1. Introduction
In the past, various fluids have been tested as substitutes for electrical insulating oils in transformers based on naphthenic or paraffinic mineral oils. These included fluids based on fluorinated or chlorinated biphenyls (1960s), silicone fluids (1970s), and synthetic esters (1980s). While some of these liquids were technically satisfactory, they posed a threat to ecosystems. Silicone liquids were expensive and immiscible, and the first synthetic esters were too expensive and produced toxic fumes when electrically arced [
1].
In liquid-filled transformers, the oil serves two crucial features by providing electrical insulation and dissipating heat generated by Joule losses, primarily from the windings, but also from the magnetic core and insulating system itself. When selecting oil for high-voltage power or distribution transformers, key dielectric properties such as permittivity, dissipation factor, and electrical breakdown voltage strength are significant parameters [
2,
3,
4,
5,
6] for, e.g., infrared spectroscopy [
7].
Insulation quality tests are necessary both after transformer manufacturing and during their operational lifespan. In most instances, insulation faults are linked to partial discharges, which arise from various causes [
8,
9,
10,
11,
12].
Currently, there is a strong emphasis on replacing mineral liquids with biodegradable liquids produced from renewable sources [
4,
5,
6,
13,
14,
15,
16,
17,
18,
19,
20]. This is a strategic decision in countries without their own oil reserves to reduce dependence on imported petroleum products. Natural oils, such as rapeseed, soy, and sunflower, are increasingly preferred as insulation fluids in modern transformers due to their eco-friendly attributes and cost-effectiveness [
4,
17,
18,
19,
21]. To ensure the compatibility of novel materials used in transformers, it is important to conduct a thorough investigation [
2,
13,
22,
23,
24]. Previous studies have examined the interaction between insulating papers and various materials, including gaskets, varnishes, and core steel, with oils such as soy or corn oil [
2,
13,
19,
22].
The study in [
22] conducted compatibility testing and addressed the compatibility of transformer mineral oil and gasket materials, including O-rings. The study found that approximately half of the gaskets did not meet the requirements, the silicone gaskets being the worst performers, as none of them passed. On the other hand, fluorocarbon gaskets were successful in all three cases. ASTM D 3455-11 Standard Test Methods for Compatibility of Construction Material with Electrical Insulating Oil of Petroleum Origin [
25] was used for these tests.
The study presented in this paper specifically focuses on exploring the compatibility of PA cable ties, rubber-based gaskets, and essential components of transformer bushings—materials used in 400 V/22 kV (35 kV) distribution transformers. The overall subject of the test is a small oil-filled distribution transformer that is EU-manufactured typically in the performance series of 50, 100, 160, 250, 400, 630, 800, 1000, 1250, 1600, 2000, and 2500 kVA for voltage levels 22 and 35 kVA, e.g., [
26]. All materials used in this transformer that could potentially interact with the natural ester have to been carefully tested using a pre-designed compatibility test procedure.
2. Materials and Methods
The experiment was performed with the goal of a natural ester oil behavior description in working-like conditions—a description of the interaction with other materials of the transformer using increased intensity by elevating the temperature and/or high electric field.
The tested materials were immersed in insulating oils, utilizing rapeseed-oil-based oil Envitrafol, rapeseed oil, and, for comparison, mineral oil Nynas Lyra X or Midel 7131 eventually. Subsequently, these materials underwent thermal aging in an oven for 2000 h at 120 °C and 1000 h at 140 °C.
A comprehensive analysis was conducted on all polymer samples and oils both before and after the aging process. The examination encompassed changes in weight and dimensions and Shore hardness, as well as electrical properties such as permittivity, resistivity, and dissipation factor if possible. Additionally, the viscosity of oils was a key aspect discussed in the evaluation. The oils after aging were subjected to the measurement of the dissipation factor, resistivity, Fourier transform infrared spectroscopy (FT-IR), and inhomogeneous field partial discharge testing.
- A.
Compatibility test
Since numerous papers have been published describing the interaction of natural ester, cellulose papers, and copper [
2,
13,
22], the testing of material compatibility was focused on auxiliary materials with natural ester. The tested materials were a rubber cork seal used for 400 V bushings, polymeric thermoset PA 6.6 (C
12H
22N
2O
2)
n (melting point 268 °C) (marked as “bushing”) used as the inner part (immersed in oil) of the 20 and 35 kV bushing, auxiliary construction material (marked as “cable ties”) based on PA 6 (C
6H
11NO)
n (melting point 220 °C), and a synthetic rubber seal (gasket).
The above-mentioned auxiliary materials have been used in small distribution transformers with mineral oils for decades. The thermal aging of the samples took place on two sets of samples at two temperatures. The first set of the samples (rubber cork seal and auxiliary construction material) was aged at 140 °C for 1000 h in both rapeseed and mineral oil. The samples were immersed in dark airtight glass containers. The second set was aged at 120 °C for 2000 h. At both temperatures, a construction material was immersed in rapeseed and mineral oil. The sets of oils-only samples were subjected to the same temperatures and times for comparison.
The main tests carried out on the samples subjected to compatibility tests and the testing of oil samples are described below.
- B.
Mechanical test
The two methods were used to test mechanical properties of rubber seals: the maximum tensile stress recorded in extending the test piece to breaking point and the standard hardness test according to Shore. In the field of conventional mechanical testing, tensile tests based on the standard ISO 527 [
27] were performed using the LabTest 3.030 testing machine LaborTech. Hardness was obtained using the procedures described in methods N, H, L, and M on test pieces of standard thickness and not less than the minimum lateral dimensions specified.
The Shore hardness test measures the indentation depth using a spring-loaded indenter made of hardened steel. The hardness value is determined on a scale ranging from 0 Shore (2.5 mm indentation depth) to 100 Shore (0 mm indentation depth). Different Shore scales (such as Shore A and D) are established based on variations in indenter forms and spring characteristics. Shore A is usually suitable for soft rubber, elastomers, and natural rubber, and Shore D is suitable for harder elastomers, plastics, and rigid thermoplastics.
- C.
Electrical test
The dissipation factor tan δ serves as a measure of dielectric losses caused by polarization and conductivity phenomena within the tested liquid. Therefore, tan δ can indicate various issues, including the following:
- -
Liquid contamination with, e.g., moisture, particles, or soluble polar contaminants.
- -
Refining quality, where poor refining quality could also contribute to elevated tan δ values.
The dissipation factor was measured in accordance with IEC 60247 [
28] at a temperature of 90 °C and 500 V/50 Hz, with a Tettex 2830/2831 dielectric analyzer along with a 2903 electrode system (both from Haefely).
An essential factor for ensuring the long-term performance of the EIS is the measurement of PD (partial discharge) activity [
9,
11,
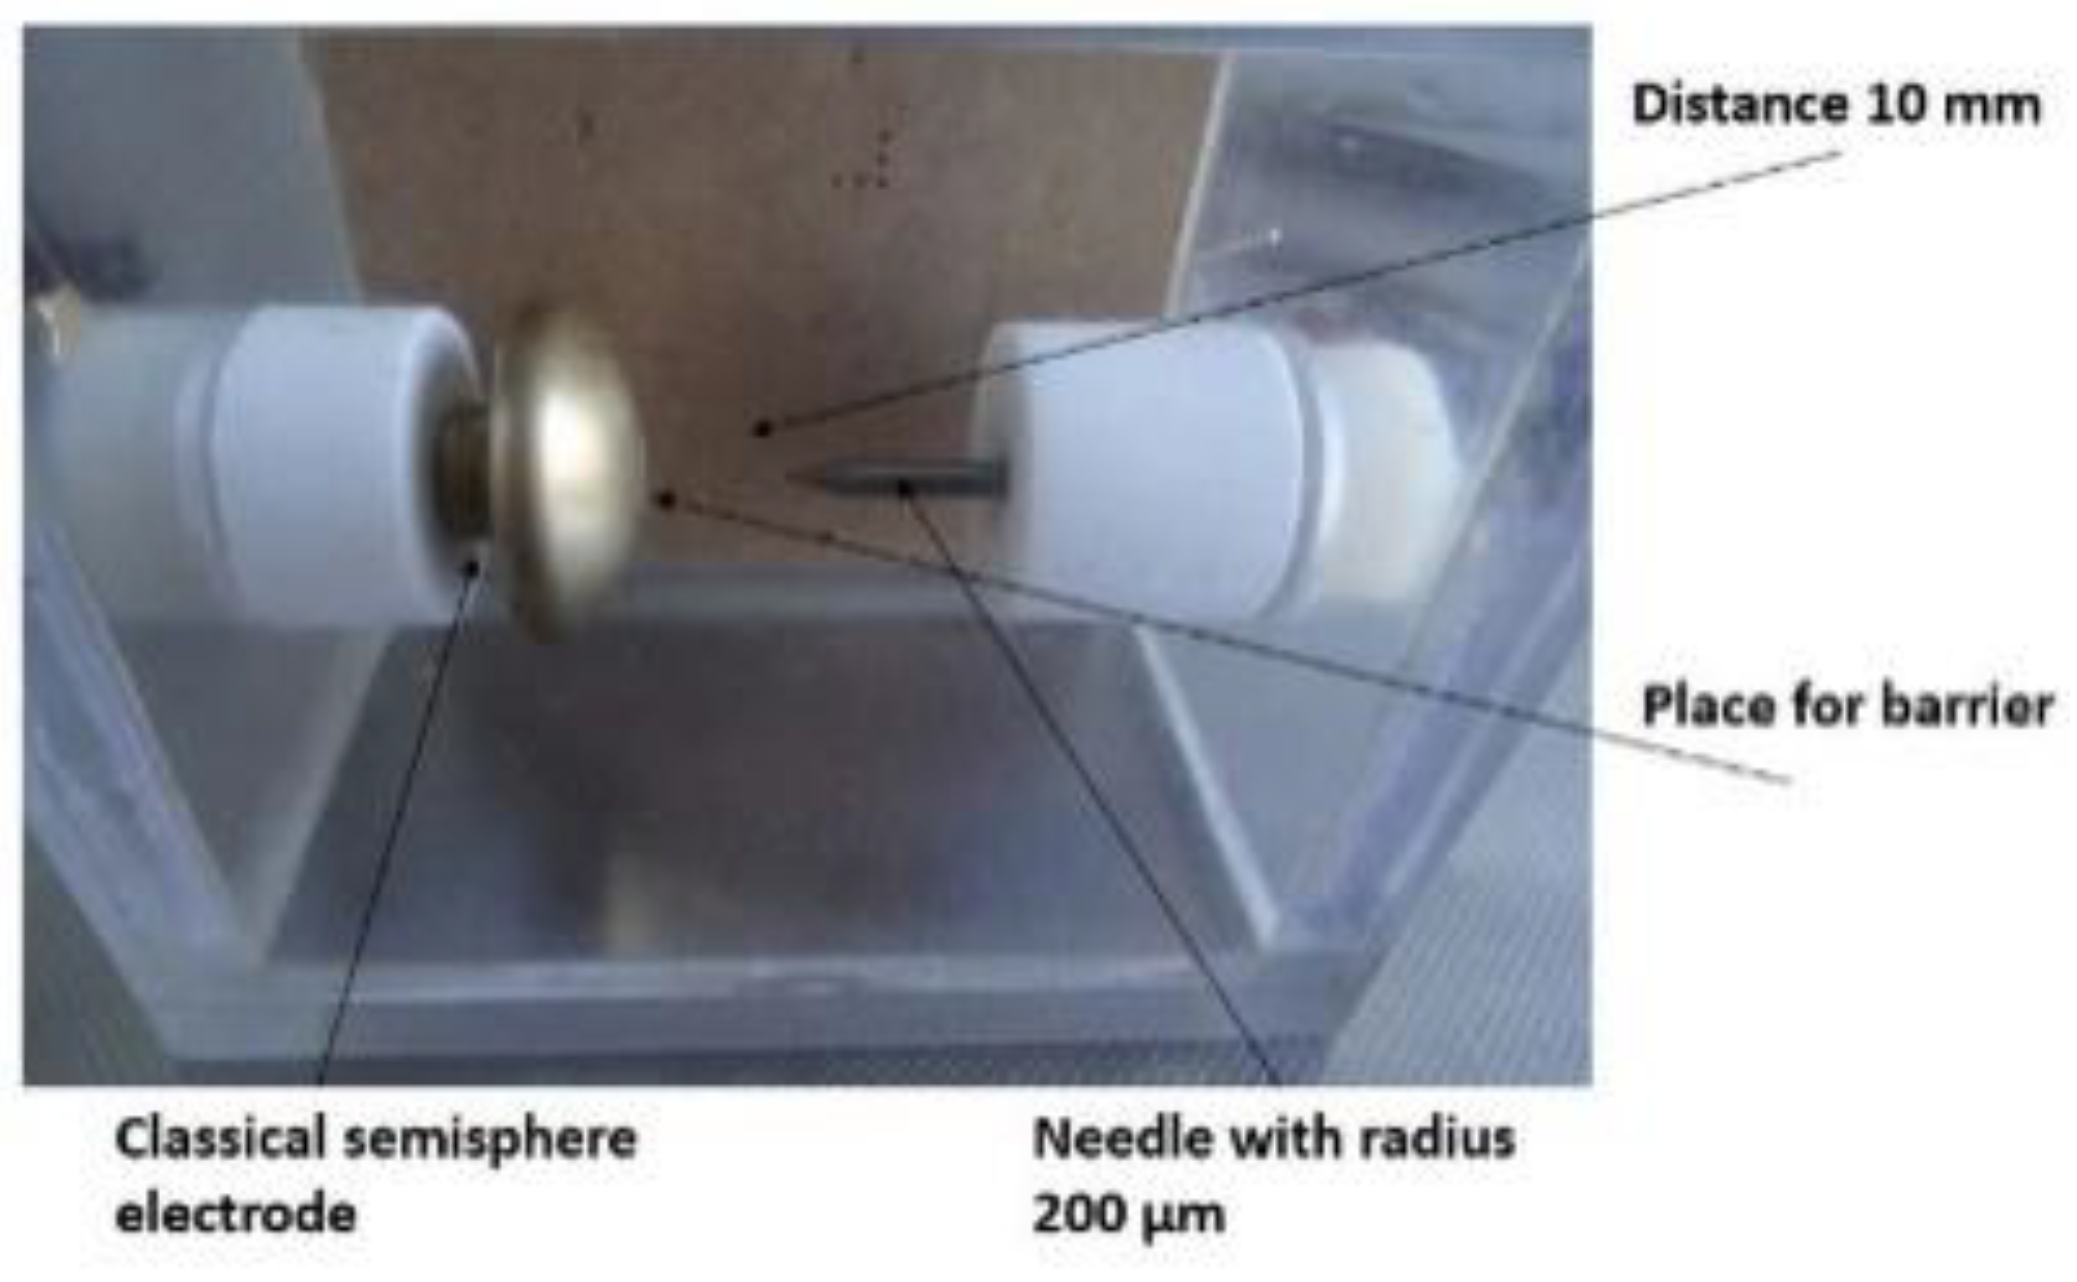
12]. In our study, we conducted partial discharge measurements using the electrode system depicted in
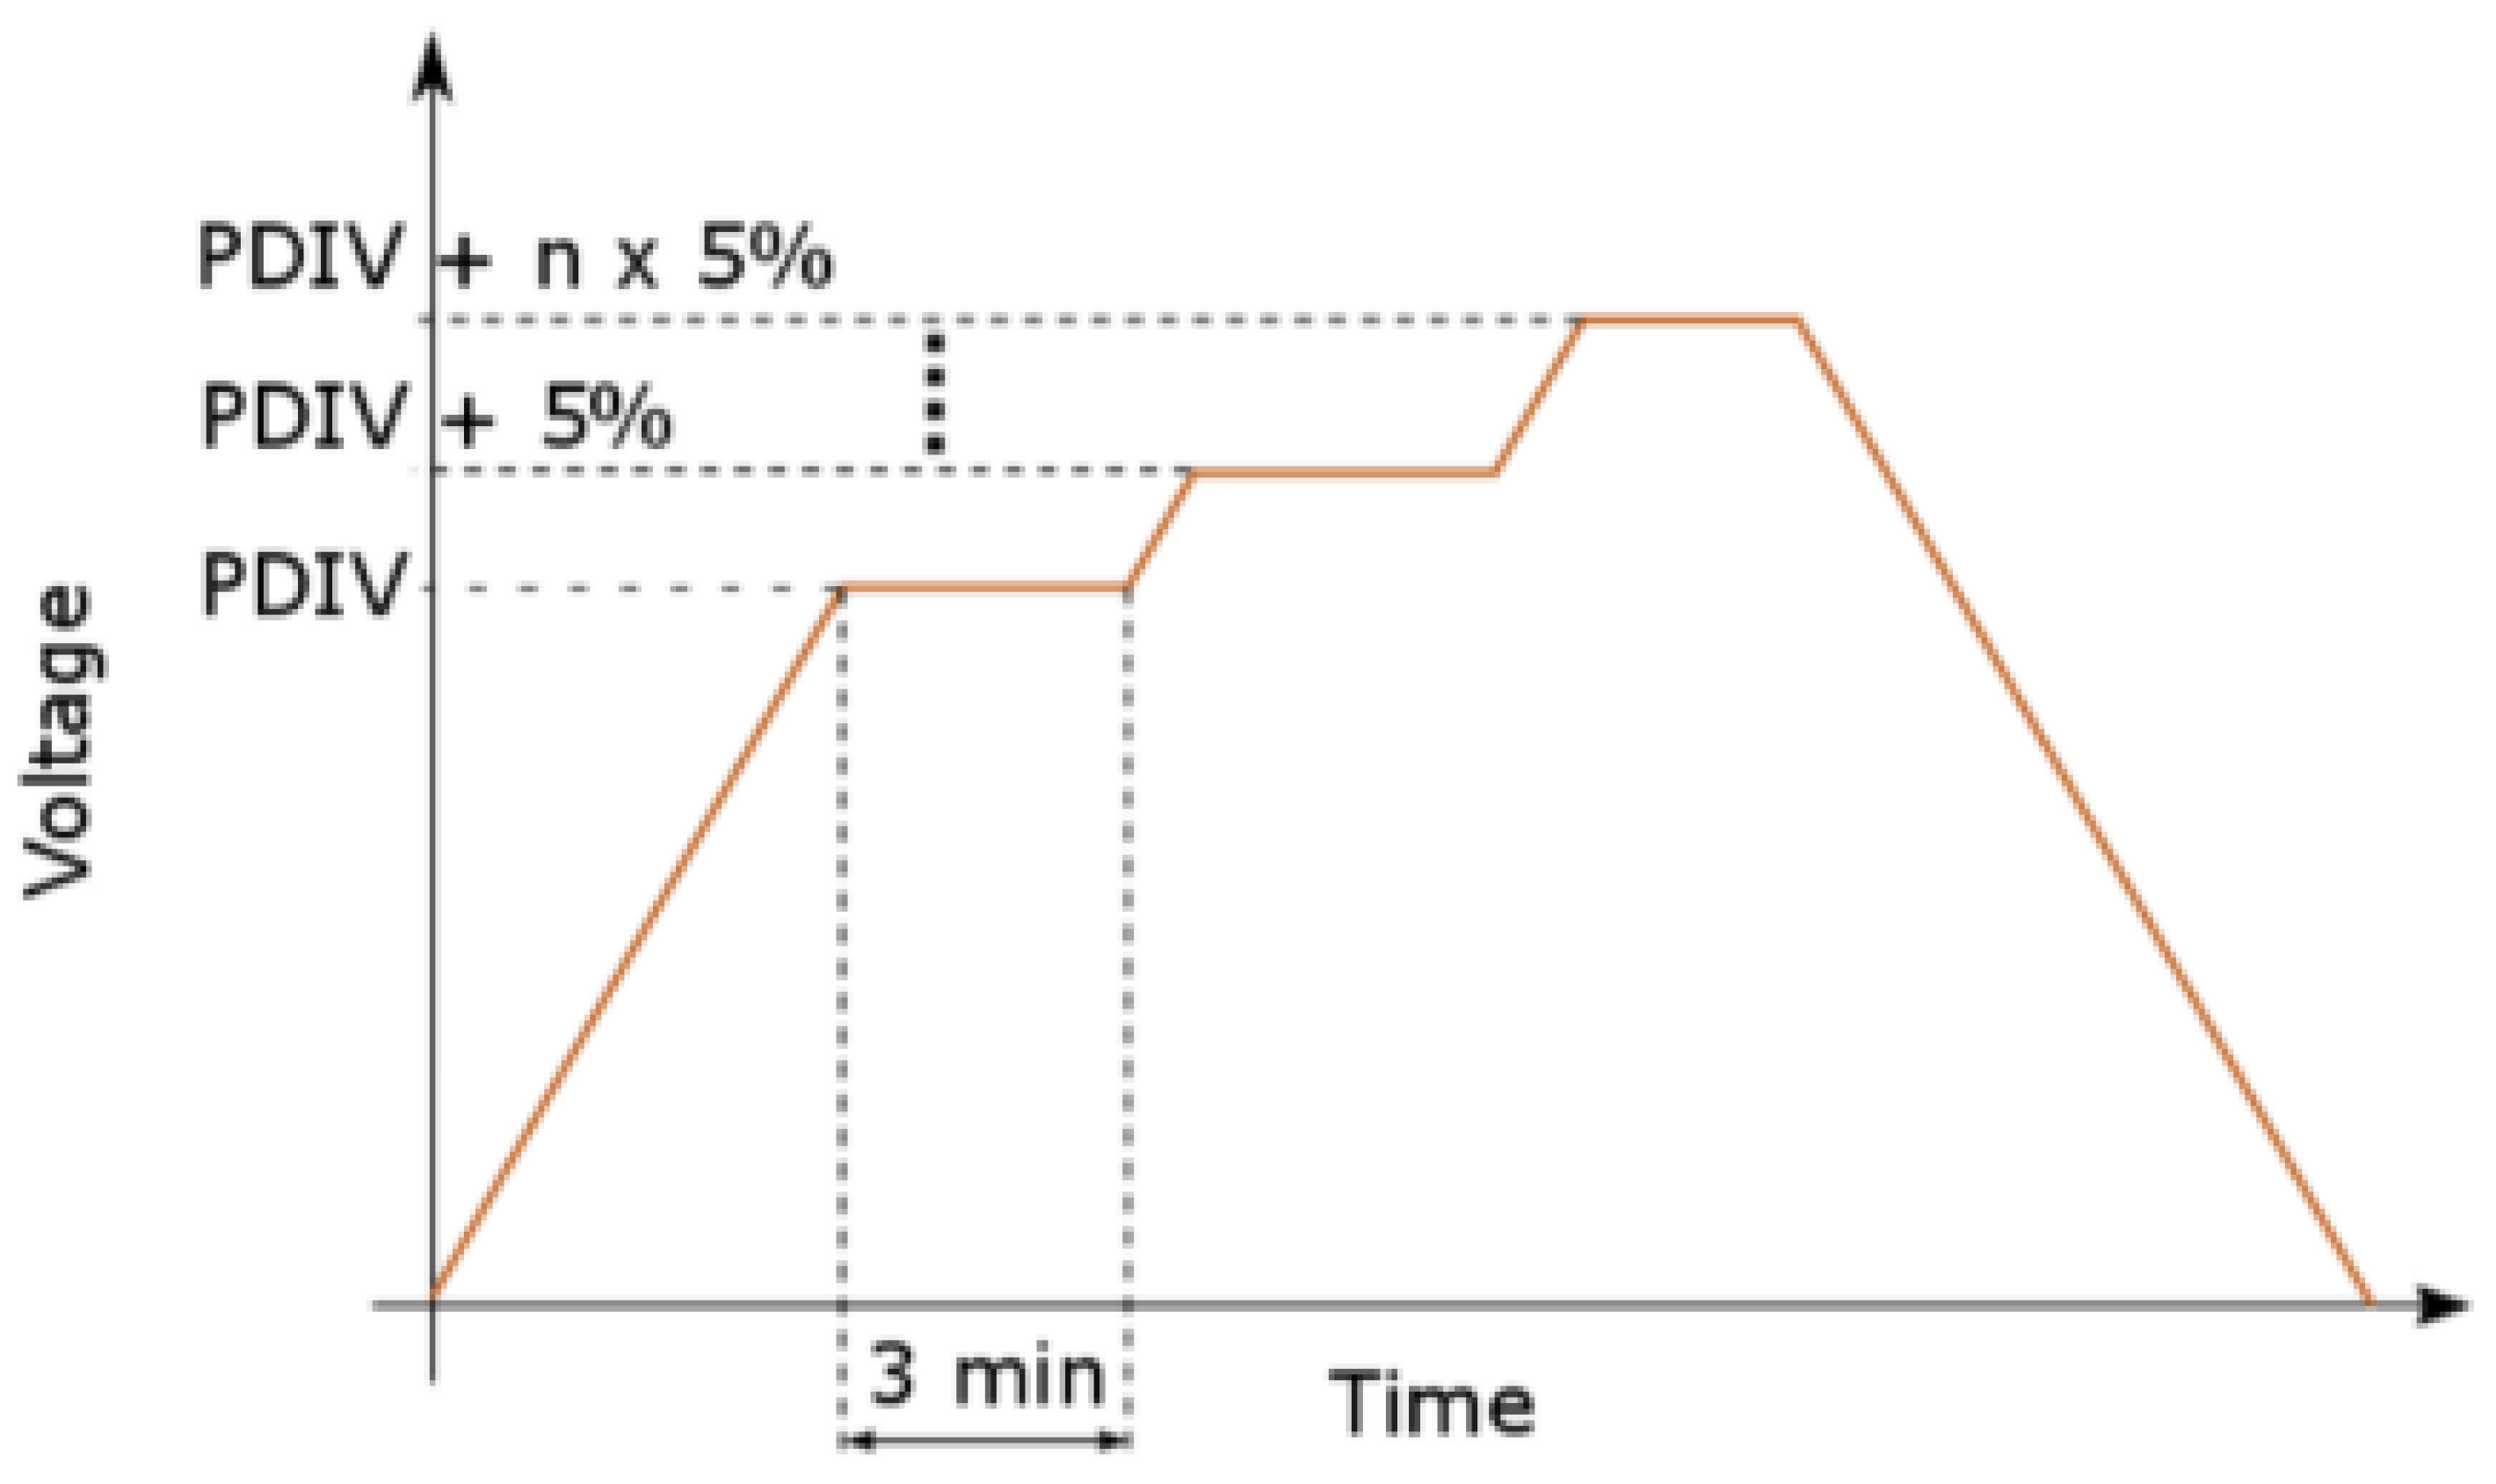
Figure 1. Specifically, the high voltage (HV) was connected to the semisphere while the needle was grounded. For security reasons, we introduced a dielectric barrier (approximately 0.3 mm thick, with a relative permittivity of approximately 2.5) into the electrode system. The evaluation procedure for PD behavior is illustrated in
Figure 2. The measurement circuit was calibrated prior to conducting the measurement (50 pC). Recorded parameters were collected at the end of the 3 min interval and continued until reaching the breakdown level. In the future, the transformer insulation will increasingly suffer from the converter load [
3,
29].
From the maximal intensity of the electrical field (E
max = 1.09·10
7 V/m), a Schwaiger factor (1) was calculated η = 0.11.
where
V is applied voltage (V) and d is the distance of electrodes (m). Maximal intensity was calculated based on the microcopy of the tungsten needle tip.
The Schwaiger factor is commonly used in order to assess both weakly and strongly inhomogeneous non-uniform electric fields and various electrode configurations [
30,
31]. The factor is defined as the ratio of the maximum electrical field to the mean value of the electrical field.
- D.
Viscosity
Electrical insulating fluid viscosity influences the heat transfer and therefore affects the increase in temperature in the transformer. Normally, the lower the viscosity, the easier the oil circulates from winding to the cooler, thus providing better heat transfer. Viscosity at lower temperatures is a critical factor for the cold start of, e.g., transformers. Dynamic viscosity refers to the frictional force that arises between two layers of flowing fluid when they come into contact with each other over an area of 1 m
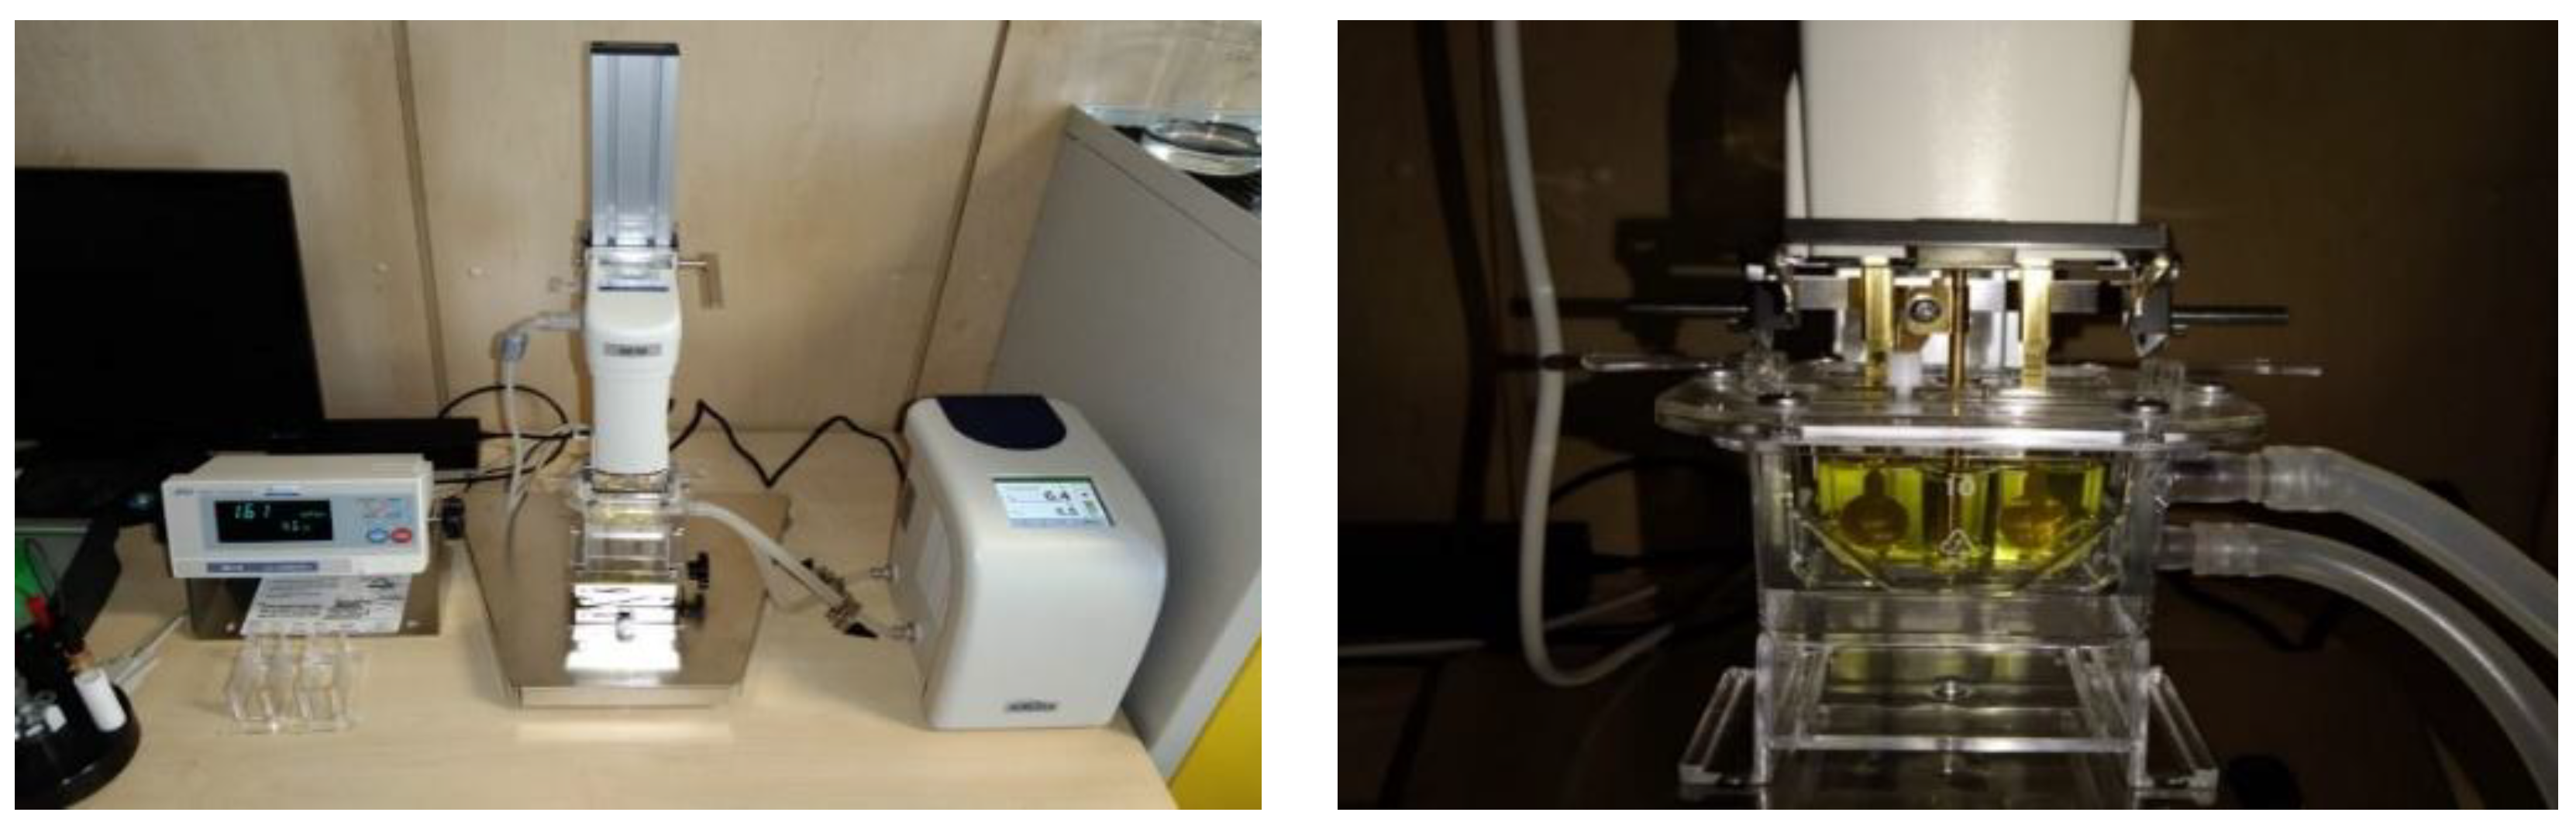
2, with a velocity difference of 1 m/s. Its measurement is possible using a vibrational viscometer (SV 10, A&D Instruments Limited), as shown in
Figure 3. This type of viscometer measures viscosity by detecting the electrical current required for the resonance of two sensor plates at a constant frequency of 30 Hz and an amplitude of less than 1 mm. The usual levels of viscosity for mineral fluids are approx. 10 mm
2s
−1 at 40 °C and 40 mm
2s
−1 for esters, measured at 40 °C. When the fluid density is known, the conversion relation between dynamic and kinematic viscosity might be used along with ISO 3104:2023 [
32].
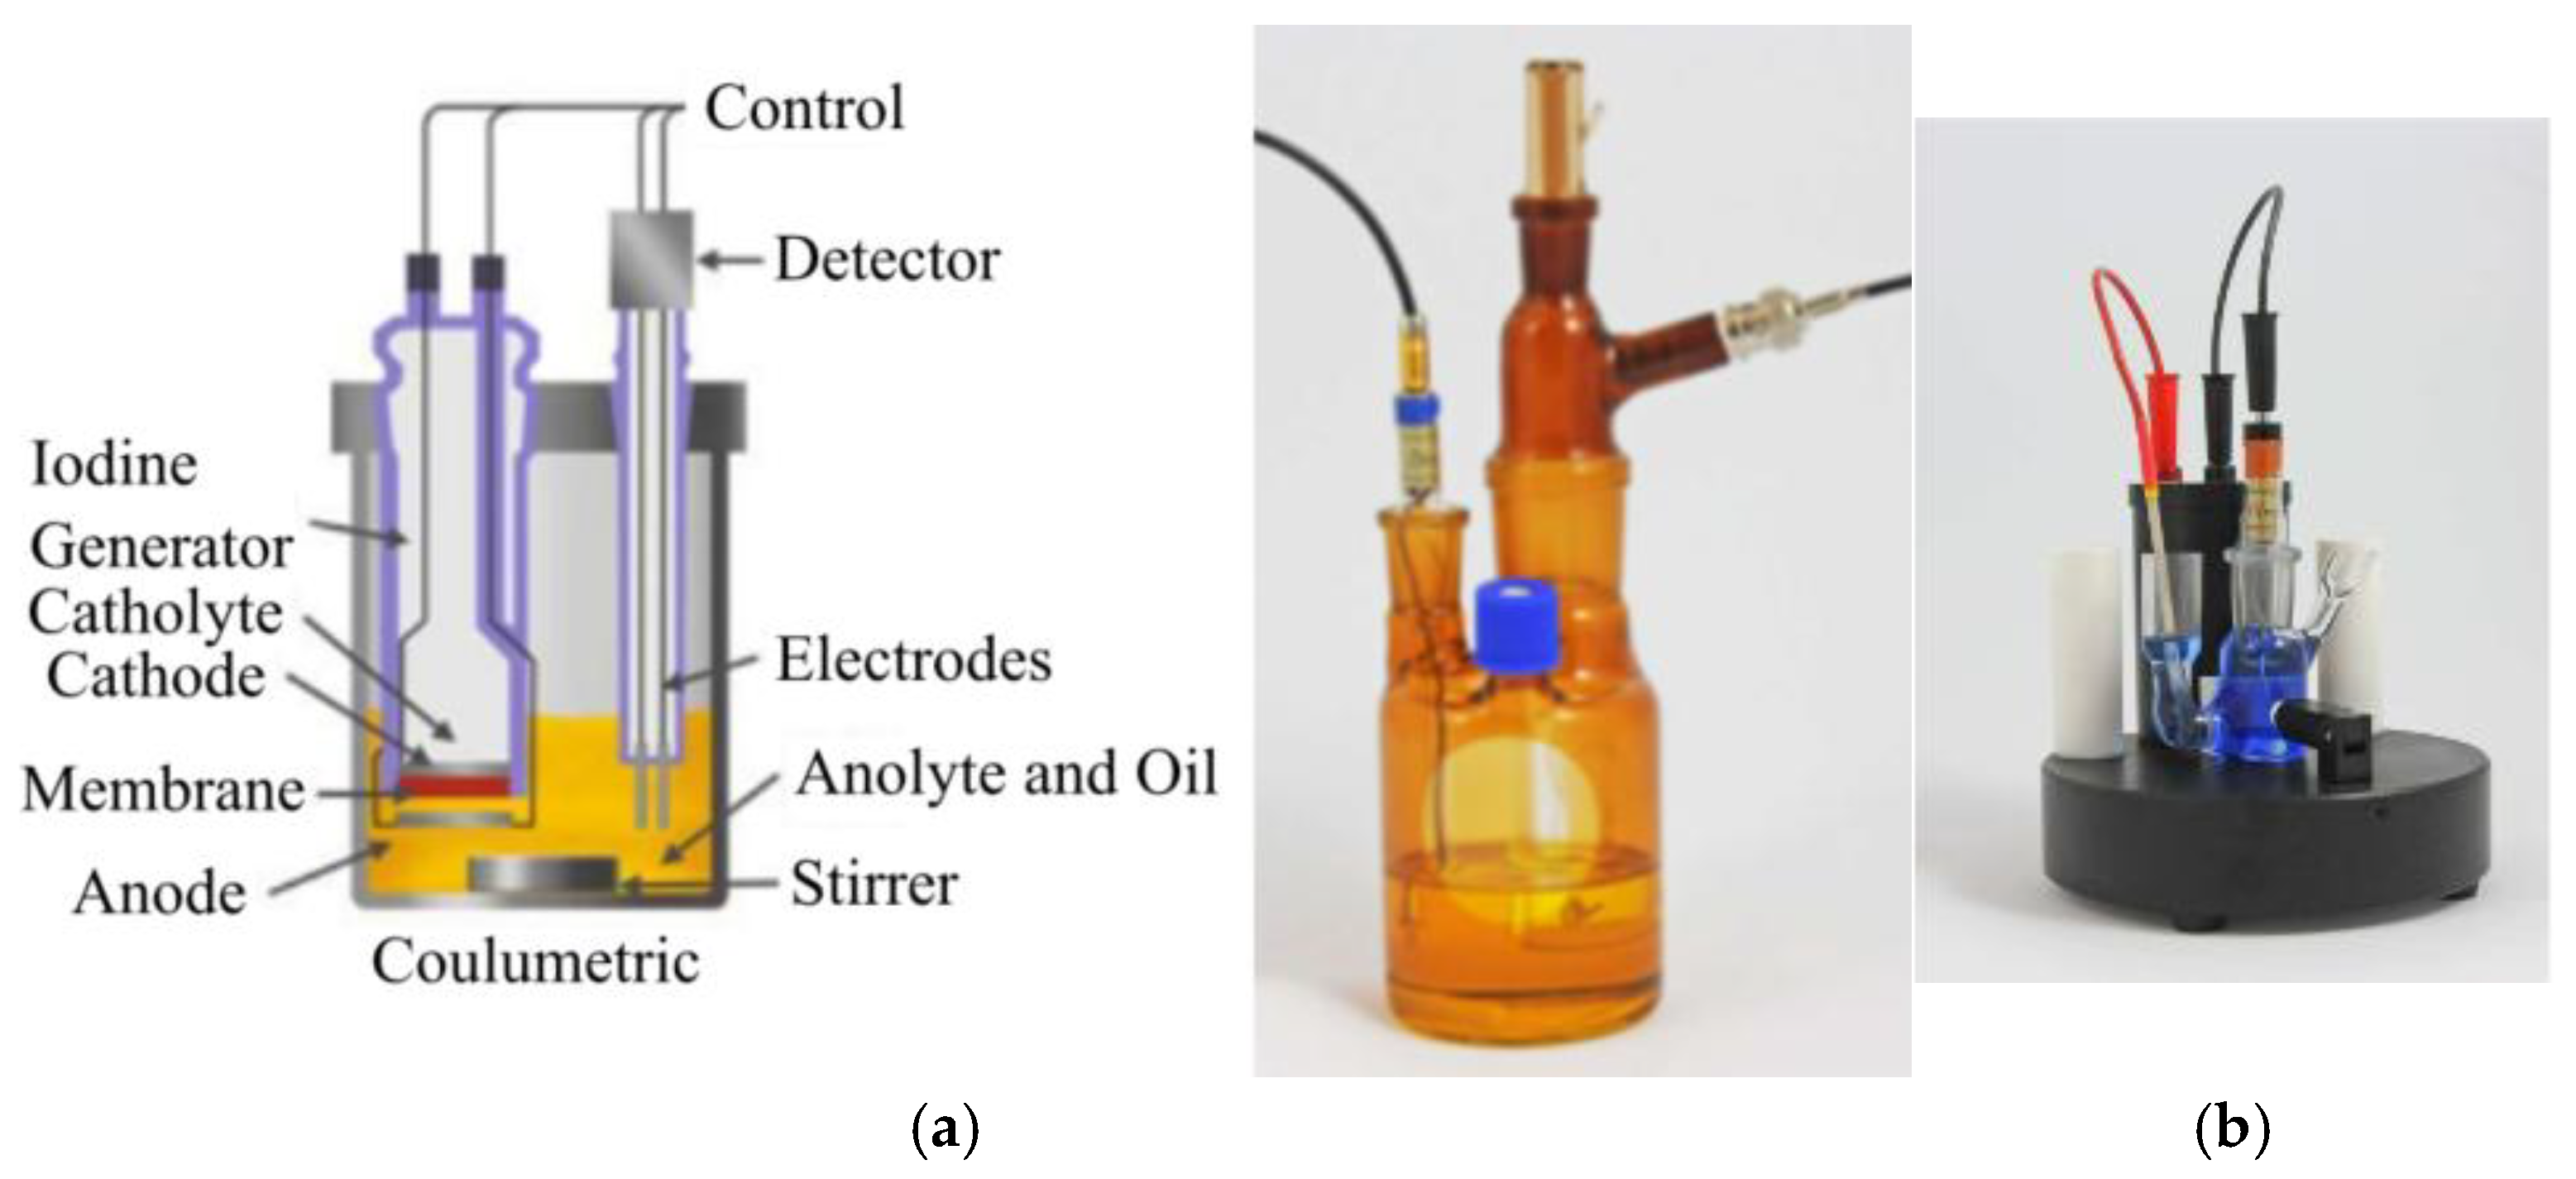
The water content of the oil samples was measured by a Coulometer WTD (Diram) based on a Karl Fischer titration (
Figure 4). The same device was used for an acid number measurement based on the volumetric determination of alkali blue B6 as a spectrophotometric indicator. The aging of oil and the oil–paper system increases the amount of acidic substances present in the oil as well as water (acid hydrolysis of cellulose). These parameters are suitable for assessing the condition and age of the oil. The definition of acidity number establishes it as the amount of potassium hydroxide (KOH) required to neutralize organic and inorganic acid-reacting components in 1 g of oil in a non-aqueous alcoholic environment. The determination of acidity number utilizes the method of spectrophotometric identification.
In coulometric titration, the titrant (hydroxide ions) is generated directly at the platinum cathode by the decomposition of water. Neutralization occurs in a closed cathodic compartment of the electrolytic cell without the presence of air, thus eliminating interference from atmospheric carbon dioxide. Spectrophotometric indication using an acid–base indicator is employed to determine equivalence. The titration solution consists of a mixture of alcohol and toluene (1:2) with a suitable indicator and an electrolyte salt. The result of the analysis is the equivalent amount of KOH in micrograms, expressed directly as the acidity value in mg KOH/g. Further details about the measurement can be found in the standard IEC 62021-1 [
33].
- E.
FT-IR
Fourier transform infrared spectroscopy (FT-IR) measurements were conducted using the Nicolet 380 spectrum analyzer. These measurements took place in the mid-infrared region and utilized both the attenuated total reflectance (ATR) technique and the transmission technique. The ATR spectrum of the sample is influenced by the wavelength of the infrared radiation, the ratio of the refractive indices of the measured sample and the ATR crystal, the angle of incidence of the radiation on the phase interface, and the efficiency of the contact between the measured sample and the ATR crystal. The resulting penetration depth of the radiation into the sample is defined by relationship (2).
where
dp is the penetration depth of the radiation into the sample,
λ is the wavelength of the radiation,
θ is the angle of incidence of the radiation on the phase interface, and
nv and
nk are the refractive indices of the sample and the crystal, respectively. The result of the experimental effort is the infrared spectrum of the substance, representing the dependence of transmittance
T, absorbance
A, or reflectance
R (optical properties of the sample) on the wavenumber (or wavelength or frequency) [
21,
34].
where
Φ0,
Φ, and
Φ0r represent the radiation flux before and after the cuvette and the radiation flux reflected by the sample. In infrared spectral studies [
7,
21,
34], it is possible to detect chemical reaction byproducts dissolved in oil. This is a non-destructive analytical method that investigates the material’s response to infrared radiation with wavelengths between 780 nm and 300 µm. Infrared radiation is commonly divided into near (0.78–3 μm), mid (3–30 μm), and far (30–300 μm) infrared regions. Due to the logarithmic relationship between energy and wavelength, the wavenumber unit was introduced, expressed as the reciprocal of the wavelength. Its unit is expressed in cm
−1. Photons of infrared radiation transfer energy to molecules, causing changes in their vibrational or rotational states. During molecular vibrational motion, energy is converted between potential and kinetic forms. Vibrational motions are categorized as valence and deformation vibrations. Valence vibrations involve periodic changes in bond length within the molecule (symmetric and asymmetric changes) while deformation vibrations refer to periodic changes in bond angles between atoms in the molecule. IR transmission measurements were performed by FT-IR Nicolet 380 using PIKE Demountable Liquid Cell Kits (PIKE Technologies, Cottonwood, Madison, USAú with BaF
2 windows (optical path 1 mm). The spectra were acquired at 4 cm
−1 resolution when a total of 32 scans were co-added for each measured spectrum.
3. Results
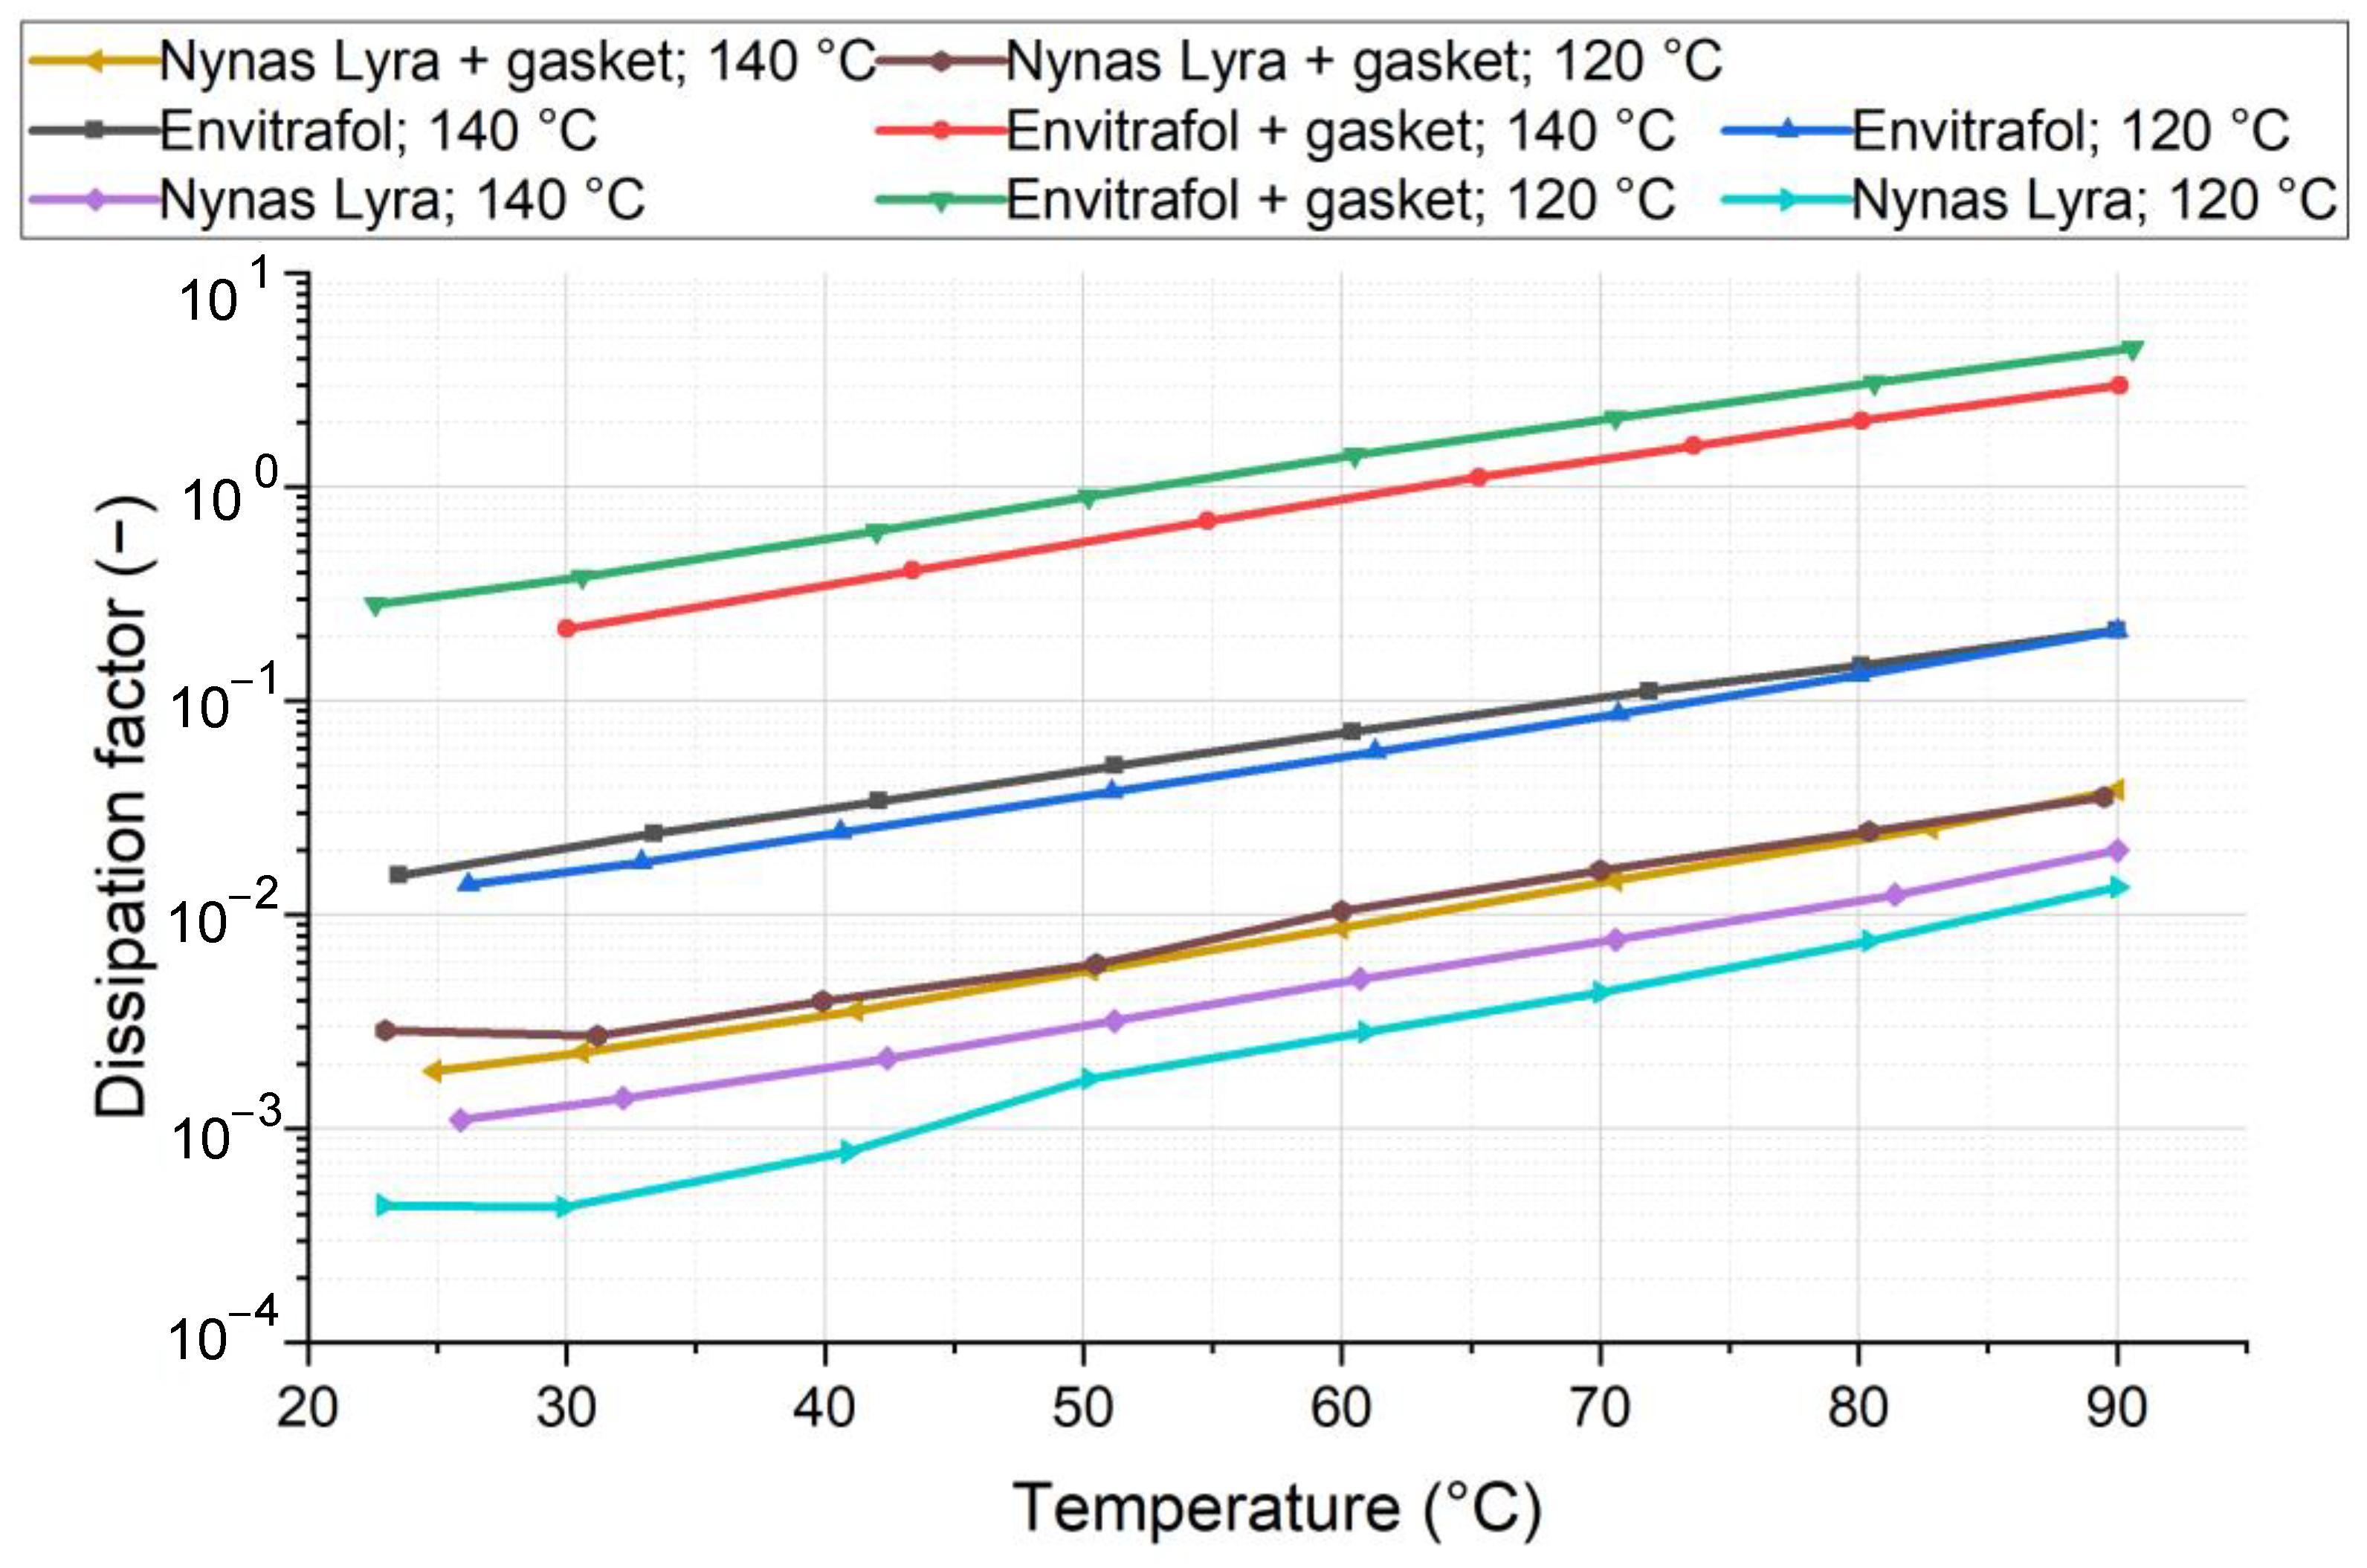
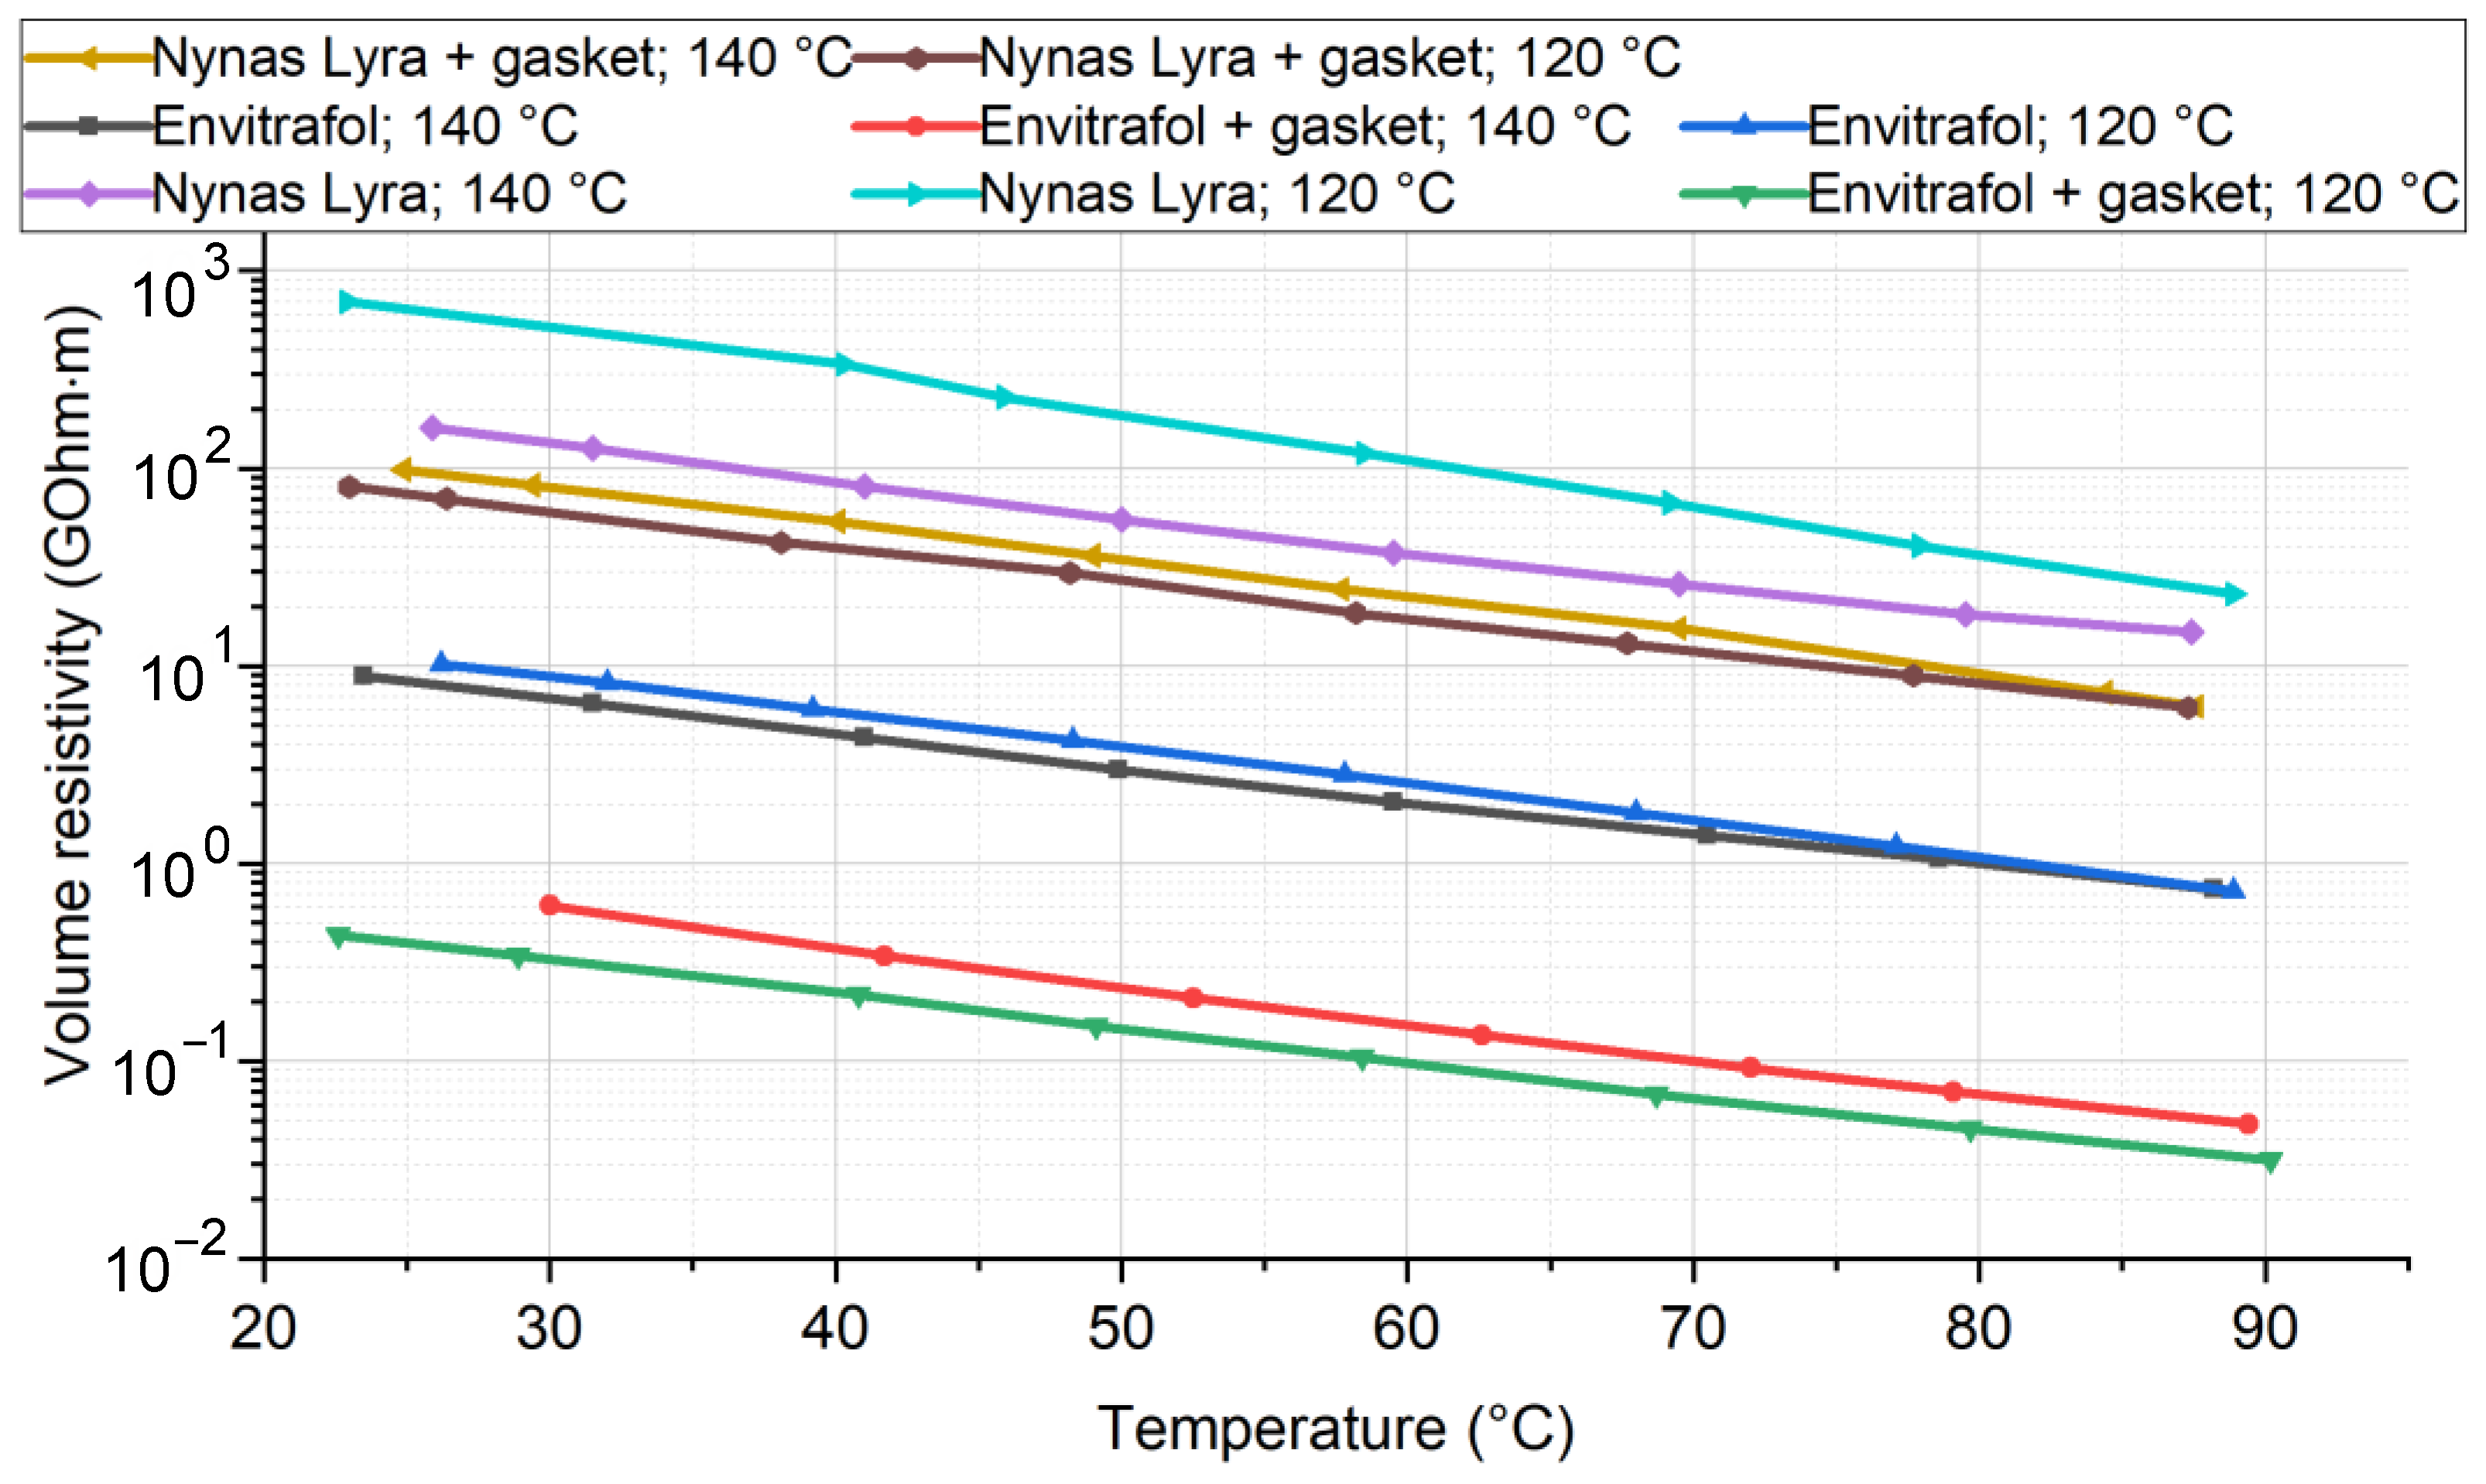
The dissipation factor (
Figure 5) and resistivity (
Figure 6) of the fluids after aging were measured, since any diluted substance will probably dissociate in the fluid and cause an increase in the dissipation factor, reducing the resistivity.
The results show a significant increase in the dissipation factor after aging at 120 °C, as well as at 140 °C. In this mass ratio and at these high temperatures, the degradation of fluids’ dielectric properties is evident. The different impacts of tested material on different oils were not observed.
The result of measured resistivity shows the impact of the tested materials on fluid resistivity. The impact is slightly negative. Again, based on this result, we do not consider new types of adverse effects of the tested material in ester fluid.
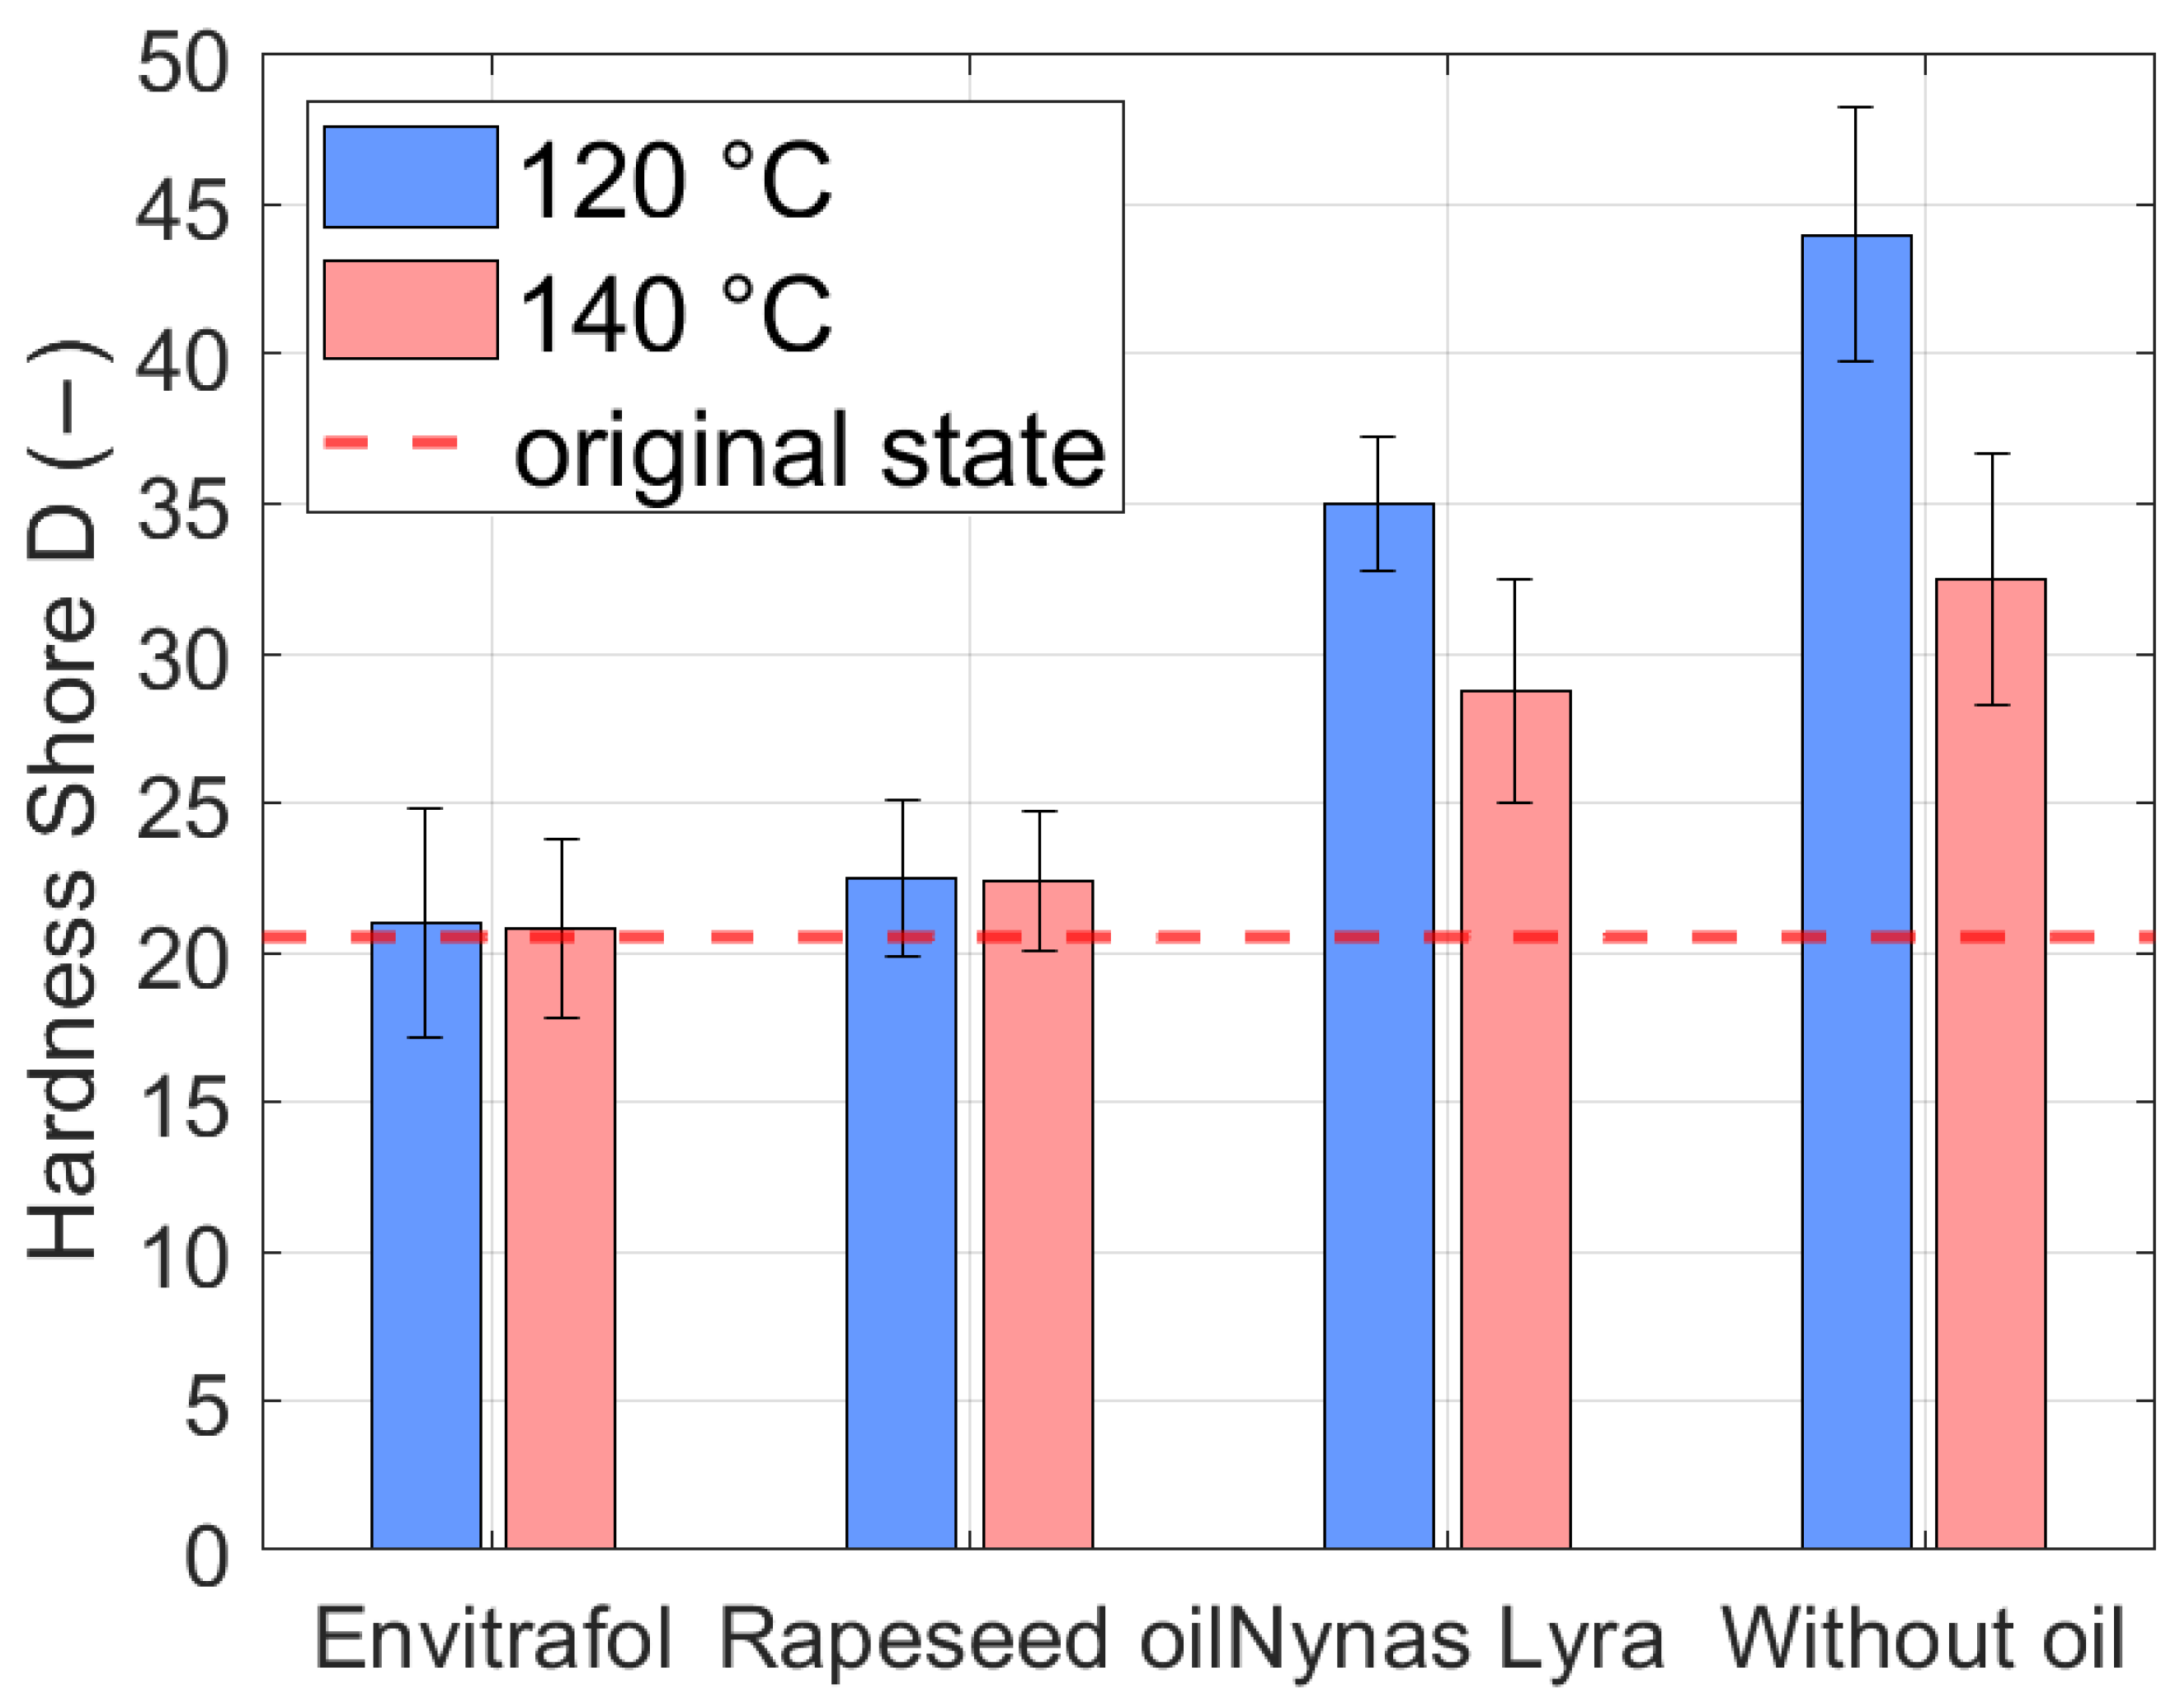
As mentioned, the proper feature for a gasket compatibility test is measurement of the hardness. If the seal hardens due to the interaction with oil, then it stops fulfilling its role and the container will not be sealed; otherwise, when it is softened by the oil, the container will not seal again. This will lead to oil leaks, and the windings and oil voltage of the transformer may become wet due to air moisture.
The synthetic rubber seal was submerged in mineral (Nynas) and natural esters (Envitrafol, rapeseed oil) in sealed containers for 2000 h at 120 °C and 1000 h at 140 °C. The results of the measured harness are given in the following
Figure 7.
As seen, the hardness of the tested transformer seal after the test (120 °C) changed most when thermally aged without the fluid (20.5 to 44), and then in mineral oil (20.5 to 35). The hardness of the sample almost did not change in Envitrafol oil (20.5 vs. 21). In rapeseed oil, an increase to 22.5 was observable. Similar results can be seen when exposed to 140 °C.
Changes in the tensile strength of PA 6 cable ties were measured using a tensile strength measuring device from LabTest (LaborTech, Opava, Czech Republic). In the initial position between the jaws, a distance of 8 cm was set, and the measurement rate was 60 mm/min. The results can be seen in the following
Table 1. At first glance, it is evident that the cable ties aged in mineral oil lost their tensile strength (the tensile strength before the test was 260 N). These cable ties were almost impossible to secure between the jaws, and they would be classified as brittle (they broke in the hand with minimal effort). The maximum force (F
max) increased for cable ties aged in rapeseed oil 120 °C. From the results, it is, however, evident that, at the same time, the PA in rapeseed became more brittle. These cable ties reached maximum tensile strength but lost their elasticity.
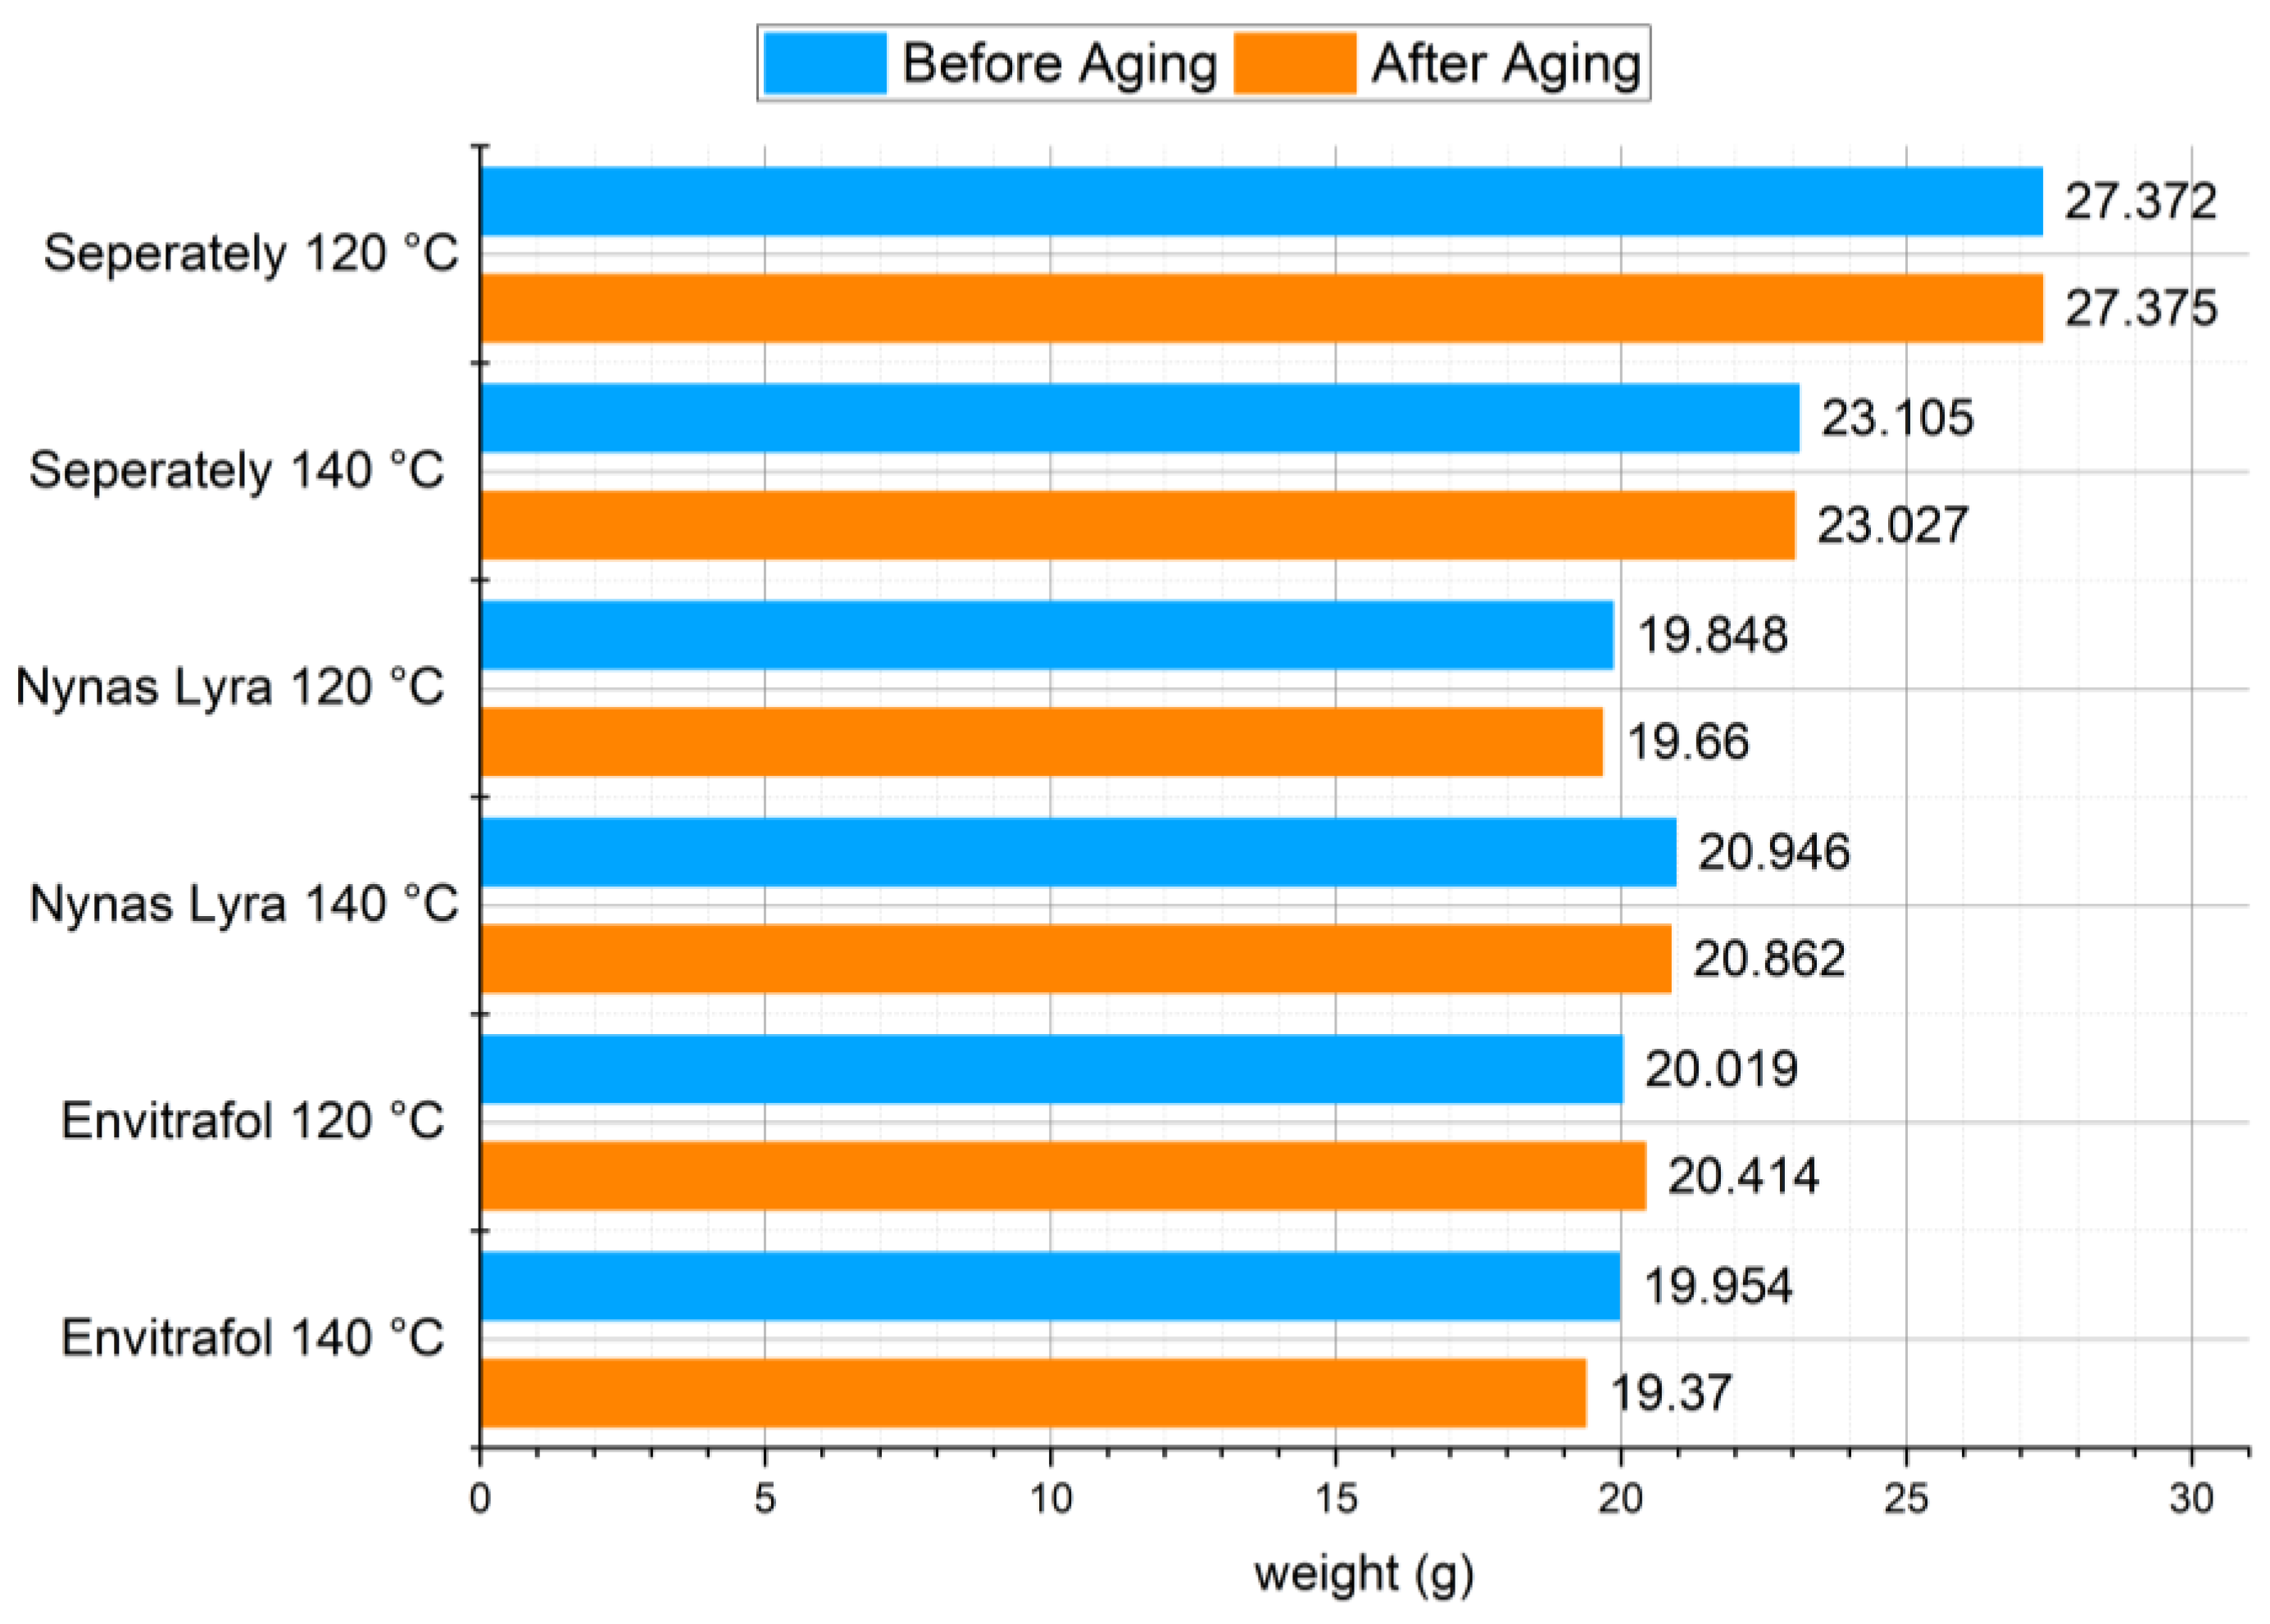
For compatibility testing, it is important to check whether the fluid can penetrate and, for example, soften the tested seal. The weight of the samples was therefore measured efore and after the test, with a result of no increase in weight;
Figure 8.
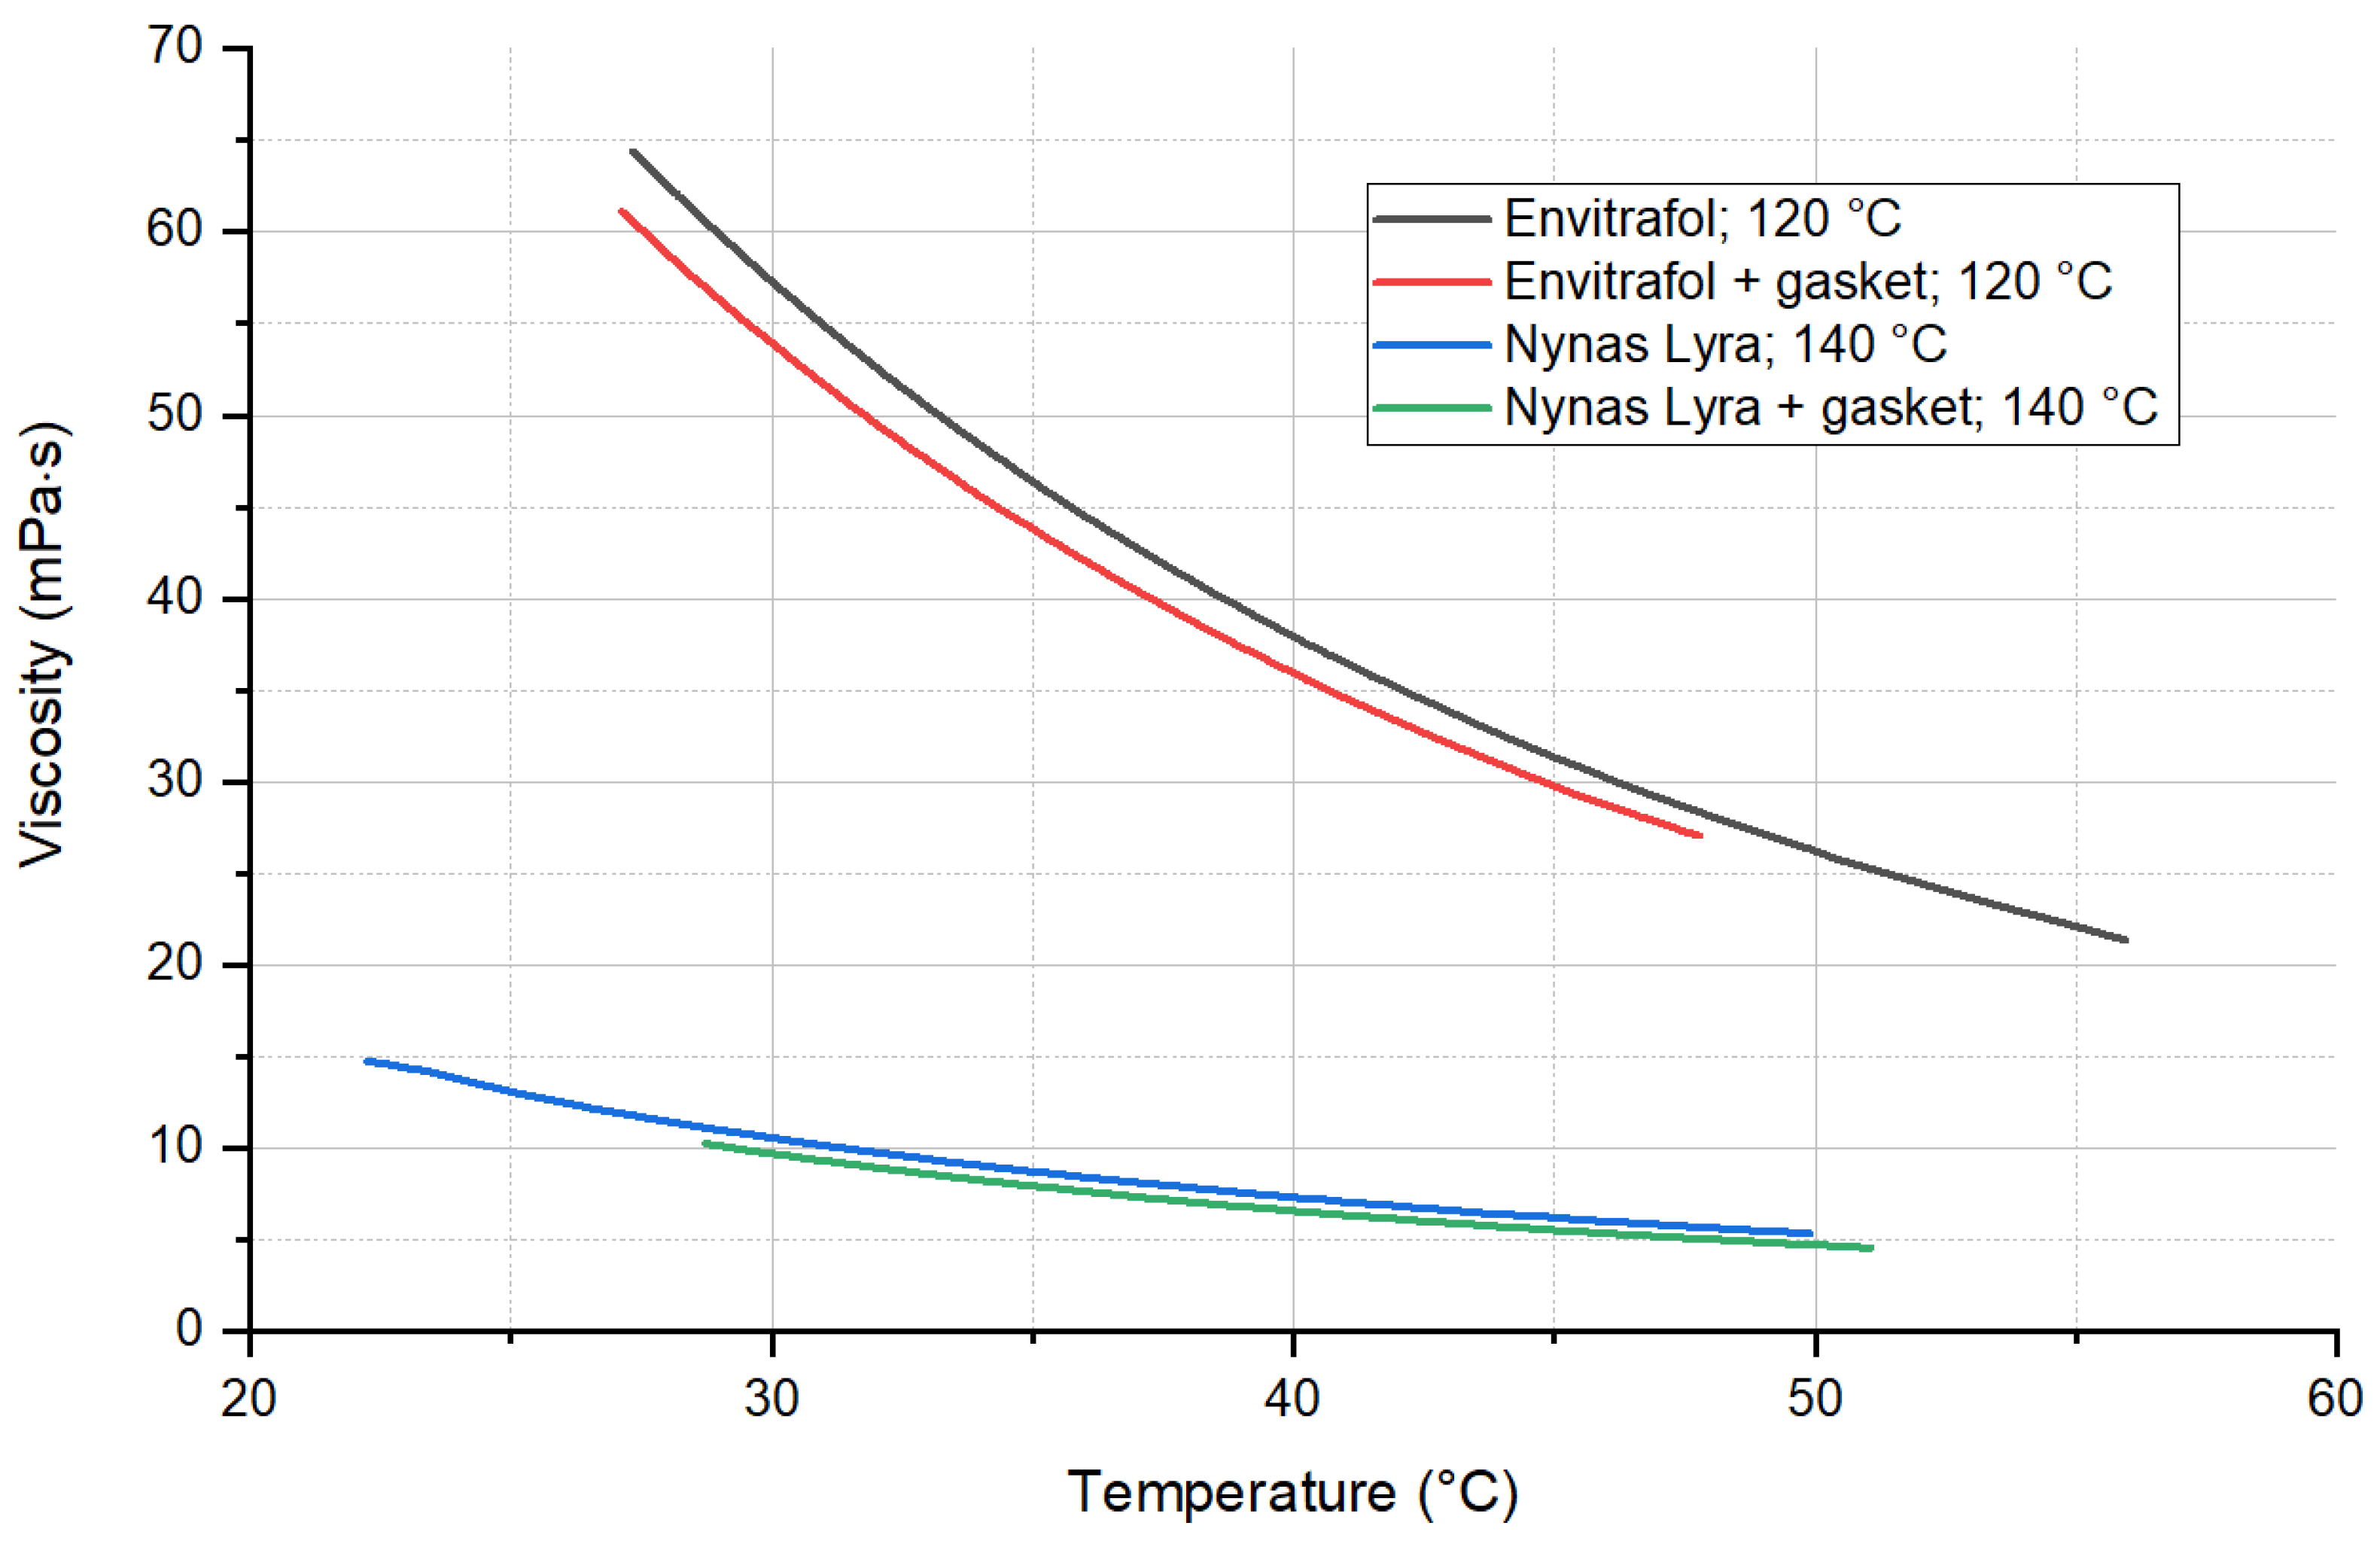
The viscosities of the oils aged by temperature (120 and 140 °C) and oils with a submerged rubber seal are presented in the following picture (
Figure 9). Again, the results prove that no significant changes occurred in the oil due to interaction with the gasket.
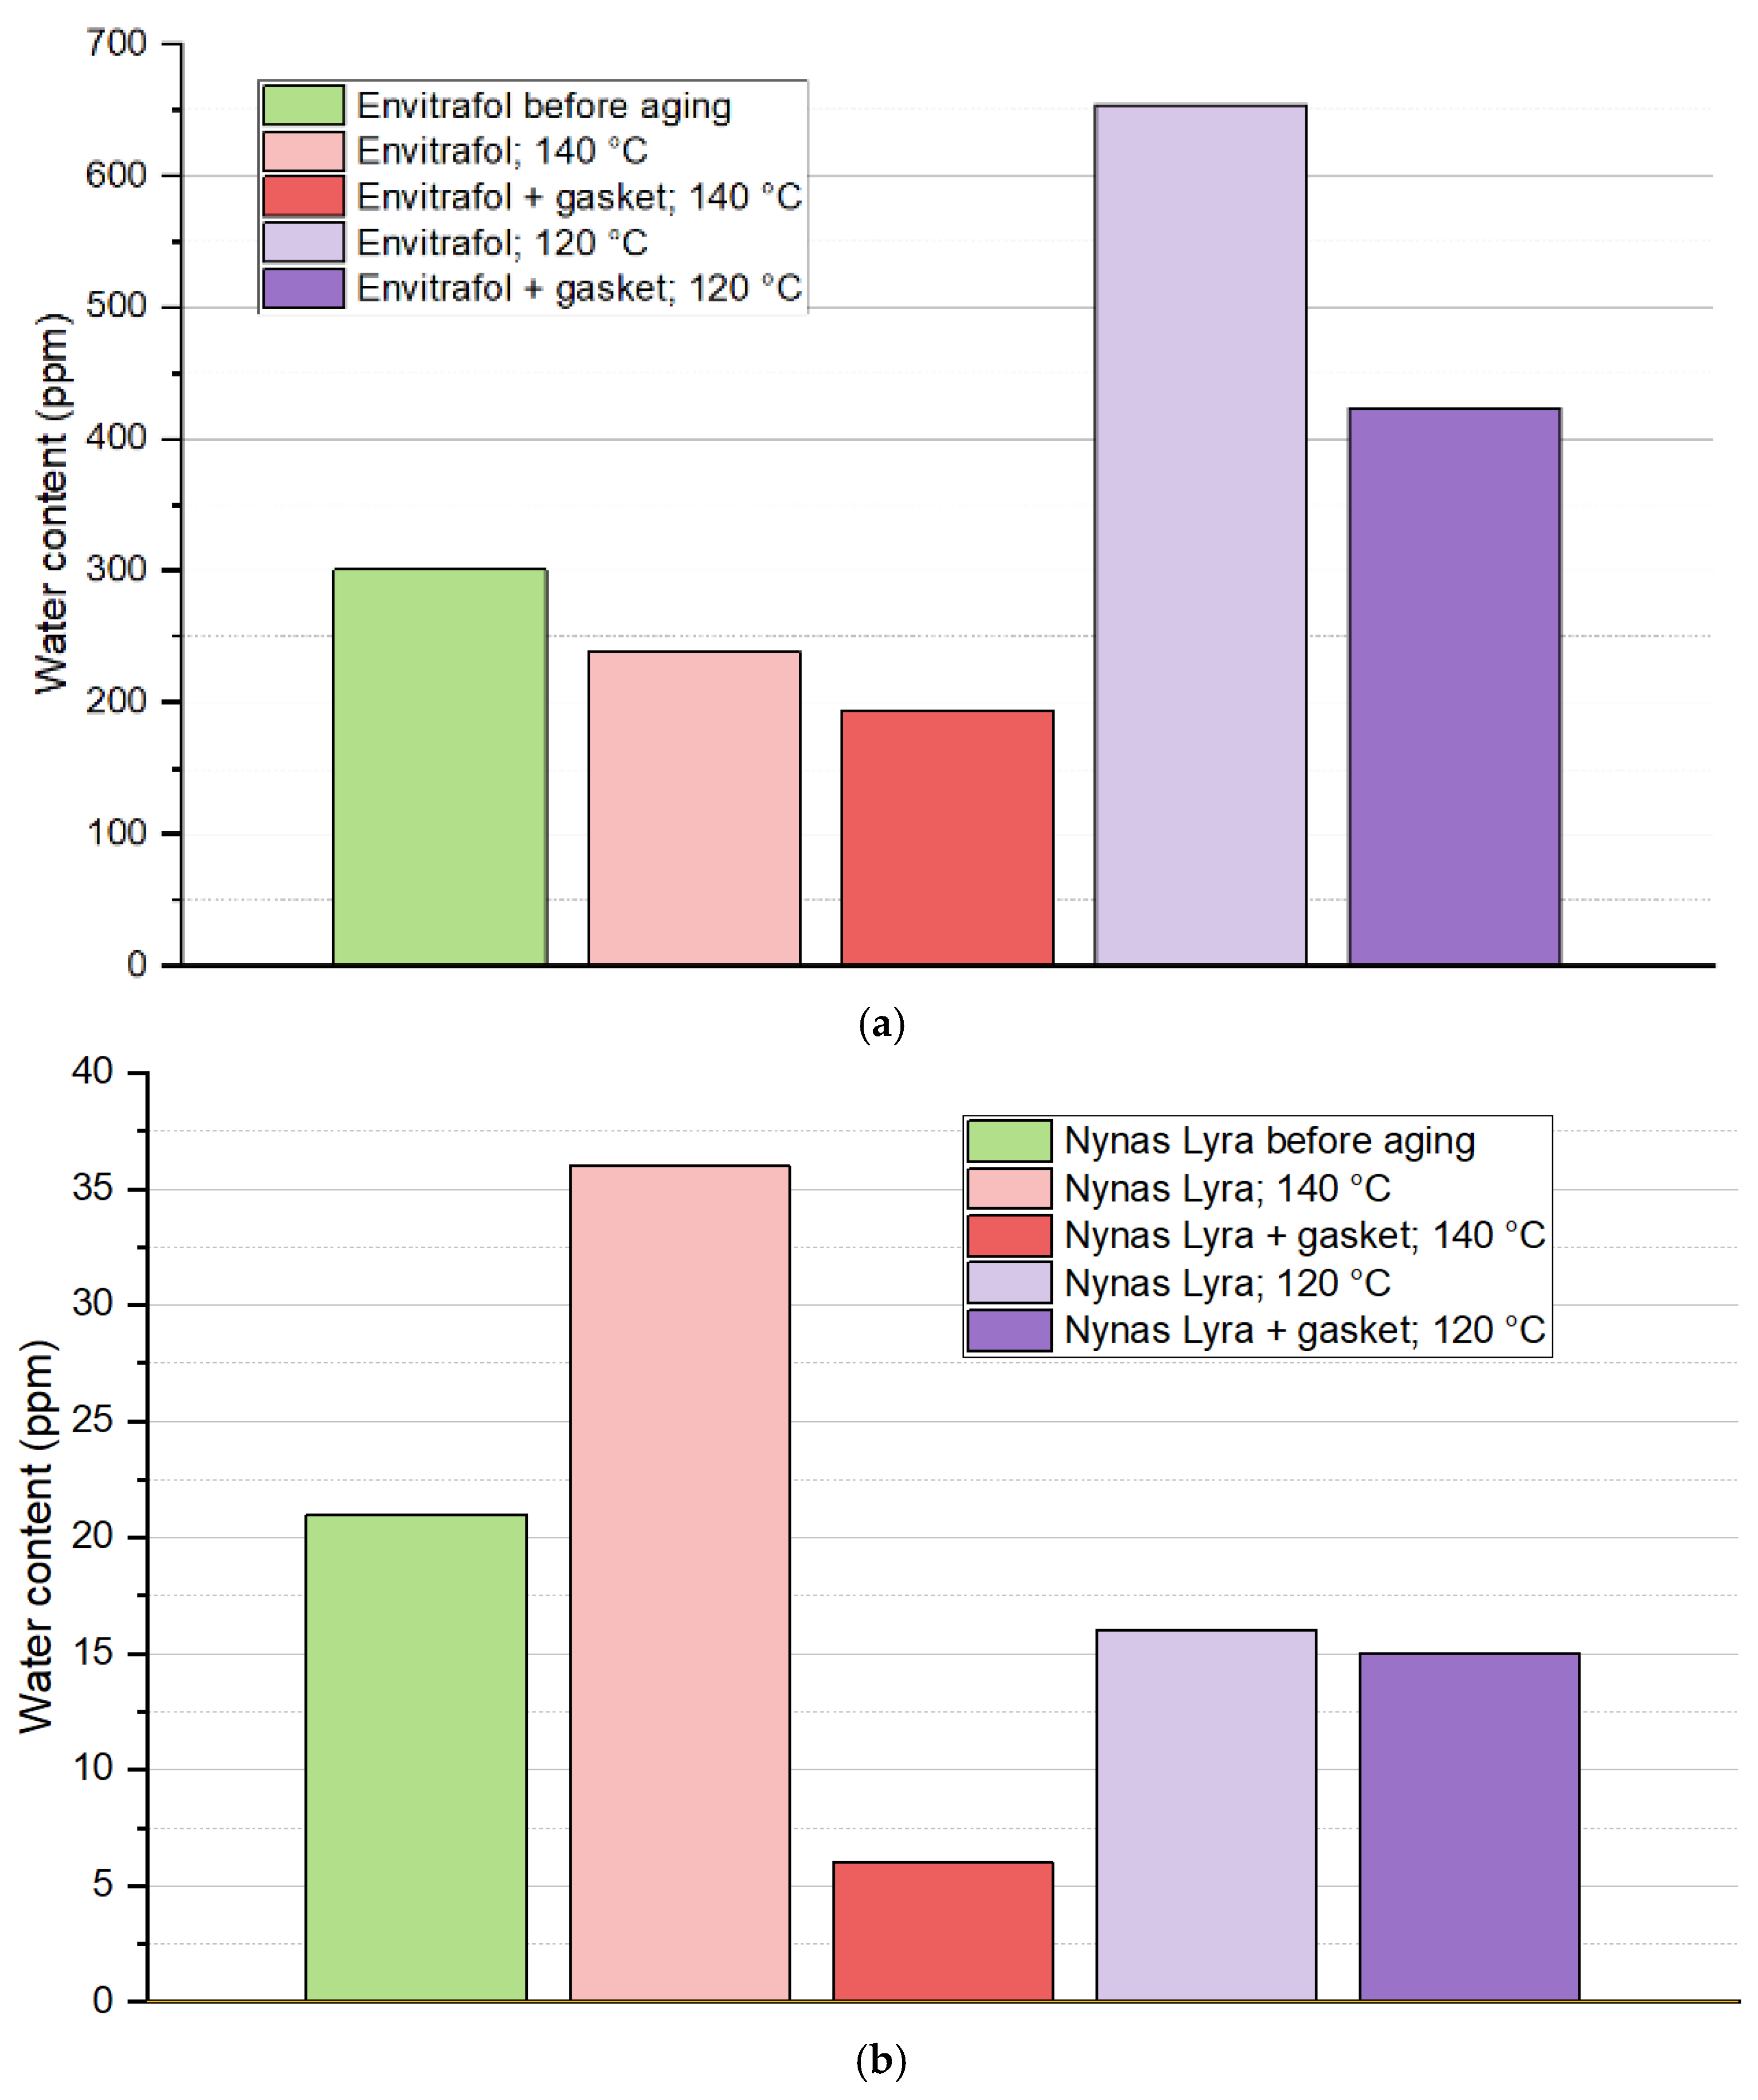
The results of the measured water content of oil samples after testing are not so easy to explain. It was proved by [
14] that both an acid hydrolysis and hydrogenation reaction occur in ester oil when exposed to high temperatures since mineral oil is determined by the acid hydrolysis of paper, which is not present in this experiment. The results of the effect of the seal on the formation of water in the oil can be marked as inconclusive based on the findings shown in
Figure 10. We expected a hydrogenation reaction of natural oil while subjected to 120 °C [
13].
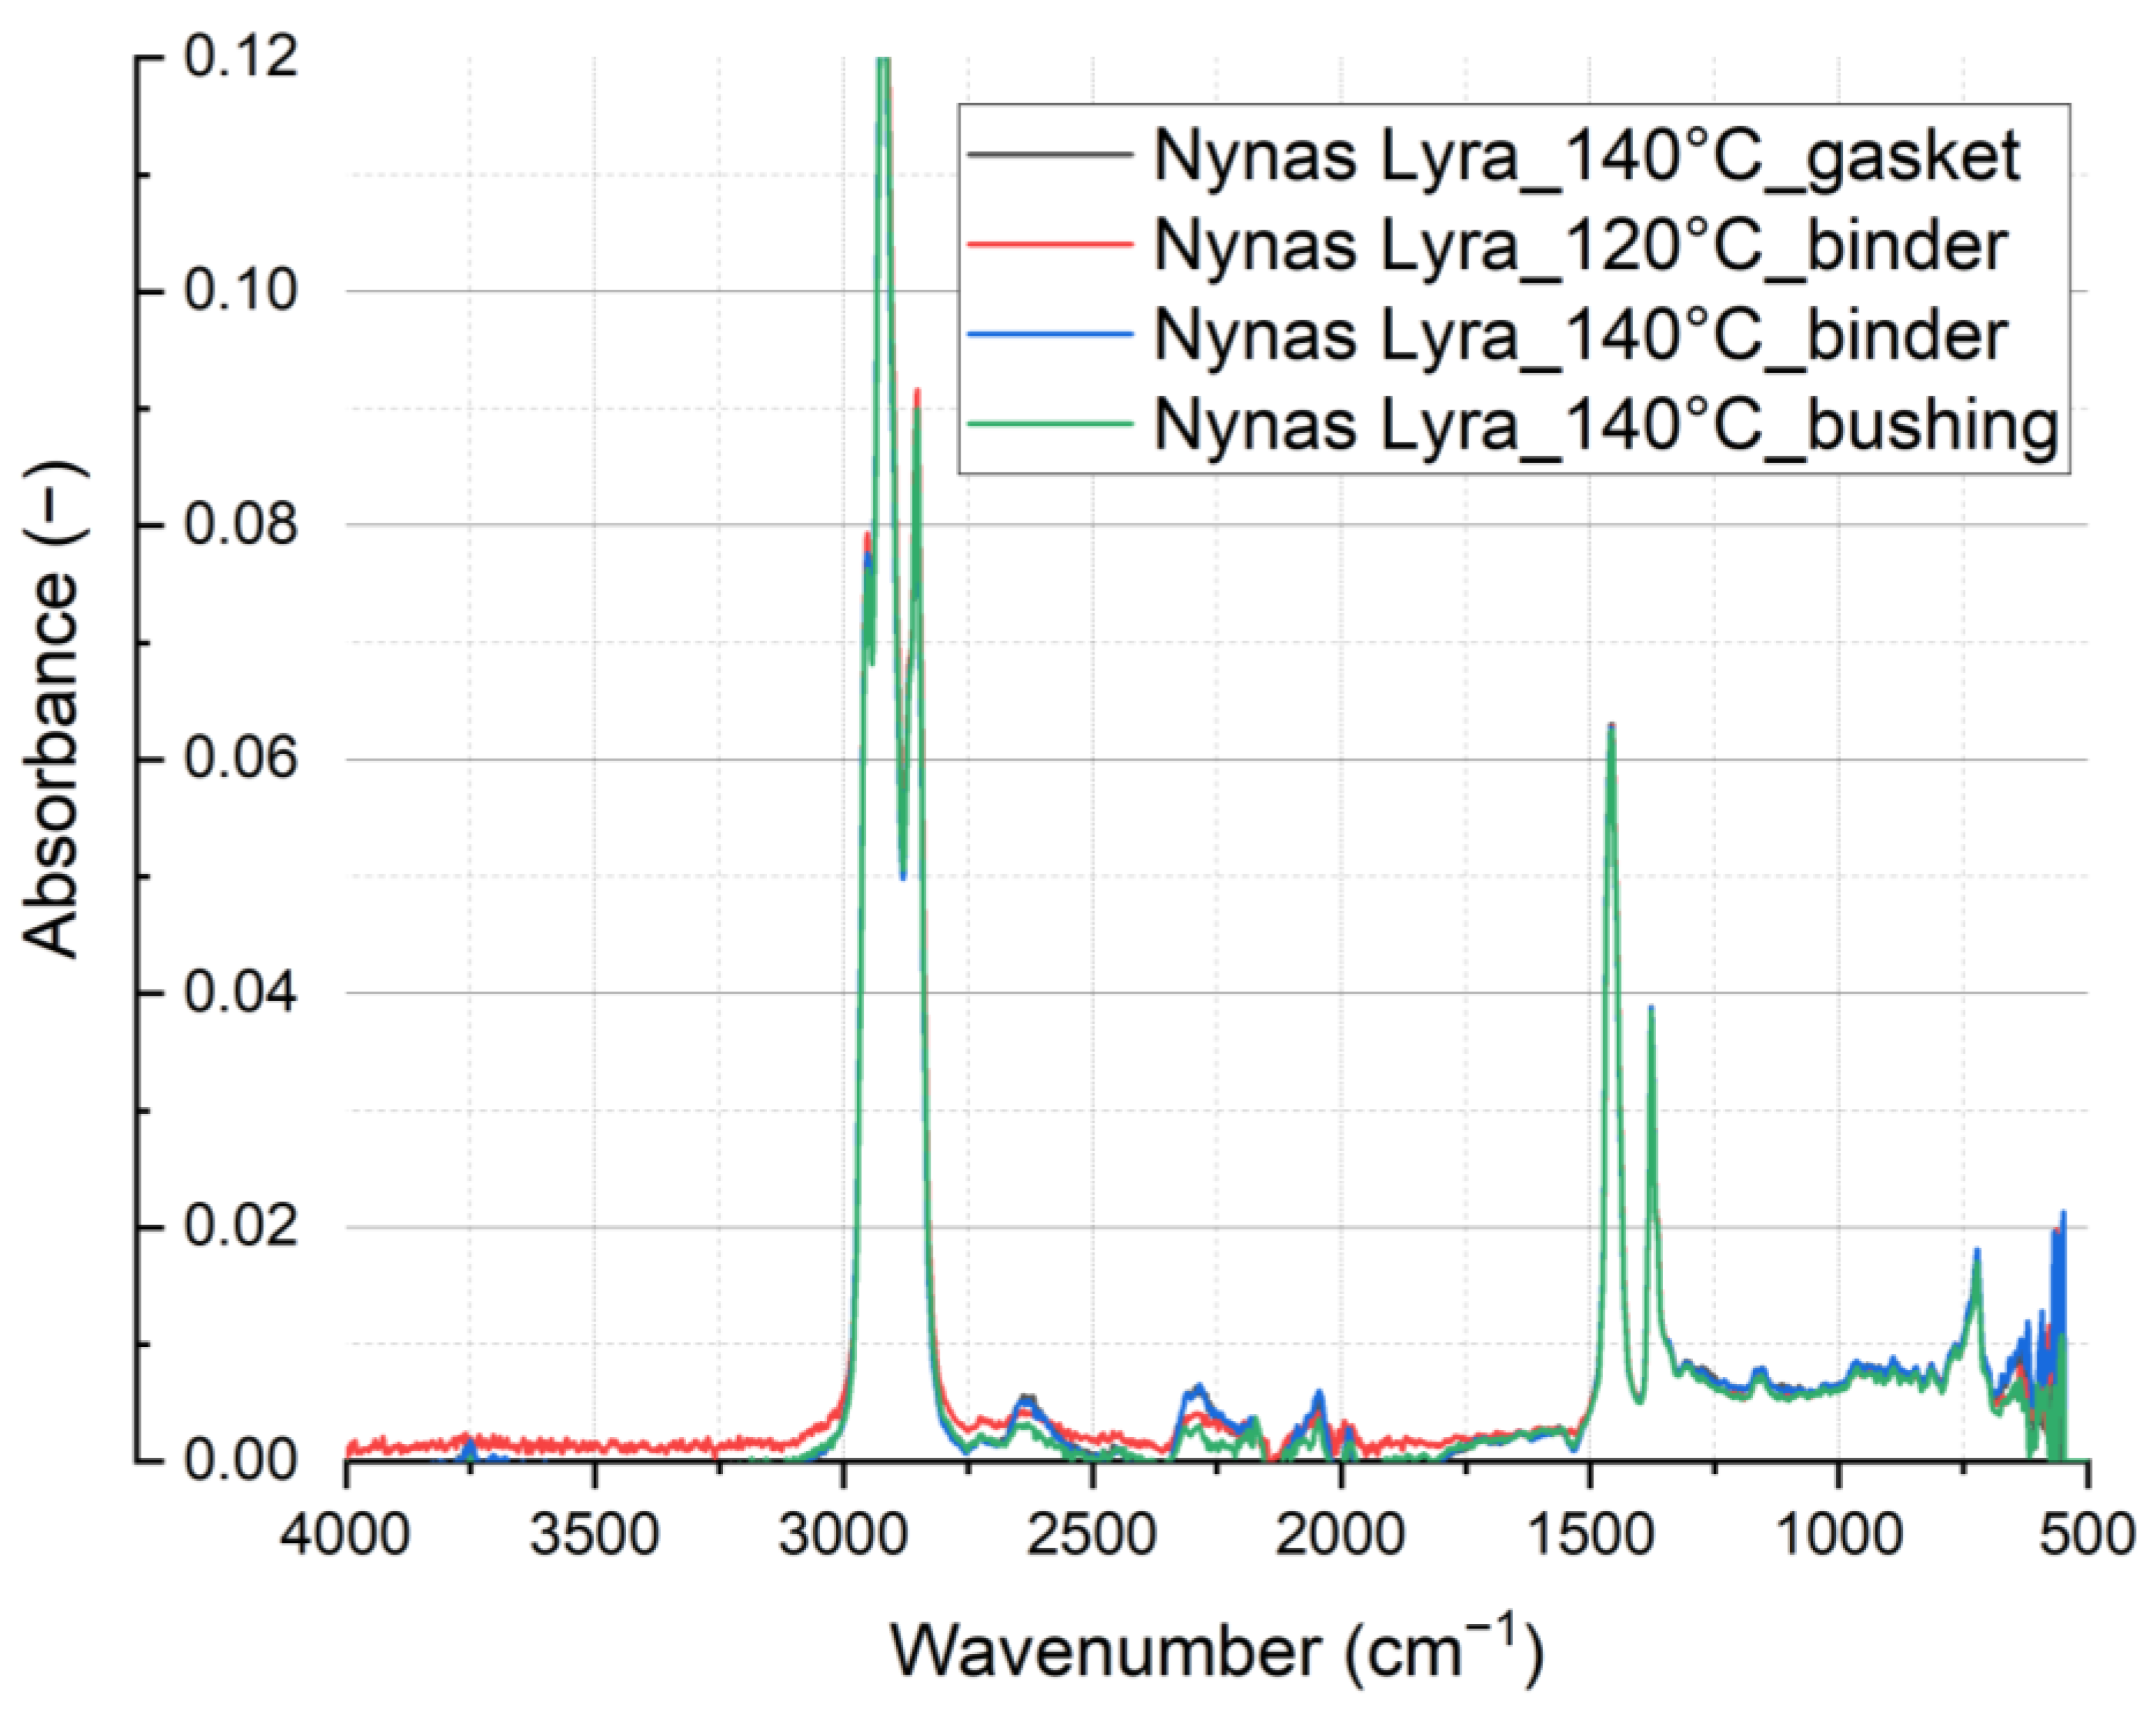
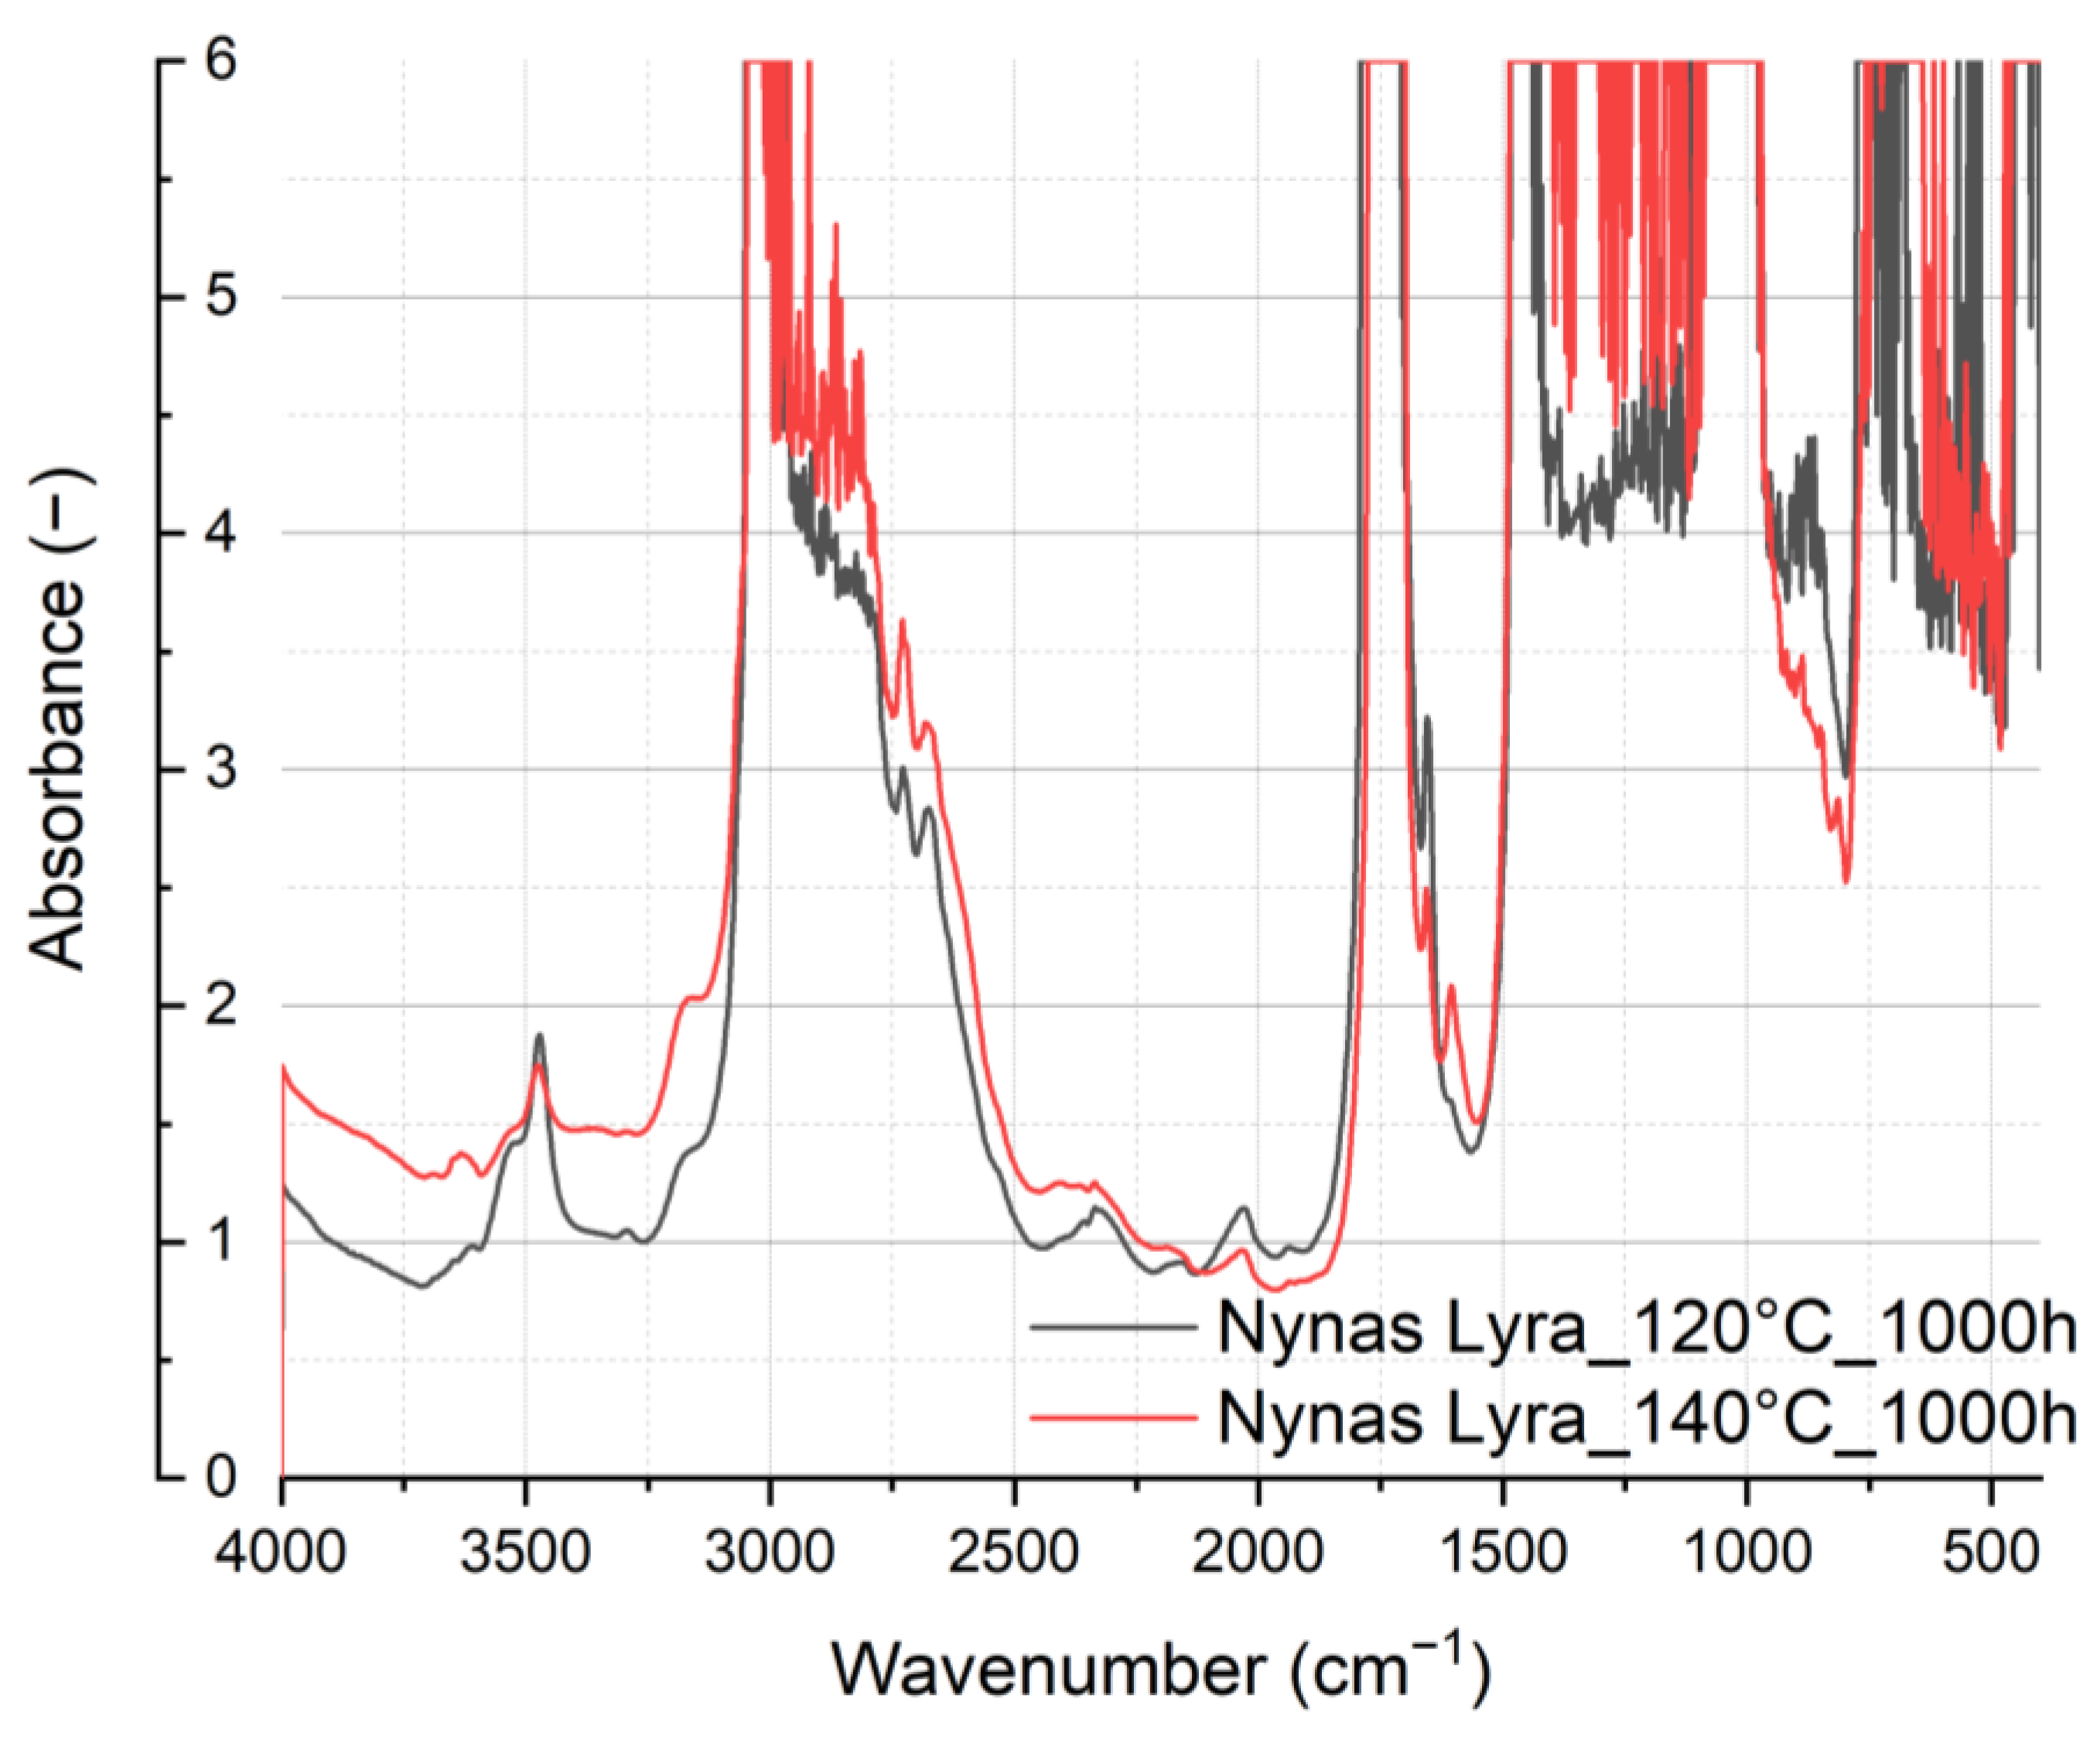
In the following figures, the measured FT-IR spectra of tested fluids are presented. First, the overall spectra of rapeseed oil,
Figure 11, and mineral oil,
Figure 12, are presented. In
Table 2, wavenumbers are assigned to main functional groups of tested oils.
Figure 11 and
Figure 12 show the results obtained by the ATR technique. This is a basic measurement that, however, does not have sufficient sensitivity to identify weakly contained components connected with oxidation-related changes. For this reason, transmission measurements were performed. This technique is described, for example, in “Comparison of the mineral oil lifetime estimates obtained by differential scanning calorimetry, infrared spectroscopy, and dielectric dissipation factor measurements” [
7], where a comparison with fresh oil samples is also provided.
In the spectral analysis depicted in
Figure 11 and
Figure 12, discernible differences emerge. Notably, variations in spectral intensity occur within the hydroxyl region at 3475 cm
−1 (associated with H
2O, ROH, and ROOH), indicating the oxidation of oils. Specifically, for rapeseed oil, heightened spectral intensity correlates with increased oil oxidation.
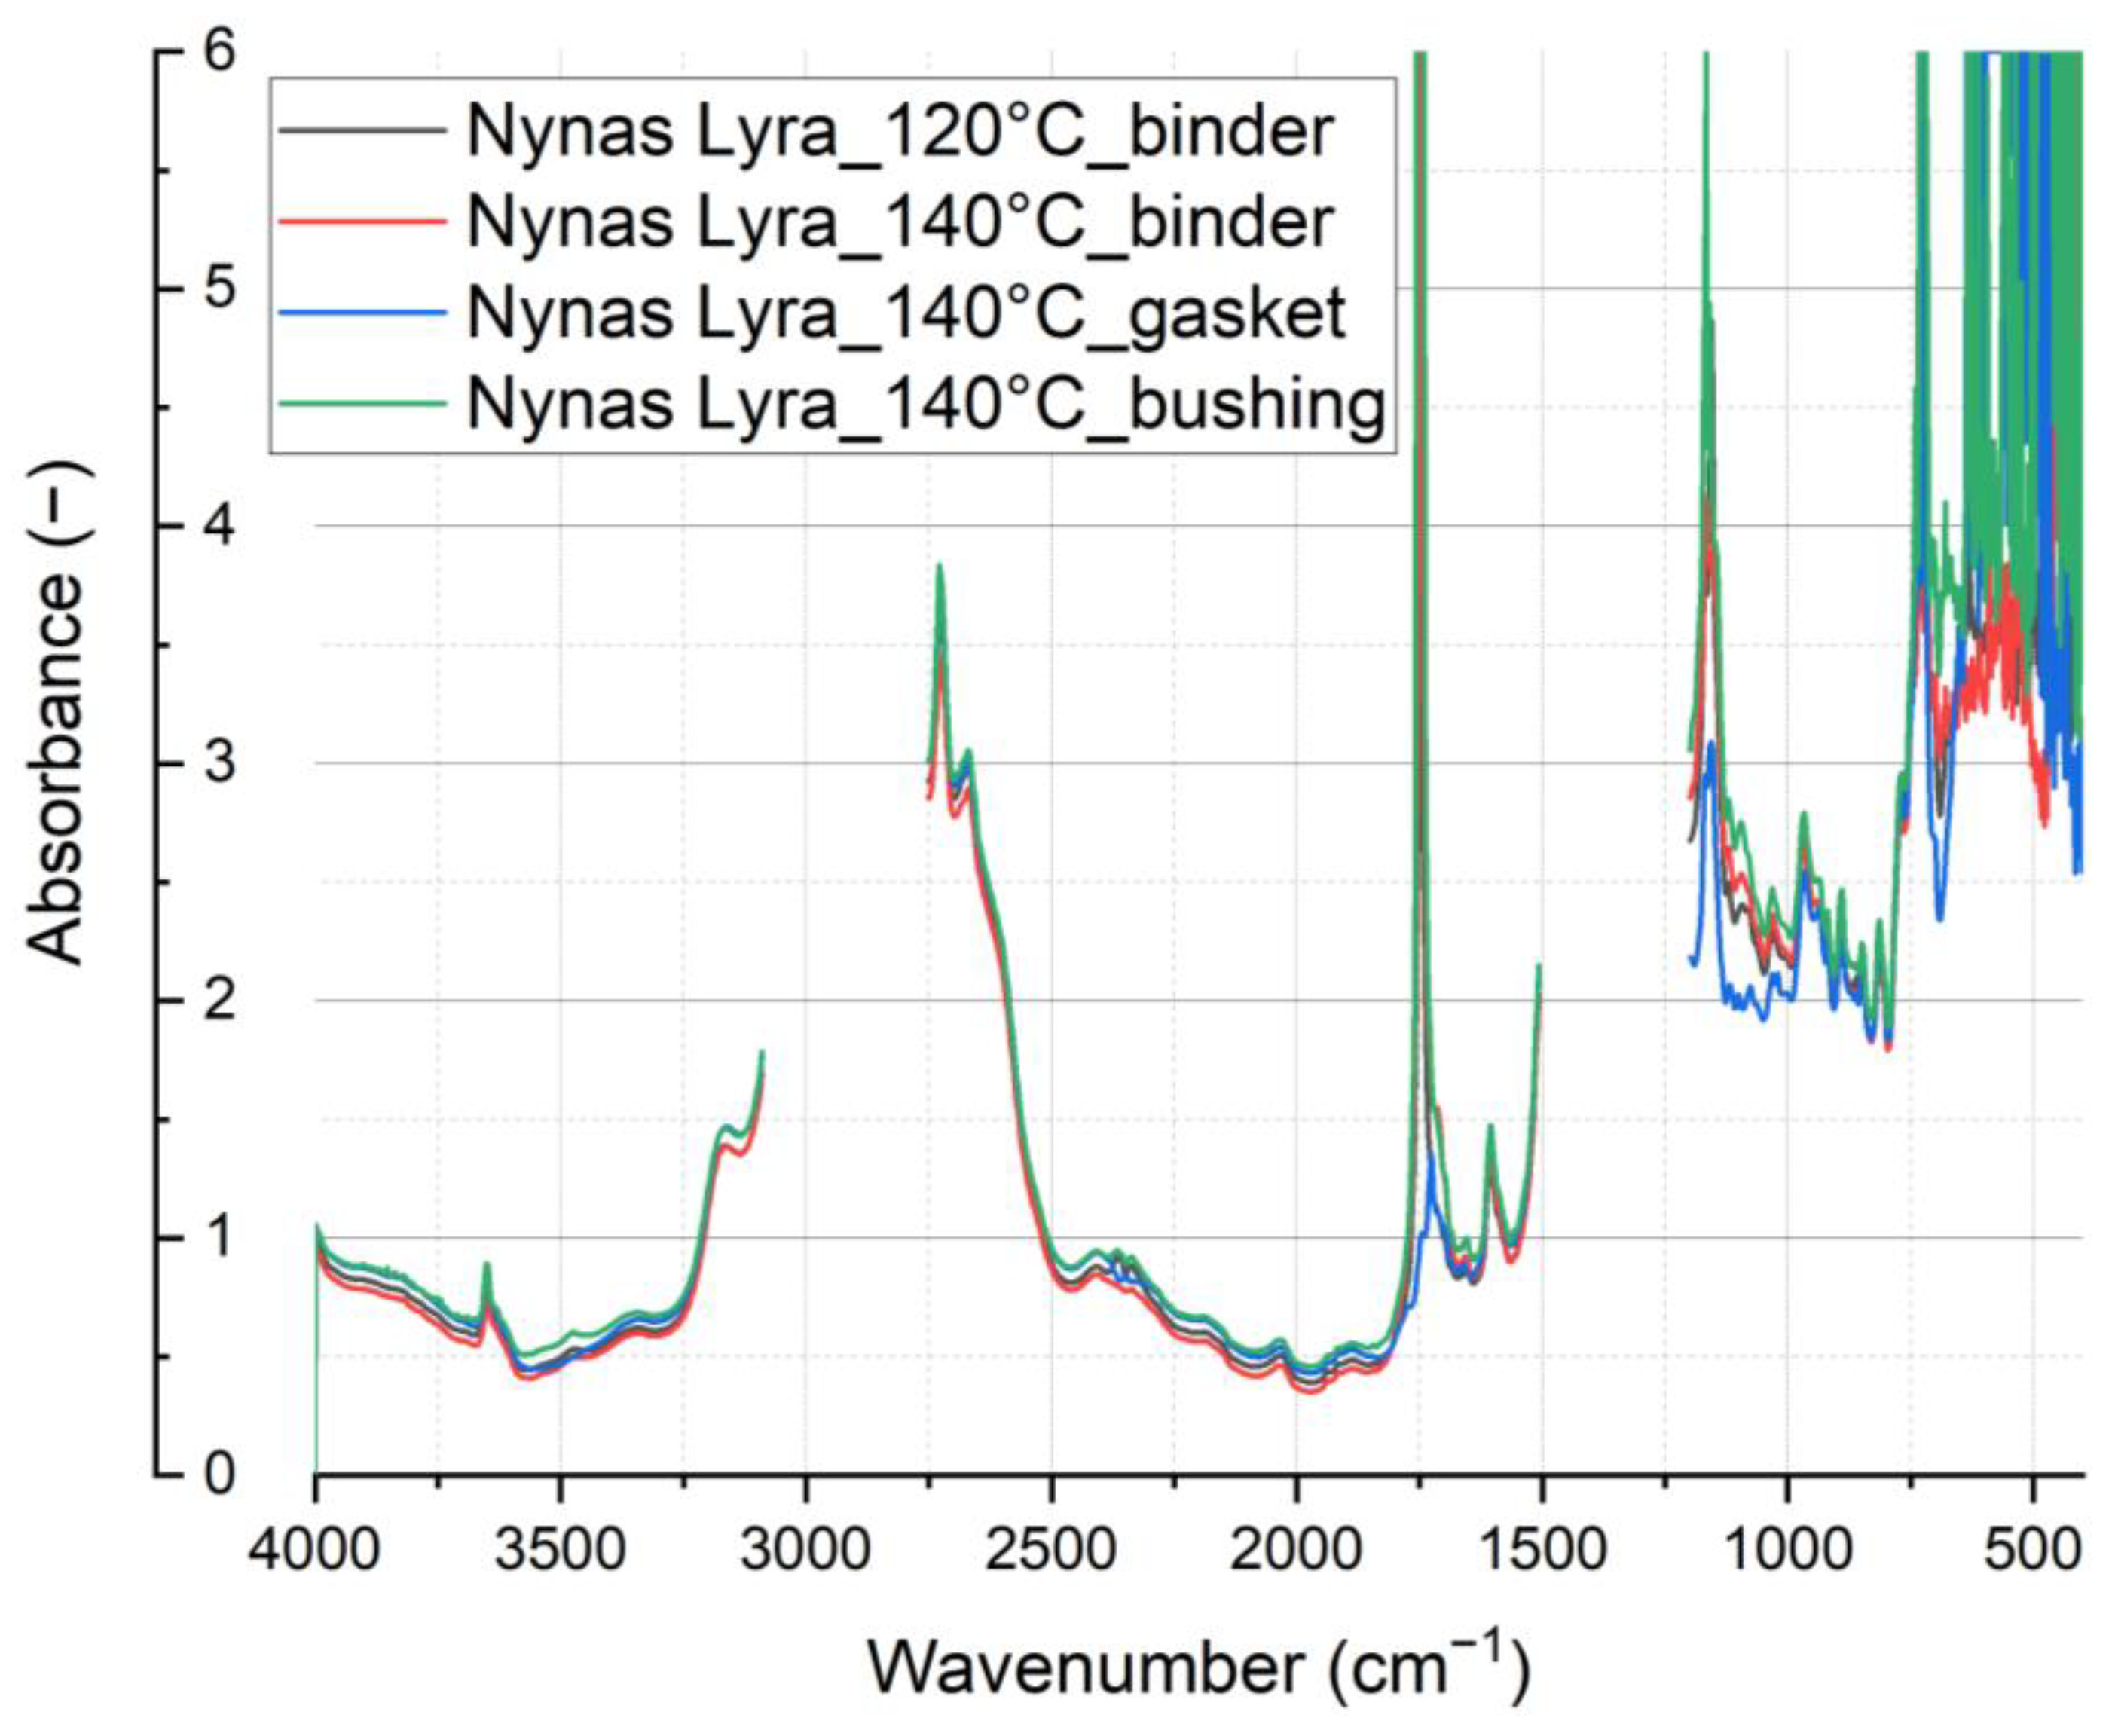
Furthermore [
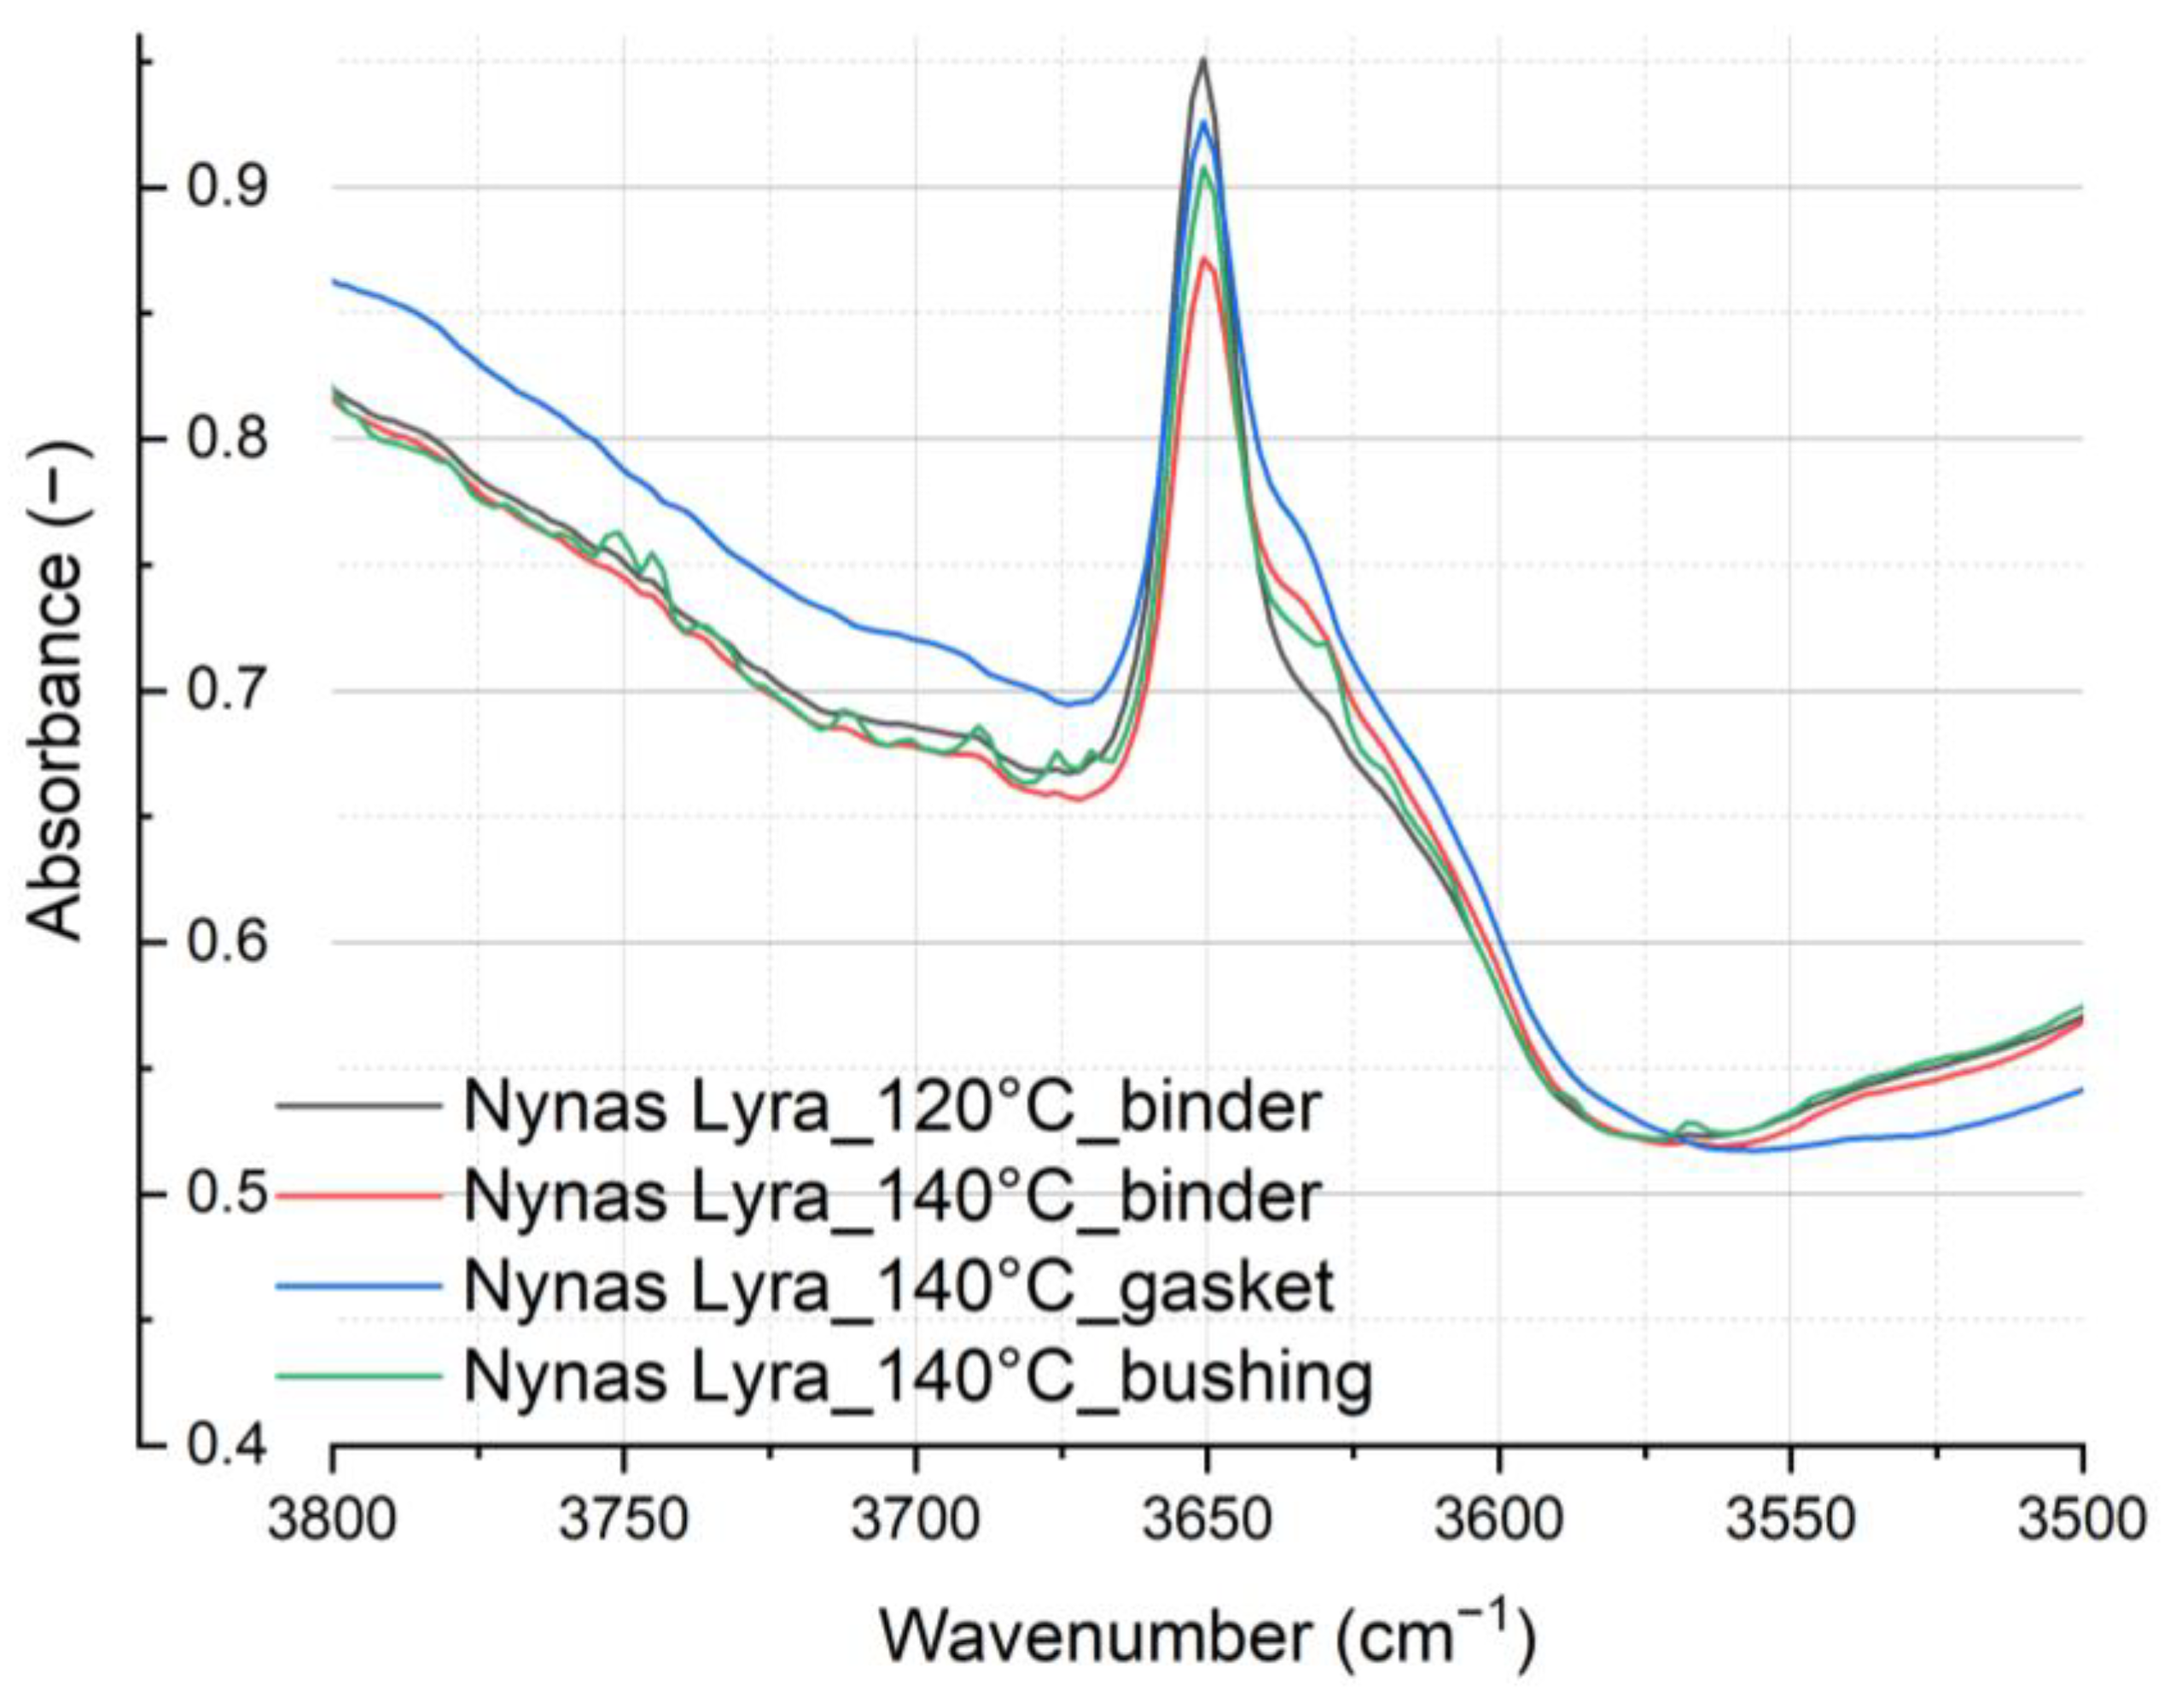
6], the aging process of mineral oil manifests as a reduction in the spectral band related to low-temperature antioxidants. This reduction is attributed to the stretch vibration of a non-hydrogen-bonded O-H group, spanning the spectral range from 3600 to 3700 cm
−1 (as illustrated in
Figure 13 and detailed in
Figure 14). As mineral oil ages, the gradual depletion of total antioxidants leads to a corresponding decrease in the intensity of the spectral band centered around 3650 cm
−1.
Figure 15 gives a detailed depiction of the vibrational region of the detected oil antioxidant.
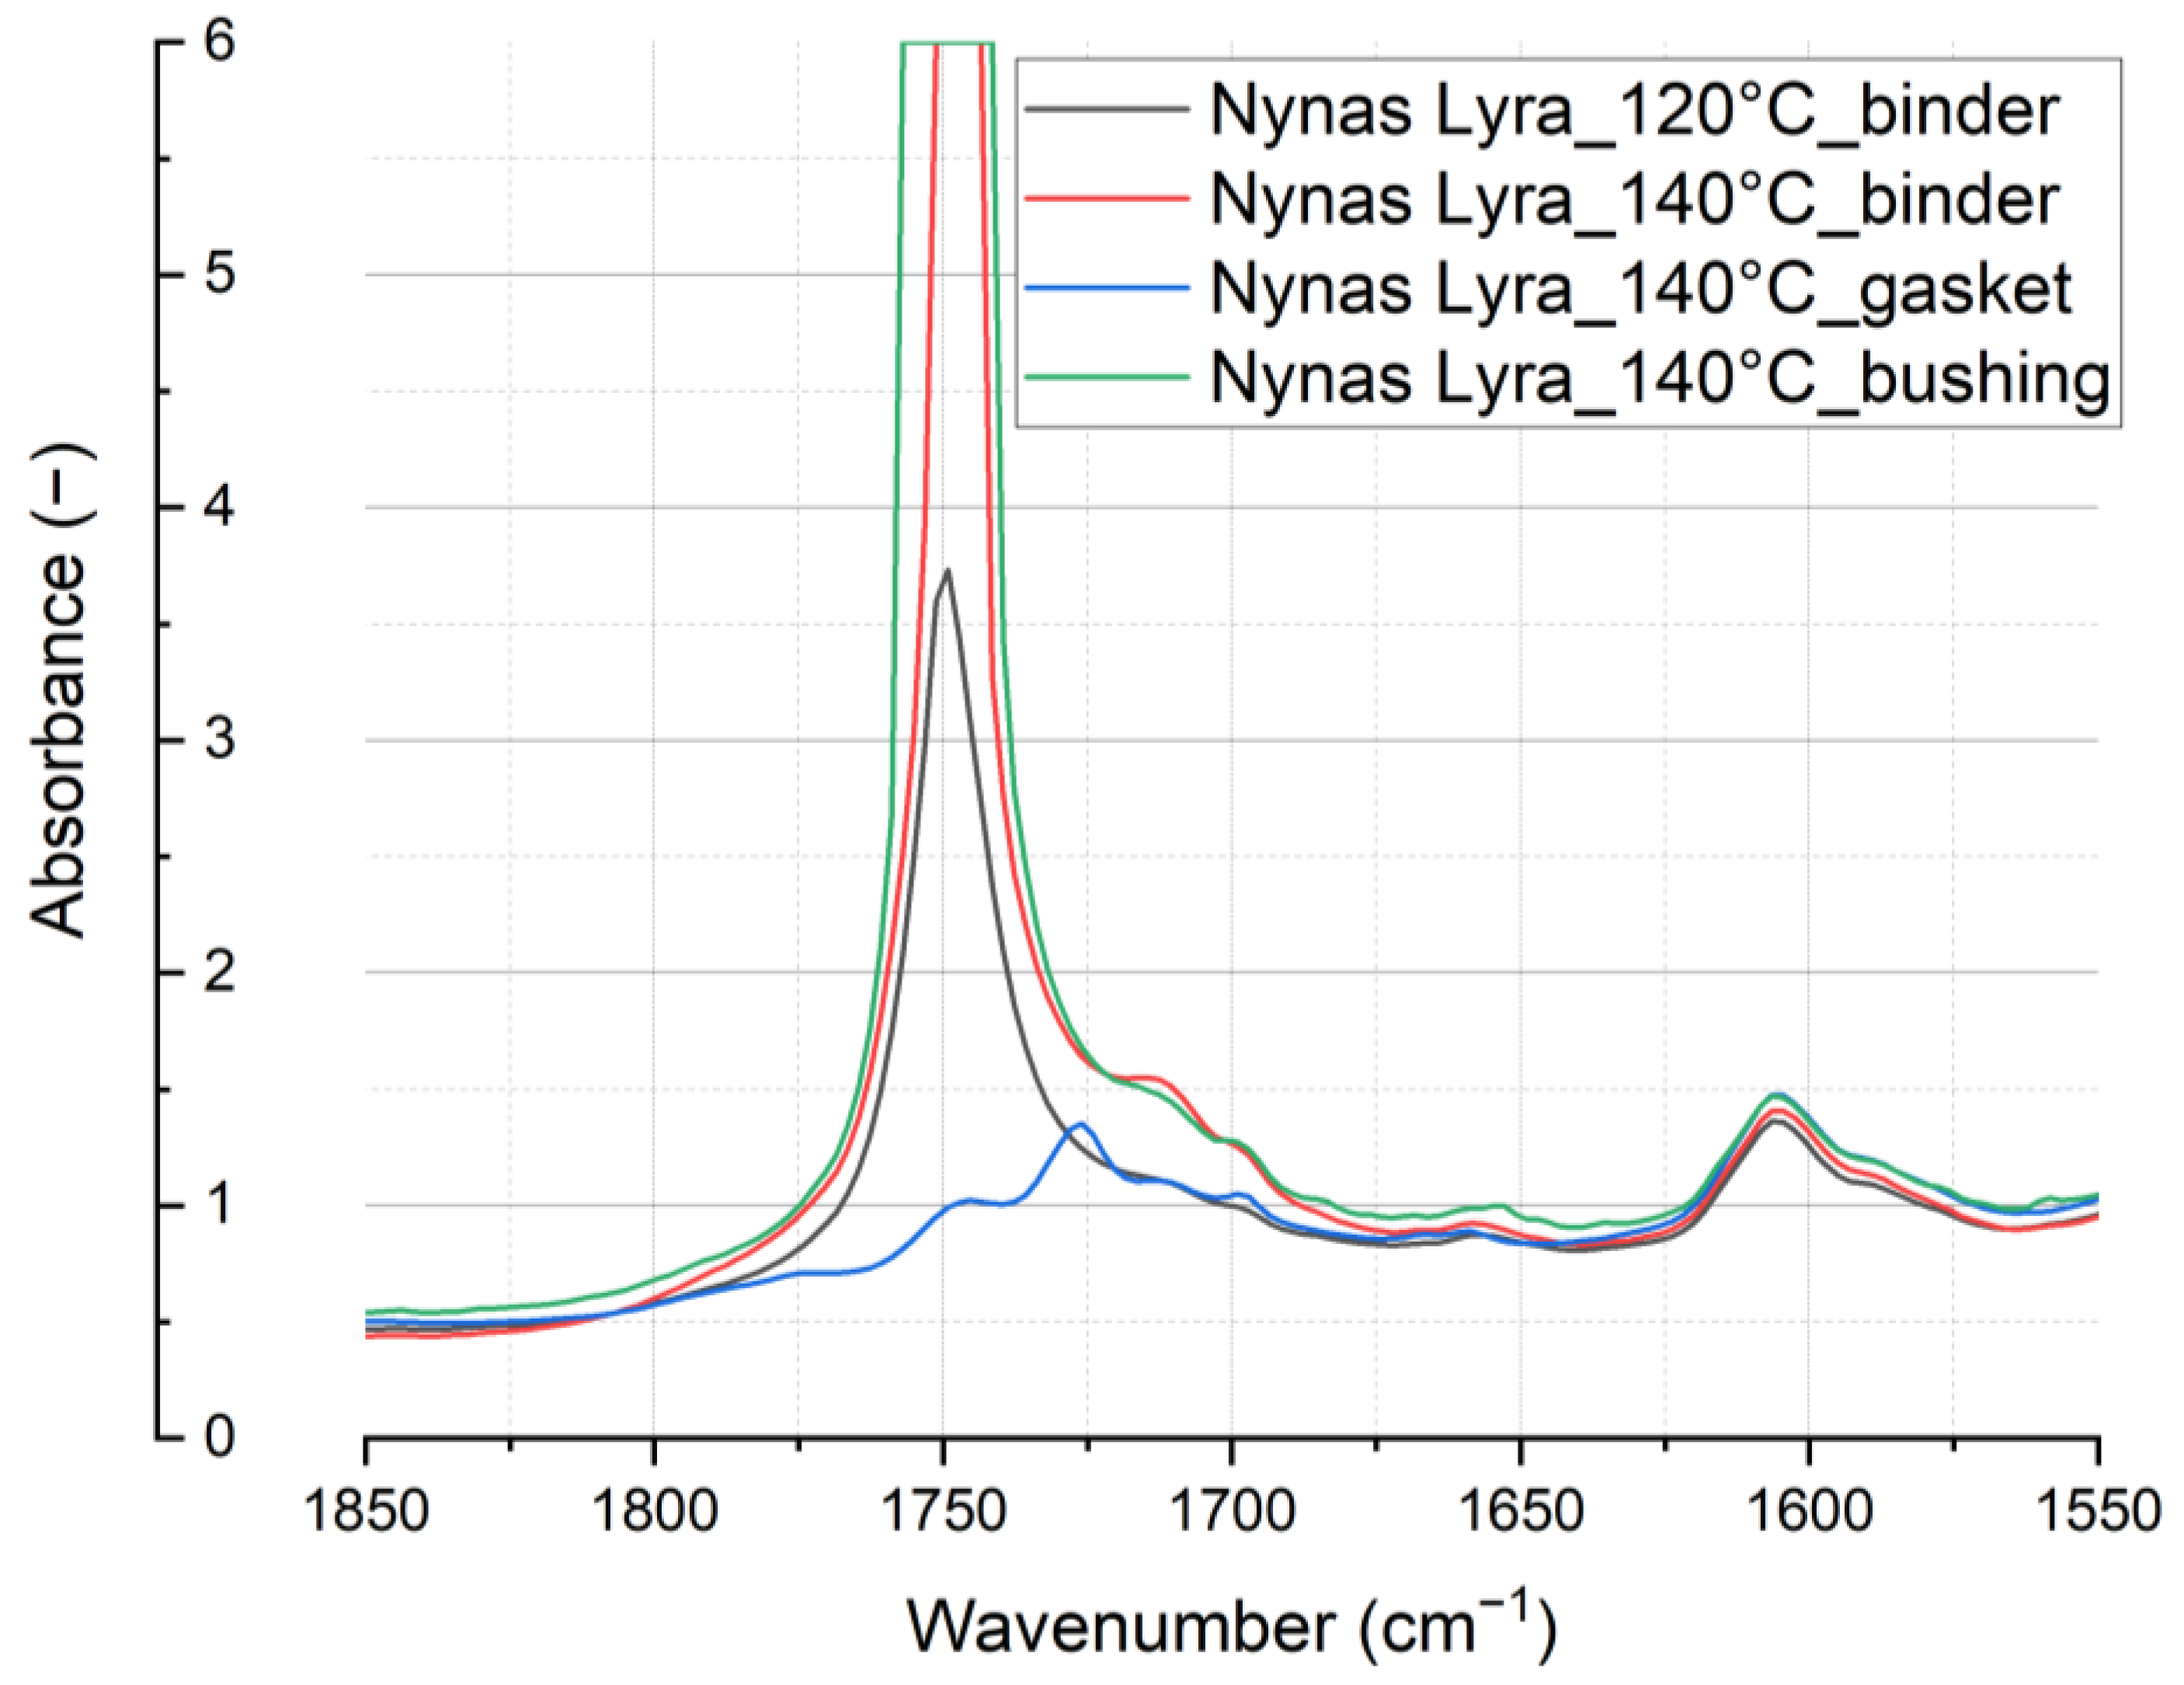
Other alterations in spectral intensity arising from the aging process become evident within the wavenumber range of 1650–1800 cm
−1 (associated with the C=O stretching vibration), see
Figure 16. These variations can be attributed to the oxidative reactions occurring in the oil. Specifically, the presence of this spectral band indicates the accumulation of carbonyl (C=O) or hydroperoxide (-OOH) groups. Notably, the strong spectral bands within this range suggest the presence of oxidation products such as ketones, aldehydes, and carboxylic acids. These compounds exhibit a significant dipole moment, where the accumulation of such polar compounds leads to a higher dielectric loss and a reduction in the insulation performance of the oil, as they increase electrical conductivity [
6,
7].
In
Figure 17 and
Figure 18, the polarity of a bond influences the intensity of an absorption band. Bonds with greater polarity produce more intense absorption bands. Additionally, the intensity is affected by the number of bonds contributing to the absorption. Based on the Beer–Lambert law, absorption bands involving more bonds exhibit higher intensity.
Due to the need to analyze the less abundant components, the optical path had to be increased during the measurement. Thus, the intensity of the more abundant components had to be significantly increased. In these cases, they enter a state of so-called total absorption, which is manifested by an oscillation curve.
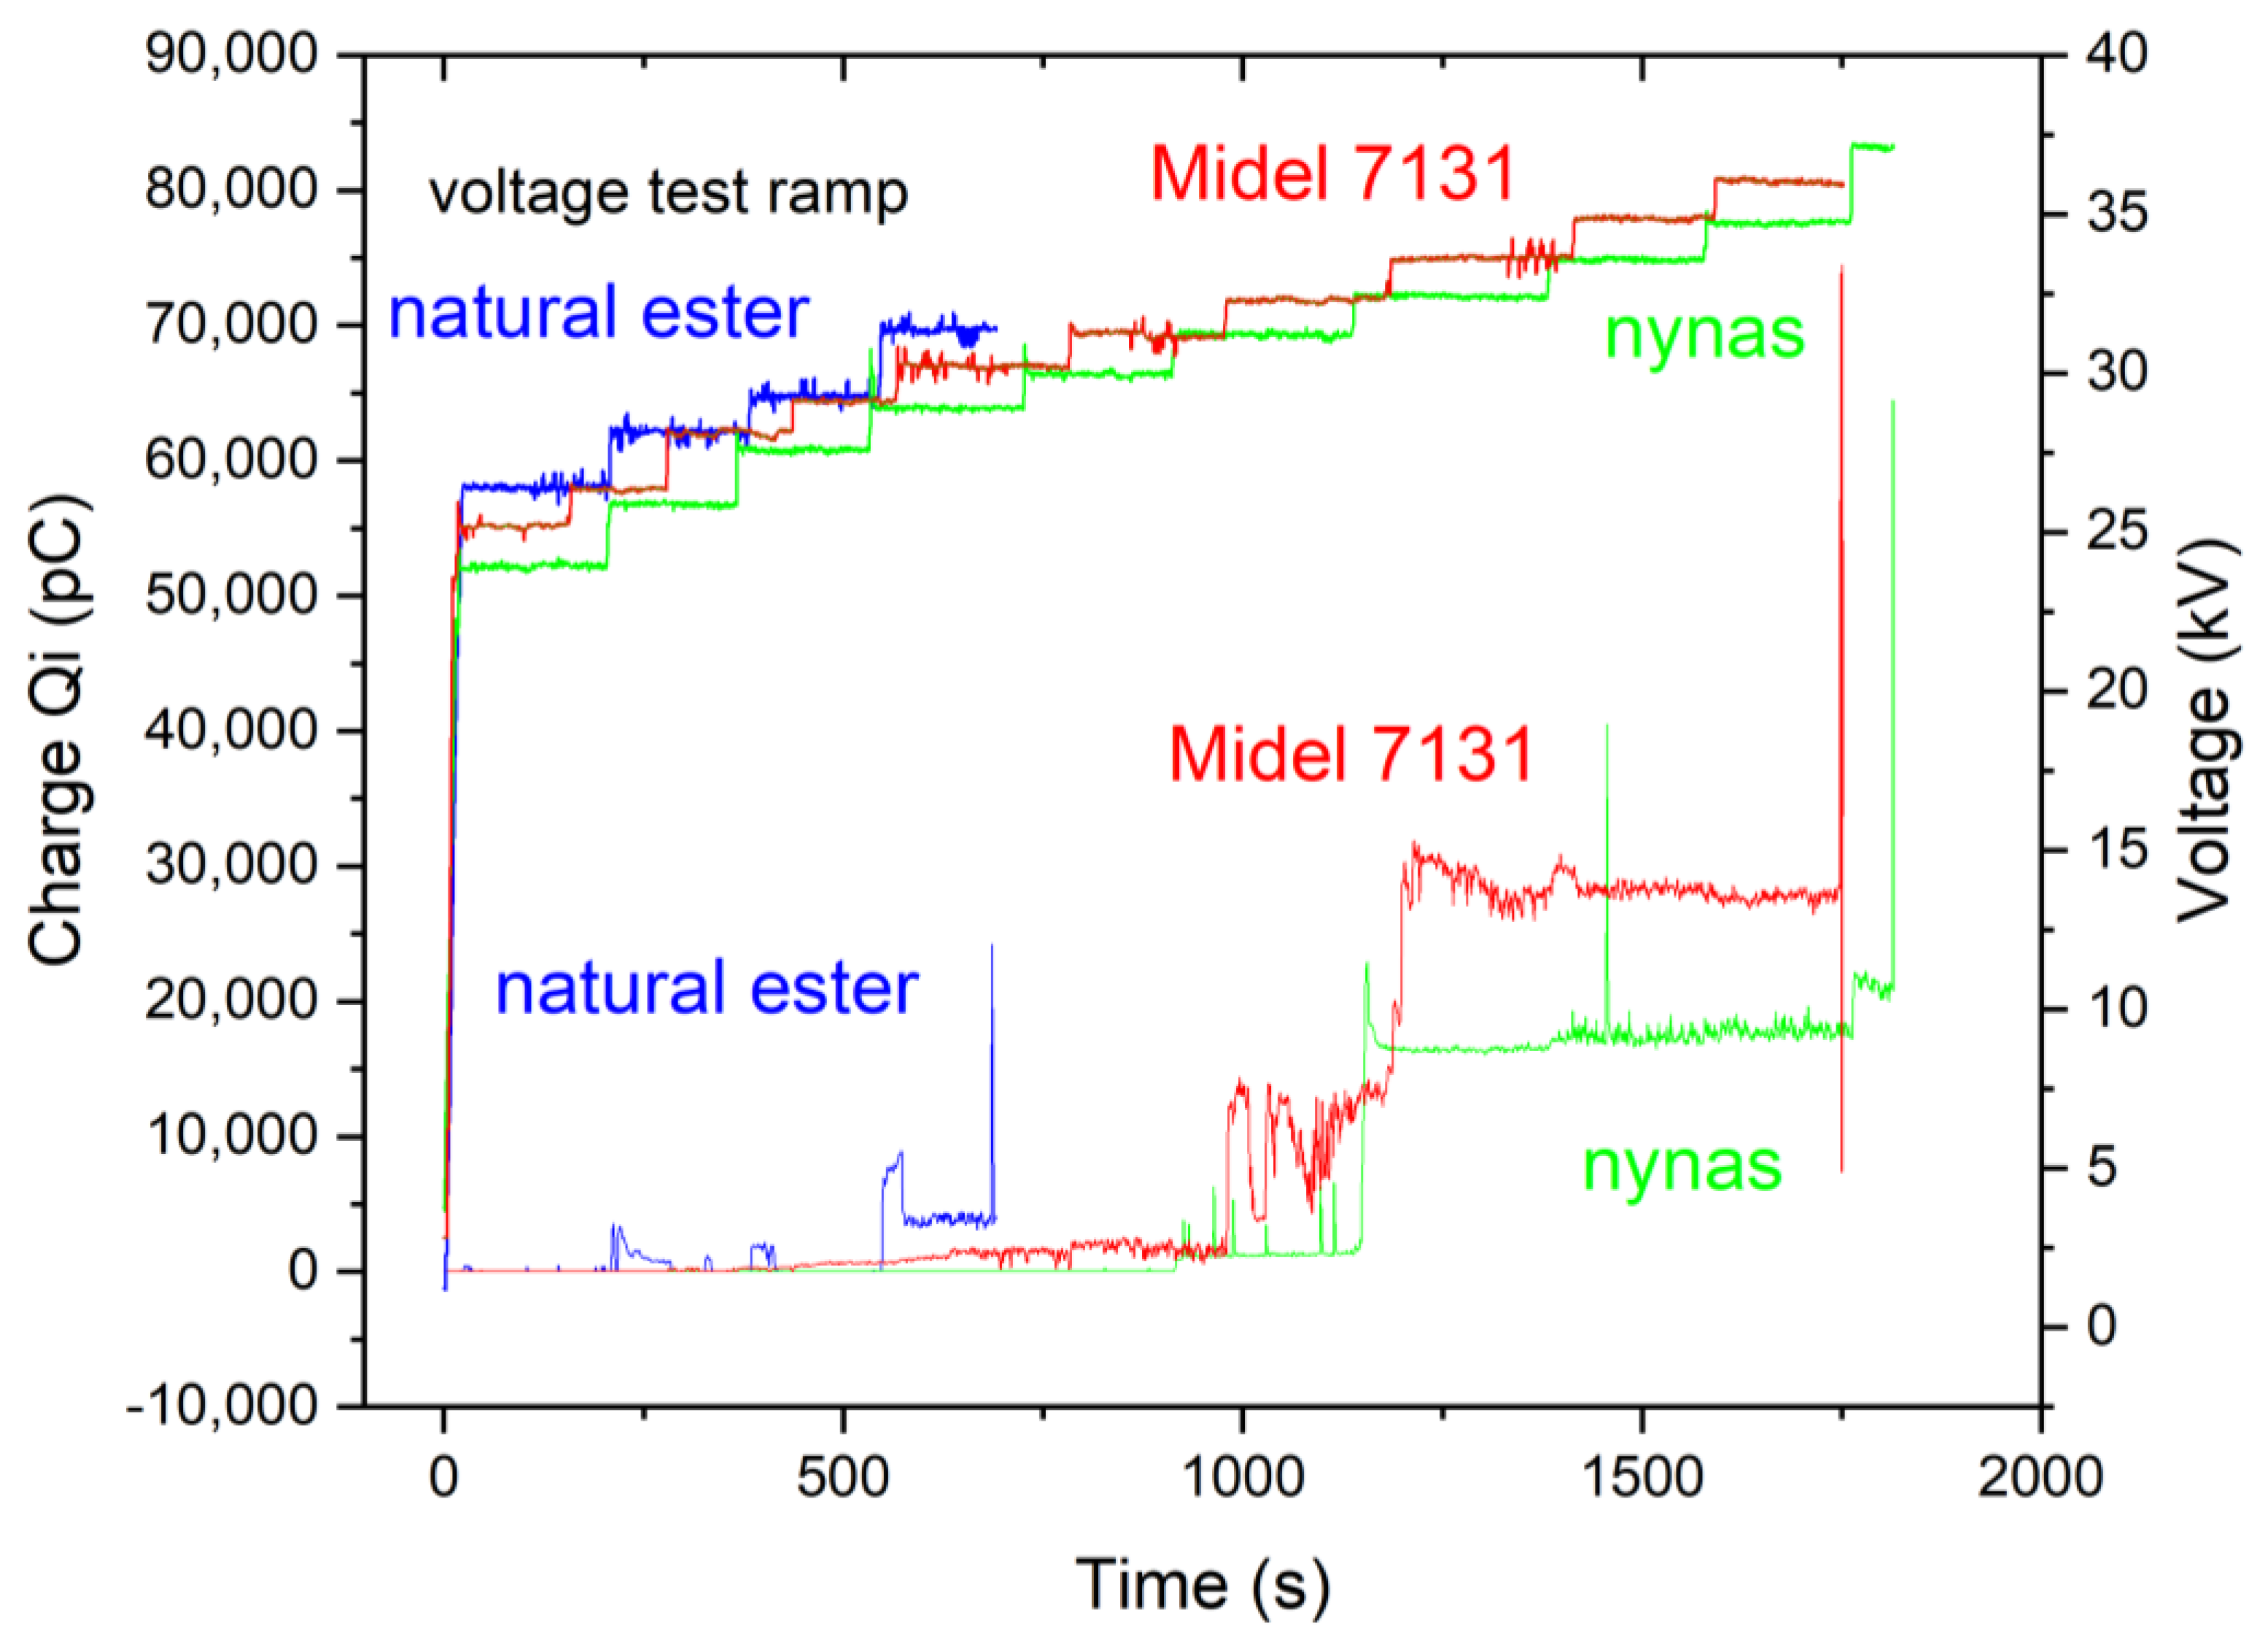
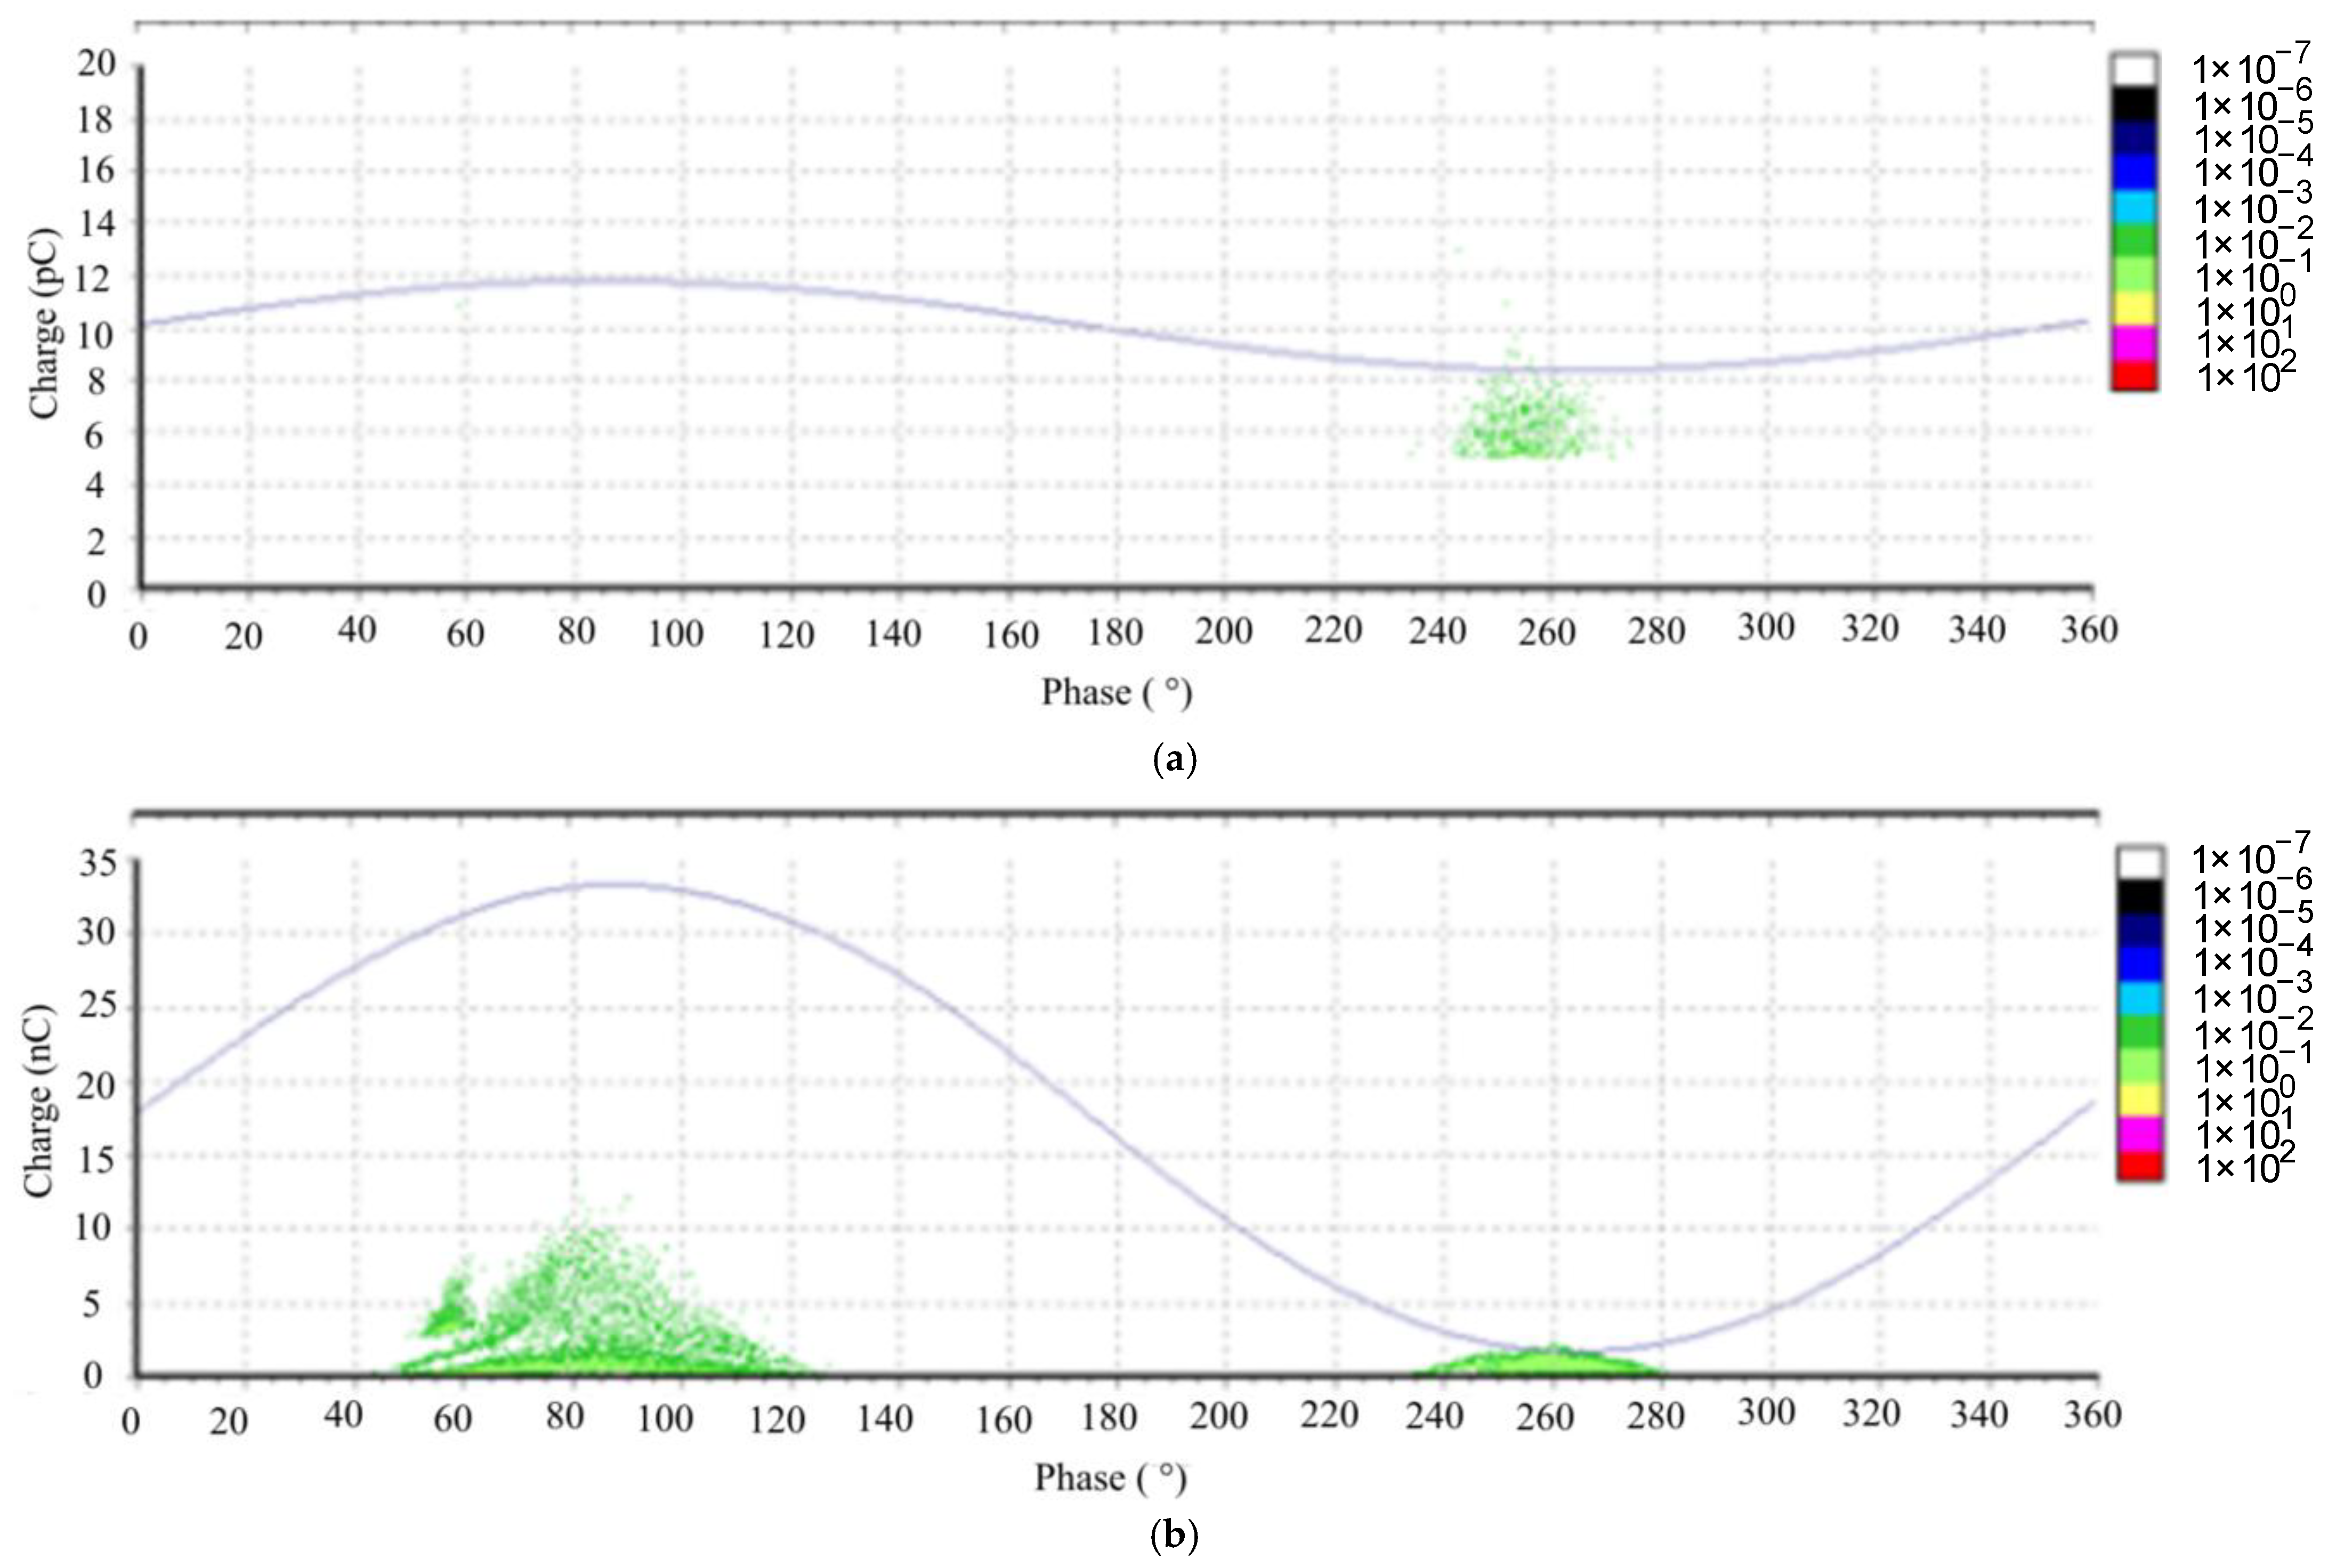
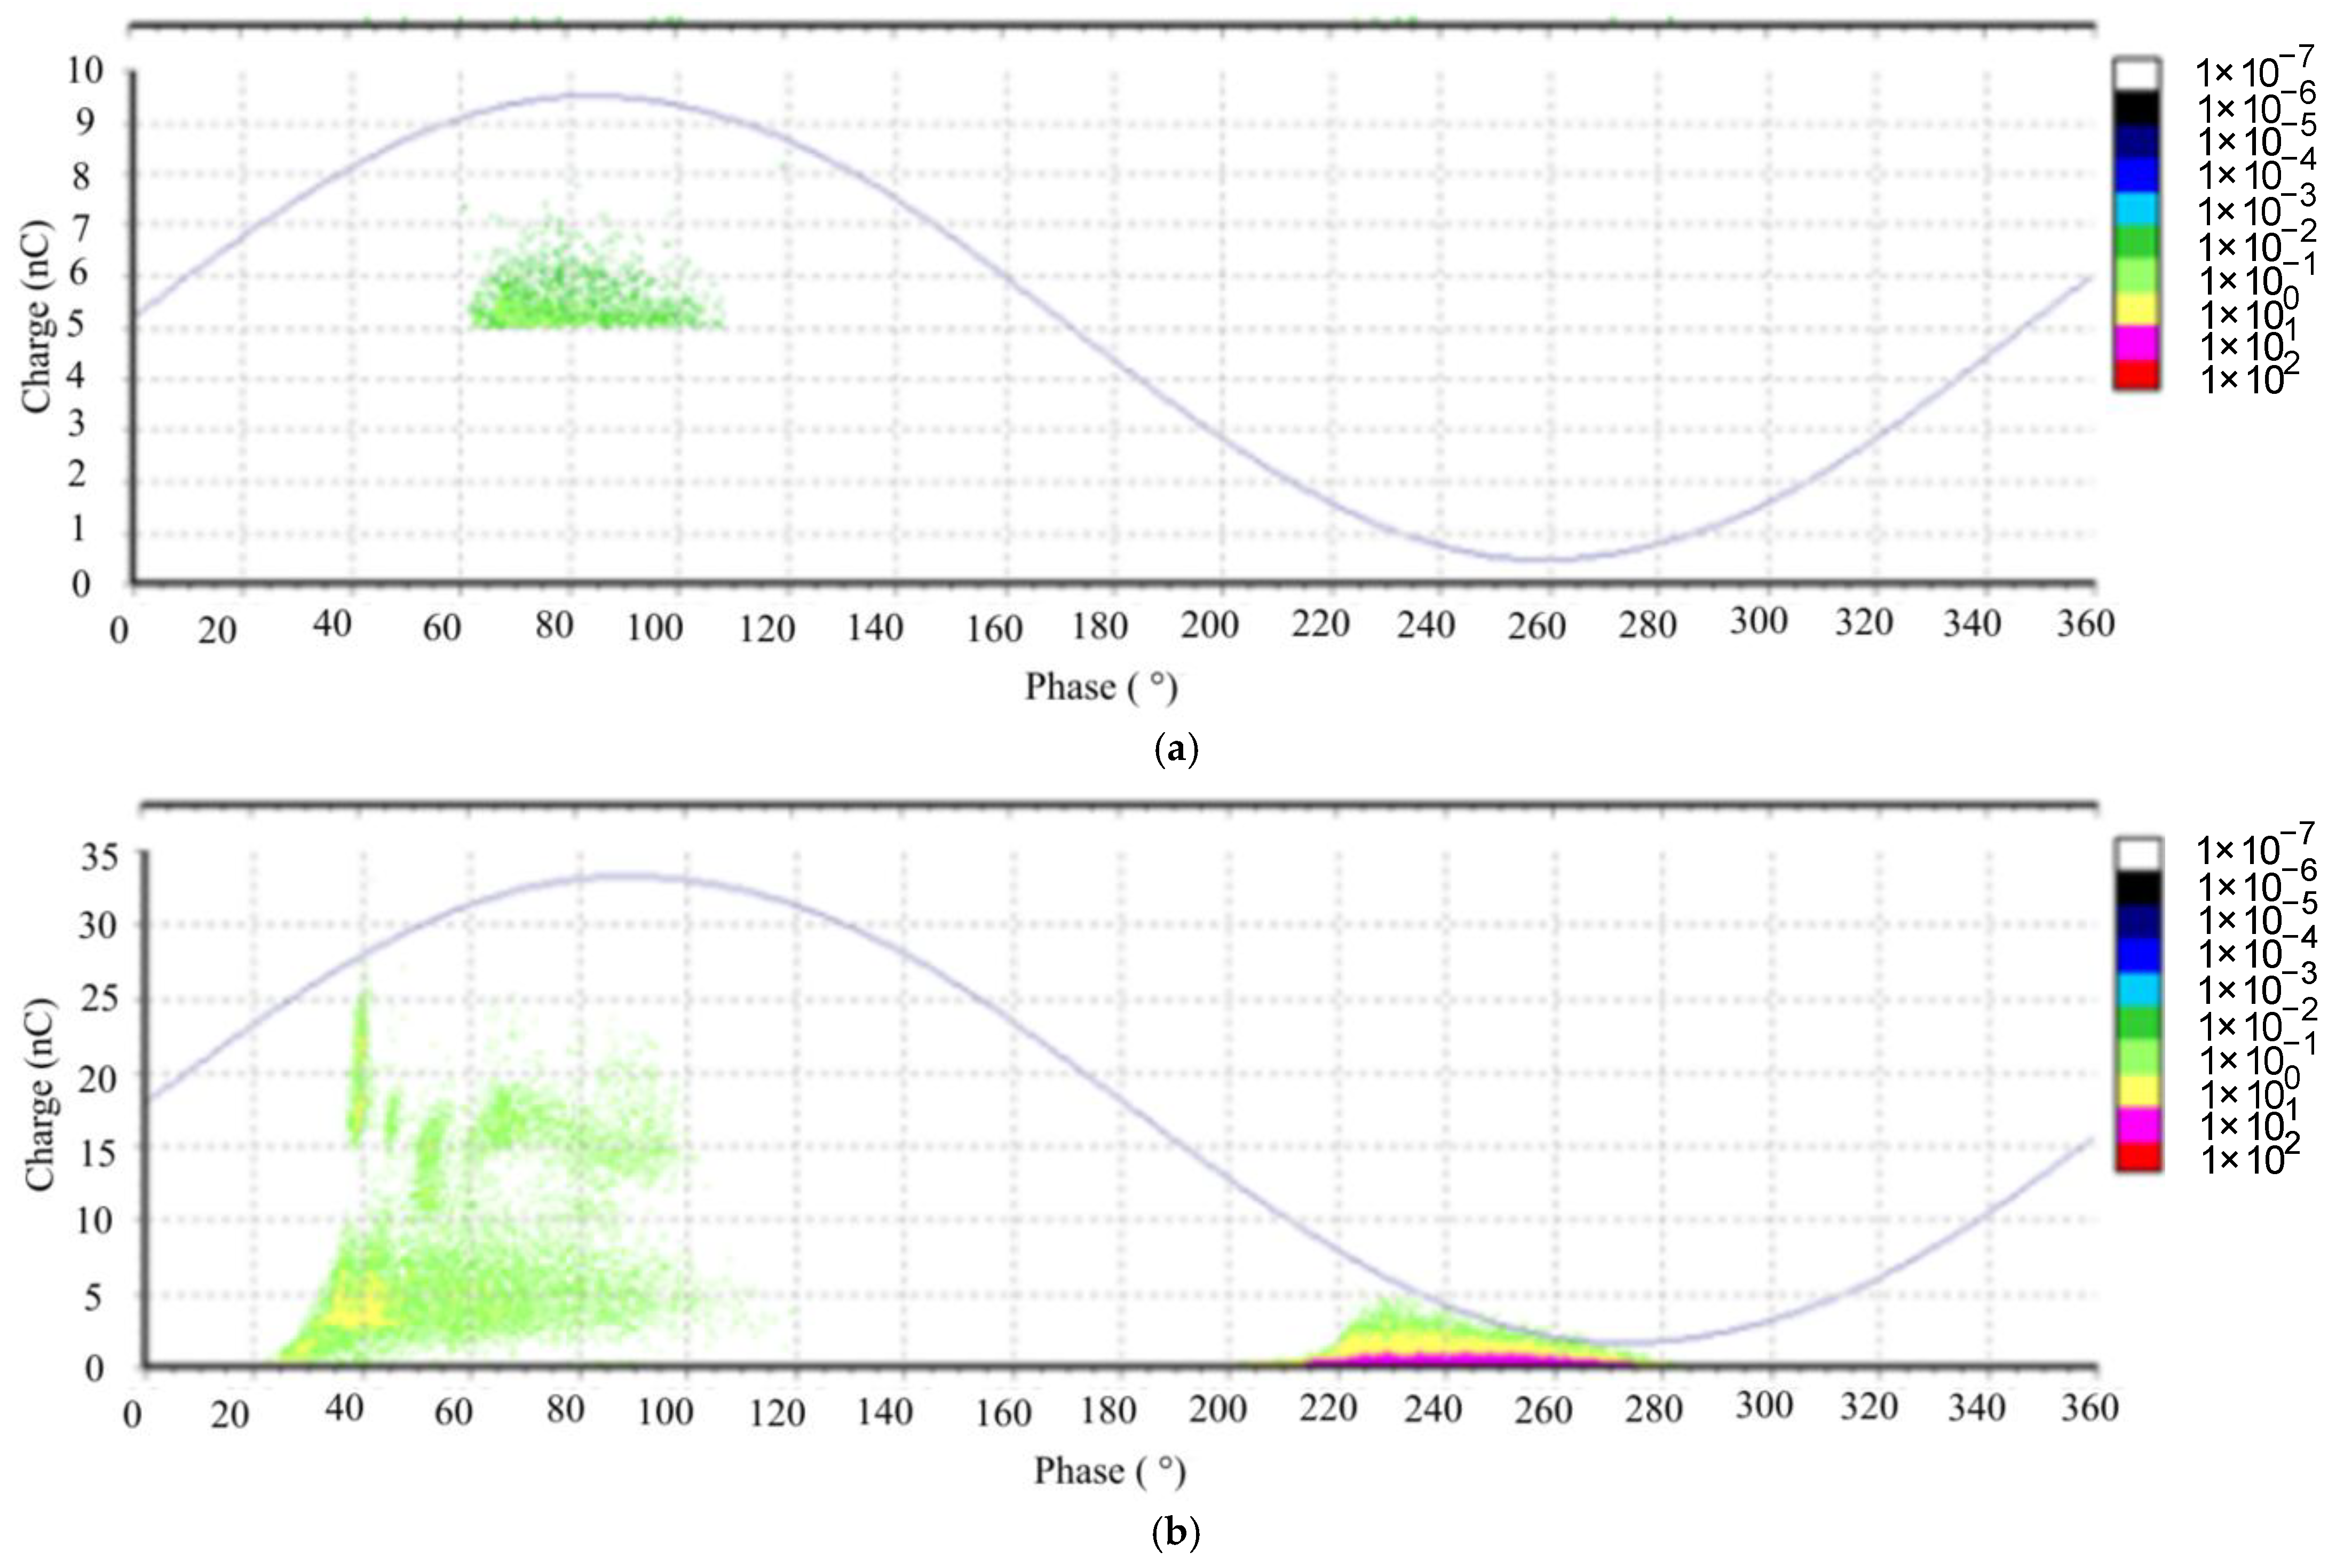
From the measurement results of the PD activity, it is evident that the breakdown is likely caused by charges located in the positive polarity. An intriguing observation arises from the situation at the PDIV (partial discharge inception voltage) level. Notably, PDs initiate in different polarities for Midel 7131 and Nynas when compared to natural ester (organic-based ester). This discrepancy could potentially be attributed to variations in the internal structure of the investigated oils [
9].
The PD analysis reveals intriguing findings. When examining the natural ester fluid, we observe that there are only a few voltage steps leading to the BDV (breakdown voltage), as depicted in
Figure 19. In contrast, for the other two fluids, the PD charge increment is gradual as the voltage approaches the BDV. The breakdown mechanism in the case of FR3, an ester fluid, is attributed to the injection of electrical charge carriers. However, for Nynas Taurus (a mineral oil) and Midel 7131 (synthetic ester fluid), the breakdown results from the generation of air bubbles, as indicated by the phase-resolved PD patterns (PRPD) in
Figure 20 and
Figure 21 [
11,
12].
4. Discussion
Analyzing the dielectric properties, we observe that thermal stress leads to the formation of ionic impurities, which adversely impact the oil’s dissipation factor. As anticipated, mineral oil consistently exhibits a lower dissipation factor compared to natural oils due to its polar nature. Throughout testing and aging, this difference remains consistent. Notably, the gaskets’ effect on mineral oil versus natural-origin oils is indistinguishable.
The tensile strength measurement of PA cable ties reveals that, while tensile strength increases in natural ester during aging, it decreases fourfold in mineral oil during the same aging process.
As seen from the test results of the mechanical properties of the tested gasket, and contrary to expectations, the harsh effect on the aging of the transformer seal has thermal aging (120 °C) itself (Shore 44 after test vs. 20.5 new) and aging in mineral oil (Shore 35.25 after test). When submerged in rapeseed oil or Envitrafol, the change in hardness for the same condition is lower (Shore 21 and 22.5 vs. 20.5 new). Similar results are seen for 140 °C aging. The results shown in
Figure 7 indicate that natural esters (contrary to expectations) cause less hardening than mineral oil in both cases of thermal aging. Also, expected softening did not occur.
The behavior of natural ester and mineral oil differs significantly from the perspective of water content observations. While natural ester undergoes both hydrolysis and hydrogenation, mineral oil experiences drying due to temperature. This effect was also noted in [
13] and requires further investigation.
Weight measurement of the gasket samples shows no significant changes when comparing the weight before and after aging in oils. The same results were obtained when measuring the viscosity of oils. This corresponds with dissipation and resistivity measurements.
From the FT-IR measurement, it is evident that the oil samples have been significantly aged by temperature. The oxidation processes and products of thermal aging are clearly discernible from the results. In particular,
Figure 16 illustrates the observable impact of the tested material on the thermal aging of the entire oil system, including the material under test. By closely examining the vibration of antioxidants, we can appreciate the precision of the FT-IR analyses, with no expected changes in this peak.
From the PD measurement, it is evident that different chemical constitutions of the oils lead to different mechanisms of oil conductivity in the inhomogeneous electric field, and thus to the different PD activity inceptions and different voltage dependances until electric breakdown. Different conductivity phenomena, different viscosities, and a higher dielectric constant of esters lead to completely different mechanisms of the first streamer in different fluids. This difference is increased with the voltage, as can be seen when comparing [
29,
35]. Regarding the low voltages, the viscosity probably plays a significant role.
The overall conclusion is that auxiliary materials react with the insulating fluid and that this interaction is detectable. As anticipated, due to the distinct chemical composition of mineral and ester fluids, degradation processes behave differently. Further focus is needed in this area for future research. Lastly, some of the expected adverse processes in natural esters occur at a slower rate than anticipated. More diagnostic data from real operations need to be gathered to predict technical life correctly, e.g., [
4,
12].


 ,
, 


