Article

A Numerical Analysis of Flow Dynamics Improvement in a Blower via Simple Integration of Bell Mouth and Nose Cone Structures

1
Department of Mechanical Engineering, Graduate School, Chung-Ang University, Seoul 06974, Republic of Korea
2
Department of Intelligent Energy and Industry, Graduate School, Chung-Ang University, Seoul 06974, Republic of Korea
*
Author to whom correspondence should be addressed.
These authors contributed equally to this work.
Energies 2025, 18(7), 1830; https://doi.org/10.3390/en18071830
Submission received: 7 March 2025 / Revised: 28 March 2025 / Accepted: 31 March 2025 / Published: 4 April 2025
(This article belongs to the Section B: Energy and Environment)

Abstract

:
Blowers, essential for aerator operation, are pivotal mechanical devices that induce airflow through an impeller. Extensive research has explored impeller geometrical parameters, such as size, angle, and blade count. However, limited attention has been paid to the synergic effect of optimizing the bell mouth of the blower inlet and the nose cone of the impeller eye. This study utilized computational fluid dynamics (CFDs) to analyze the impact of the bell mouth and nose cone on the blower through a geometric case study and evaluate the synergy between these components. A bell mouth decreases the wake by 91.76%, and a nose cone decreases the stagnation at the impeller eye and expands the effective impeller area by 76.29%. Moreover, this study demonstrated a significant synergistic effect between the bell mouth and nose cone, which reduced the head loss by 81.4% compared with the base model. This study presents a simple and effective method to improve blower efficiency and reduce power consumption by applying aerodynamically designed bell mouths and nose cones to blowers.

1. Introduction

Increasing the oxygen concentration to promote microorganism activity and remove organic matter is necessary during wastewater treatment [1]. A high-capacity blower is employed to pull in air and elevate the oxygen levels in wastewater, which consumes substantial energy [2,3]. Therefore, the effectiveness of wastewater treatment is directly correlated with the performance of the blower. The shape of the blower directly affects the blower’s efficiency. Recent research has focused on improving blower efficiency by optimizing the shape of blowers. From this perspective, numerous studies have been conducted to confirm the flow characteristics and enhance the performance using geometric parameters, such as size [4], angle [5], shape [6], and number of impeller blades [7,8]. However, few studies have been conducted on the nose cone of the impeller eye [9]. The function of the nose cone is to reduce drag as it enters the impeller blade, thereby enhancing the inflow rate [10]. Nose cones are used in various fields, including blowers, hypersonic missiles, and racing cars [11,12,13]. Recently, various studies have been conducted involving nose cones, one of which provides an innovative morphing nose cone for underwater use [14]. The bell mouth is a fluid guidance system with a bell-shaped structure at the blower inlet, which is widely used in air intake systems to facilitate smooth airflow; various studies have been conducted to enhance blower performance. For instance, in axial flow compressors and gas turbines, improvement has been achieved in flow uniformity and reduced pressure loss [15,16]. In jet engine ground testing, a bell mouth has been applied to facilitate stable airflow and accurate mass flow rate measurements [17]. In pump sumps, applying a bell mouth significantly enhanced flow uniformity [18]. In centrifugal blowers and fans, even minor modifications improved performance, demonstrating measurable effects on airflow [19,20]. The use of the bell mouth in renewable energy systems, such as solar chimney power plants and natural convection solar air heaters, has produced significant airflow increases [21,22]. Because the diameter of the bell mouth significantly influences the flow rate of the blower [19], many industrial fields are applying large-diameter bell mouths. However, applying a large bell mouth to a blower is difficult in wastewater treatment facilities because the air intake system is typically closed and has a constrained internal space. Moreover, synergistic effects have rarely been verified by applying more than two geometric parameters. Increasing the efficiency of blowers is an important environmental and economic issue for sustainable environmental infrastructure.
In this study, computational flow dynamics (CFDs) were used to analyze the shape parameters of the blower inlet (bell mouth) and impeller eye (nose cone) to improve diffuser efficiency. The shape of the blower is shown in Figure 1a. Air enters through the blower inlet, passes through the impeller, and consequently increases the pressure. The compressed air flows out through the volute (Figure 1b(i)). As the air passes through the blower, two major wakes are formed. One wake is the separation flow on the wall of the blower inlet (Figure 1b(ii)), and the other is the stagnation flow that occurs when the impeller eye meets the intake air (Figure 1b(iii)). Bell mouth and nose cone structures were added to the inlet of the blower and the impeller eye, respectively, to reduce the loss due to the wake inside the blower (Figure 1b(v)). This method allows for simultaneous cost reduction and increased blower efficiency by adding a structure that does not require the replacement of the blower in a closed intake system with limited internal space. Moreover, the simultaneous application of the bell mouth and nose cone to the blower enabled analysis of the synergistic effect. This study highlights the need for further research to investigate the synergistic effects of multiple variables in addition to these two. Additionally, this research is expected to facilitate the efficient and economical operation of wastewater treatment facilities and contribute to environmental protection.

2. Materials and Methods

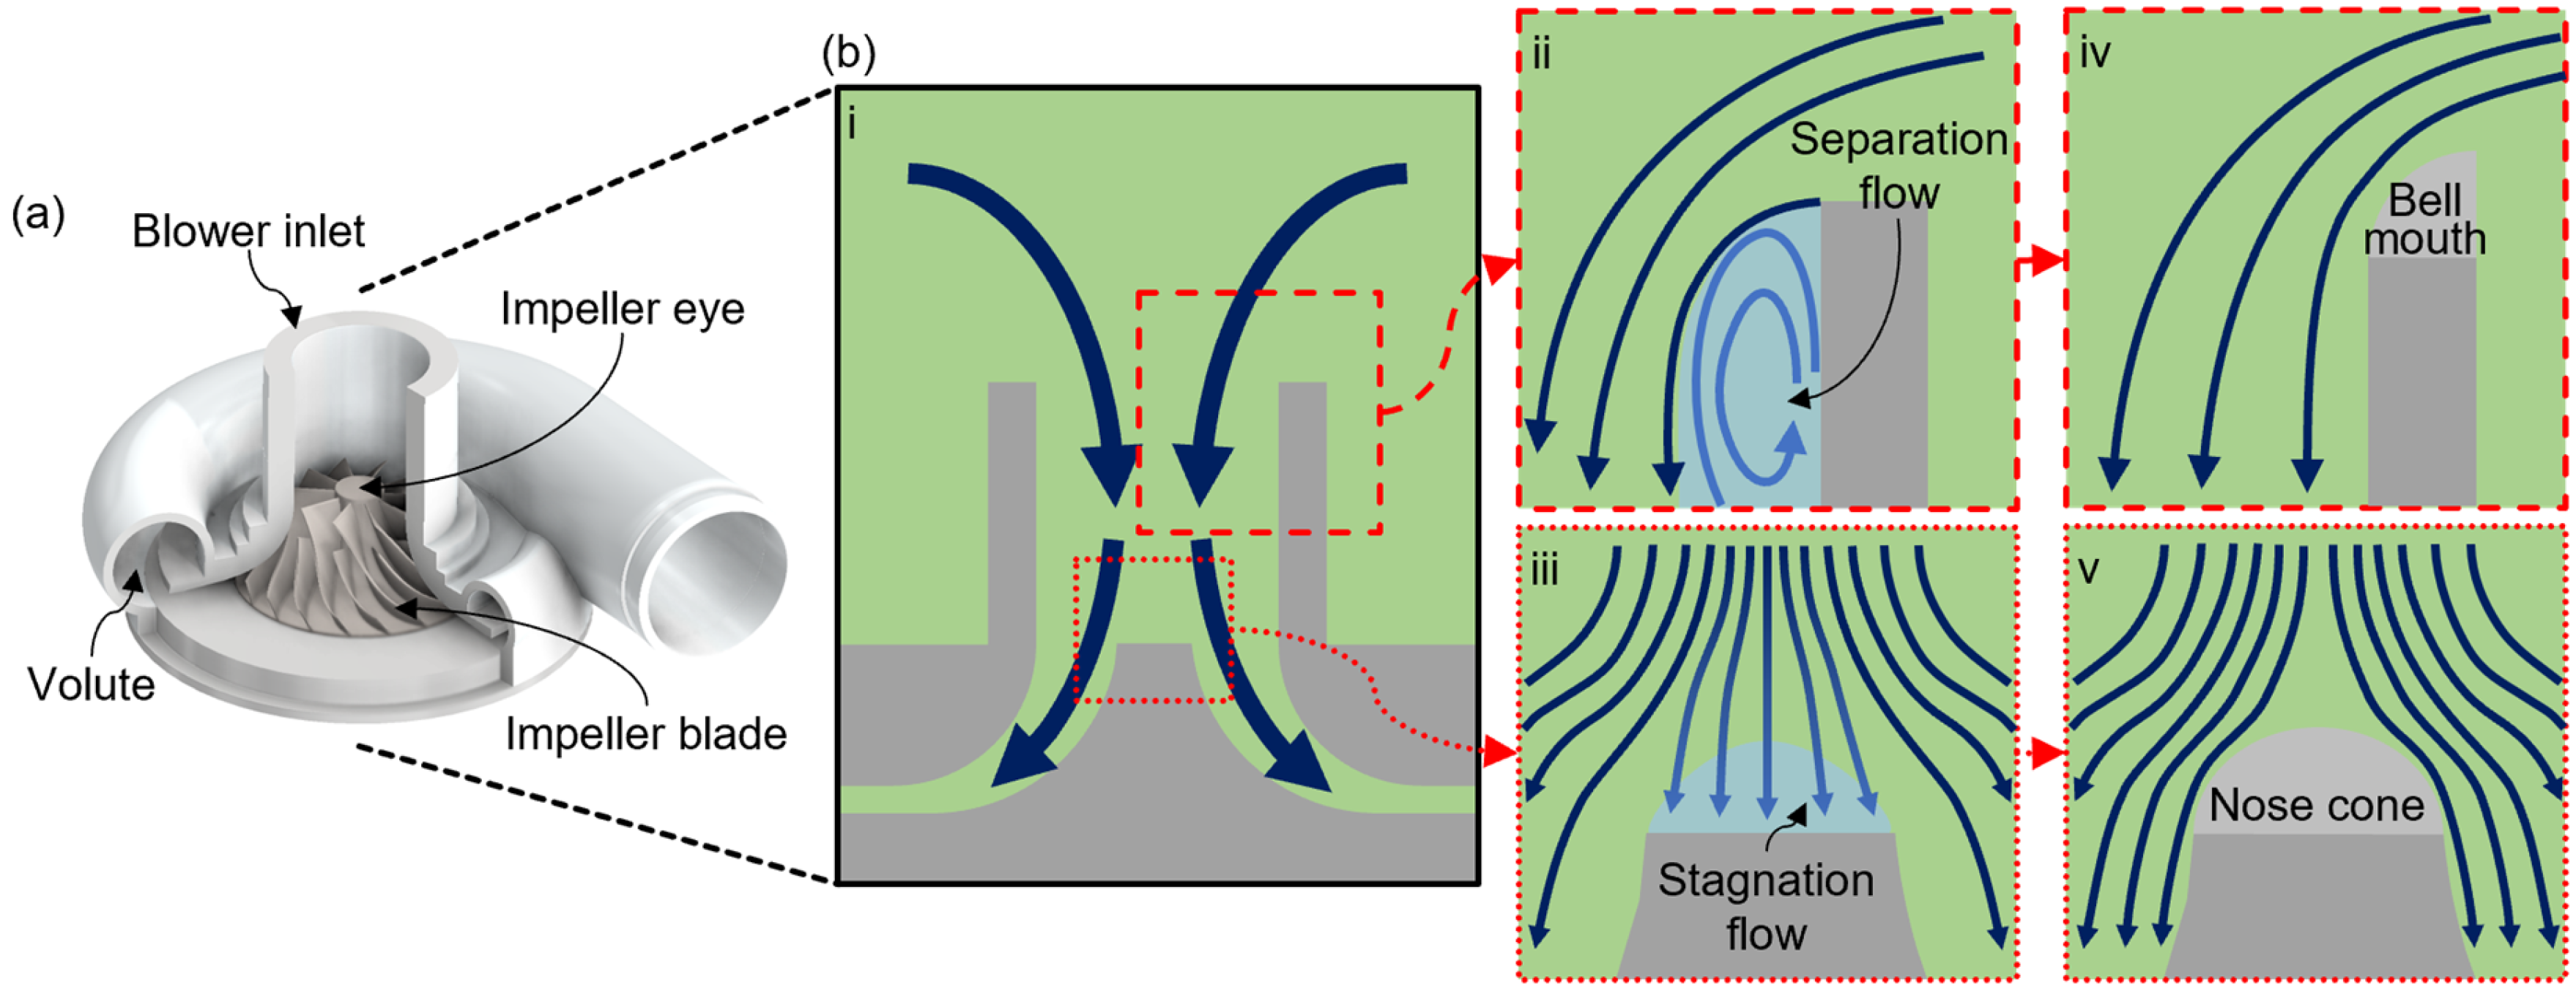
2.1. Geometries of Analysis Models

The blower dimensions used in this study were based on those of a high-pressure turbo blower (TB 100-0.8, Aerzener Maschinenfabrik GmbH, Aerzen, Germany). The bell mouth and nose cone are positioned above the impeller blades and volutes. Because of the one-way characteristic of the fluid, the trend observed in this study for the bell mouth and nose cone was expected to remain consistent even if the impeller blades and volutes were omitted. Therefore, the impeller blades and volute, which are less pertinent to the analysis, were simplified (Figure 2a). An axisymmetric geometry, including the outer region, was designed to allow efficient numerical analysis (Figure 2b). The outside area (blue line) has a height of 500 mm and a radius of 450 mm. The blower has a height of 189 mm. The radius and wall thickness (t) of the blower inlet are 53.4 and 21.61 mm, respectively. The impeller height and radius are 75 and 154.5 mm, respectively, and the radius of the outlet (green line) is 10 mm. In this study, two types of bell mouths were investigated for the blower inlet, and a nose cone was applied to the impeller eye (Figure 2c,d). Because the internal space of the blower is limited, the size of the bell mouth is also constrained. Therefore, two types of compact bell mouths were designed. Type 1 is designed so that the thickness of the bell mouth is equal to the thickness of the blower wall (Figure 2c(i)). In Type 2, the bell mouth was designed by extending the radius by the wall thickness (t) (Figure 2c(ii)). For Types 1 and 2, the height of the bell mouth was designed to be increased by 0.5, 1.0, and 1.5 times the wall thickness (t, 21.61 mm). Moreover, the height of the nose cone was designed to be increased by 0.5, 1.0, and 1.5 times the impeller eye radius (r, 19 mm) (Figure 2d). The model names reflect the prefix “B” (for bell mouth) and “N” (for nose cone) with the corresponding numerical values (Table 1).

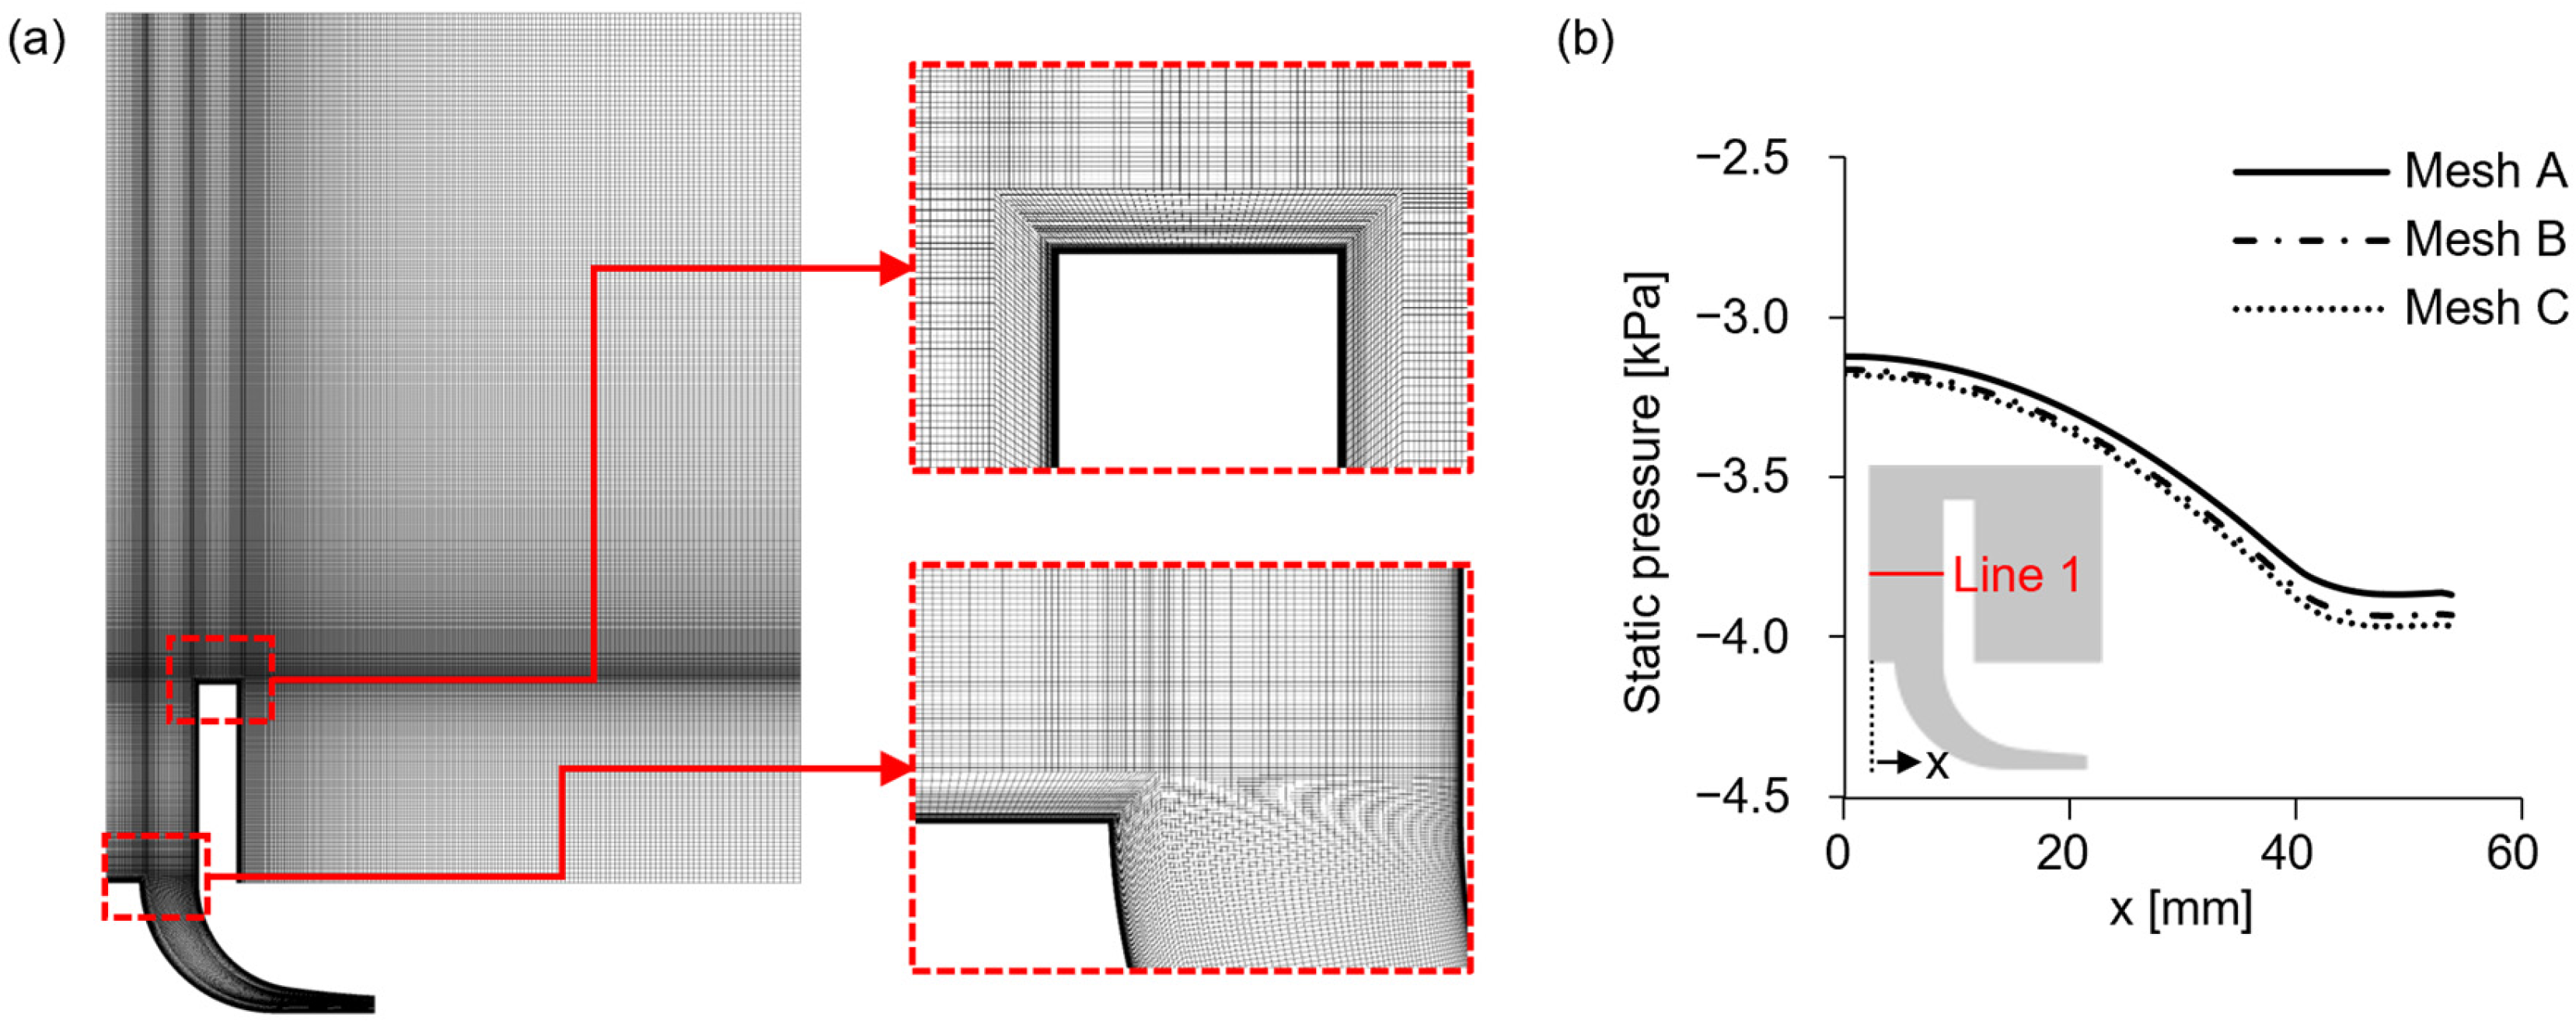
2.2. Numerical Model and Boundary Conditions

Numerical analyses were performed using ANSYS 19.2 Fluent software (Ansys, Inc., Canonsburg, PA, USA). The turbulent flow in the blower was predicted using the shear stress transport (SST) k-ω model. Compared with the k-ε model, the SST k-ω model provides improved accuracy in capturing boundary layer effects, which is crucial for analyzing flow characteristics around the bell mouth and nose cone. Additionally, although large eddy simulation (LES) provides higher accuracy in resolving turbulence structures, its computational cost is significantly higher, which makes it impractical for this study. Reynolds-averaged Navier–Stokes (RANS) models, including k-ε, are computationally efficient but may lack precision in near-wall regions. Therefore, the SST k-ω model was chosen to balance computational efficiency and accuracy, ensuring reliable results for the bell mouth and nose cone flow analysis.
The turbulent kinetic energy k (Equation (1)) and the specific rate of dissipation ω (Equation (2)) were calculated using the following transport equations [23]:
t ρ k + x i ρ k u i = x j Γ k k x j + G k Y k + S k
t ρ ω + x j ρ k u j = x j Γ ω ω x j + G ω Y ω + D ω + S ω
where Gk is the production of turbulence kinetic energy, Gω is the generation of ω, and Гk and Гω are the effective diffusivities of k and ω, respectively. Yk and Yω are the dissipations of k and ω, respectively; Dω is the cross-diffusion term; and Sk and Sω are user-defined source terms. In this study, a steady state was adopted because the analysis did not involve moving parts, and the blower operated continuously, resulting in a constant flow field. The working fluid was air with a density of 1.225 kg/m3 and viscosity of 1.789 × 10⁻⁵ kg/m·s. The boundary condition for the outside area, the inlet (blue line), was atmospheric pressure. Based on the experimental data, the outlet (green line) was defined as a mass flow outlet with a flow rate of 0.531 kg/s. The non-slip condition was applied to the blower wall, including the impeller (orange line), considering the viscous effects on the wall surface (Figure 2b).
Quadrilateral grids were applied to all geometries (Figure 3a). To improve the accuracy of the analysis of the boundary layer near the wall, including the bell mouth and nose cone, y+ was set to less than 1. Mesh tests were conducted for 80,830 (Mesh A), 271,700 (Mesh B), and 541,008 (Mesh C) meshes according to the grid density of the boundary layer (Figure 3b). The mesh test was performed on Line 1, which had the maximum velocity and wake, located 143 mm from the bottom of the computational domain. Mesh A and Mesh B exhibited pressure differences of 1.75% and 0.56%, respectively, relative to Mesh C. Considering that the objective was to maintain a deviation of less than 1% for analysis efficiency, Mesh B was adopted. All computational models were meshed using the Mesh B density.

3. Results and Discussion

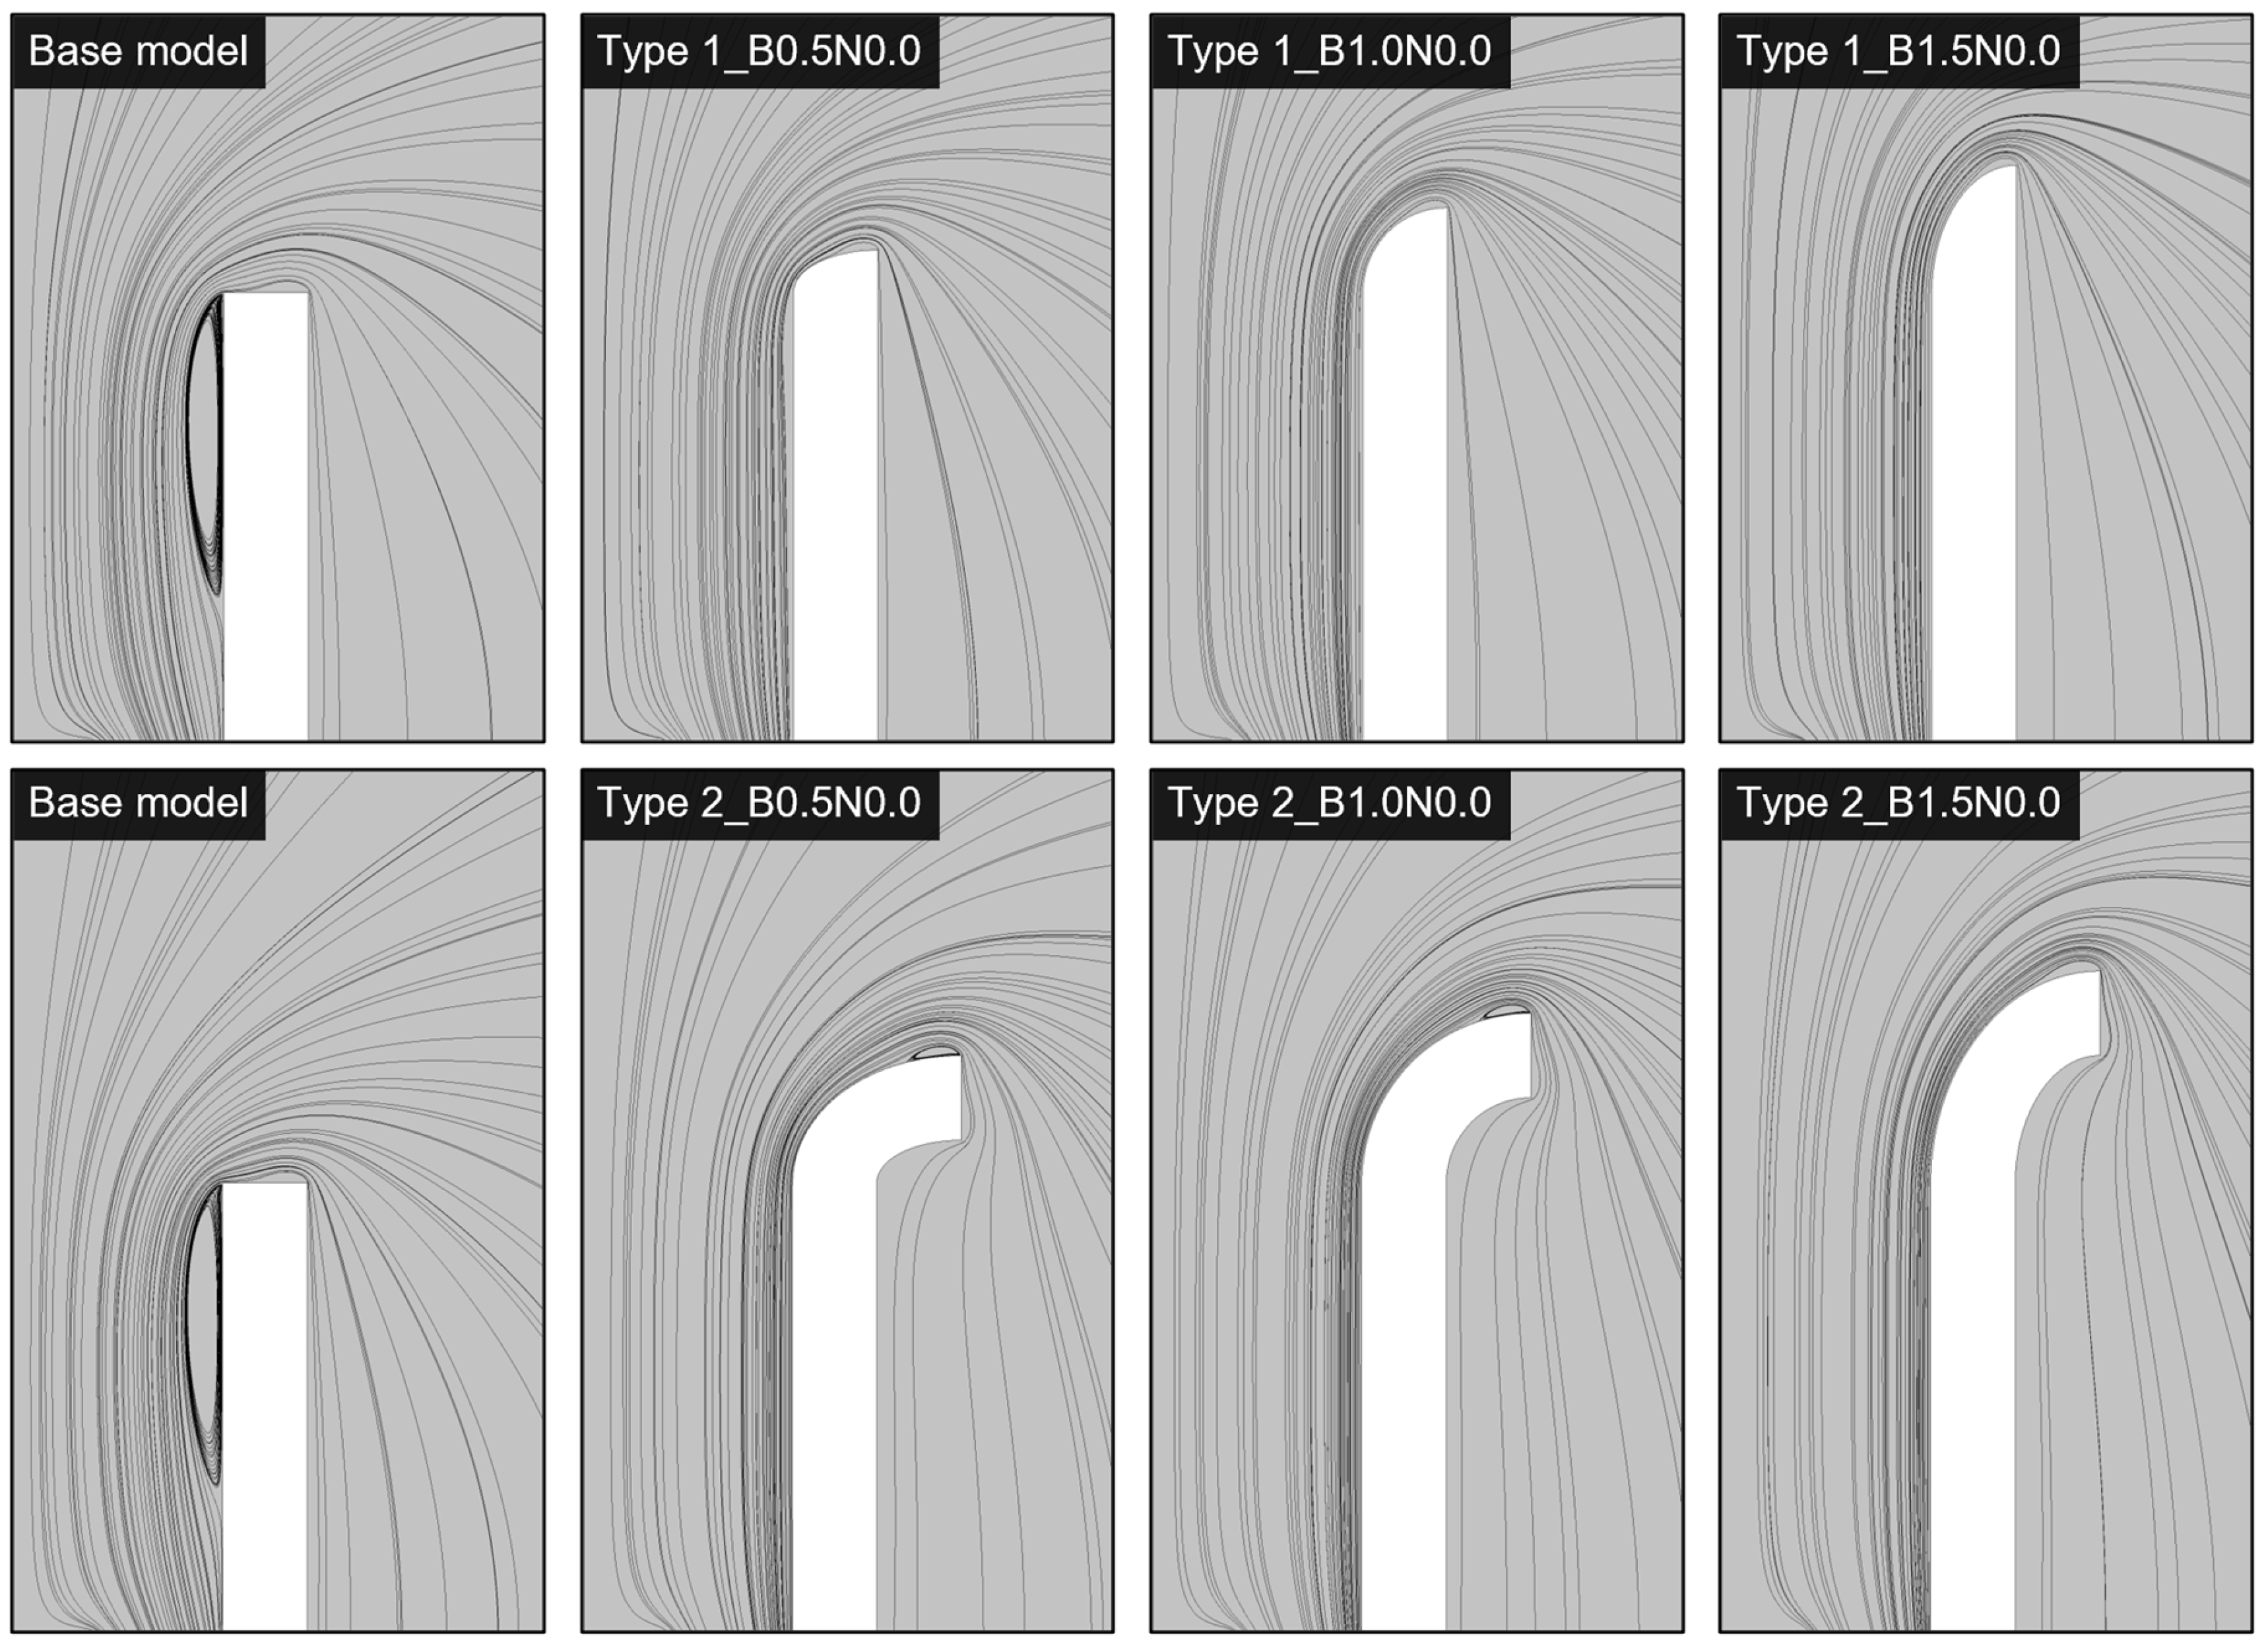
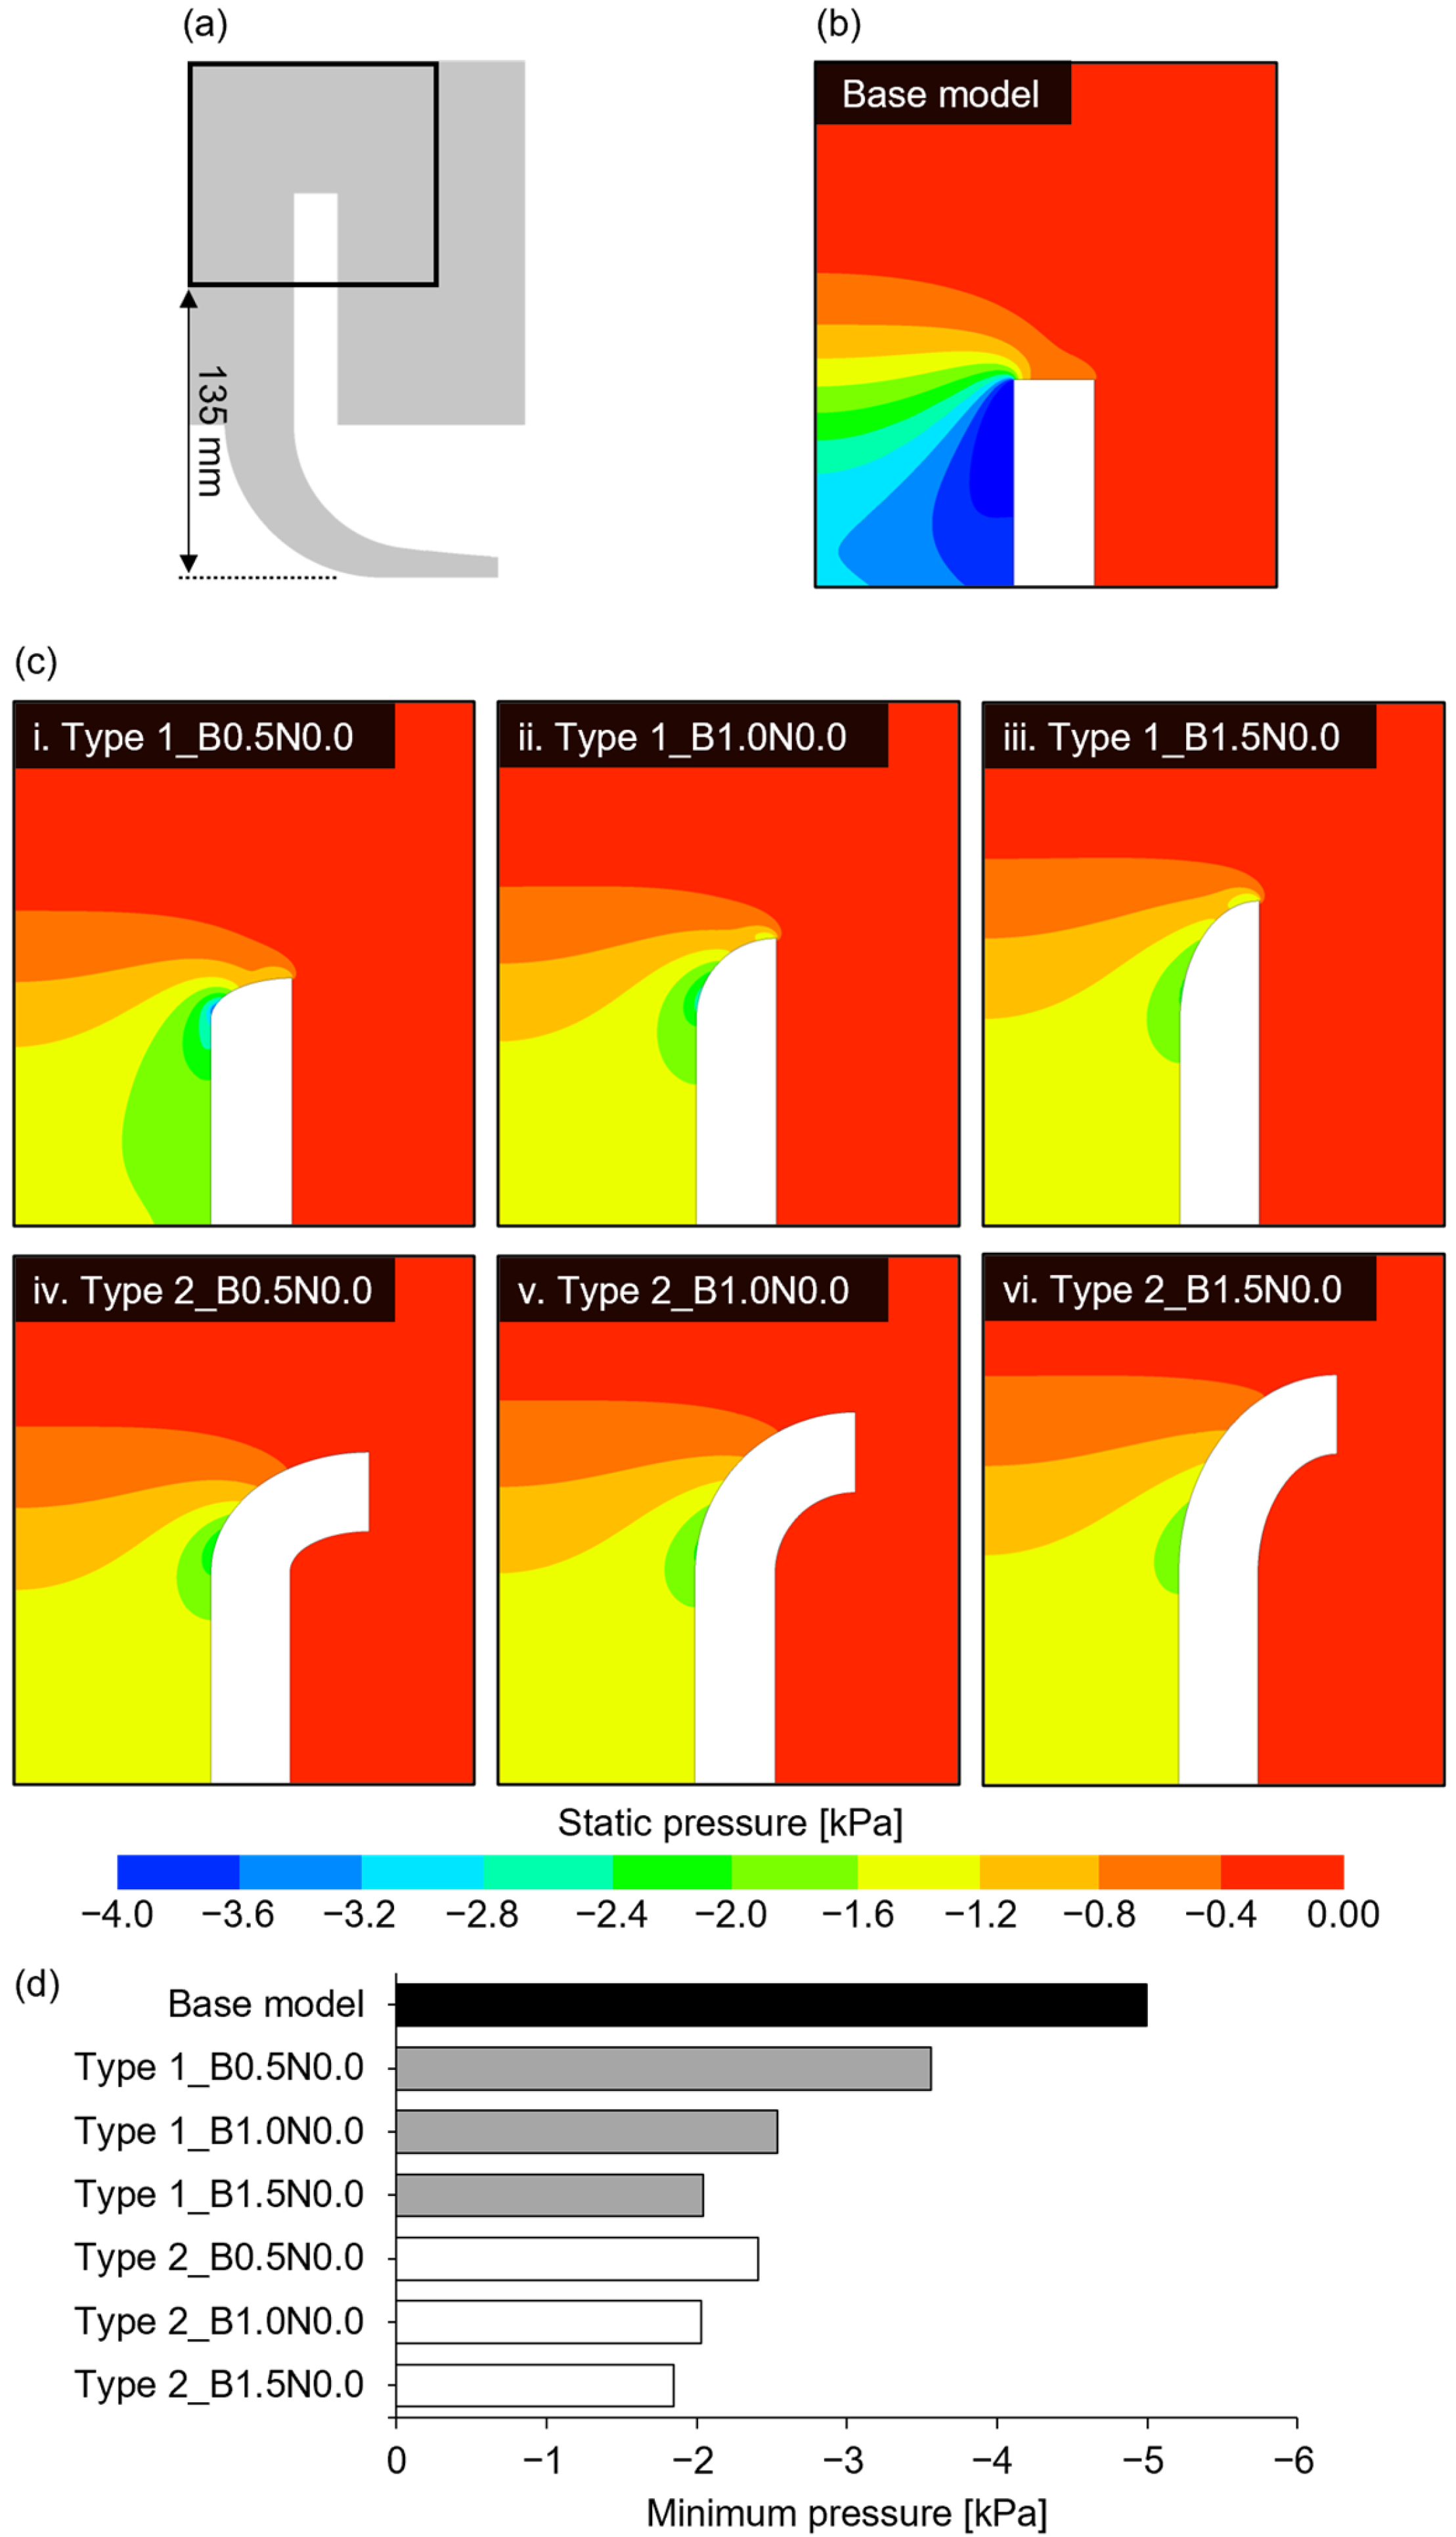
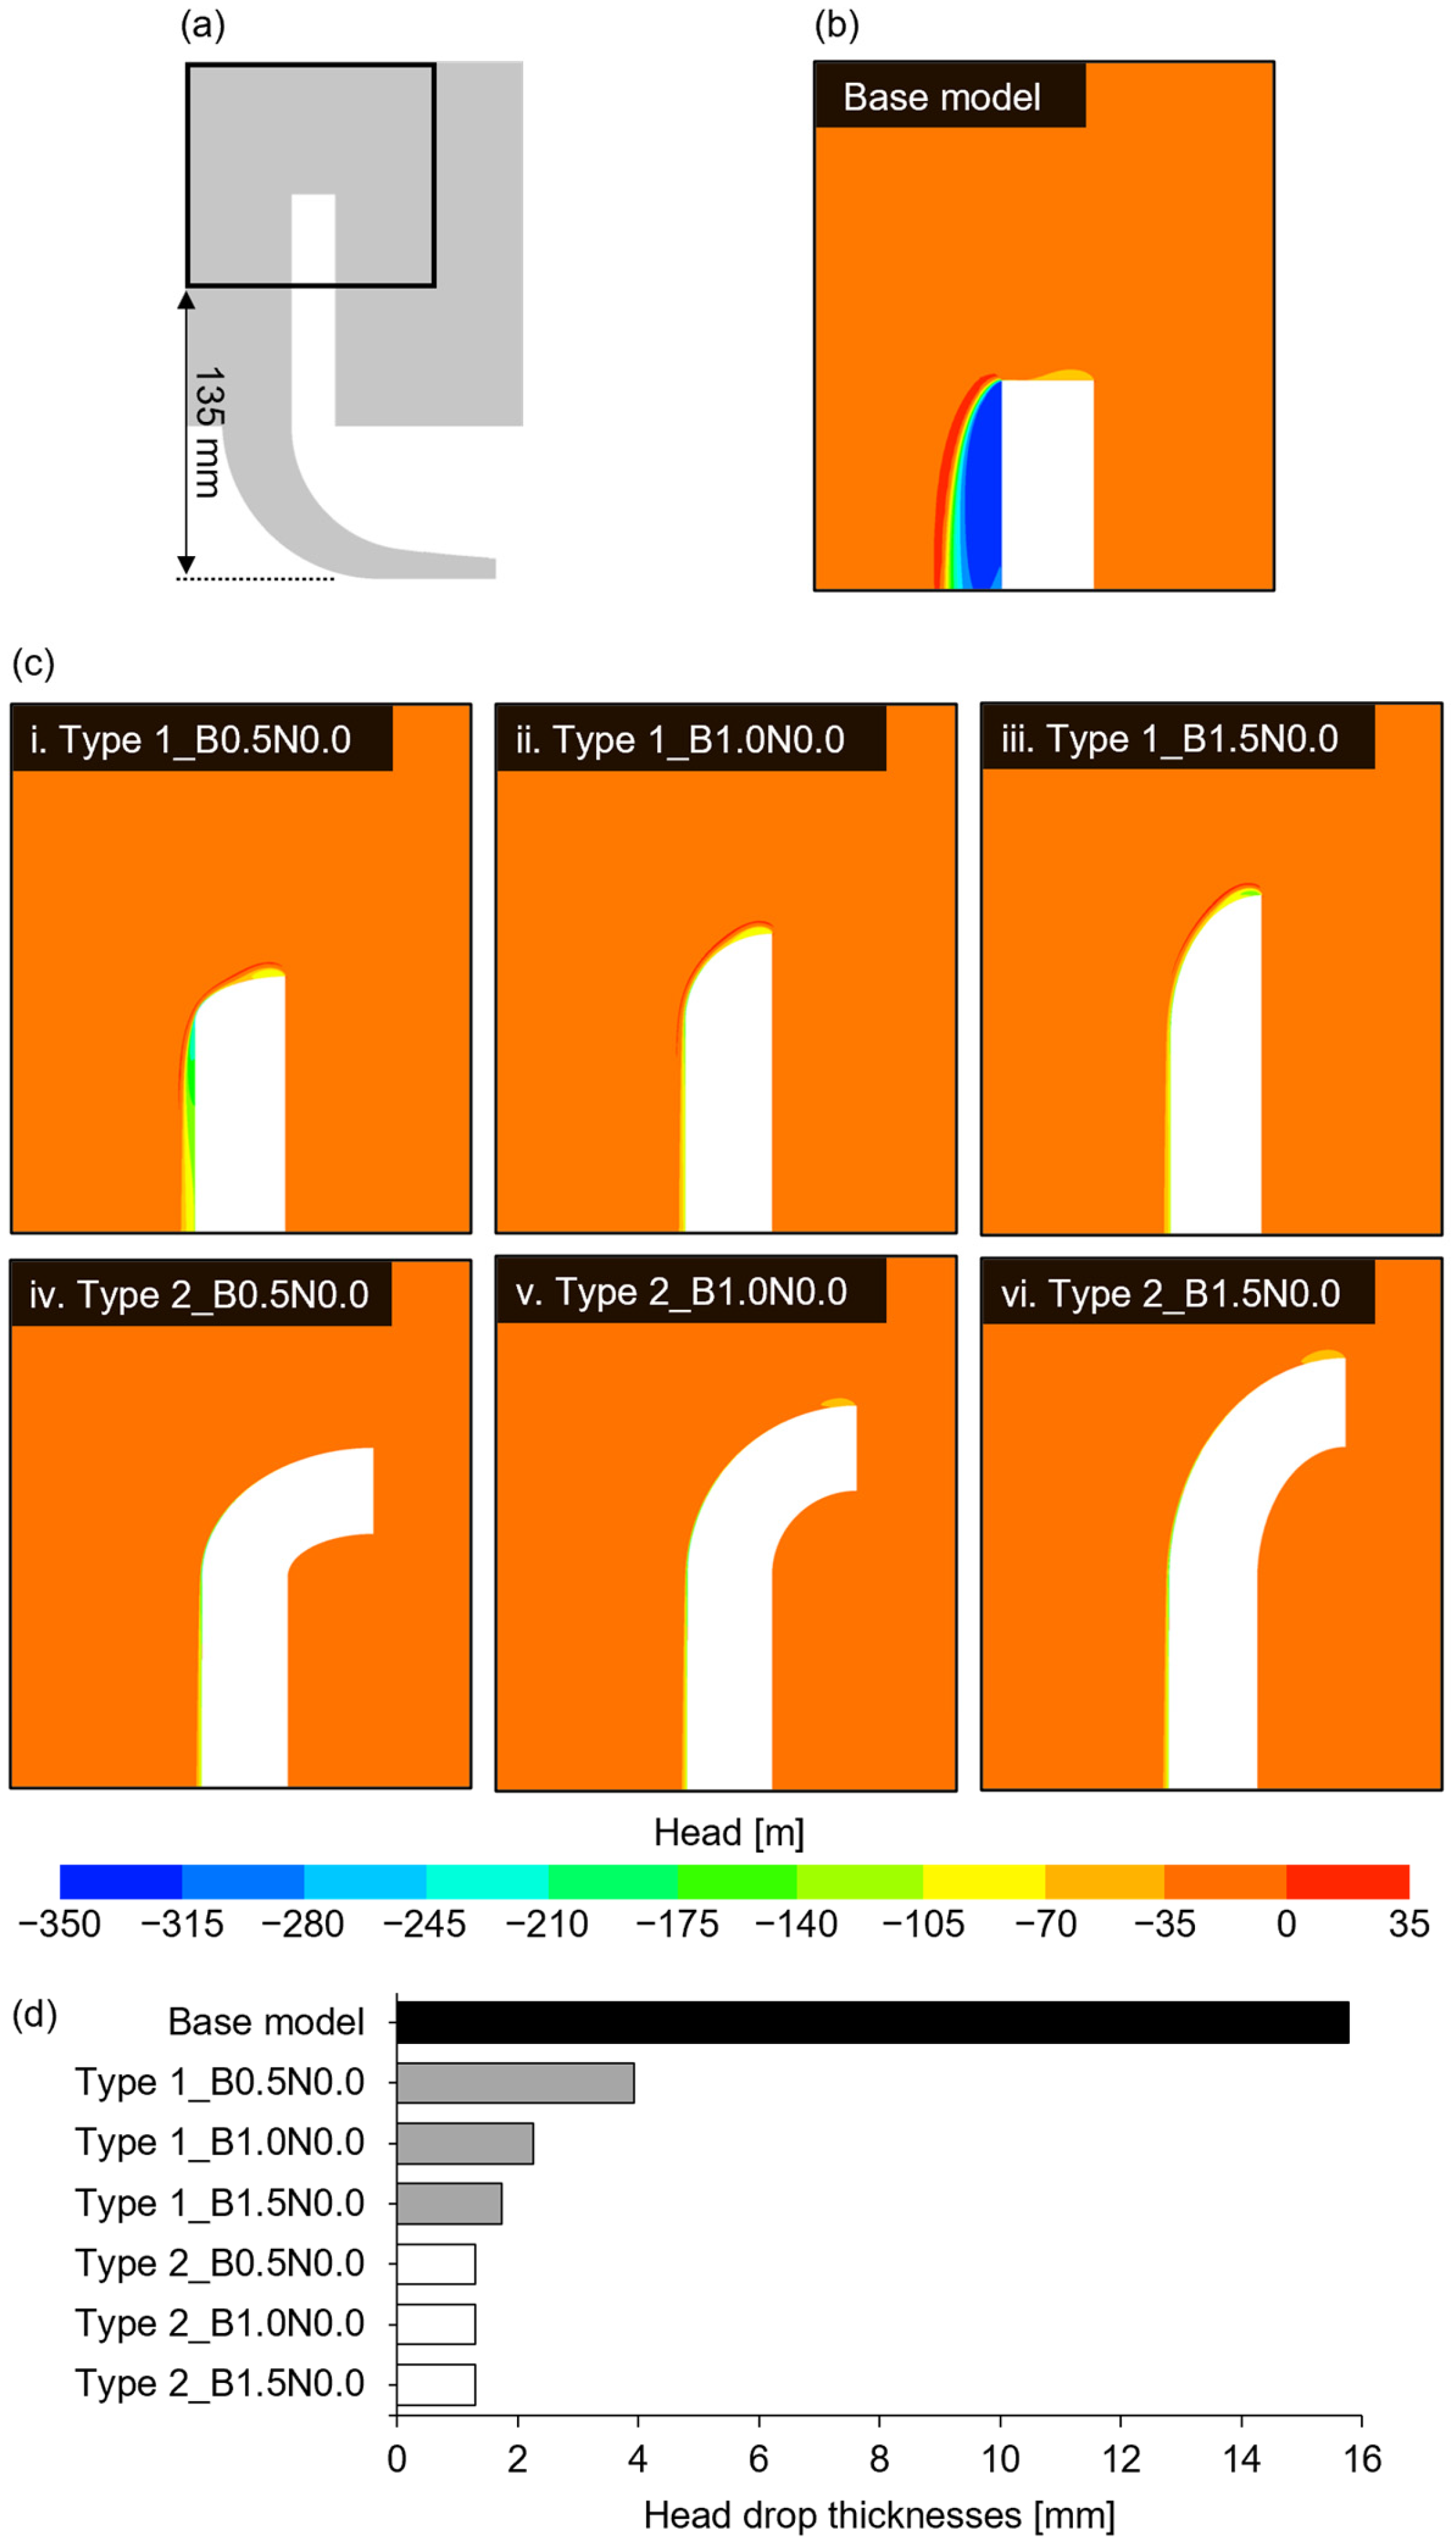
3.1. Bell Mouth Analysis

The bell mouth improves the blower efficiency by reducing the flow resistance and turbulence. One of the main reasons for the reduced flow resistance is the decrease in the vena contracta. Applying a bell mouth helps reduce the vena contracta by mitigating the pressure drop and vortex generation at the blower inlet, thereby decreasing the energy loss. In this study, the effects of the bell mouth were compared using pressure contours and streamlines (Figure 4 and Figure A1), which were confirmed near the blower inlet, as marked in Figure 4a, 135 mm from the bottom of the blower. In the base model, the blower wall impedes the flow, creating a vena contracta at the blower inlet (Figure 4b). Moreover, the minimum pressure in the base model is −4.996 kPa, which is the lowest value compared with the model with the bell mouth application. The vena contracta is known to reduce the effective flow passage, which results in increased flow resistance. Regardless of the type and height of the bell mouth in this study, applying the bell mouth to the base model removed the wake near the blower wall and reduced resistance as air flowed into the blower (Figure 4c). As the height of the bell mouth increased, the low-pressure zone was decreased, and the overall pressure distribution tended to become uniform (Figure 4d). This means that the vena contracta effect on the blower wall decreased as the tangent between the blower and the bell mouth became gentler. The minimum pressures were 71.20%, 50.76%, and 40.91% for Type 1_B0.5N0.0, Type 1_B1.0N0.0, and Type 1_B1.5N0.0, respectively, compared with the base model, and 48.16%, 40.65%, and 36.91% for Type 2_B0.5N0.0, Type 2_B1.0N0.0, and Type 2_B1.5N0.0, compared with the base model. The effects of reducing the low-pressure zone and the minimum pressure were more pronounced in Type 2 (Figure 4c(iv–vi)) than in Type 1 (Figure 4c(i–iii)) because of its larger structure for fluid induction than in Type 1. This decrease in low pressure leads to an increase in effective flow passage, which reduces flow resistance and facilitates flow. However, in devices with space constraints, the application of a Type 1 bell mouth can be considered.
The head was also examined to analyze the bell mouth performance. The head is the energy of the fluid expressed in units of length; a larger head has more potential energy, and E = mgH. The head (H) is defined as Equation (3) [10]:
H = P ρ g + v 2 2 g
where P, ρ, g, and v denote the pressure, air density, gravitational acceleration, and flow velocity, respectively. The potential head was ignored because the working fluid was gas and had low density.
Through the head contour, the head was confirmed based on the type and size of the bell mouth near the blower inlet (Figure 5a). For the base model, on the wall of the blower, an area with an extremely low head of −345.3 m (blue area) was confirmed, and the head increased to 16 m (red area) at the outer boundary of this area (Figure 5b). The thickness of this region was 15.78 mm. However, when a Type 1 bell mouth was applied, the head drop value and the thickness around the wall decreased. As the size of the bell mouth increased, the area where the head drop occurred tended to decrease (Figure 5c). The thicknesses of the head drops were 24.90%, 14.32%, and 10.96% for Type 1_B0.5N0.0, Type 1_B1.0N0.0, and Type 1_B1.5N0.0, respectively, compared with the base model. For the Type 2 bell mouth, the head drop on the wall decreased as in Type 1, and the size and width of the head drop in Type 2 also tended to decrease as the size of the bell mouth increased. The thicknesses of the head drops were 8.24%, 8.17%, and 8.24% for Type 2_B0.5N0.0, Type 2_B1.0N0.0, and Type 2_B1.5N0.0, respectively (Figure 5d). Type 2, which had a wide inlet diameter, tended to have a smaller head drop than Type 1. The thickness of the head drop is closely related to the wake and effective passage diameter. Reducing the thickness of the head drop increases the effective flow diameter, thereby reducing the flow resistance. The head drop was quantitatively confirmed at Line 1, a line parallel to the x-axis, in which the flow velocity showed a maximum value and was significantly affected by the wake (Figure 6a). For the base model, the head drop occurs from approximately 40 mm and decreases up to −319.3 m. For Type 1, the head starts to decrease to approximately 48 mm in the 0.5 model and decreases to −113.8 m; in the 1.0 and 1.5 models, the head starts to decrease to approximately 50 mm and decreases to −90 and −92.2 m, respectively (Figure 6b). For Type 2, the head starts to decrease to approximately 51 mm for the 0.5, 1.0, and 1.5 models and decreases to −83.5, −82.9, and −82.6 m, respectively (Figure 6c). At the head near the wall, Type 1 has a greater effect on the head drop than Type 2, because the size of the structure is smaller. Additionally, the head drop decreases as the height of the bell mouth increases. However, for Type 2, the head drop near the wall shows no significant correlation with the structure size, which is because the Type 2 bell mouth is sufficiently round. The increase in the head drop (or vena contracta) due to the geometry of the structure can be attributed to the minor head loss. The head loss caused by the vena contracta effect due to the geometry is defined by Equations (4) and (5):
H L = K L v 2 2 g
K L = f r 2 R
where KL is the loss coefficient, r is the roundness of the bell mouth inlet, and R is the radius of the inlet (53.4 mm) [10]. KL is inversely related to r/2R, and a higher KL indicates a stronger vena contracta effect. Therefore, a model with greater roundness (Type 2 bell mouth) and higher height tends to have a smaller KL.

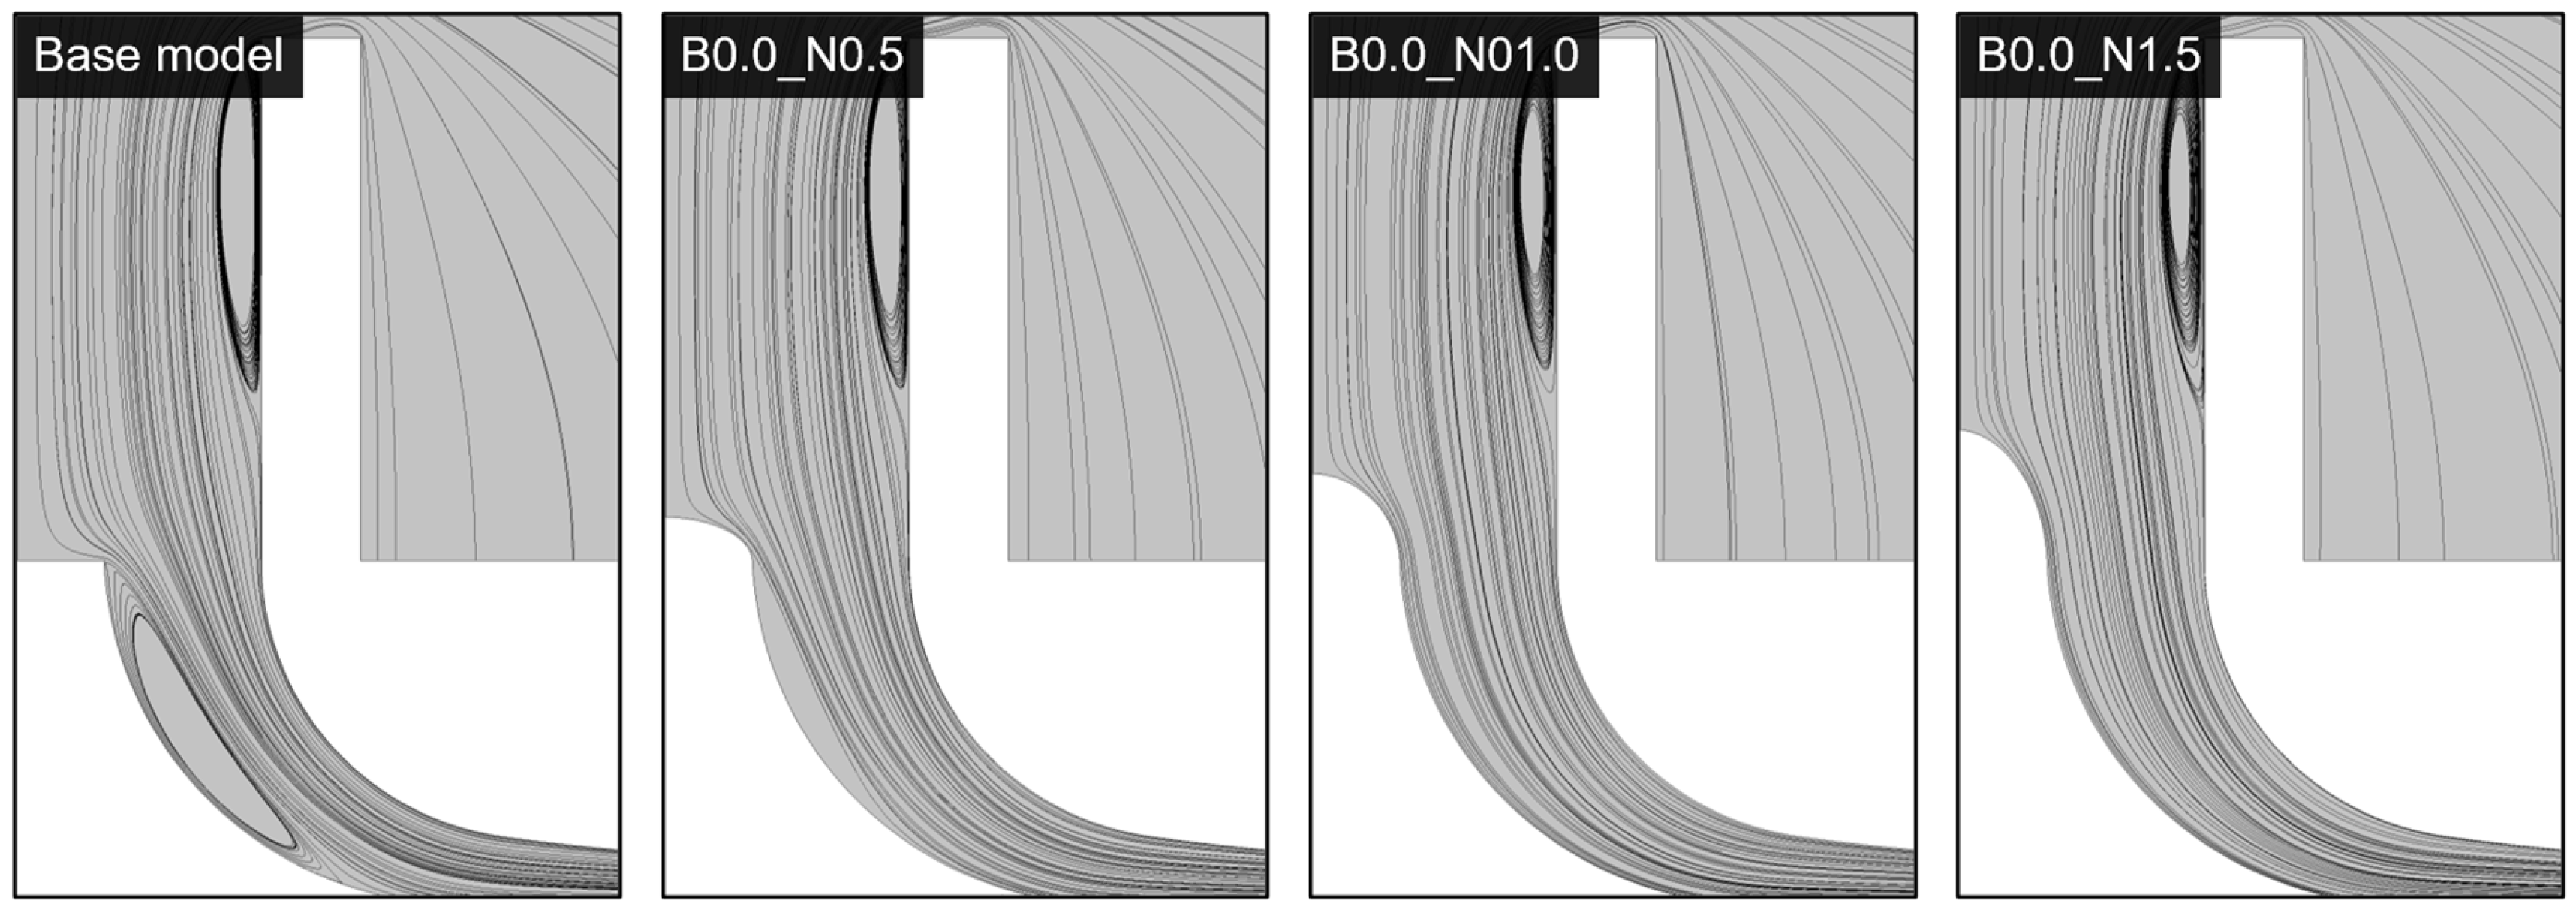
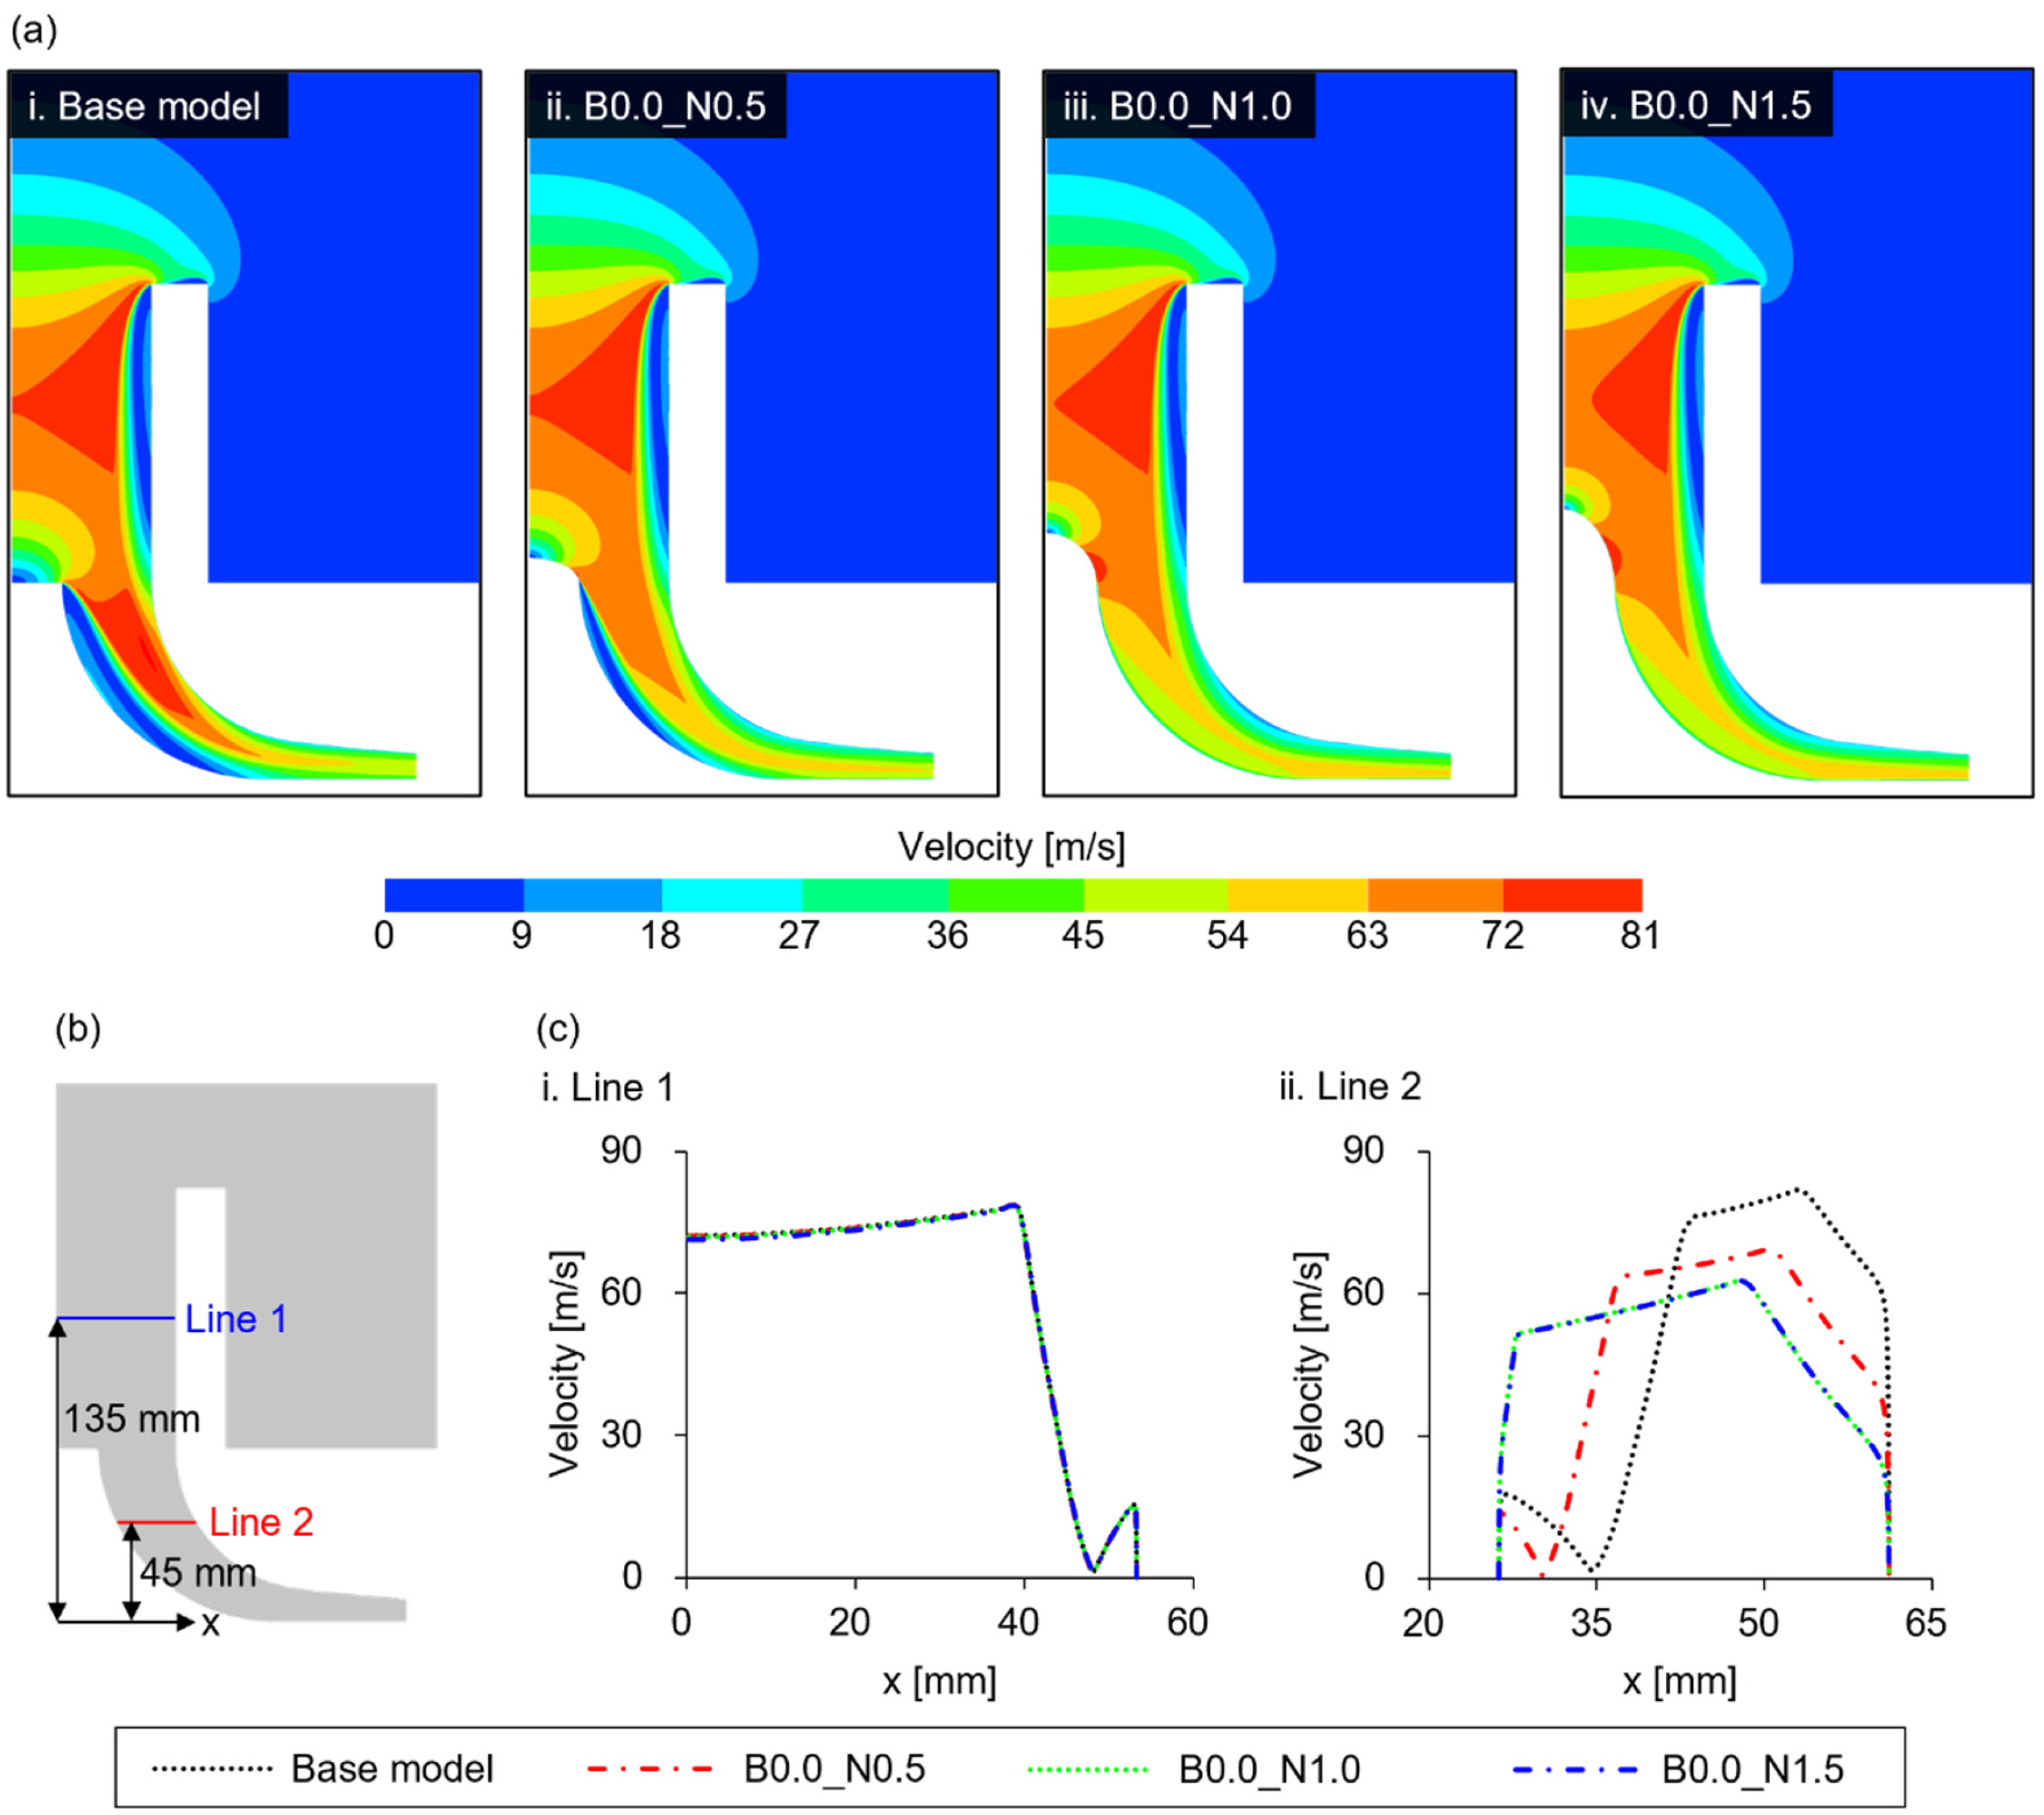
3.2. Nose Cone Analysis

The nose cone is designed to guide fluid flow more smoothly and is widely used in various fields, such as aviation [24,25] and wind power [26,27]. In the base model, stagnation, where the flow rate decreases as the fluid approaches the structure, was confirmed near the impeller eye (Figure 7a(i) and Figure A2). When a nose cone structure was applied to the impeller eye, the stagnation was reduced at the impeller eye (Figure 7a(ii–iv)). The decrease in stagnation became more pronounced as the nose cone size increased. When the nose cone is applied, the fluid flows more smoothly, causing the stagnation point to shift forward and reducing flow separation. As a result, the stagnation region decreases, and flow resistance decreases. However, the flow velocity in the region between the inlet and the impeller eye is similar. To confirm this quantitatively, the flow velocity was confirmed in Line 1, where the velocity and wake were the largest (Figure 7b,c(i)). The flow velocity gradually increases from 72 m/s to 78 m/s at 0 to 38 mm and rapidly decreases from 78 m/s to 1 m/s at 38 to 48 mm. Subsequently, it increases again and finally reaches 0 m/s as it approaches the wall. In the section between 40 and 50 mm, a wake occurs. The reduction in flow stagnation by the nose cone did not affect the wake and blower inlet velocities in the area between the impeller eye and inlet.
Because this study uses a simplified model with the impeller blades removed, trusting the results of the area after the impeller eye is difficult; however, overall trends can be identified. To determine the effect of the nose cone on the impeller blade section, the velocity distribution was examined at Line 2, which is the position where the wake occurs in the impeller section. Line 2 is located 45 mm from the bottom of the blower (Figure 7b). In the base model, the wake is the thickest at 26 to 34.5 mm (thickness: 8.5 mm), and the effective sectional area of the impeller (the area where the fluid flows without being affected by the wake) was the smallest (Figure 7c(ii)). Because the same amount of air flowed through a small effective cross-sectional area, it exhibited a relatively higher velocity than the model with a nose cone. For the model with a nose cone, the wake decreased as the height of the nose cone increased (the effective area increased); therefore, B0.0N1.0 and B0.0N1.5 did not confirm a wake in the impeller section, and the same flow scheme was confirmed.
When a wake occurs, the outward velocity of the impeller section increases (Figure 7a). An increase in flow velocity can damage the blades by causing cavitation on the outside of the impeller blades [10,28]. The drag caused by fluid is related to the shape of the object. Assuming the impeller eye without a nose cone as a thin disk, the drag coefficient (Cd) is 1.1. In contrast, a nose cone in the shape of a hemisphere (1.0r) has a Cd of 0.42. Considering that the Cd of a cone shape decreases as the angle of the apex (or point) decreases [10], the Cd value decreases as the height of the nose cone increases, as shown in Figure 7. The reduction in Cd reduces energy loss, thereby improving the performance of the blower.

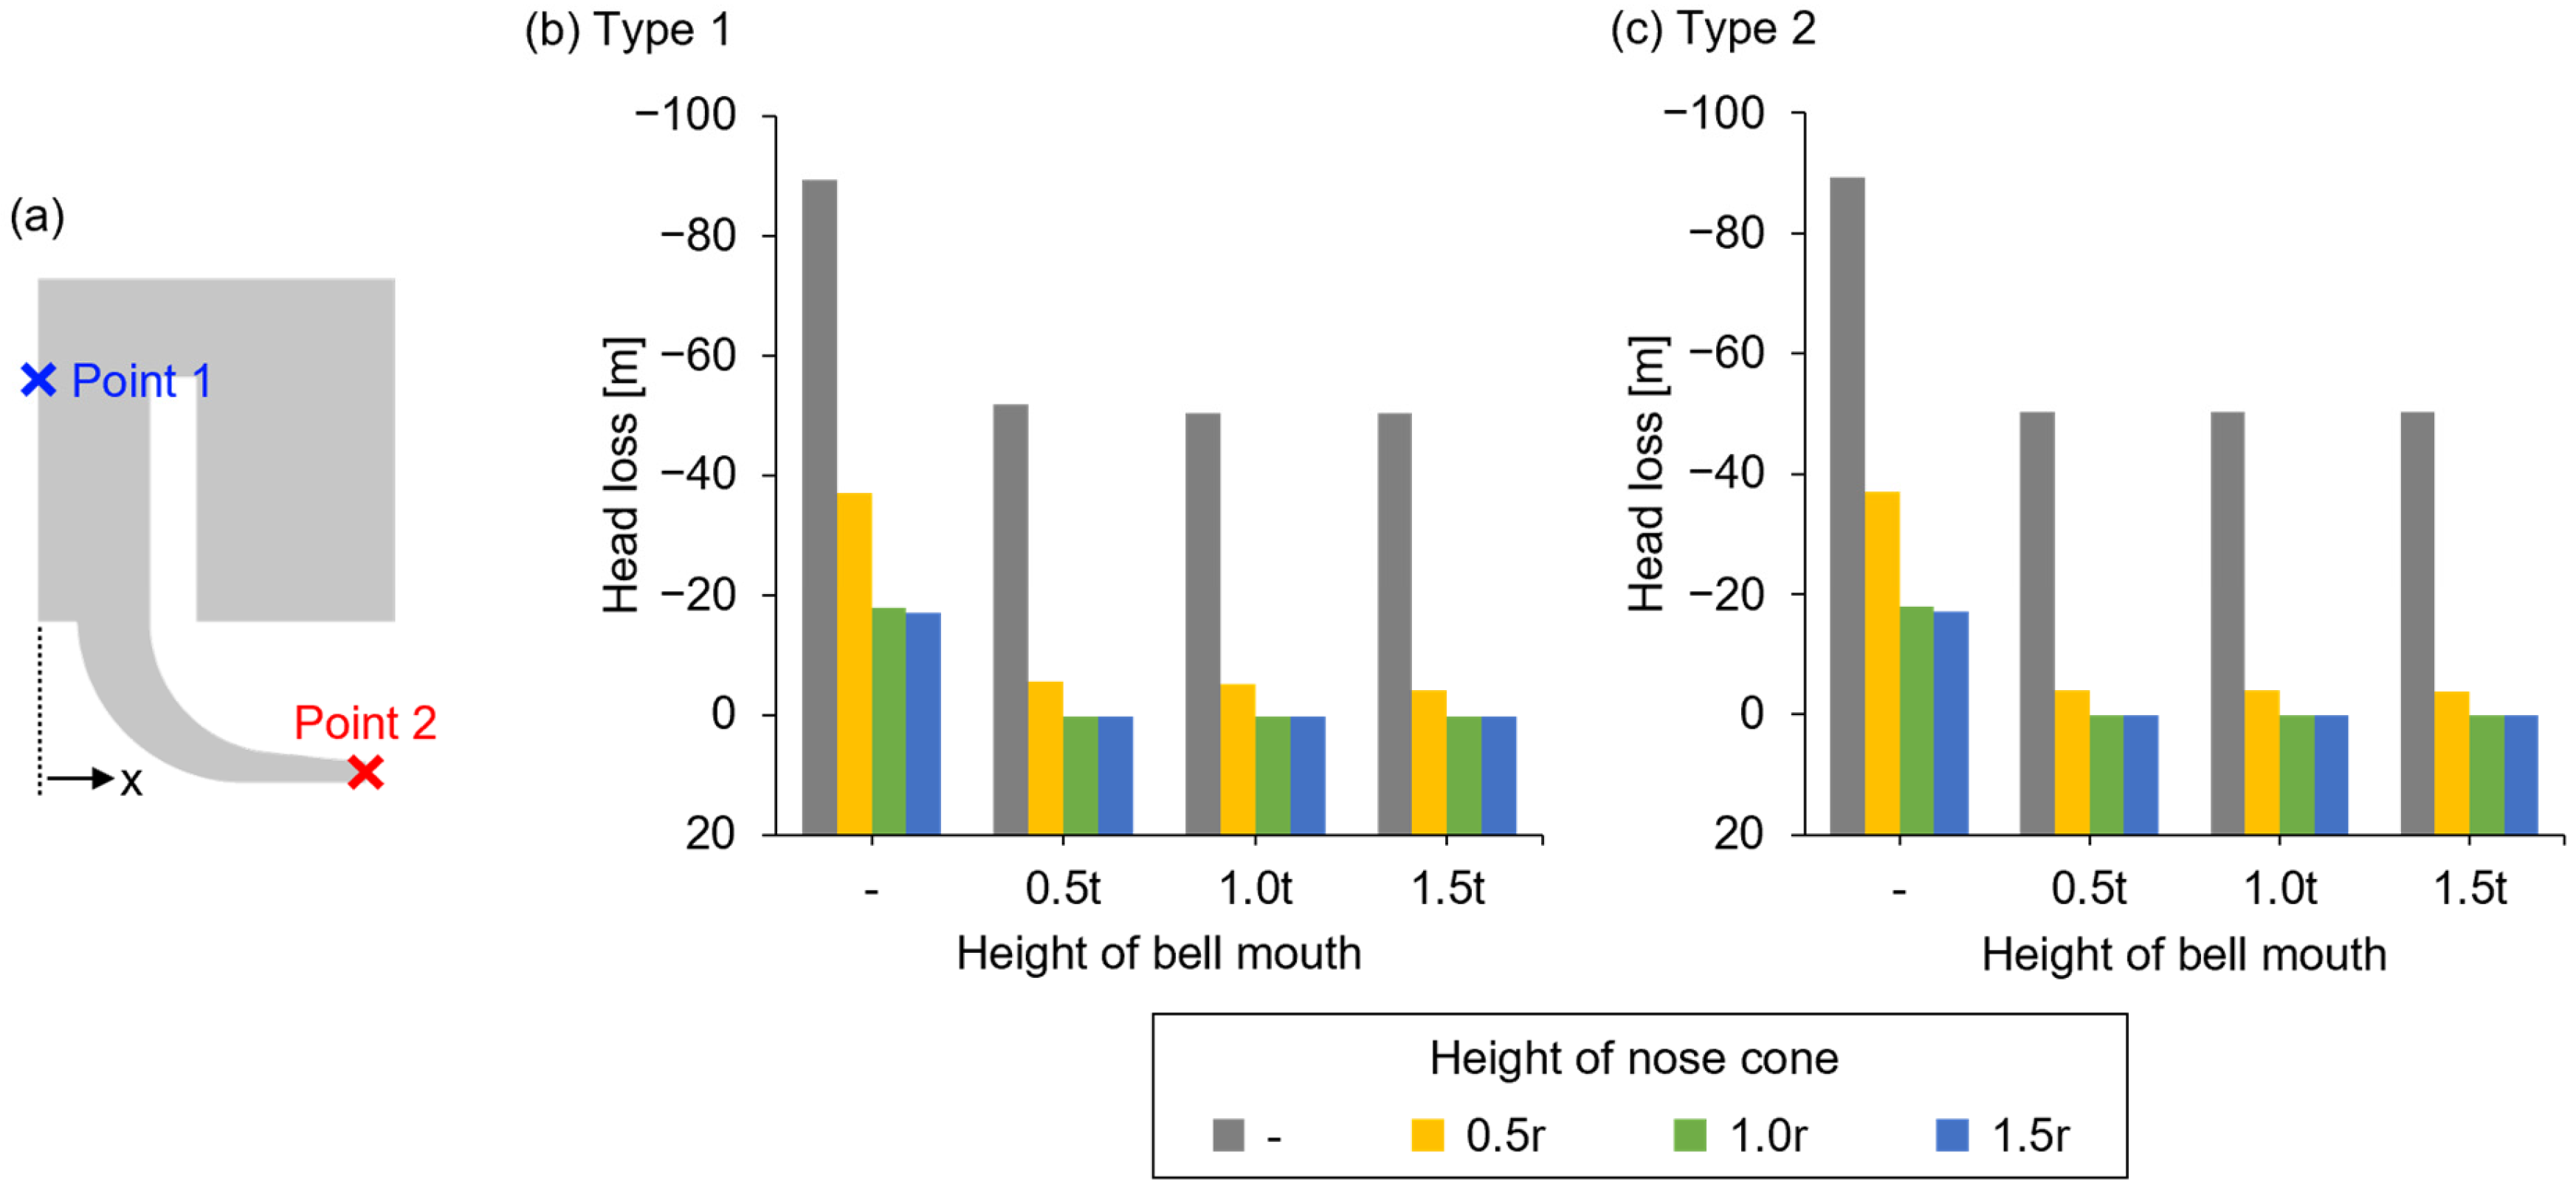
3.3. Combined Effect of the Bell Mouth and Nose Cone

To analyze the effects of the bell mouth and nose cone, the head loss of the blower was analyzed based on the difference between the heads at Point 1 at the center of the blower inlet and Point 2 at the center of the outlet (Figure 8a). The head loss is given by Equation (6) [10]:
H e a d   l o s s = P 2 P 1 ρ g + v 2 2 v 1 2 2 g
where P1 and P2 are the pressures at Points 1 and 2, respectively, and v1 and v2 are the velocities at the same points. Because impeller blades were simplified in this study, accurately analyzing the results after the impeller eye was challenging. However, considering the one-way characteristic of the fluid flow, identifying the tendency of the effects of the bell mouth and nose cone is not a problem.
For the nose cone without a bell mouth, B0.0N0.5, B0.0N1.0, and B0.0N1.5 reduced the head loss by 28.9%, 38.9%, and 39.1%, respectively, compared with the base model (Figure 8b,c; the first bundle of the bar graph). As shown in Figure 7c(ii), the head loss is almost similar when the nose cone is 1.0 r and 1.5 r.
In the synergistic model of the bell mouth with a nose cone, the head loss tends to decrease significantly compared with the model in which only the bell mouth or nose cone was applied. No significant difference exists in the height of the bell mouth between Type 1 and Type 2 bell mouths; however, the head loss tended to decrease as the height of the bell mouth increased. Type 1_B1.5N1.5 and Type 2_B1.5N1.5 reduced the head loss by 74.7% and 81.4%, respectively, compared with the base model (Figure 8b,c; fourth bundle of the bar graph). A small head loss indicates a small loss owing to friction, and the power consumption of the blower can be reduced by applying the bell mouth and nose cone.

4. Conclusions

This research examined the design and performance of two types of bell mouths and nose cones and identified their significant impact on blower efficiency. Our findings demonstrate that the bell mouth design effectively reduces the vena contracta, thereby decreasing flow resistance. Additionally, the reduced vena contracta, caused by the bell mouth, minimizes wake formation near the inlet, which leads to a more uniform pressure distribution and a significant reduction in head loss.
A comparative analysis revealed that Type 2 bell mouths, characterized by larger inlet diameters, exhibited superior performance over Type 1, reducing wake thickness by 89.04% and 91.76%, respectively. Furthermore, introducing nose cone shapes alleviated flow stagnation at the impeller eye, expanded the effective impeller area by 76.29%, and improved overall flow uniformity.
The combined use of bell mouth and nose cone models proved to be the most effective strategy, reducing head loss by up to 81.4%. This improvement was particularly pronounced in the Type 2_B1.5D1.5 configuration, demonstrating the best overall performance. These findings confirm that integrating bell mouths and nose cones enhances blower efficiency by mitigating the energy losses associated with geometric constraints, friction, and flow separation.
Moreover, the straightforward and cost-effective nature of retrofitting existing blowers with bell mouths and nose cones highlights their practicality for widespread implementation in various industrial settings. By optimizing blower performance and reducing energy consumption, this study provides valuable insights for enhancing wastewater treatment facility operations and various other industrial blower applications.
However, because this study focused on specific blower models and controlled experimental conditions, further investigations are needed to validate these findings across diverse industrial applications. Additionally, long-term performance assessments, maintenance considerations, and real-world energy savings should be explored to ensure the feasibility of large-scale implementation. Understanding the economic impact, such as expected cost reductions in energy consumption and operational expenses, will further strengthen its widespread adoption.

Author Contributions

Conceptualization, J.Y. and J.Y.P.; methodology, J.Y. and J.P.; software, J.Y., S.L., and J.P.; validation, J.Y. and S.L.; formal analysis, J.Y. and J.P., investigation, J.Y.; resources, J.Y.; data curation, J.Y.; writing—J.Y., J.P., and S.B.; writing—review and editing, J.P. and S.B.; visualization, J.Y. and J.P.; supervision, J.Y.P.; project administration, J.Y.P.; funding acquisition, J.Y.P. All authors have read and agreed to the published version of the manuscript.

Funding

This work was supported by the IITP (Institute of Information & Coummunications Technology Planning & Evaluation)-ITRC (Information Technology Research Center) grant funded by the Korea government (Ministry of Science and ICT)(IITP-RS-2024-00436248).

Data Availability Statement

The study data are contained within the article.

Acknowledgments

We would like to express sincere gratitude to the CEO and researchers of Namwon Turbo One Inc. for providing detailed design drawings of the blower’s configuration to ensure the smooth execution of this research. This research was supported by the Chung-Ang University Research Scholarship Grants in 2023 (S.B.).

Conflicts of Interest

The authors declare no conflicts of interest.

Appendix A

Figure A1. Streamline according to the bell mouth type. When the bell mouth was installed, the wake near the inlet was reduced, and the vena contracta was reduced.
Energies 18 01830 g0a1
Figure A2. Streamline according to the nose cone. Streamline according to the nose cone. As the nose cone height increases, the stagnation region at the impeller eye decreases, resulting in reduced flow resistance.
Energies 18 01830 g0a2

References

  1. Crini, G.; Lichtfouse, E. Advantages and disadvantages of techniques used for wastewater treatment. Environ. Chem. Lett. 2019, 17, 145–155. [Google Scholar] [CrossRef]
  2. Longo, S.; d’Antoni, B.M.; Bongards, M.; Chaparro, A.; Cronrath, A.; Fatone, F.; Lema, J.M.; Mauricio-Iglesias, M.; Soares, A.; Hospido, A. Monitoring and diagnosis of energy consumption in wastewater treatment plants. A state of the art and proposals for improvement. Appl. Energy 2016, 179, 1251–1268. [Google Scholar] [CrossRef]
  3. Zhang, Z.; Kusiak, A. Models for Optimization of Energy Consumption of Pumps in a Wastewater Processing Plant. J. Energy Eng. 2011, 137, 159–168. [Google Scholar] [CrossRef]
  4. Afshar Ghotli, R.; Abdul Aziz, A.R.; Ibrahim, S.; Baroutian, S.; Arami-Niya, A. Study of various curved-blade impeller geometries on power consumption in stirred vessel using response surface methodology. J. Taiwan Inst. Chem. Eng. 2013, 44, 192–201. [Google Scholar]
  5. Lee, Y.T.; Lim, H.C. Performance assessment of various fan ribs inside a centrifugal blower. Energy 2016, 94, 609–622. [Google Scholar] [CrossRef]
  6. Imsaengsuk, J.; Sangsawangmatum, T.; Chantrasmi, T.; Nontakaew, U. Performance investigation of blower for mechanical ventilator using CFD. In AIP Conference Proceedings; AIP Publishing: Phuket, Thiland, 2024; Volume 3086. [Google Scholar]
  7. Abo Elyamin GR, H.; Bassily, M.A.; Khalil, K.Y.; Gomaa, M.S. Effect of impeller blades number on the performance of a centrifugal pump. Alex. Eng. J. 2019, 58, 39–48. [Google Scholar]
  8. Varun Ch, S.; Anantharaman, K.; Rajasekaran, G. Effect of blade number on the performance of centrifugal fan. Mater. Today Proc. 2023, 72, 1143–1152. [Google Scholar]
  9. Mandhare, N.A.; Karunamurthy, K. Investigation on Centrifugal Pump Performance for Various Nose-Cap Geometries. In Theoretical, Computational, and Experimental Solutions to Thermo-Fluid Systems: Select Proceedings of ICITFES 2020; Springer: Singapore, 2021; pp. 401–411. [Google Scholar] [CrossRef]
  10. Munson, B.R.; Okiishi, T.H.; Huebsch, W.W.; Rothmayer, A.P. Fundamentals of Fluid Mechanics, 7th ed.; Wiley: Singapore, 2013. [Google Scholar]
  11. Shaikh, J.S.; Pathan, K.A.; Kumar, K.; Khan, S.A. Effectiveness of Cone Angle on Surface Pressure Distribution along Slant Length of a Cone at Hypersonic Mach Numbers. J. Adv. Res. Fluid Mech. Therm. Sci. 2023, 104, 185–203. [Google Scholar]
  12. Dhumal, A.; Ambhore, N.; Tamkhade, P.; Marne, A.; Mujawar, N. Numerical Optimization for Aerodynamic Performance of Nose Cone of FSAE Vehicle through CFD. CFD Lett. 2024, 16, 161–171. [Google Scholar]
  13. Shah, V.K.; Ateeb, K.; Razzaq, M.; Varun, C.; Avinash, B. Determination of the optimum nose cone geometrical shape for supersonic missile. Mater. Today Proc. 2022, 64, 749–754. [Google Scholar] [CrossRef]
  14. Wu, H.; Tan, L.; Niu, W.; Song, Y.; Zhang, Y.; Wang, S.; Yan, S. A novel morphing nose cone for underwater gliders: Performance analysis, parameter optimization, and driving mechanism design. Appl. Ocean Res. 2024, 147, 104000. [Google Scholar] [CrossRef]
  15. Tiwari, A.; Patel, S.; Lad, A.; Mistry, C.S. Development of Bell Mouth For Low Speed Axial Flow Compressor Testing Facility. In Proceedings of the Asian Congress on Gas Turbines, Mumbai, India, 14–16 November 2016. [Google Scholar]
  16. Han, M.H.; Park, J.H.; Yang, J.S.; Yoon, S.Y.; Min, J.K. Shape optimization of bellmouth to improve flow uniformity under non-aligned inflow condition in gas turbine casing. Eng. Appl. Comput. Fluid Mech. 2024, 18, 2400533. [Google Scholar]
  17. Sevinç, K. Aerodynamic design optimization of a bellmouth shaped air intake for jet engine testing purposes and its experiment based validation. J. Phys. Conf. Ser. 2021, 1909, 012028. [Google Scholar]
  18. Shrestha, U.; Choi, Y.-D. Bellmouth Shape Optimization for the Suppression of Flow Instability in a Pump Sump Model. KSFM J. Fluid Mach. 2021, 24, 49–57. [Google Scholar]
  19. Son, P.N.; Kim, J.W.; Byun, S.M.; Ahn, E.Y. Effects of inlet radius and bell mouth radius on flow rate and sound quality of centrifugal blower. J. Mech. Sci. Technol. 2012, 26, 1531–1538. [Google Scholar]
  20. Kim, S.; Heo, S.; Cheong, C.; Kim, T.H. Numerical and experimental investigation of the bell-mouth inlet design of a centrifugal fan for higher internal flow rate. J. Mech. Sci. Technol. 2013, 27, 2263–2273. [Google Scholar]
  21. Singh, A.P.; Kumar, A.; Akshayveer Singh, O.P. A novel concept of integrating bell-mouth inlet in converging-diverging solar chimney power plant. Renew. Energy 2021, 169, 318–334. [Google Scholar]
  22. Singh, A.P.; Kumar, A.; Akshayveer Singh, O.P. Natural convection solar air heater: Bell-mouth integrated converging channel for high flow applications. Build. Environ. 2021, 187, 107367. [Google Scholar]
  23. ANSYS Inc. ANSYS FLUENT Theory Guide 12.0 Theory Guide; ANSYS Inc.: Canonsburg, PA, USA, 2015; Volume 15317. [Google Scholar]
  24. Deepak, N.R.; Ray, T.; Boyce, R.R. Evolutionary Algorithm Shape Optimization of a Hypersonic Flight Experiment Nose Cone. J. Spacecr. Rocket. 2012, 45, 428–437. [Google Scholar] [CrossRef]
  25. Gauer, M.; Paull, A. Numerical Investigation of a Spiked Blunt Nose Cone at Hypersonic Speeds. J. Spacecr. Rocket. 2012, 45, 459–471. [Google Scholar] [CrossRef]
  26. Whale, J. Design and construction of a simple blade pitch measurement system for small wind turbines. Renew. Energy 2009, 34, 425–429. [Google Scholar]
  27. Freere, P.; Sacher, M.; Derricott, J.; Hanson, B. A Low Cost Wind Turbine and Blade Performance. Wind. Eng. 2010, 34, 289–302. [Google Scholar] [CrossRef]
  28. Tao, R.; Xiao, R.; Wang, Z. Influence of Blade Leading-Edge Shape on Cavitation in a Centrifugal Pump Impeller. Energies 2018, 11, 2588. [Google Scholar] [CrossRef]
Figure 1. Schematics of the hydrodynamic phenomenon in the blower. (a) Structure of the blower. (b) Schematic of airflow in the blower. (i) Cross-sectional view of the blower without an impeller and its approximate flow (blue arrow). (ii) Reduction in the effective flow area by the flow separation on the blower inlet. (iii) Stagnation point on the impeller eye. (iv) When the bell mouth is applied, separation flow disappears. (v) When the nose cone is applied, stagnation flow disappears.
Energies 18 01830 g001
Figure 2. Model parameter descriptions. (a) Schematic of the 2D axisymmetric computational domain. (b) Geometry and boundary conditions of the blower, including the outside air area. The blue arrows schematically indicate the air inflow. (c) Bell-mouth type of blower inlet with different heights. (i) Model maintaining the diameter of the blower inlet. (ii) Model in which the inlet is extended outward by the wall thickness (t) of the blower wall. (d) Nose cones with different heights.
Energies 18 01830 g002
Figure 3. Mesh of the computational domain. (a) A quadrilateral grid was applied to the whole computational domain and set densely near the wall. (b) The mesh test was performed at Line 1, 143 mm from the bottom of the blower. Based on the mesh test results, Mesh B was selected in view of the accuracy and efficiency of the calculations.
Energies 18 01830 g003
Figure 4. Static pressure contours according to the bell mouth type. (a) The blower inlet area, which is the observation area, is 135 mm from the bottom of the blower. (b) Pressure contours in the base model. A large pressure drop was produced by the vena contracta. (c) Pressure contours in the bell mouth model. (iiii) Type 1 bell mouth. The larger the bell mouth, the lower the pressure drop. (ivvi) Type 2 bell mouth. Same as Type 1; the larger the bell mouth, the lower the pressure drop, and the effect is more prominent than Type 1. (d) The greater the size of the bell mouth, the higher the minimum pressure (negative pressure), making Type 2 more efficient than Type 1.
Energies 18 01830 g004
Figure 5. Head contours according to the types of bell mouth. (a) The blower inlet area is 135 mm from the bottom of the blower. (b) Head contours in the base model. (c) Head contours according to the types of bell mouth. (iiii) Type 1 and (ivvi) Type 2. (d) In Type 1, increasing the size of the bell mouth reduces the thickness of the head drop; however, in Type 2, the size of the bell mouth does not appear to affect the thickness of the head drop.
Energies 18 01830 g005
Figure 6. The head value profile recorded at Line 1. (a) The position of the Line 1 location corresponds to the maximum flow velocity and wake. (b) Head varies depending on the type of bell mouth. With Type 1, larger bell mouths result in greater head drops, whereas (c) Type 2 shows a less pronounced correlation between bell mouth size and head drop.
Energies 18 01830 g006
Figure 7. Velocity distribution around the impeller zone. (a) Velocity contour according to the height of the nose cone. (i) Base model, (ii) B0.0_N0.5, (iii) B0.0_N1.0, and (iv) B0.0_N1.5. (b) Location of Lines 1 and 2. (c) Velocity curves as the height of the nose cone in Lines (i) 1 and (ii) 2.
Energies 18 01830 g007
Figure 8. Quantitative comparison of head loss. (a) Two points are used to measure the head loss: the center of the blower inlet (Point 1) and outlet (Point 2). Head loss varies based on the sizes of the bell mouth and nose cone as follows: (b) with a Type 1 bell mouth, and (c) with a Type 2 bell mouth.
Energies 18 01830 g008
Table 1. Name of each model according to the bell mouth and nose cone.
Height of Bell MouthHeight of Nose ConeTypes of Bell Mouth
(t = 21.61 mm)(r = 19 mm)Type 1Type 2
--Base model
0.5rB0.0_N0.5
1.0rB0.0_N1.0
1.5rB0.0_N1.5
0.5t-Type 1_B0.5_N0.0Type 2_B0.5_N0.0
0.5rType 1_B0.5_N0.5Type 2_B0.5_N0.5
1.0rType 1_B0.5_N1.0Type 2_B0.5_N1.0
1.5rType 1_B0.5_N1.5Type 2_B0.5_N1.5
1.0t-Type 1_B1.0_N0.0Type 2_B1.0_N0.0
0.5rType 1_B1.0_N0.5Type 2_B1.0_N0.5
1.0rType 1_B1.0_N1.0Type 2_B1.0_N1.0
1.5rType 1_B1.0_N1.5Type 2_B1.0_N1.5
1.5t-Type 1_B1.5_N0.0Type 2_B1.5_N0.0
0.5rType 1_B1.5_N0.5Type 2_B1.5_N0.5
1.0rType 1_B1.5_N1.0Type 2_B1.5_N1.0
1.5rType 1_B1.5_N1.5Type 2_B1.5_N1.5
Disclaimer/Publisher’s Note: The statements, opinions and data contained in all publications are solely those of the individual author(s) and contributor(s) and not of MDPI and/or the editor(s). MDPI and/or the editor(s) disclaim responsibility for any injury to people or property resulting from any ideas, methods, instructions or products referred to in the content.

