Abstract
The subject addressed in this article is the application of the life cycle assessment (LCA) method for studying the greenhouse gas emissions attributable to public bus transport. The article provides a discussion on the results of the authors’ in-house study on the greenhouse gas (GHG) emissions generated over the life cycle of the buses used in Poland’s public transport with the use of well-to-wheel (WTW) fuel life cycle analysis. The project started by adopting the methodology and assumptions for the research; next, the data required to perform the relevant analyses were collected and the greenhouse gas emissions attributable to the operation of buses equipped with both diesel fuel (DF) internal combustion engines and electric engines (BEVs) were assessed against real-life data using a selected Polish municipal transport company as an example in 2022. The study also included an assessment of GHG emissions from electric buses powered by renewable energy sources (RESs), using data from the chosen municipal transport company. For the RES fractions of 25%, 50%, and 75% in the energy mix, emission reductions of approx. 19%, 38%, and 57% have been achieved, respectively. For an energy mix entirely derived from RESs, the reduction in emissions comes to ca. 76% vis-à-vis Poland’s energy mix in 2022.
1. Introduction
Some of the greatest challenges currently facing the contemporary world are the environmental, economic, and social problems associated with the greenhouse effect. Greenhouse gas (GHG) emissions, and particularly of carbon dioxide, methane, and nitrous oxide, are presently on the rise due to human activity, including combustion of fossil fuels, such as coal, petroleum, and natural gas. The gases emitted during the combustion of the fuels in common use allow solar radiation into the Earth’s atmosphere, while they do not release thermal radiation from the atmosphere to a sufficient extent. This leads to an ever-increasing amount of greenhouse gases present in the atmosphere and the growing greenhouse effect, which is the main cause of global warming, responsible for weather anomalies and environmental degradation [1]. Extreme weather phenomena threaten human life and health, causing numerous issues, including the growing incidence of diseases and excessive mortality. Road transport, being one of the most crucial sectors of the economy, is an important area where significant reduction in greenhouse gas emissions can be achieved, thereby improving air quality. A major portion of the CO2 emissions generated across the European Union (EU) comes directly from transport, with road transport being attributed to nearly 72% of this volume [1]. In Poland (PL), the emissions attributable to transport increased from 22 to 56 million tonnes of CO2 equivalent between 1990 and 2016, causing the average emissions from the transport sector in Poland to have risen nearly three times [2]. Emissions from road transport, primarily in cities, represent a significant source of air pollution. High vehicle traffic density and impaired air flow in urban centres cause the atmospheric phenomenon of smog to emerge as a consequence of fog mixing with smoke and exhausts. Deleterious chemical compounds, including sulphur and nitrogen oxides as well as various solids or particulate matter, enter the atmosphere [3]. The harmfulness of the pollution generated by means of urban road transport is also attributable to the fact that pollutants spread in the immediate vicinity of people in high concentrations and at low altitudes. The level of harmful emissions depends primarily on the traffic volume, the congestion which builds up, and a large number of vehicles igniting as well as coming to a halt. All these pollutants accumulate, especially in densely developed urban settlements, where they are particularly difficult to disperse. What matters in terms of the structure of road transport vehicles is a number of aspects such as their size, age, technical condition, and the type of fuel they combust. According to the World Health Organization (WHO), as many as 23 of the 50 EU cities with the highest concentrations of the PM2.5 particulate matter are to be found in Poland [4]. The European Environment Agency (EEA) states that nearly all inhabitants of European cities breathe air whose pollution levels exceed the WHO standards [5]. Another serious environmental problem affecting the life and health of city dwellers is the noise generated by road transport. According to the EEA data, more than 50% of people living in urban areas are exposed to traffic noise exceeding acceptable levels both during the day and at night [6]. The EU plan for sustainable Europe sets specific targets for the transport sector. As part of the first-ever global treaty on climate, officially known as the Paris Agreement, ratified in 2015, the EU countries committed themselves to reducing greenhouse gas emissions by at least 40% below the 1990 levels by 2030 [7]. Additionally, the European Union, being the world’s third largest greenhouse gas emitter next to China and the US, undertook to act towards achieving the target of net zero GHG emissions by 2050 under the European Green Deal [8]. The European Green Deal package comprises initiatives representing a number of closely interlinked areas, such as climate, environment, energy, transport, industry, agriculture, and sustainable financing. In the sphere of road transport, the European Parliament and Council passed dedicated legislation aimed at reducing CO2 emissions in 2019 [9]. Under document [9], the EU member states are required to ensure that, when awarding contracts, ordering parties take into account the energy factor and the environmental impact over the entire life cycle of vehicles, including energy consumption as well as emission of CO2 and certain pollutants. The document in question indicates minimum target levels for the share of orders for carbon-neutral heavy vehicles in the total number of heavy vehicles under procurement. With regard to the foregoing, Poland’s act on electromobility and alternative fuels [10,11] contains a provision to maintain vehicle fleets used to provide public transport services with a fraction of carbon-neutral buses at 30%, as of 1 January 2028. The said minimum fractions of buses pertain directly to the total number of vehicles dedicated exclusively or partially to the provision of public transport services by their operator.
All across the European Union, including Poland, a number of measures are currently being undertaken to significantly reduce the negative environmental impact of internal combustion engine vehicles and to replace them with vehicles running on alternative fuels, such as electric or hydrogen-powered vehicles. However, advanced environmental life cycle assessments of these fuels, used in the transport sector, indicate that they are also not completely free from negative environmental impact, especially in terms of the effects of their production phase or cases where power is derived from an energy mix devoid of a significant impact of eco-friendly renewable energy sources (RESs). What appears to be a very important challenge in practice is using a fuel with the least effect on GHG emissions as well as on other impact categories, such as minimised consumption of fossil fuels, metals, and minerals, which stems from the requirements set forth by the Europe Commission and the applicable principles of circular economy. This proves to be a very important aspect when considering the alternative fuels consumed by means of transport, especially at the production stage, as it is in the case of biofuels, or the production of batteries and infrastructure in the case of electric vehicles or fuel cell vehicles. According to data provided by the European Automobile Manufacturers’ Association (ACEA) [12] and contained in a report by the Polish Automotive Industry Association [13], in 2022, diesel-powered buses with internal combustion engines were still the most popular type in Poland, accounting for 75% of all new bus sales. The total share of electric and hybrid buses was 18.8%. The sales of new buses in Poland and the EU in the year 2022, broken down by drive system types, have been summarised in Figure 1.
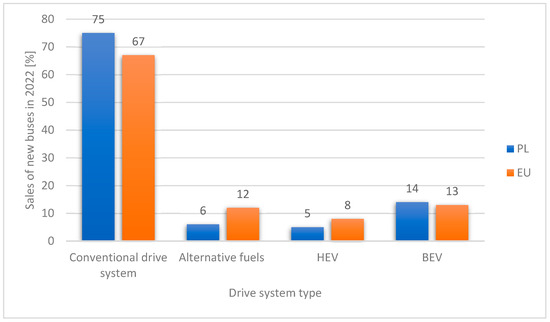
Figure 1.
Sales of new buses in Poland and the EU in 2022. Source: authors’ own compilation based on [13].
In the recent years, the use of electric buses has been increasing both in Europe and in Poland (Figure 2) [14]. In the latter country, 1237 electric buses were in operation in 2024, representing an increase of more than 100% compared to 2021, when there were 591 buses in service [14]. In all EU member states, 20,215 electric buses were in operation in 2024, which meant an increase of nearly 140% against the year 2021, when there were 8820 buses [14]. Having analysed the data provided in Figure 2 for the EU and Poland, one can conclude that, over the recent years, and especially since 2020, a dynamic increase has been observed in the number of electric buses operated by both transport companies and municipal transport service providers.
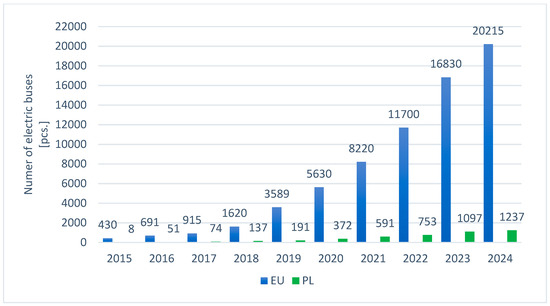
Figure 2.
Number of electric buses in EU and Poland. Source: authors’ own compilation based on [14].
A method that makes it possible to analyse both the entire life cycle of products and to take numerous damage and impact categories into account is life cycle assessment (LCA) [15,16,17,18,19,20,21,22,23,24]. In the transport sector, life cycle assessment is often applied by way of the well-to-wheel (WTW) fuel life cycle analysis, as currently recommended by the European Commission [25]. The WTW method makes it possible to assess the energy consumption and greenhouse gas emission associated with the production, transport, and distribution of fuel. The WTW analysis spans two phases:
- Well-to-tank (WTT) analysis, in which one is to consider the environmental burdens associated with the sourcing of the raw material from which fuel is produced, the fuel production itself, as well as its transport and storage.
- Tank-to-wheel (TTW) analysis, in which one is to consider the environmental burdens associated with the fuel consumption by means of transport, as well as the refuelling and fuel combustion associated with vehicle operation.
Electric vehicles are assumed to be carbon neutral because they do not emit pollutants in their operating phase. When examining the energy consumption and greenhouse gas emissions attributable to electric vehicles, including electric buses, one should predominantly apply the WTT method which, in this particular case, means studying the GHG emissions related to electricity production [17]. Analyses comparing the energy and environmental indicators of four types of city passenger buses using the WTW method are presented in the paper [18]. The vehicles subject to their analysis were as follows: a model equipped with a conventional diesel-powered internal combustion engine, a hydrogen-powered fuel cell electric vehicle, a battery electric vehicle, and one with a hybrid diesel–electric engine. Battery electric buses (BEVs) were found to perform far better in terms of environmental ratings than the other buses subject to the study, but only under the condition that the electricity needed to charge them was supplied from a clean energy mix, i.e., from a power grid using an adequate portion of RESs. The authors of paper [19] have proposed a hybrid system of analysis based on the WTW and LCA methods to assess GHG emissions from electric vehicles. In paper [20], the authors have concluded that electric vehicles reveal significant potential to reduce greenhouse gas emissions. The authors of paper [21], on the other hand, have presented an analysis of vehicle-generated GHG emissions by taking individual electricity sources into account. The results of the analysis discussed in that paper only apply to the GHG emissions from the electric vehicles operated in those European countries where a maximum number of electric vehicles were sold. According to the authors, the GHG emissions generated by electric vehicles depend on the mix of resources used for electric energy production, the emissions associated with the extraction, transport, and conversion of a given energy resource, and the efficiency of the vehicle charging system. The authors of paper [22] developed life cycle inventories (LCI) for both conventionally powered and electric vehicles. They proved that, assuming the distance covered by vehicles at 150,000 km, electric vehicles powered by the European electricity mix provided a reduction in greenhouse gas emissions ranging between 10 and 24% compared to vehicles with internal combustion engines. In paper [23], the authors have presented the results of an LCA-based comparative analysis of the CO2 emissions from conventional petrol and diesel fuel vehicles examined against vehicles running on alternative fuels. The regions chosen for the LCA areas were the United States, the European Union, Japan, China, and Australia. Their results clearly imply that the CO2 emissions generated at the stage of production of electric vehicles were higher than those attributable to internal combustion engine vehicles due to the additional CO2 emissions associated with battery production. Furthermore, the authors of paper [23] have found that, in countries where RESs or electric energy production technologies of low carbon intensity are commonly used for energy production, as the distance travelled by the analysed vehicles increases over the course of their operation, the total CO2 emissions during the operation of electric vehicles are significantly lower than the indices established for conventionally powered vehicles. Paper [24] provides the results of an LCA-based analysis of selected buses used in urban transport, while paper [24] comments upon the results of LCA of public transport buses running on alternative fuels. The results presented and discussed in paper [24] have confirmed that it is actually difficult to point at the specific alternative fuel type intended for public transport buses that should be considered optimal in environmental terms. However, what has been confirmed is that using electric buses for public transport services represents a good option on account of their low greenhouse gas emission rates, provided that they are charged from renewable energy sources, and particularly from photovoltaic systems. Under the authors’ in-house studies [26,27], the impact of various means of road transport on climate change and human health in Poland was assessed [26], and various analyses were conducted to examine the environmental footprints of the electric cars used in Poland over their life cycle [27]. In paper [26], it has been evidenced that the operation of means of transport is among the most important sources of environmental impact. The purpose of paper [26] was to determine greenhouse gas emissions as well as to assess the impact of the operation of means of road transport in Poland on human health using LCA, and the specific means of road transport taken into account were passenger cars, heavy goods vehicles, and buses. Paper [27] provides results of a study of the environmental (water and carbon) life cycle footprints of an electric passenger car, including an analysis of electric battery charging in Poland, both at present and in the future. The pre-assumed proportions of individual electric energy generation sources comprising Poland’s power engineering systems between 2015 and 2050 have been used to examine selected environmental footprints attributable to the present and future electric car battery charging process.
2. Methodology of Analysis
This paper provides the results of an assessment of the greenhouse gas emissions associated with the use of diesel fuel (DF) internal combustion engine buses and electric buses (BEVs), with one of the major municipal transport companies operating in 2022 in the Polish metropolitan area known as Metropolis of Upper Silesia and Dąbrowa Basin, shortened to GZM, used as an example. The GHG emissions were analysed by way of the life cycle assessment (LCA) method. LCA’s main components are the identification and quantification of potential environmental burdens associated with the raw materials used as well as the energy consumed and the emissions released into the environment. The LCA method was chosen for purposes of the analyses performed under the study because it enables environmental assessment which takes the entire life cycle of the fuels consumed by vehicles as well as diverse environmental aspects into account. The analyses performed by the authors included comparing electric buses and those powered by internal combustion engines in terms of the most significant impact category, namely greenhouse gas emissions.
The LCA-based analysis made it possible to identify environmental burdens related both directly and indirectly to the life cycle of a bus. In accordance with the applicable standards [15,16], the aim and scope of the study were defined, including the functional unit, the system boundary, and the basic assumptions for analyses. The results thus obtained were analysed with reference to the year of analysis, i.e., 2022, while the functional unit assumed for the analyses was 100 km of the distance covered by individual buses. The analyses covered the life cycle of the fuels used in the buses operated by the municipal transport company chosen for the study. What these analyses also took into account was the additional fuel consumption associated with the heating system used in the operation of these electric buses.
The goal of these analyses was to highlight determinants for the assessment of the greenhouse gas emissions associated with the operation of the buses used in Poland to provide municipal transport services, powered by both internal combustion engines and electric motors. An additional component of the study was an assessment of the greenhouse gas emissions from the electric buses equipped with batteries charged from renewable energy sources.
The calculations for the LCA were performed using version 9.5.0.2 of the Simapro software along with the Ecoinvent v.3.9 database [28,29]. For purposes of the study, the relevant input and output data were subject to detailed identification and analysis—a process known as life cycle inventory (LCI)—which makes it possible to survey all the data necessary for life cycle assessment. This is an important component of LCA-based analyses, demonstrating the reliability of the analysis results obtained. Therefore, it is important that LCA should be based on real-life data, as in the case of this study, rather than some secondary data extracted from a literature review.
The main assumptions and the set of inputs and outputs envisaged in this paper, actually used in individual phases of the bus life cycle, are real-life data obtained from the chosen municipal transport company. The data concerning the energy systems used for charging the electric bus batteries were processed with reference to data specific to Poland. The assumptions for the environmental assessment and for the data inventory pertaining to the structure of the dust and gas emissions caused by the operation of road transport vehicles in Poland were developed with reference to the 2021 data acquired from the Central Statistical Office [2], while the emissions from diesel engine buses were assumed on the basis of the data provided by the National Centre for Emissions Management (KOBiZE) [30,31]. The solution used to conduct the environmental impact assessment was the IPCC method, developed by the Intergovernmental Panel on Climate Change [16,28], intended to enable evaluation of greenhouse gas emissions over the entire life cycle of products [29]. The IPCC method made it possible to calculate an index based on the global warming potential (GWP). The measure converts the radiative forcing of the greenhouse gases released into the environment into equivalent kilogrammes of carbon dioxide [29].
3. Assumptions and Data Inventory
The Metropolis of Upper Silesia and Dąbrowa Basin (Metropolis GZM) incorporates 41 municipalities located in the central part of Silesian Voivodeship. The entity appointed to perform such operations as planning, organisation, and management of collective public transport in the GZM territory is the Metropolitan Transport Authority (MTA). The main task facing this Authority in terms of the collective public transport organisation is to provide passenger transport services within the GZM area as well as in the municipalities with which relevant agreements have been concluded [32]. The collective public transport system organised and managed by the Metropolitan Transport Authority is the largest in Poland in terms of the area coverage and the number (439) of service lines [32]. There are currently 19 entities providing bus, tram, and trolleybus transport services within the GZM territory. Municipal transport companies hold the largest share in the bus transport market, as they are responsible for more than 60% of the operational volume. The bus fleet serving the transport network in Metropolis GZM consists of 1612 vehicles, and most of those used to deliver collective public transport services in this territory are characterised by a length of 11–13 m (MAXI class) or 18–24 m (MEGA class), their quantity coming to 975 and 478 vehicles, respectively. The entity chosen for the analyses conducted under the study is one of the municipal transport companies which provide public bus transport services in the GZM area. As declared by this company, their fleet amounted to 240 buses. The chosen municipal transport company provided public transport services using buses compliant with the Euro 3 (5 buses), Euro 4 (5 buses), Euro 5 (10 buses), Euro 5 EEV (72 buses), and Euro 6 standards (128 buses), and 20 electric (carbon-neutral) buses, the latter representing 8.33% of the total fleet in service. The infrastructure used for electric bus charging, i.e., 17 stations designed for slow (plug-in) charging as well as two pantograph chargers, is located at the company’s depot. By 2026, the chosen municipal transport company is planning to continue upgrading its fleet in accordance with the requirements of the applicable law [10,11], i.e., by purchasing 77 carbon-neutral vehicles (electric buses). Additionally, in connection with the intended purchase of further electric buses, the company’s plans include installation of four pantograph chargers at two selected interchange points. They are also planning to move to new headquarters as well as to change the main depot, where new capabilities are to be provided for electric bus charging from renewable energy sources (RESs) using an in-house PV system. The analyses conducted by the authors comprised both electric buses and those propelled by internal combustion engines. The analysis of the electric ones considered the life cycle of the electricity used to charge bus batteries. Also, diesel fuel, used to heat the buses, was taken into account. What the analysis of the internal combustion engine buses covered was the life cycle of diesel fuel, including the fuel consumed for bus heating, and direct in-service emissions of gas and dust pollutants. All the analyses were conducted by taking into account real-life data obtained from the municipal transport company for each month of 2022, broken down into diesel fuel and electricity consumption by individual buses. On account of the sheer number of buses serving the GZM area, including those operated by the municipal transport company, the data assumed for the analyses under the study concerned 12 m long vehicles (MAXI class).
Some examples of the data characterising the 12 m (MAXI class) buses with internal combustion engines with Euro 6 standards, including the actual distance travelled and fuel consumption in the months of July to December 2022, as provided by the chosen municipal transport company, have been summarised in Table 1. Sample data on the actual distance travelled as well as the electricity and heating fuel consumed by the electric buses between July and December 2022, obtained from the municipal transport company, have been provided in Table 2. The data in Table 2 concern all the 12 m long buses (MAXI class) in operation. Analysing the data given in Table 2, one can see different values of electricity consumption related to km in the analysed months (kWh/km). In August, electricity consumption was 1.02 kWh/km, and in December 1.08 kWh/km. Having analysed the data thus acquired, the authors found that the only month in which electric buses did not consume diesel fuel for heating purposes was August (Table 2). In the remaining months of 2022, diesel fuel combustion was recorded, with the peak consumption of 6210 L reached in December. The use of diesel fuel in electric bus heating systems entails its negative impact on the direct emissions generated at bus operation sites as well as on the indirect emissions associated with diesel fuel production.

Table 1.
Fuel consumption and distance travelled by 12 m diesel-powered buses (MAXI class), with Euro 6 standards applicable from July to December 2022. Source: authors’ own compilation based on the data obtained from the municipal transport company.

Table 2.
Consumption of electricity and fuel for heating as well as distance travelled by 12 m electric buses (MAXI class) between July and December 2022. Source: authors’ own compilation based on the data obtained from the municipal transport company.
Given what data had been rendered available by the municipal transport company, in the analyses and calculations conducted under the study for both diesel and electric buses, the following convention of designations was adopted for the buses in question (Table 1 and Table 2): 12 m bus—12 m long (MAXI class) bus short fleet.
The system boundary set for the analysis of the electric buses comprised electricity production considering all energy sources in Poland. The percentage share of individual energy sources in 2022, assumed with reference to the data compiled for electricity production by Energy Forum in a document entitled Energy Transition in Poland—2023 edition [33]—as provided by Agencja Rynku Energii S.A. in 2023 [34], has been summarised in Table 3.

Table 3.
Electricity production by energy source in Poland in 2022. Source: authors’ own compilation based on [33,34].
The system boundary established for purposes of the analyses performed for the buses featuring internal combustion engines comprised diesel fuel production and direct emissions over the course of the vehicle operation, including carbon dioxide emissions and on-route exhaust emissions according to individual Euro emissions standards. These requirements are set forth in international and European standards relating to vehicle emission levels, including those of city buses [35].
The basic data inventory used to perform the LCA analyses of the diesel buses comprised the following:
- Distance travelled in each month of the analysis.
- Fuel consumption—diesel fuel, including fuel consumed for bus heating.
- Emissions of gas and dust pollutants according to the emission standards applicable to 12 m buses: Euro 6.
The basic data inventory used for purposes of the LCA analyses of the electric buses comprised the following:
- Distance travelled in each month of the analysis.
- Fuel (electricity) consumption for battery charging.
- Diesel fuel consumption for bus heating.
- Gas and dust emissions from diesel fuel consumption for heating of 12 m buses: Euro 6.
4. LCA Results
4.1. Assessment of Greenhouse Gas Emissions from Diesel Fuel
Based on the real-life data obtained from the chosen municipal transport company (Table 1), GHG emission analyses were conducted for 12 m diesel buses with Euro 6 standards, and the analysis results obtained for individual months of the year 2022 are shown in Figure 3. The determinants of the GHG emissions produced by the 12 m Euro 6-complaint buses with diesel engines in January 2022 are provided in Figure 4.
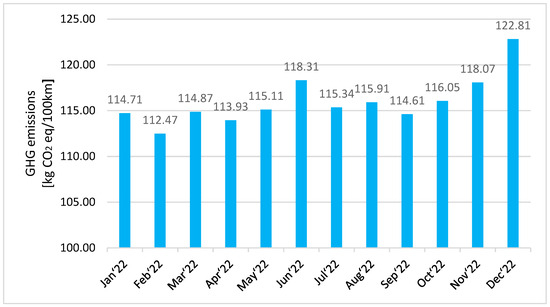
Figure 3.
GHG emissions from 12 m diesel fuel buses with Euro 6 standards broken down by months of 2022. Source: authors’ own compilation.

Figure 4.
Determinants of GHG emissions for Euro 6-compliant 12 m diesel engine buses established for January 2022. Source: authors’ own compilation.
Based on the analysis conducted by the authors and the results shown in Figure 4, it has been concluded that the main determinant of greenhouse gas emissions from diesel buses is direct carbon dioxide emission representing 85.7% of total emissions. However, the contribution of diesel fuel production should also be regarded as important, amounting to 14.3% of the emissions.
4.2. Assessment of Greenhouse Gas Emissions from Electric Buses
The LCA-based analyses conducted for the electric buses took into account the life cycle of the fuel consumed, i.e., the electric energy intended for battery charging, as well as the consumption of the fuel required for in-service bus heating, having an additional negative environmental effect. The results of the GHG emissions calculations for 12 m electric buses, based on real-life data (Table 2), broken down into each month of 2022, are provided in Figure 5. As shown in Figure 5, the highest emissions from diesel fuel are generated in winter, which is related to the highest consumption of this fuel for heating in this period. The GHG emissions are worse in winter because of heating. The GHG emission determinants pertaining to the 12 m electric buses, covering January 2022, are shown in Figure 6.
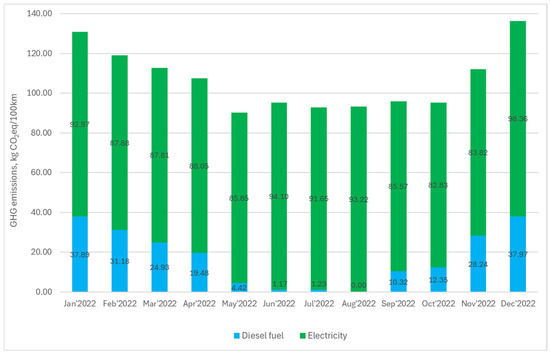
Figure 5.
Greenhouse gas emissions from 12 m electric buses broken down by months of 2022. Source: authors’ own compilation.
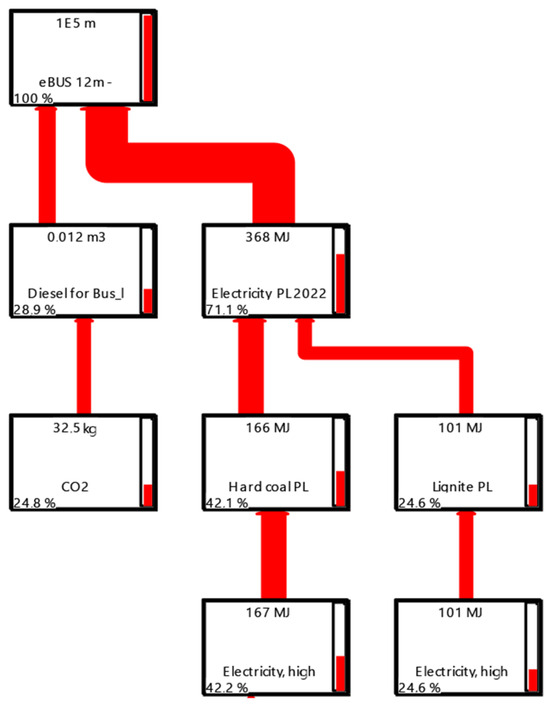
Figure 6.
Determinants of GHG emissions for 12 m electric buses in January 2022. Source: authors’ own compilation.
Following the LCA-based analyses conducted under the study it has been established that the main determinant of GHG emissions for electric buses (Figure 6) is the electricity used for battery charging. It should be noted that the considerable share of this fuel type in the total GHG emissions is due to the fact that the analyses comprised energy from the power grid based on the Polish 2022 energy mix.
4.3. Greenhouse Gas Emissions Assessment from Electric Buses and Diesel Fuel Buses with Euro 6 Standards
On account of the municipal transport company’s plans to purchase new electric buses and to gradually phase out Euro 5 and Euro 5 EEV-compliant diesel buses in favour of internal combustion engine vehicles conforming with the Euro 6 standard, a comparison of mean GHG emission rates established for the entire analysed year of 2022 in a breakdown into Euro 6 diesel buses (DFs) and electric buses (BEVs) is provided in Figure 7.
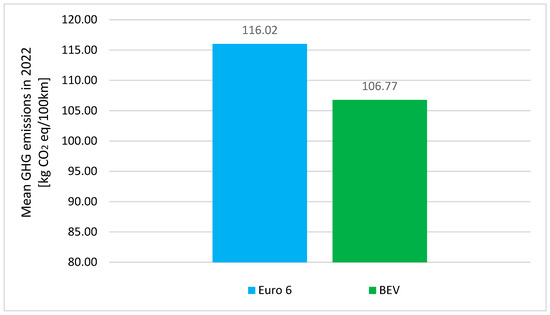
Figure 7.
Mean GHG emissions from Euro 6-complaint diesel engine (DF) and electric (BEV) 12 m buses for the entire analysed year of 2022. Source: authors’ own compilation.
Based on the GHG emission rates established for the Euro 6 standard-compliant diesel buses (Figure 3) and electric buses (Figure 5), it has been found that in winter months, e.g., December and January, the GHG emissions generated by electric buses are actually greater. This is primarily due to the fact that diesel fuel consumption for heating in electric buses has been taken into account in the LCA-based analyses. However, analysis of the mean GHG rates established for the entire year 2022 (Figure 7) shows that electric buses produced 7.97% less of these emissions.
4.4. Impact of RES Share in Energy Mix on the GHG Emissions of the Electric Buses
As per the assumptions formulated in the documents of Poland’s Energy Policy Until 2040 [36] and National Air Protection Programme [37], the importance of renewable energy sources is expected to grow steadily in the coming years, reaching a share of almost 40% in the structure of national electricity consumption in 2040 [36]. This will become possible primarily due to high-end solar energy (PV panels) as well as on-shore and off-shore wind energy (wind power plants) systems which, given local economic and technical conditions, show the best prospects for further development. Moreover, according to documents, the current EU regulations put an obligation on Poland to have reached a 14% share of renewable energy in transport by 2030 [36]. The volume of green electricity used to power vehicles, including buses, depends on the RES fraction in the energy mix used by the electric power industry. The projection of electricity production from RESs, as per the assumptions of the Energy Outlook for Poland until 2040 [36], is presented in Table 4. The measures implemented in Poland with respect to the development of RESs are aimed, among other purposes, at reducing the carbon intensity of the entire energy sector and increasing energy independence from external energy supplies. In follow-up to the EU countries entering into the Kyoto Protocol [38], the European Council agreed upon the 3 × 20 package for reducing greenhouse gas emissions by 20%, increasing energy efficiency by 20%, and increasing energy production from renewable sources by 20% [39]. Then the EU adopted directives and a regulation altogether referred to as the climate and energy package, a crucial element of which is the RES-related solutions [40]. Passed by the European Council in 2019, the commitment to pursue a common goal of climate neutrality by 2050 as well as the European Commission’s announcement of the European Green Deal [8] are expected to trigger significant reductions in greenhouse gas emissions over the next 30 years. All of the EU’s initiatives are meant to accelerate the energy transition in the member states and lead to a reduction in net domestic GHG emissions of at least 55% by 2030, predominantly through the upgrading and development of energy infrastructure and a significant increase in the share of RESs in the energy mix, i.e., in the structure of energy production and consumption in individual EU countries.

Table 4.
RES-based electric energy production in Poland. Source: authors’ own compilation based on [36].
Considering the aforementioned EU initiatives and with reference to the information acquired from the analysed municipal transport company announcing a move to a new seat in the near future, where advanced infrastructure for electric bus charging using solar energy is expected to be installed, the study included analyses of the potential greenhouse gas emissions attributable to electric buses powered partially from RESs. The analyses and calculations were based on 2022 data concerning a 12 m long electric bus (Table 2). The electricity production was adopted by taking all energy sources in Poland in 2022 into account (Table 3), as well as the assumed gradual change in the share of RESs in the energy mix used for bus charging from 0% to 25%, 50%, 75%, and finally 100%. The results thus obtained for the GHG emissions from the 12 m electric bus using the LCA method, relative to the RES share, are shown in Table 5 and in Figure 8 and Figure 9.

Table 5.
Potential GHG emissions from a 12 m electric bus relative to the share of RESs. Source: authors’ own compilation.
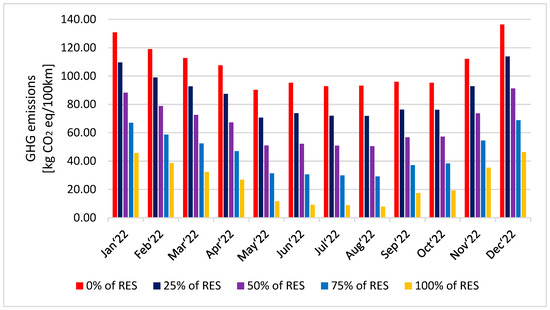
Figure 8.
GHG emissions from a 12 m electric bus relative to the share of RESs. Source: authors’ own compilation.
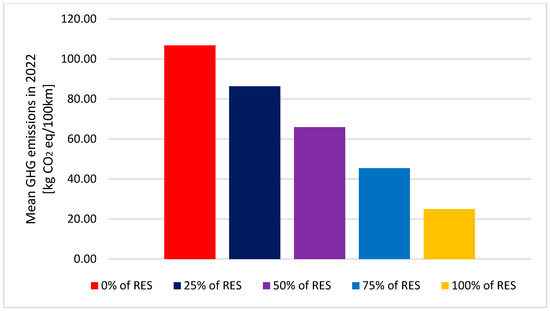
Figure 9.
Mean GHG emissions from a 12 m electric bus relative to the share of RESs for the entire analysed year of 2022. Source: authors’ own compilation.
Adding renewable energy sources to the energy mix used for charging of the batteries of electric buses brought a reduction in the total GHG emissions over the entire 2022 (Figure 9). For the RES fractions of 25%, 50%, and 75% in the energy mix, emission reductions of approx. 19%, 38%, and 57% were established, respectively. For an energy mix entirely derived from RESs, the reduction in emissions came to ca. 76% compared to Poland’s 2022 energy mix (Table 3). The GHG emission determinants for the 12 m electric buses, considering the RES share in the energy mix at the levels of 25%, 50%, 75%, and 100%, are shown in Figure 10.
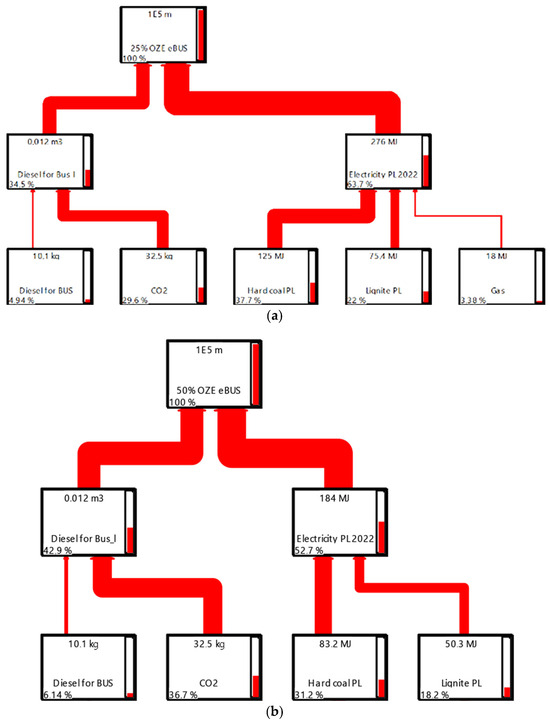
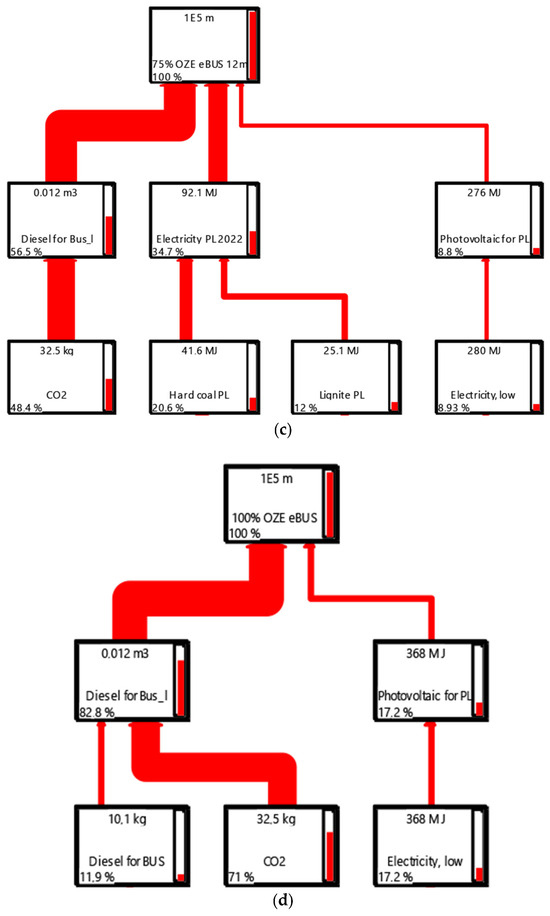
Figure 10.
Determinants of GHG emissions from a 12 m electric bus relative to the share of RES: (a) 25%, (b) 50%, (c) 75%, (d) 100%. Source: authors’ own compilation.
5. Results and Discussion
Based on real-life data (Table 2) concerning the electricity consumption by electric buses in each month of 2022, the total energy consumption of all buses was determined. The total 2022 electricity consumption thus calculated for the 12 m buses came to 610,573.60 kWh. The fact of providing a 25% share of renewable energy sources, namely solar power, in the energy mix used for charging of the 12 m electric buses, which in the case of the chosen municipal transport company corresponds to 152,643.4 kWh of energy obtained from renewable sources, will reduce the greenhouse gas emissions from the buses in operation by approx. 19%. In the event that this fraction increases to 50%, meaning that the company is capable of obtaining 305,286.8 kWh from RESs, the GHG emission reduction for the buses in service will be approx. 38%. Assuming that 100% of the energy mix used for charging the 12 m electric buses is derived from renewable energy sources (solar power), the GHG emissions attributable to the buses in operation may drop by 76%. The aggregate results of the calculations based on the assumption that the RES share in the energy mix used for bus charging is to change from 0% to 25%, 50%, 75%, and 100% are summarised in Table 6. The 100% share of renewable energy sources in the energy mix corresponds to the premises underlying the intent to implement carbon-neutral public bus transport in cities to reduce indirect emissions.

Table 6.
GHG emissions from 12 m electric buses relative to the share of RESs. Source: authors’ own compilation.
Having analysed the results provided in Table 6, the authors have found that each time the fraction of renewable energy, namely solar power, in the energy mix increases by 25%, the greenhouse gas emissions attributable to a single electric bus are reduced by approx. 19%. Table 6 also contains “multiplication factor” values which take into account the percentage reduction in greenhouse gas emissions relative to the RES share in the energy mix. The “multiplication factors” proposed can be applied by municipal transport companies or any other transport operators, as they conduct cost–benefit analyses against their plans to increase the RES share in the energy mix used for charging electric buses, so as to satisfy the legitimacy criteria for the implementation of carbon-neutral public bus transport in cities.
In order to determine the value of the RES coefficient for solar energy used to charge electric buses based on the data from Table 6, a graph presented in Figure 11 was developed. Figure 11 shows the values of the determined multiplier (Table 6) depending on the assumed percentage share of renewable energy sources in the form of solar energy. The determined value of the slope coefficient of the straight line presented in Figure 1, amounting to “−0.0076”, was adopted as the value of the RES coefficient for solar energy used to charge electric buses.
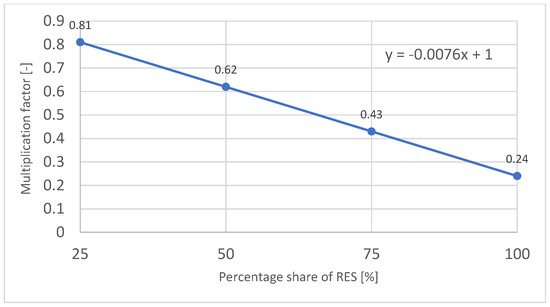
Figure 11.
Values of the determined multiplier depending on the assumed percentage share of RESs in the form of solar energy. Source: authors’ own compilation.
6. Summary and Conclusions
Some of the findings arising from the study discussed in this paper are that, with regard to the environmental impact assessment of the greenhouse gas emissions attributable to public bus transport, one should apply the LCA methodology when conducting analyses, and they should comprise both the life cycle of all the fuels consumed by vehicles and the actual operation of buses (direct and indirect emissions). The study comprised an assessment of the greenhouse gas emissions produced by the buses operated by a chosen public transport company in Poland. Additionally, electric buses powered by renewable energy sources were also examined in terms of their GHG emissions. Based on the relevant calculations and analyses concerning the greenhouse gas emissions from public bus transport, the following conclusions have been formulated:
- The greatest benefits in terms of greenhouse gas emission reduction can be achieved in public bus transport by replacing conventionally powered vehicles with electric vehicles, yet only under the condition that the energy consumed to power them comes from renewable energy sources. Adding renewable energy sources to the energy mix used for charging electric bus batteries reduces total GHG emissions. For the RES fractions of 25%, 50%, and 75% in the energy mix, emission reductions of approx. 19%, 38%, and 57% have been achieved, respectively. For an energy mix entirely derived from RESs, the reduction in emissions comes to ca. 76% vis-à-vis Poland’s energy mix in 2022.
- Due to significant additional greenhouse gas emissions, especially in the winter months, electric buses should be operated without diesel heating systems. Unfortunately, such heating solutions in electric buses are currently often used in Poland, due to the lower purchase price of the bus. Currently, an alternative may be electric buses with modern electric heating systems combined with a heat pump.
- Currently used electric buses in Poland are charged with an energy mix that mainly comes from coal-fired power plants. This unfavourable situation should improve, because according to the adopted assumptions of the energy policy, the importance of renewable energy sources (RESs) in Poland is to systematically grow in the coming years, reaching a 39.5% share in the structure of domestic electricity consumption in 2040.
Author Contributions
Conceptualization, P.F.; methodology, P.F.; software, P.F. and D.B.; validation, P.F. and D.B.; formal analysis, P.F.; investigation, P.F.; resources, P.F.; data curation, P.F.; writing—original draft preparation, P.F.; writing—review and editing, P.F. and D.B.; visualization, P.F.; supervision, D.B.; project administration, P.F.; funding acquisition, P.F. All authors have read and agreed to the published version of the manuscript.
Funding
This research received no external funding.
Data Availability Statement
The data presented in this study are available on request from the corresponding author.
Conflicts of Interest
The authors declare no conflicts of interest.
References
- European Environment Agency. Trends and Projections in Europe 2023; EEA Report No. 7/2023; European Environment Agency: Copenhagen, Denmark, 2023. [Google Scholar]
- Road Transport in Poland in 2020 and 2021. Statistical Analyses Central Statistical Office, Warsaw-Szczecin, 2023. Available online: https://stat.gov.pl/en/topics/transport-and-communications/transport/road-transport-in-poland-in-the-years-2020-and-2021,5,7.html (accessed on 4 March 2025).
- Manisalidis, I.; Stavropoulou, E.; Stavropoulos, A.; Bezirtzoglou, E. Environmental and Health Impacts of Air Pollution: A Review. Front. Public Health 2020, 8, 505570. [Google Scholar]
- Poland Air Quality Management—Final Report. Document of the World Bank, Report No: AUS0000585, 2019. Available online: https://openknowledge.worldbank.org/server/api/core/bitstreams/7d982fea-4878-5fef-89a0-a4b2ff6c7dd0/content (accessed on 4 March 2025).
- Europe’s Air Quality Status 2024. Available online: https://www.eea.europa.eu/publications/europes-air-quality-status-2024 (accessed on 20 January 2025).
- European Environment Agency. Environmental Noise in Europe—2020; EEA Report No 22/2019; European Environment Agency: Copenhagen, Denmark, 2019. [Google Scholar]
- Paris Climate Change Agreement. 2016. Available online: https://unfccc.int/process-and-meetings/the-paris-agreement/the-paris-agreement (accessed on 20 January 2025).
- Communication from the Commission COM(2019) 640_final of 11 December 2019, European Green Deal, 2019. Available online: https://eur-lex.europa.eu/resource.html?uri=cellar:b828d165-1c22-11ea-8c1f-01aa75ed71a1.0002.02/DOC_1&format=PDF (accessed on 4 March 2025).
- Directive 2019/1161 of the European Parliament and of the Council (EU) of 20 June 2019 Amending Directive 2009/33/EC on the Promotion of Clean and Energy-Efficient Road Transport Vehicles. Available online: https://eur-lex.europa.eu/eli/dir/2019/1161/oj/eng (accessed on 4 March 2025).
- Act of 11 January 2018 on Electromobility and Alternative Fuels. Journal of Laws of 2018, Item 317 (Journal of Laws of 2021, Item 110, as Amended), 2018. Available online: https://isap.sejm.gov.pl/isap.nsf/download.xsp/WDU20180000317/U/D20180317Lj.pdf (accessed on 4 March 2025).
- Official Announcement of the Speaker of the Sejm of the Republic of Poland Act of 10 January 2023 Releasing the Uniform Text of the Act on Electromobility and Alternative Fuels (Journal of Laws of 2023, Item 875), 2023. Available online: https://isap.sejm.gov.pl/isap.nsf/download.xsp/WDU20230000875/T/D20230875L.pdf (accessed on 4 March 2025).
- Report of the European Automobile Manufacturers’ Association (ACEA). Available online: https://www.acea.auto/publication/the-automobile-industry-pocket-guide-2023-2024/ (accessed on 4 March 2025).
- Report of the European Automobile Manufacturers’ Association (ACEA). Report Buses Registered over the Year 2022 by Fuel Type. Available online: https://www.acea.auto/files/ACEA_buses_by_fuel_type_full-year-2022.pdf (accessed on 4 March 2025).
- European Commission. European Alternative Fuels Observatory. Available online: https://alternative-fuels-observatory.ec.europa.eu/transport-mode/road/european-union-eu27/vehicles-and-fleet (accessed on 20 January 2025).
- PN-EN ISO 14040:2009; Environmental Management—Life Cycle Assessment—Principles and Framework. ISO: Geneva, Switzerland, 2009.
- PN-EN ISO 14044:2006; Environmental Management—Life Cycle Assessment—Requirements and Guidelines. ISO: Geneva, Switzerland, 2006.
- Ercan, T.; Tatari, O. A hybrid life cycle assessment of public transportation buses with alternative fuel options. Int. J. Life Cycle Assess. 2015, 20, 1213–1231. [Google Scholar]
- Correa, G.; Muñoz, P.M.; Rodriguez, C.R. A comparative energy and environmental analysis of a diesel. hybrid. hydrogen and electric urban bus. Energy 2019, 187, 115906. [Google Scholar] [CrossRef]
- Moro, A.; Helmers, E. A new hybrid method for reducing the gap between WTW and LCA in the carbon footprint assessment of electric vehicles. Int. J. Life Cycle Assess. 2015, 22, 4–14. [Google Scholar]
- Nordelöf, A.; Messagie, M.; Tillman, A.; Ljunggren Söderman, M.; Van Mierlo, J. Environmental impacts of hybrid. plug-in hybrid. and battery electric vehicles—What can we learn from life cycle assessment? Int. J. Life Cycle Assess. 2014, 19, 1866–1890. [Google Scholar]
- Casals, L.C.; Martinez-Laserna, E.; García, B.A.; Nieto, N. Sustainability analysis of the electric vehicle use in Europe for CO2 emissions reduction. J. Clean. Prod. 2016, 127, 425–437. [Google Scholar]
- Hawkins, T.R.; Singh, B.; Majeau-Bettez, G.; Strømman, A.H. Comparative Environmental Life Cycle Assessment of Conventional and Electric Vehicles. J. Ind. Ecol. 2013, 17, 53–64. [Google Scholar]
- Kawamoto, R.; Mochizuki, H.; Moriguchi, Y.; Nakano, T.; Motohashi, M.; Sakai, Y.; Inaba, A. Estimation of CO2 Emissions of Internal Combustion Engine Vehicle and Battery Electric Vehicle Using LCA. Sustainability 2019, 11, 2690. [Google Scholar] [CrossRef]
- Nordelöf, A.; Romare, M.; Tivander, J. Life cycle assessment of city buses powered by electricity, hydrogenated vegetable oil or diesel. Transp. Res. Part D Transp. Environ. 2019, 75, 211–222. [Google Scholar] [CrossRef]
- Final Report for the European Commission, DG Climate Action. Determining the Environmental Impacts of Conventional and Alternatively Fuelled Vehicles Through LCA. Available online: https://climate.ec.europa.eu/system/files/2020-09/2020_study_main_report_en.pdf (accessed on 4 March 2025).
- Burchart-Korol, D.; Folęga, P. Impact of road transport means on climate change and human health in Poland. Promet—Traffic Transp. 2019, 31, 195–204. [Google Scholar] [CrossRef][Green Version]
- Burchart-Korol, D.; Folęga, P. Environmental footprints of current and future electric battery charging and electric vehicles in Poland. Transp. Probl. 2020, 15, 61–71. [Google Scholar]
- Swiss Centre for Life Cycle Inventories. Ecoinvent 2023 Ecoinvent Database V 3.9. 2025. Available online: www.ecoinvent.org (accessed on 4 January 2025).
- IPCC—Intergovernmental Panel on Climate Change, IPCC Fifth Assessment Report. The Physical Science Basis. Available online: http://www.ipcc.ch (accessed on 4 January 2025).
- CO2, SO2, Nox, CO and Total Particulate Matter Emission Rates for Electric Energy, Based on the Information Contained in the National Database on the Emissions of Greenhouse Gases and Other Substances in 2019; National Centre for Emissions Management IOŚ-PIB (KOBiZE): Warsaw, Poland, 2020.
- Emission and Climate Cost Calculator for Means of Public Transport; National Centre for Emissions Management IOŚ-PIB (KOBiZE): Warsaw, Poland, 2020.
- Cost-Benefit Analysis (CBA) of Using Zero-Emission Buses in Providing Public Transport Services Organised by the GZM Metropolis of Upper Silesia and Dąbrowa Basin. Katowice. 2024. Available online: https://bip.metropoliagzm.pl/artykul/34552/132995/analiza-kosztow-i-korzysci-akk (accessed on 4 March 2025).
- Energy Forum, Analyses and Dialogue. Energy Transition in Poland, 2023. Available online: https://www.forum-energii.eu/en/energy-transition-in-poland-2023-edition (accessed on 4 March 2025).
- Ministry of Climate and Environment. Department of Strategies and Analyses, Statistical Information on Electricity, Warsaw, 2023. Available online: https://www.gov.pl/web/klimat/badania-statystyczne (accessed on 4 March 2025).
- Regulation (EU) 2019/1242 of the European Parliament and of the Council of 20 June 2019 Setting CO2 Emission Performance Standards for New Heavy-Duty Vehicles and Amending Regulations (EC) No 595/2009 and (EU) 2018/956 of the European Parliament and of the Council and Council Directive 96/53/EC. Available online: https://eur-lex.europa.eu/eli/reg/2019/1242/oj/eng (accessed on 4 March 2025).
- Poland’s Energy Policy Until 2040. Official Announcement of the Minister of Climate and Environment of 2 March 2021 on the State’s Energy Policy Until 2040. Available online: https://www.gov.pl/web/climate/energy-policy-of-poland-until-2040-epp2040 (accessed on 4 March 2025).
- Update to the National Air Protection Programme Until 2025 (with an Outlook to 2040). Ministry of Climate and Environment, Warsaw, 2021. Available online: https://www.gov.pl/web/klimat/krajowy-program-ochrony-powietrza (accessed on 4 March 2025).
- Kyoto Protocol to the United Nations Framework Convention on Climate Change, Drawn up in Kyoto on 11 December 1997 (Journal of Laws 2005. No. 203. Item 1684), Council Decision 2002/358/EC of 25 April 2002 Concerning the Approval, on Behalf of the European Community, of the Kyoto Protocol to the United Nations Framework Convention on Climate Change and the Joint Fulfilment of Commitments Thereunder (OJ L 130 of 15 May 2002). Available online: https://isap.sejm.gov.pl/isap.nsf/download.xsp/WDU20052031684/O/D20051684.pdf (accessed on 4 March 2025).
- Conclusions of the European Council of 8–9 March 2007. The Conclusions Contained Commitments Later to Be Referred to as 3 × 20. 2007. Available online: https://cire.pl/pliki/2/PKEE-Raport%202030_Raport_czastkowy_4_2008-06-19.pdf (accessed on 4 March 2025).
- Directive 2009/28/EC of the European Parliament and of the Council of 23 April 2009 on the Promotion of the Use of Energy from Renewable Sources and Amending and Subsequently Repealing Directives 2001/77/EC and 2003/30/EC. 5 June 2009, pp. 16–62, Typically Referred to as Renewable Energy Directive (RED). Available online: https://eur-lex.europa.eu/legal-content/EN/TXT/PDF/?uri=CELEX:32009L0028 (accessed on 4 March 2025).
Disclaimer/Publisher’s Note: The statements, opinions and data contained in all publications are solely those of the individual author(s) and contributor(s) and not of MDPI and/or the editor(s). MDPI and/or the editor(s) disclaim responsibility for any injury to people or property resulting from any ideas, methods, instructions or products referred to in the content. |
© 2025 by the authors. Licensee MDPI, Basel, Switzerland. This article is an open access article distributed under the terms and conditions of the Creative Commons Attribution (CC BY) license (https://creativecommons.org/licenses/by/4.0/).