1. Introduction
The cooling characteristic using a cone–column combined heat sink was investigated by Zheng et al. [
1]. A study on the roughness effect in microchannels was performed by Alihosseini et al. [
2]. Khadem et al. [
3] investigated the role of geometrical design in the thermal performance of MCHS. Laminar forced convection of water in the offset strip–fin microchannel network heat sinks was analyzed by Hong and Cheng [
4]. A design with a rib shape and fillet radius was developed, and the thermal performance of MCHS was studied by Derakhshanpour et al. [
5]. The MCHS performance in transverse microchambers when various rib geometries are interrupted was investigated by Chai and Wang [
6]. The thermal change in MCHS as the pin fin height varied was shown by Bhandari and Projapati [
7]. Gan et al. [
8] created a sophisticated microchannel heat sink with impeding jets and dimples to improve heat transfer. A double-layered MCHS, including porous ribs and wavy microchannels for increasing the coolant flow velocity, was designed by Wang et al. [
9]. Ramesh et al. [
10] studied the enhancement of heat transmission in MCHS. Nanofluid flow with the variation of velocity and concentration through MCHS was observed by Bhattacharya and Samanta [
11].
Modified heat plus mass fluxes for nonlinear thermal radiation in three-dimensional Eyring–Powell nanofluid were investigated by Muhammad et al. [
12] with mathematical analysis. Xu et al. [
13] demonstrated an improvement in heat transport and thermal performance by cutting the baffles of MCHS. Their invention featured cutting baffles on both the top and bottom layers of a double-layered microchannel heat sink (DLMCHS). According to the findings, the top layer’s cutting baffles enhance heat transfer efficiency and thermal strain more than the bottom layer. The thermal performance of silicon-made MCHS was analyzed by Chein and Huang [
14], who used nanofluids as coolants and showed that the thermal performance increased using two particular geometries. The thermal performance and flow characteristics via both the single crosscutting zigzag flow channel (CCZ-HS) and the continuous zigzag flow channel (CZ-HS) were studied by Duangthongsuk and Wongwises [
15], and their study showed that compared to CZ-HS, the thermal performance of CCZ-HS was better. The numerical simulation of thermal performance through MCHS was studied by Farsad et al. [
16] using nanofluids, and their study showed that metal nanofluids had better cooling performance than metal oxide nanofluids because of the metal nanofluids’ thermal conductivity. The advantages and disadvantages of single and hybrid passive methods of MCHS were compared by Japar et al. [
17]. They demonstrated that MCHS adopting the single passive technique was not as efficient at cooling as hybrid MCHS. It also showed that nanoparticles’ type and concentration affected nanofluids’ cooling performance as coolants. The flow visualization, heat transfer characteristics, and pressure drop through MCHS were examined by Kadam and Kumar [
18]. They observed and explained different flow patterns in microchannel geometry and showed the interrelated heat transfer characteristics of single and two phases. Kuppusamy et al. [
19] have examined the flow fields and thermal performance by using numerical simulation through a trapezoidal grooved microchannel heat sink (TGMCHS) and found that the trapezoidal groove’s optimal thermal performance was achieved by widening its maximum width and shortening its minimum width. Li and Kleinstreuer [
20] have shown that nanofluids can perform better thermally with a slight increase in pumping power via the flow in a microchannel. Here, they worked with nanofluids from two models for nanofluids, which have effective thermal conductivity. A periodic right triangle groove in the flow pathway through MCHS was proposed by Saha et al. [
21], and their design was inspired by the heat transfer management used in solar air heaters, which improved the thermal performance of MCHS.
A numerical investigation employing Al
2O
3/water nanofluids to measure the rate of heat transfer via six circular heat sinks was conducted by Kumar and Kumar [
22], and their study showed that Al
2O
3/water nanofluids are better coolants than water as they reduce electrical chip’s heat resistance, surface temperature, and power consumption. The effects of nonuniform heating on the heat flux limits in MCHS were investigated by Ritchey et al. [
23]. First, they worked to find the critical heat flux (CHF) area; by working on it, they discovered that CHF happened if there was an instant sheer upstream of steam that occurred over the heat spot. Waqas et al. [
24] investigated how well a TiO
2/water nanofluid worked as a coolant through six circular MCHS. Also, the thermal performance of TiO
2/water nanofluid and water was compared in their study. Wong and Muezzin [
25] showed that the parallel flow gives better thermal performance, except for a high Reynolds number and channel aspect ratio compared to counterflow. They have conducted this experiment using a double-layer MCHS. For high heat flux spots, an MCHS made of diamond was designed by Yang et al. [
26], and the ammonia’s flow boiling heat transfer properties were studied through it. Their proposed heat sink had great heat removal capacity because diamond substrates have a high heat removal capacity, and boiling ammonia flow has a good heat transfer capacity. Uddin et al. [
27] comprehensively analyzed heat and mass transfer rates associated with a vertical sheet. Their study revealed that both local and average mass transfer rates significantly affected heat generation (varying from 0.005% to 0.004%), thermal buoyancy force (ranging from 0.006% to 0.009%), and solutal buoyancy force (from 0.0027% to 0.0024%). These influences contributed to an enhancement in the respective characteristics of the system. Alatawi [
28] investigated employing a multi-walled carbon nanotube (MWCNT) nanofluid in a circular cavity to enhance heat transmission in a magnetohydrodynamic (MHD) convection system. It emphasized how important internal geometry, magnetic flux, and nanofluid properties are for thermal efficiency. Salhi et al. [
29] optimized heat sink performance by active and passive methods, emphasizing the impact of vortex generators and Al₂O₃ nanoparticles in a microchannel heat sink. The study found that adding Al₂O₃ nanoparticles to pure water improves heat transmission. Higher concentrations improve the Nusselt number and thermal performance, particularly when vortex generators are used. The results showed that a 2% nanoparticle concentration combined with vortex generators produces the highest thermal performance.
MCHSs have gained significance in current thermal management systems due to their capacity to effectively disperse heat in confined areas, which is especially significant in high-performance electronics and other heat-sensitive applications. Despite substantial research in this field, some critical difficulties remain in maximizing MCHS performance. One such problem is the cone–column combination MCHS, which has only been investigated in a few research studies, leaving significant gaps in comprehending its full potential.
The current literature highlights numerous study gaps that need to be addressed to improve MCHS performance further:
- ❖
Only a few research studies have looked into the cone–column combined MCHS, making it a relatively unknown design in thermal management. More research is required to assess the advantages and disadvantages of this geometry when compared to traditional MCHS designs.
- ❖
While MCHS are well known for their excellent heat dissipation, the potential for efficiency improvement, mainly through new designs and sophisticated cooling fluids, has yet to be achieved. Understanding how many factors affect MCHS efficiency remains a significant research gap.
- ❖
Pressure drop substantially affects MCHS performance since excessive pressure loss can lower fluid flow rate and overall cooling efficiency. However, previous research has not adequately addressed viable ways to reduce pressure decrease in MCHS.
- ❖
While nanofluids have shown potential in improving heat transfer qualities, there has been a shortage of extensive research into their role in improving the thermal performance of the cone–column coupled MCHS.
This study aims to fill these gaps by numerically simulating a water–G nanofluid’s flow dynamics and heat transfer properties through a cone–column combination MCHS. However, the main objectives of this research are as follows:
Investigate the influence of controlling parameters (such as fluid velocity, channel shape, and thermal conductivity) on the MCHS’s heat transmission and fluid flow processes for additional insight into the system’s performance.
Analyze the usefulness of water–G nanofluid as a cooling fluid, focusing on its capacity to improve heat transfer compared to standard coolants.
Develope techniques to reduce pressure drop within the MCHS design without sacrificing heat transfer performance.
Determine the highest cooling efficiency possible by combining water–G nanofluid with the cone–column heat sink shape.
This study proposes a novel strategy to enhance MCHS efficiency and thermal performance using advanced nanofluids and an optimized heat sink design by addressing these unresolved scientific issues. The findings are expected to significantly improve the design of more effective and energy-efficient cooling systems for a wide range of high-performance applications.
4. Results and Discussions
The water–G nanofluid’s flow, as well as thermal performance using a cone–column MCHS, are investigated. Using Equation (6), the working fluid’s various inlet velocities are assumed to be 0.085 m/s, 0.255 m/s, 0.426 m/s, 0.511 m/s, 0.596 m/s, and 0.766 m/s, which correspond to
Re values of 100, 300, 500, 600, 700, and 900, respectively. The solid volume fractions of nanoparticles are considered 0.01%, 1%, 2%, 3%, and 4%. The external heat fluxes are 10
4 W/m
2, 10
5 W/m
2, 5 × 10
5 W/m
2, and 10
6 W/m
2. The Reynolds number range (100–900) is typical for microchannel cooling systems in electronic devices, encompassing both laminar and early transition flow regimes often found in low-power applications emphasizing flow dynamics. A heat flux range of 10
4 to 10
6 W/m
2 is crucial for effective cooling in electronics, automotive, and data centers where efficient heat dissipation is essential. These ranges are consistent with practical scenarios and are supported by research from Zheng et al. [
1] and Zhu et al. [
36]. Additionally, with the changes in inlet velocity, the values of friction factor, relative Fanning friction, pressure drop, synergy number, mean Nusselt number, the relative mean Nusselt number, and the effectiveness of temperature improvement are computed. The streamlines are black solid lines in the streamline contour plot, while the color maps show the velocity profile surface plot. Meanwhile, the color maps indicate the contour’s surface, while the isotherms are illustrated by the solid black lines. Using water–G nanofluid, the thermal efficiency improvement is calculated compared to water. Additionally, a comparison is made between the numerical results and those reported in the literature.
4.1. Effect of Reynolds Number
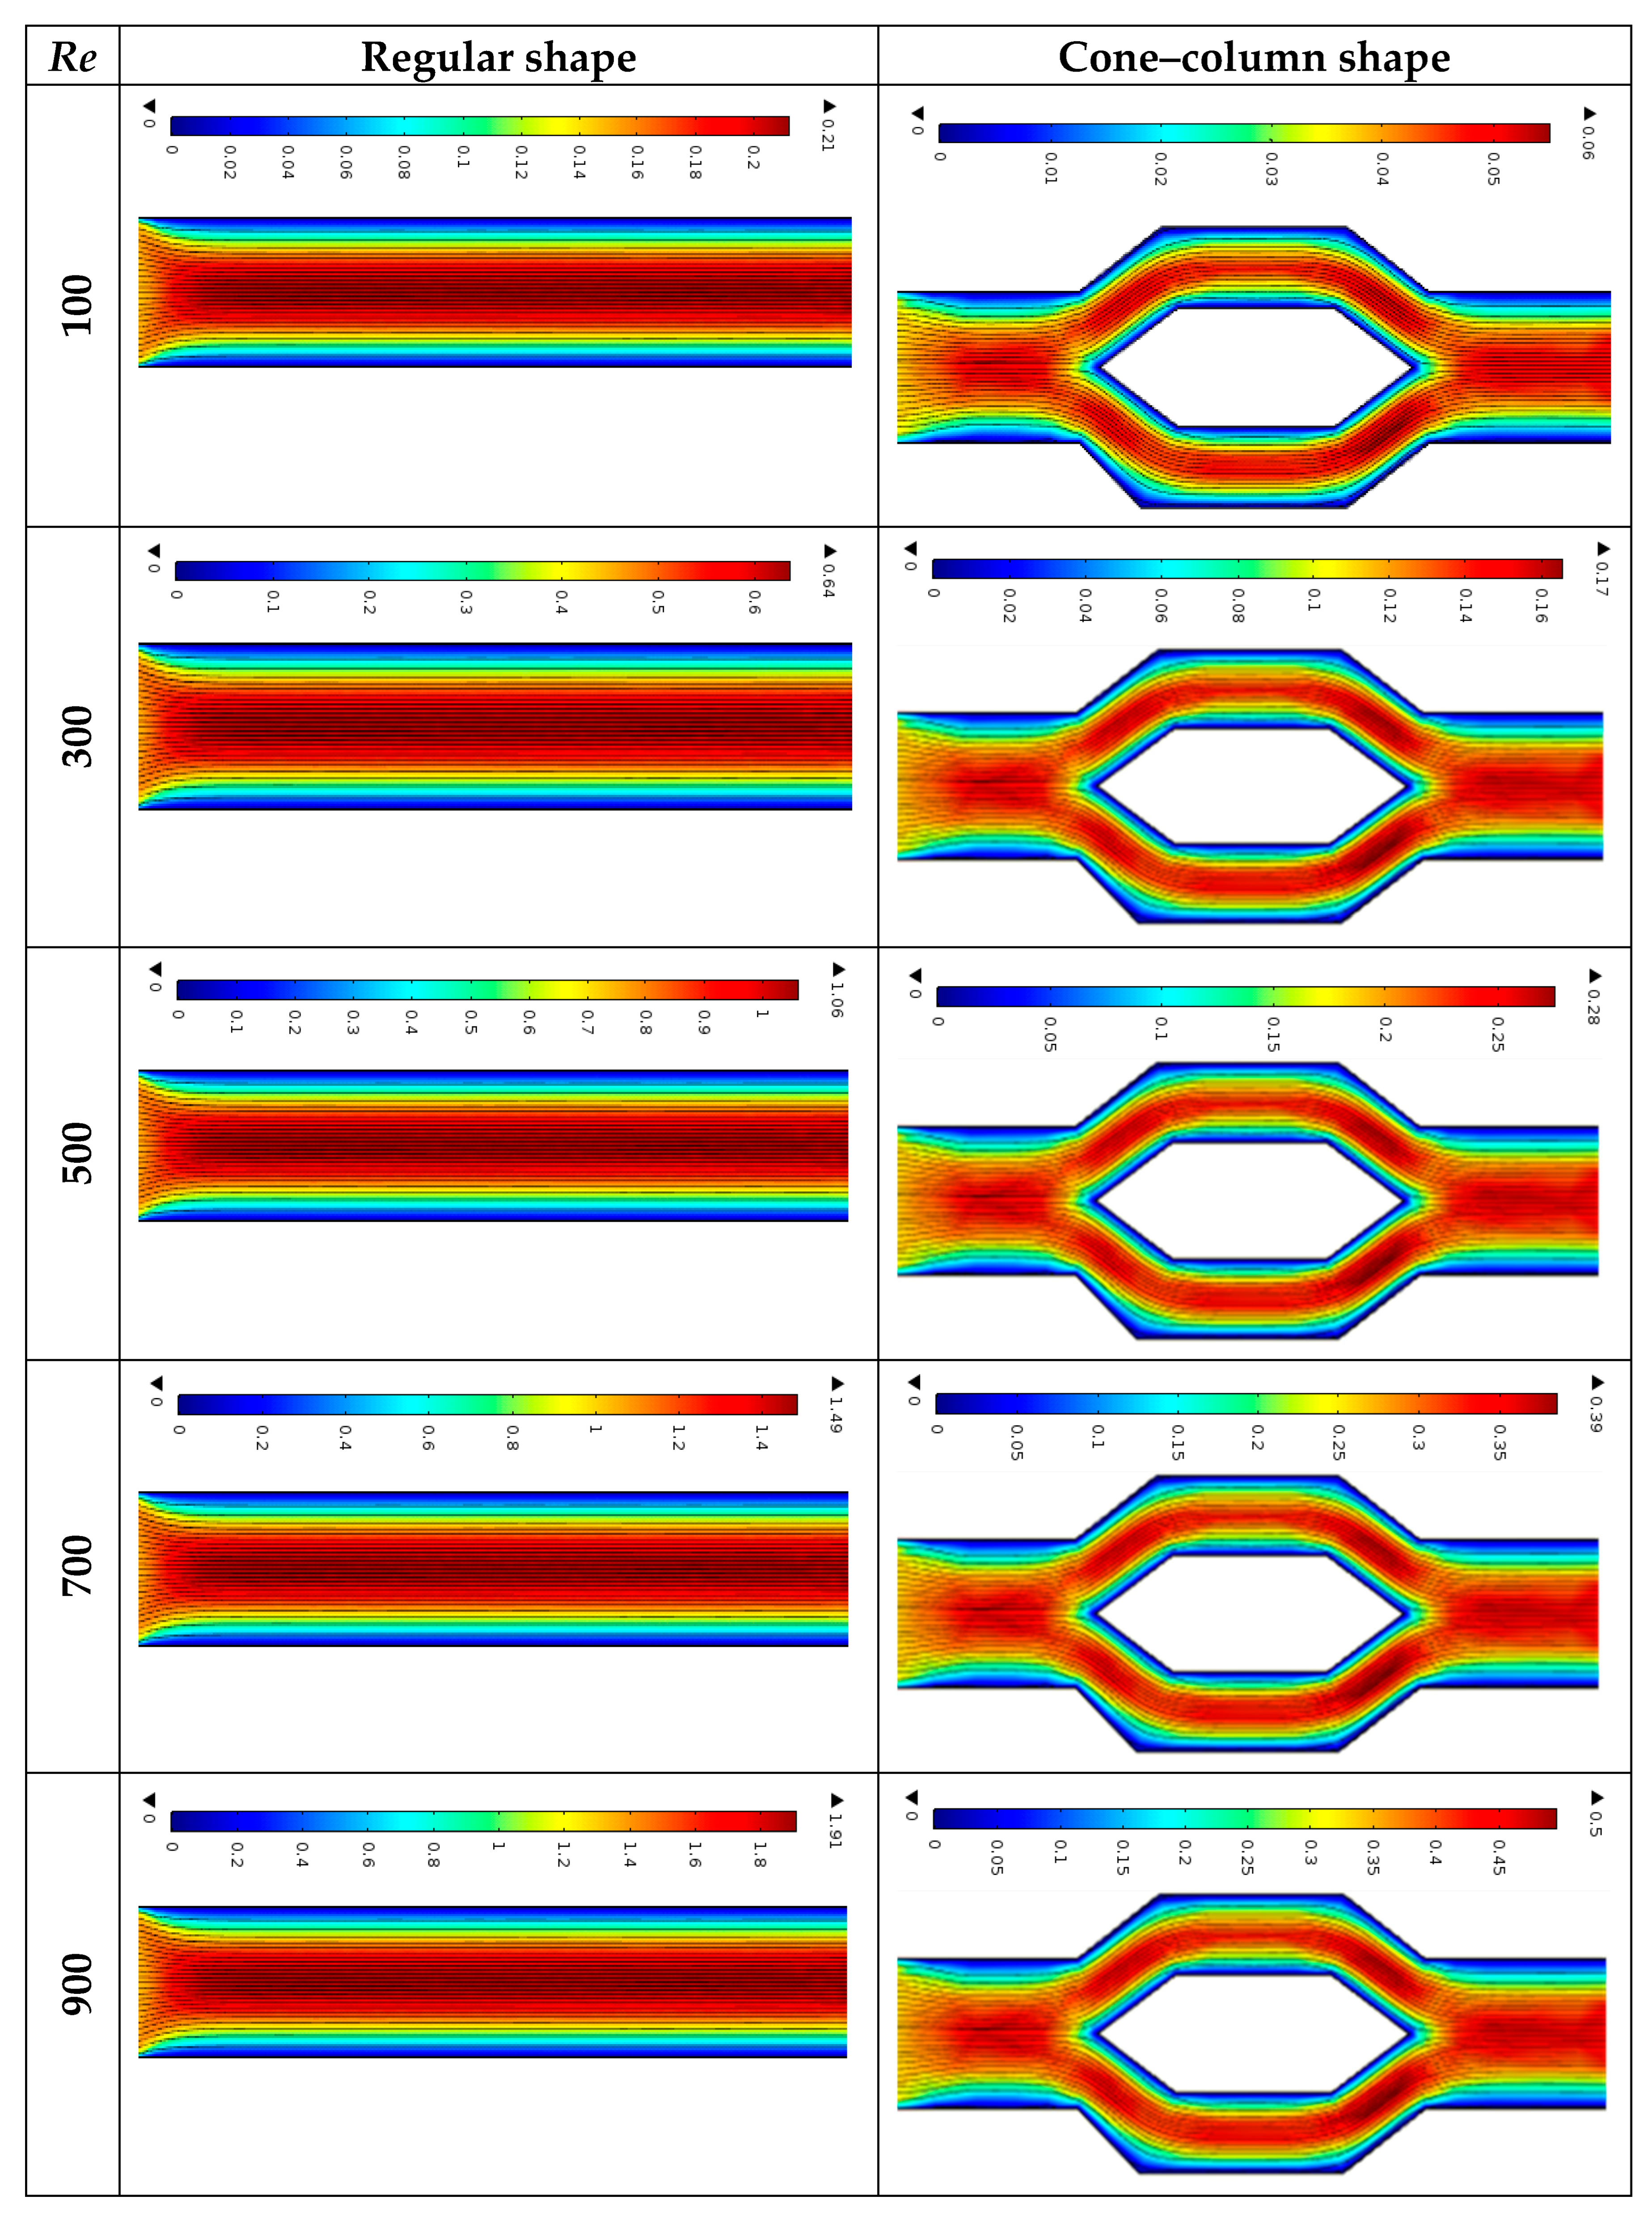
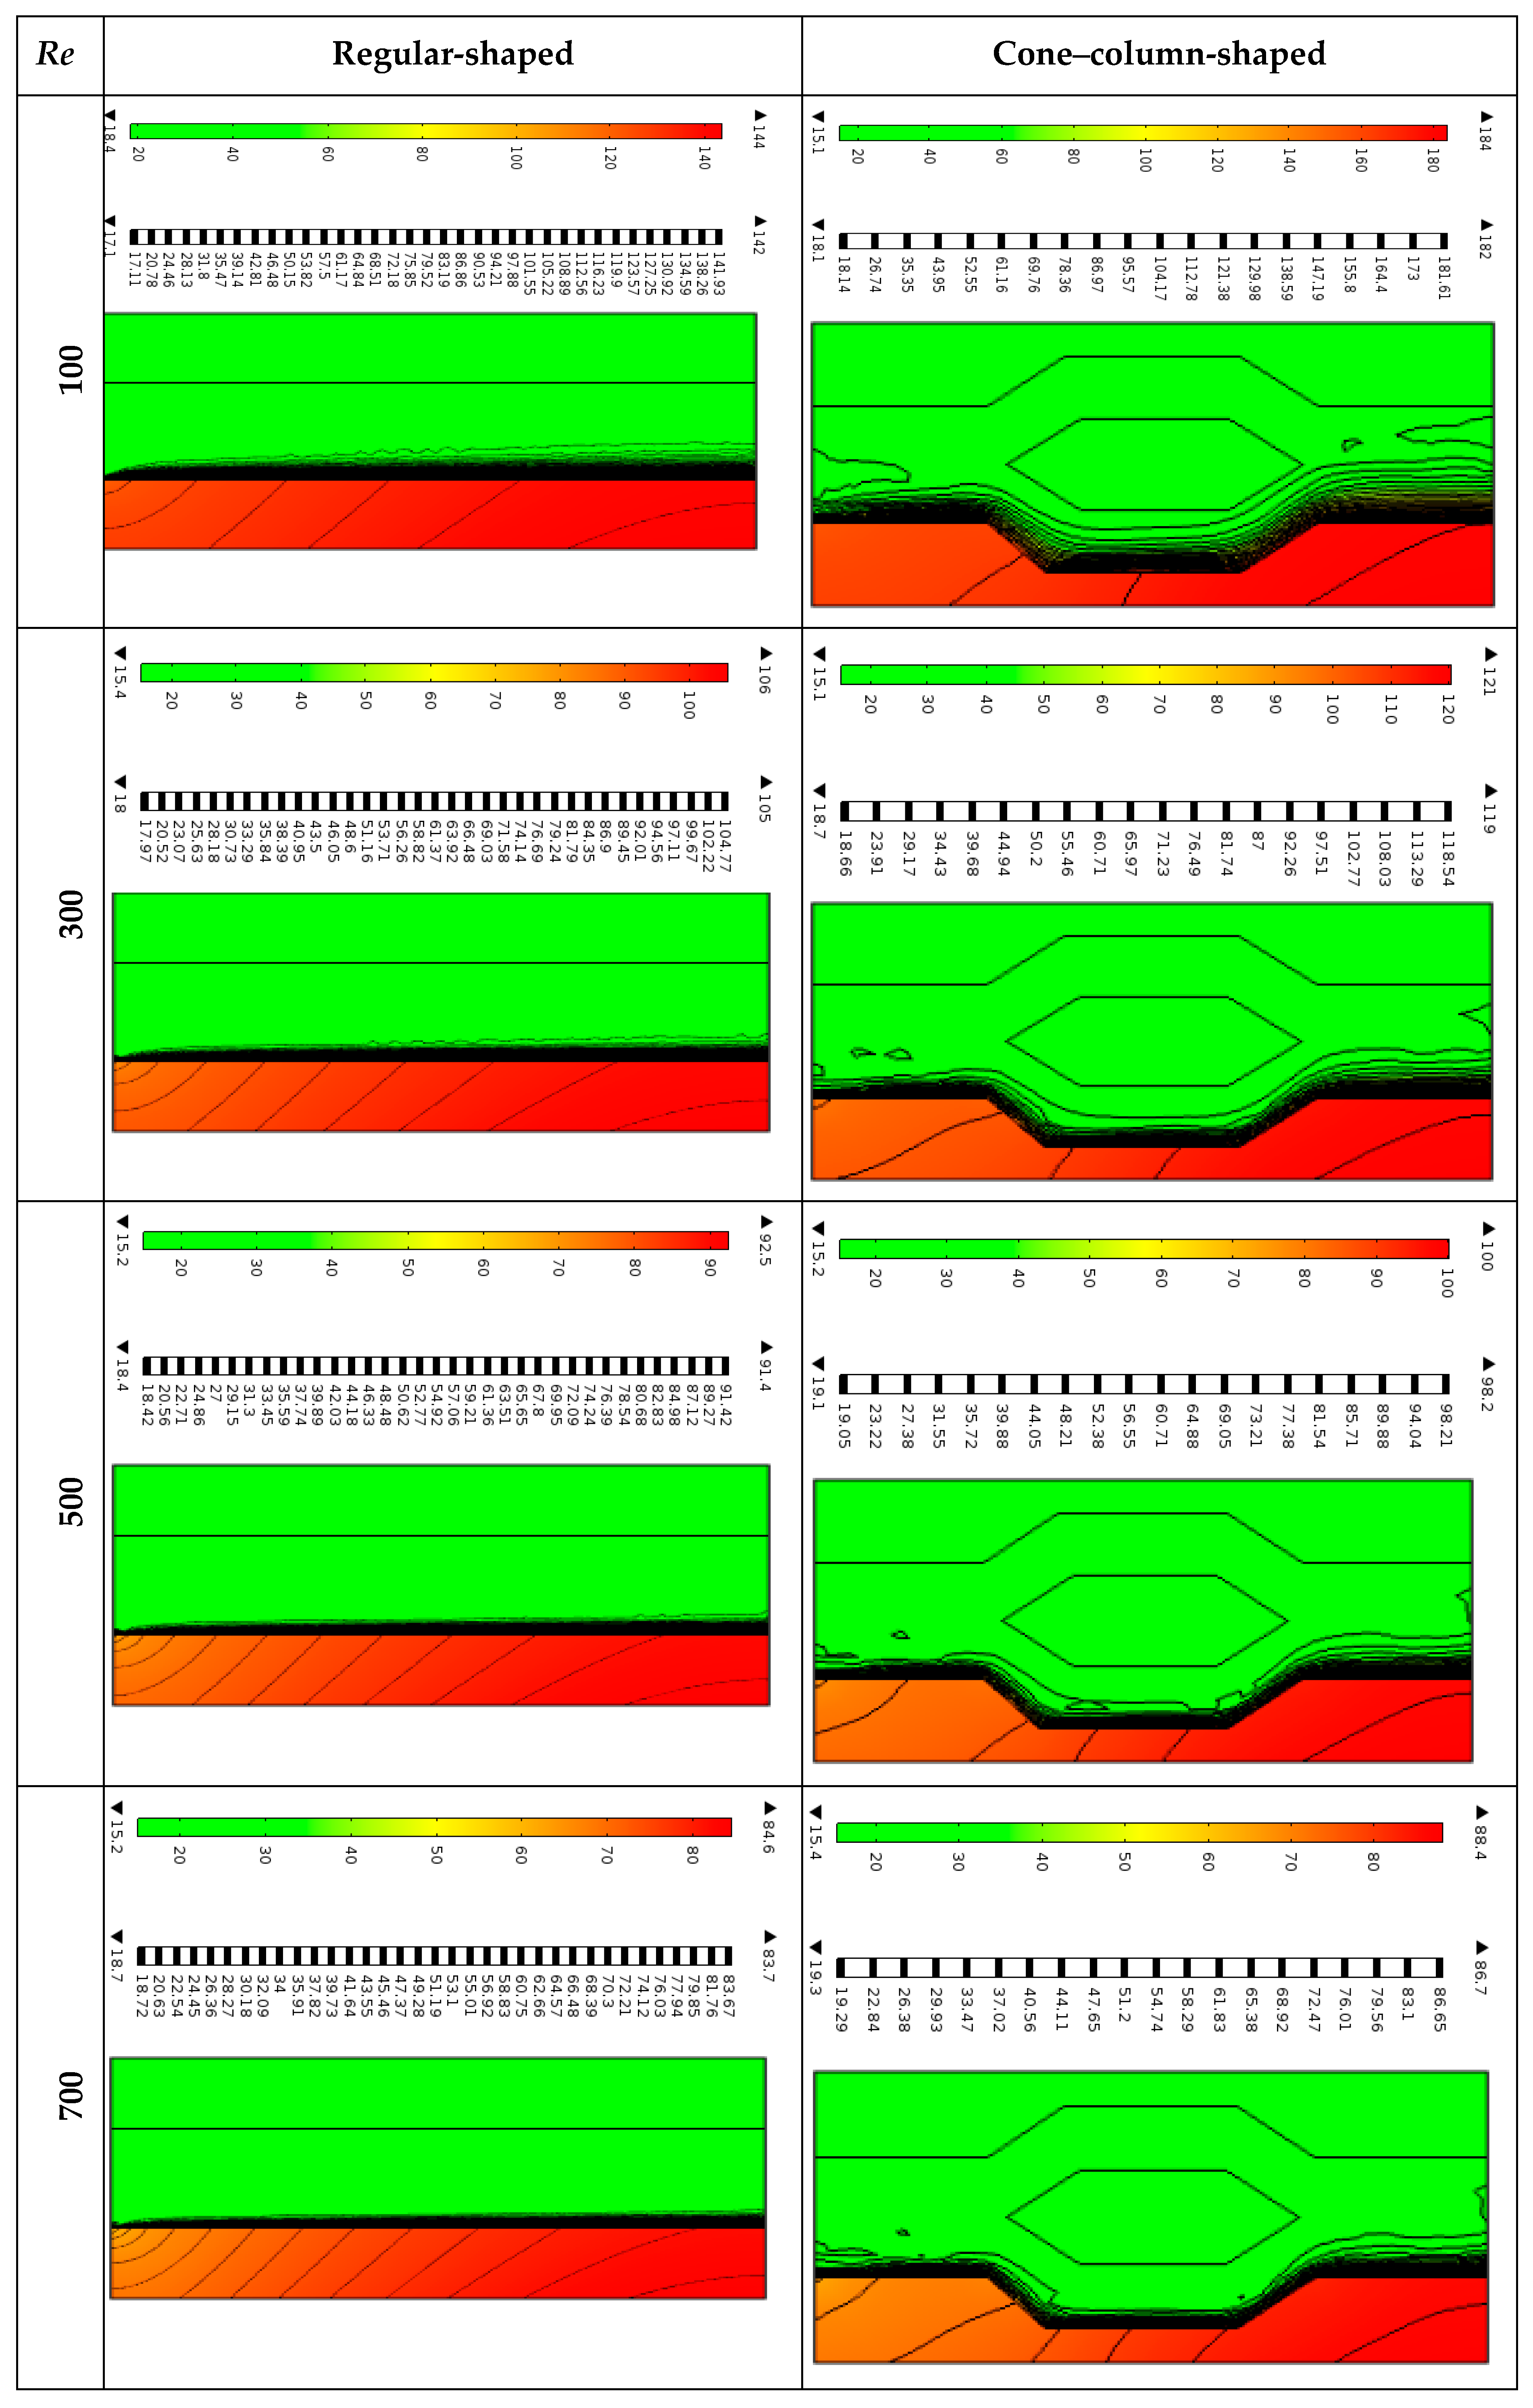
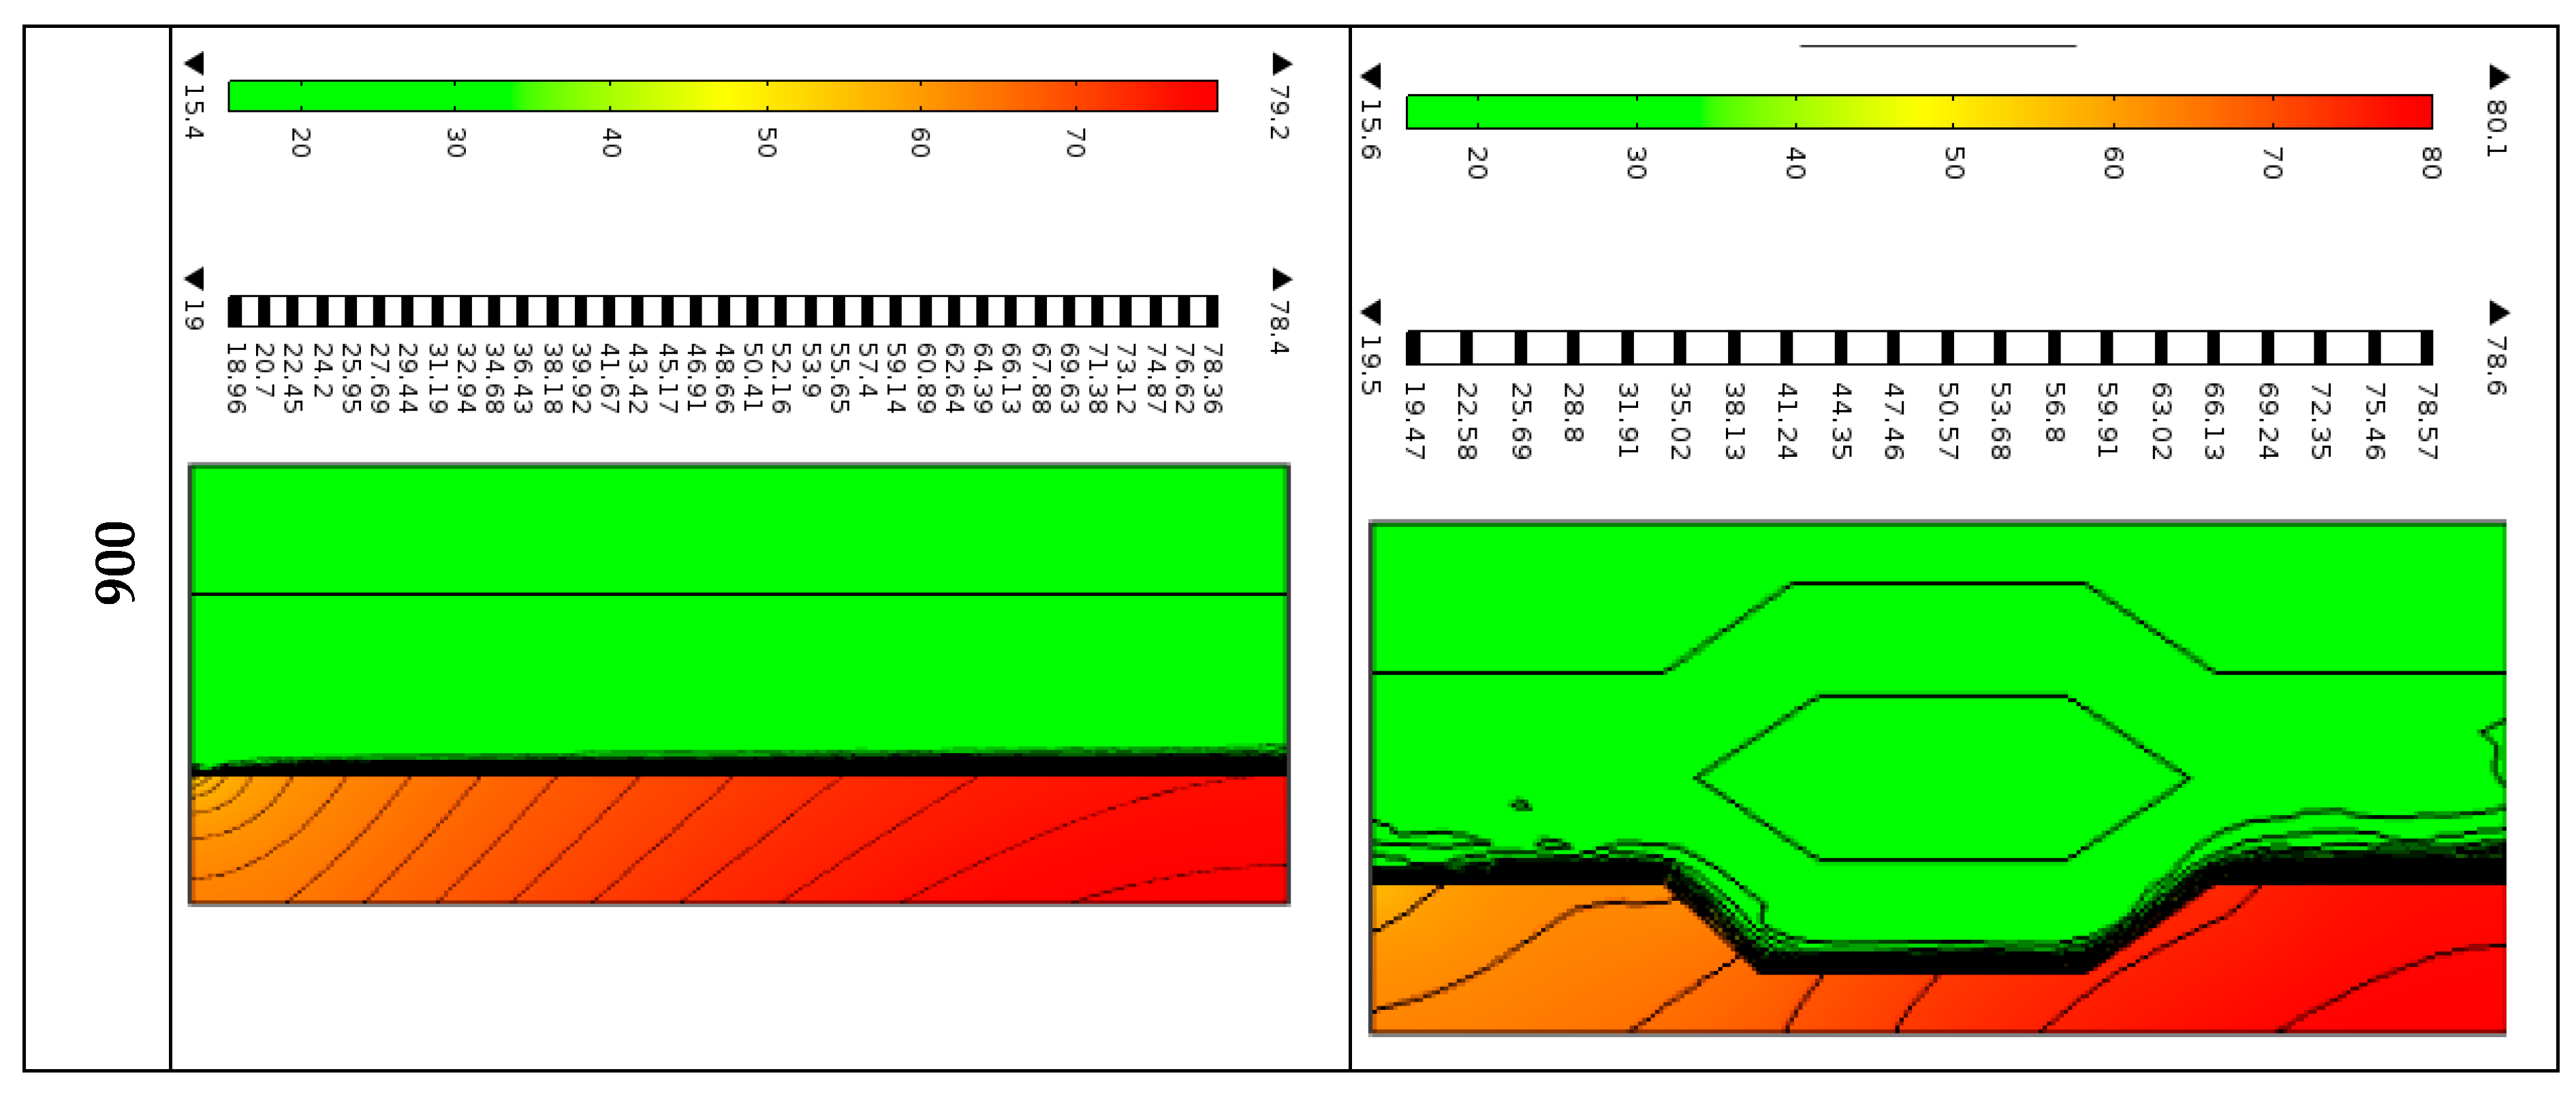
Graphical representations of the numerical results are displayed here. The effect of Reynolds number (100, 300, 500, 700, and 900) on the streamlines and isothermal lines through the MCHS using water–G nanofluid with fixed solid volume fraction of 1% and external heat flux of 10
6 W/m
2 are displayed in
Figure 7 and
Figure 8, respectively. The contour plot indicates the highest values in red and the lowest values in blue. The Reynolds number, a dimensionless measure, categorizes fluid flow as turbulent or laminar, with high advised values greater than 2000 and low indicated values below 2000. For a regular and cone-shaped heat sink, the red color indicates high velocity, while the blue on both the peak and bottom signifies low velocity, as shown in
Figure 7. At
Re = 100, streamlines are smooth but wavy near the cone–column boundaries at the plane surface for regular shape, and the velocity is lower near the cone–column boundaries than around other sink parts. When the
Re is 100, the inlet velocity is only 0.085 m/s, while at a
Re = 900, it reaches 0.766 m/s. However, higher Reynolds number values result in the lowest increased velocity at both geometries’ peaks of the MCHS center and the highest at a flat surface. Consequently, regular-shaped MCHS has a higher velocity than cone–column form. For regular-shaped MCHS, the fluid velocity is low at
Re = 100 and relatively high at
Re = 900. A cone–column-shaped heat sink features undulating streamlines at the cone but flat plane surfaces, resulting in a reduced velocity inside the cone. However, a higher Reynolds number causes a higher velocity at the flat surface and a lower velocity at the cone–column-shaped surface’s peak. Consequently, regular-shaped MCHS’s velocity is higher than that of cone–column forms.
The isothermal lines become smooth at
Re = 100 for regular-shaped and dispersed for cone–column shapes, as illustrated in
Figure 8. When the Reynolds number gradually rises, these lines move smoothly close to the sidewalls of both heat sinks. The colored and black temperature bars represent surface and isothermal line temperatures in degrees Celsius. In both cases, higher temperatures are observed at the bottom solid wall, whereas lower temperatures are observed at the top wall. For regular shape, the nanofluid temperature varies between 17.1 °C to 142.0 °C, while for the cone–column shape, it ranges from 18.1 °C to 182.0 °C at Reynolds number of 100. It also varies from 19.5 °C to 78.6 °C for the regular shape and from 19.0 °C to 78.4 °C for the cone–column grooved shape. From the explanation above, cone–column shapes conduct heat faster than traditional ones.
4.2. Effect of Solid Concentration
The solid volume fraction of water–G nanofluids significantly affects the thermal efficiency of an MCHS. Increasing the fraction from 0.01% to 4% improves the thermal conductivity and heat transfer coefficient, enhancing cooling performance. However, this also increases the viscosity and pressure drop, requiring more pumping power. Graphene nanoparticles enhance heat transfer and energy efficiency at 1% and 3% of solid volume fractions. As the volume fraction increases from 0.01% to 4%, the water–graphene nanofluid’s thermal conductivity improves, facilitating heat transfer and increased thermal efficiency.
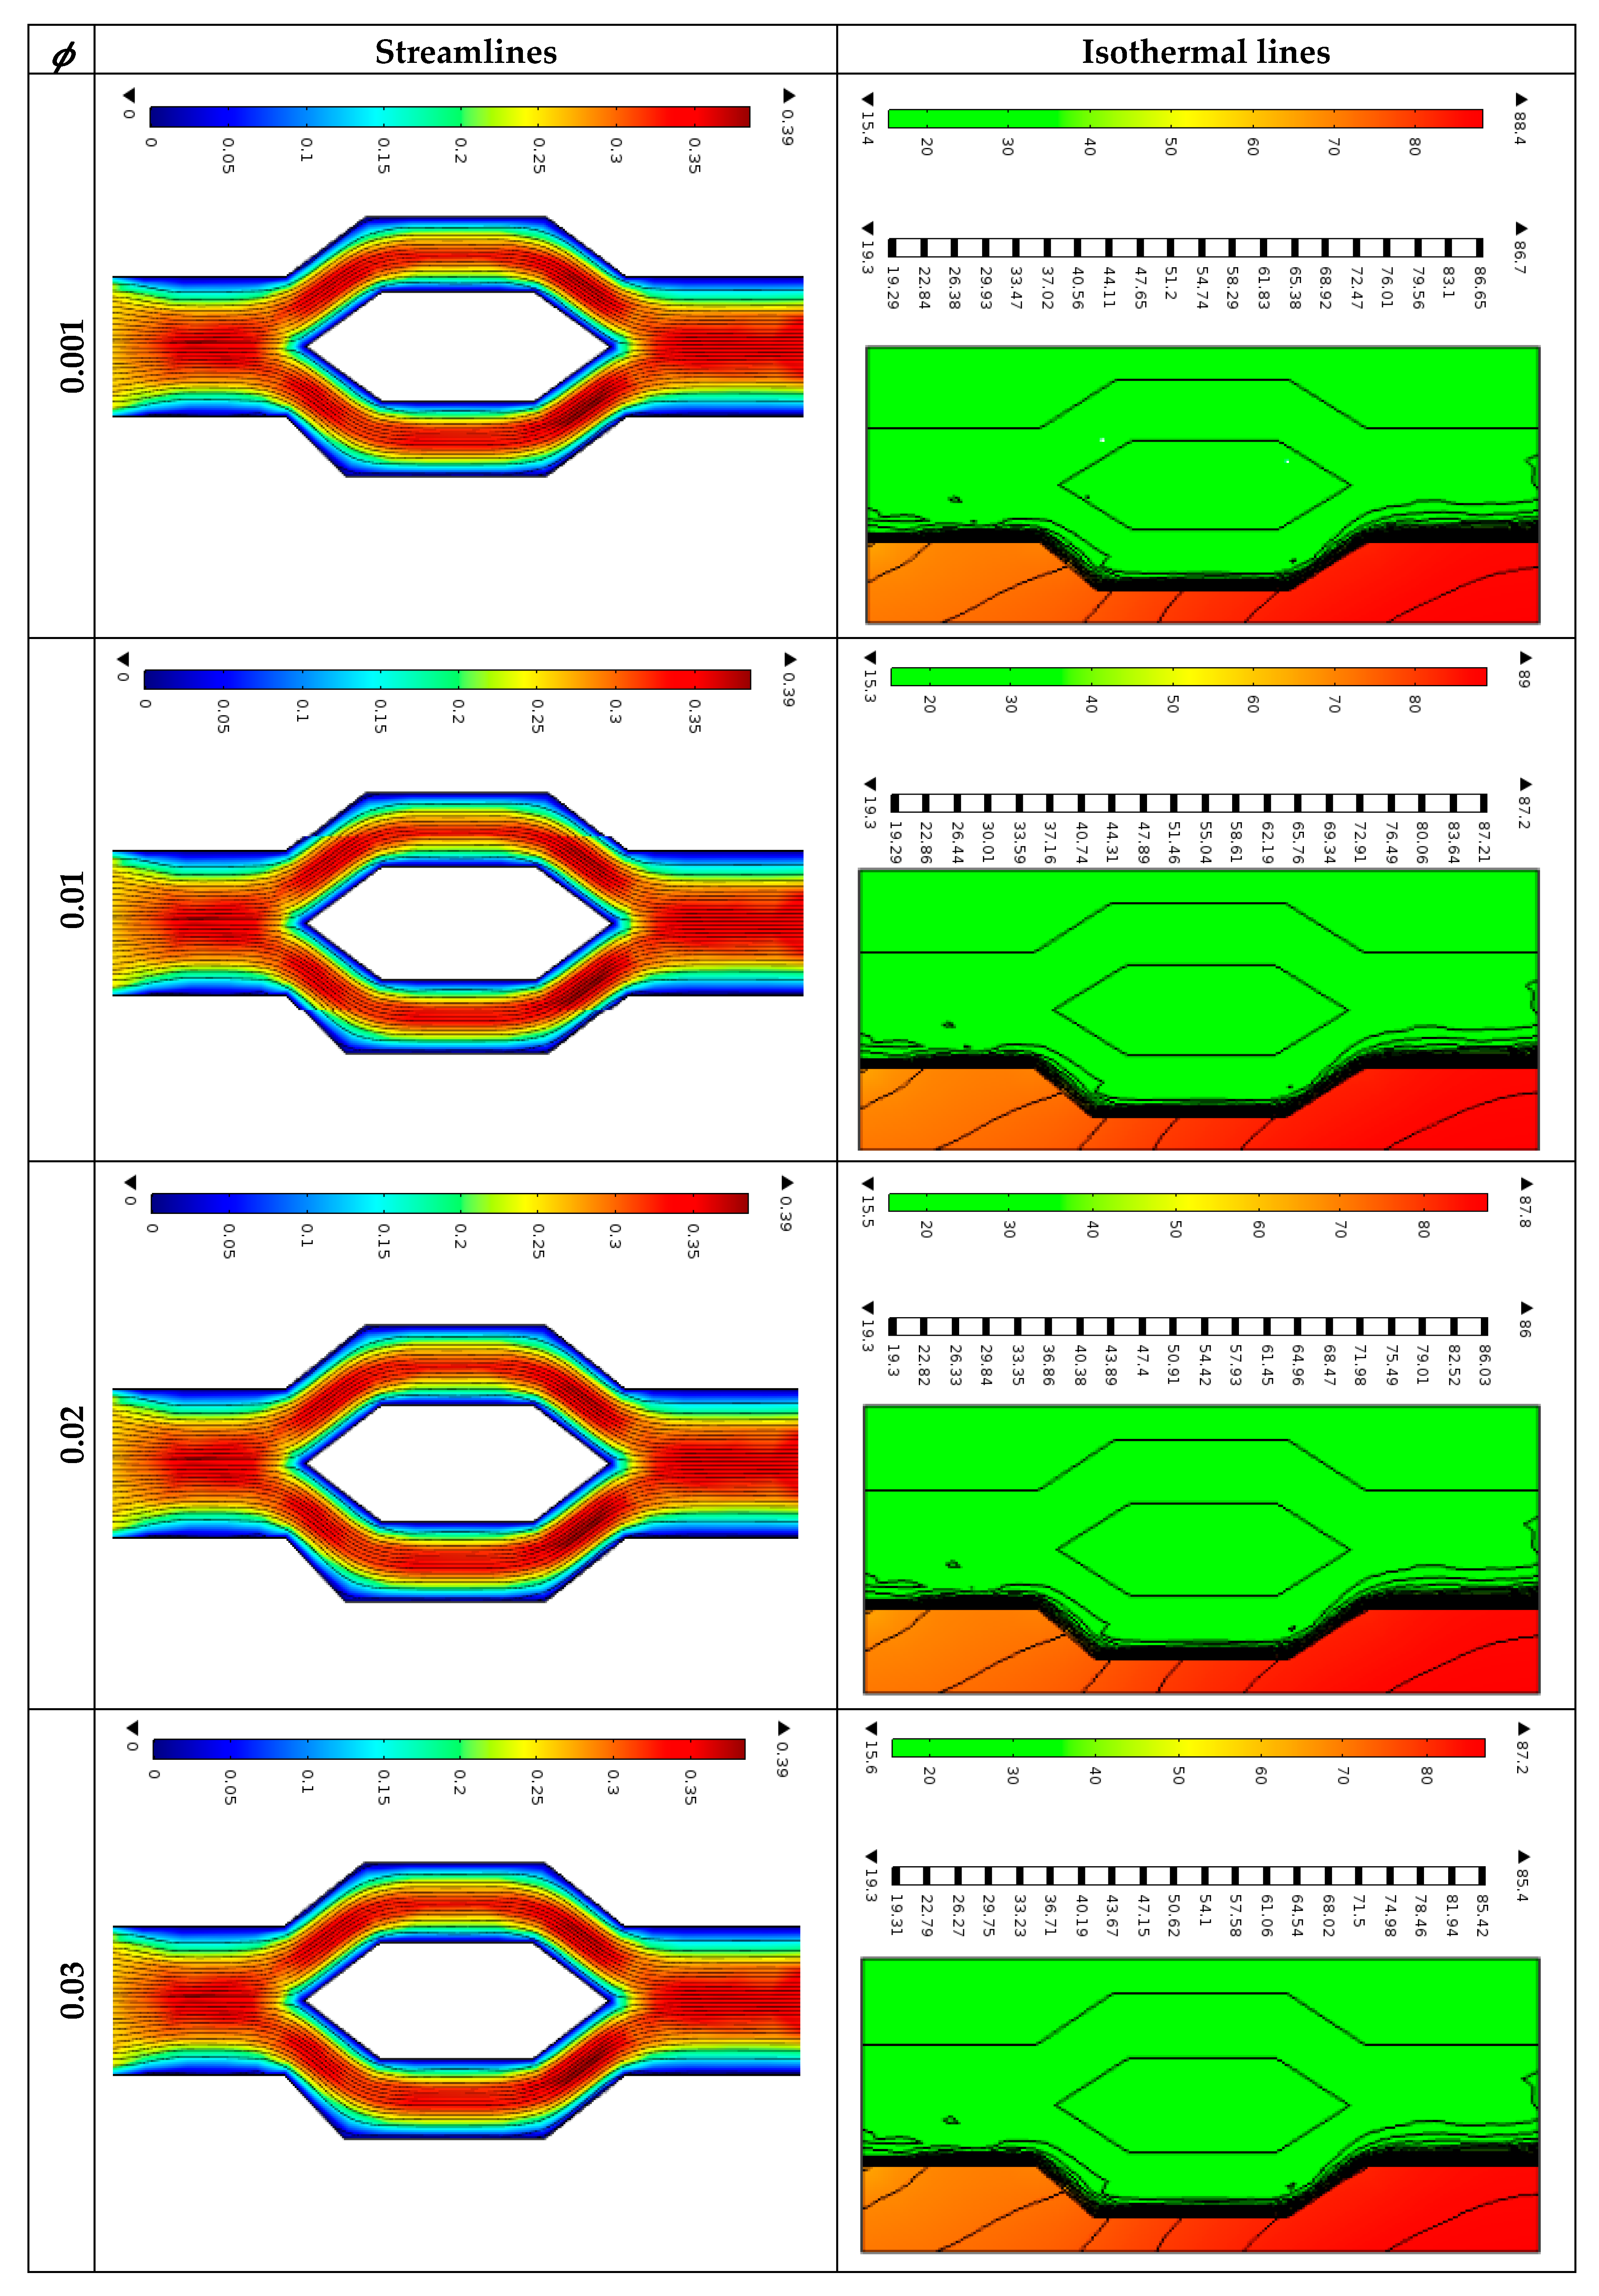
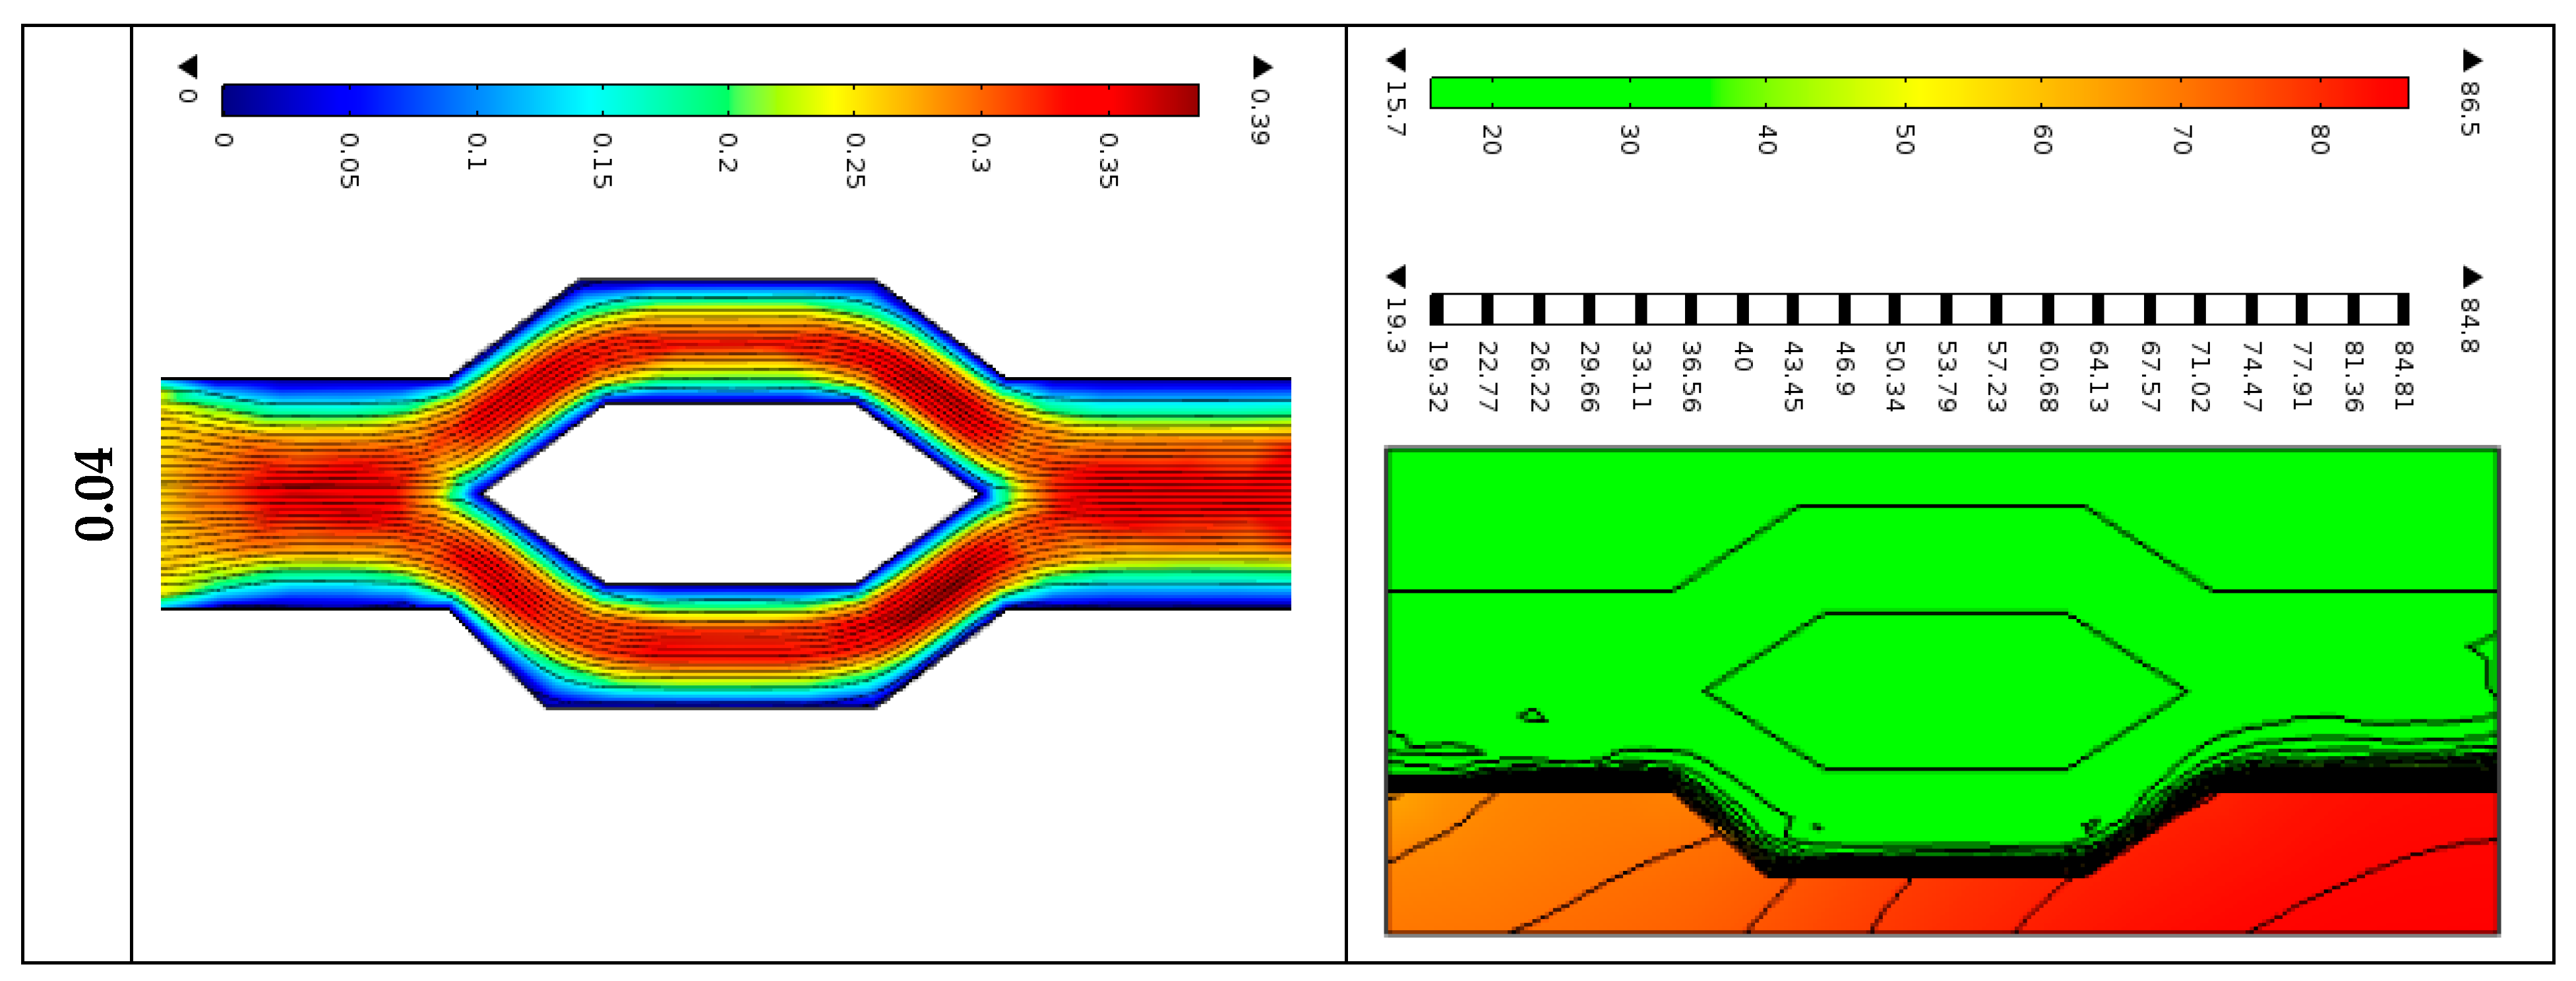
Figure 9 illustrates how the water–G nanofluid’s volume concentration (
ϕ) affects the streamline and isotherm profiles throughout the cone–column-shaped microchannel heat sink. The
Re is maintained at 600, and
q = 10
6 W/m
2, while the solid concentration is varied at 0.001, 0.01, 0.02, 0.03, and 0.04. In
Figure 9, the streamline moves smoothly over the heat sink’s flat area, with the velocity significantly dropping close to the grooves’ apex. The most considerable velocity is observed at the lowest solid volume concentration. On the other hand, in
Figure 9, the larger thermal impact region causes the isothermal lines to approach the lower wall. Due to the imposed heat flux at the lower boundary, the isothermal lines get closer to the upper wall as the solid concentration rises. When
ϕ is between 0.001 and 0.02, the lower part of the domain contains the majority of the isothermal lines. However, at
ϕ values between 0.03 and 0.04, the grooved MCHS area has the majority of the isothermal lines, showing a more parallel pattern and indicating a greater level of heat transfer. As
ϕ increases, the heat transmission rate increases, reaching its maximum value for the grooved MCHS.
4.3. Effect of Heat Flux
Increasing the heat flux from 10
4 W/m
2 to 10
6 W/m
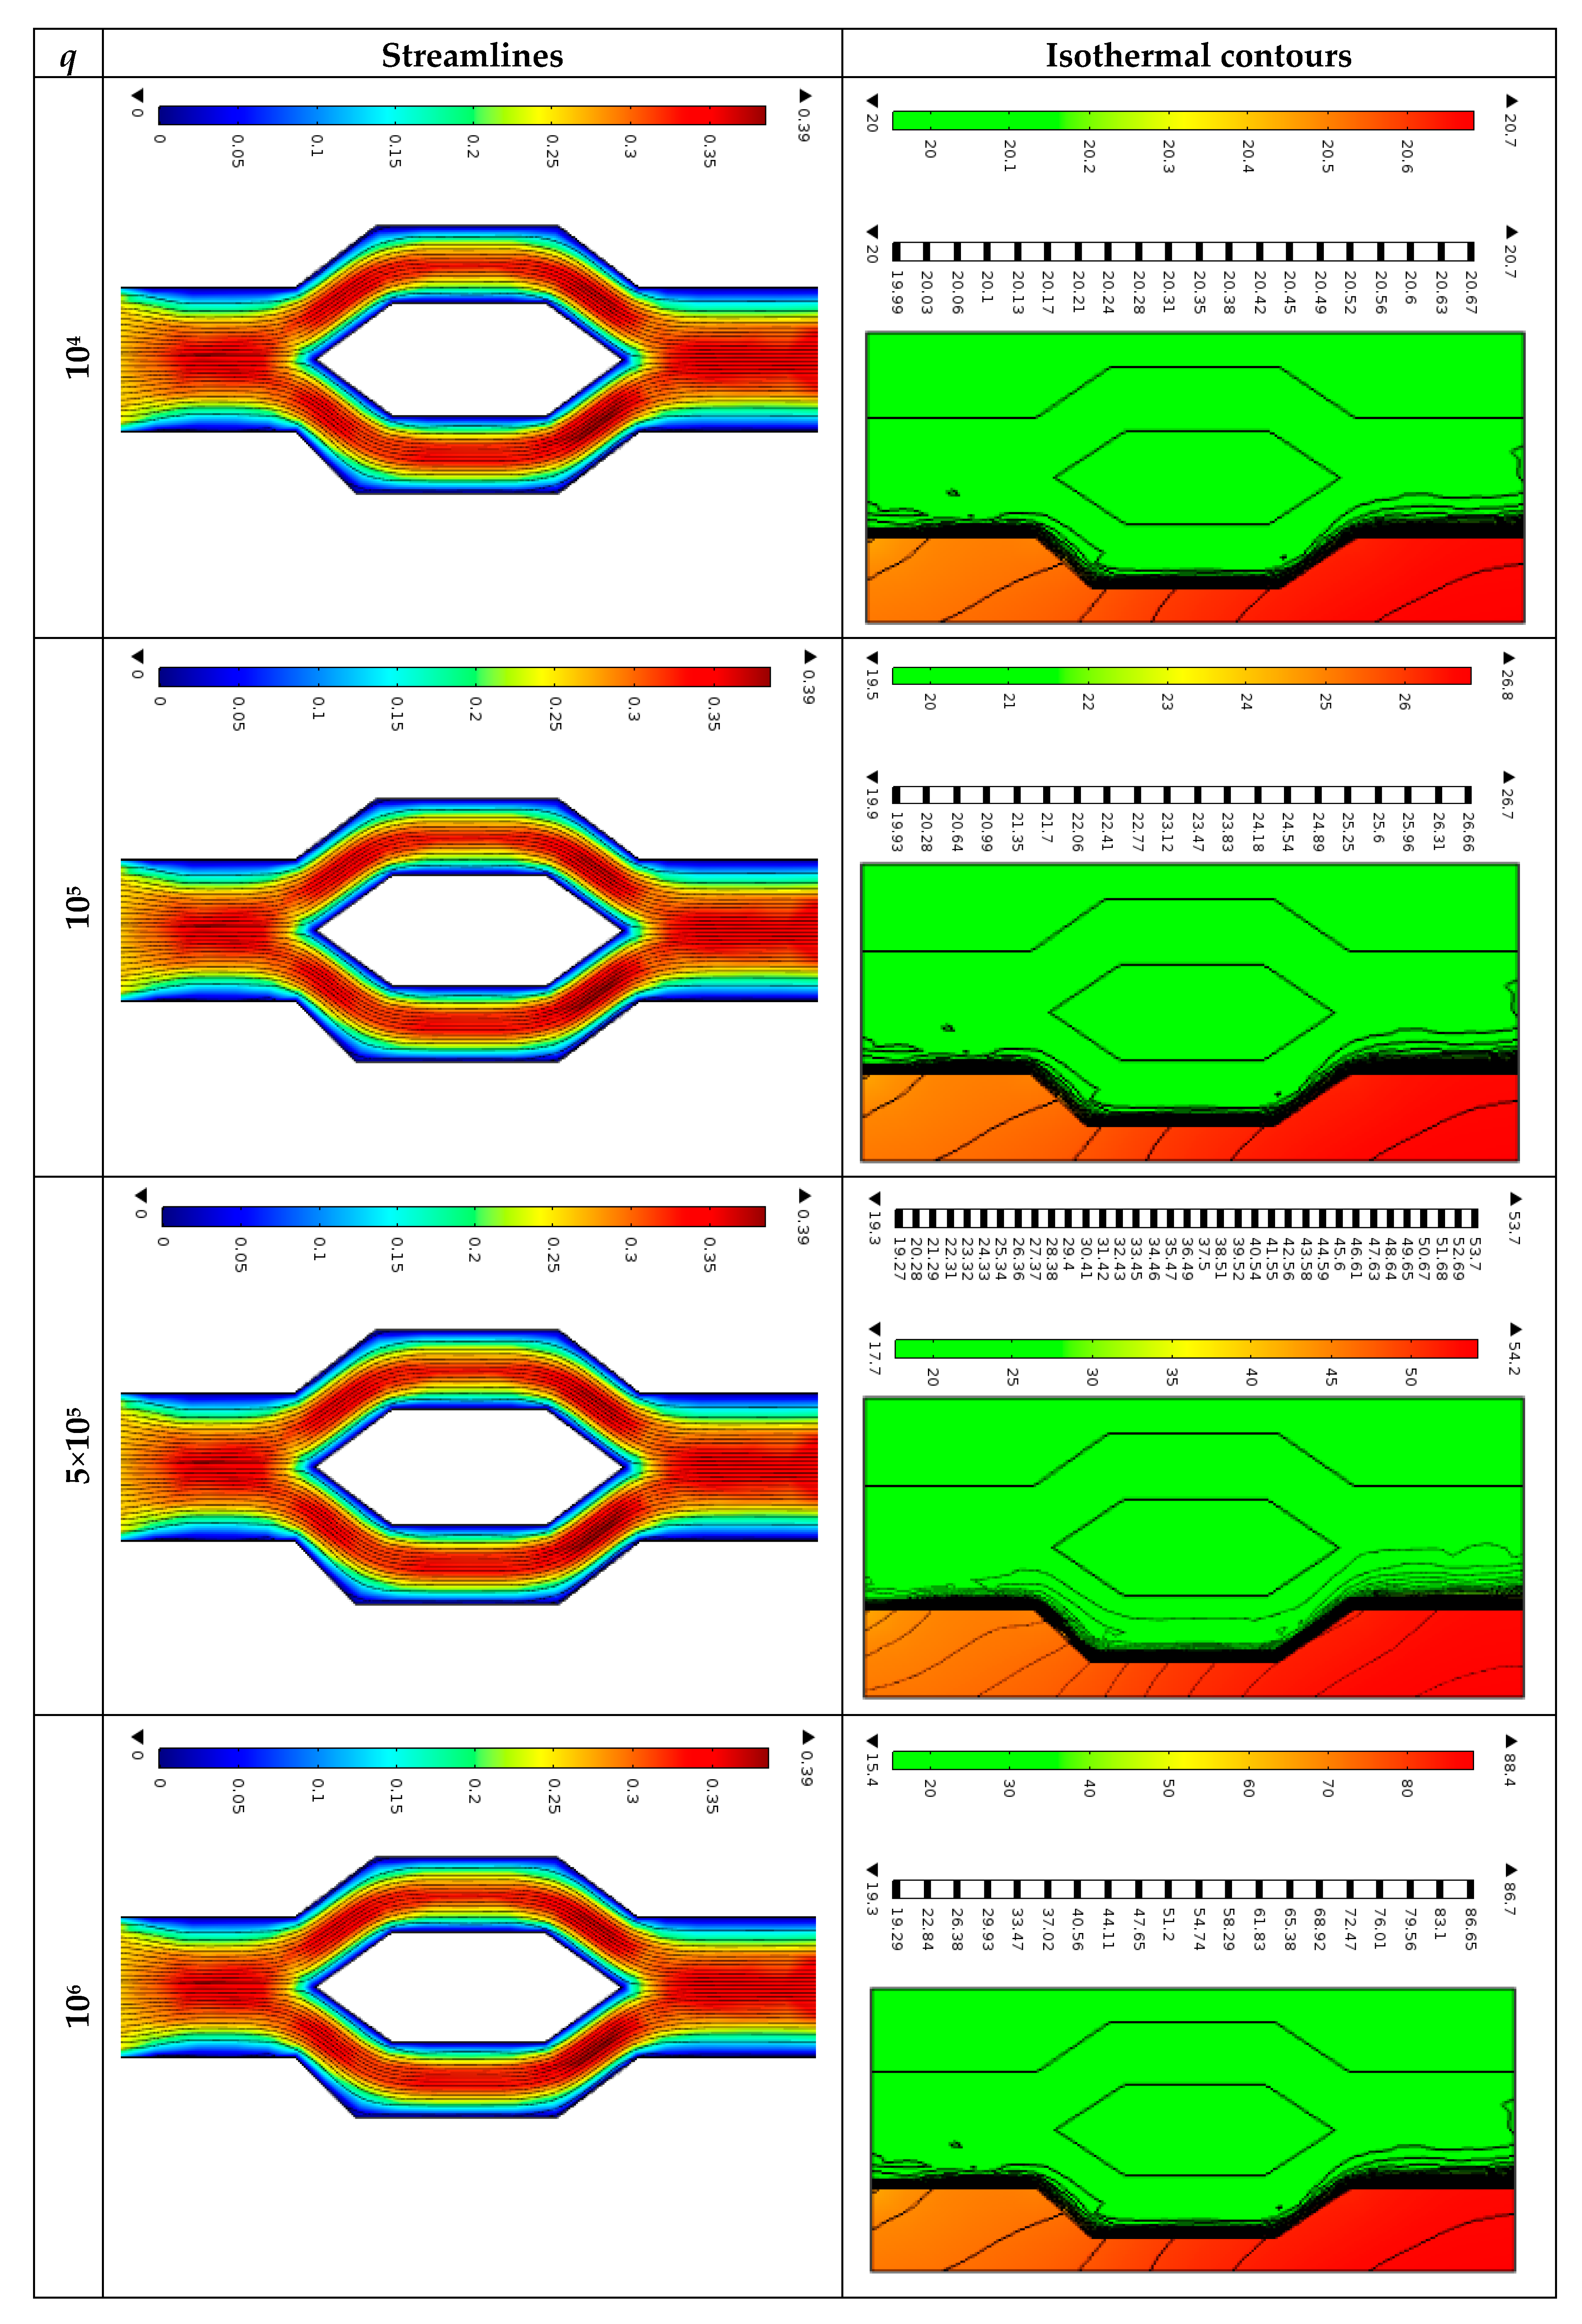
2 in the cone–column microchannel heat sink leads to more concentrated and intensified streamlines near the heated surface due to stronger thermal gradients. The isothermal lines become more tightly packed, indicating steeper temperature gradients and better heat transfer near the surface. However, secondary flows and potential hotspots may develop at higher heat flux values, requiring optimized channel design and flow control to maintain efficient thermal management. In
Figure 10, the streamlines and isothermal lines of the water–G nanofluid for externally applied heat flux to the MCHS’s bottom solid wall,
q = 10
4 W/m
2, 10
5 W/m
2, 5 × 10
5 W/m
2, and 10
6 W/m
2 are shown, where the solid concentration and Reynolds number are maintained at 0.01 and 600, respectively.
An external heat flow at the bottom wall produces a temperature gradient inside the fluid. Due to buoyancy effects, the heated fluid at the bottom will become less dense and rise. This buoyancy-driven flow can significantly alter the streamlines, creating upward convective currents that affect the overall flow pattern. The imposed heat flux forms the heated wall’s thermal boundary layer. Along the flow direction, this boundary layer develops. As the fluid moves over the heated bottom wall, the streamlines near the wall will bend, following the temperature-induced flow patterns. This can lead to more complex flow structures within the microchannel. Based on the heat flux’s magnitude and the resulting temperature variations, secondary flows (such as vortices or recirculation zones) may develop. These secondary flows can distort the primary streamline pattern, creating regions of enhanced mixing, potentially improving heat transfer but, also, increasing the pressure drop. The fluid may accelerate due to thermal expansion in the presence of a significant heat flux. This acceleration alters the velocity profile, impacting the shape and direction of the streamlines. The streamlines will converge in acceleration regions and diverge in deceleration areas, modifying the overall flow distribution. In microchannels, viscous dissipation and thermal diffusion play significant roles.
The system’s additional heat from the bottom wall will diffuse through the fluid, influencing the viscous forces. Streamlines close to the heated wall may experience increased shear forces, altering their path and potentially leading to more uniform flow distribution away from the wall. The cumulative impact of buoyancy-driven flow, formation of thermal boundary layers, and secondary flow patterns lead to a modified flow field within the microchannel. The streamlines profile will show a pronounced upward movement near the heated wall, with potential regions of recirculation or secondary flow patterns that can enhance mixing and heat transfer. Computational fluid dynamics (CFD) simulations can be utilized to understand and visualize these effects better. These simulations can model the heat flux at the bottom wall and show how the streamlines are affected under various operating conditions. By analyzing these simulation results, one can optimize the design and operating parameters of the cone–column microchannel heat sink for improved thermal management performance. Due to higher externally applied heat flux (q = 106 W/m2) affects the water–G nanofluid flow and temperature fields more than the lower heat flux values (q = 104 W/m2).
4.4. Nusselt Number
The nanofluid’s heat transfer coefficient is a key factor in determining its thermal performance. When the solid volume fraction rises, the heat transfer coefficient of the water–graphene nanofluid also increases. It is because of the enhanced interaction between the base fluid and the nanoparticles, which boosts the convective heat transfer. As a result, at higher nanoparticle concentrations (e.g., closer to 4%), the microchannel heat sink can achieve more excellent cooling performance by transferring more heat per unit area.
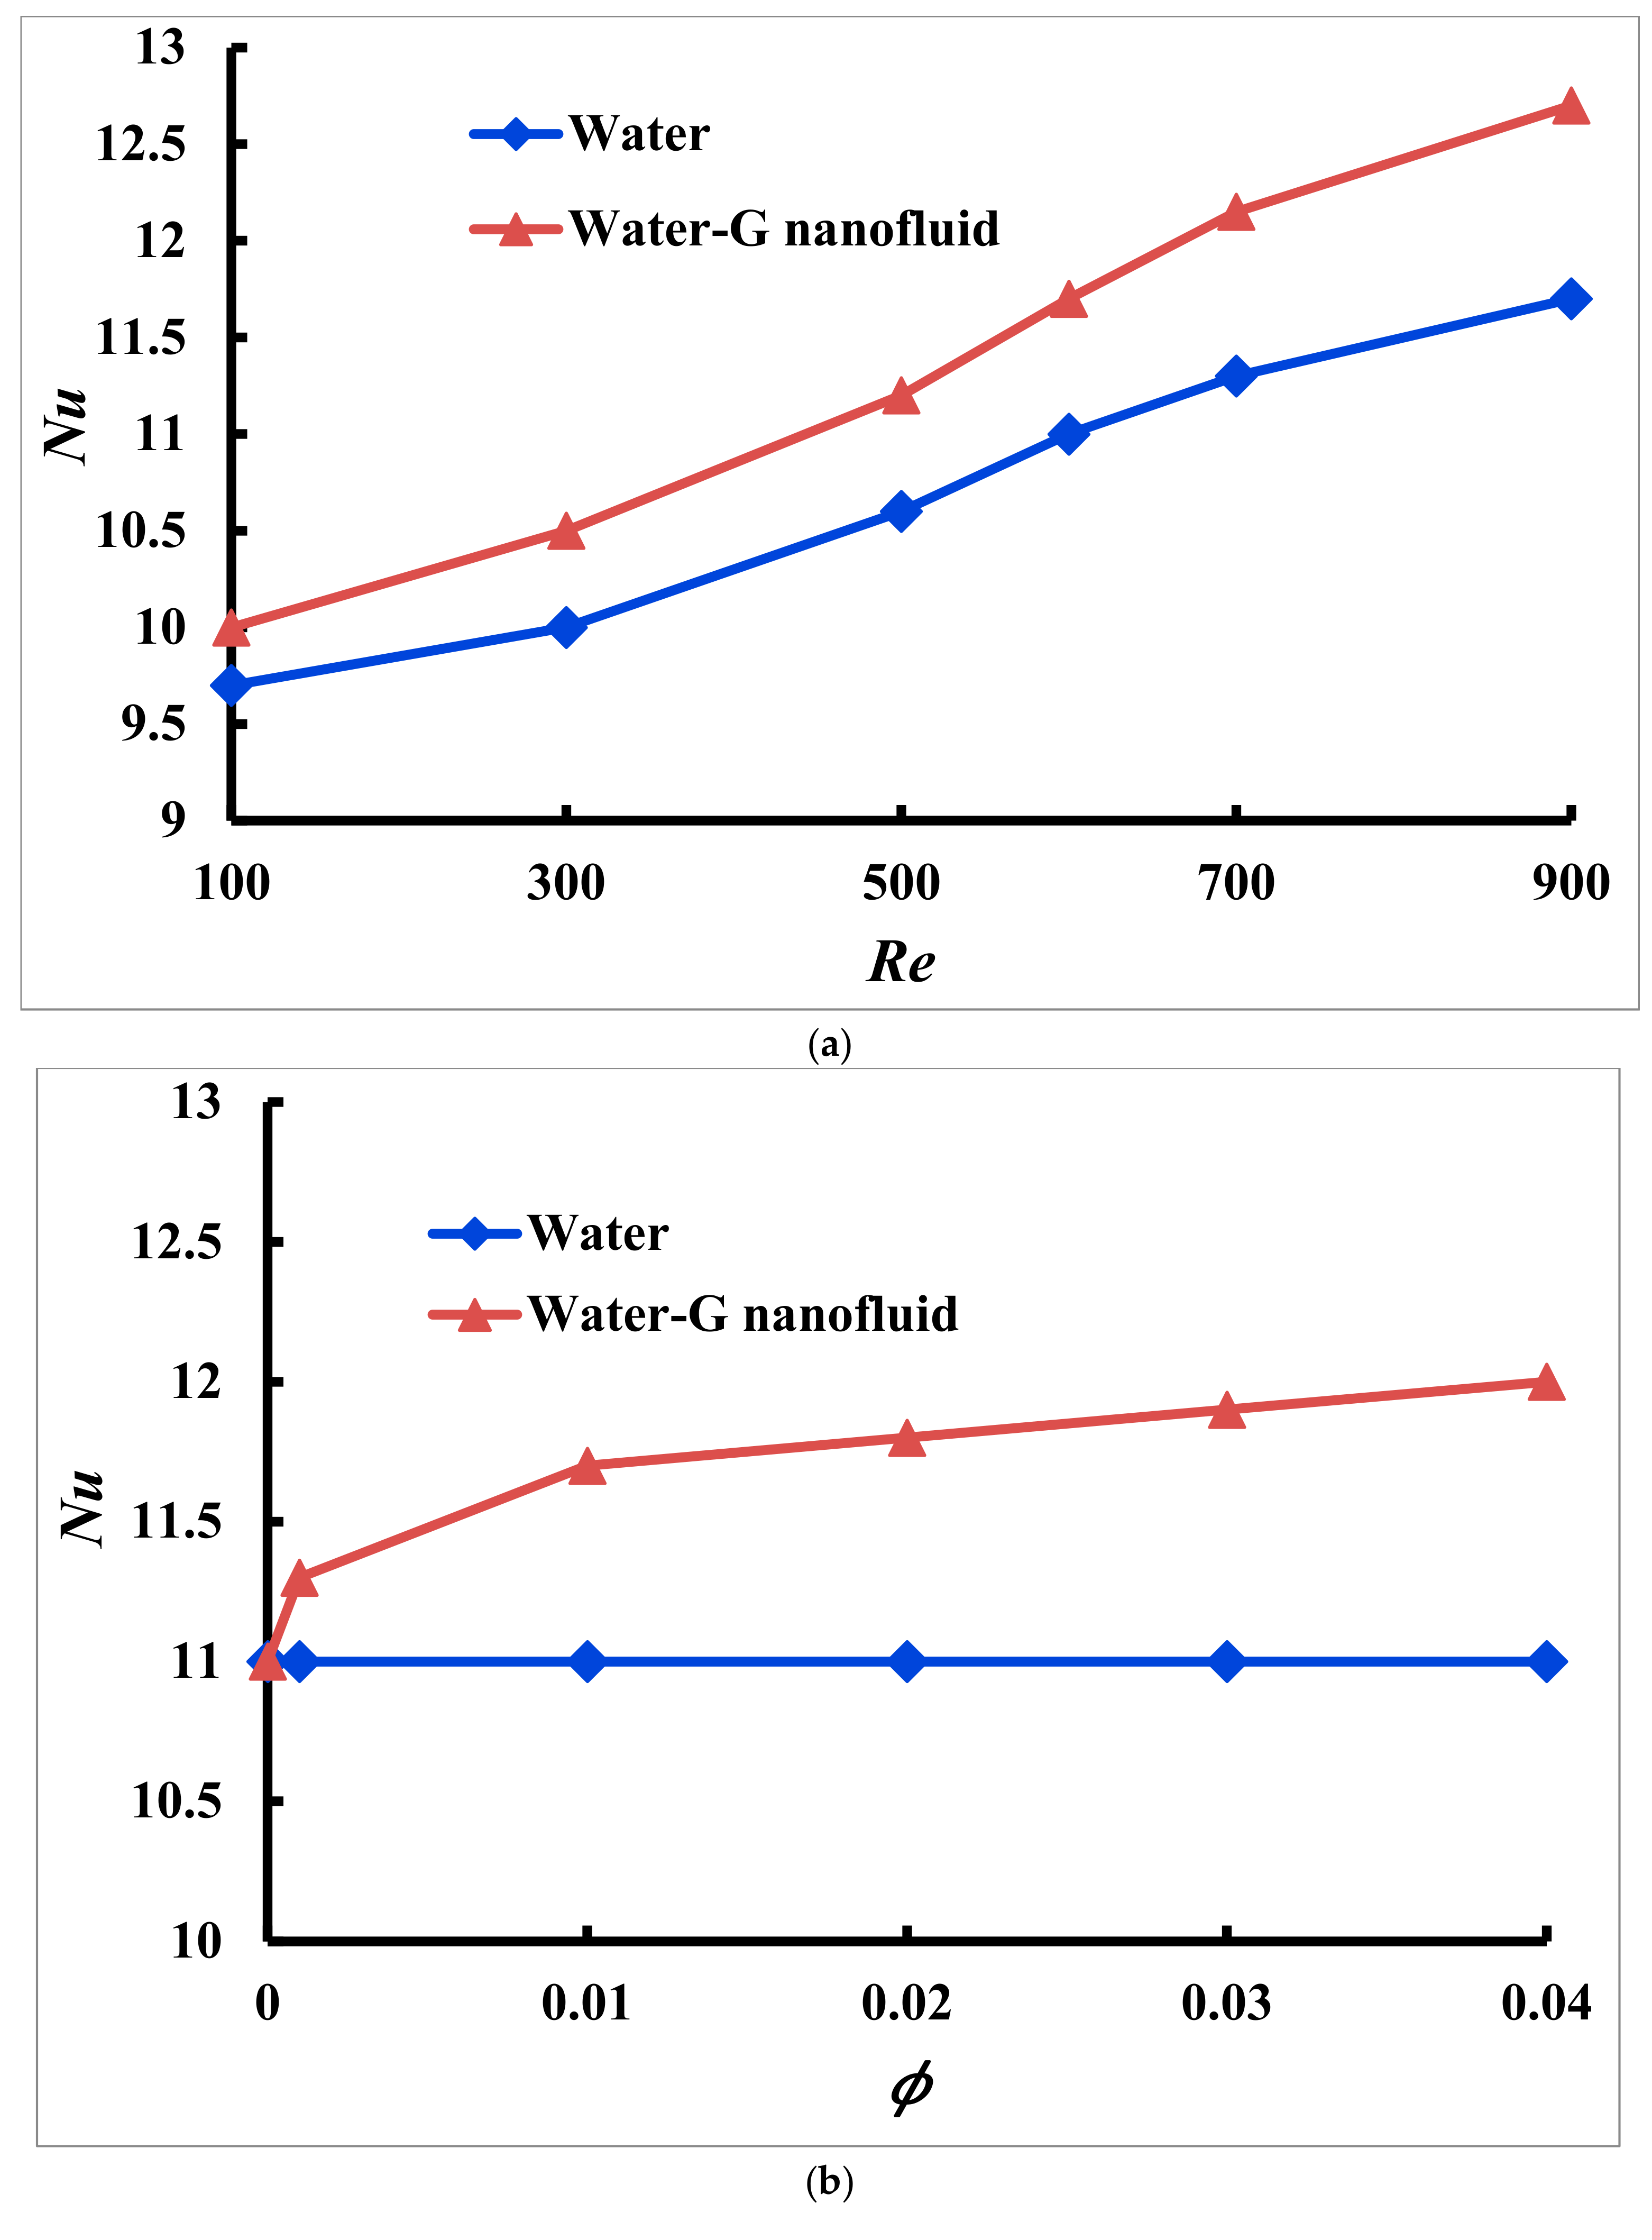
Figure 11a shows the impact of the Nusselt number on the average Reynolds number using Equation (10a). The orange line represents water–G nanofluid with 1% solid concentration, and the blue line represents clear water used as a heat-transferring medium in the cone–column MCHS. The Nusselt number is a dimensionless quantity that indicates the ratio of heat energy conducted inside the fluid to the heat energy converted in the fluid. It shows the heat that moves through the fluid’s heated surface. The
Nu equivalently rises as the Re rises from 100 to 900 for laminar flow through the channel. The base fluid and the water–G nanofluid have
Nu values of 9.7 and 10, respectively, while the
Re is 100. When the
Re is 900, the values of
Nu are 11.7 and 12.7, respectively. The water-based graphene nanofluid and clear water demonstrate increasing thermal transport of about 27.00% and 20.62%, respectively, due to rising values of the Reynolds number from 100 to 900 for the cone–column-shaped MCHS.
The nanoparticles’ dispersion inside the base fluid becomes challenging at higher concentrations. Agglomeration or clustering of nanoparticles can occur, especially as the volume fraction approaches 4%. This reduces the actual surface area that can be heated and diminishes the enhancement benefits. Therefore, maintaining proper nanoparticle dispersion is essential to realize the expected thermal efficiency improvements.
Figure 11b depicts the heat transmission rate of water–G and clear water for various solid concentrations while maintaining the Reynolds number and heat flux fixed at 600 and 10
6 W/m
2, respectively. A wide range of solid concentration values are used here, consisting of 0.1%, 1%, 2%, 3%, and 4%, and a significant heat transmission rate is seen at 1%. The graph indicates that the solid concentration value increases steadily as the heat transmission rate increases following
ϕ. The values of the Nusselt numbers at
ϕ = 1% and 0% (clear water) are 11.7, and 11, respectively. As a result, the water–G nanofluid growing rate is higher than the water, which is 9.09%, as the solid concentration increases from 0% to 4%.
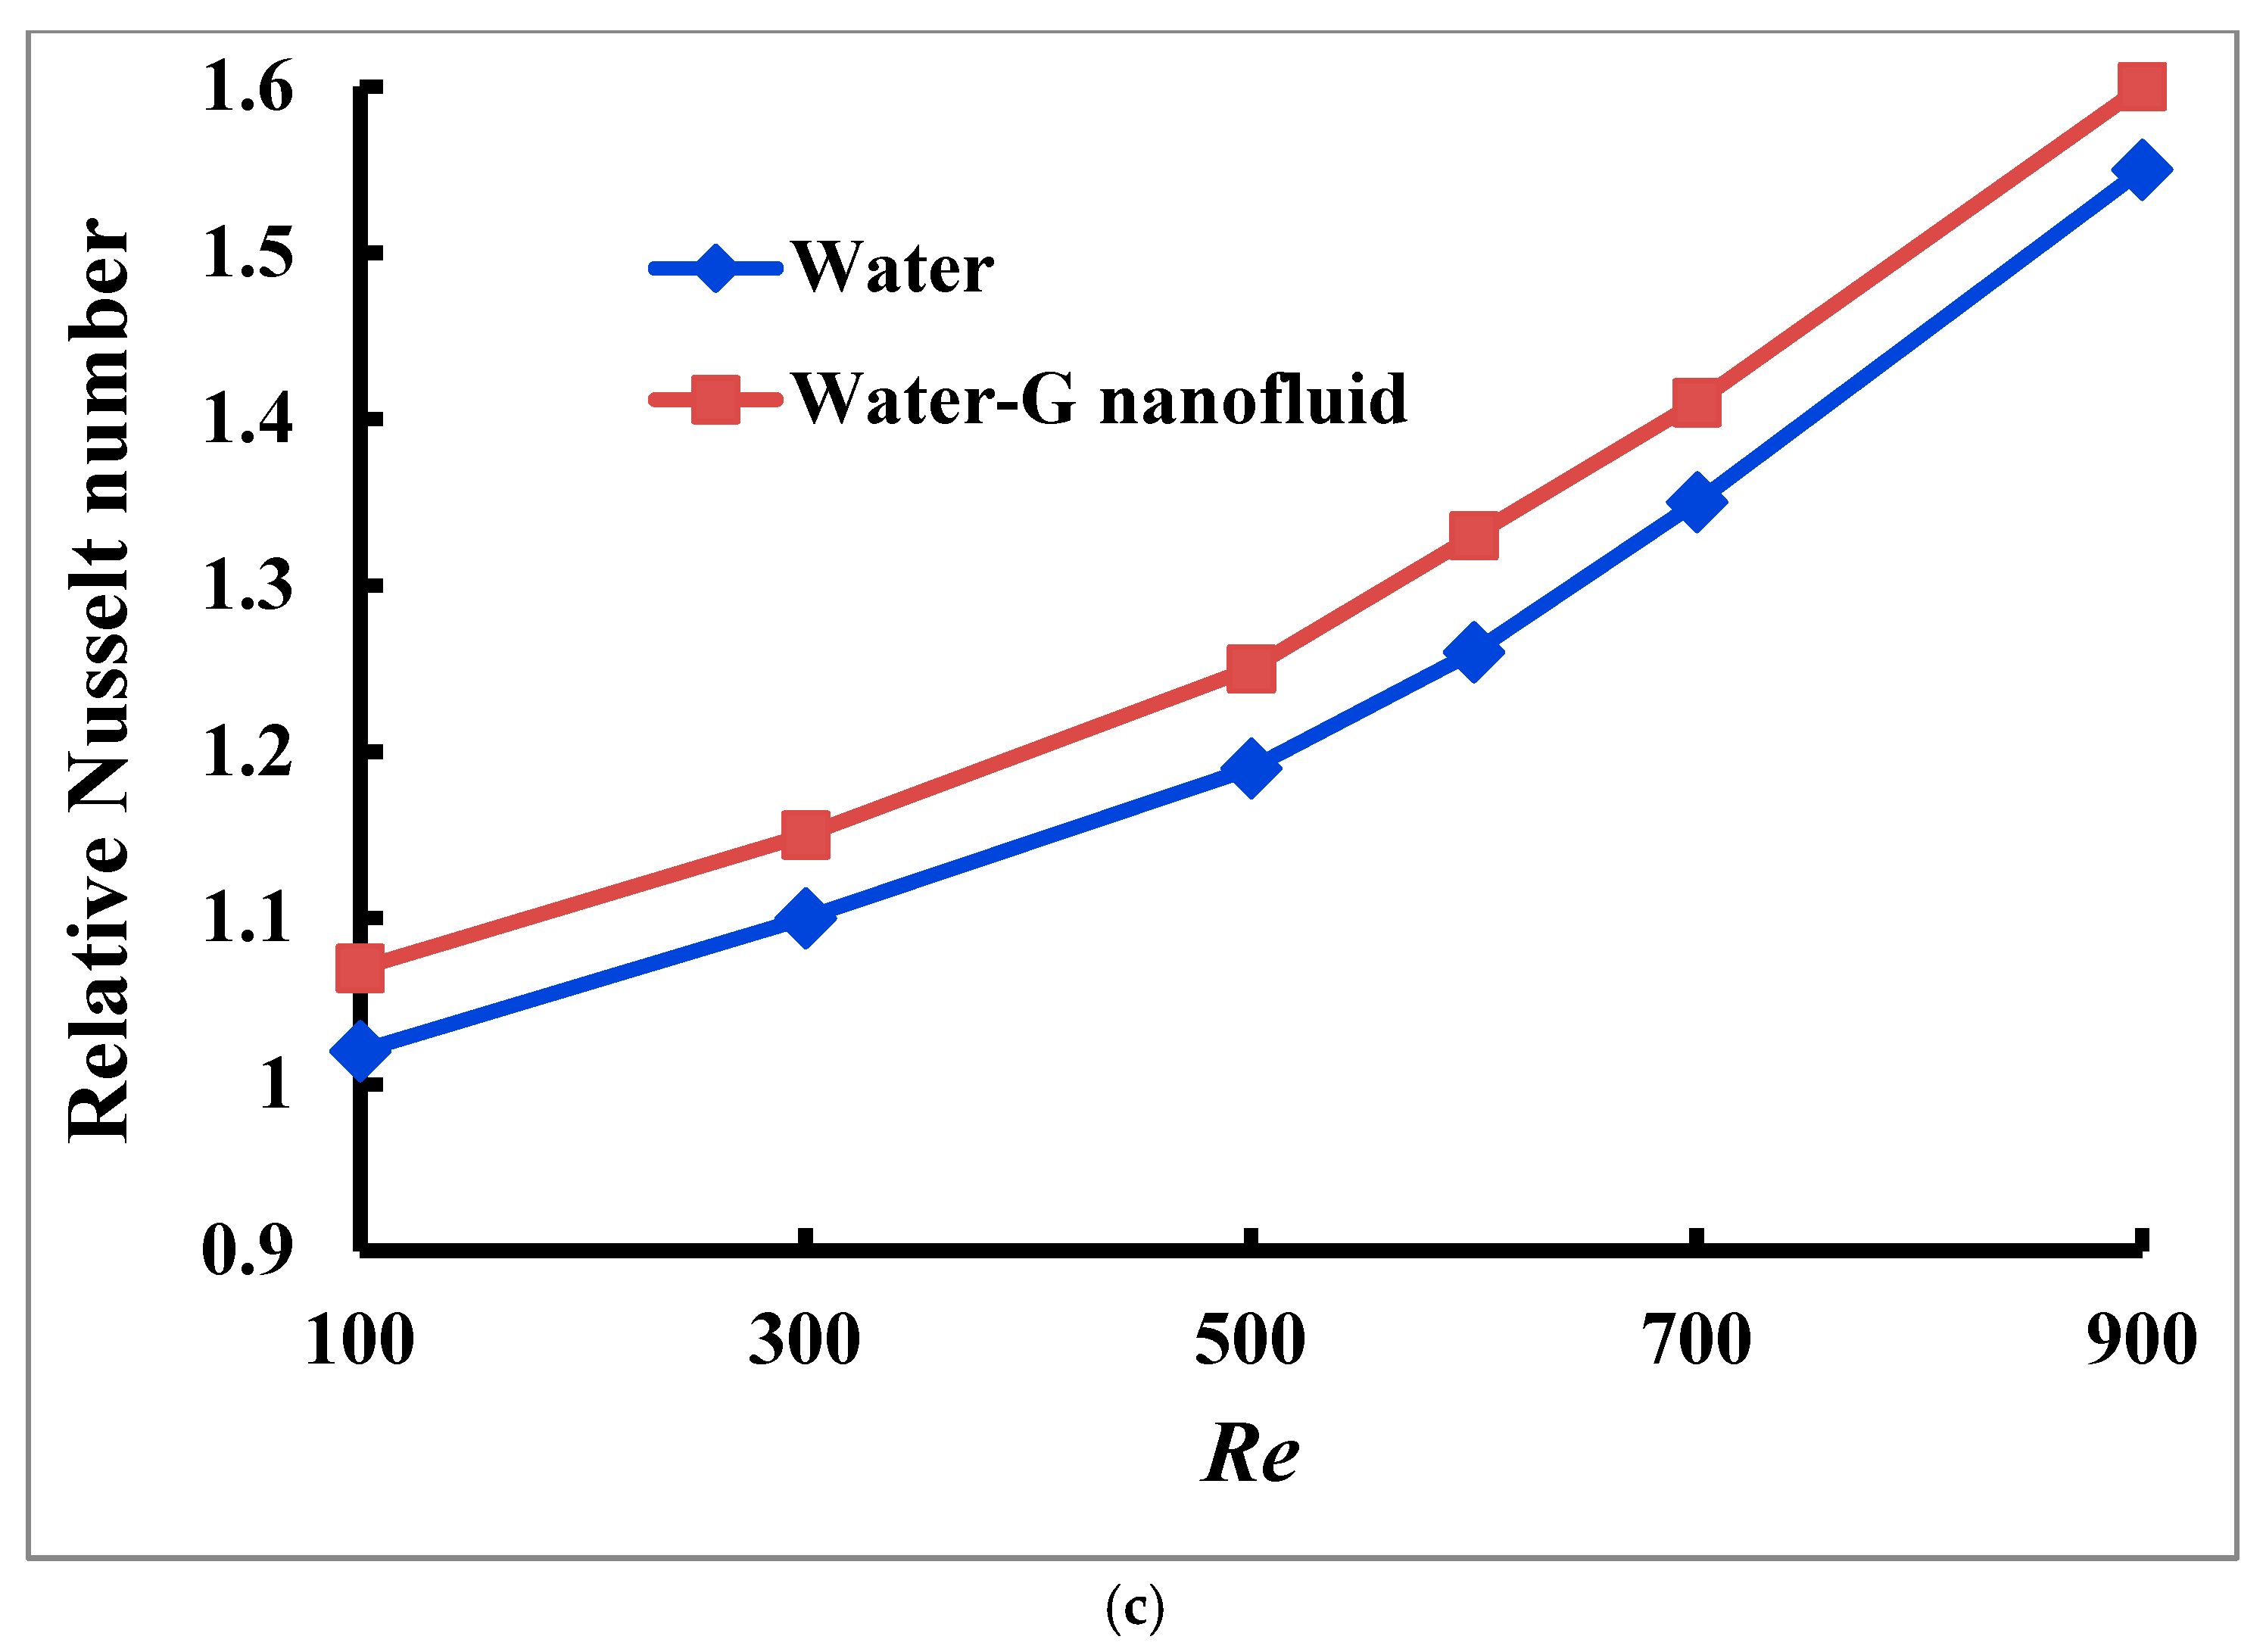
When assessing an MCHS’s thermal efficiency, the relative Nusselt number is a crucial parameter. The dimensionless Nusselt number generally represents the convective to conductive heat transport ratio. The relative Nusselt number compares the Nusselt number under specific operating conditions (e.g., enhanced cooling techniques, modified geometries, or different working fluids) with a baseline case, providing insights into the effectiveness of these changes. It allows for quantifying heat transmission improvements because of design adjustments, nanofluids, and changes in flow conditions or heat flux. By calculating the relative Nusselt number, engineers can optimize the heat sink for maximum thermal performance, energy efficiency, and fluid flow efficiency, ensuring the system can effectively dissipate heat while minimizing operational costs and energy usage. In
Figure 11c, through the cone–column MCHS, the impact of the corresponding
Nu is demonstrated while the Reynolds number is constant at
Re = 600. The corresponding Nusselt number is computed from Equation (14). The graph indicates that the relative Nusselt number’s value varies between 1.02 to 1.55 for water and 1.07 to 1.6 for water–G nanofluid. This suggests that the cone–column combined MCHS may transmit heat more effectively using water–G nanofluid compared to base fluid water.
4.5. Pressure Drop
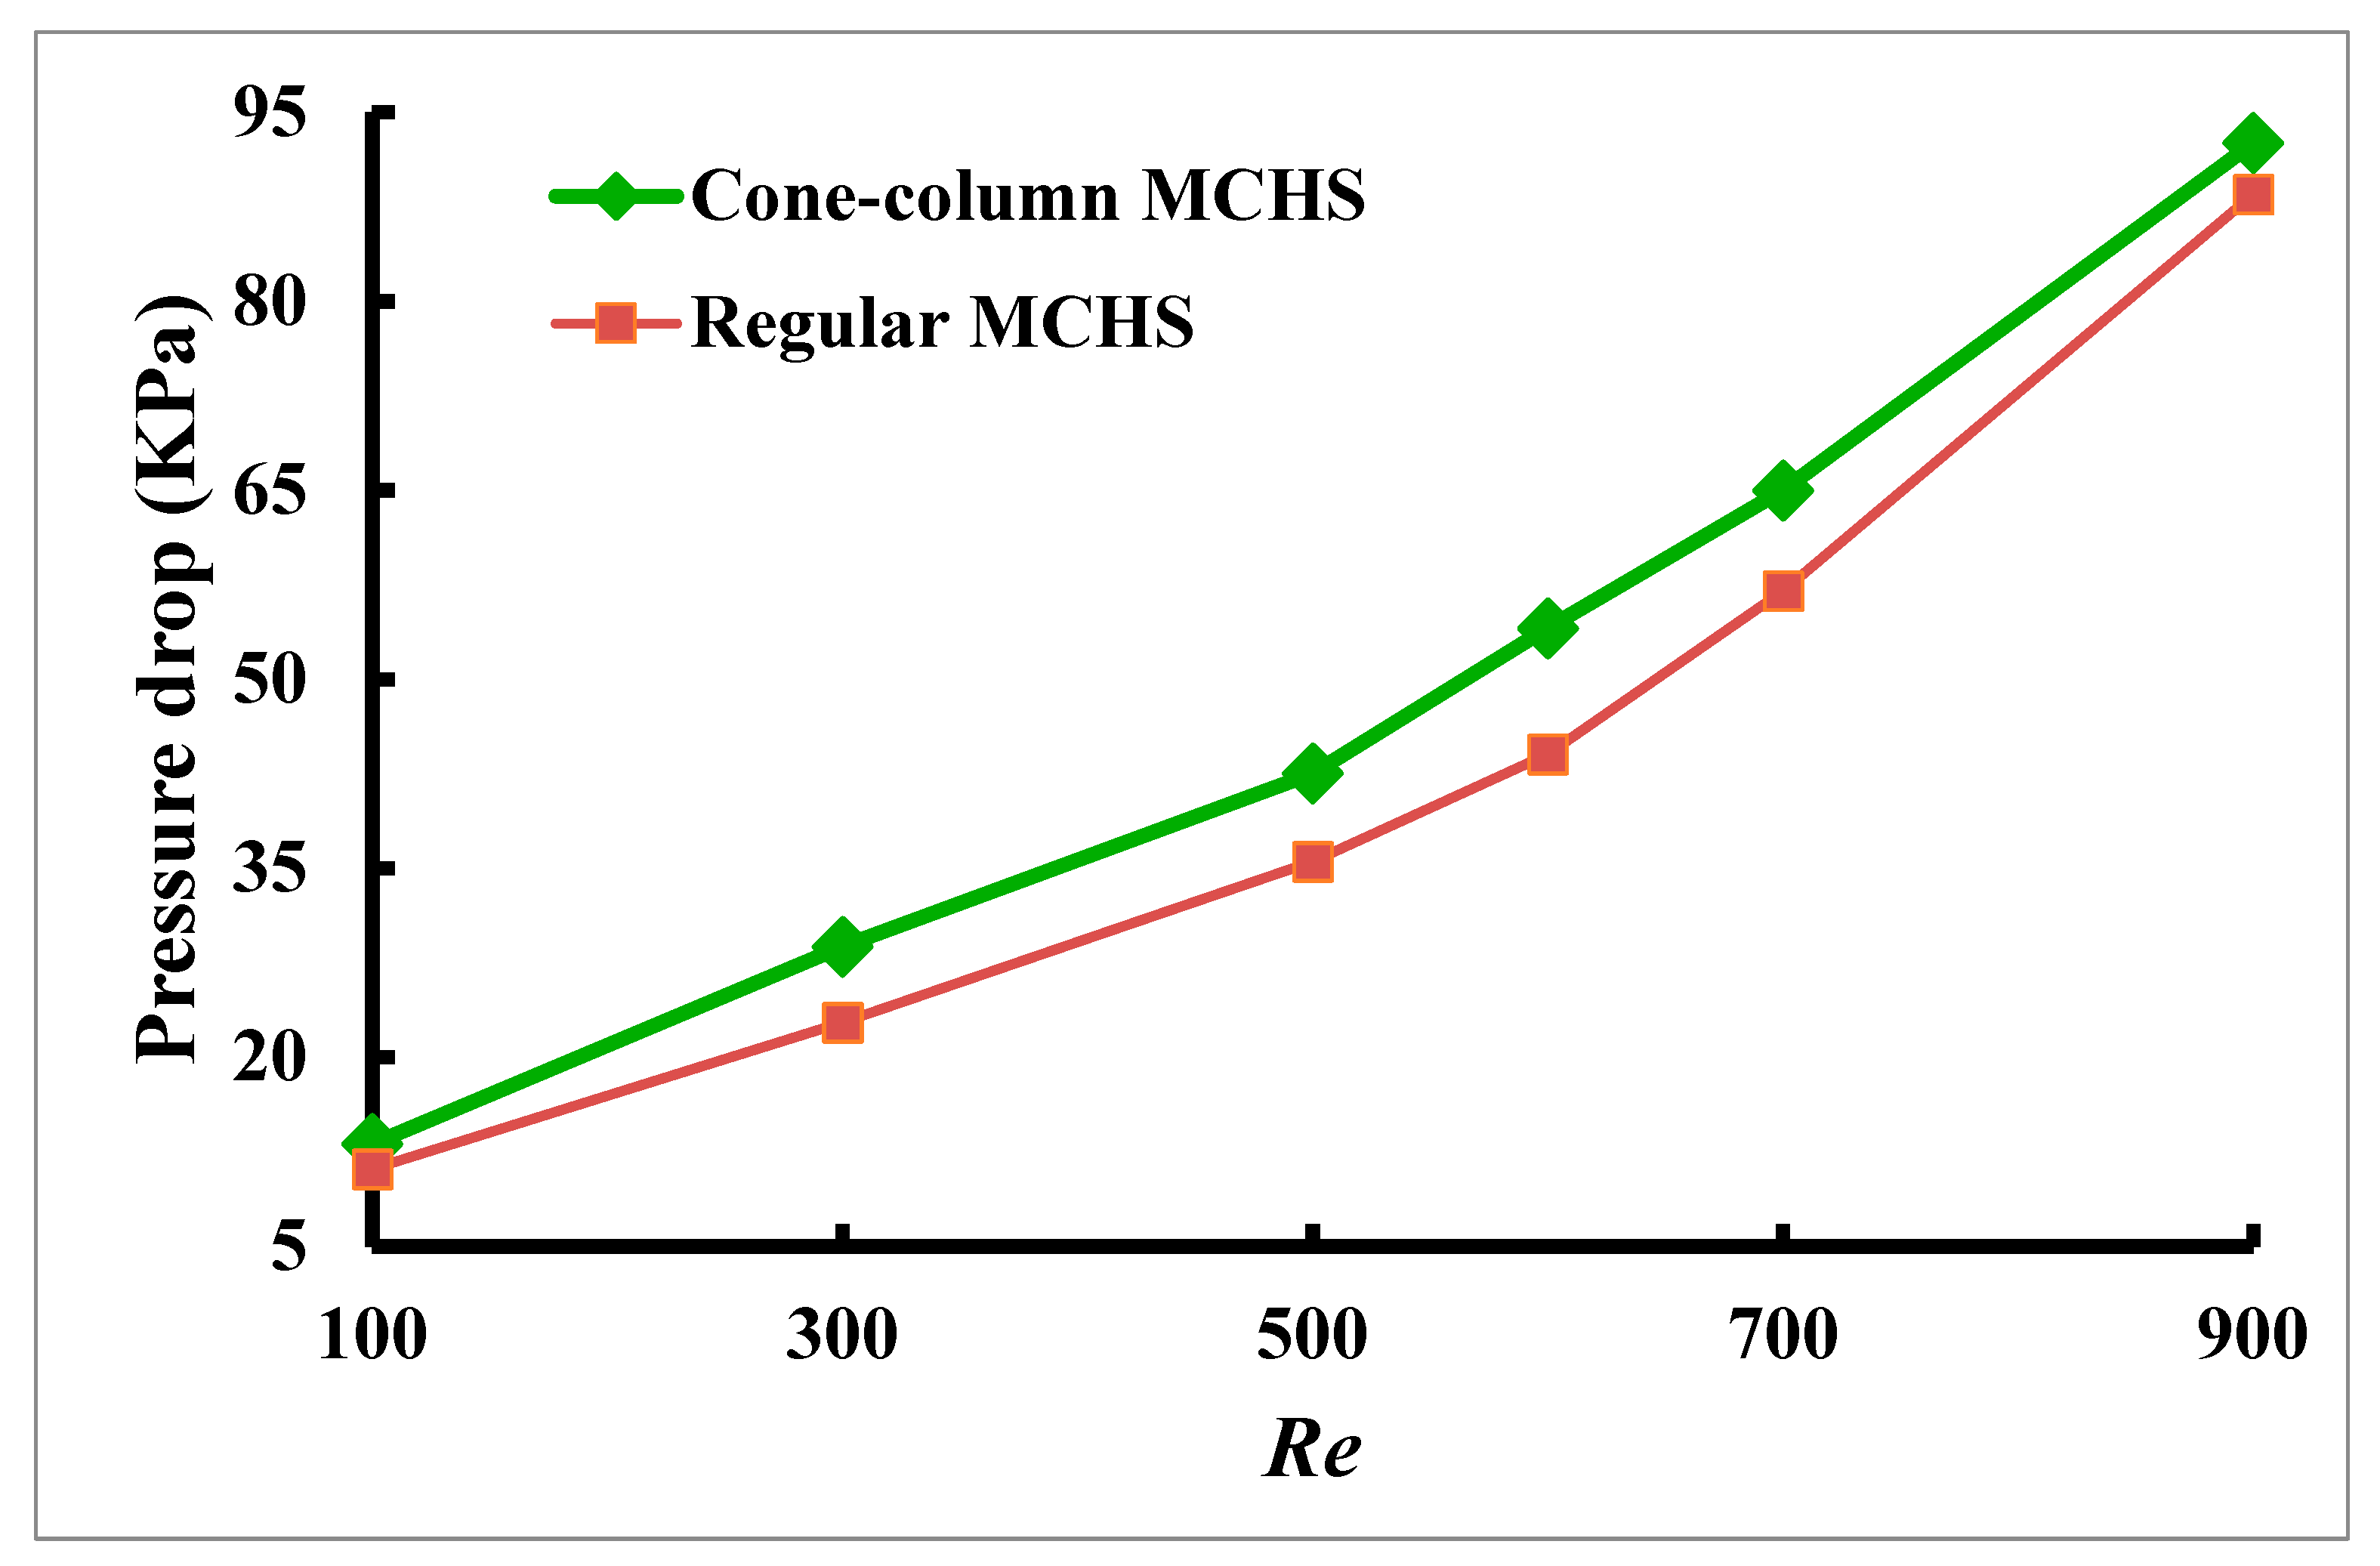
Pressure drop affects the pumping energy needed to move the fluid through the microchannels. A higher pressure drop means more energy is required to conquer the fluid flow resistance, increasing the pumping power requirement. Optimizing pressure drops helps in reducing operational energy costs. The pressure drop refers to the drop in pressure that a fluid experiences while passing through a cooling system. A higher pressure drop increases the pumping power required, resulting in higher operational energy expenses. While enhancing heat transfer frequently results in a higher pressure drop, managing the pressure drop is critical for balancing thermal performance and energy efficiency. Minimizing pressure drop minimizes the energy required for fluid circulation while maintaining heat transfer, making the cooling system more cost-effective. This increases the system’s thermal efficiency. In the cone–column combined MCHS and regular MCHS, there is a reduction in pressure while the Reynolds number is 100 to 900 using water–G nanofluid, as shown in
Figure 12 and calculated using Equation (11), with the solid concentration maintained at 0.01 and the heat flux is 10
6 W/m
2. The accompanying chart illustrates that the pressure drop increase is associated with the increasing Reynolds number. When using water–G nanofluid, the pressure drop ranges between 13.12 kPa and 92.6 kPa for the cone–column MCHS and from 11.12 kPa to 88.5 kPa for the regular MCHS. The pressure drop gradually increases as the Reynolds number differs between 100 and 500, then sharply rises to its peak. It has been observed that the pressure loss in the cone–column microchannel increases with higher working fluid velocity.
4.6. Pumping Power
Pumping power (
Pp) is a crucial parameter in microchannel heat sinks, impacting energy efficiency and cooling performance. In microchannels, fluid flows via extremely narrow pathways, producing high surface-area-to-volume ratios that improve heat transmission. However, this increases frictional losses and pressure drop, substantially impacting pumping power requirements.
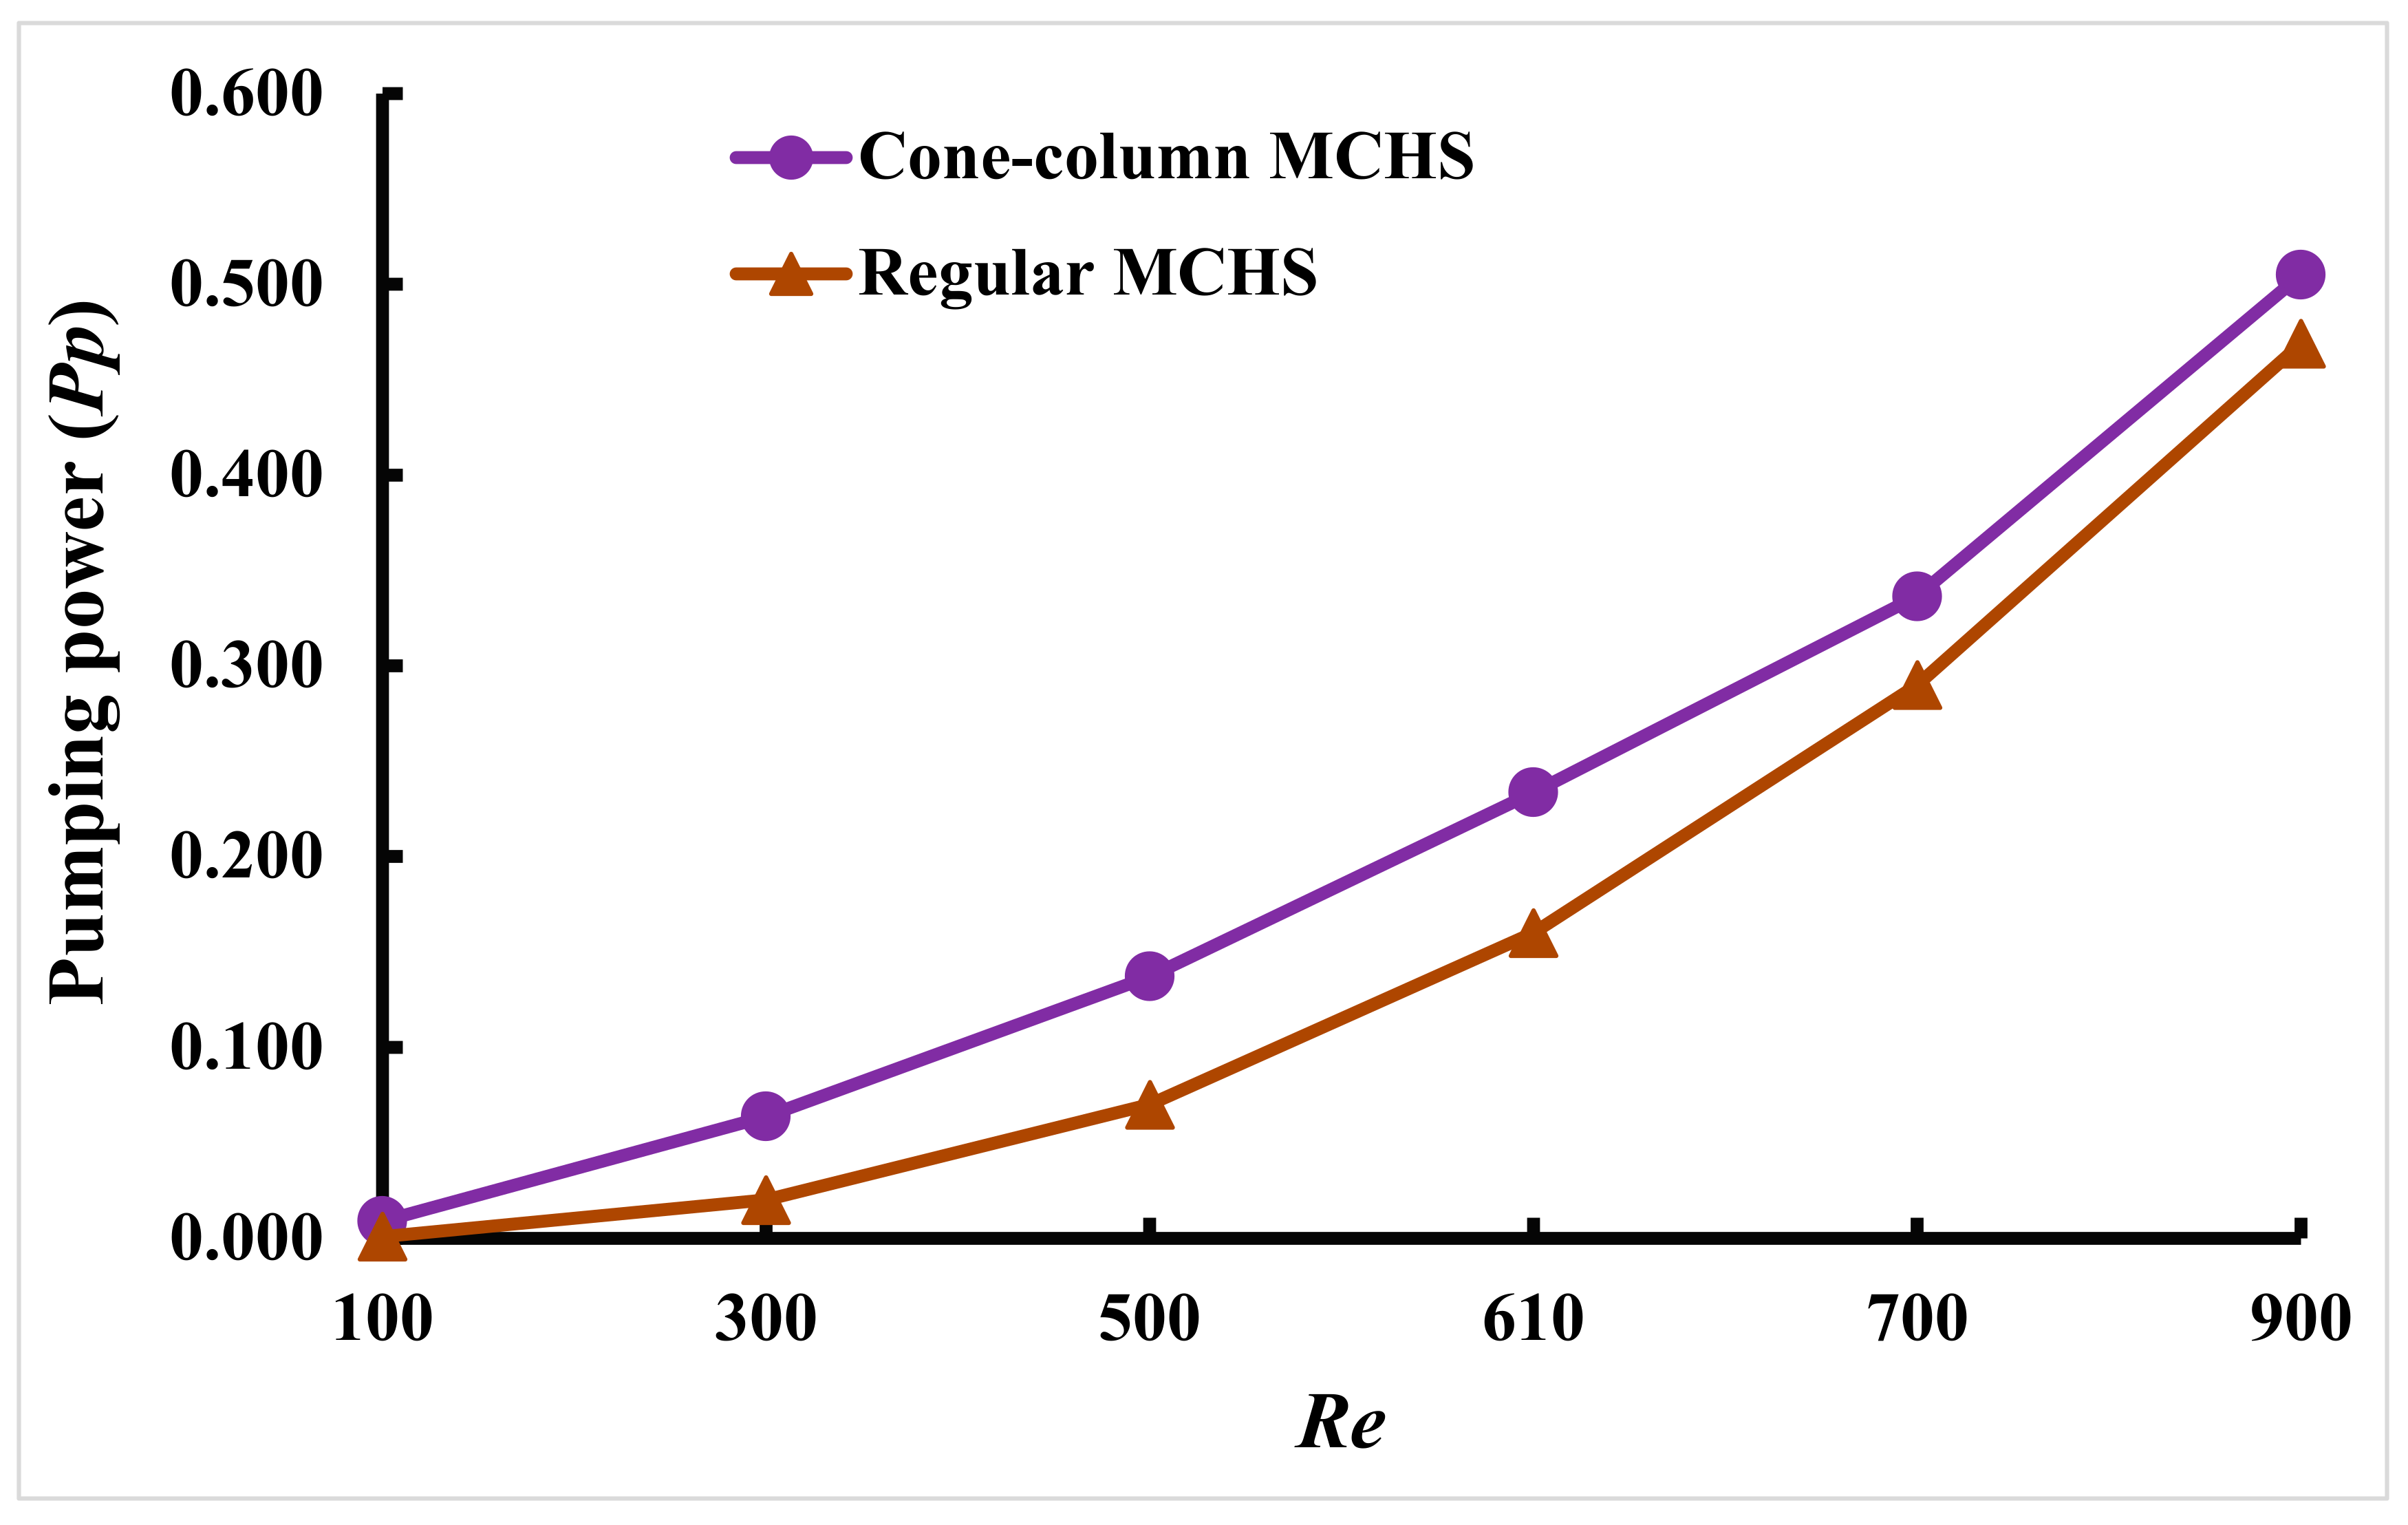
Figure 13 shows that pumping power (
Pp) grows dramatically with Reynolds number (
Re) in both setups. Pumping power increases in the cone–column combination MCHS and normal MCHS when the Reynolds number ranges from 100 to 900 using water–G nanofluid and computed using Equation (16), with the solid concentration maintained at 0.01 and heat flux at 10
6 W/m
2.
4.7. Field Synergy Number
“Field synergy” refers to the synergistic interaction between the flow velocity field and the velocity distribution in an entire flow domain. The efficiency of convective heat transfer is contingent upon the fluid’s velocity, temperature differential with the wall, physical characteristics, and how effectively these components interact. The field synergy number is a key parameter for studying the thermal efficiency of microchannel heat sinks. It helps quantify the interaction between the fluid’s velocity field and the heat exchanger’s temperature gradient. Calculating the field synergy number provides critical insights into optimizing heat transfer and overall system performance.
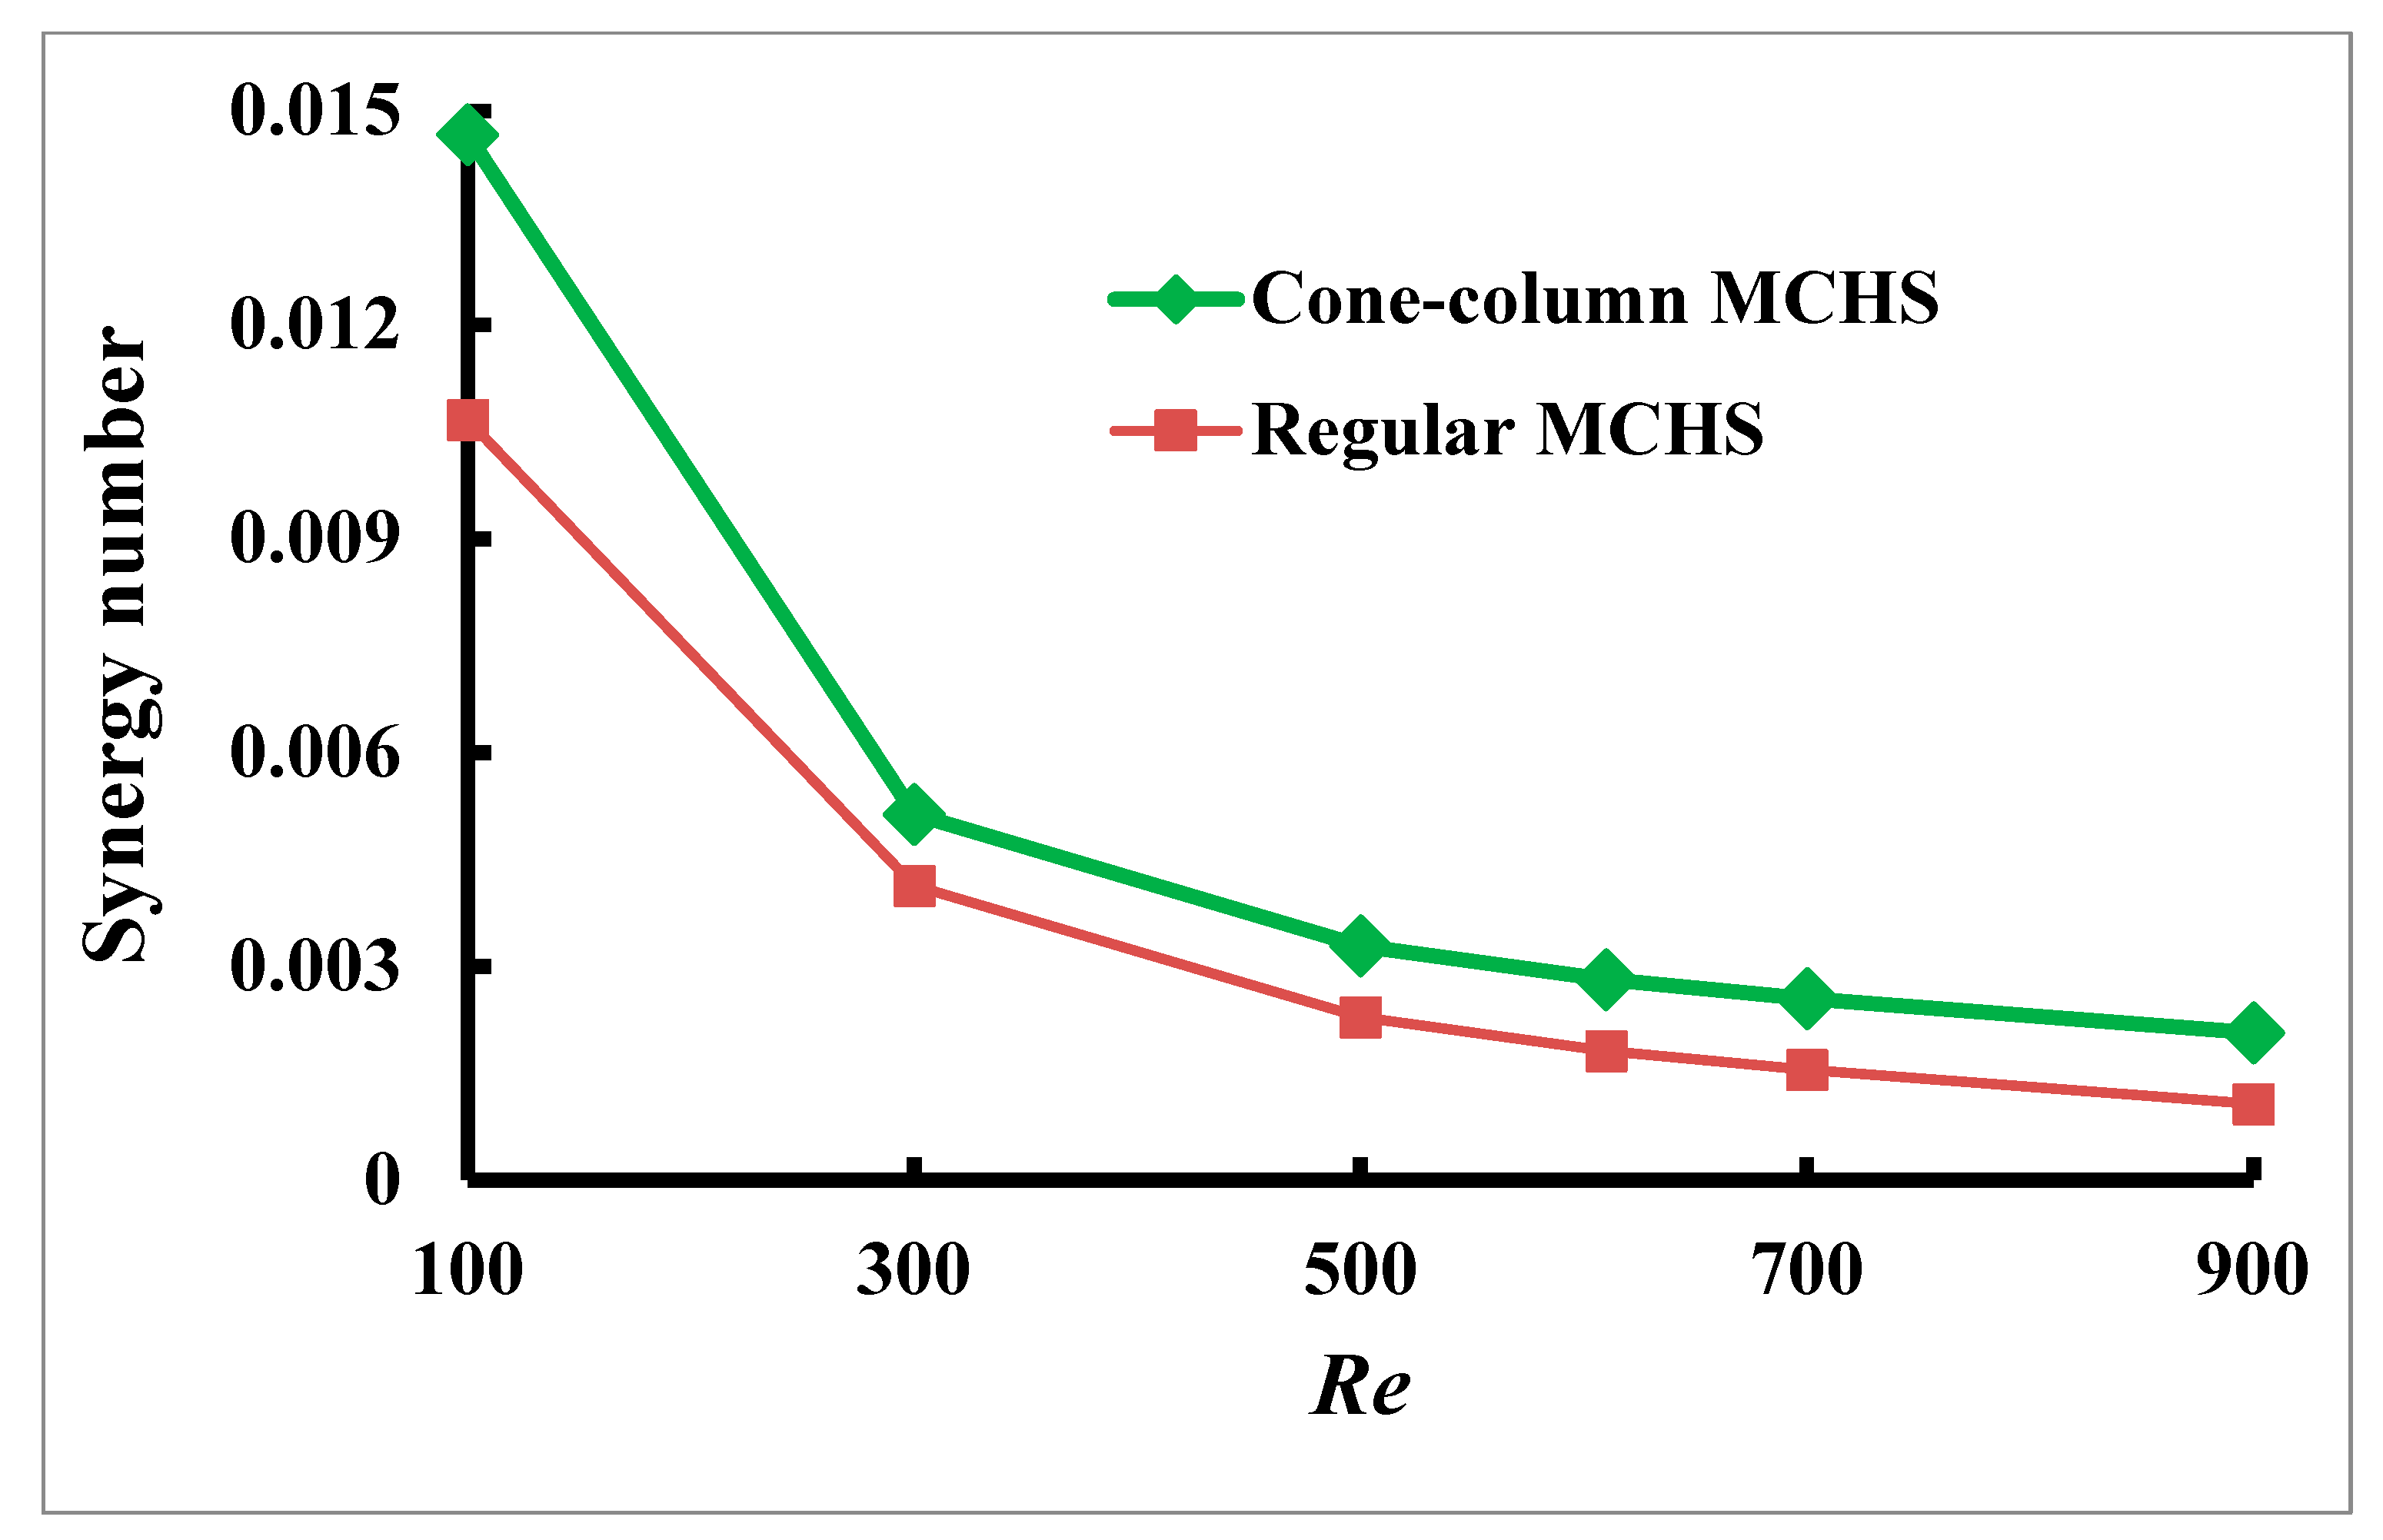
This study uses a cone–column-shaped MCHS and regular-shaped MCHS depicted in
Figure 14 to analyze how the field synergy number (
Fc) is affected by the
Re, which varies from 100 to 900. Using Equation (9), the
Fc is determined. Based on the results, the highest peak value, 0.015, occurs at a Reynolds number of 100, with a noticeable change between this value and 500. Subsequently, the field synergy value gradually decreases. Consequently, as the
Re rises and reaches 900, the degree of synergy decreases to nearly zero as 0.002, and 0.00107 for cone–column combined MCHS and regular-shaped MCHS, respectively, as illustrated in
Figure 14. According to the results, the heat conduction field and fluid velocity distribution benefit from nanoparticles in water, especially in fluid temperature dispersion and flow rate.
4.8. Apparent Friction Factor and Relative Friction Factor
The apparent Fanning friction factor is a critical parameter in analyzing flow characteristics and the thermal efficiency of an MCHS. Its calculation significantly affects the overall effectiveness of the heat sink, particularly in optimizing fluid flow and heat transfer. It quantifies the resistance to fluid flow due to friction within the microchannels. This resistance is key in calculating the microchannel heat sink’s pressure drop. A higher friction factor indicates excellent flow resistance, requiring more fluid pump energy. Minimizing friction while maintaining effective cooling is crucial for optimizing energy efficiency.
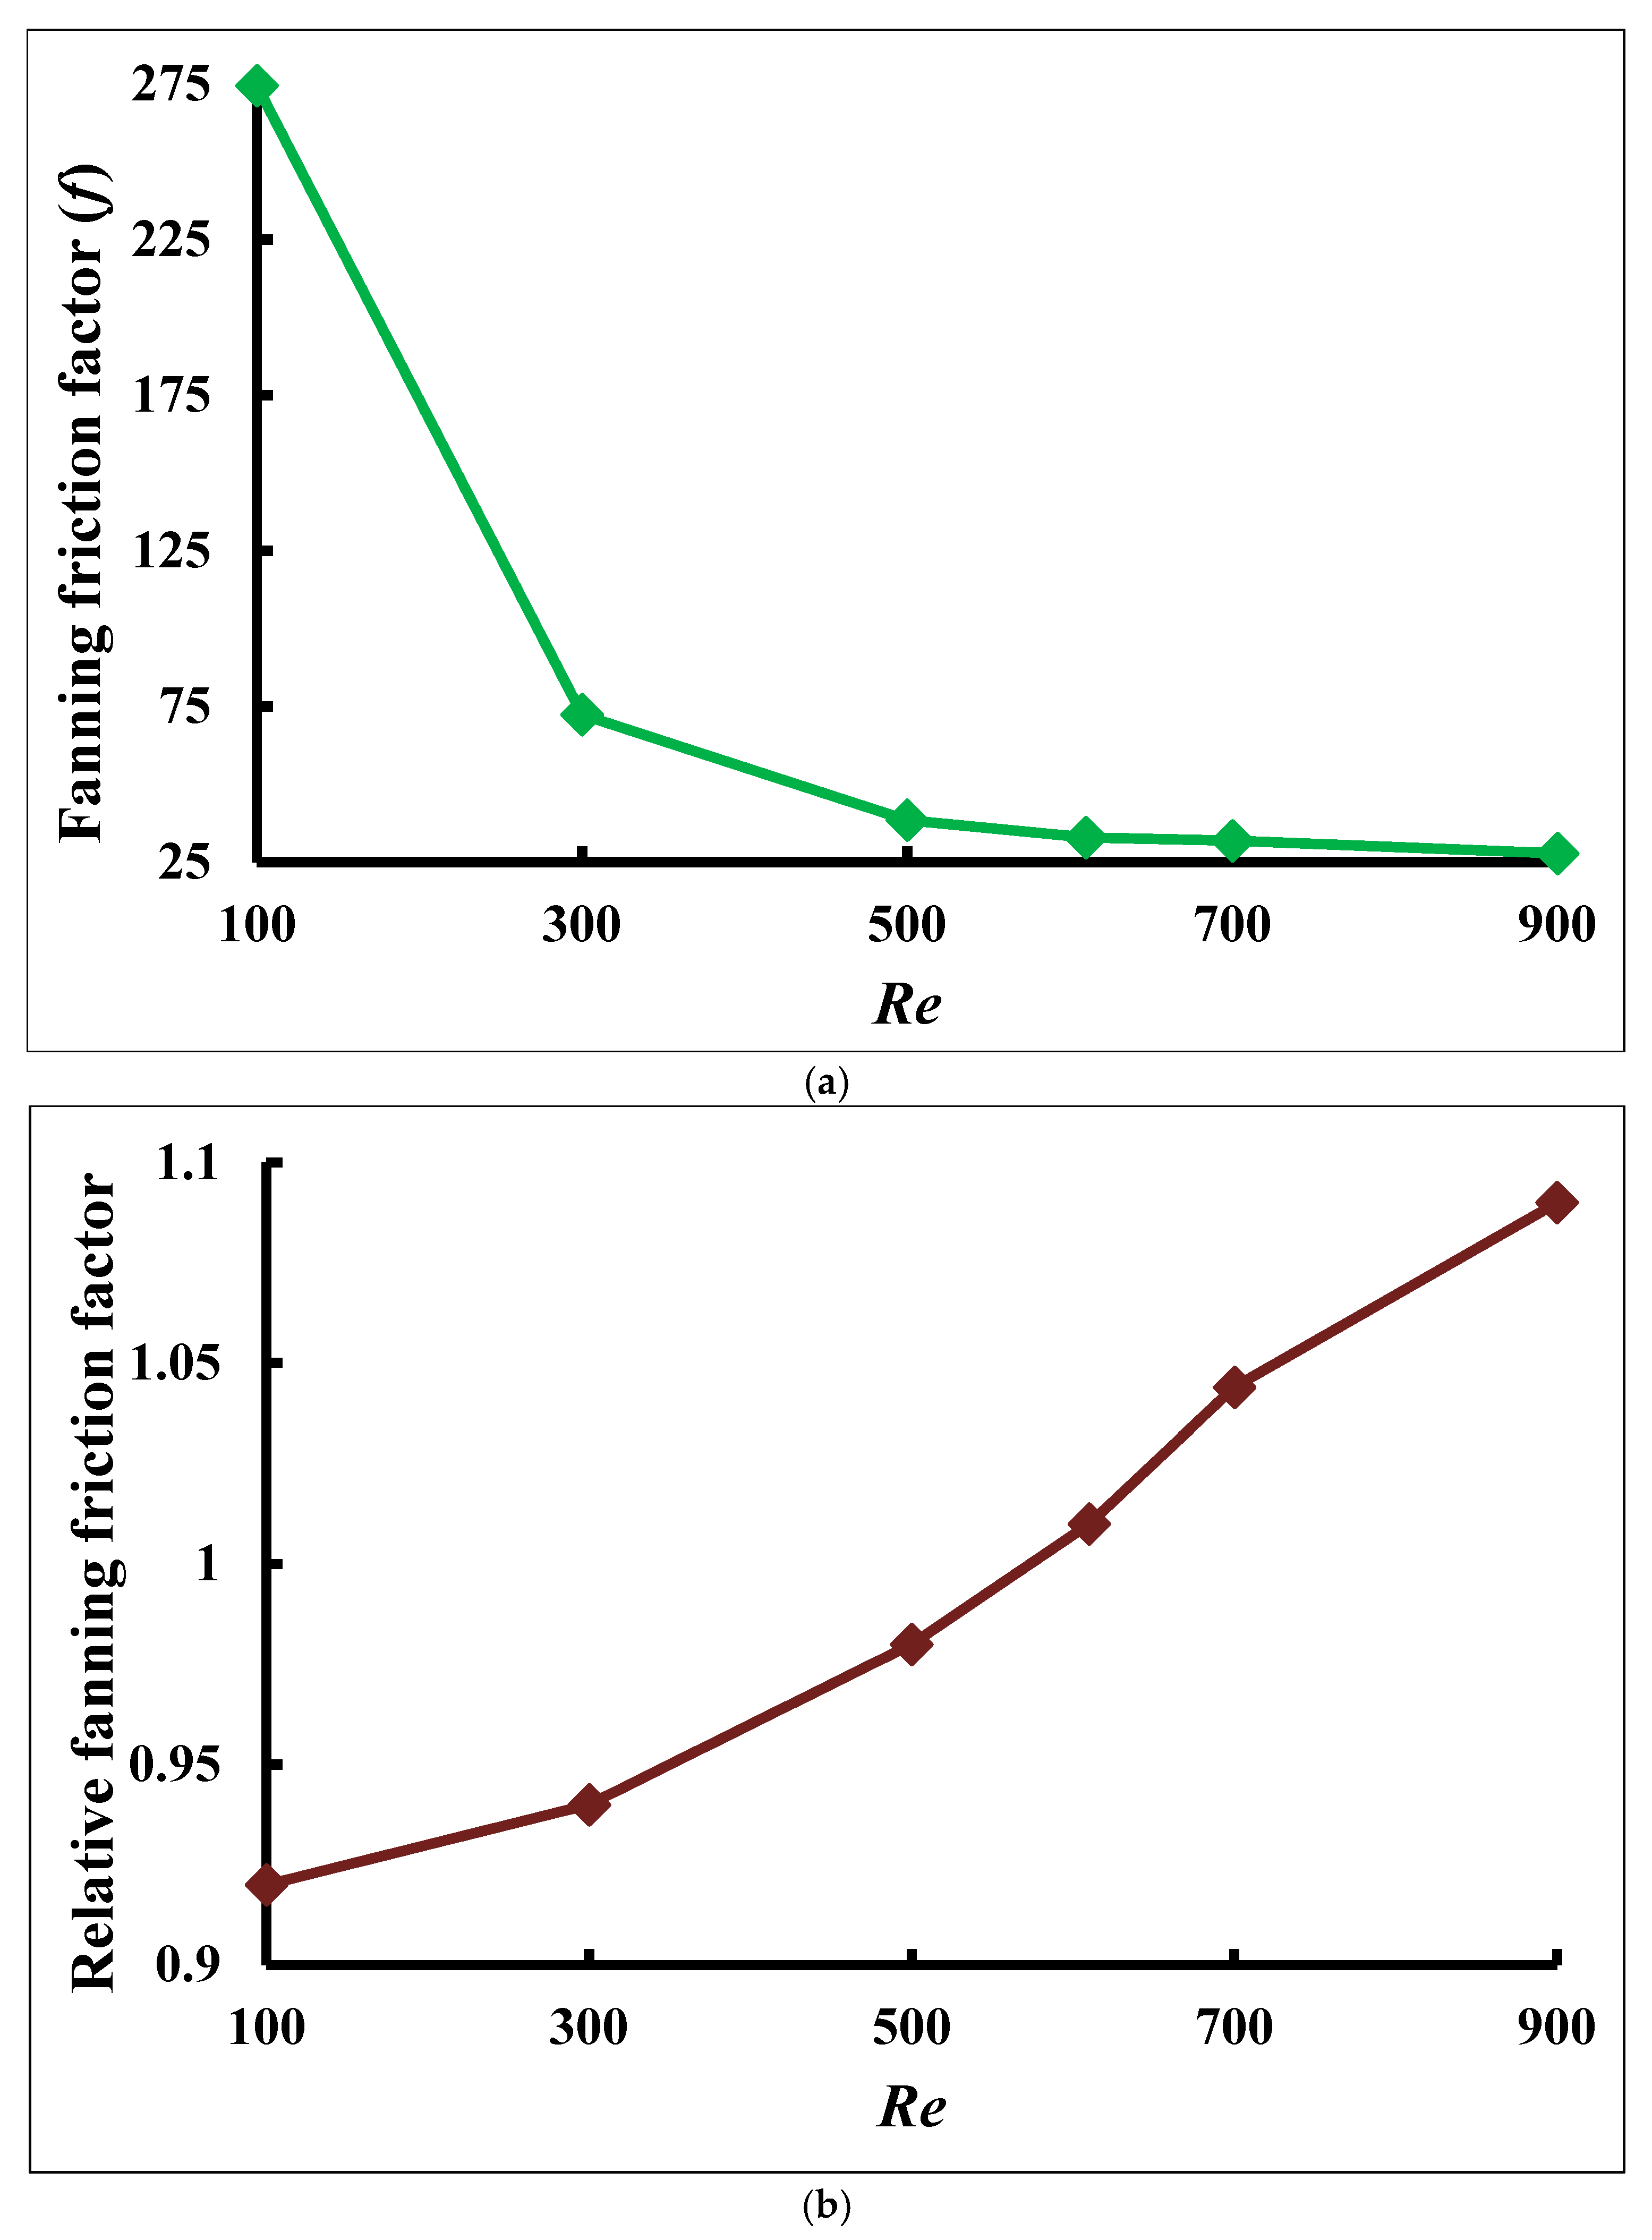
When using water–G nanofluid, the Fanning friction factor and the relative Fanning friction factor for cone–column MCHS can be calculated using Equations (12) and (13), as shown in
Figure 15a,b. The Fanning friction factor computes pressure drops resulting from friction and is inversely proportional to velocity and directly proportional to pressure drop. The friction factor in
Figure 15a lowers as the
Re increases. According to the calculations, the Fanning friction factor value drops quickly up to 500 and then gradually goes up to 900, although
Re and the inlet velocity are increasing. The maximum and minimum values of the apparent friction factor are observed as 274.376 and 27.834, at
Re = 100 and 900, respectively. Still, after that, the values start dropping gradually. According to the diagram, the most significant improvement in relative Fanning friction occurs when the Reynolds number approaches 900 (
Figure 15b), with a value of 1.09 for the water–G nanofluid. Due to the relative Fanning friction factor, the Reynolds number is simultaneously rising quickly. Thus, the relative Fanning friction raises the rate of thermal enhancement to a greater degree than water while employing nanofluid.
4.9. Mean Temperature
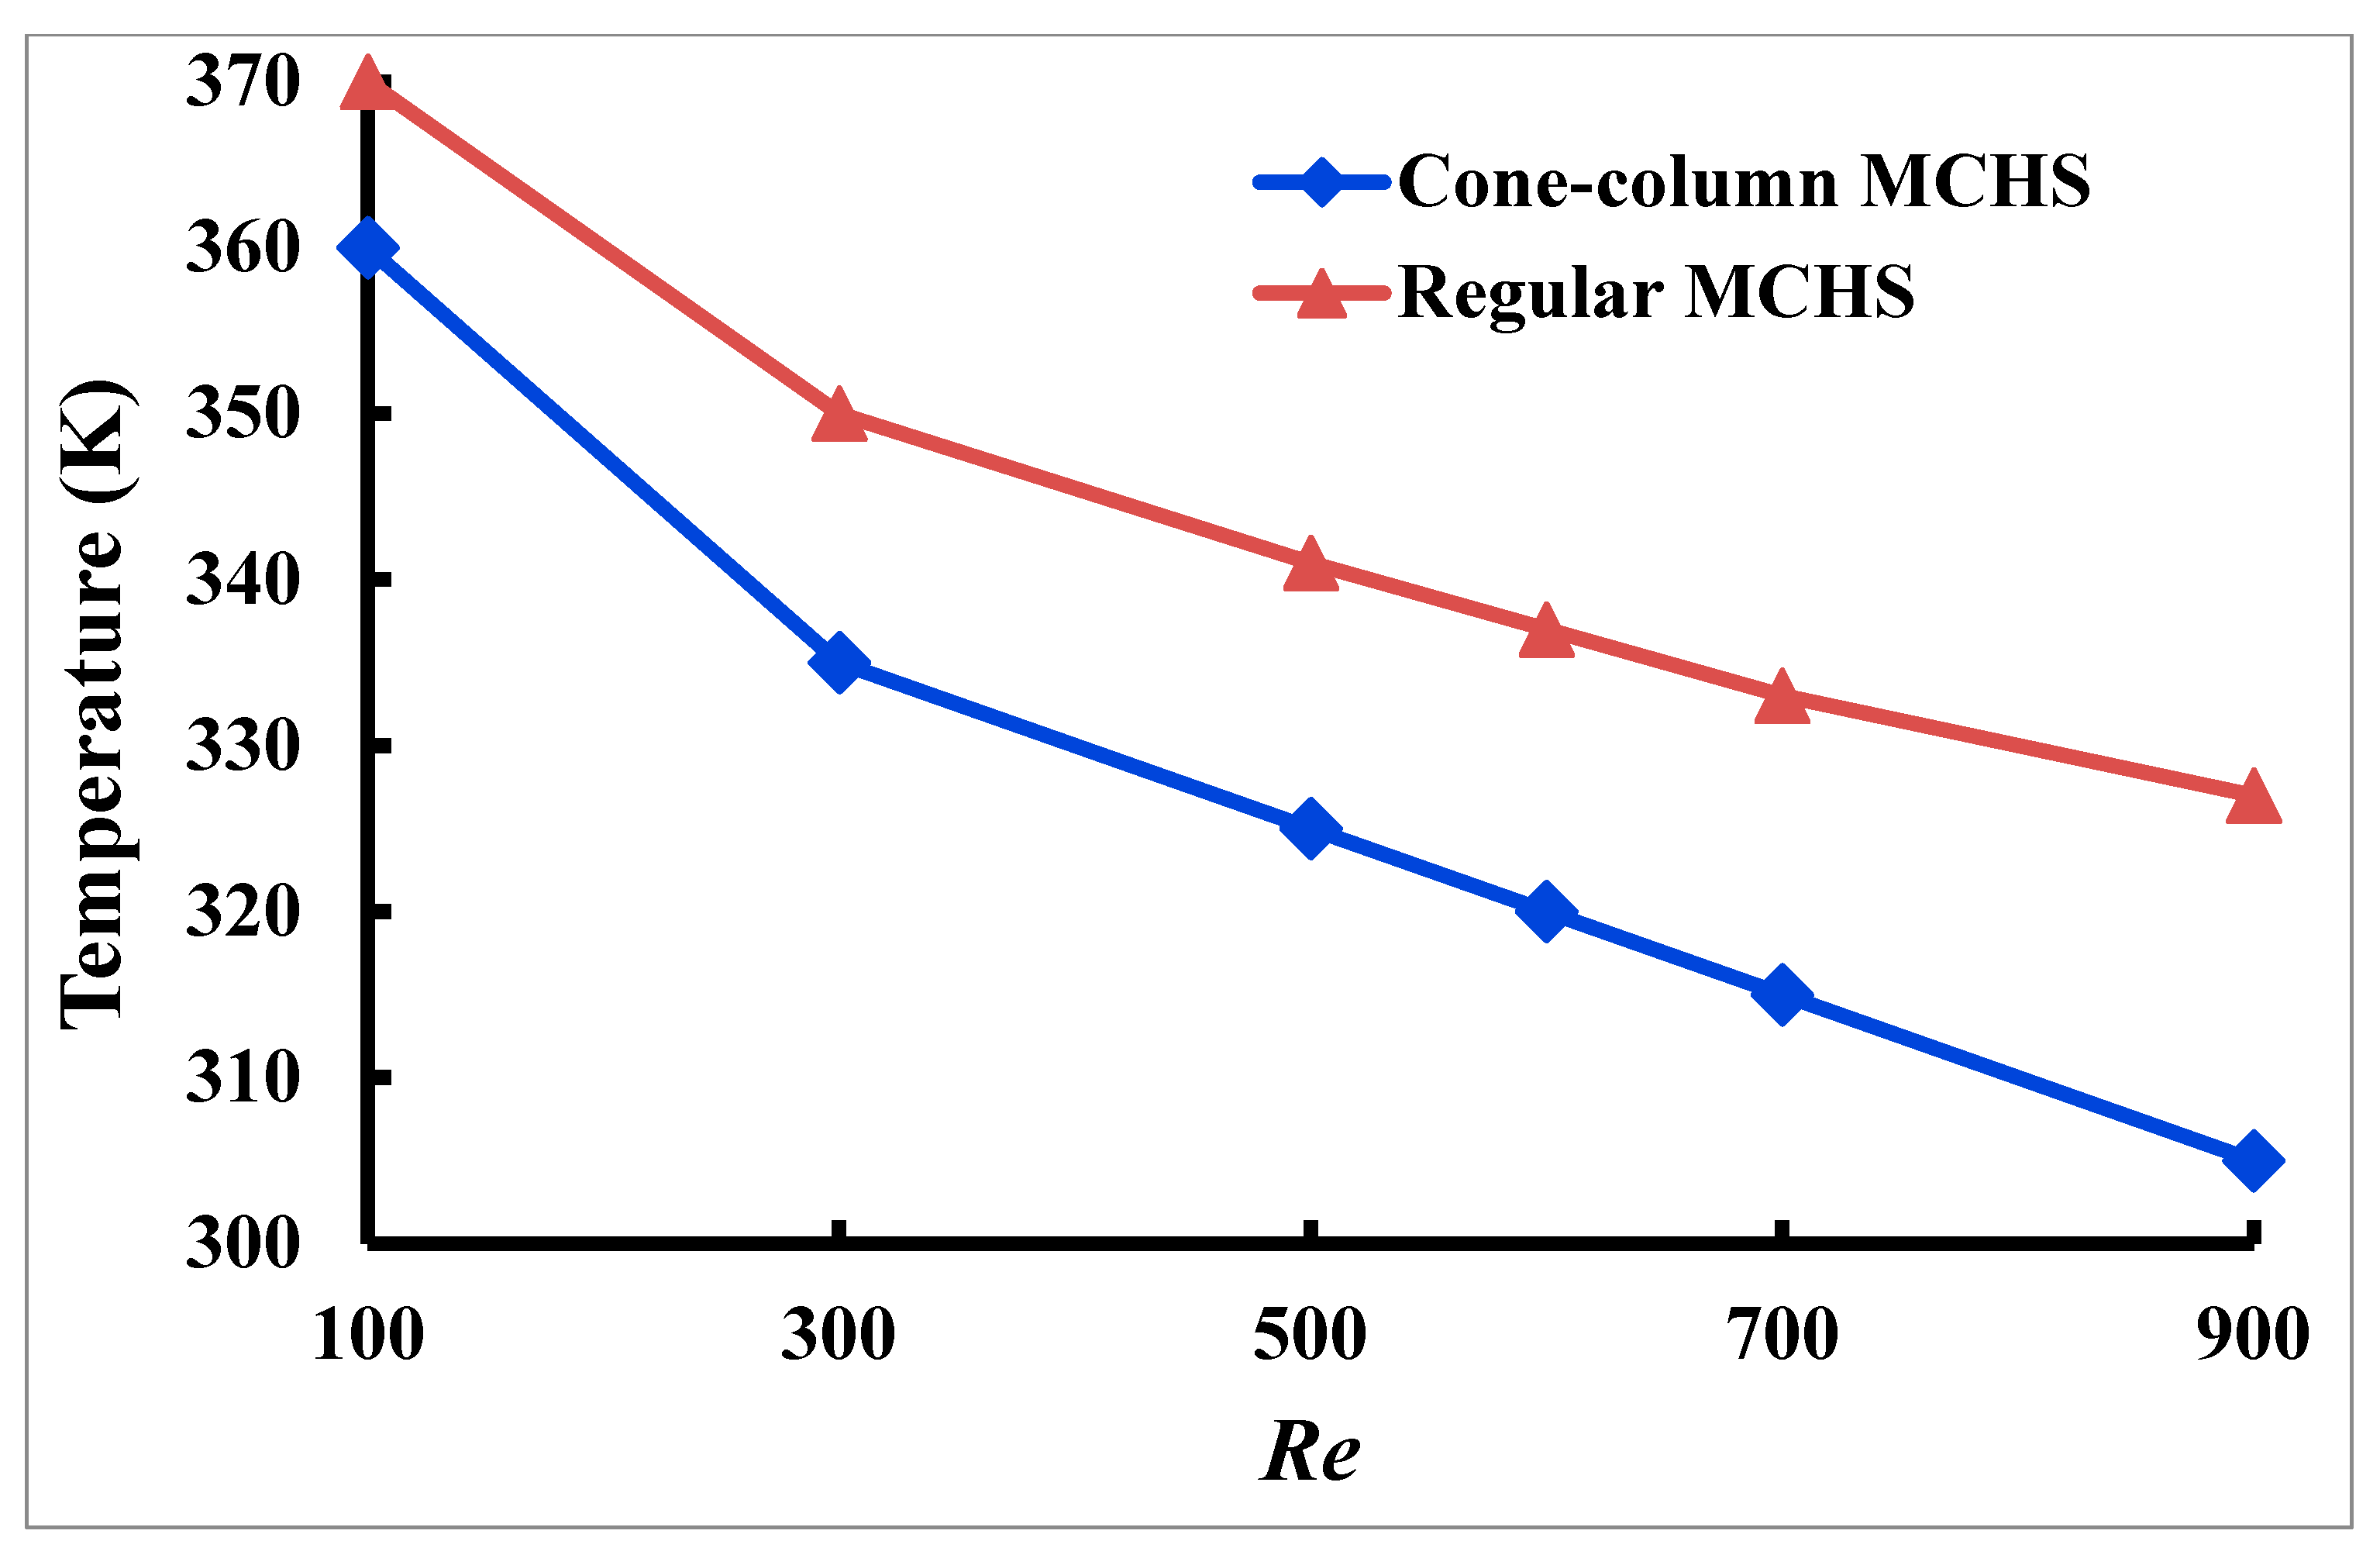
The more effective heat transmission effect of the MCHS is directly reflected in the substrate’s mean temperature. Using 1% concentrated water–G nanofluid,
Figure 16 illustrates how the
Re changes the average temperature of the circular microchannel substrate and the cone–column combined heat sink.
Figure 16 shows that when
Re increases, the mean temperature of the combined cone–column heat sink’s base consistently decreases compared to the mean temperature of the circular microchannel. Compared to the circular microchannel, the combination cone–column heat sink provides structural advantages, as evidenced by a significant drop in the mean base temperature when
Re increased from 100 to 200. The circular microchannel’s average temperature base drops as
Re rises to 900, and the reduction in amplitude is also slowed down. The decreasing rates of the bottom heated surface’s average temperature are about 15.28% and 11.62% due to rising values of inlet velocity for the cone–column and regular MCHS, respectively.
4.10. Thermal Efficiency
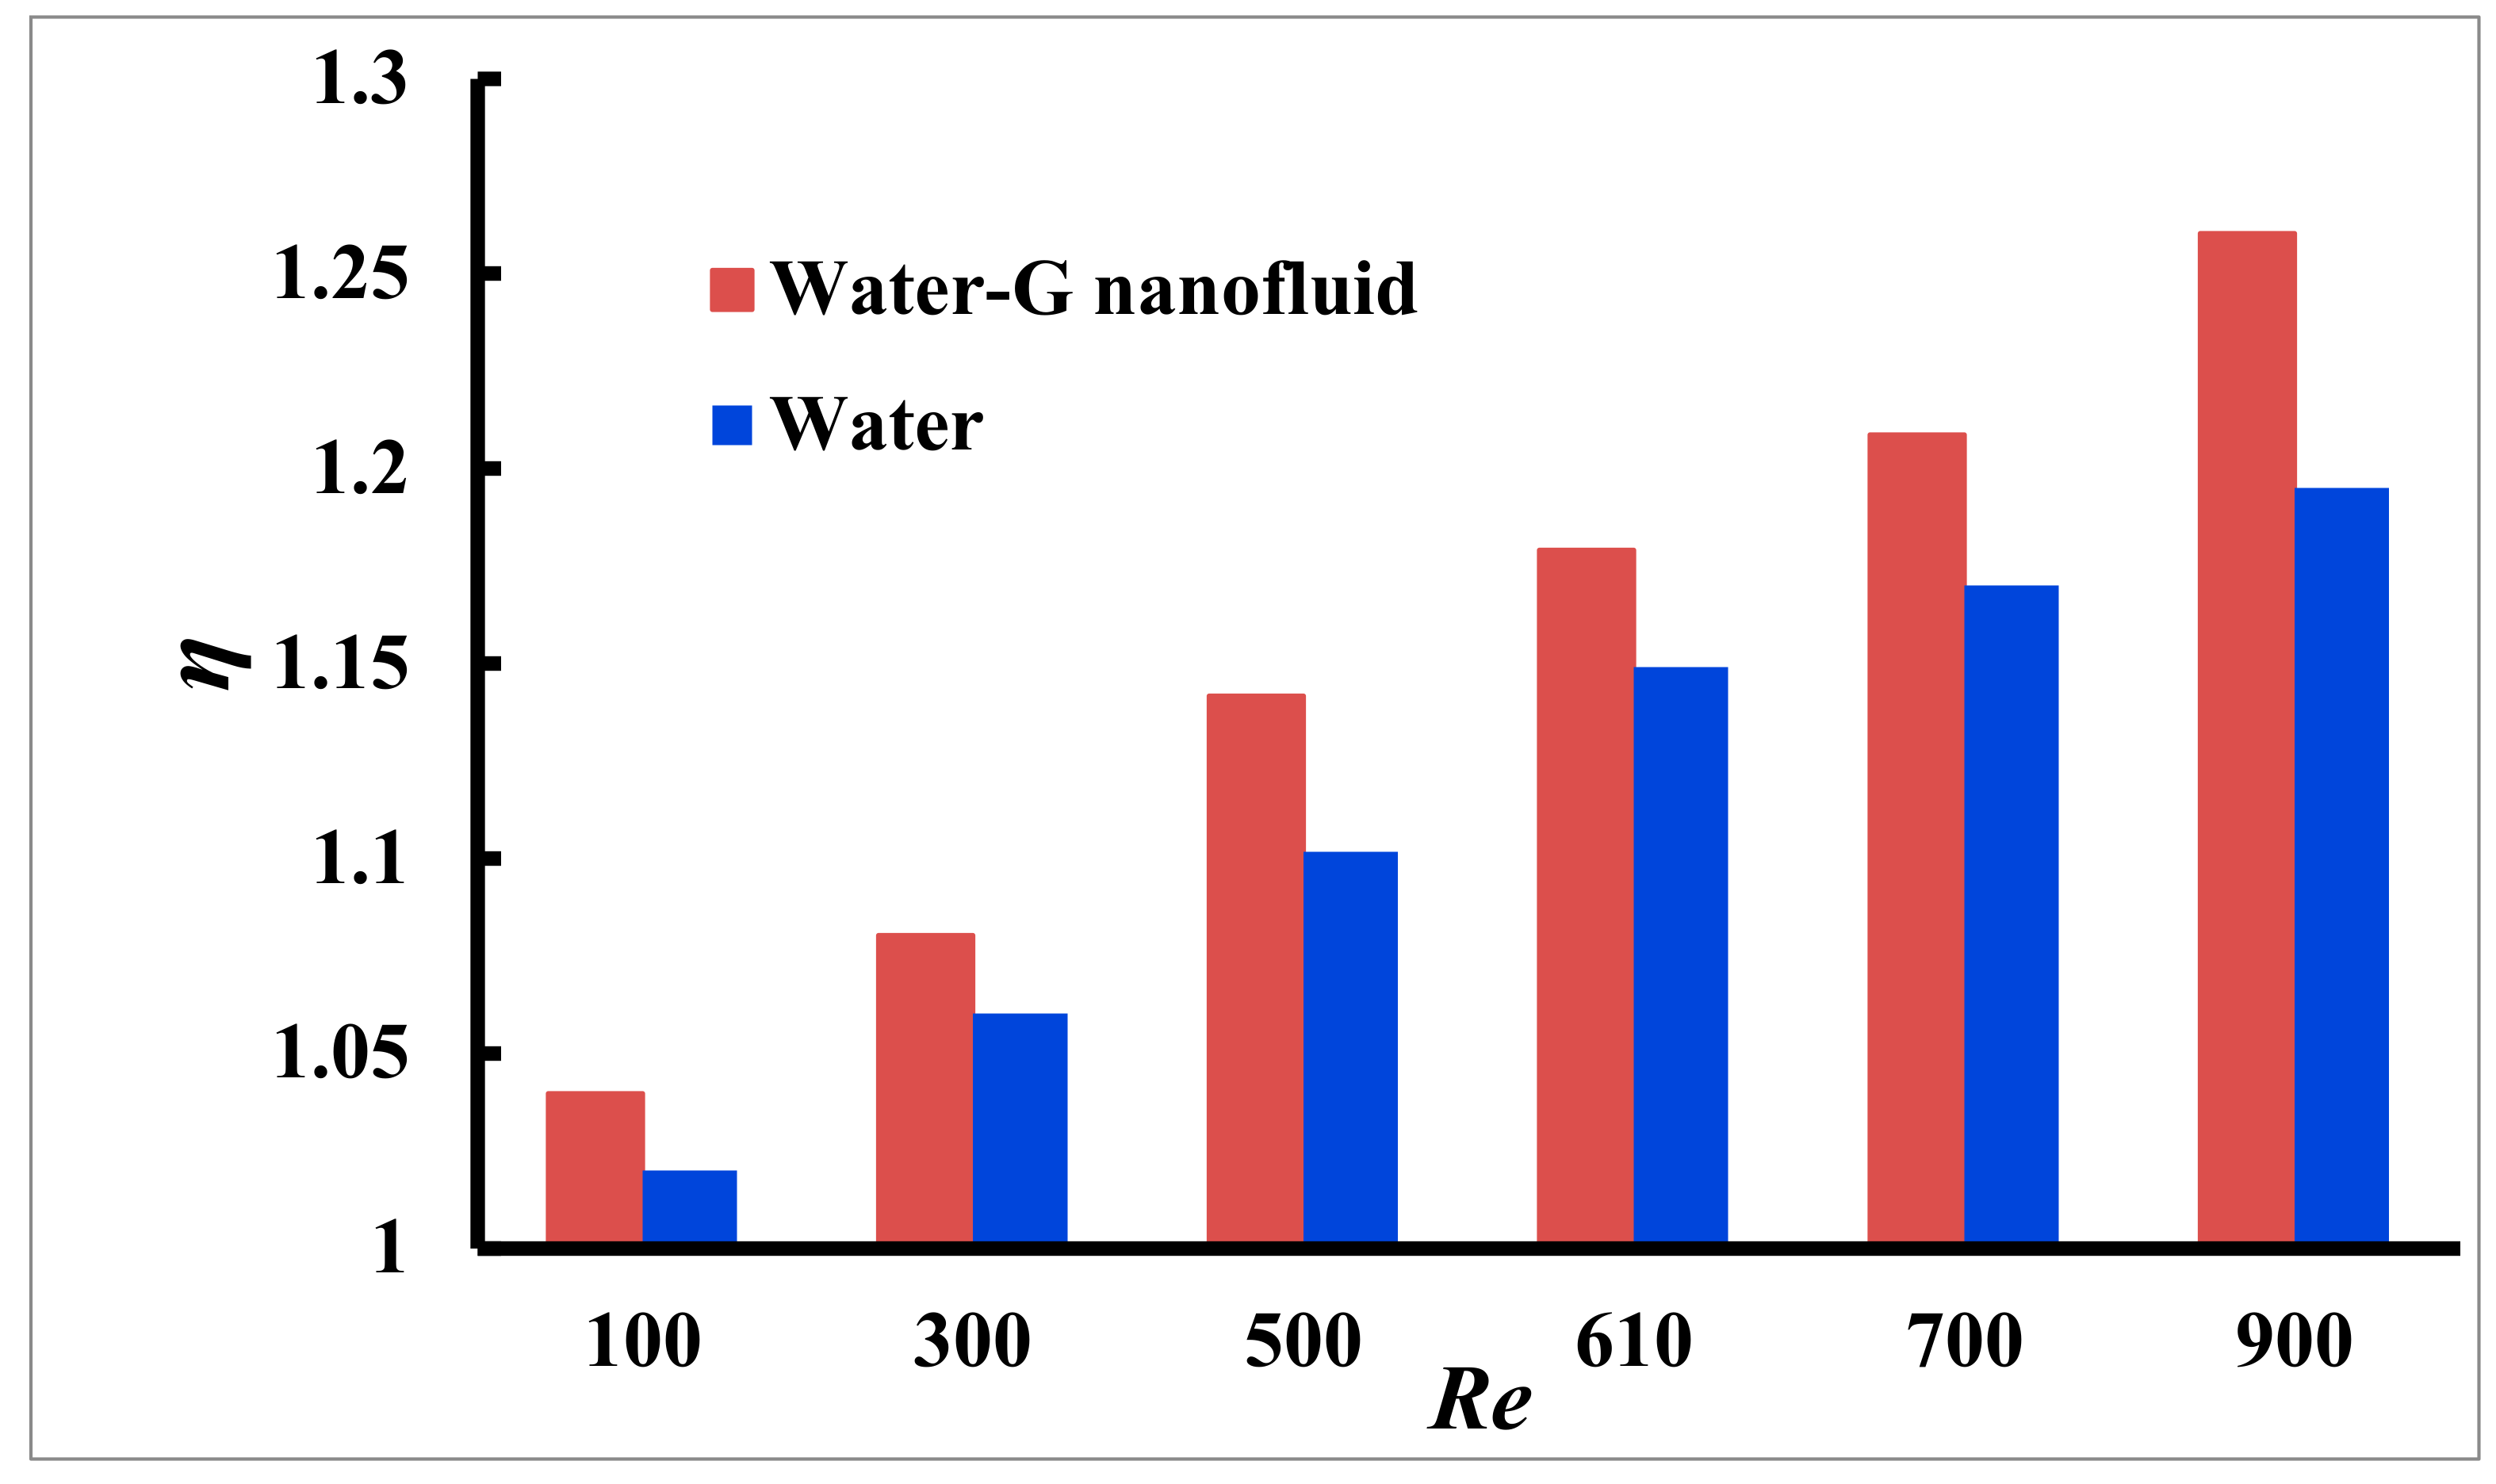
At a constant pumping power, after calculating the thermal efficiency boost using Equation (15),
Figure 17 depicts how thermal improvement affects efficiency (
η) to
Re. The cone–column-shaped MCHS’s thermal enhancement efficiency increases from 1.04 to 1.26 as the
Re increases from 100 to 900, with a 1% solid concentration of water–G nanofluid and a heat flow of 10
6 W/m
2. However, using base fluid water, the values are from 1.02 to 1.195 for rising values of
Re.
4.11. Performance Index
The hydraulic performance index (
Pi) measures how well a microchannel heat sink balances heat transfer improvement and pumping power needs.
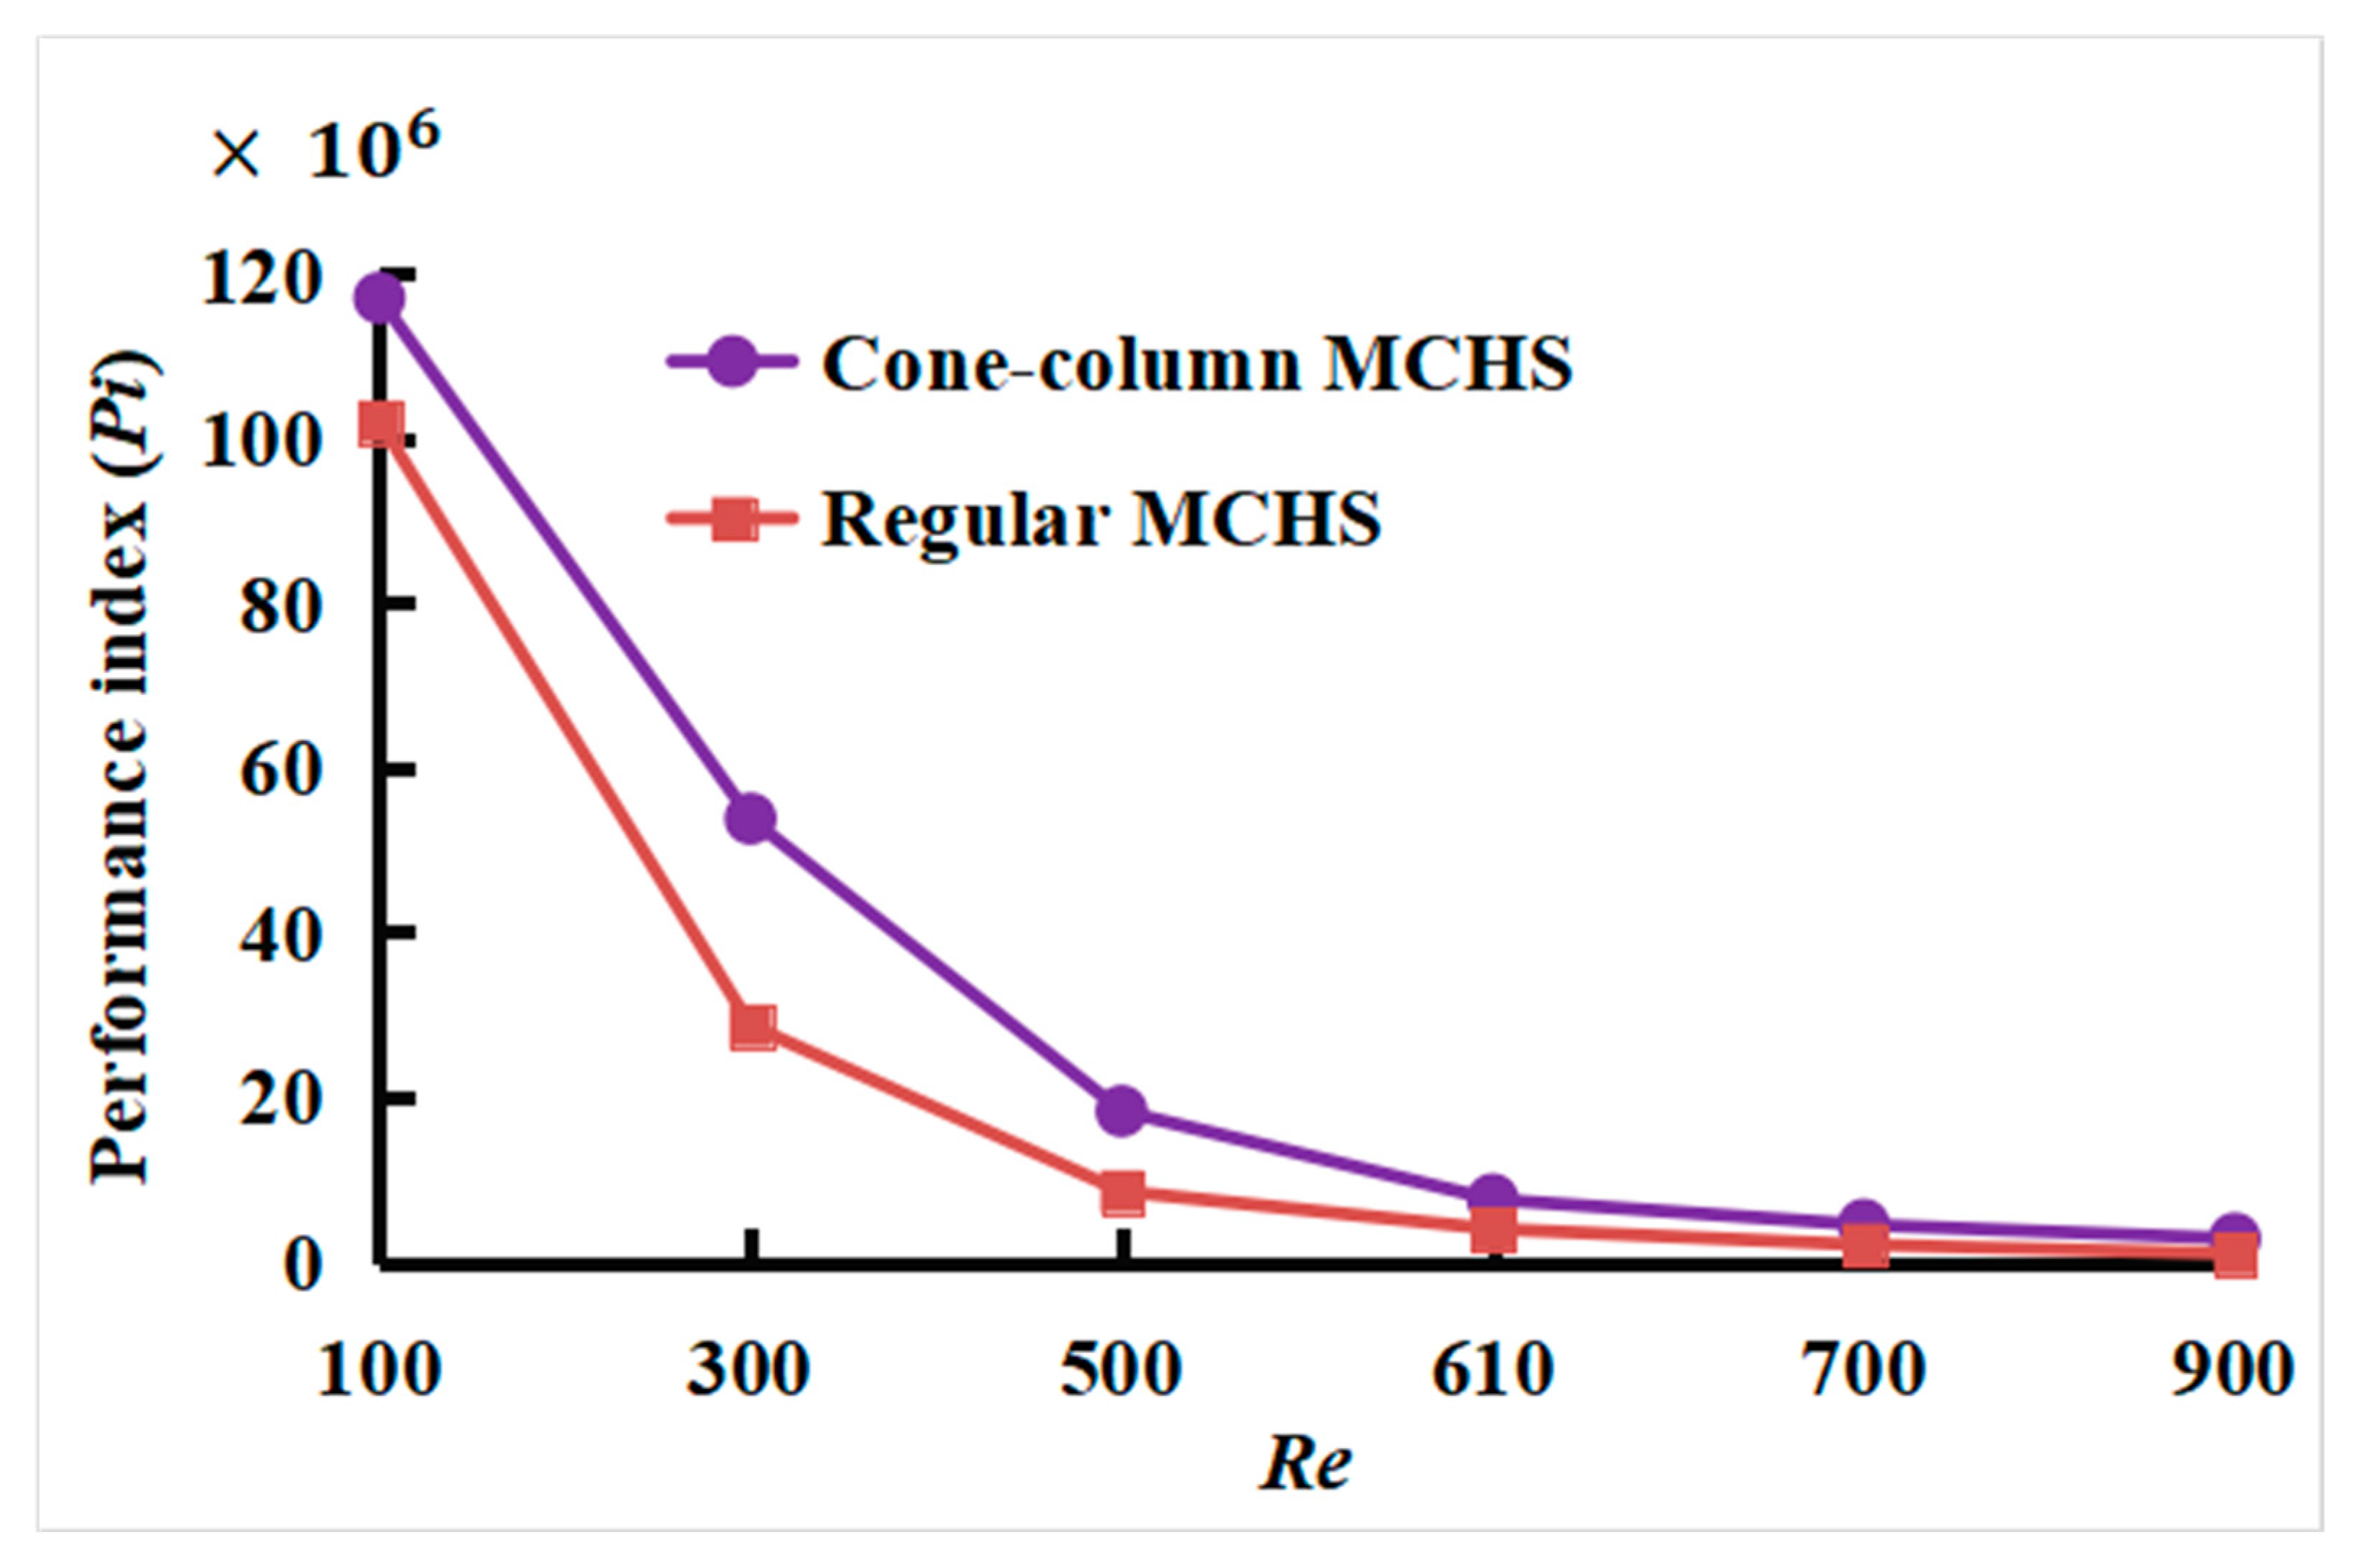
Figure 18 indicates that the regular-shaped arrangement starts with exceptionally low
Pi versus Reynolds number variations compared to the cone–column arrangement. The performance index values vary from 1.17 × 10
8 to 2.83 × 10
6 for the cone–column MCHS, whereas they vary from 1.02 × 10
8 to 1.01 × 10
6 for the case of regular-shaped MCHS due to the variation of
Re from 100 to 900. Thus, cone–column MCHS indicates more predictable and sustainable performance. This makes it a stronger candidate for applications requiring consistent performance across various operating conditions. The rapid performance reduction in the regular layout MCHS demonstrates its limitations at more significant flow rates. In contrast, despite its slightly higher pressure drop and pumping power, the cone–column design with a lower Reynolds number ensures greater long-term efficiency and operating stability.
4.12. Comparison
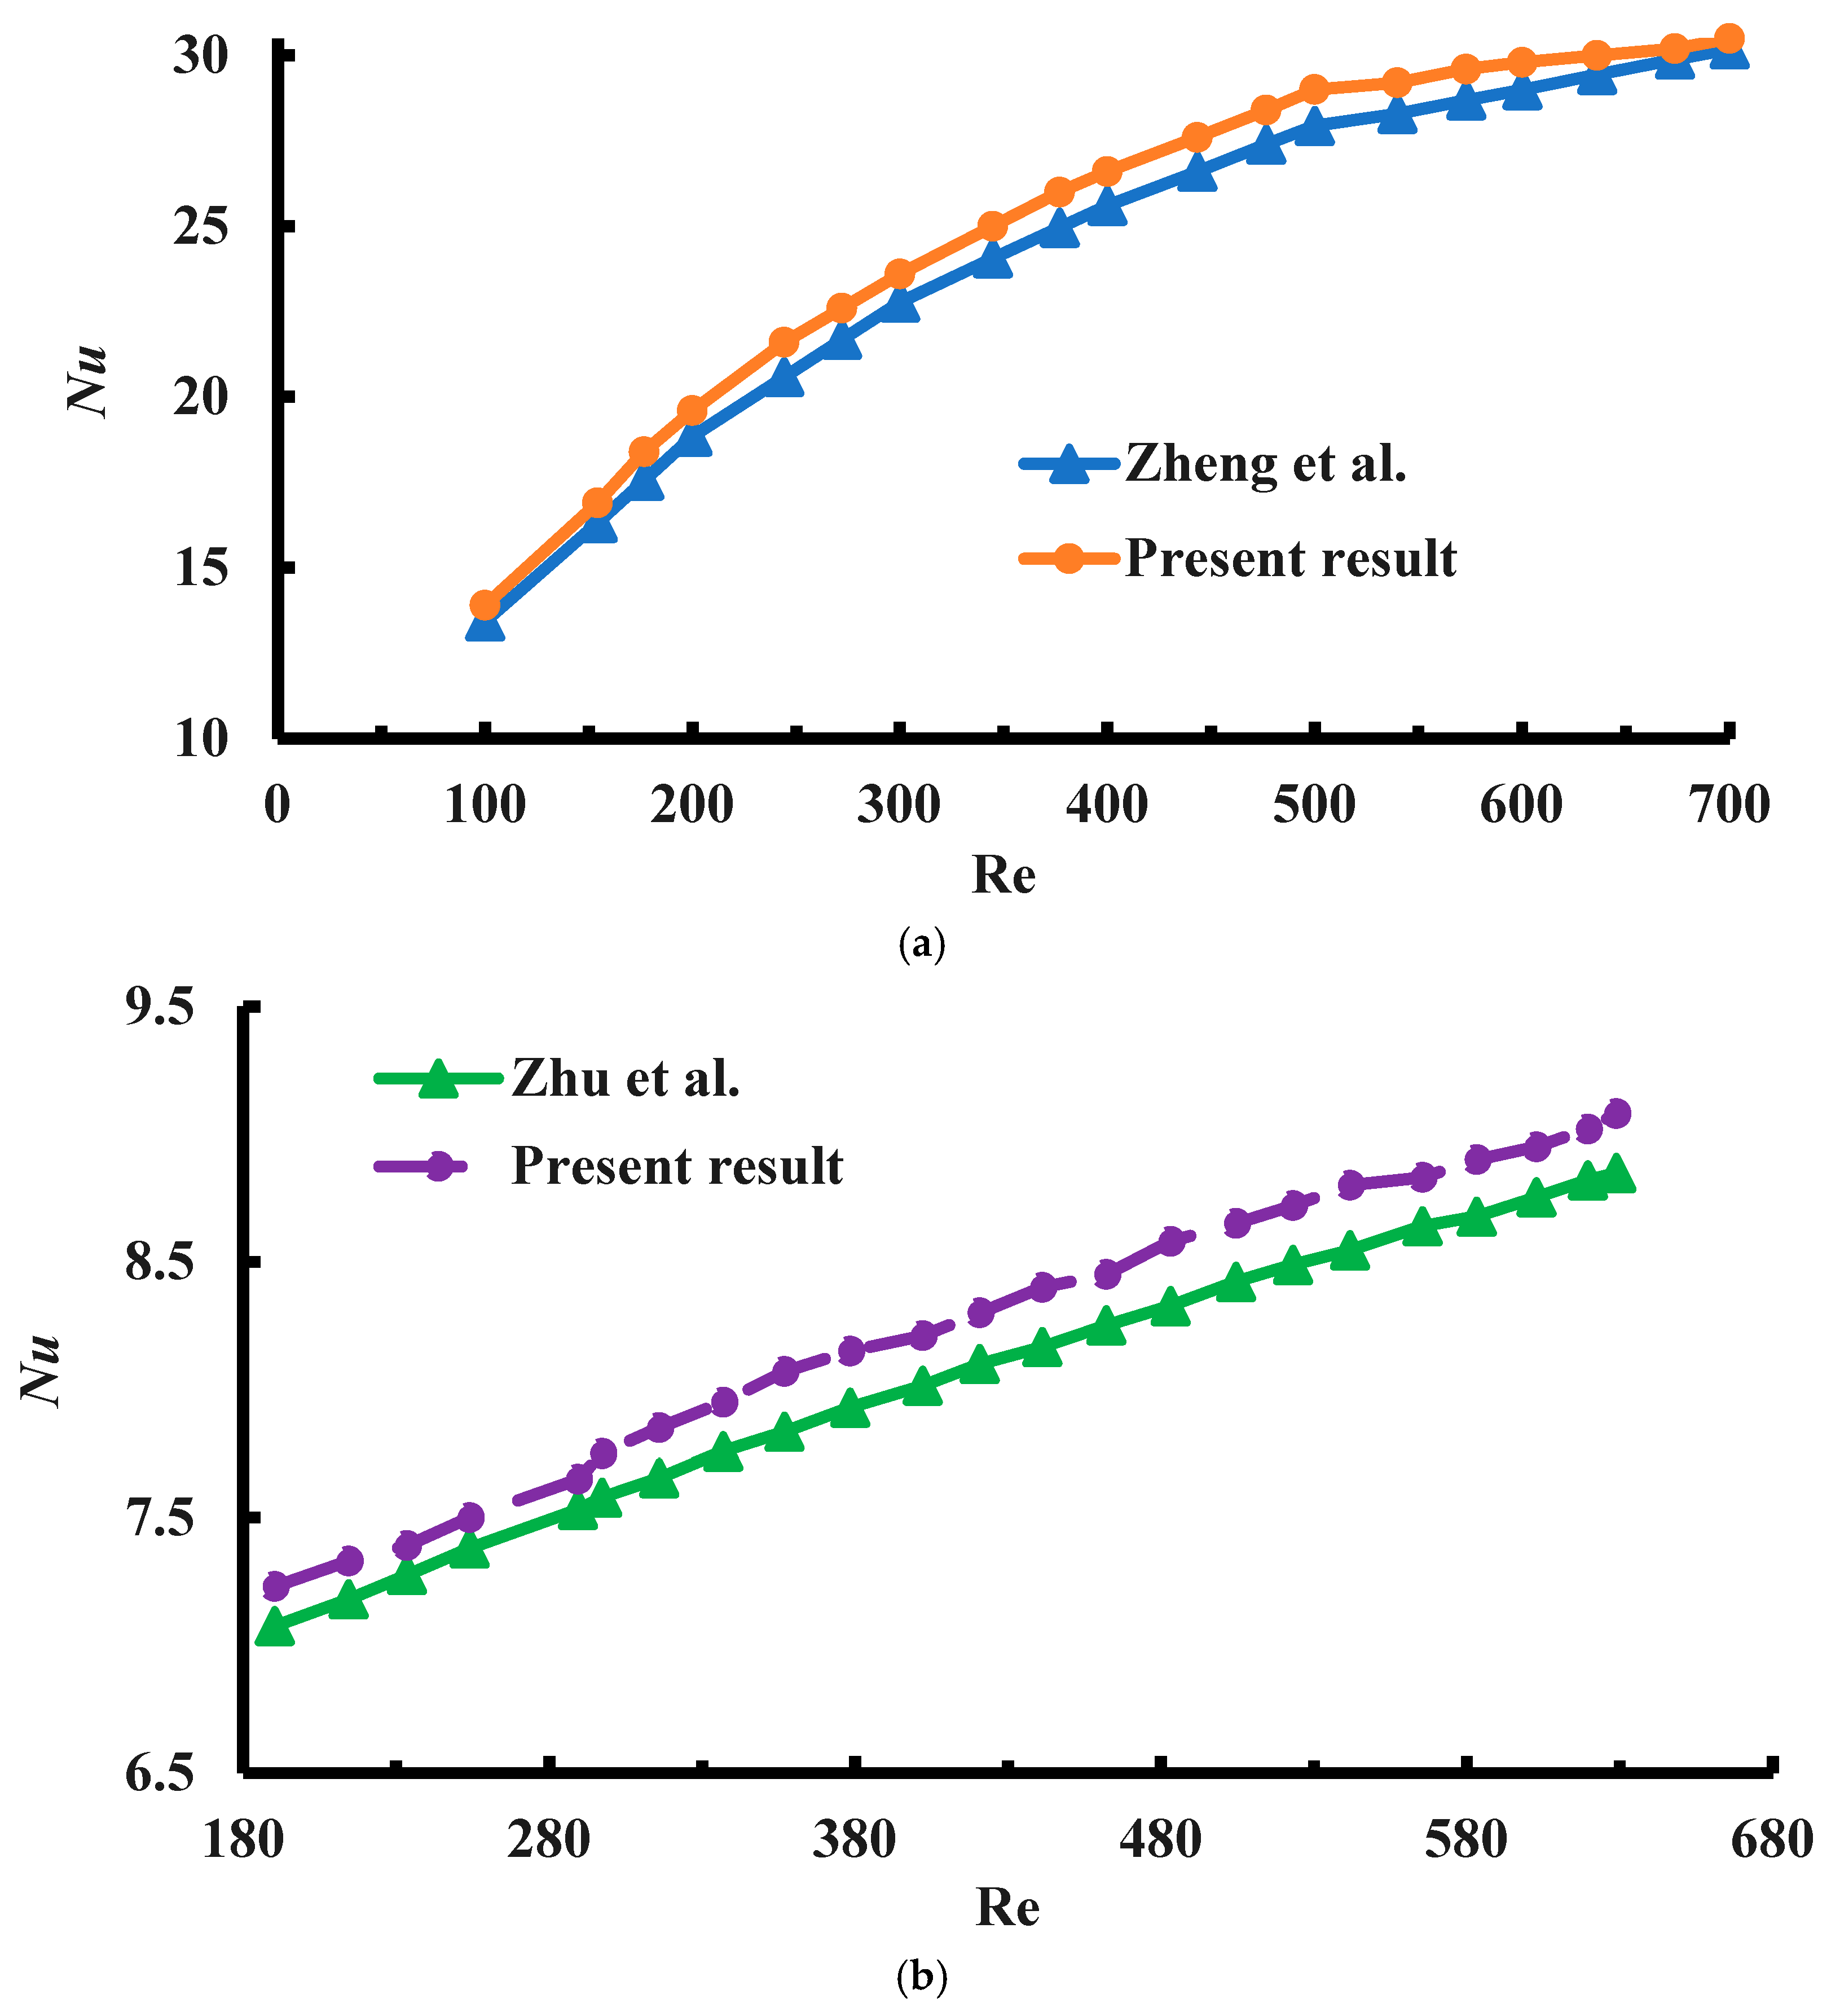
The numerical result of the average Nusselt number versus the
Re is compared with that of Zheng et al. [
1]. For this comparison, the working fluid utilized is pure water whose characteristics have been provided in
Table 1, and a cone–column-shaped channel is considered. The present code values are calculated using Equation (10b) for this comparison. The comparison result is shown in
Figure 19a. The data are extracted using Web Plot Digitizer (Version 4.5) software from
Figure 9 of Zheng et al. [
1]. The values of
Nu for current and accessible numerical data lie between 13.44 and 30.5, with the lowest and highest errors being 1.05% and 4.93%, respectively. Again, the clear water as the working fluid and smooth channel are used to numerically compare the mean Nusselt number to
Re in contrast to Zhu et al. [
36]. The findings are illustrated in
Figure 19b. The data are extracted from
Figure 11 of Zhu et al. [
36] for this comparison using Web Plot Digitizer (Version 4.5) software. Equation (10a) is used to calculate the values of
Nu. According to the current and available numerical data, the heat transfer rate ranges from 7.08 to 9.08, with a minimum inaccuracy of 1.58% and a maximum inaccuracy of 3.04%. The numerical findings agree with Zheng et al. [
1] and Zhu et al. [
36].
5. Conclusions
This research uses a dynamic model to investigate heat transport and flow of nanofluid containing graphene and water within a cone–column combined and regular-shaped MCHS. It examines flow patterns, the base fluid’s and the nanofluid’s thermal fields, the effects of various parameters, and the effect of the cavity’s sloping angles. The main interest in using the water–G nanofluid is that it has higher variations in the heat transfer rate (Nu) values than the base fluid. Thus, compared to a base fluid, a nanofluid is a more appropriate and efficient fluid medium for obtaining enhanced heat transfer performance. Furthermore, an exciting finding from the research is that using different concentrations of graphene nanoparticles within water (which creates a nanofluid) enhances heat transfer performance. However, the key findings of the investigation are as follows:
The Reynolds number variation and its impact on the streamlines and isothermal lines using the MCHS is studied using water–G nanofluid with a fixed solid volume fraction of 1% and an external heat flux of 106 W/m2. It shows that as the Reynolds number increases, the Nusselt number increases by 27.00% and 20.62% using water–G nanofluid and water, respectively.
When the solid concentration rises from 0.1% to 4% with a constant Reynolds number of 600 and heat flux of 106 W/m2, the average Nusselt number value increases compared to water. The enhanced rate of heat transfer is 9.09% compared to water.
In the cone–column combined MCHS and regular MCHS, the pressure drop occurs when the Reynolds number values are enhanced for water–G nanofluid. It increases by 605.79% and 695.86% for cone–column combined and regular-shaped heat sink.
With the range of 100 to 900 for the Reynolds number, the synergy number varies. At 100, the synergy number stands at its summit, and as the Reynolds number increases, the synergy number gradually decreases for both cone–column combined and regular-shaped MCHS.
The apparent friction factor exhibits maximum and minimum values of 274.376 and 27.834 at Re = 100 and 900, respectively, and as an impact of the relative Fanning friction factor, the Reynolds number increases rapidly. The relative Fanning friction factor increases with the variation of Reynolds numbers.
As Reynolds number increases from 100 to 900, the thermal efficiency increases by 21.21% using 1% concentrated water–G nanofluid and 17.16% using base fluid water. Thus, water–G nanofluid helps augment the thermal enhancement efficiency by about 4.05% more than base fluid.
The performance index of the cone–column MCHS is approximately 14.8% higher than the regular-shaped MCHS at a Reynolds number of 100.
So, the cone–column-shaped one is more thermally efficient than a regular-shaped one. The thermal efficiency is higher when using water–G nanofluid compared to pure water in a cone–column combined MCHS due to several key factors, such as enhanced thermal conductivity, increased surface area, improved convective heat transfer, higher specific heat capacity, and reduced thermal resistance of the graphene nanoparticle. In such advanced heat sink designs, these factors collectively lead to higher thermal efficiency when using water–G nanofluid over pure water.
