
Online Monitoring of Partial Discharges in Large Power Transformers Using Ultra-High Frequency and Acoustic Emission Methods: Case Studies


Abstract
1. Introduction
- The ability to immediately detect PD ignition and a sudden, sharp increase in their intensity.
- The ability to detect an upward trend in the values of parameters describing PD pulses, thanks to which the maintenance department can quickly develop and implement procedures that minimize the risk of failure.
- The ability to adjust the schedule of periodic diagnostic tests (e.g., accelerating or postponing them) and to plan downtimes and maintenance work based on data recorded by the PD monitoring system.
- The ability to detect the relationship between PD activity and transformer operating parameters, such as voltage, oil temperature, or on-load tap changer position, which in turn opens the possibility of forecasting PD activity based on statistical models and artificial intelligence methods.
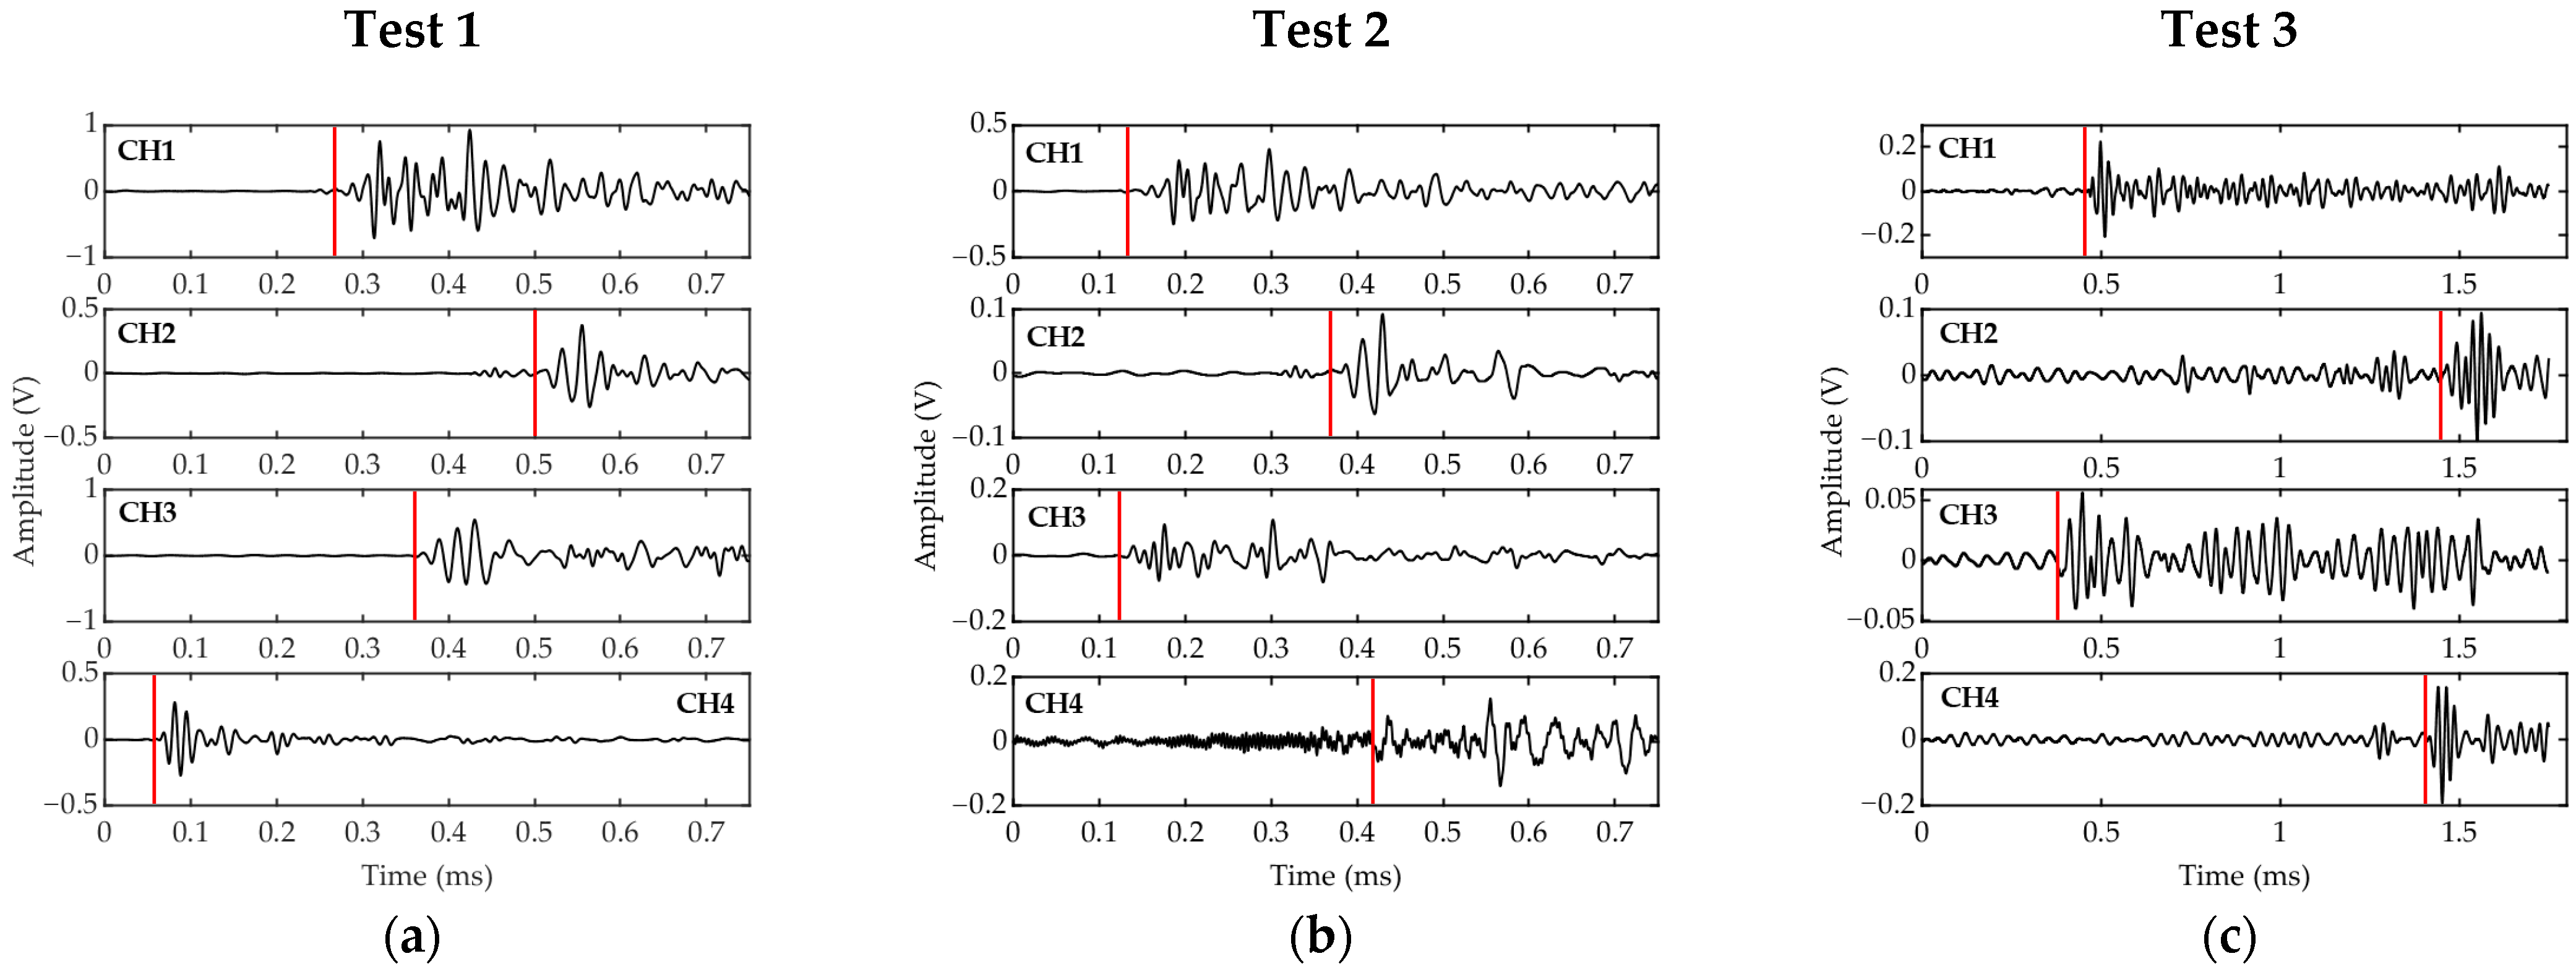
- The ability to estimate the approximate location of the PD source based on the analysis of the activity of acoustic emission transducers and then precisely determine the location of the defect using the time difference of arrival (TDoA) technique.
2. Materials and Methods
2.1. Online Monitoring of PD Using the UHF Method
2.1.1. Detection of PD Using the UHF Method
2.1.2. Parameters and Functions of the UHF PD Monitoring System
2.2. Online Monitoring of PD Using the AE Method
2.2.1. Detection of PD Using the AE Method
2.2.2. Parameters and Functions of the PD Monitoring System Using the AE Method
2.3. Localization of PD Sources Using the TDoA Technique
2.4. Case Study Objects
2.5. Methodology for Online Monitoring of PDs in Tested Power Transformers
- Step 1.
- Switching off the power transformer.
- Step 2.
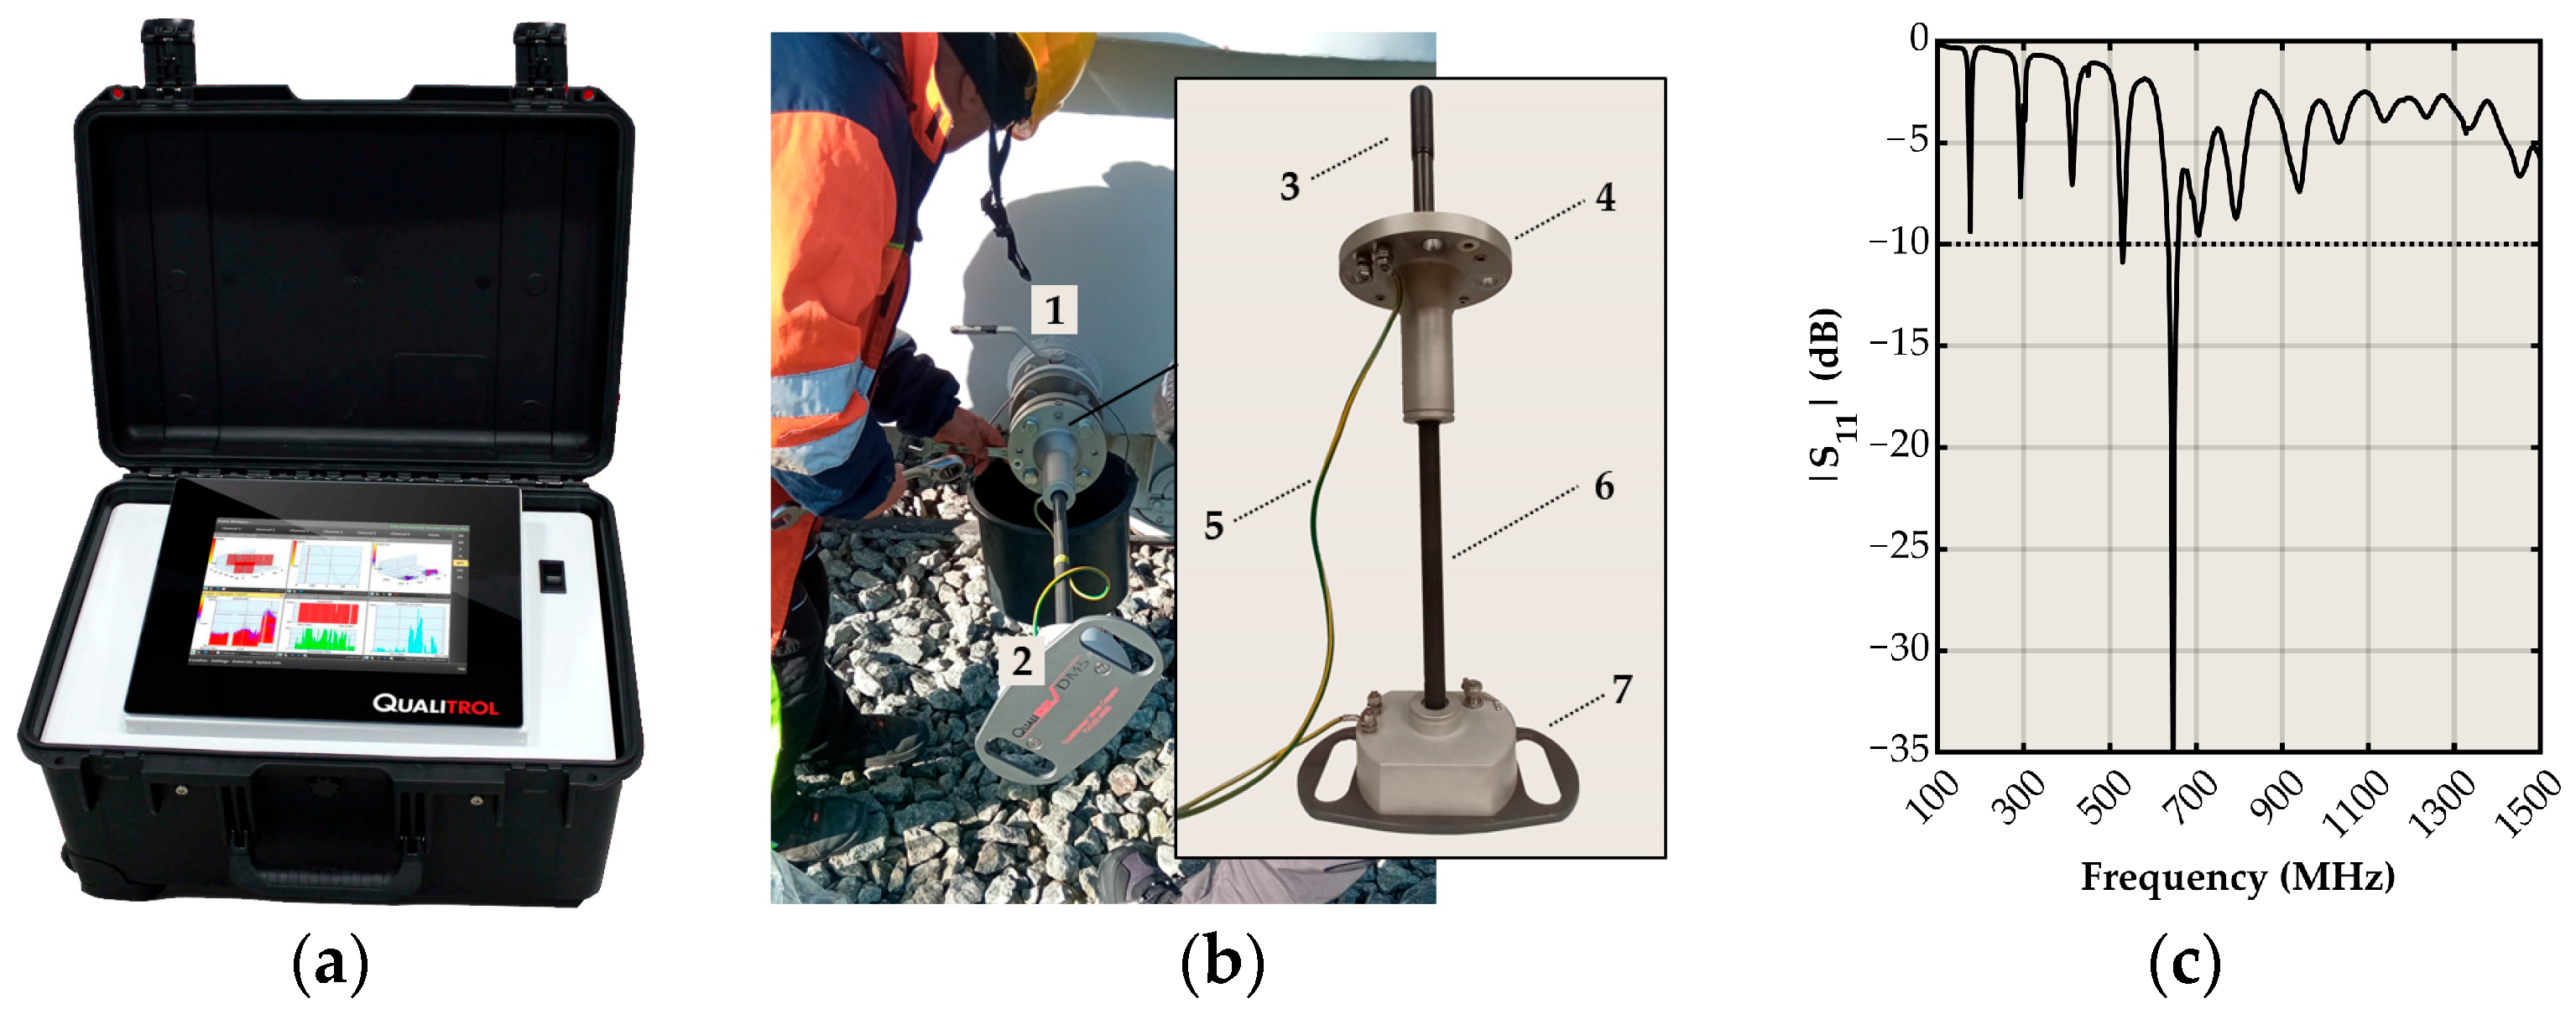
- Installing the antenna (UHF PD detector) in the transformer oil drain valve.
- Step 3.
- Determining the optimal position of the antenna in the oil drain valve. The depth of the antenna was changed in the range of ±3 cm relative to the external plane of the tank wall to achieve the minimum, close to unity value of the VSWR (Voltage Standing Wave Ratio). This procedure aimed to adapt the antenna to optimal operating conditions and minimize signal reflection losses. A portable, vector network analyzer, MEASALL KC901S+ (Measall, Chengdu, China), was used to measure the VSWR.
- Step 4.
- Installing the noise-gating antenna near the transformer tank.
- Step 5.
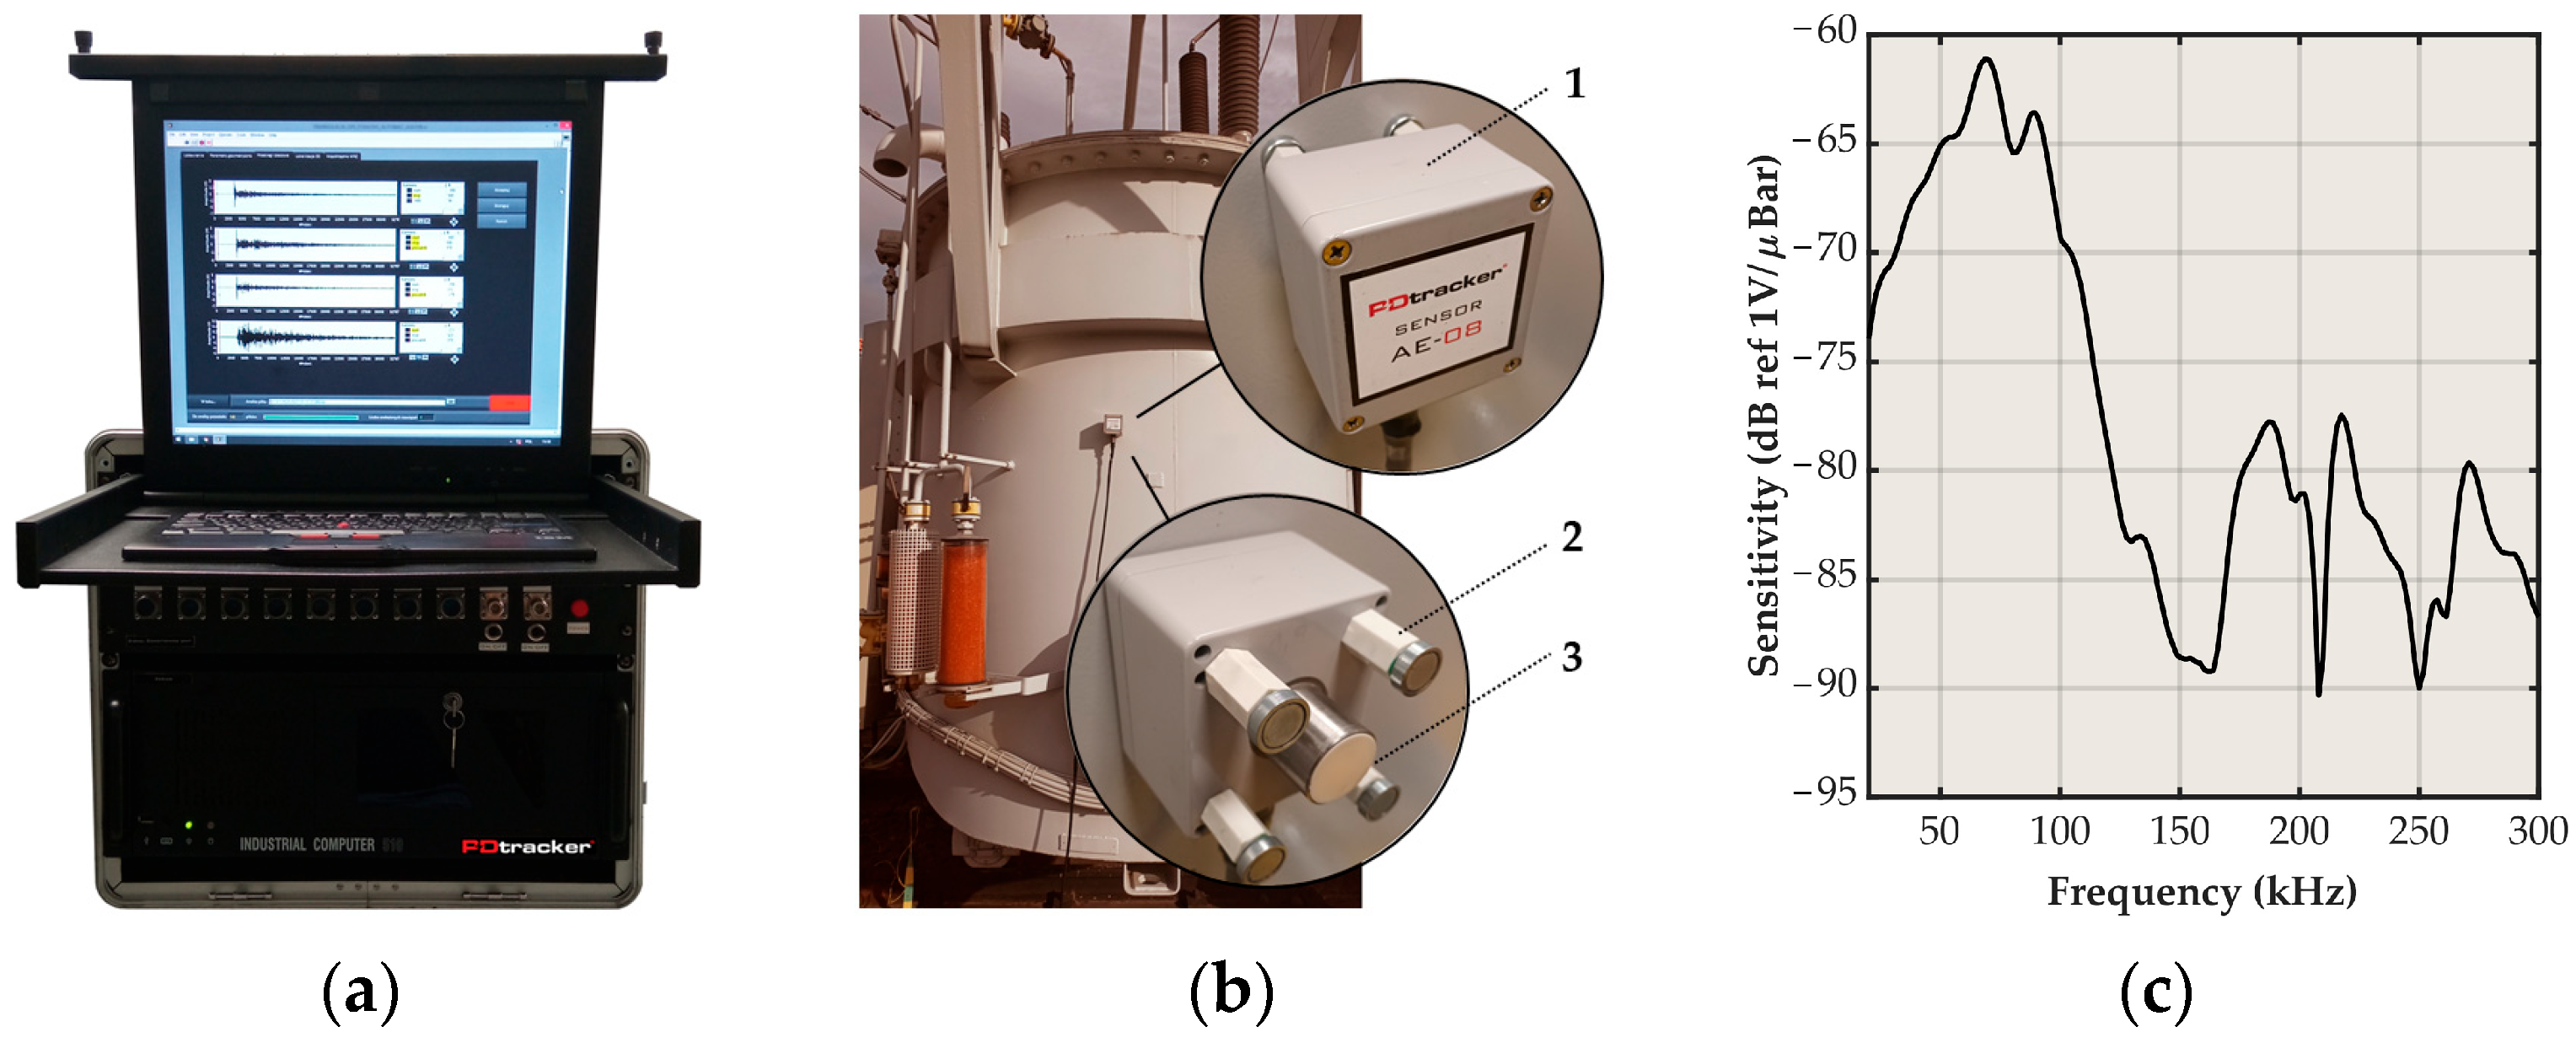
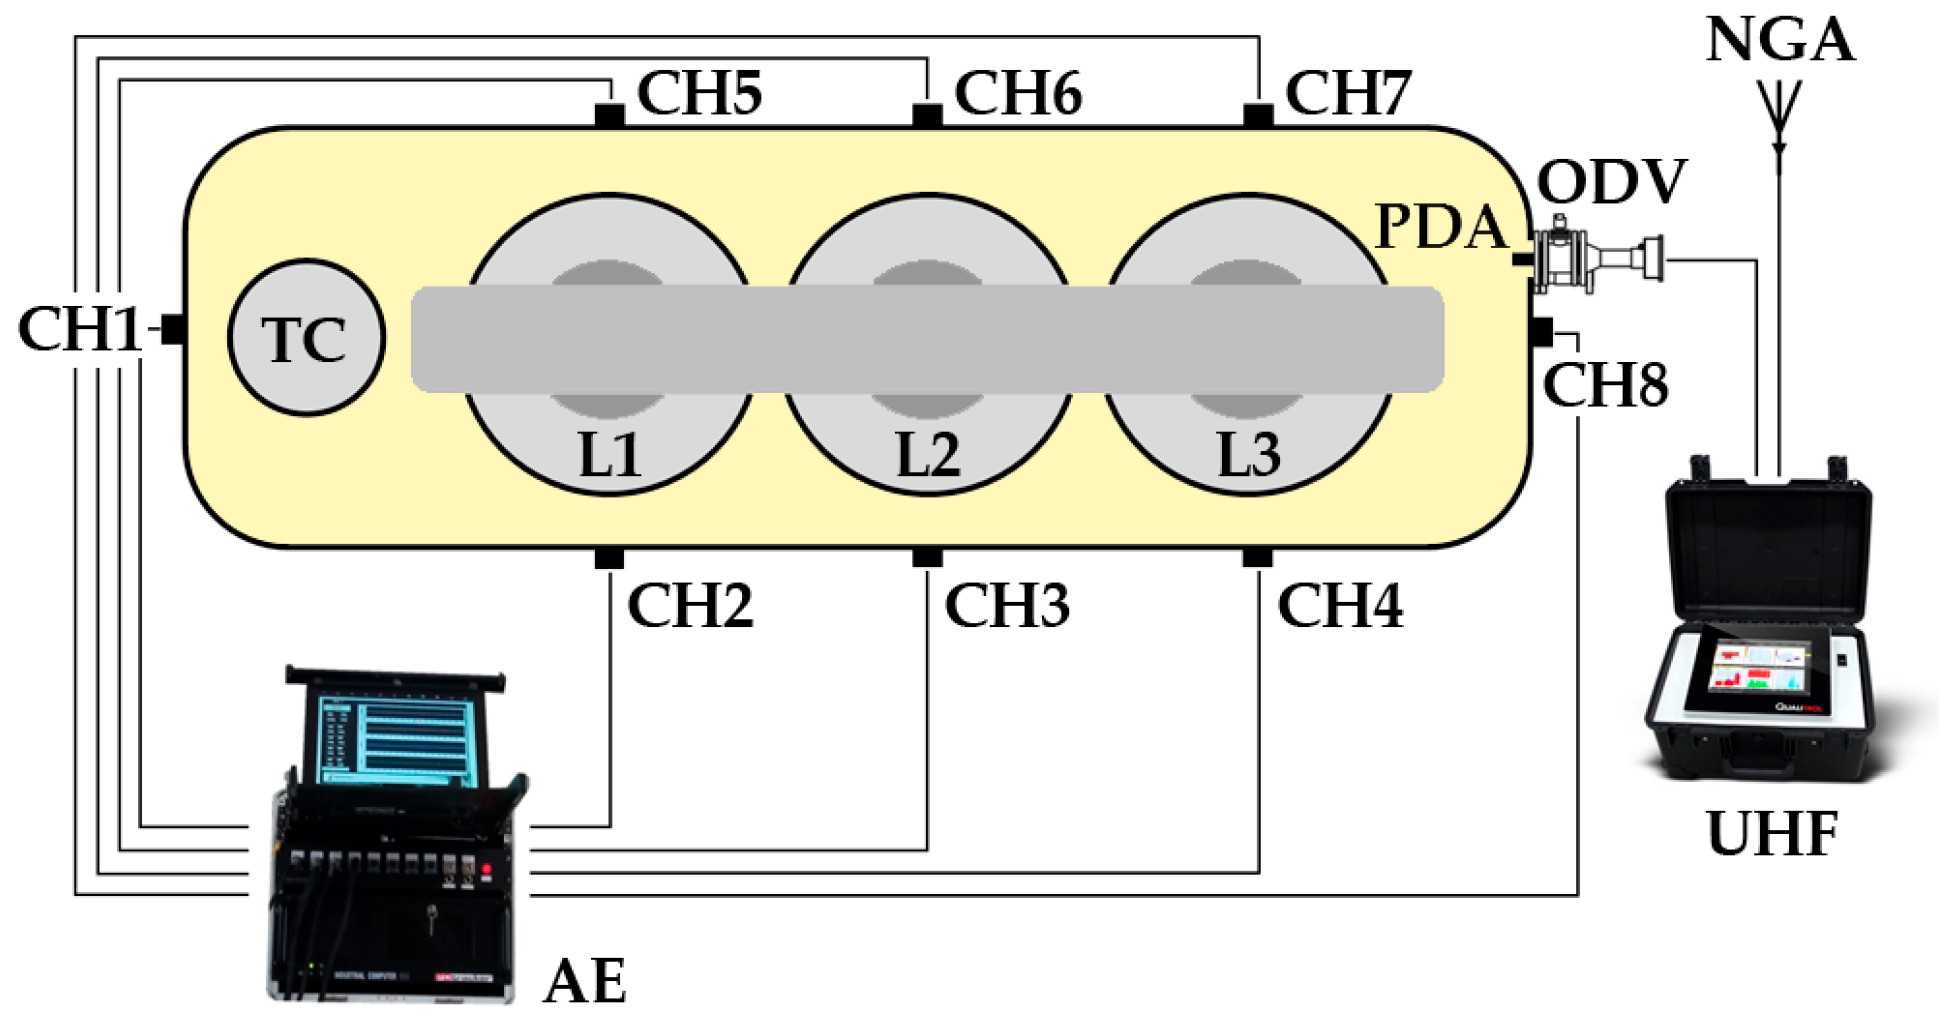
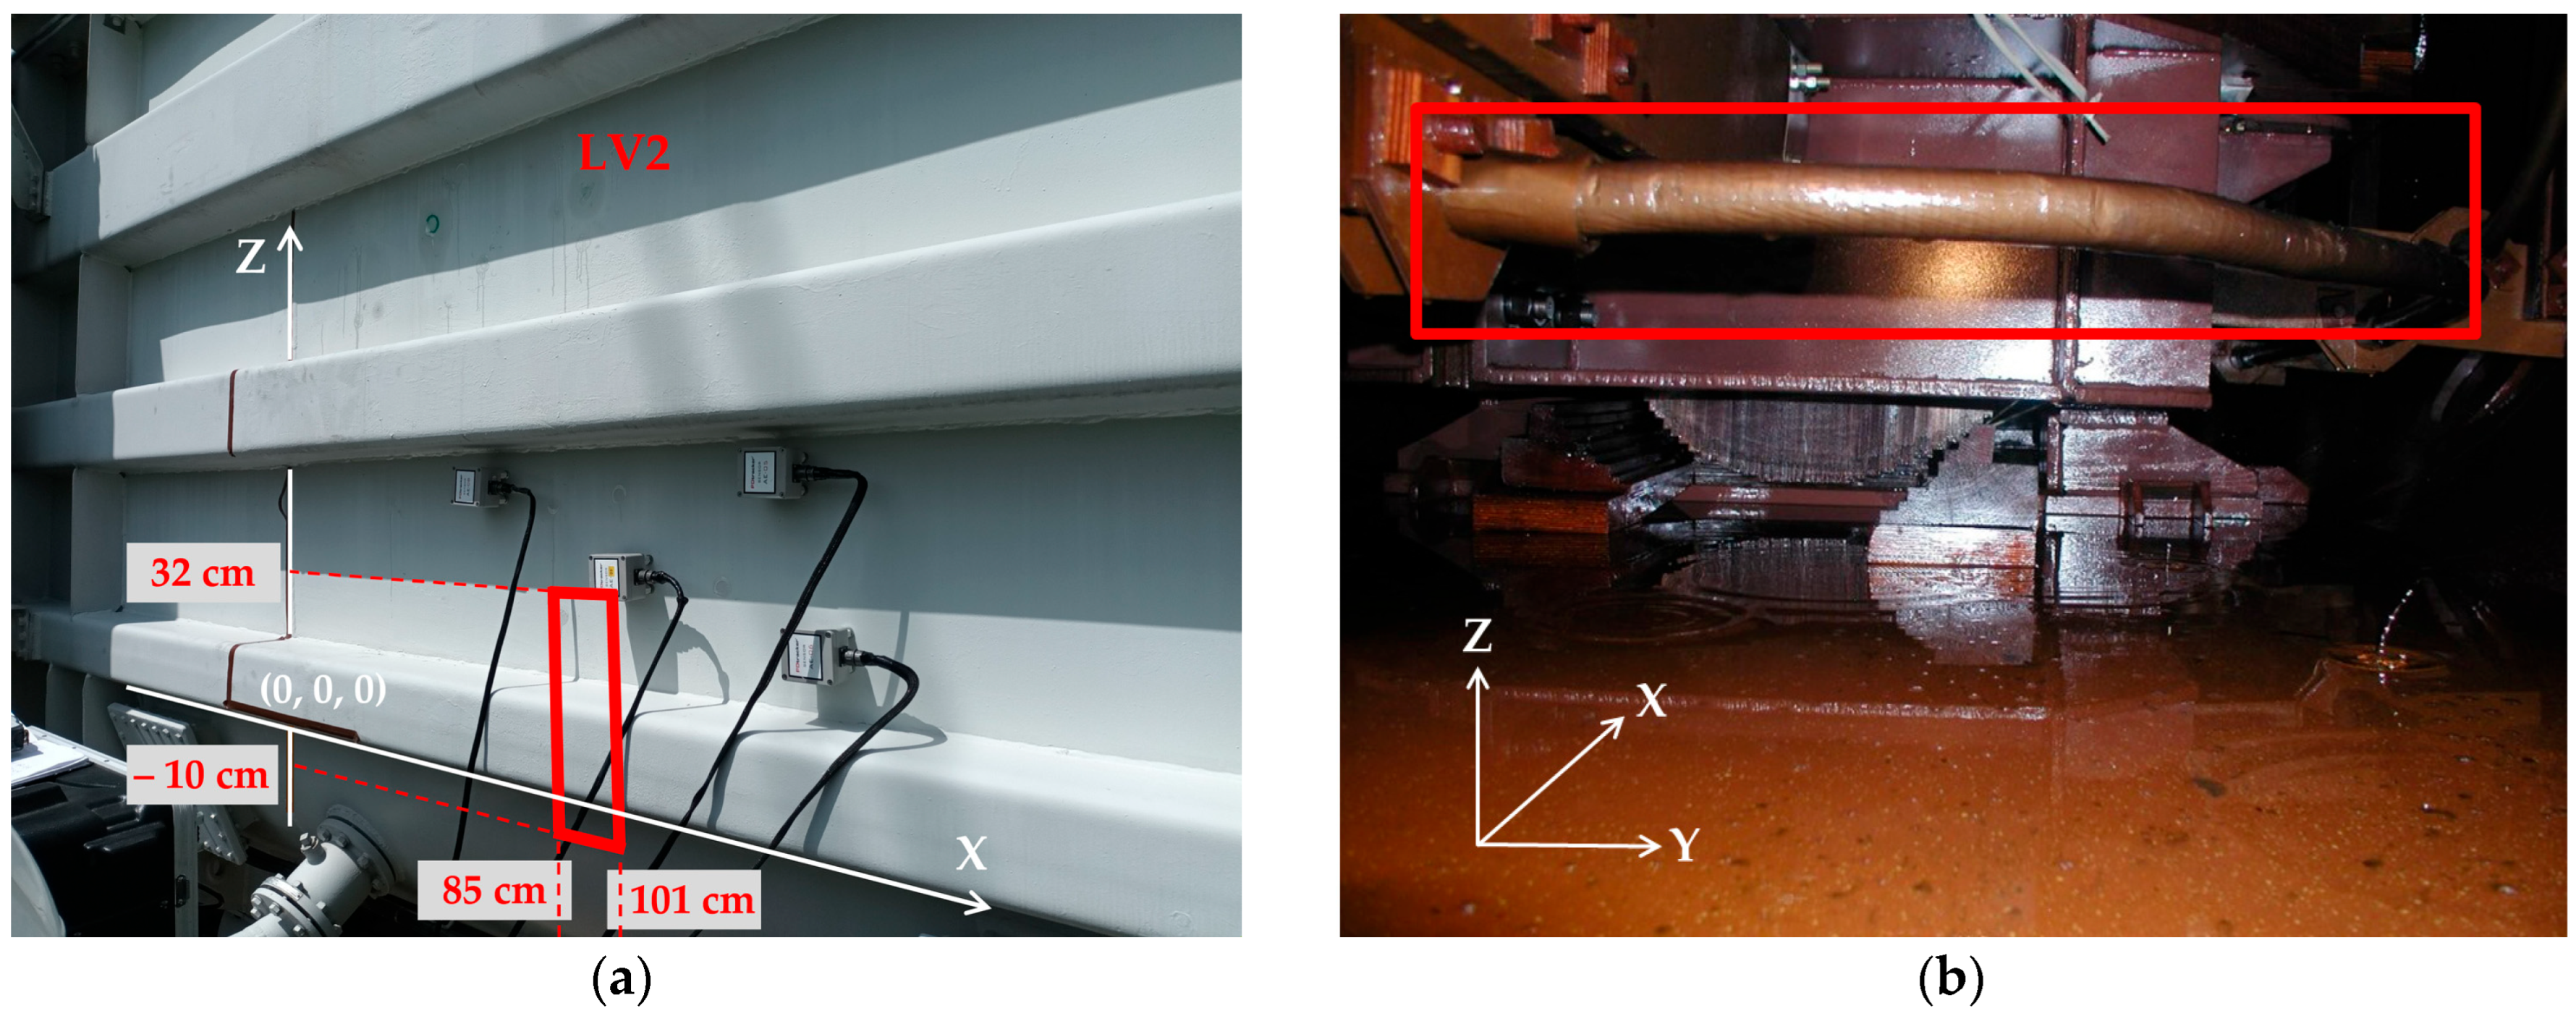
- Installing the eight AE sensors (marked CH1–CH8) on the transformer tank as follows: CH1—on the side wall of the tank, opposite the on-load tap changer; CH2, CH3, and CH4—on the high-voltage side, opposite phases L1, L2, and L3, respectively; CH5, CH6, and CH7—on the low-voltage side, opposite phases L1, L2, and L3, respectively; and CH8—on the side wall of the tank (Figure 3).
- Step 6.
- Verifying the correct operation of individual measurement channels in the acoustic emission (AE) system and proper acoustic and mechanical coupling of AE sensors using the Hsu–Nielsen method (pencil-lead breaks).
- Step 7.
- Determining the level of electromagnetic interference recorded by the noise-gating antenna and the UHF PD detector on the de-energized power transformer.
- Step 8.
- Energizing the power transformer.
- Step 9.
- Determining the average effective value of the acoustic background noise (Anoise_RMS) recorded by the AE sensors on the energized transformer and the threshold above which the monitoring system will count AE pulses, according to the relationship threshold = k · Anoise_RMS, where k = 5.
- Step 10.
- Determining the level of electromagnetic interference recorded by the noise-gating antenna and UHF PD detector on the energized transformer.
- Step 11.
- Leaving the online PD monitoring systems in operation for the period specified by the transformer owner (from several days to several weeks), during which parameters of acoustic signals (number of AE pulses per minute) and radio signals (number and amplitude of UHF and PRPD patterns) were recorded.
- Step 12.
- Localizing PD sources using the TDoA technique in the transformer tank area where the AE sensors of the PDtracker Portable system recorded acoustic emission pulses (if PDs were detected when the monitoring systems were activated or during their routine inspection on the following day, acoustic emission monitoring was immediately halted, and efforts were made to locate the PD source).
- True positive (TP): The number of cases in which both methods detected a PD pulse during the same period. This means that both systems correctly recorded the presence of a discharge. In this case, there is a low probability that both the UHF and AE methods were recording interference at the time.
- False positive (FP): The number of cases in which one method recorded a PD pulse and the other did not. This suggests that one of these methods was more sensitive in detecting PD or may have captured interference signals.
- False negative (FN): The number of cases in which one method did not detect a pulse recorded by the other method. Here, the reasons may be identical to those in false positive cases.
- True negative (TN): The number of cases in which both methods did not record any PD pulse. This means that both methods are consistent in identifying periods without discharges or are too sensitive to detect them, e.g., in a situation where the generated PD pulses had low energy.
3. Case Study Analysis of Online PD Monitoring in Power Transformers
3.1. Transformer A
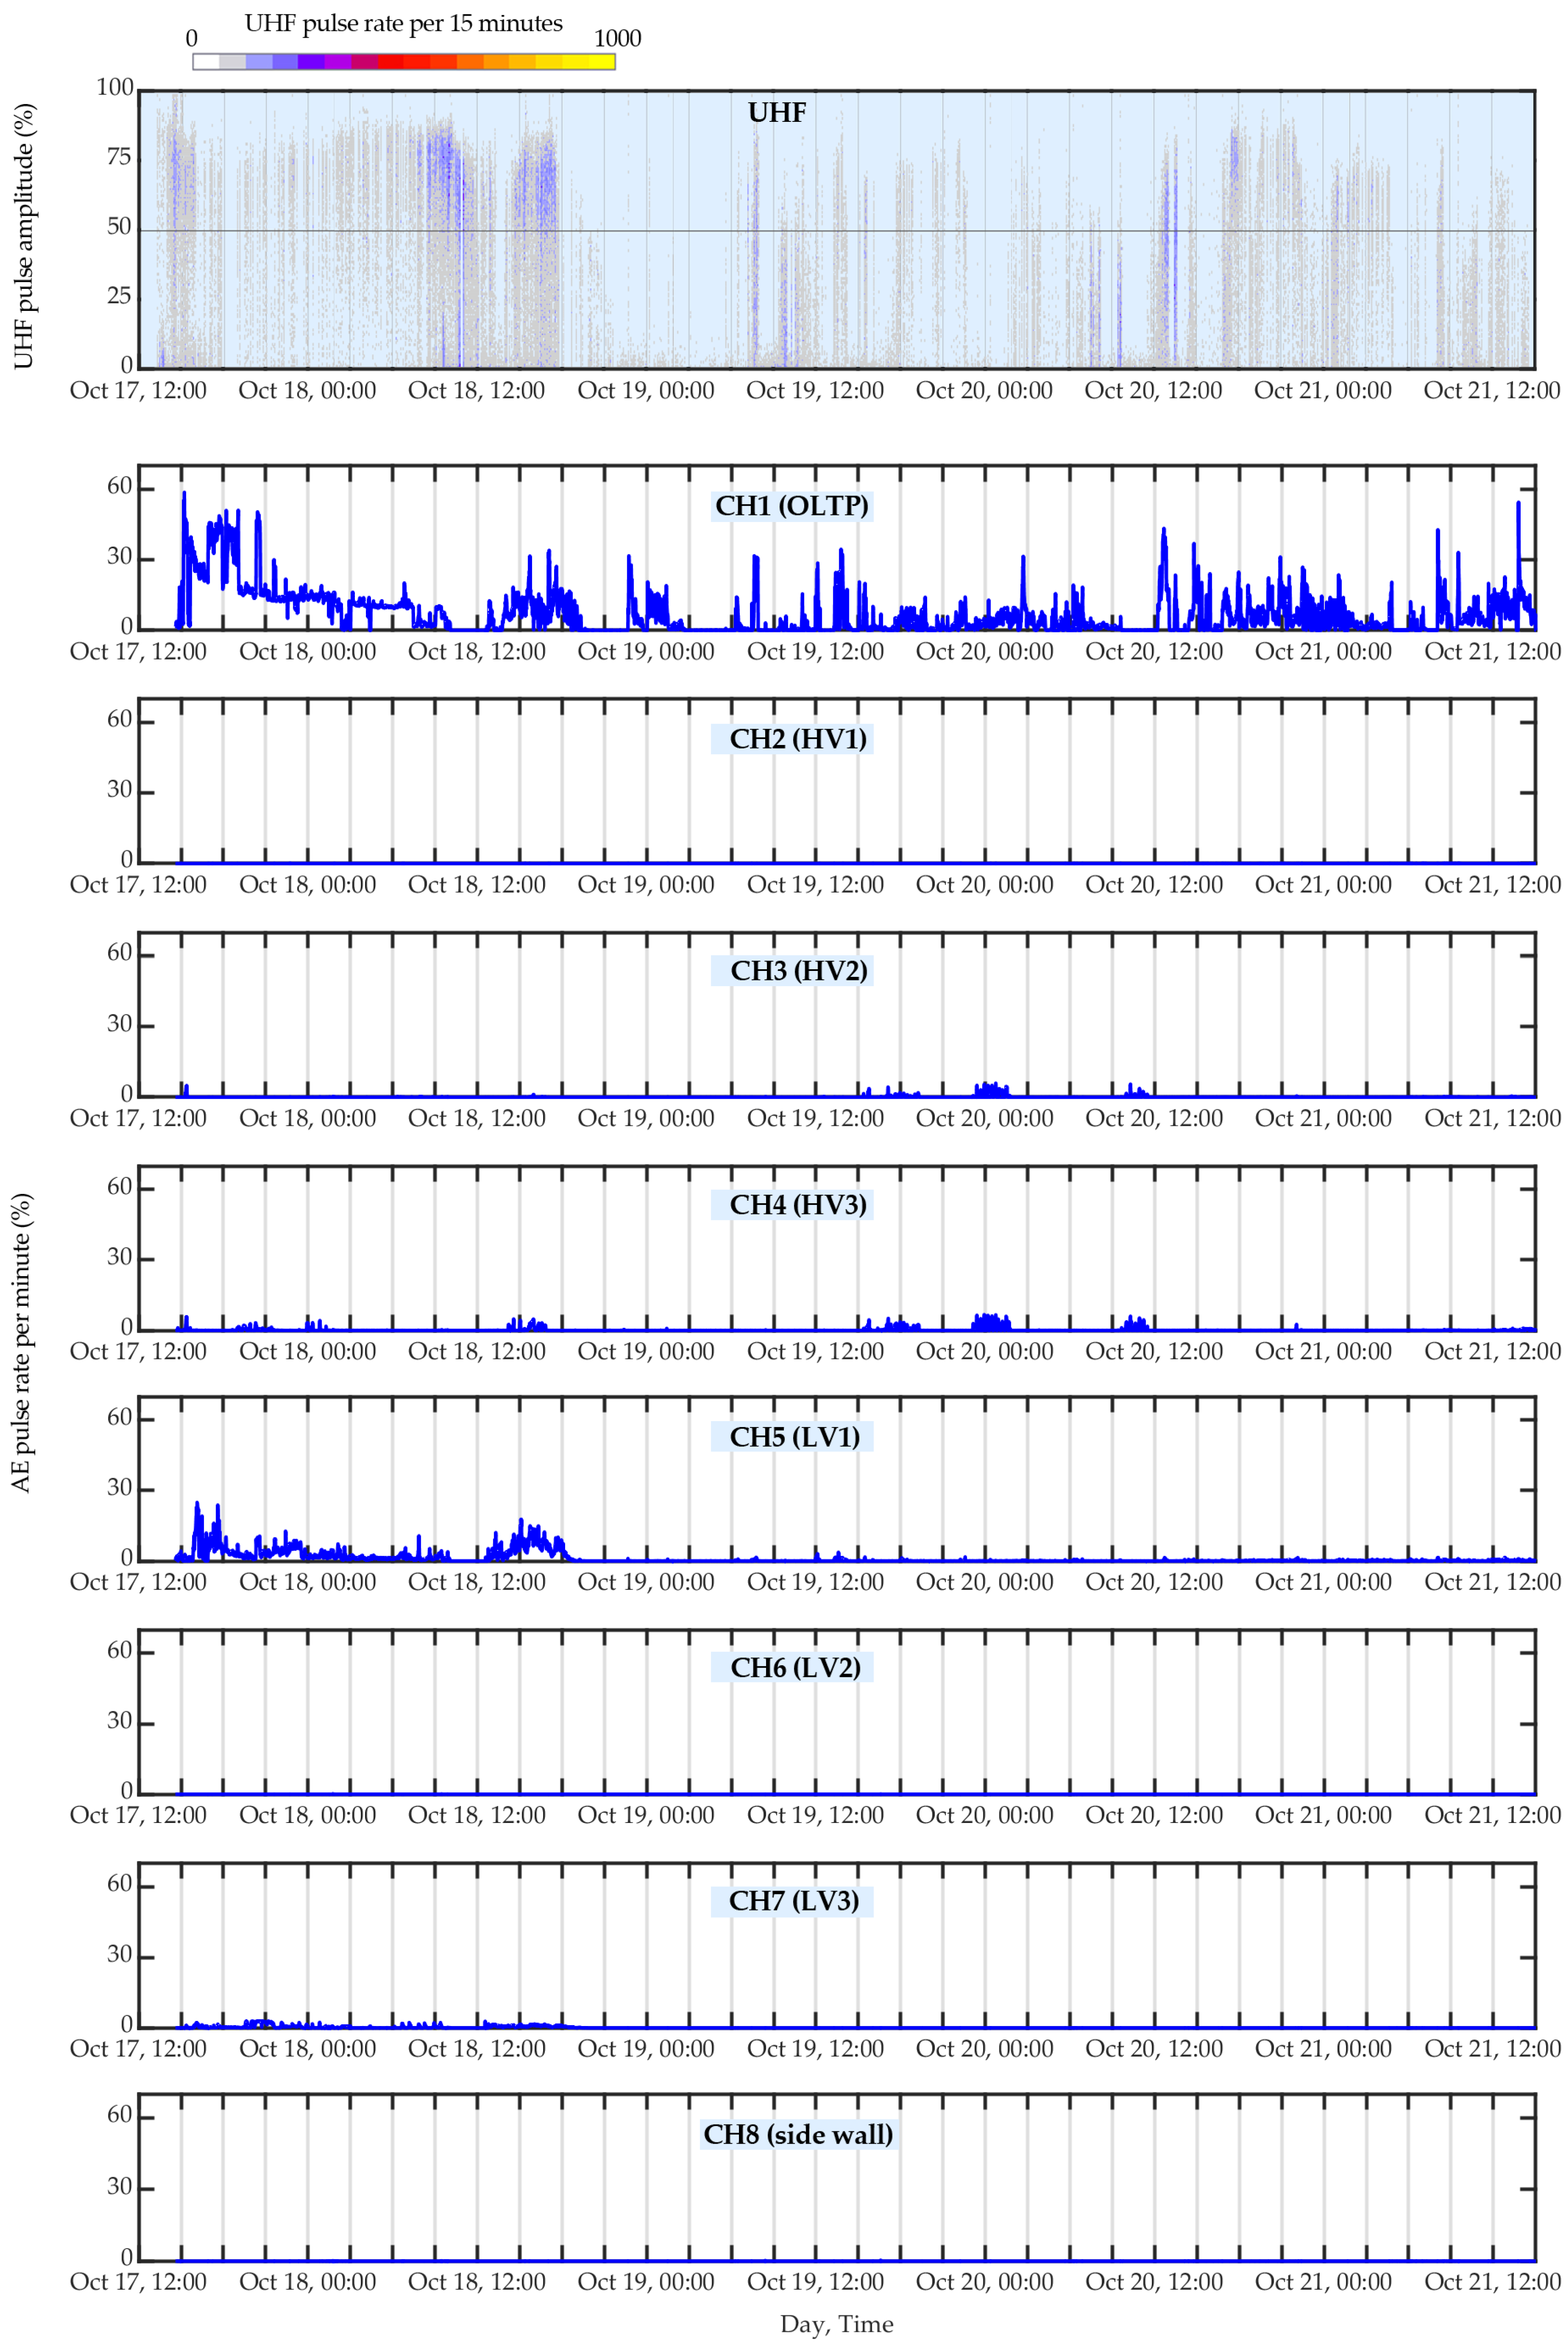
3.1.1. Results of Online Monitoring of Partial Discharges
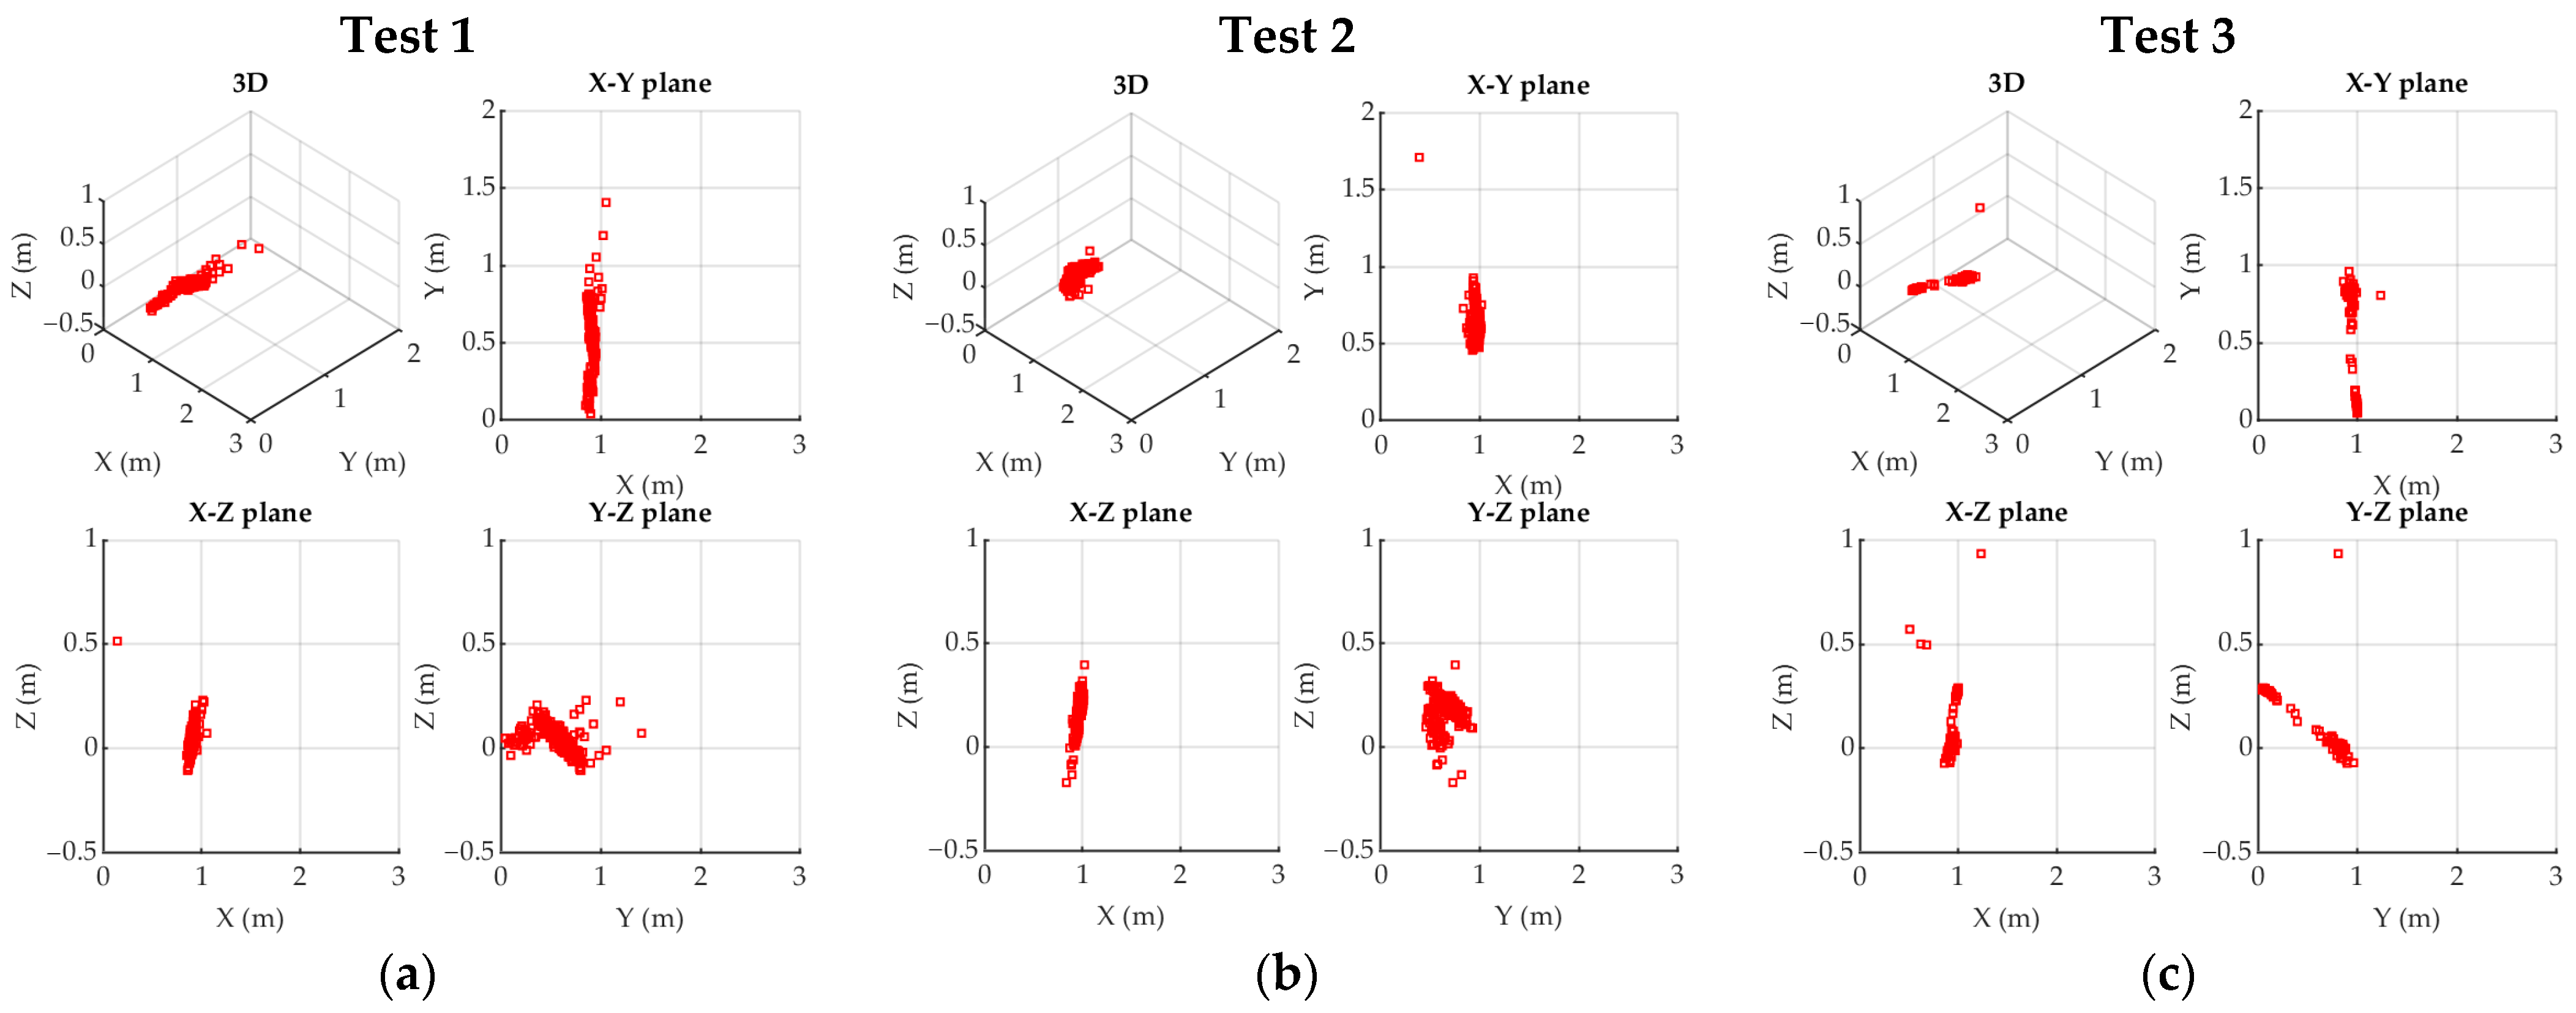
3.1.2. Results of Partial Discharge Source Localization
3.2. Transformer B
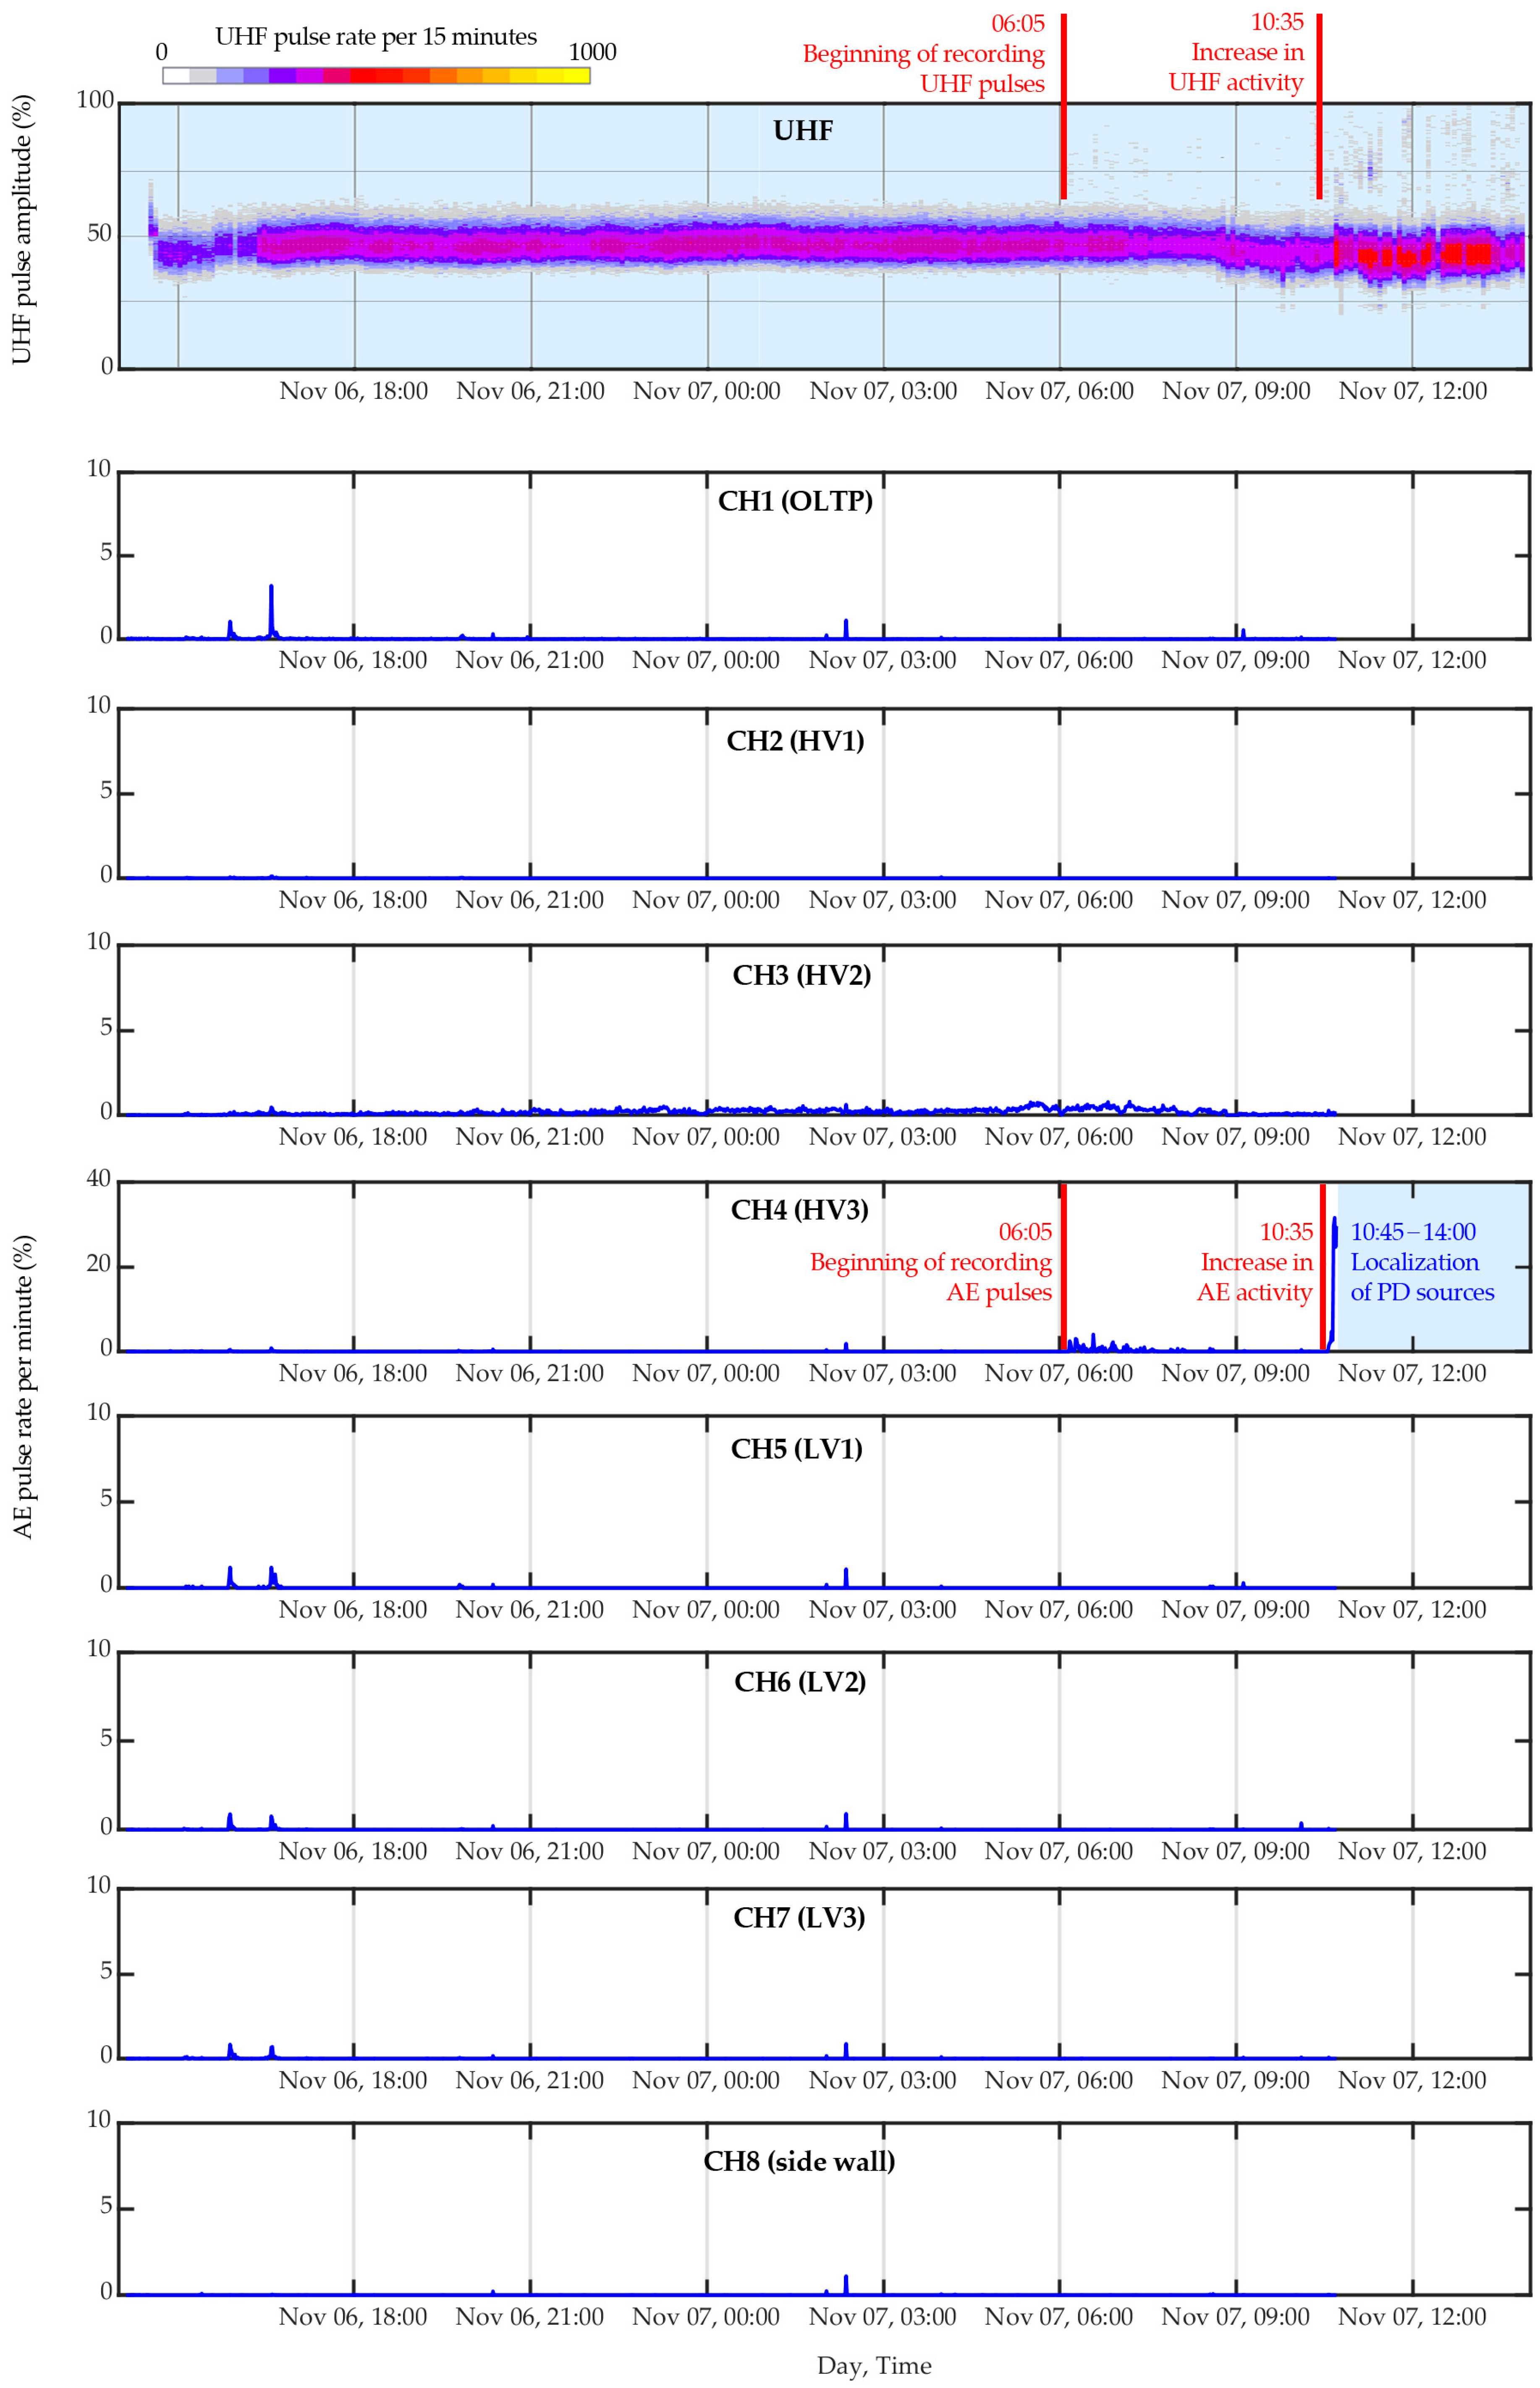
3.2.1. Results of Online Monitoring of Partial Discharges
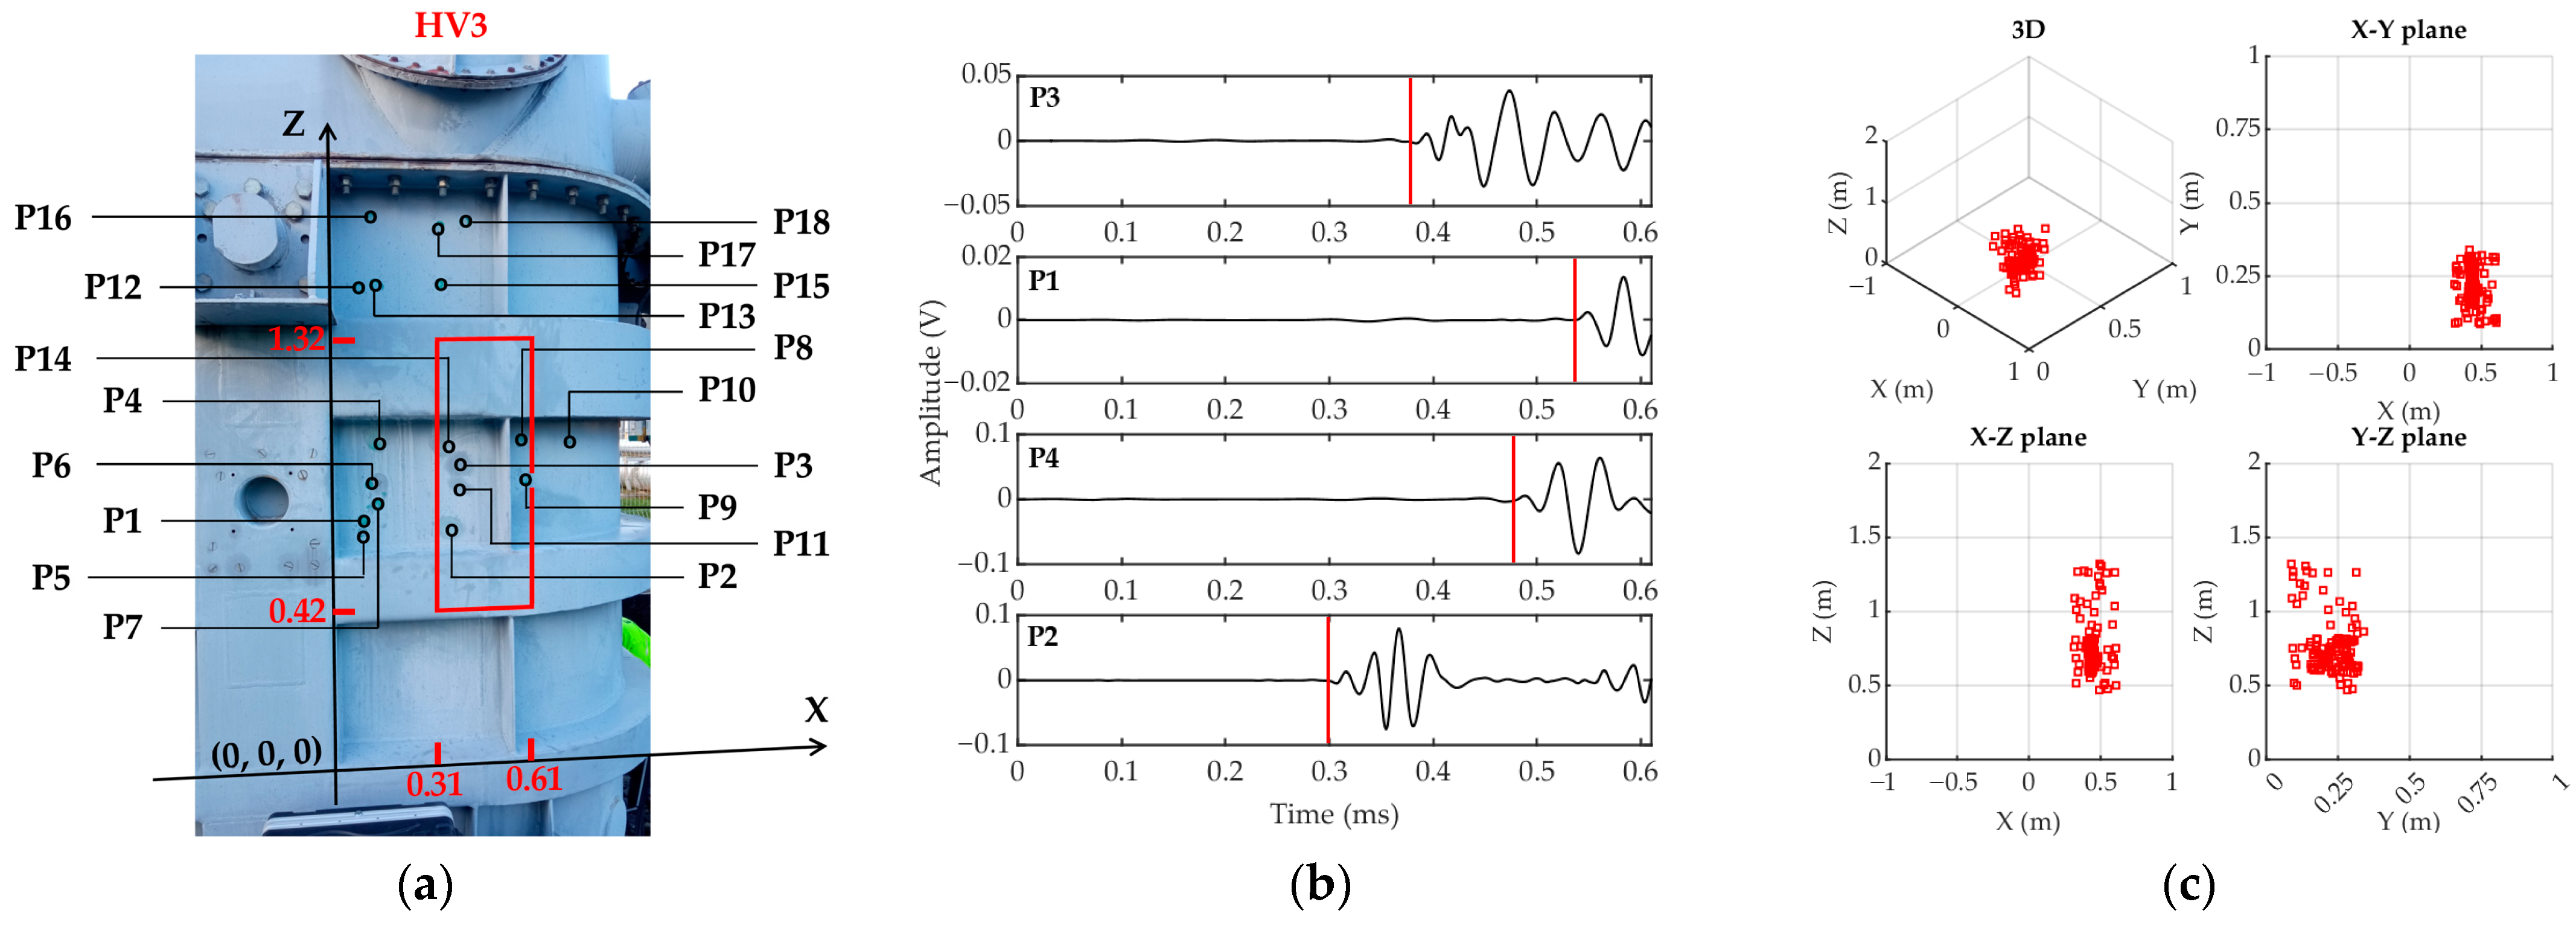
3.2.2. Results of Partial Discharge Source Localization
3.3. Transformer C
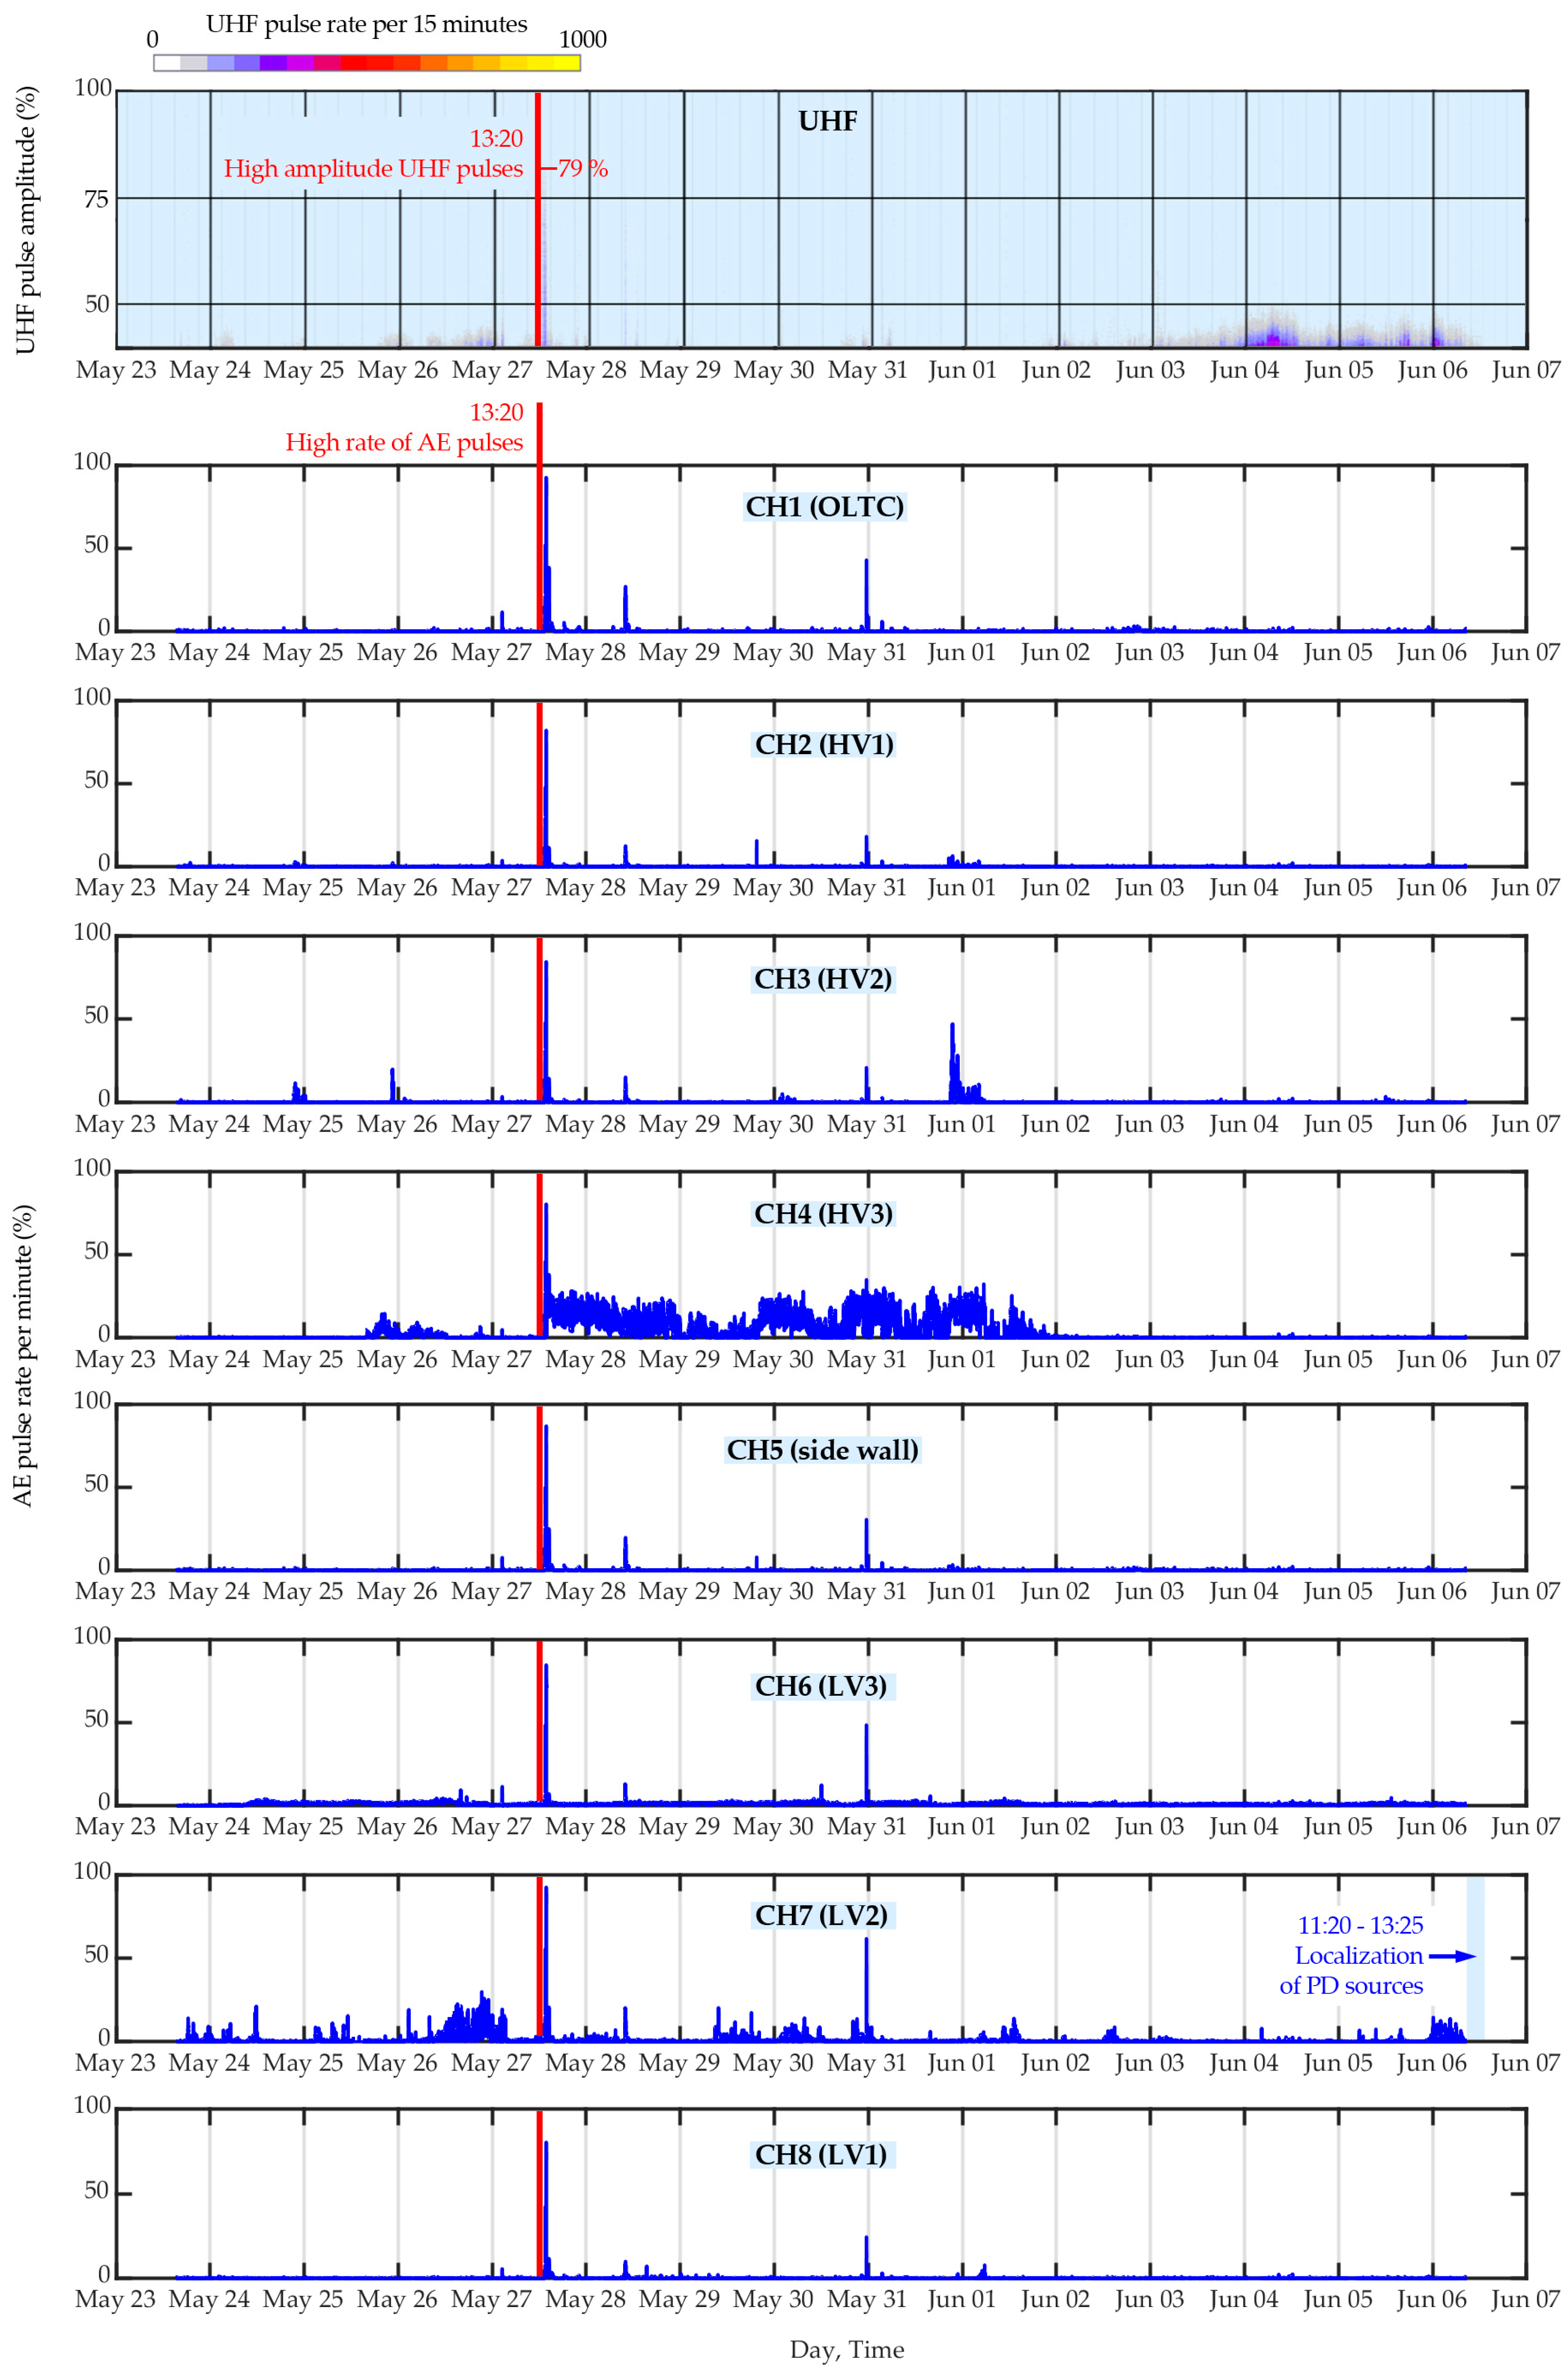
3.3.1. Results of Online Monitoring of Partial Discharges
3.3.2. Results of Partial Discharge Source Localization
4. Conclusions
- Simultaneous use of AE and UHF methods increases the effectiveness and reliability of PD detection. These methods are based on different physical phenomena (AE method records elastic waves; UHF method records electromagnetic pulses) and are susceptible to varying sources of interference. A high percentage of cases in which both methods simultaneously recorded pulses allowed us to confirm with high probability the presence of real PDs and not acoustic or radio interference. Statistical analyses showed that the agreement of the results for ‘Transformer A’ and ‘Transformer B’ was 65.6% and 72.8%, respectively, while for ‘Transformer C’, it was lower (43%).
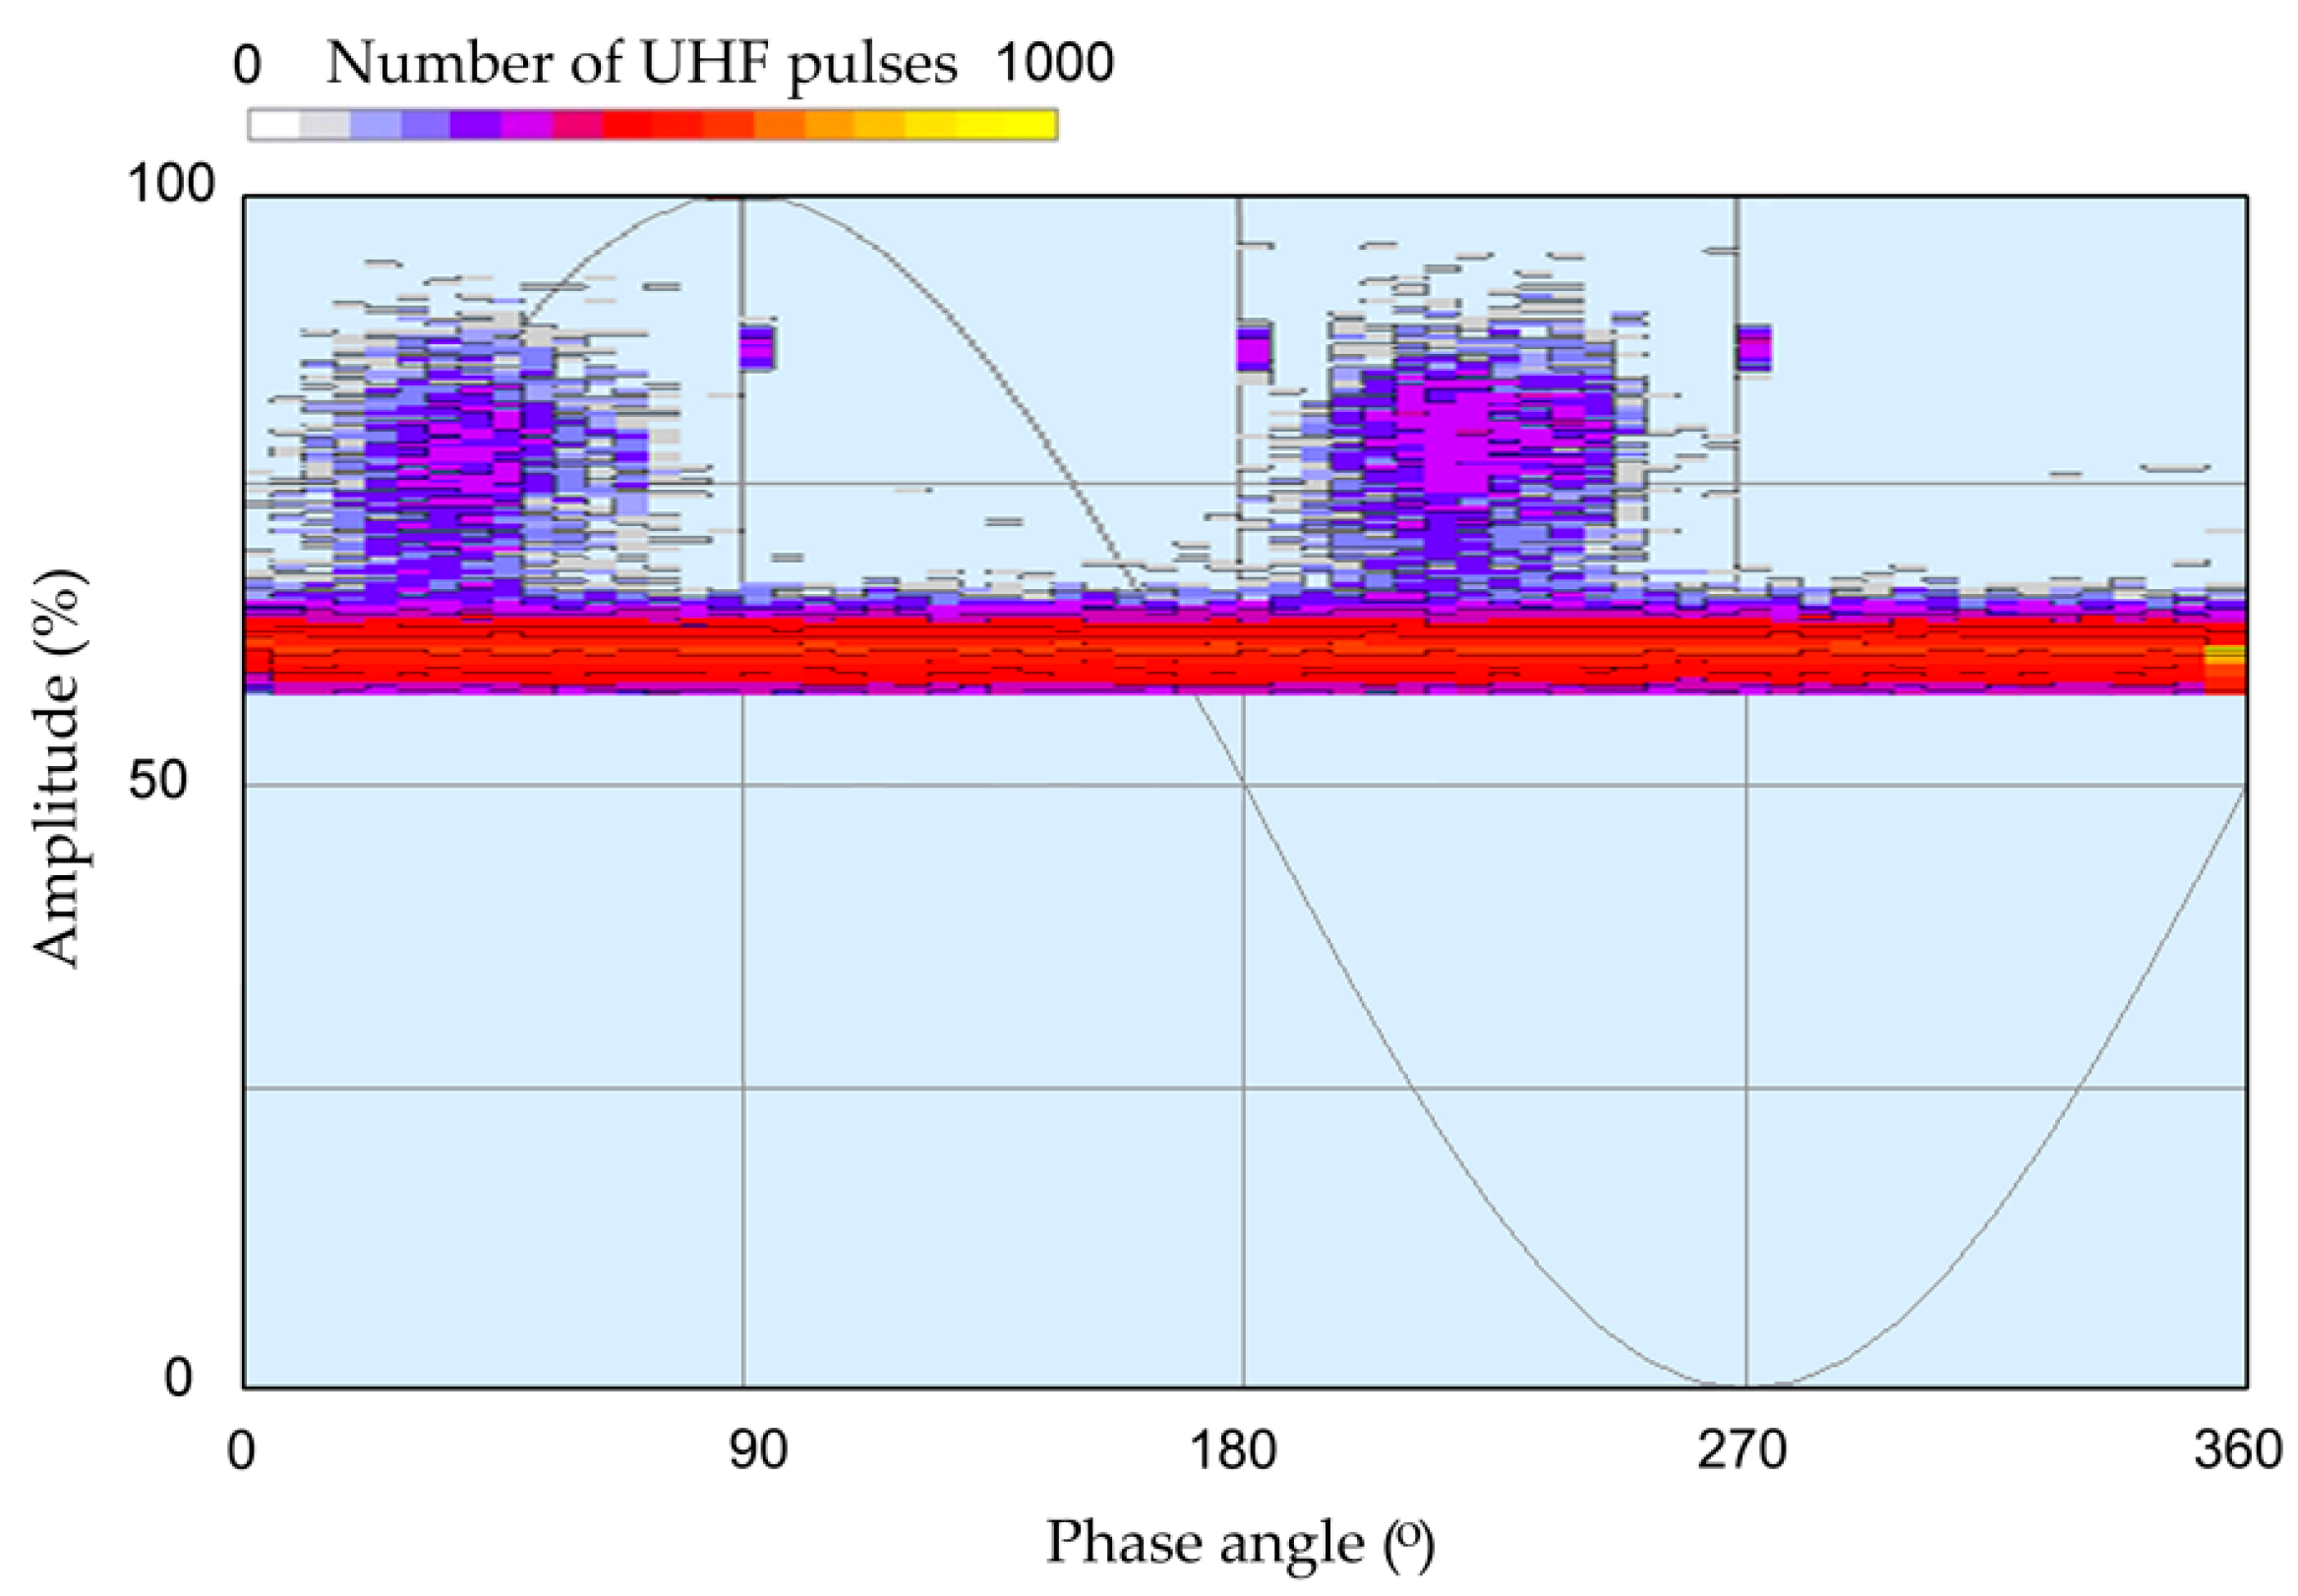
- Monitoring PDs using the UHF method with the function of recording PRPD patterns allows for identifying the type of insulation system defect. For all the tested transformers, characteristic PRPD patterns were recorded, indicating the occurrence of PDs.
- Using a multi-channel AE system allows for the localization of defects in individual transformer phases. This allowed one to determine the potential location of discharge sources already at the monitoring stage. For ‘Transformer A’, AE pulses were recorded near the on-load tap changer; for ‘Transformer B’, in phase L3 on the high-voltage side; and for ‘Transformer C’, in phase L2 on the low-voltage side. The data obtained significantly accelerated the procedure for the precise location of the discharge sources using the TDoA technique.
Author Contributions
Funding
Data Availability Statement
Conflicts of Interest
References
- Balanta, J.Z.; Rivera, S.; Romero, A.A.; Coria, G. Planning and Optimizing the Replacement Strategies of Power Transformers: Literature Review. Energies 2023, 16, 4448. [Google Scholar] [CrossRef]
- Vasquez, W.A.; Jayaweera, D. Risk-based approach for power transformer replacement considering temperature, apparent age and expected capacity. IET Gener. Transm. Distrib. 2020, 14, 4898–4907. [Google Scholar]
- Zaldivar, D.A.; Romero, A.A.; Rivera, S.R. Risk Assessment Algorithm for Power Transformer Fleets Based on Condition and Strategic Importance. Algorithms 2021, 14, 319. [Google Scholar] [CrossRef]
- Tenbohlen, S.; Jagers, J.; Vahidi, F.; Bastos, G.; Desai, B.; Diggin, B.; Fuhr, J.; Gebauer, J.; Krüger, M.; Lapworth, J.; et al. Transformer Reliability Survey; Technical Brochure 642; CIGRE: Paris, France, 2015. [Google Scholar]
- Przybylek, P.; Gielniak, J. Analysis of gas generated in mineral oil, synthetic ester, and natural ester as a consequence of thermal faults. IEEE Access 2019, 7, 65040–65051. [Google Scholar]
- Cavallini, A.; Montanari, G.C.; Ciani, F. Analysis of Partial Discharge Phenomena in Paper-oil Insulation Systems as a Basis for Risk Assessment Evaluation. In Proceedings of the IEEE International Conference on Dielectric Liquids, Coimbra, Portugal, 26 June–1 July 2005; pp. 241–244. [Google Scholar]
- Rashid, H.M.; Refaat, S.S.; Abu-Rub, H. Overview and partial discharge analysis of power transformers: A literature review. IEEE Access 2021, 9, 64587–64605. [Google Scholar]
- Rodríguez-Serna, J.M.; Albarracín-Sánchez, R.; Garnacho, F.; Álvarez, F.; Ortego, J. Partial Discharges Measurements for Condition Monitoring and Diagnosis of Power Transformers: A Review. In Proceedings of the 6th International Advanced Research Workshop on Transformers, Cordoba, Spain, 7–9 October 2019; pp. 83–88. [Google Scholar]
- Gawlak, A. Profitability Analysis of Investment Projects in Distribution Networks. Prz. Elektrotechniczny 2019, 95, 13–16. [Google Scholar]
- Ilkhechi, H.D.; Samimi, M.H. Applications of the acoustic method in partial discharge measurement: A review. IEEE Trans. Dielectr. Electr. Insul. 2021, 28, 42–51. [Google Scholar]
- Kunicki, M.; Cichoń, A.; Borucki, S. Study on descriptors of acoustic emission signals generated by partial discharges under laboratory conditions and in on-site electrical power transformer. Arch. Acoust. 2016, 41, 265–276. [Google Scholar]
- Chai, H.; Phung, B.T.; Mitchell, S. Application of UHF Sensors in Power System Equipment for Partial Discharge Detection: A Review. Sensors 2019, 19, 1029. [Google Scholar] [CrossRef]
- Tenbohlen, S.; Beura, C.P.; Siegel, M. Condition Assessment of Power Transformers by UHF PD Measurements. In Proceedings of the 2022 9th International Conference on Condition Monitoring and Diagnosis (CMD), Kitakyushu, Japan, 13–18 November 2022; pp. 5–10. [Google Scholar]
- Cavallini, A.; Rubio Serrano, J.; Azcarraga Ramos, C.G.; Garcia Souto, J.A.; Montanari, G.C. Comparison of ultrasonic, electrical and UHF characteristics of partial discharge emission in oil/paper insulation systems. In Proceedings of the Conference on Electrical Insulation and Dielectric Phenomena (CEIDP), Cancun, Mexico, 16–19 October 2011; pp. 440–443. [Google Scholar]
- Witos, F.; Gacek, Z. Application of the joint electro-acoustic method for partial discharge investigations within a power transformer. Eur. Phys. J. Spec. Top. 2008, 154, 1951–6401. [Google Scholar]
- Fuangsoongnern, U.; Plueksawan, W. A Measurement Technique to Identify and Locate Partial Discharge in Transformer with AE and HFCT. Int. J. Eng. Res. Appl. 2014, 4, 51–58. [Google Scholar]
- Dulac, H.; Hoffman, G.; Williams, T. State of the Art Technologies for Liquid Immersed Power Transformer Online Monitoring. In Proceedings of the 2024 IEEE IAS Petroleum and Chemical Industry Technical Conference (PCIC), Orlando, FL, USA, 16–19 September 2024; pp. 1–7. [Google Scholar]
- Habib, B.; Al Zaabi, O.; Harid, N.; Al Hosani, K.; Alkhatib, M. Condition monitoring based on partial discharge diagnostics using UHF sensors: A comprehensive state-of-the-art review. IEEE Trans. Dielectr. Electr. Insul. 2024, 31, 2860–2873. [Google Scholar]
- Balali, B.; Kuhnke, M.; Zidny, I.; Werle, P.; Akbari, A. Development of multidimensional monitoring systems for power transformers by integrating special UHF partial discharge detectors. In Proceedings of the 2024 IEEE International Conference on High Voltage Engineering and Applications (ICHVE), Berlin, Germany, 18–22 August 2024; pp. 1–4. [Google Scholar]
- Predl, F.; Guo, W.; Hoek, S.; Krüger, M. Combining Acoustic and Electrical Methods to Locate Partial Discharge in a Power Transformer. In Proceedings of the 2015 IEEE 11th International Conference on the Properties and Applications of Dielectric Materials (ICPADM), Sydney, Australia, 19–22 July 2015; pp. 424–427. [Google Scholar]
- Siegel, M.; Beltle, M.; Tenbohlen, S.; Coenen, S. Application of UHF sensors for PD measurement at power transformers. IEEE Trans. Dielectr. Electr. Insul. 2017, 24, 331–339. [Google Scholar]
- Si, W.; Fu, C.; Yuan, P. An Integrated Sensor With AE and UHF Methods for Partial Discharges Detection in Transformers Based on Oil Valve. IEEE Sens. Lett. 2019, 3, 3502003. [Google Scholar]
- Xiaohu, X.; Yongfen, L.; Xiao, T.; Peng, C.; Yanming, L. Relocatable Ultrasonic Array and UHF Combined Sensor Applied to PD Location in Oil. IEEE Sens. J. 2014, 14, 357–361. [Google Scholar] [CrossRef]
- Sikorski, W. Active Dielectric Window: A New Concept of Combined Acoustic Emission and Electromagnetic Partial Discharge Detector for Power Transformers. Energies 2019, 12, 115. [Google Scholar]
- Firuzi, K.; Vakilian, M.; Phung, B.T.; Blackburn, T.R. A hybrid transformer PD monitoring method using simultaneous IEC60270 and RF data. IEEE Trans. Power Deliv. 2019, 34, 1374–1382. [Google Scholar]
- IEC 60270; High-Voltage Test Techniques—Partial Discharge Measurements. IEC: Geneva, Switzerland, 2015.
- Sikorski, W.; Walczak, K.; Gil, W.; Szymczak, C. On-Line Partial Discharge Monitoring System for Power Transformers Based on the Simultaneous Detection of High Frequency, Ultra-High Frequency, and Acoustic Emission Signals. Energies 2020, 13, 3271. [Google Scholar] [CrossRef]
- Ranninger, U.; Krüger, M. Measurement, localisation, and monitoring of partial discharges on a power transformer. Transform. Mag. 2021, 8, 106–113. [Google Scholar]
- Gorgan, B.; Koltunowicz, W.; Ohde, J.; Zander, P. Monitoring and Diagnosis of Electrical Equipment Insulation with the Support of Combined Conventional and Alternative Partial Discharge Methods. In Proceedings of the 2022 9th International Conference on Condition Monitoring and Diagnosis (CMD), Kitakyushu, Japan, 13–18 November 2022; pp. 1–5. [Google Scholar]
- Mehrjou, R.; Hosseini, S.M.H. Detection and Location of Partial Discharge on a Power Transformer by Applying Acoustic and UHF Sensors. GMSARN Int. J. 2024, 18, 562–574. [Google Scholar]
- Tenbohlen, S.; Coenen, S.; Siegel, M.; Linn, T.; Markalous, S.; Mraz, P.; Beltle, M.; Naderian, A.; Schmidt, V.; Fuhr, J.; et al. Improvements to PD Measurements for Factory and Site Acceptance Tests of Power Transformers. CIGRE Technical Brochure 861. 2022. Available online: https://e-cigre.org/publication/861-improvements-to-pd-measurements-for-factory-and-site-acceptance-tests-of-power-transformers (accessed on 18 January 2025).
- Judd, M.D.; Yang, L.; Hunter, I.B. Partial discharge monitoring of power transformers using UHF sensors. Part I: Sensors and signal interpretation. IEEE Electr. Insul. Mag. 2005, 21, 5–14. [Google Scholar] [CrossRef]
- IEEE Std C57.127-2018 (Revision of IEEE Std C57.127-2007); IEEE Guide for the Detection, Location and Interpretation of Sources of Acoustic Emissions from Electrical Discharges in Power Transformers and Power Reactors. IEEE: Piscataway, NJ, USA, 2019. Available online: https://ieeexplore.ieee.org/document/8664690 (accessed on 18 January 2025).
- IEC TS 62478:2016; High Voltage Test Techniques—Measurement of Partial Discharges by Electromagnetic and Acoustic Methods. International Electrotechnical Commission (IEC): Geneva, Switzerland, 2016.
- Sikorski, W. Development of Acoustic Emission Sensor Optimized for Partial Discharge Monitoring in Power Transformers. Sensors 2019, 19, 1865. [Google Scholar] [CrossRef]
- Rathod, V.B.; Kumbhar, G.B.; Bhalja, B.R. Partial Discharge Detection and Localization in Power Transformers based on Acoustic Emission: Theory, Methods, and Recent Trends. IETE Technol. Rev. 2021, 39, 540–552. [Google Scholar] [CrossRef]
- Markalous, S.M.; Tenbohlen, S.; Feser, K. Detection and Location of Partial Discharges in Power Transformers using Acoustic and Electromagnetic Signals. IEEE Trans. Dielectr. Electr. Insul. 2008, 15, 1576–1583. [Google Scholar] [CrossRef]
- Drexler, P.; Čáp, M.; Fiala, P.; Steinbauer, M.; Kadlec, R.; Kaška, M.; Kočiš, L. A Sensor System for Detecting and Localizing Partial Discharges in Power Transformers with Improved Immunity to Interferences. Sensors 2019, 19, 923. [Google Scholar] [CrossRef]
- Akaike, H. Autoregressive model fitting for control. Ann. Inst. Stat. Math. 1971, 23, 163–180. [Google Scholar] [CrossRef]
- Maeda, N. A Method for Reading and Checking Phase Time in Auto-Processing System of Seismic Wave Data. Zisin 1985, 38, 365–379. [Google Scholar] [CrossRef]
- Conn, N.R.; Gould, N.I.M.; Toint, P.L. Trust-Region Methods, MPS/SIAM Series on Optimization, SIAM and MPS; Society for Industrial and Applied Mathematics: Philadelphia, PA, USA, 2000. [Google Scholar]
- Nocedal, J.; Wright, S.J. Numerical Optimization, 2nd ed.; Springer Series in Operations Research; Springer: Berlin/Heidelberg, Germany, 2006. [Google Scholar]
- MathWorks. Equation Solving Algorithms. MATLAB Documentation. MathWorks. Available online: https://www.mathworks.com/help/optim/ug/equation-solving-algorithms.html (accessed on 18 January 2025).
- W.G D1. 29 CIGRE, Partial Discharges in Transformers. 2017. Available online: http://e-cigre.org/publication/676-partial-discharges-in-transformers (accessed on 18 January 2025).
- Najafi, S.A.M.; Werle, P. Investigation on the possibility of silent partial discharges inside power transformers. In Proceedings of the 2016 IEEE Electrical Insulation Conference (EIC), Montreal, QC, Canada, 19–22 June 2016; pp. 276–279. [Google Scholar]


| Transformer Designation | Year of Manufacture | Rated Power (MVA) | Rated Voltage (kV) | Winding Connections | Cooling Type | Test Period |
|---|---|---|---|---|---|---|
| Transformer A | 1991 | 160 | 230/120/15.75 | YNA0yN0 | ONAF | 17–24 October 2023 |
| Transformer B | 1978/1996 1 | 160 | 230/120/15.75 | YNA0yN0 | ONAF | 6–7 November 2023 |
| Transformer C | 1980 | 160 | 230/120 | Y0d11 | ONAF | 23 May–9 June 2024 |
| Dissolved Gas | Measured Gas Concentration (ppm) | Typical Gas Concentration Values (ppm) * | ||
|---|---|---|---|---|
| Transformer A | Transformer B | Transformer C | ||
| Hydrogen (H2) | 177 | 291 | 453 | 150 |
| Acetylene (C2H2) | 79 | 204 | 67 | 55 |
| Carbon dioxide (CO2) | – | 3401 | 3216 | 3000 |
| AE: Pulse (1) | AE: No Pulse (0) | |
|---|---|---|
| UHF: Pulse (1) | TP = 59.2% | FP = 16.4% |
| UHF: No Pulse (0) | FN = 17.9% | TN = 6.4% |
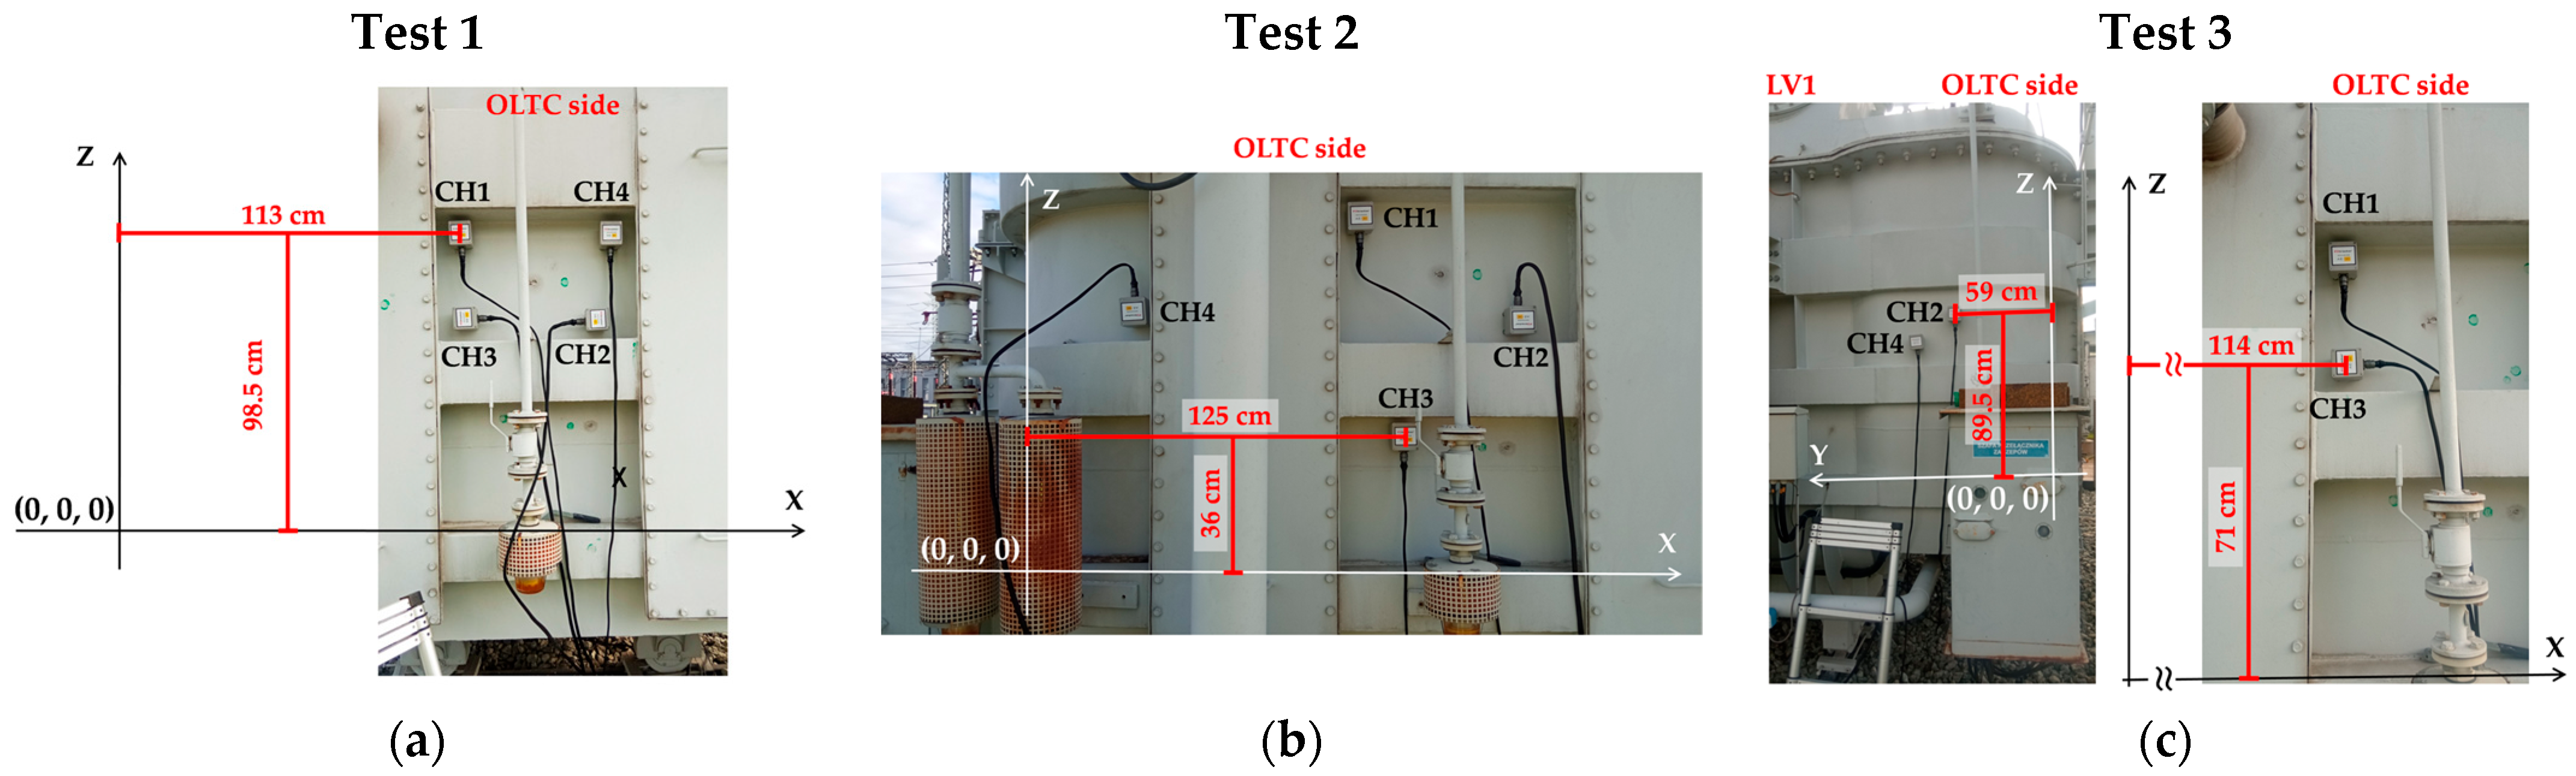
| Test Designation | AE Sensor | AE Sensor Coordinates | ||
|---|---|---|---|---|
| X (m) | Y (m) | Z (m) | ||
| Test 1 | CH1 | 1.130 | 0 | 0.985 |
| CH2 | 1.580 | 0 | 0.700 | |
| CH3 | 1.140 | 0 | 0.710 | |
| CH4 | 1.630 | 0 | 0.980 | |
| Test 2 | CH1 | 1.130 | 0 | 0.985 |
| CH2 | 1.580 | 0 | 0.700 | |
| CH3 | 1.250 | 0 | 0.360 | |
| CH4 | 0.560 | 0 | 0.720 | |
| Test 3 | CH1 | 1.130 | 0 | 0.985 |
| CH2 | 0 | 0.590 | 0.895 | |
| CH3 | 1.140 | 0 | 0.700 | |
| CH4 | 0 | 0.790 | 0.750 | |
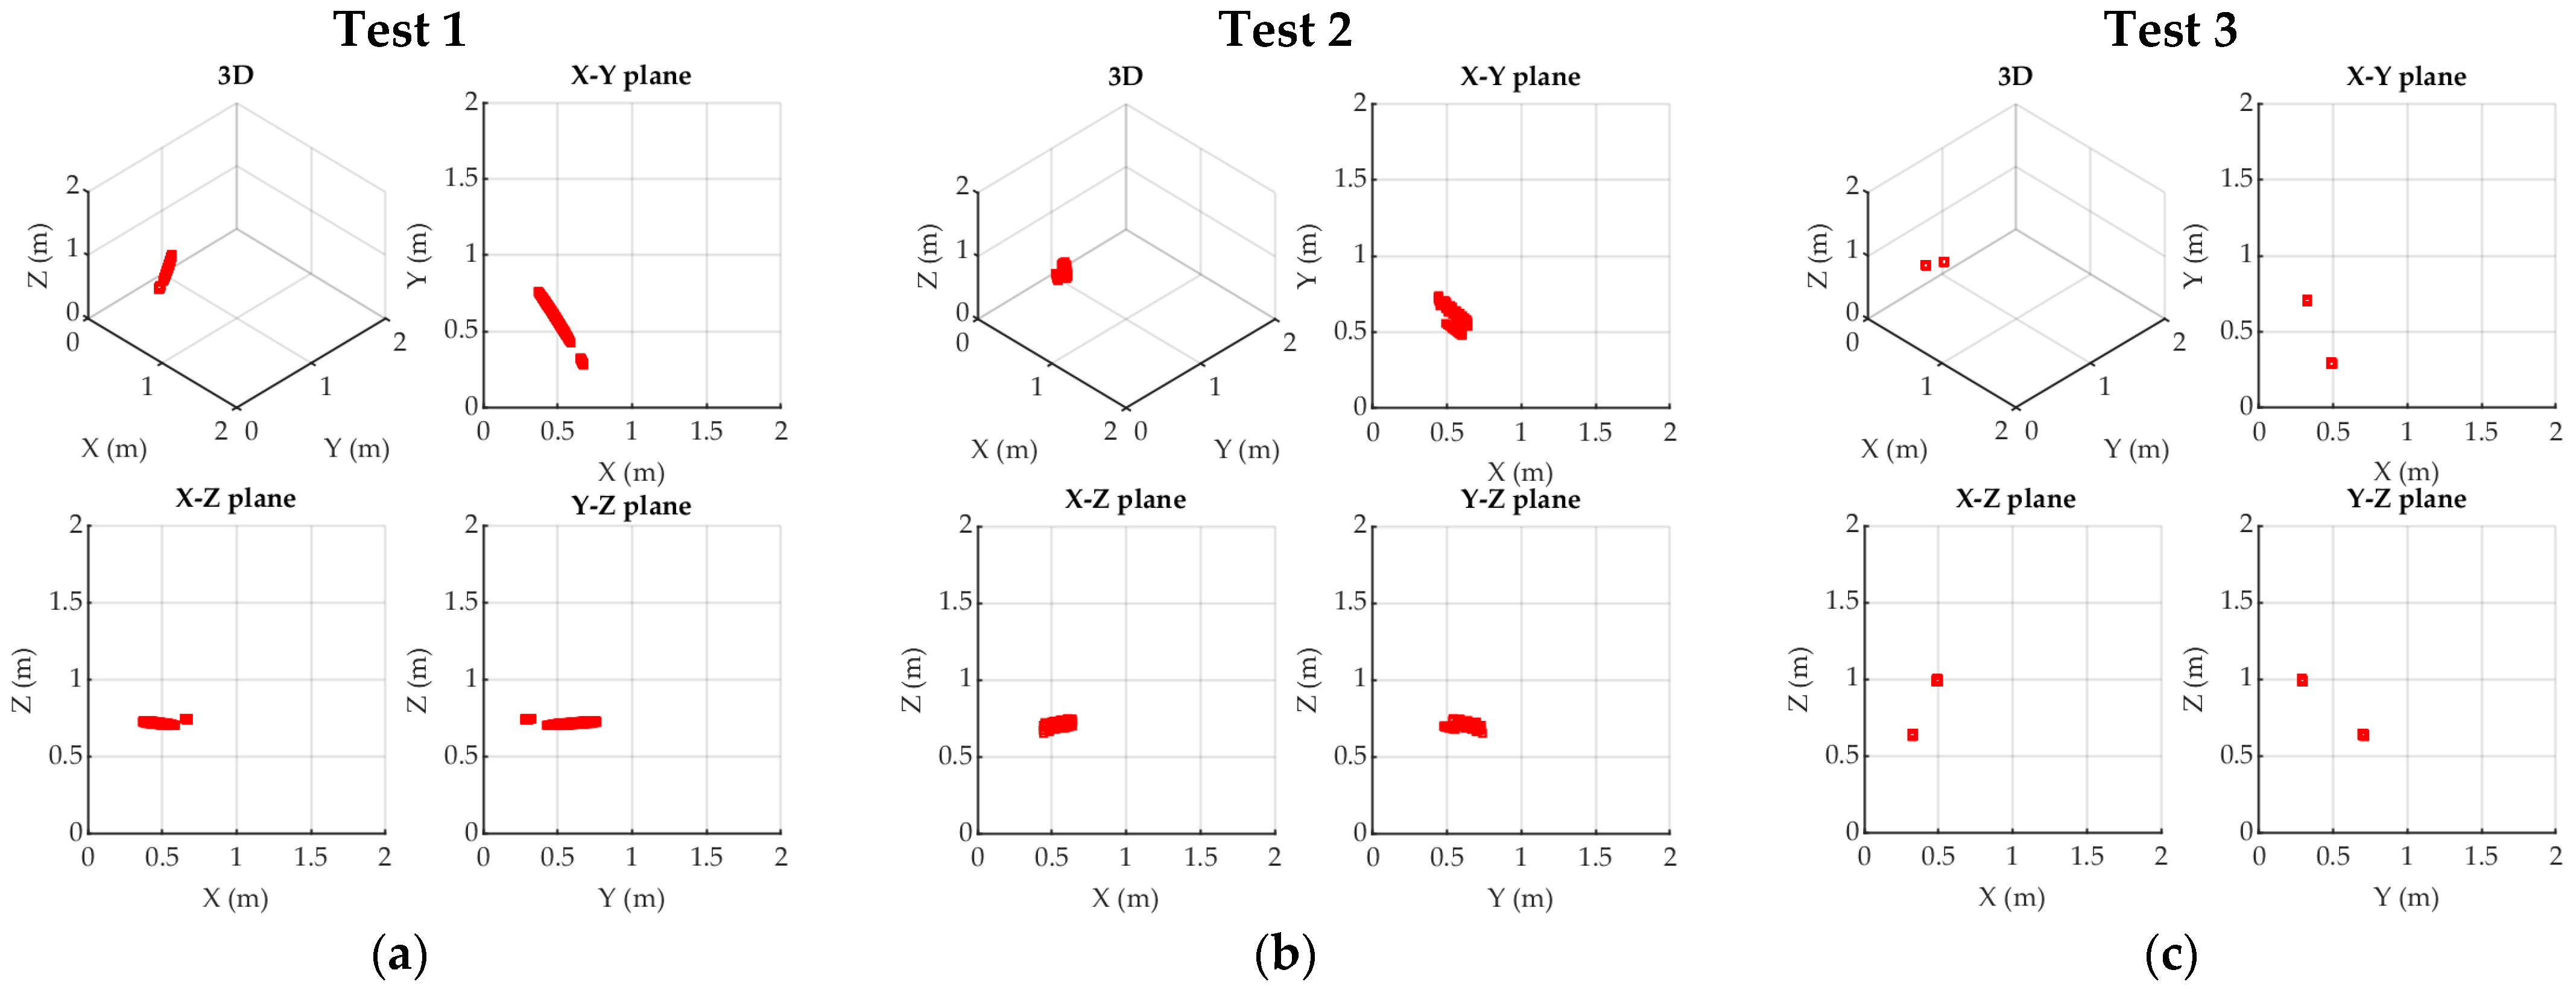
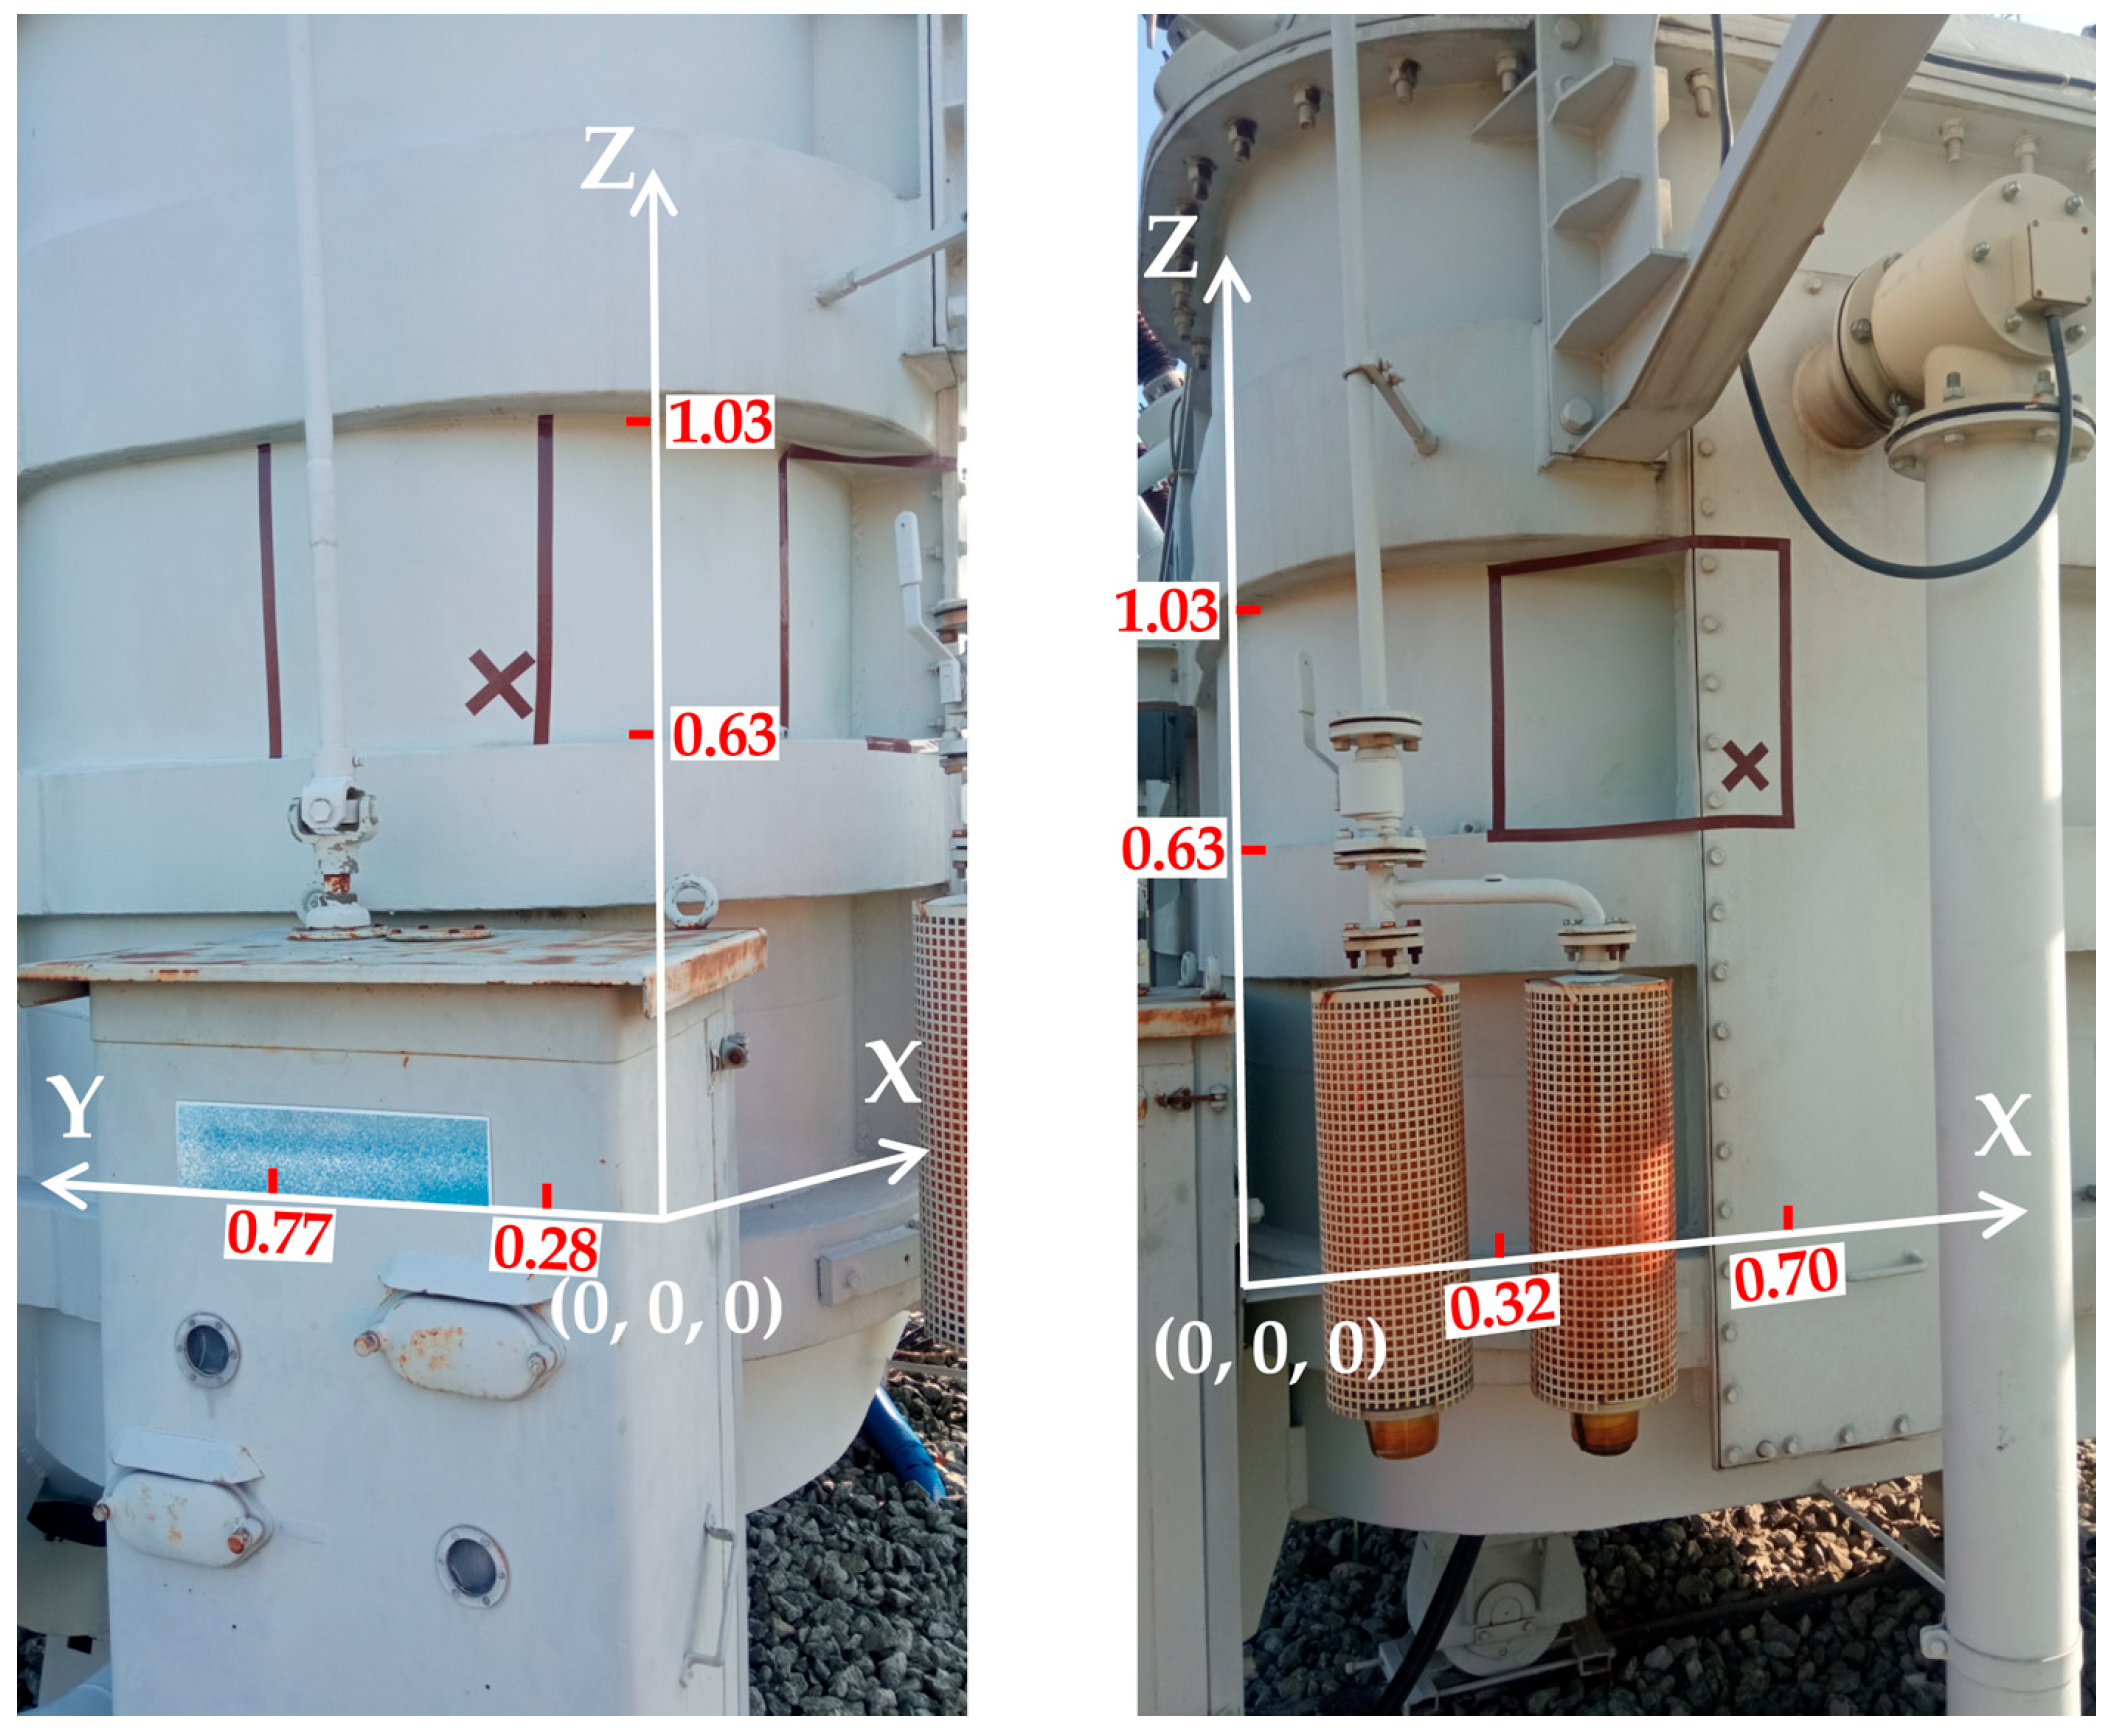
| The Range of Determined Coordinates of the PD Source | ||
|---|---|---|
| X (m) | Y (m) | Y (m) |
| 0.32–0.70 | 0.28–0.77 | 0.63–1.03 |
| The Modal Value of the PD Source Coordinates | ||
| X (m) | Y (m) | Y (m) |
| 0.65 | 0.33 | 0.70 |
| AE: Pulse (1) | AE: No Pulse (0) | |
|---|---|---|
| UHF: Pulse (1) | TP = 5.9% | FP = 9.6% |
| UHF: No Pulse (0) | FN = 17.6% | TN = 66.9% |
| Measurement Point Designation | AE Sensor Coordinates | Measurement Point Designation | AE Sensor Coordinates | ||||
|---|---|---|---|---|---|---|---|
| X (m) | Y (m) | X (m) | X (m) | Y (m) | Z (m) | ||
| P1 | 0.09 | 0 | 0.73 | P10 | 0.75 | 0.05 | 1.00 |
| P2 | 0.38 | 0 | 0.70 | P11 | 0.40 | 0 | 0.85 |
| P3 | 0.41 | 0 | 0.91 | P12 | 0.09 | 0 | 1.50 |
| P4 | 0.13 | 0 | 0.99 | P13 | 0.11 | 0 | 1.51 |
| P5 | 0.09 | 0 | 0.70 | P14 | 0.33 | 0 | 0.99 |
| P6 | 0.10 | 0 | 0.86 | P15 | 0.33 | 0 | 1.51 |
| P7 | 0.13 | 0.01 | 0.78 | P16 | 0.10 | 0 | 1.73 |
| P8 | 0.59 | 0.01 | 1.00 | P17 | 0.33 | 0 | 1.70 |
| P9 | 0.60 | 0 | 0.87 | P18 | 0.41 | 0 | 1.72 |
| The Range of Determined Coordinates of the PD Source | ||
|---|---|---|
| X (m) | Y (m) | Z (m) |
| 0.31–0.61 | 0.08–0.34 | 0.42–1.32 |
| The Modal Value of the PD Source Coordinates | ||
| X (m) | Y (m) | Y (m) |
| 0.44 | 0.22 | 0.67 |
| AE: Pulse (1) | AE: No Pulse (0) | |
|---|---|---|
| UHF: Pulse (1) | TP = 32.7% | FP = 17.3% |
| UHF: No Pulse (0) | FN = 39.7% | TN = 10.3% |
| Test Designation | AE Sensor | AE Sensor Coordinates | ||
|---|---|---|---|---|
| X (m) | Y (m) | Y (m) | ||
| Test 1 | CH1 | 0.860 | 0 | 0.265 |
| CH2 | 1.195 | 0 | 0.330 | |
| CH3 | 0.990 | 0 | 0.480 | |
| CH4 | 0.695 | 0 | 0.490 | |
| Test 2 | CH1 | 1.030 | 0 | 0.340 |
| CH2 | 1.380 | 0 | 0.250 | |
| CH3 | 1.315 | 0 | 0.505 | |
| CH4 | 0.695 | 0 | 0.485 | |
| Test 3 | CH1 | 0.870 | 0 | 0.470 |
| CH2 | 0.945 | 0 | 0.215 | |
| CH3 | 1.140 | 0 | 0.510 | |
| CH4 | 1.145 | 0 | 0.240 | |
| The Range of Determined Coordinates of the PD Source | ||
|---|---|---|
| X (m) | Y (m) | Z (m) |
| 0.85–1.01 * | 0.05–0.95 * | −0.07–0.29 * |
| The Modal Value of the PD Source Coordinates | ||
| X (m) | Y (m) | Y (m) |
| 0.96 | 0.76 | 0.11 |
Disclaimer/Publisher’s Note: The statements, opinions and data contained in all publications are solely those of the individual author(s) and contributor(s) and not of MDPI and/or the editor(s). MDPI and/or the editor(s) disclaim responsibility for any injury to people or property resulting from any ideas, methods, instructions or products referred to in the content. |
© 2025 by the authors. Licensee MDPI, Basel, Switzerland. This article is an open access article distributed under the terms and conditions of the Creative Commons Attribution (CC BY) license (https://creativecommons.org/licenses/by/4.0/).
Share and Cite
Sikorski, W.; Gielniak, J. Online Monitoring of Partial Discharges in Large Power Transformers Using Ultra-High Frequency and Acoustic Emission Methods: Case Studies. Energies 2025, 18, 1718. https://doi.org/10.3390/en18071718
Sikorski W, Gielniak J. Online Monitoring of Partial Discharges in Large Power Transformers Using Ultra-High Frequency and Acoustic Emission Methods: Case Studies. Energies. 2025; 18(7):1718. https://doi.org/10.3390/en18071718
Chicago/Turabian StyleSikorski, Wojciech, and Jaroslaw Gielniak. 2025. "Online Monitoring of Partial Discharges in Large Power Transformers Using Ultra-High Frequency and Acoustic Emission Methods: Case Studies" Energies 18, no. 7: 1718. https://doi.org/10.3390/en18071718
APA StyleSikorski, W., & Gielniak, J. (2025). Online Monitoring of Partial Discharges in Large Power Transformers Using Ultra-High Frequency and Acoustic Emission Methods: Case Studies. Energies, 18(7), 1718. https://doi.org/10.3390/en18071718