Article

MPPT-Based Chaotic ABC Algorithm for a Photovoltaic Power System Under Partial Shading Conditions

Department of Electrical Engineering, Chung Yuan Christian University, Taoyuan 320, Taiwan
*
Author to whom correspondence should be addressed.
Energies 2025, 18(7), 1710; https://doi.org/10.3390/en18071710
Submission received: 24 January 2025 / Revised: 5 March 2025 / Accepted: 19 March 2025 / Published: 28 March 2025
(This article belongs to the Special Issue New Trends in Photovoltaic Power System)

Abstract

:
This paper presents a novel maximum power point tracking (MPPT) method designed for a photovoltaic (PV) power system operating under partial shading conditions. Partial shading conditions induce multiple power peak characteristics into the power–voltage curve of the PV power system, such that conventional MPPT methods often lead local maximum power and result in suboptimal energy harvesting. To solve this problem, this paper proposes a chaotic artificial bee colony (CABC) algorithm hybridized with a chaotic searching behavior. The incorporation of the chaotic mapping enhances the exploration capability of bees (i.e., faster convergence time) and escapes local optima. To demonstrate its superior performance, the CABC algorithm is rigorously evaluated through simulations under two distinct partial shading scenarios, while making comparisons with the standard ABC algorithm and traditional MPPT methods. Therefore, the potential of this novel approach enhances MPPT accuracy, efficiency, and reliability in a partially shaded PV power system.

1. Introduction

Photovoltaic power systems present a compelling solution for solar energy harvesting, directly converting sunlight into electricity without harmful emissions [1,2,3]. However, maximizing energy extraction from PV power is challenging due to the inherent variability of solar irradiance, weather patterns, and shading conditions, etc., [4,5,6]. In addition, maximum power point tracking techniques have become crucial components in modern PV power systems. Generally speaking, MPPT algorithms should dynamically adjust the operating point of the PV power conversion system to output the maximum power under various environmental conditions [7,8]. Traditional MPPT algorithms, such as Perturb and Observe (P&O) [9] and Incremental Conductance (INC) [10], are widely employed due to their simplicity and ease of implementation. These algorithms rely on incremental adjustments of the PV module operating voltage from observation of the current power changes to iteratively converge toward the maximum power point (MPP) [11,12,13]. However, the uneven illumination of the PV module leads to multiple peaks on the power–voltage (P-V) characteristic curve [14,15,16,17], i.e., the situation occurs on the PV module under partial shading conditions. These multiple peaks mislead conventional MPPT algorithms, i.e., causing wrong convergence to local maximum power points (LMPPs) instead of the global maximum power point (GMPP). This means that the conventional MPPT methods result in significant energy losses under the partial shading conditions.
To solve the limitations due to partial shading conditions, advanced MPPT techniques employing metaheuristic optimization algorithms have garnered significant interest. For example, some algorithms inspired by natural phenomena offer robust and adaptive approaches for MPPT [18,19]. On the other hand, metaheuristic algorithms, including genetic algorithms (GA) [20], particle swarm optimization (PSO) [21,22,23,24], and artificial bee colony (ABC) [25,26,27,28], utilize stochastic search processes to explore a broader range of potential solutions and improve the ability to circumvent local optima and converge towards the GMPP. These algorithms emulate natural processes such as evolution, swarm intelligence, and foraging behavior to iteratively refine the optimal operating point, so that the PV power extraction is maximized from the PV power system [29,30]. However, these metaheuristic algorithms usually require complex computation and high time cost. This implies that the convergence of MPPT is slow and PV power extraction is reduced. On the other hand, chaotic mapping behavior has been applied to improve the performance of the PSO algorithm in PV MPPT [31,32,33]. Chaotic mapping behavior is seemingly random behavior offering ergodicity and sensitivity to initial conditions and aiding escape from local optima. Combining metaheuristic algorithms and chaotic mapping improves exploration distribution to be like a white noise, so that it enables faster convergence and better GMPP tracking.
This paper presents a novel MPPT approach to integrate the ABC algorithm with a chaotic mapping behavior for improving the tracking performance of partially shaded PV power systems. Characterized by their ergodic and non-repeating behavior, chaotic dynamics provide a mechanism for generating diverse and unpredictable search patterns. Then, the ABC algorithm is enhanced to comprehensively explore the wider solution space and avoid local maxima. Moreover, the proposed chaotic ABC algorithm is rigorously evaluated through simulations under two distinct partial shading scenarios to demonstrate its superior performance compared to the standard ABC algorithm. The results showcase the enhanced accuracy, adaptability, and convergence speed achieved by integrating chaotic dynamics into the ABC algorithm. As a result, this approach paves the way for more reliable energy extraction from the PV power system operating under complex real-world conditions, i.e., it represents a significant advancement in MPPT technology.
The structure of this paper is as follows: Section 2 provides a comprehensive over-view of the mathematical model of a solar photovoltaic module and the impact of partial shading on its P-V characteristics. Section 3 introduces the chaotic ABC algorithm based MPPT for addressing multi-peak power characteristics. Section 4 presents the simulation results to validate the effectiveness of the CABC algorithm in tracking the GMPP under various shading conditions. Finally, some conclusions are made in Section 5.

2. Modeling of a PV Module

This section delves into the modeling of a PV module, encompassing its current–voltage (I-V) characteristics, equivalent circuit representation, and the impact of external factors like irradiance and temperature on power output.

2.1. I-V Characteristics and Equivalent Circuit

A PV cell, essentially a semiconductor component of a PV panel, directly converts light energy into electrical energy via the photovoltaic effect. Its behavior closely resembles that of a P-N junction diode, and its electrical characteristics can be effectively represented by an equivalent circuit model. The simplified model of a PV panel is composed of the fundamental behavior of several PV cells and responses to varying environmental conditions. In detail, the equivalent circuit model consists of a current source, representing the photocurrent ( I p h ) generated in proportion to incident light intensity, connected in parallel with a diode, representing the P-N junction. Let us denote the series resistance R s as the internal resistance of the PV cell, and the shunt resistance R p as the resistance to represent leakage current paths. Mathematically, the total output current ( I P V ) of the PV panel can be expressed as follows:
I P V = N p I p h I O × exp q V P V + q R s I P V N s n K B T 1 V P V + R s I P V N s R p
where N p is the number of parallel-connected strings of solar cells in the module; I p h is the photocurrent; I O is the diode saturation current; q is the elementary charge ( 1.6 × 10 19   C ); V P V is the output voltage; N s is the number of series-connected solar cells in a single string; n is the diode ideality factor; K B is the Boltzmann constant ( 1.3806503 × 10 23   J / K ); and T is the cell temperature in Kelvin. The photocurrent ( I P h ) is proportional to the incident irradiance ( G ) to be expressed as follows:
I P h = I s c , S T C + K i T K i T S T C × G G S T C
where I s c , S T C is the short-circuit current at standard test conditions (STCs); K i is the short-circuit current temperature coefficient; T S T C is the standard test condition temperature 298.15   K ( 25   C ); and G S T C is the irradiance at standard test conditions ( 100 W / cm 2 ). The diode saturation current ( I O ) is temperature-dependent and is given by the following equation:
I O = I O , r e f T T r e f 3 exp q E g n K B × 1 T r e f 1 T
where I O , r e f is the diode saturation current at a reference temperature ( T r e f ) of 298.15   K corresponding to the standard test conditions; E g is the bandgap energy of the semiconductor material, which for crystalline silicon is approximately 1.12 electron volts ( eV ) at standard test temperature. As a result, the preceding equations characterize the current-voltage relationship of the PV panel, while the output power and current are determined for various terminal PV voltages.

2.2. Effect of Irradiance and Temperature

From the above, the current–voltage characteristics of the PV panel are significantly influenced by external environmental factors, primarily irradiance ( G ), and cell temperature ( T ). Understanding their influence is crucial for maximizing energy extraction from the PV power system. The photocurrent ( I P h ) in (2) is directly proportional to incident irradiance. Consequently, increased irradiance yields a proportional increase in short-circuit current and a corresponding increase in the overall power output of the PV panel; otherwise, the current and power output decrease. While irradiance primarily affects the current output, temperature predominantly influences the voltage output. As the temperature rises, the open-circuit voltage ( V O C ) decreases, while the short-circuit current ( I s c ) experiences a slight increase. This inverse relationship between temperature and V O C is attributed to the temperature dependence of the semiconductor material bandgap energy. The dependence of short-circuit current on temperature and irradiance can be quantified as follows:
I s c = I s c , S T C × G G S T C + K i T K i T S T C
Moreover, the open-circuit voltage is predominantly affected by temperature and series resistance ( R s ), while the influence of irradiance is relatively minor and often negligible. The equation for V O C is as follows:
V O C = V O C , S T C + K v T T S T C I s c I s c , S T C R s
where V O C is the open-circuit voltage at a specific temperature; V O C , S T C is the open-circuit voltage at STC; K v is the open-circuit voltage temperature coefficient. The combined influence of irradiance and temperature on the I-V characteristics of the PV panel, as described by the equations governing I s c and V O C , reveals the dynamic nature of PV panel performance. This dynamic behavior necessitates MPPT algorithms to continuously optimize the operating point and ensure maximal energy extraction under fluctuating environmental conditions.

2.3. P-V Characteristics and Maximum Power Point

The power output of the PV panel is the product of its output voltage and current, given by the following:
P P V = V P V I P V
Plotting the power output ( P P V ) vs. the voltage ( V P V ) yields the power–voltage (P-V) characteristic curve of the PV panel, with an example shown in Figure 1. The presence of a maximum point, the MPP, delivers its peak power output under specific irradiance and temperature conditions. At the MPP, denoted by VMPP and IMPP for voltage and current, respectively, the derivative of power with respect to voltage becomes zero:
d P P V d V P V = 0
In other words, the MPP of the PV panel, representing its optimal operating point, dynamically shifts along the power–voltage characteristic curve due to varying environmental conditions. As a result, specialized control strategies are required to dynamically adjust the PV system operating voltage or current for operating at the MPP.

2.4. Impact of Partial Shading and Mitigation Strategies

Partial shading, resulting from obstructions that create uneven irradiance on a PV module composed of several series-parallel panels, significantly hinders the efficient and reliable operation of a PV system. This non-uniform illumination not only alters the electrical characteristics of the PV module but also reduces the power output.

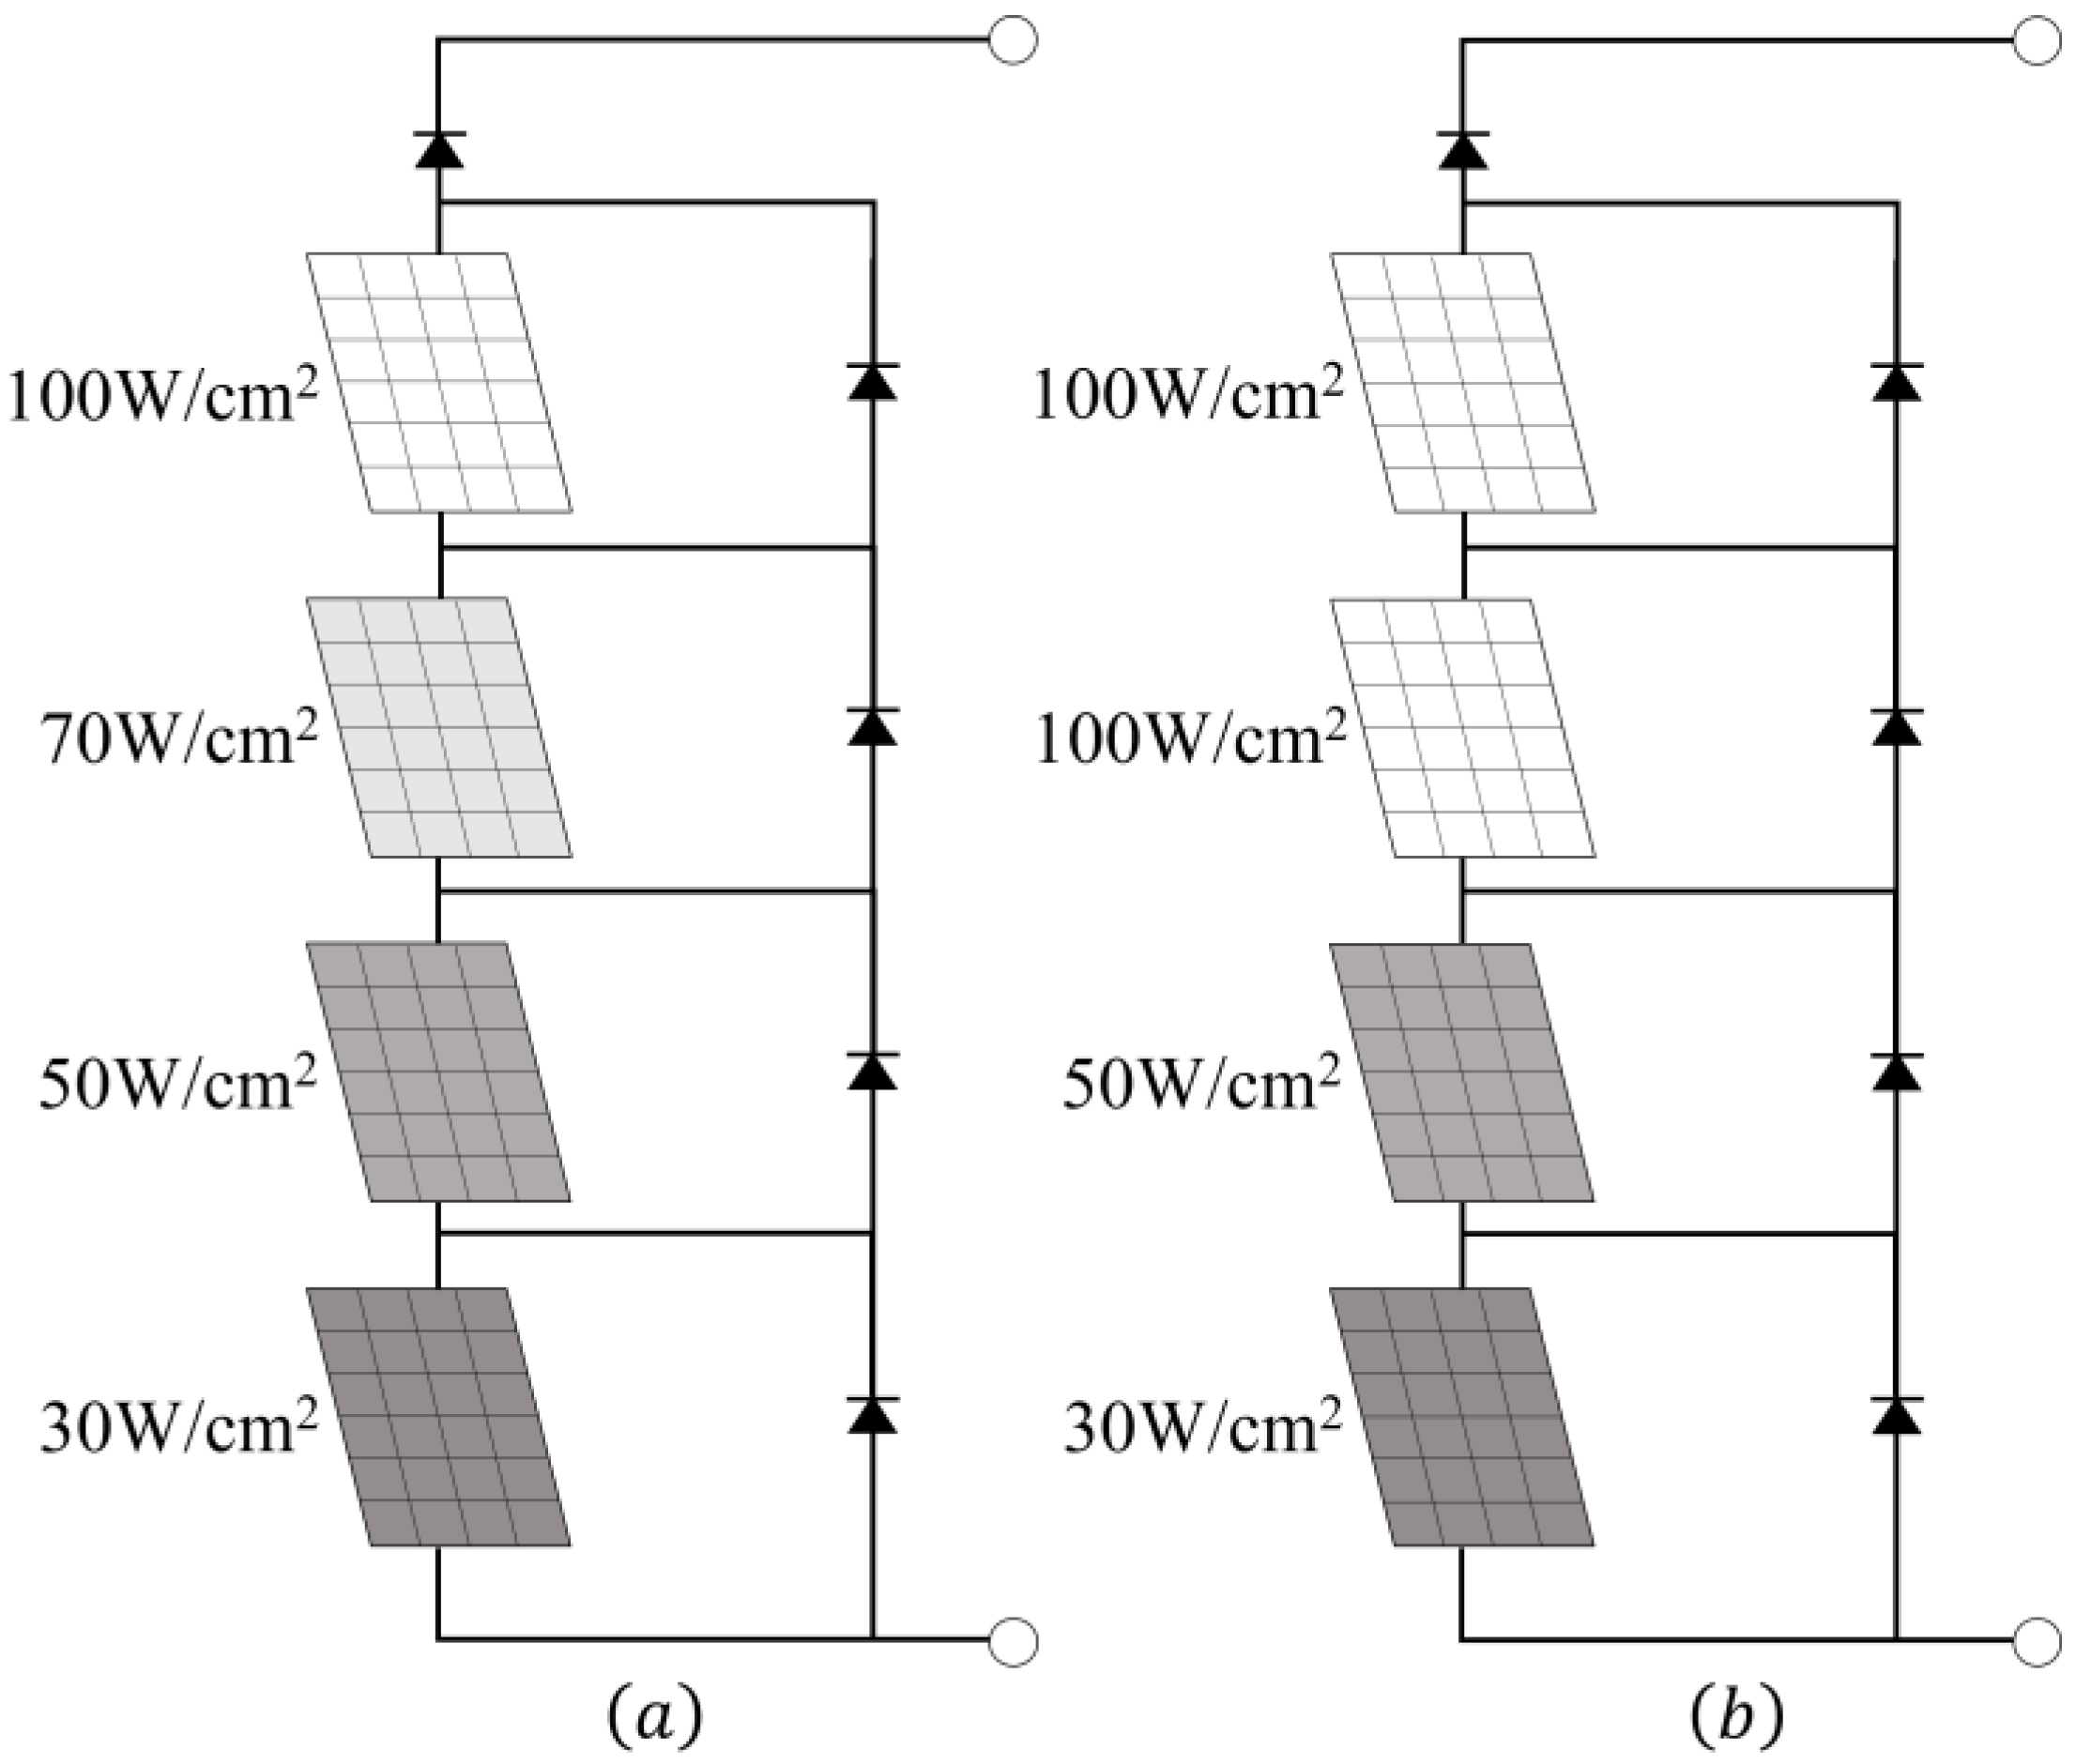
2.4.1. Electrical Effects of Partial Shading

Although a PV module exhibits a single GMPP under uniform irradiance, partial shading conditions induce multiple LMPPs due to the complex interaction between shaded and unshaded cells. A reduction in irradiance on a shaded cell proportionally decreases its photocurrent generation ( I P h ). This means that the shaded cell, with diminished I P h , operates at a lower voltage to maintain current continuity. However, the series-connected architecture of the PV module necessitates equal current flow through all cells. This reduced operating voltage forces the shaded cell into reverse bias, leading to power dissipation instead of generation. The power dissipated by the shaded cell contributes to hot spot formation.
To mitigate localized power dissipation and module damage due to shaded cells, bypass diodes are connected in parallel with strings of PV cells within the module. Under uniform irradiance, the bypass diode remains reverse-biased and non-conductive. However, if a cell within the string is shaded, its output voltage decreases, potentially forcing it into reverse bias. In this case, the bypass diode becomes forward-biased to provide an alternate current path. This prevents reverse-bias operation of the shaded cell, limiting its power dissipation and averting hotspot formation. The current diverted through the bypass diode effectively bypasses the shaded cell, while the remaining unshaded cells in the string are allowed to operate at a higher voltage and continue contributing to power generation. As a result, since the diode begins to conduct and effectively clamps the cell voltage, the clamping action alters “knee” regions in the current–voltage characteristic curve. The bypass diodes effectively prevent hotspot formation by limiting power dissipation in the shaded cells, so that this configuration enhances PV module reliability and extends its operational lifespan. For example, Figure 2 illustrates a PV array incorporating bypass diodes under two partial shading cases. The four PV panels are subject to different irradiance, so that the diodes clamp the PV voltage, i.e., there are local maximum power points in the P-V curve of the PV characteristics. According to the two uneven irradiance cases in Figure 2a,b, the multi-peak phenomena are induced, as shown in Figure 3 and Figure 4, respectively.

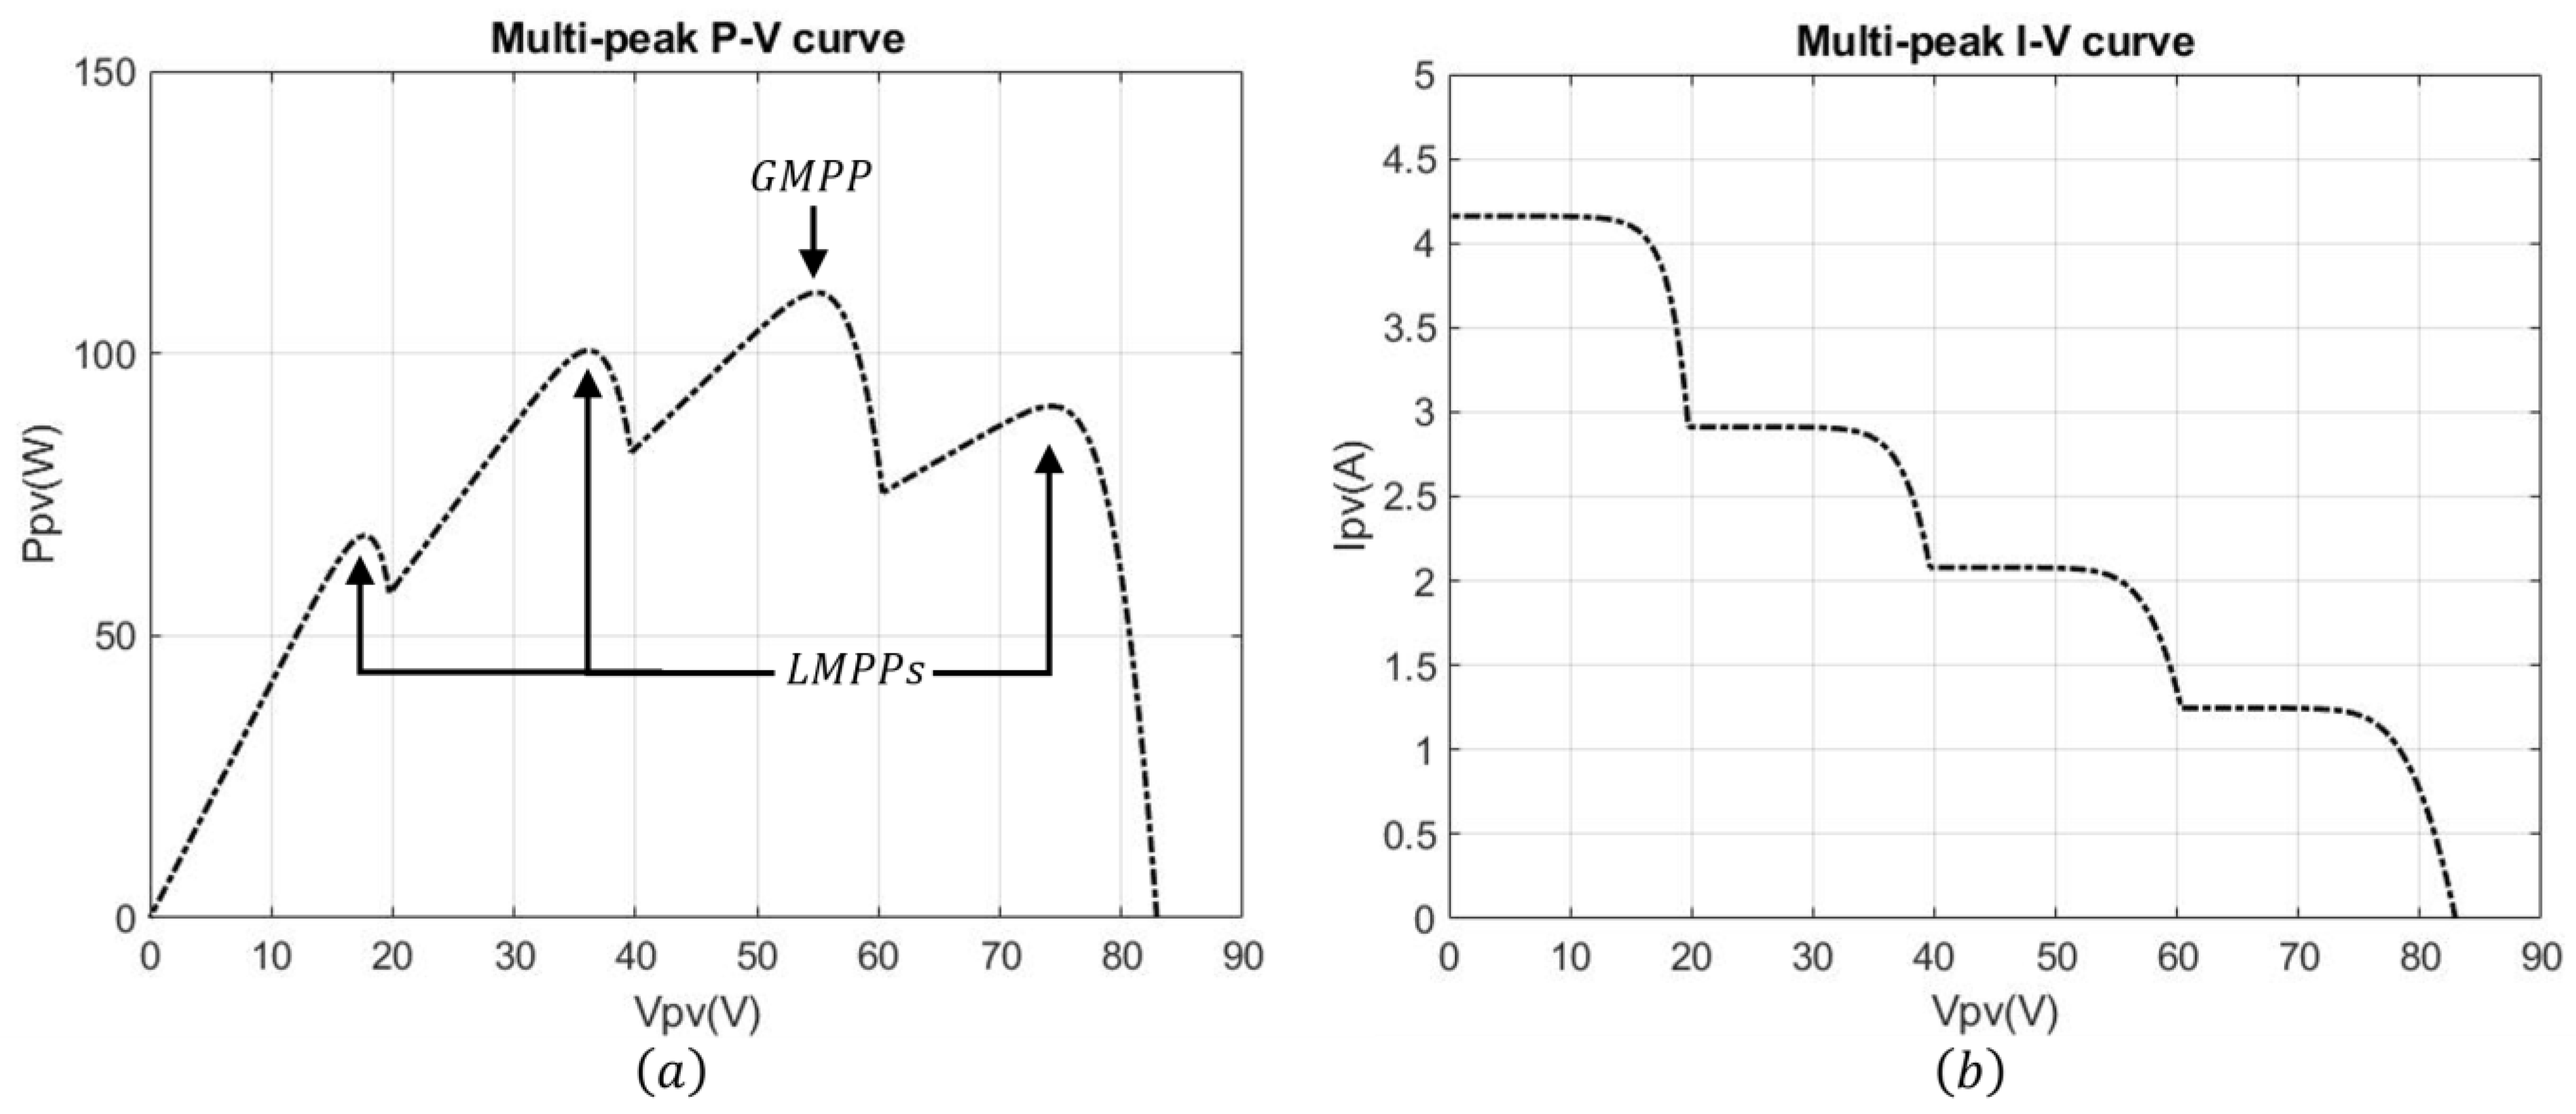
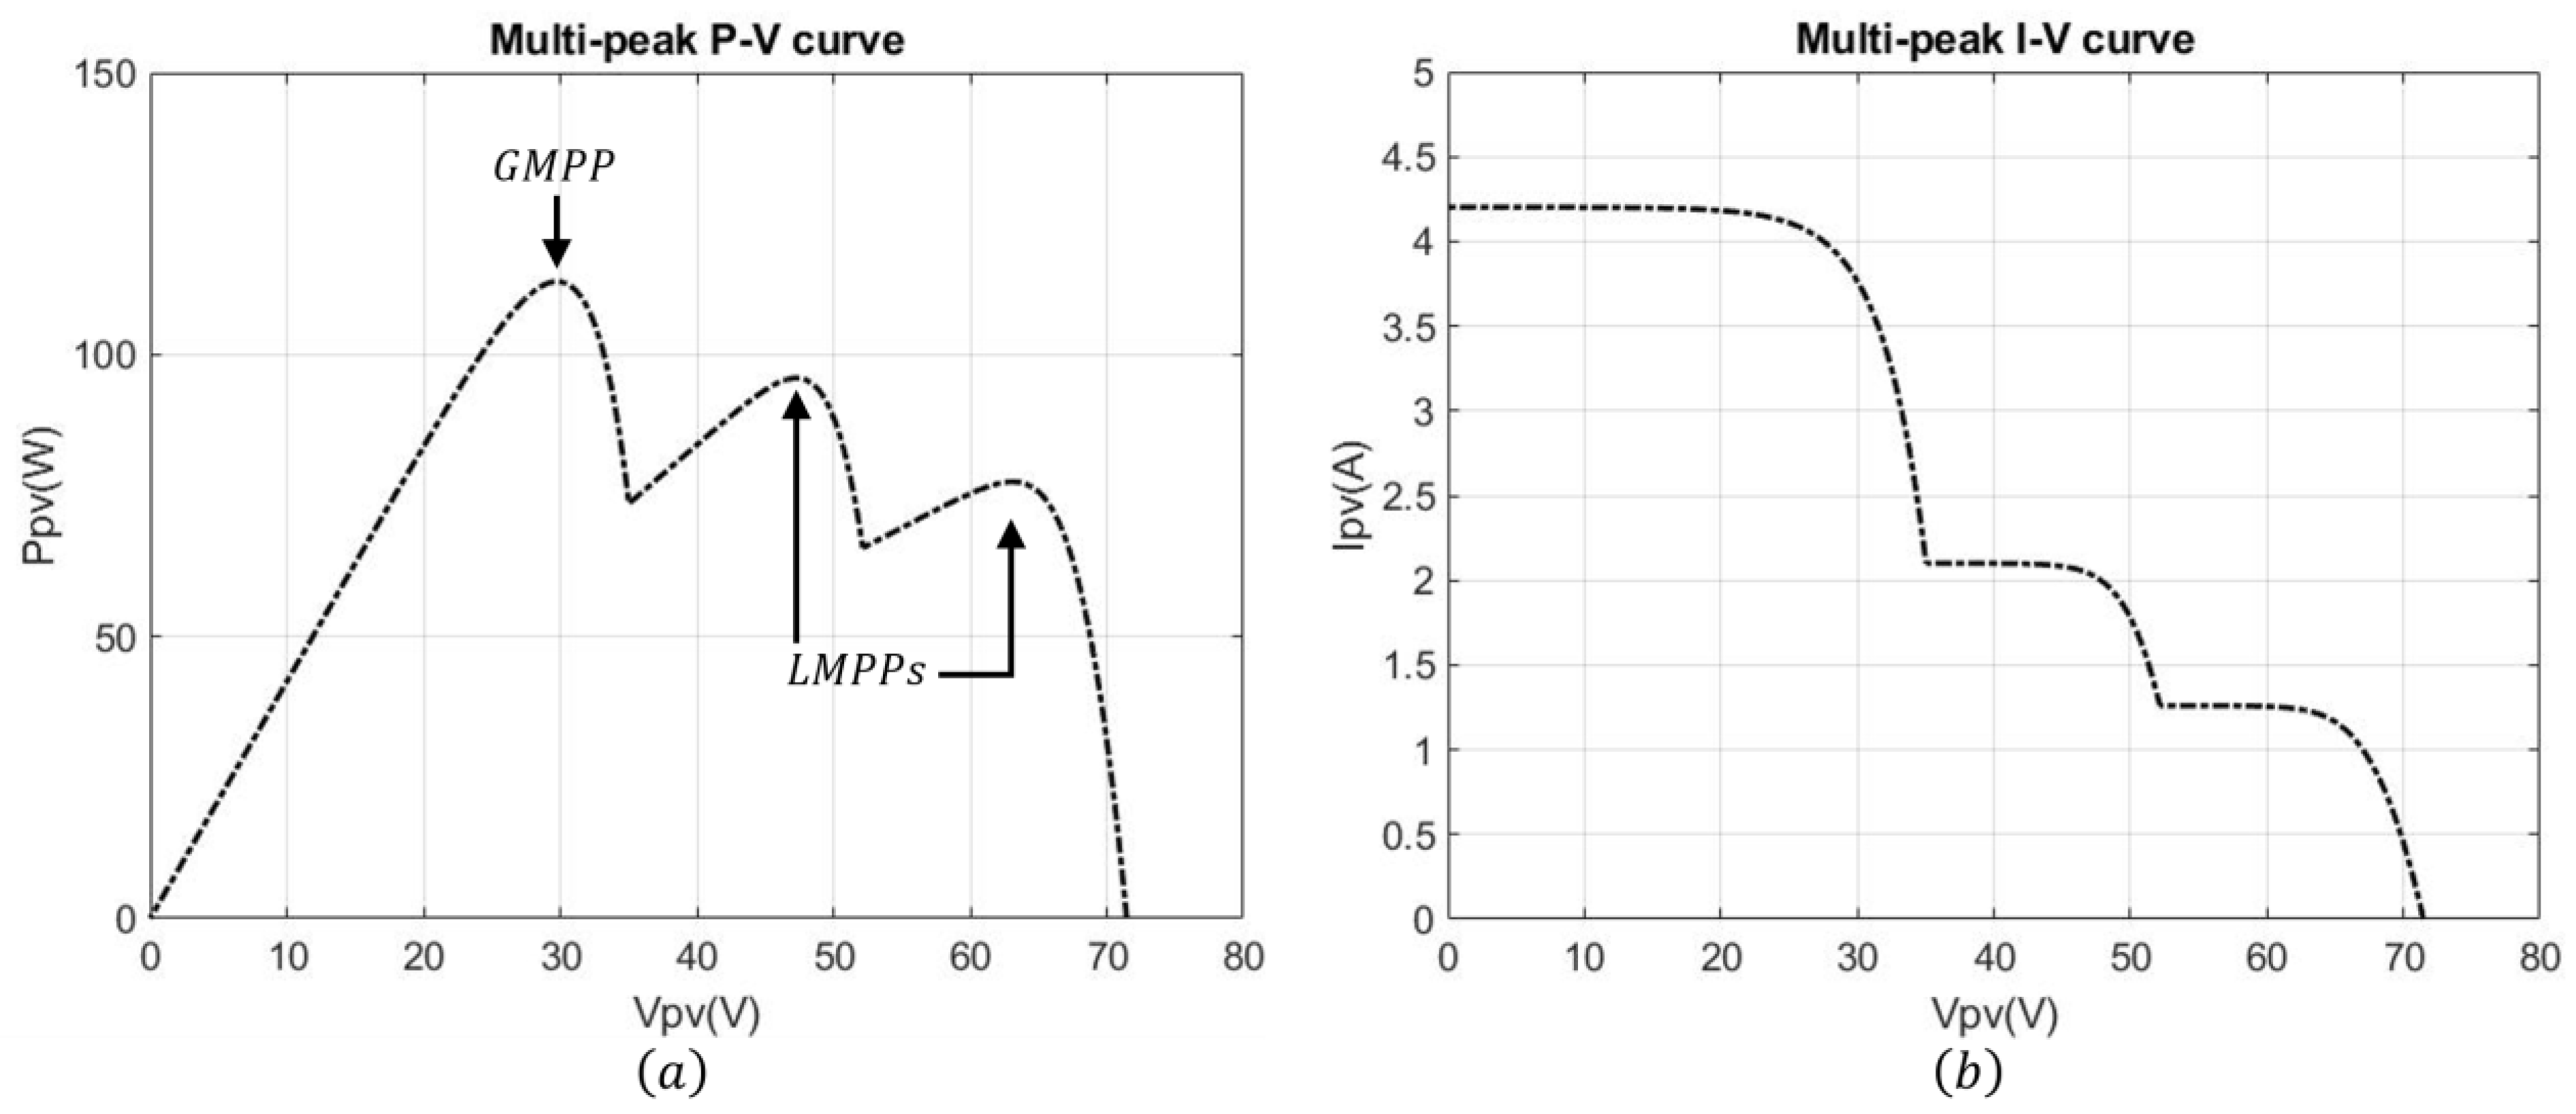
2.4.2. Multi-Peak PV Characteristics Under Partial Shading

Bypass diodes are crucial for preventing hotspots in PV modules, but they induce multi-peak P-V characteristics under partial shading conditions. As such, the activation of each bypass diode varies depending on the specific shading pattern across the PV array. Each conducting bypass diode induces a new “knee” in the P-V curve, i.e., creating a LMPP. The number of peaks on the P-V curve is closely related to the number of bypass diodes and the complexity of the shading pattern. For example, a module with four bypass diodes and four panel strings might exhibit two to four discernible peaks under various shading scenarios, as in Figure 3. Critically, not all of these peaks represent optimal operating points. Under partial shading, the GMPP typically resides at one of the local peaks but is not necessarily the highest-voltage peak. As shading progressively increases, the P-V curve evolves as follows. As shading intensifies, the first bypass diode conducts, inducing a second power peak, and the GMPP may transition from the original peak to the new one. With further shading of more cell strings, additional bypass diodes sequentially create more peaks on the P-V curve and shift the GMPP. For example, Figure 3 and Figure 4 demonstrate four-peak and three-peak power curves arising from the partial shading cases in Figure 2. The number of LMPPs depends on different partial shading conditions, while the power is also relative to the panel temperature. As a result, some peaks may be insufficiently distinct by some MPPT algorithms.

3. Chaotic ABC Algorithm-Based MPPT for a PV Power System

Maximizing the power output from a PV module under uniform irradiance conditions involves easily tracking the GMPP. Unfortunately, exploring the effect of the partial shading is a significant challenge due to the multi-peak P-V characteristic curves of the PV system. Conventional MPPT algorithms, designed for single-peak tracking, frequently converge to local maxima (LMPPs) instead of the global maximum (GMPP) under partial shading conditions, i.e., reducing energy yield. Addressing this challenge necessitates advanced MPPT techniques that are capable of navigating the complex multi-peak P-V landscape and accurately identifying the GMPP; metaheuristic optimization algorithms, inspired by natural phenomena, have emerged as promising solutions with their ability to handle the nonlinear and multi-modal optimization problem.

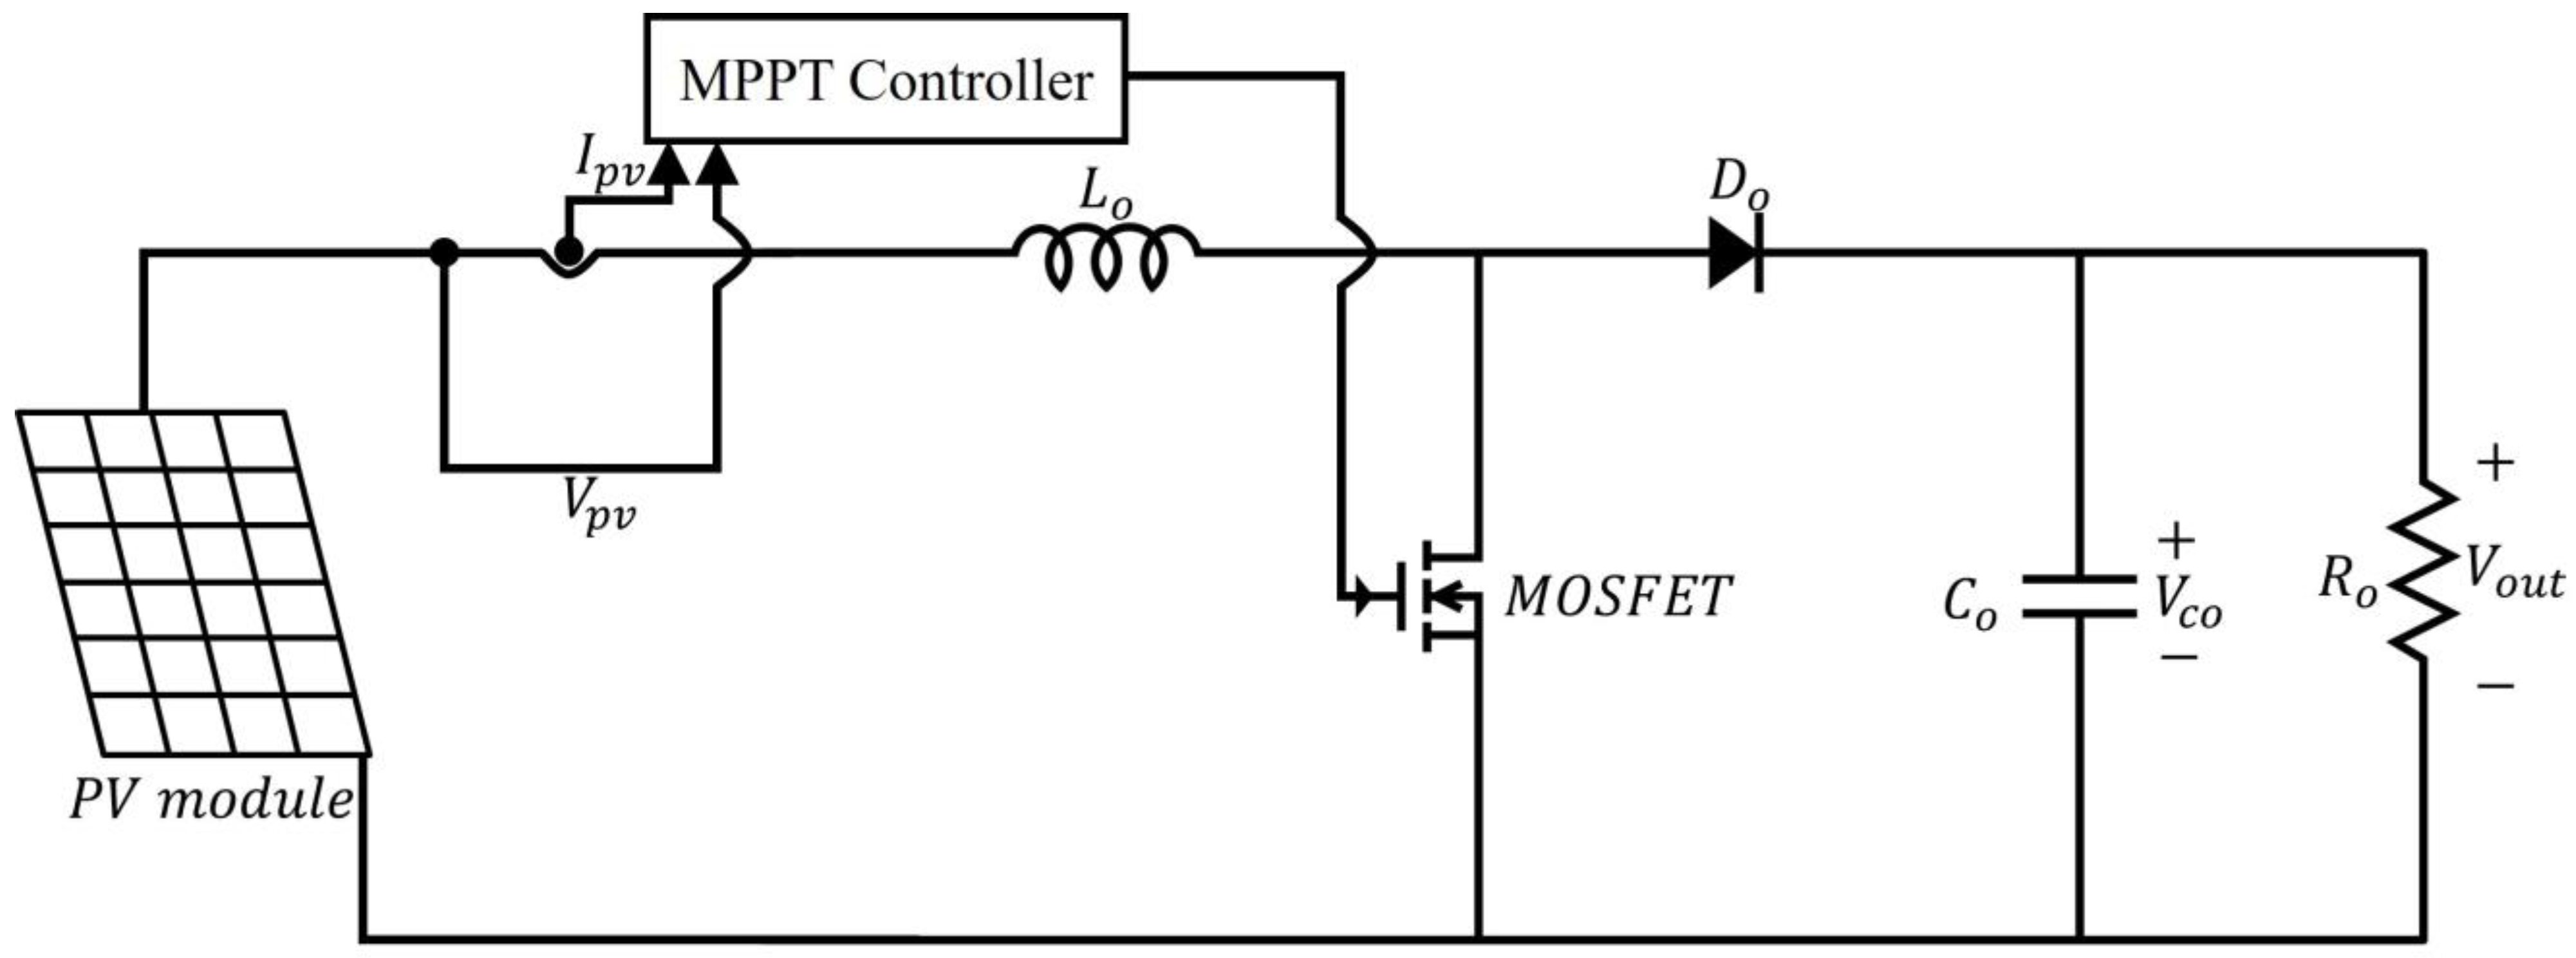
3.1. MPPT Implementation with a Boost Converter

The practical implementation of MPPT algorithms commonly employs a DC-DC converter to interface the PV module with the load, as illustrated in Figure 5, facilitating operating point adjustments. The converter is composed of an inductor ( L o ), a MOSFET switch, a diode ( D o ), a capacitor ( C o ), and a load resistance ( R o ).
Particularly, the load voltage surpasses the PV voltage by the boost converter. The output voltage ( V o u t ) of the boost converter is related to the input voltage ( V i n ) through the following equation:
V o u t = V i n 1 U
where V o u t is the output voltage; V i n is the input voltage; and U is the duty cycle of the MOSFET switch, defined as the on-time ratio of the MOSFET in one period. This equation elucidates the primary function of the boost converter to generate an output voltage exceeding its input. Modulating the duty cycle allows the converter to effectively regulate the output voltage, thereby controlling the operating point of the connected PV module. To develop the MPPT algorithm, we utilized measurements of the PV voltage ( V P V ) and current ( I P V ) to compute output power ( P P V ) and search the optimal operating point for maximum power extraction.

3.2. Chaotic ABC Algorithm Based MPPT

The traditional ABC algorithm is a population-based optimization technique inspired by bee foraging behavior, and it has emerged as a promising approach for MPPT. This bio-inspired algorithm mimics the searching strategy that bees employ to locate nectar sources, in which each potential nectar source represents a duty cycle setting for the DC-DC boost converter of the PV power system. Through iterative exploration and the exploitation of duty cycle values, the ABC algorithm seeks the optimal setting that maximizes PV power generation. However, the random searching mode results in high computational iterations. To enhance exploration and mitigate premature convergence, a chaotic system is integrated into the original ABC algorithm. By observing the behavior of employed bees, we replace the original controlled randomness with a chaotic element to let employed bees escape local optima and explore a wider range of the solution space. This leads to more robust and efficient MPPT performance and improves energy harvesting from the PV power system. The detail chaotic artificial bee colony (CABC) algorithm is reported for solving the MPPT problem as follows.
Let the nectar vector be denoted as q r , where r indexes the nectar source. The vector q r comprises N dimensions ( ν = 1 , 2 , 3 , , N ) and constitutes the solution space. Each dimension, q r , ν , of the nectar vector q r is subject to the constraint l ν q r , ν L ν , where l ν and L ν represent the minimum and maximum bounds, respectively, for dimension ν = 1 , 2 , 3 , , N . The total number of employed bees and onlooker bees is SN. The number of effective nectar sources, representing the surviving employed and onlooker bees, is denoted by RN. The maximum iteration count is set to δ , and the abandonment criterion of no improvement for each nectar source is Ω iteration.
The optimization steps of this CABC algorithm are as follows:
Step 1.
Initialization
The employed bees are randomly positioned within the solution space, representing potential sources of nectar to be explored below:
q r s , ν = l ν + r a n d 0 , 1 L ν l ν
where each nectar source location s ( s = 1 , 2 , 3 , , S N ) represents a potential solution, i.e., a candidate solution in the search space, and r a n d 0 , 1 denotes a random number between 0 and 1.
Step 2.
Chaotic Employed Bee Mode
Within the bee colony, effectively surviving employed bees will explore new nectar source locations according to Equations (10) and (11):
q k , ν = q ¯ r k , ν + σ 2 k × q ¯ r k , ν q ¯ r h , ν
σ 1 k ( τ + 1 ) = σ 1 k 3 τ + 0.2 σ 2 k τ + 2.77 σ 1 k τ   rem   β σ 2 k ( τ + 1 ) = σ 1 k τ   rem   β
where q ¯ r k , ν represents the current location of the employed bee; q k , ν represents the new nectar location in the ν -th dimension of the k-th employed bee; σ 2 k [ β , β ] is generated by the folding chaotic system-folding Cubic map; and q ¯ r h , ν is the location of employed bee h in the ν -th dimension, randomly selected from the swarm (where any number h cannot equal k). In Equation (11), the folding function is defined as the remainder shift function as follows:
rem ( σ , β ) = σ   rem   β = σ β σ / β
For any real number σ / β , the term σ / β is the function that rounds σ / β to the nearest integer towards zero. This folding function confines the chaotic trajectory within the interval [ β , β ] , where β is a boundary parameter defining the predefined region. Significantly, the foraging bees do not discover new nectar sources randomly. Instead, they employ the chaotic trajectory generated by boundary folding to guide their search. This exploration strategy more accurately reflects the natural behavior of bees, which forage for nectar along chaotic trajectories constrained by boundaries. For example, Figure 6 illustrates the folding effect of β = 1.72 .
As the value of β decreases, the number of folds increases, expanding the range of the maximum positive Lyapunov exponent in response to perturbations. If a new nectar source location falls outside the operational range of the PV cell, the employed bee h is discarded, and a new nectar source location is randomly calculated for another employed bee until all q k , ν values fall within the PV cells operational range. Since the nectar quantity of a nectar source corresponds to the fitness of the respective solution, employed bees determine relocation based on the fitness of nectar sources q k , ν and q ¯ r k , ν . If relocation is chosen, q k , ν replaces q ¯ r k , ν as the new location.
Step 3.
Onlooker Bee Mode
Onlooker bees are responsible for assessing the adequacy of current nectar sources. If deemed insufficient, they explore new nectar sources to facilitate continued algorithm execution. Onlooker bees calculate the objective fitness value corresponding to the nectar source. Based on the probability w k in Equation (13), they employ a greedy selection method to determine whether to adopt a new nectar source.
w k = f i t k h = 1 R N f i t h
Here, f i t k represents the objective fitness value of the nectar source location q ¯ r k , while f i t h represents the objective fitness value of the nectar source location q ¯ r h . Nectar sources chosen by scout bees are further explored for new potential solutions using Equation (10).
Step 4.
Scout Bee Mode
If a nectar source shows no sign of fitness improvement after reaching its predefined limit, Ω , of consecutive iterations without improvement, it is abandoned. The corresponding employed bee transitions into a scout bee, using Equation (9), and explores a new location to generate a novel nectar source position.
Step 5.
The algorithm defines the nectar source location with the highest nectar yield as the optimal solution.
Step 6.
If either of the termination criteria (the iteration exceeding δ or U b e s t U p r e v _ b e s t e ) are met, the optimal solution is returned; otherwise, the process returns to Step 2. Note here that U b e s t represents the current best duty cycle; U p r e v _ b e s t represents the previous best duty cycle; and e denotes the error tolerance.
For the MPPT control, the objective fitness is set to the output power of the PV module, i.e., f i t = P P V = I P V V P V . Based on the above steps of the CABC algorithm, each iteration updates correspondingly to the duty cycle of the DC-DC boost converter until the GMPP is reached. The combined actions of the chaotic employed bee, onlooker bee, and scout bee phases enable the CABC algorithm to effectively explore all the optima points (through the chaotic employed bee and onlooker bee phases) and maintain global exploration capabilities (through the scout bee phase) within the solution space. By iteratively adjusting the duty cycle of the boost converter and measuring the power, the algorithm progressively converges towards the GMPP, i.e., the nectar source vector ( q r ) can be effectively adjusted to achieve MPPT for the PV power system. Moreover, the introduction of random perturbations and a probabilistic selection mechanism in onlooker bee mode further enhance the algorithm’s ability to escape local optima and identify global optima. The synergistic interaction of these phases maximizes the probability of convergence toward the GMPP. Thus, the efficiency of the PV power conversion system becomes higher. Meanwhile, the process of the algorithm is easily implemented, even adding chaotic mapping calculation. In summary, the flowchart of the proposed CABC method is shown in Figure 7.
Remark 1.
Regarding the choice of parameters, the method trade-offs are convergence speed, accuracy, and robustness. For example, the chaotic parameter β is at least smaller than 1.8 to ensure chaotic behavior. However, a smaller parameter β will limit the mapping space (i.e., the searching space), such that the convergence time become larger. Thus, β = 1.72 balances these metrics effectively for PV MPPT using the folded chaotic map in this paper. On the other hand, colony size is also determined empirically. A larger colony size yields a global search but increases the computational load, while a smaller colony size accelerates the convergence rate but risks entrapment. There is a value of colony size to balance trade-offs between global search, convergence speed, and computational load for robust performance in real cases.
Remark 2.
To make it easier for readers understand the improvement from the CABC algorithm, we discuss the flowchart of the CABC-based MPPT process compared with the standard ABC algorithm here. The key difference between the ABC and the proposed CABC lies in integrating chaotic dynamics into critical stages. Instead of random number generation, the CABC strategically employs chaotic maps. Indeed, the chaotic dynamic mapping plays a white noise-like role to replace the random function in the nectar exploration of employed bees. In this way, the nectar exploration is more similar to natural bees’ behavior and achieves faster convergence in a global searching manner. Especially in the case with multiple power peaks, the advantage is more obvious due to using chaotic exploration.
Remark 3.
To emphasize the feasibility of real-world implementation and validation, the CABC builds upon the well-established ABC algorithm and incorporates chaotic dynamics with a simple chaotic map, i.e., only adding minimal complexity. Therefore, transitioning the CABC-based MPPT to real-world implementation is not anticipated to present significant challenges, and it can be seamlessly integrated with minimal modifications. As a result, the validation of the proposed CABC -based MPPT algorithm is as good as PSO and standard ABC algorithms in a real-world setting. The CABC algorithm with better performance is readily adaptable to practical PV systems and MPPT controllers.

4. Simulation Results

To address the susceptibility of conventional MPPT techniques to local maxima under partial shading conditions, the proposed chaotic ABC algorithm-based MPPT method was applied to a PV power conversion system, as shown in Figure 5. Meanwhile, the performance of the proposed CABC algorithm was compared with the conventional ABC and PSO algorithms [20,21,22,23] under various environmental conditions. Two sets of simulations were conducted to validate the effectiveness of the CABC algorithm in tracking the GMPP of the PV power conversion system under partial shading conditions. The uneven irradiance conditions for these two simulations are illustrated in Figure 2a and Figure 2b, respectively. Figure 3 presents the P-V and I-V characteristics under the irradiance conditions of Figure 2a at an ambient temperature of 25 °C, while Figure 4 shows the P-V and I-V characteristics under the irradiance conditions of Figure 2b at an ambient temperature of 45 °C. These curves clearly demonstrate the presence of multiple local maxima under partial shading conditions, so that we can highlight the challenges faced by conventional MPPT techniques. The parameters of the DC-DC boost converter shown in Figure 5 are as follows: L o =   3   mH , C o = 220   μ F , R o =   50   Ω , and switching frequency = 20   kHz . Module specifications of one PV panel are listed in Table 1.
The CABC algorithm employs the following parameter settings: an initial duty cycle of 0.9, maximum and minimum duty cycles, respectively, of 0.9 and 0.05, a colony group size of 6, a nectar abandonment limit Ω = 12 , and a predefined boundary parameter β = 1.72 for the folded chaotic map. The ABC algorithm utilizes the same parameter settings as the CABC algorithm but excludes the chaos-related parameters. The PSO algorithm shares the initial duty cycle and range with the CABC algorithm, as well as the population size. On the other hand, the PSO algorithm uses an inertia weight ( ω ) of 0.5 and cognitive and social learning factors ( c 1 and c 2 ) of 1.9. Then, a detailed comparative analysis of the simulation results by applying the CABC, ABC, and PSO algorithms under two different shading conditions is given in Section 4.1 and Section 4.2.

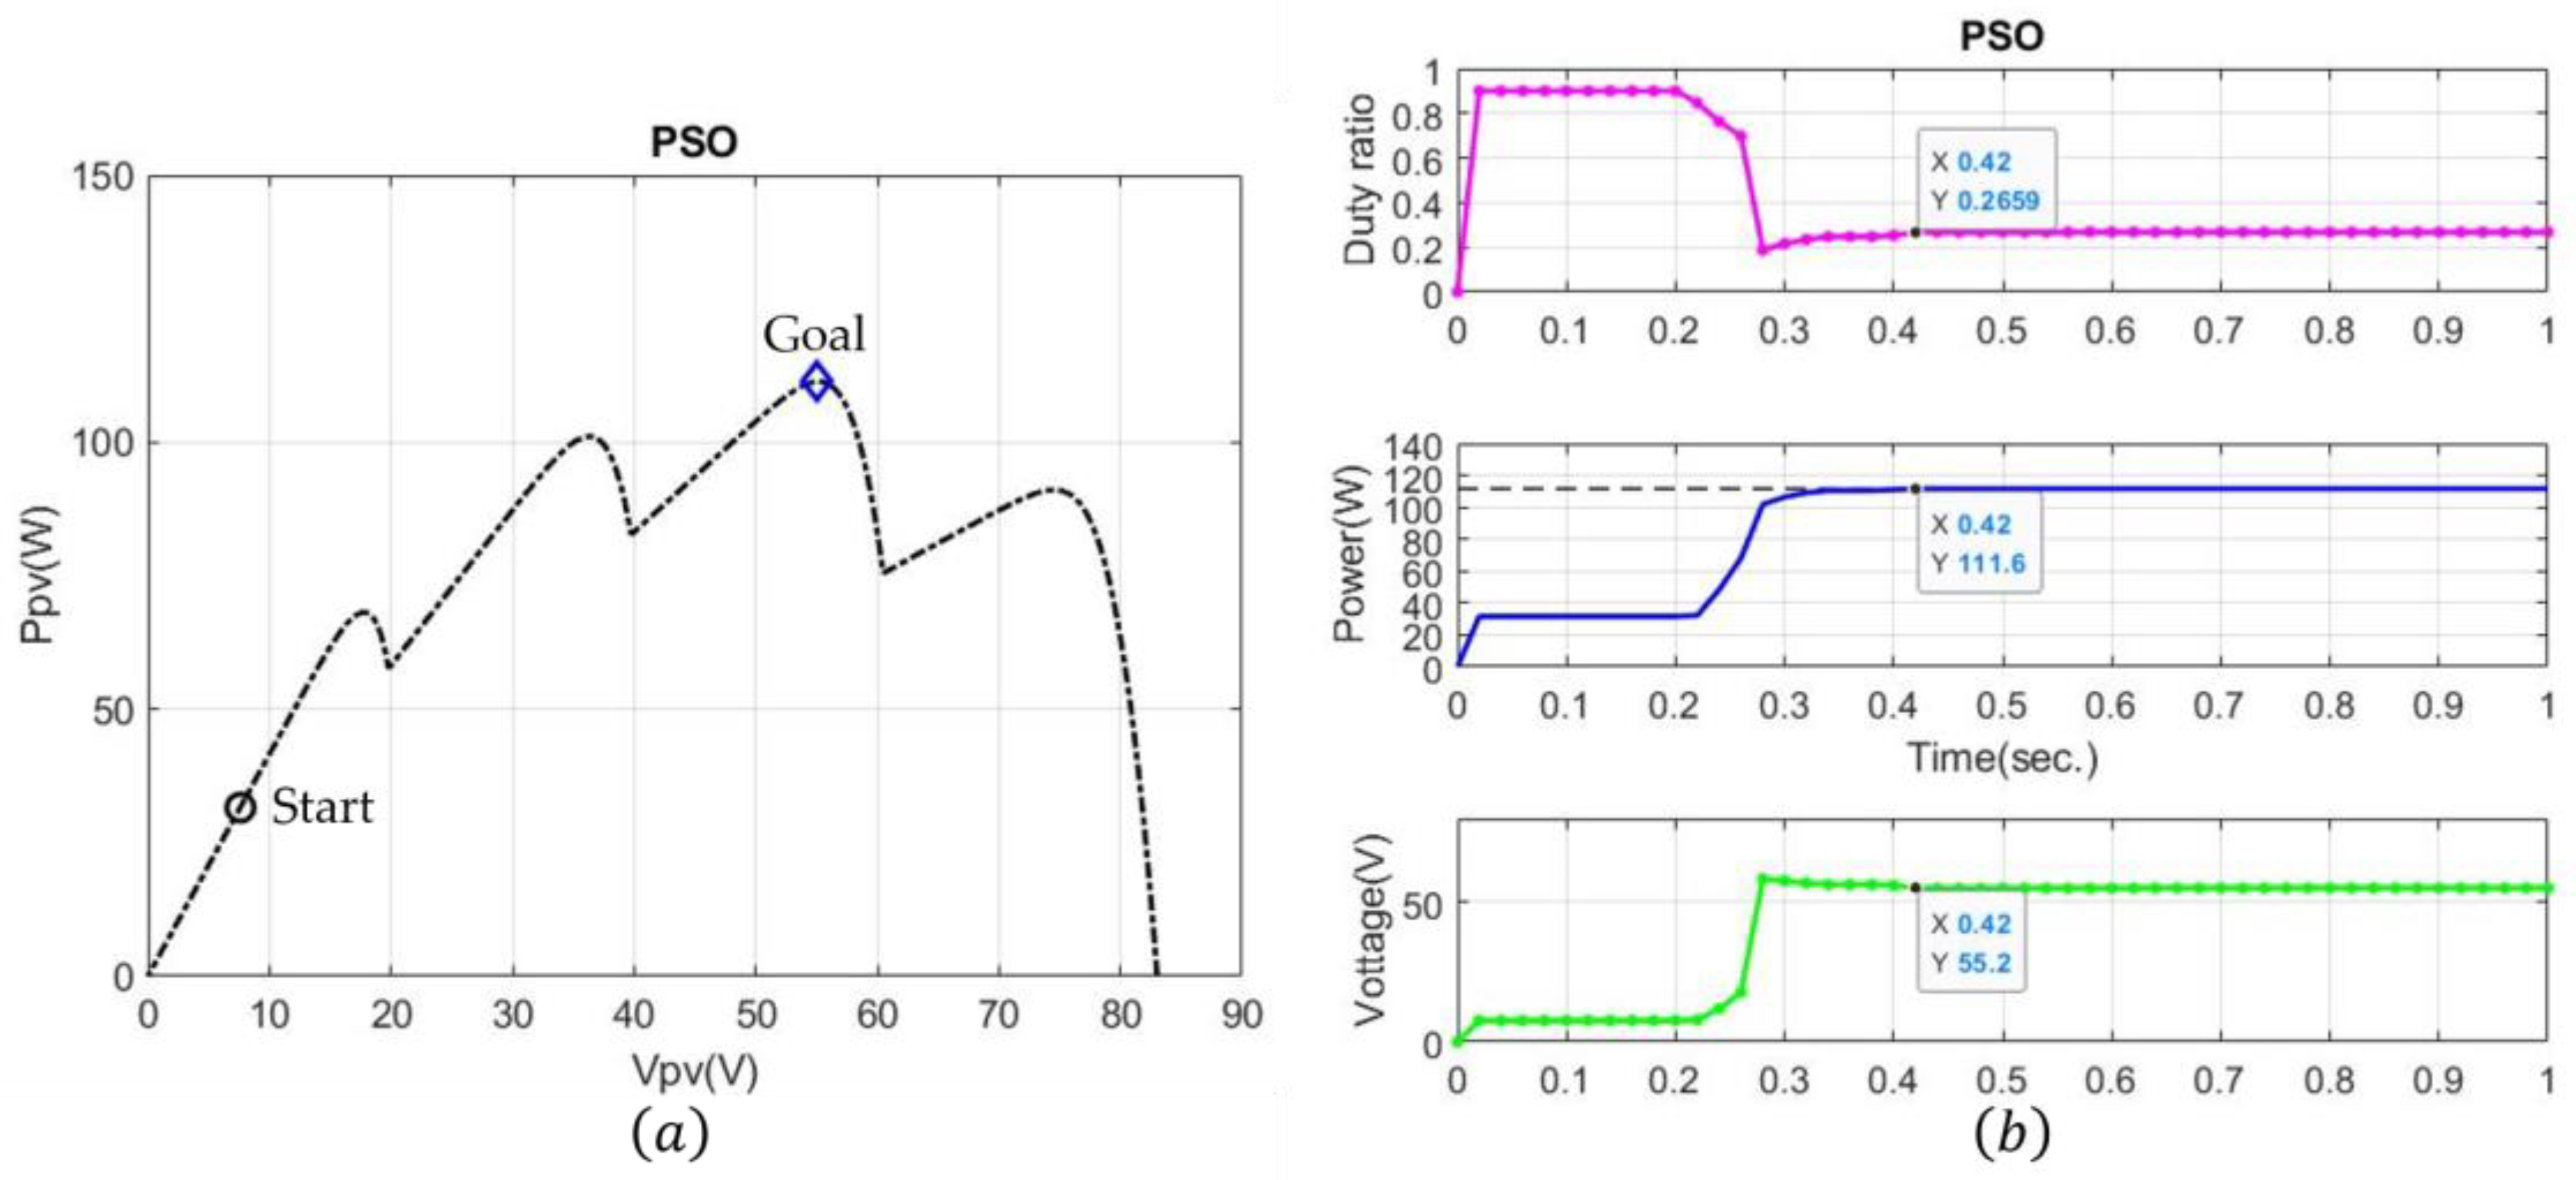
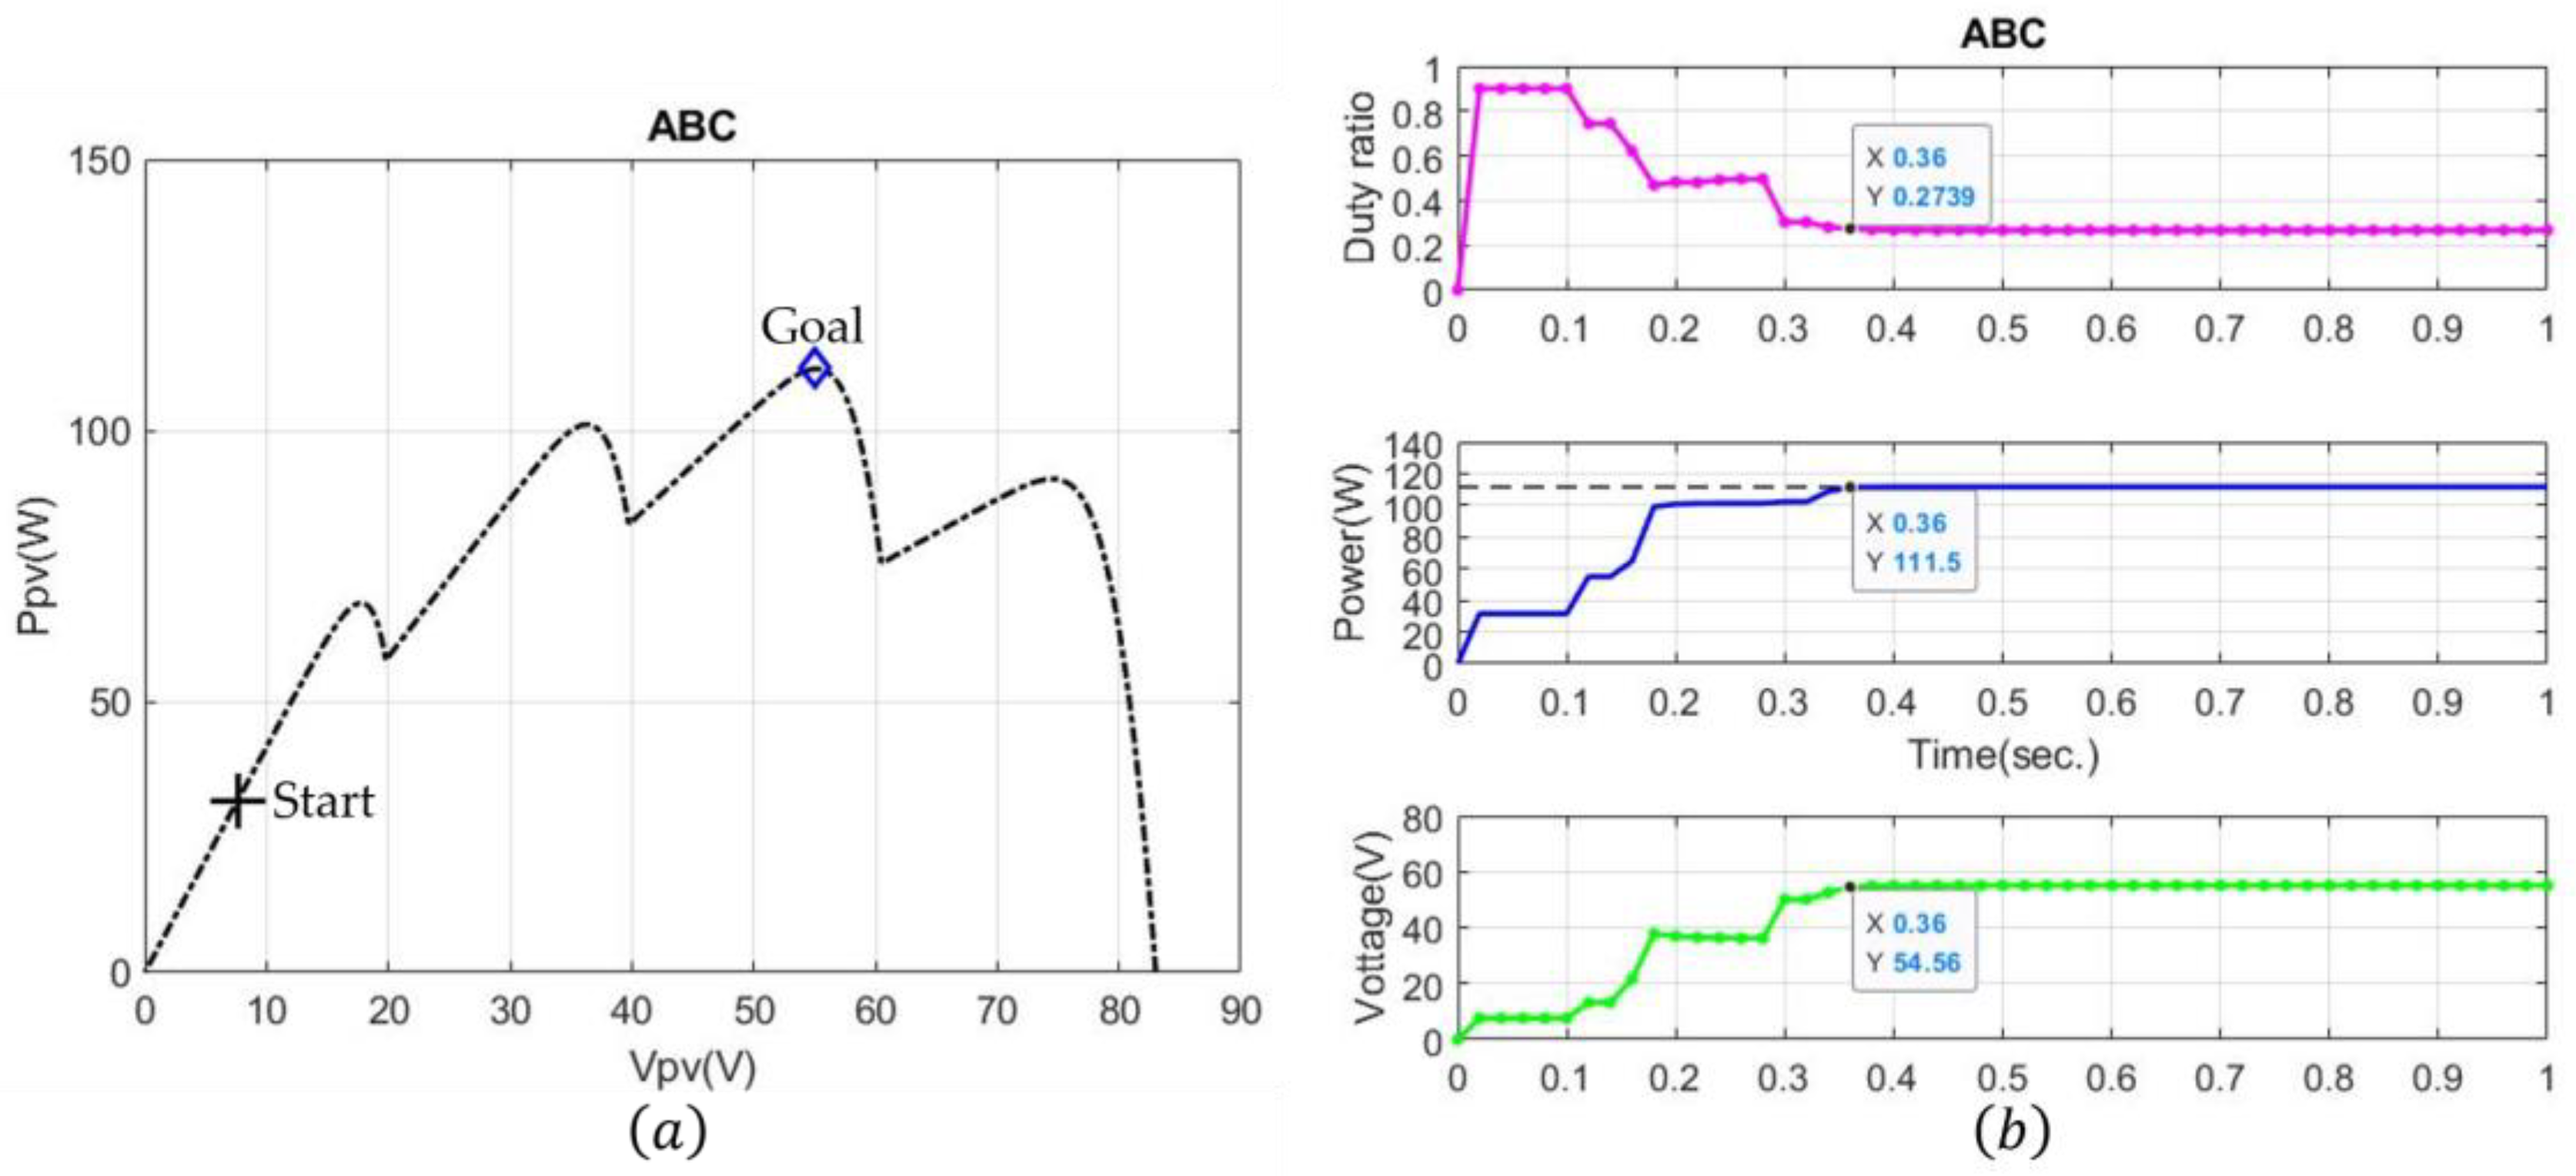
4.1. Case 1: Four-Peak Performance Under Partial Shading

This subsection evaluates the performance of the PSO, ABC, and CABC algorithms under the environmental situation resulting in the P-V and I-V characteristics of the PV power system depicted in Figure 3. These algorithms control the output power of the PV module by adjusting the duty cycle of a DC-DC boost converter. The simulation results are illustrated in Figure 8, Figure 9 and Figure 10. The GMPP of the PV power system was achieved by these three algorithms. In addition, the proposed CABC algorithm for the MPPT yields a faster response than the other two algorithms.

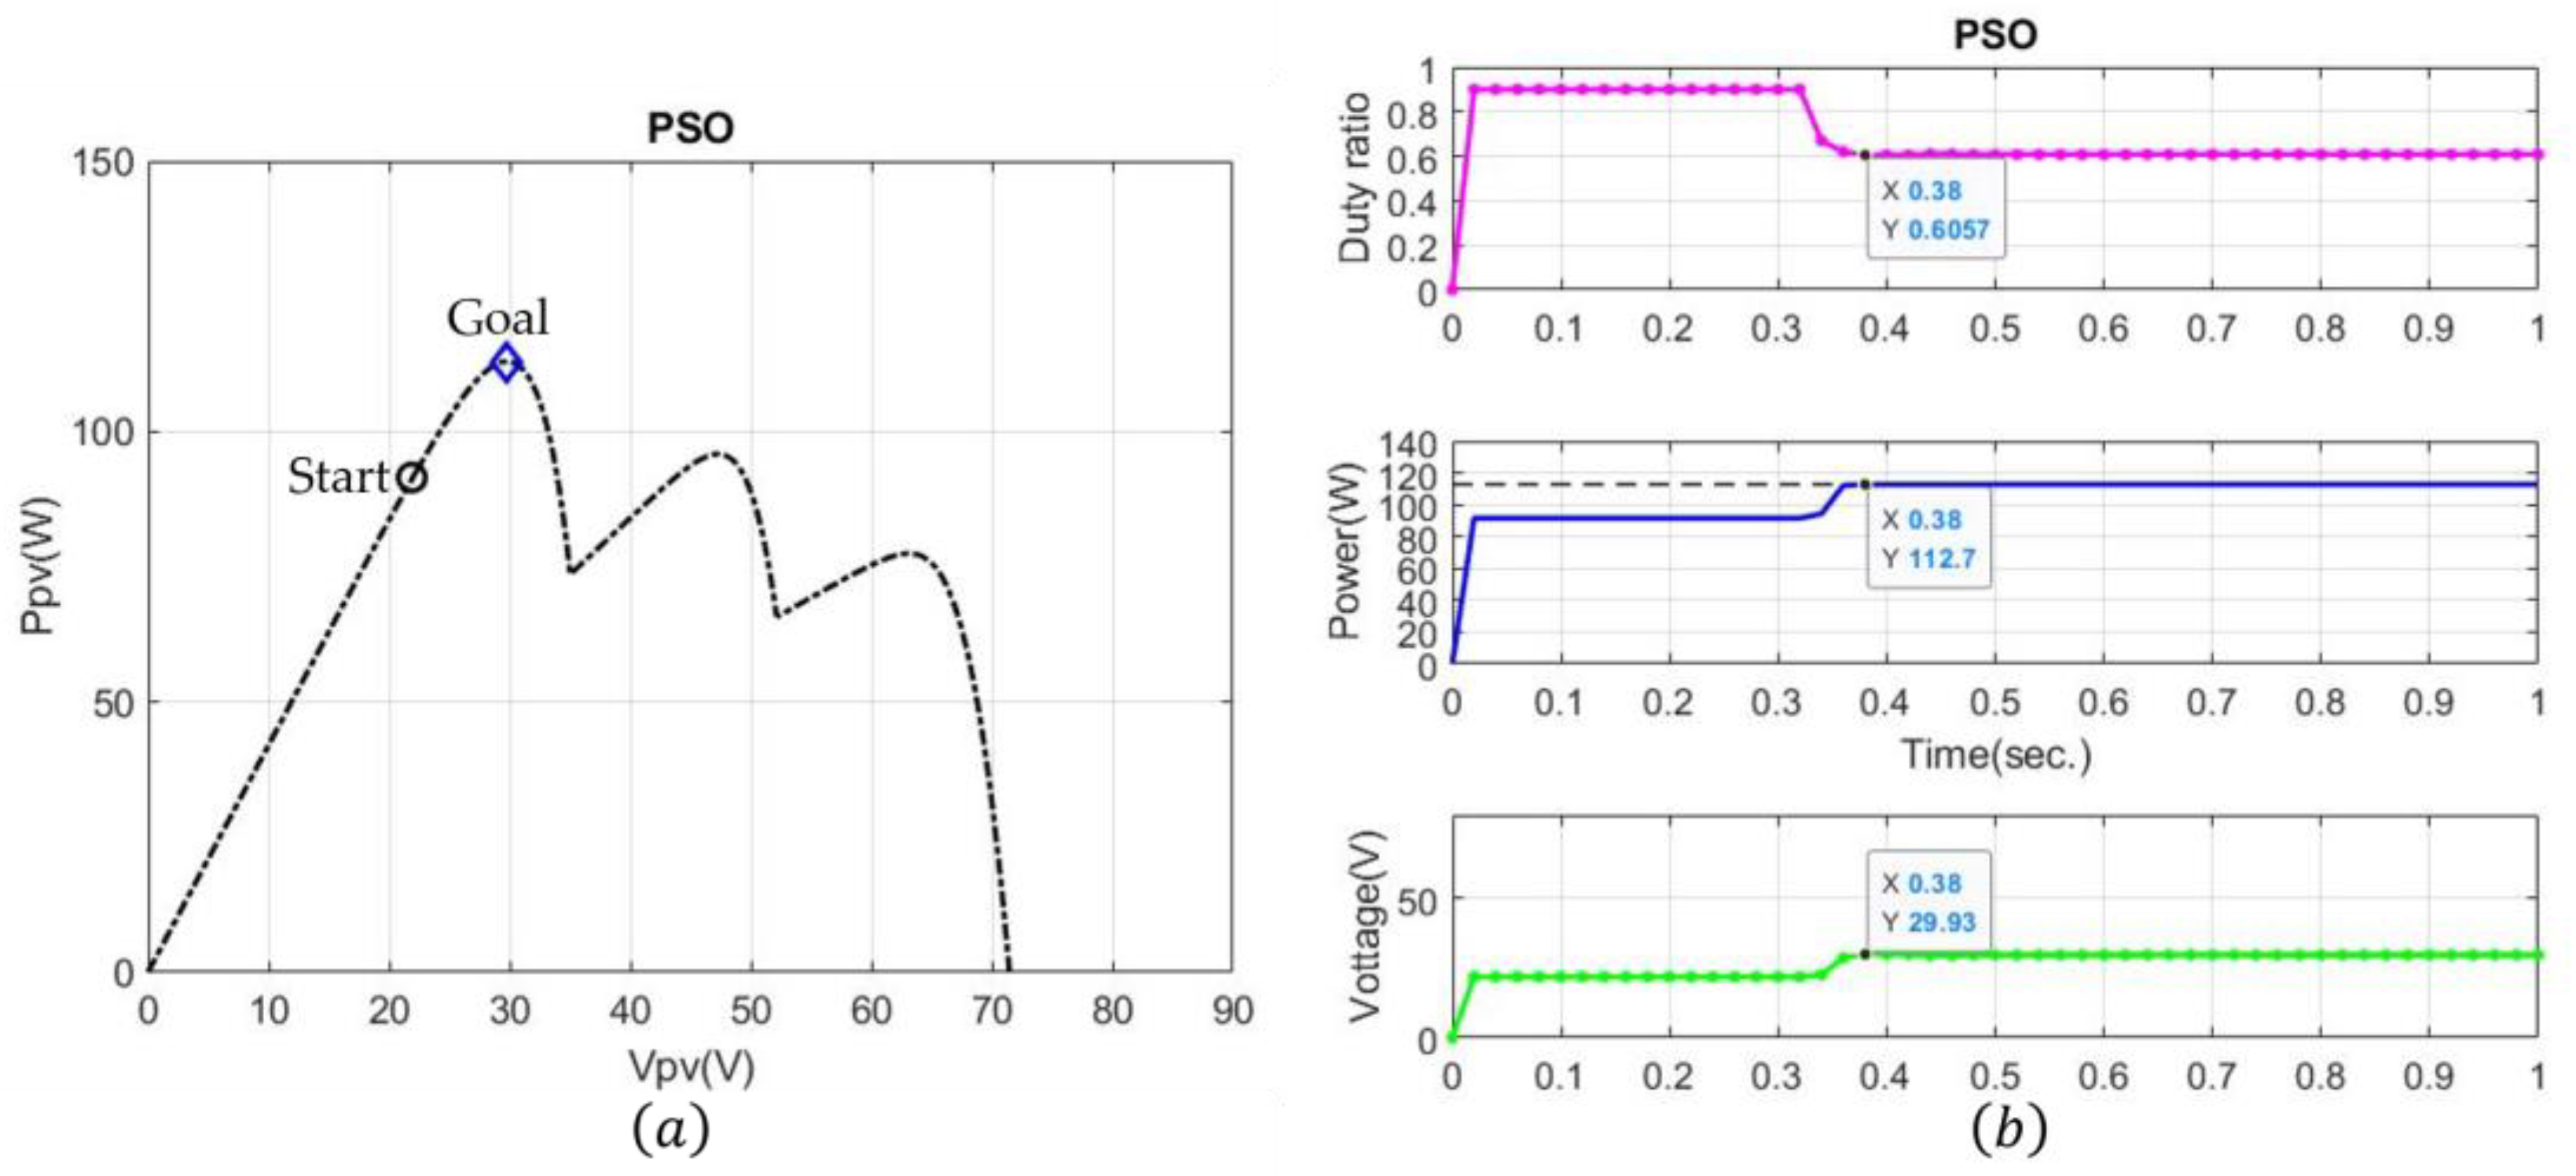
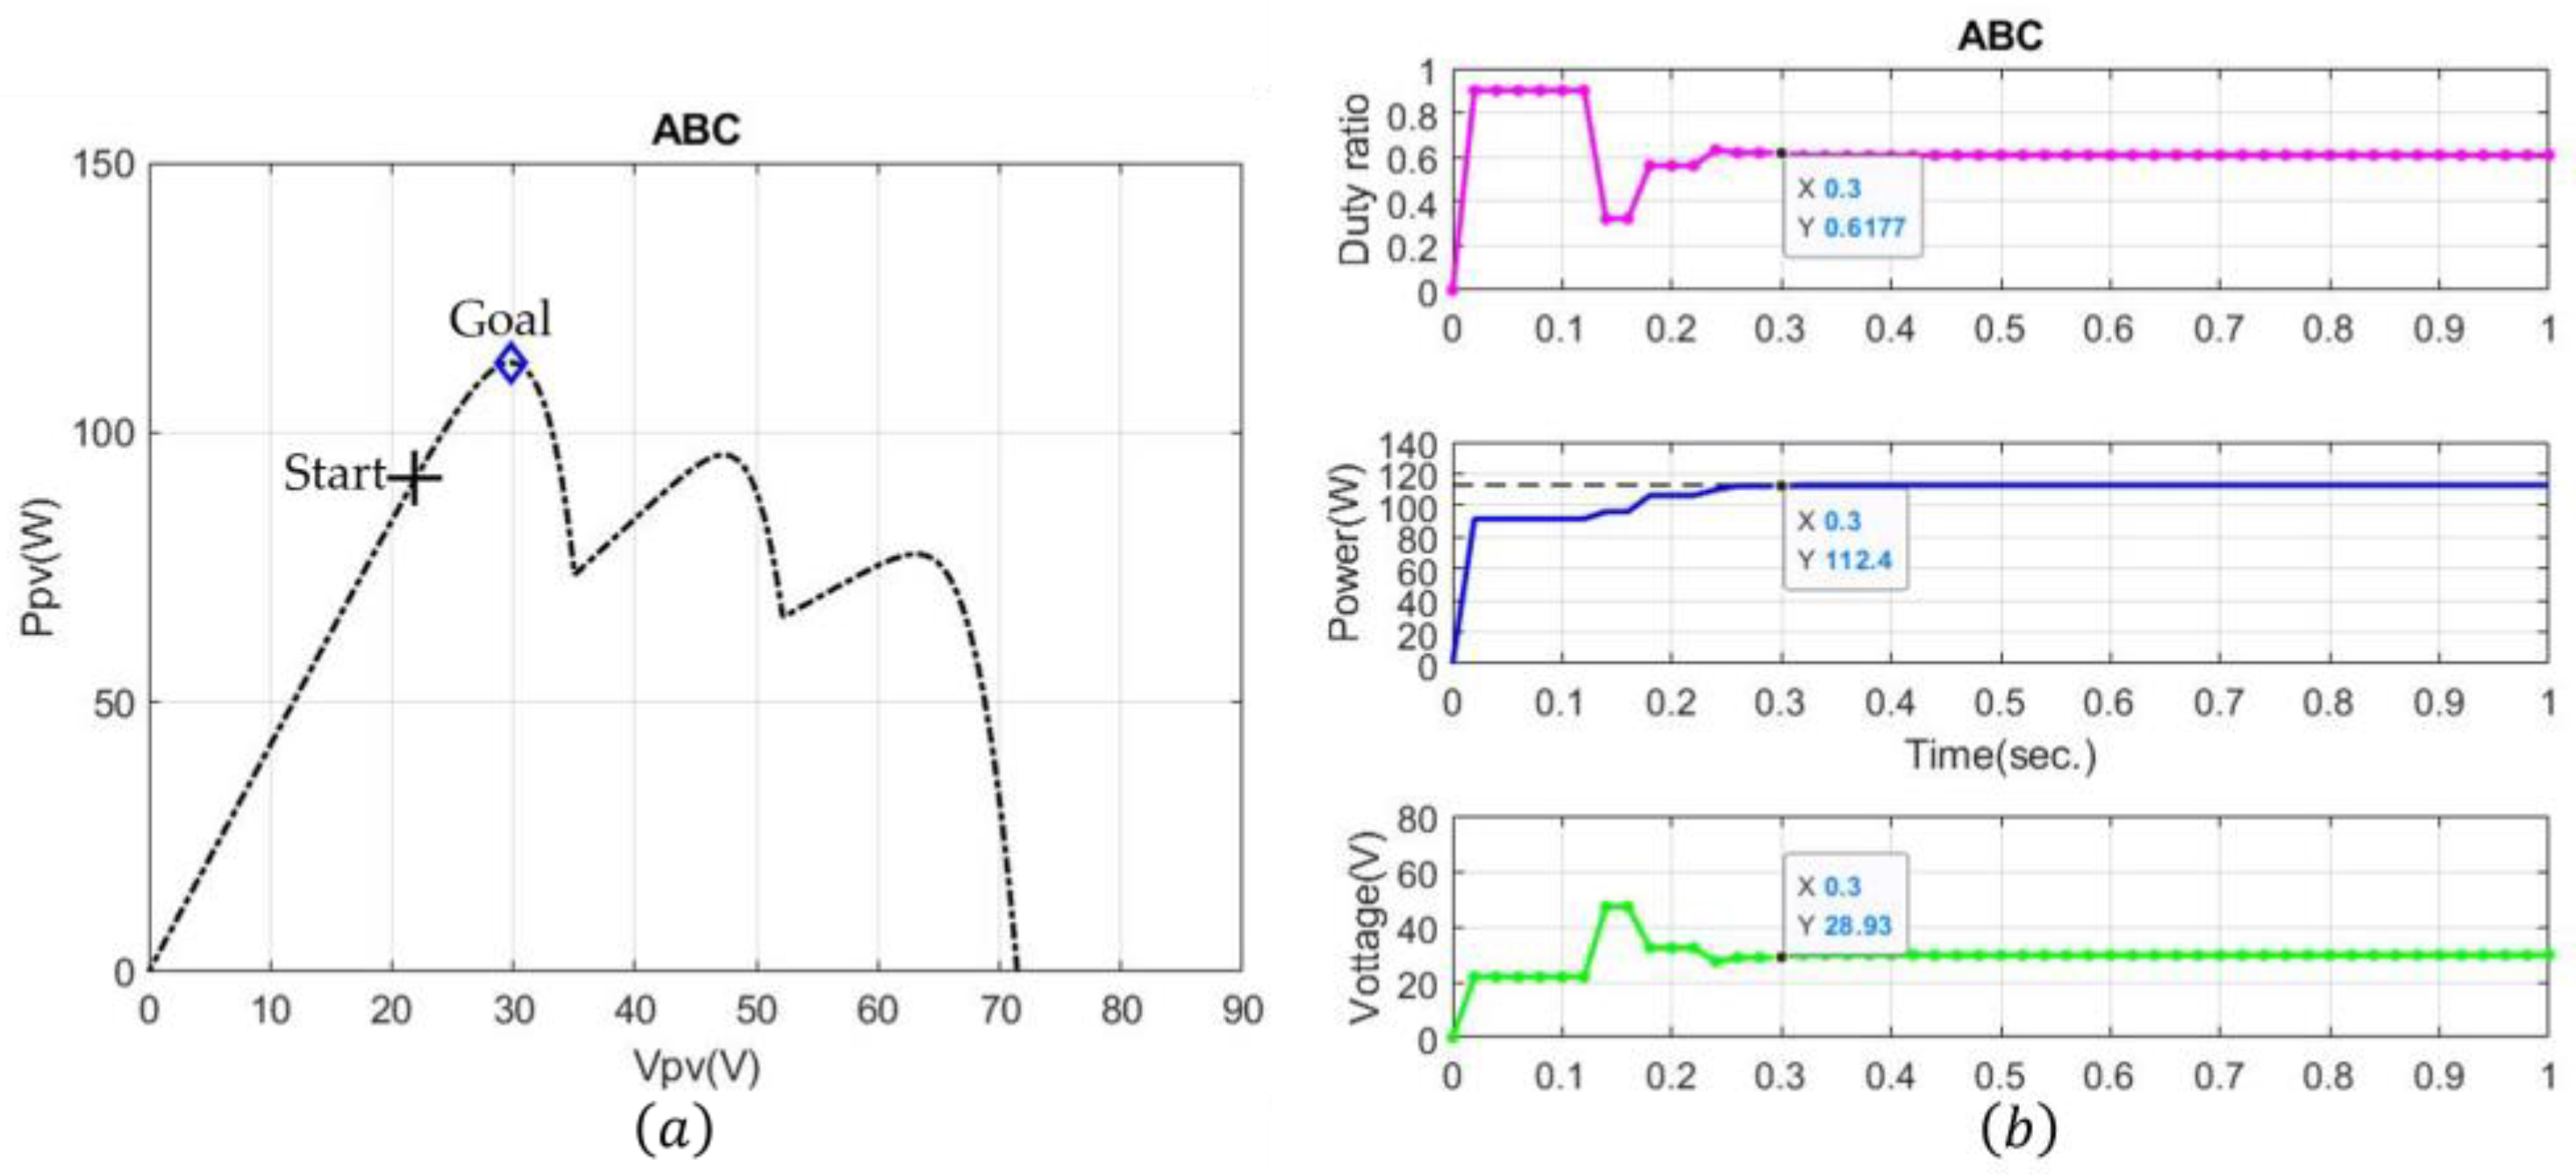
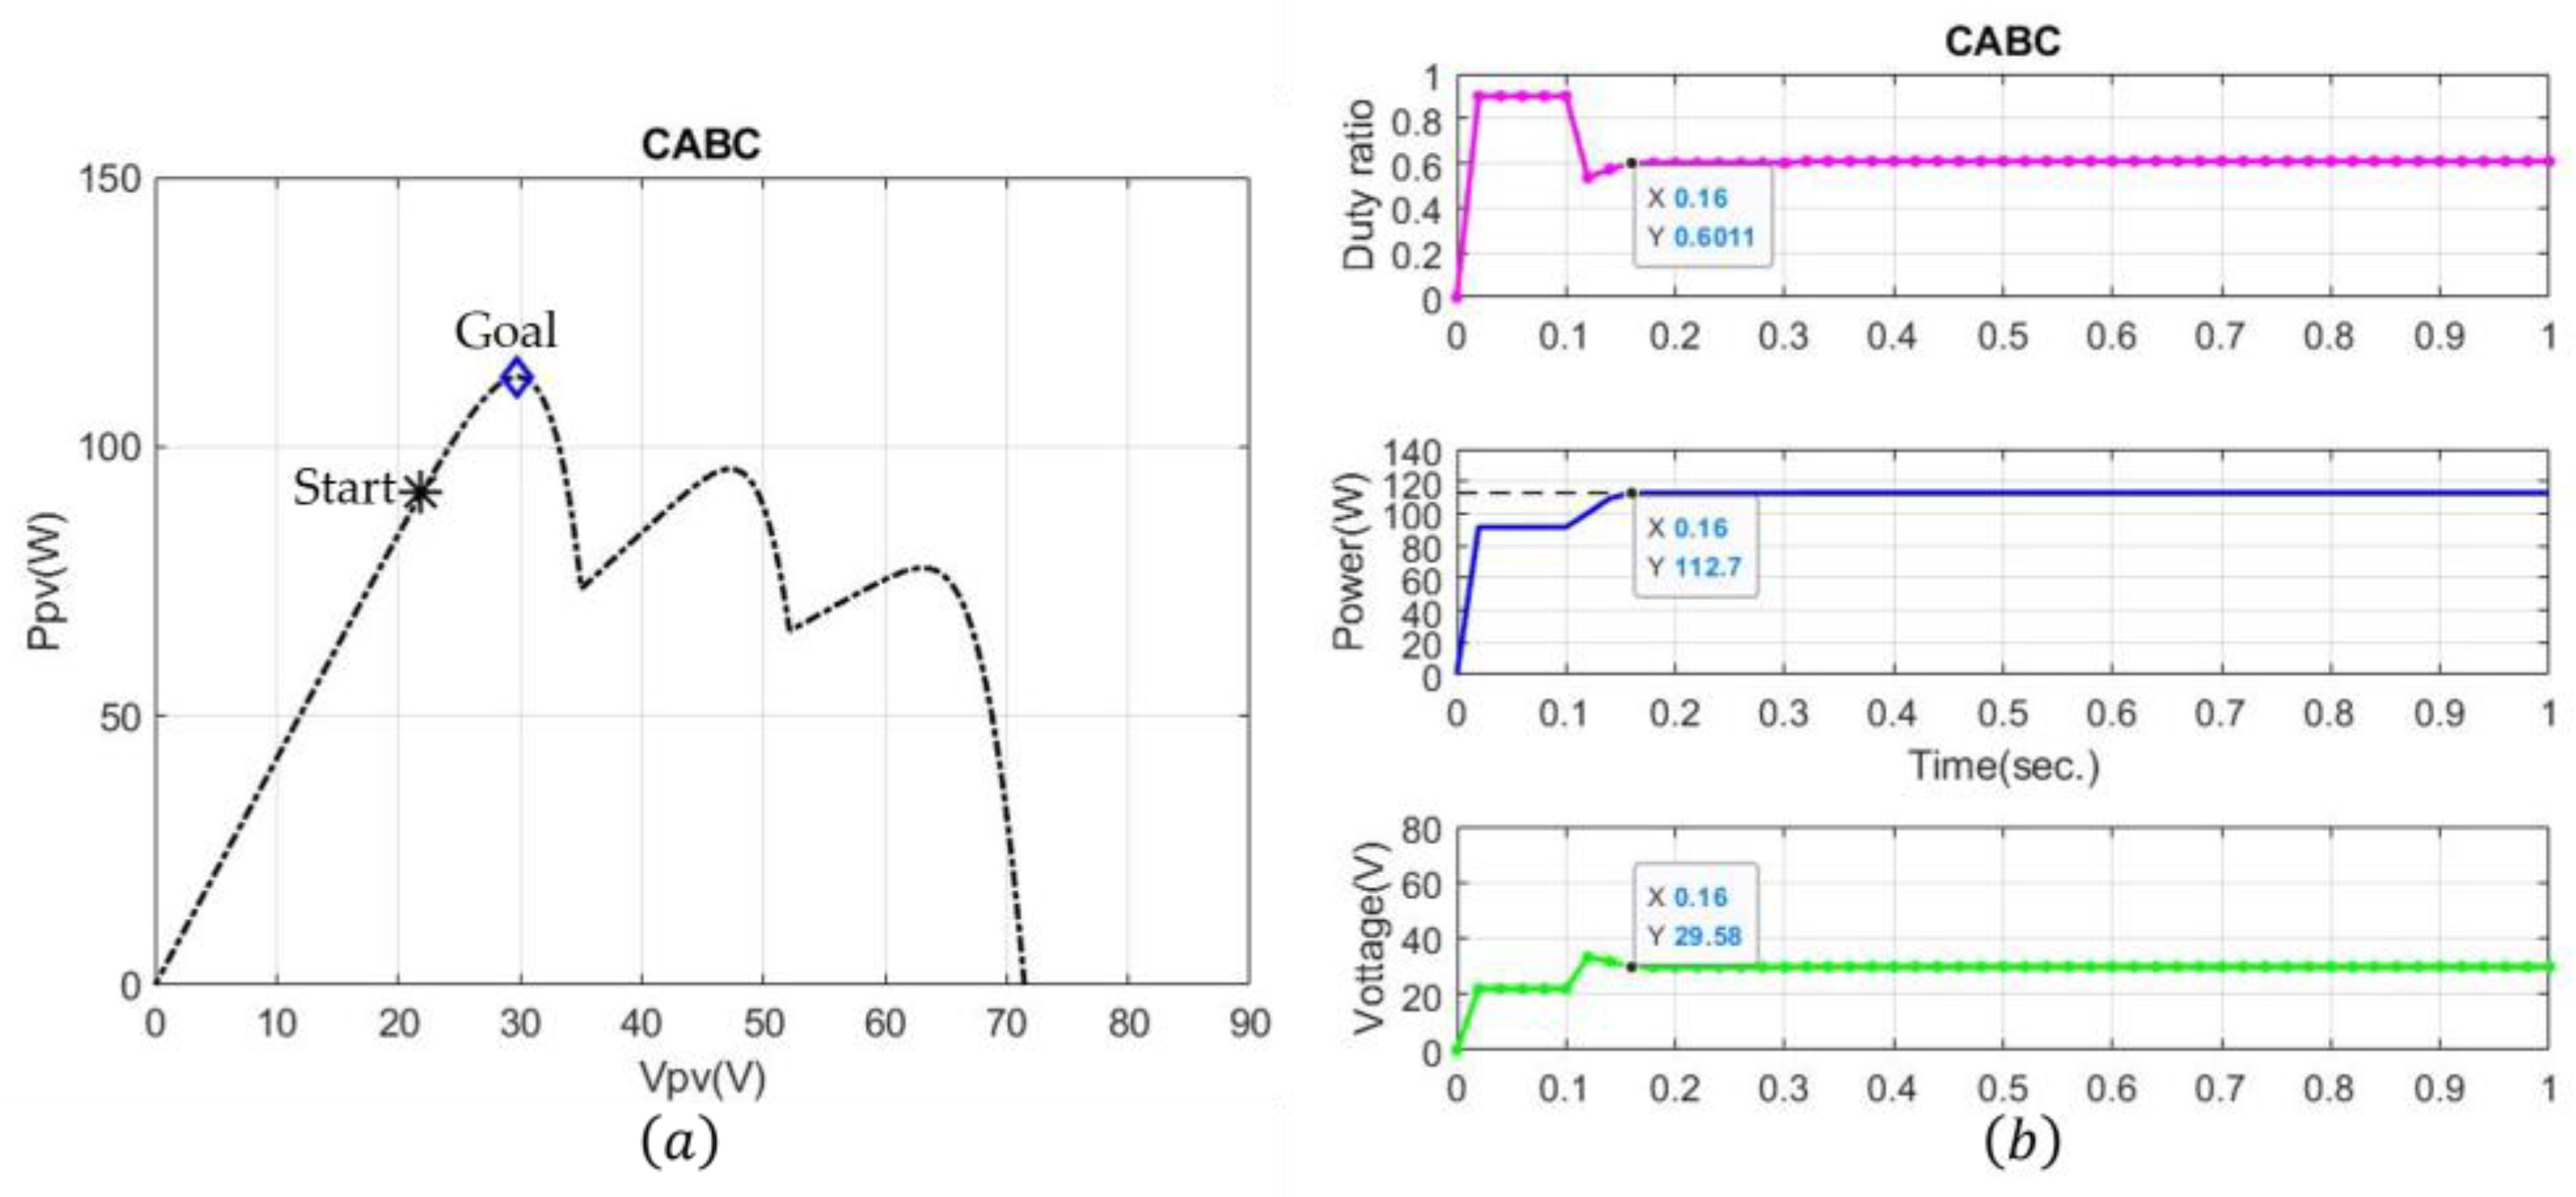
4.2. Case 2: Three-Peak Performance Under Partial Shading

This subsection evaluates the performance of the PSO, ABC, and CABC algorithms under the environmental situation resulting in the P-V and I-V characteristics depicted in Figure 4. In this case, there are three power peaks in the P-V characteristic curve, where the GMPP does not locate to the right-hand side of the power curve, i.e., the traditional MPPT method fails at the local maximum power point. The simulation results after applying the three algorithms to control the output power of the PV module are presented in Figure 11, Figure 12 and Figure 13. The GMPP of the system was achieved by these three algorithms. Obviously, the proposed CABC algorithm for MPPT yields a faster response than the other two algorithms.
The simulation results validate the effectiveness of the CABC algorithm in addressing partial shading challenges for the photovoltaic power system. From the simulations under various irradiance conditions such as four-peak and three-peak GMPP scenarios, the CABC algorithm’s ability to accurately identify the GMPP is highlighted. In other words, the CABC algorithm can consistently locate the GMPP even for various varying partial shading patterns, i.e., its robustness is demonstrated. Its inherent global search capability prevents convergence to local optima and ensures its stable convergence behavior. Moreover, Table 2 presents the time required to search the maximum power point using the PSO, ABC, and CABC algorithms. Here, the CABC algorithm results in a faster response for the MPPT. As a result, the CABC algorithm exhibits superior performance compared to the standard ABC and PSO algorithms, demonstrating improvements in tracking accuracy, adaptability, and convergence speed. This improvement is attributed to the integration of chaotic systems, which emulates the inherent randomness observed in natural phenomena.
Remark 4.
Regarding the issue of computational load, a comparison of the proposed CABC, PSO, and ABC algorithms is made in this regard. Standard PSO typically requires tuning three parameters: inertia weight, cognitive coefficient, and social coefficient. The ABC algorithm often involves adjusting colony size, maximum iteration number, and the limit parameter. Since the CABC only introduces one additional parameter, β (folded chaotic map), the CABC algorithm has a slightly higher parameter count than the ABC and PSO methods. In other words, the overall increase in computational complexity is negligible. This small computational load is significantly outweighed by the performance enhancements of CABC, particularly in convergence speed, steady-state accuracy, and global optimization for MPPT under partial shading. Therefore, the CABC offers a marked improvement in MPPT performance with a computationally efficient design.

5. Conclusions

This paper proposes a novel MPPT method designed to address the limitations of the standard artificial bee colony algorithm in handling the multi-peak power–voltage characteristics of partially shaded PV systems. By replacing the random function in the chaotic dynamic mapping with a white noise-like role in the nectar exploration of employed bees, the proposed CABC algorithm is easy to implement, even adding chaotic mapping. Moreover, the results indicate significant improvements in MPPT accuracy, adaptability to varying shading conditions, and convergence speed. In other words, this work presents a more efficient and reliable solution for maximizing energy harvesting from PV systems under complex partial shading conditions. In addition, through simulations of two distinct partial shading scenarios, the chaotic ABC algorithm exhibits superior performance compared to the PSO and standard ABC algorithms. Therefore, the efficiency of the PV power conversion is improved subject to partial shading conditions in this study.

Author Contributions

Software, writing, original draft preparation, Y.-T.C.; writing—review and editing, C.-S.C. All authors have read and agreed to the published version of the manuscript.

Funding

This work was supported by the National Science and Technology Council, R.O.C. the project number is NSTC 113-2221-E-033-033.

Data Availability Statement

The raw data supporting the conclusions of this article will be made available by the authors on request.

Conflicts of Interest

The authors declare no conflicts of interest.

References

  1. Katche, M.L.; Makokha, A.B.; Zachary, S.O.; Adaramola, M.S. A Comprehensive Review of Maximum Power Point Tracking (MPPT) Techniques Used in Solar PV Systems. Energies 2023, 16, 2206. [Google Scholar] [CrossRef]
  2. Manna, S.; Singh, D.K.; Akella, A.K.; Kotb, H.; AboRas, K.M.; Zawbaa, H.M.; Kamel, S. Design and implementation of a new adaptive MPPT controller for solar PV systems. Energy Rep. 2023, 9, 1818–1829. [Google Scholar]
  3. Kiran, S.R.; Basha, C.H.H.; Singh, V.P.; Dhanamjayulu, C.; Prusty, B.R.; Khan, B. Reduced Simulative Performance Analysis of Variable Step Size ANN Based MPPT Techniques for Partially Shaded Solar PV Systems. IEEE Access 2022, 10, 48875–48889. [Google Scholar]
  4. Kishore, D.K.; Mohamed, M.R.; Sudhakar, K.; Peddakapu, K. Swarm intelligence-based MPPT design for PV systems under diverse partial shading conditions. Energy 2023, 265, 126366. [Google Scholar]
  5. Refaat, A.; Ali, Q.A.; Elsakka, M.M.; Elhenawy, Y.; Majozi, T.; Korovkin, N.V.; Elfar, M.H. Extraction of maximum power from PV system based on horse herd optimization MPPT technique under various weather conditions. Renew. Energy 2024, 220, 119718. [Google Scholar]
  6. Hussain, M.T.; Sarwar, A.; Tariq, M.; Urooj, S.; BaQais, A.; Hossain, M.A. An Evaluation of ANN Algorithm Performance for MPPT Energy Harvesting in Solar PV Systems. Sustainability 2023, 15, 11144. [Google Scholar] [CrossRef]
  7. Sarwar, S.; Javed, M.Y.; Jaffery, M.H.; Arshad, J.; Ur Rehman, A.; Shafiq, M.; Choi, J.-G. A Novel Hybrid MPPT Technique to Maximize Power Harvesting from PV System under Partial and Complex Partial Shading. Appl. Sci. 2022, 12, 587. [Google Scholar] [CrossRef]
  8. Abo-Khalil, A.G.; El-Sharkawy, I.I.; Radwan, A.; Memon, S. Influence of a Hybrid MPPT Technique, SA-P&O, on PV System Performance under Partial Shading Conditions. Energies 2023, 16, 577. [Google Scholar] [CrossRef]
  9. Jabbar, R.I.; Mekhilef, S.; Mubin, M.; Mohammed, K.K. A modified perturb and observe MPPT for a fast and accurate tracking of MPP under varying weather conditions. IEEE Access 2023, 11, 76166–76176. [Google Scholar] [CrossRef]
  10. Harrison, A.; Alombah, N.H.; de Dieu Nguimfack Ndongmo, J. A New Hybrid MPPT Based on Incremental Conductance-Integral Backstepping Controller Applied to a PV System under Fast-Changing Operating Conditions. Int. J. Photoenergy 2023, 2023, 9931481. [Google Scholar]
  11. Stephen, A.A.; Musasa, K.; Davidson, I.E. Modelling of Solar PV under Varying Condition with an Improved Incremental Conductance and Integral Regulator. Energies 2022, 15, 2405. [Google Scholar] [CrossRef]
  12. Ahmed, E.M.; Norouzi, H.; Alkhalaf, S.; Ali, Z.M.; Dadfar, S.; Furukawa, N. Enhancement of MPPT controller in PV-BES system using incremental conductance along with hybrid crow-pattern search approach based ANFIS under different environmental conditions. Sustain. Energy Technol. Assess. 2022, 50, 101812. [Google Scholar] [CrossRef]
  13. Awad, M.; Ibrahim, A.M.; Alaas, Z.M.; El-Shahat, A.; Omar, A.I. Design and analysis of an efficient photovoltaic energy-powered electric vehicle charging station using perturb and observe MPPT algorithm. Front. Energy Res. 2022, 10, 969482. [Google Scholar] [CrossRef]
  14. Ouissaaden, F.I.; Dlimi, S.; Kamel, H.; El Khaldi, S.; Elmourabit, F.; Khoukh, A. Effect of Partial Shading on a PV System. In Proceedings of the 2024 International Conference on Circuit, Systems and Communication (ICCSC), Fes, Morocco, 28–29 June 2024; pp. 1–6. [Google Scholar]
  15. Xu, H.; Zhao, M.; Xue, F.; Zhang, X.; Sun, L. An Improved Mayfly Algorithm With Shading Detection for MPPT of Photovoltaic Systems. IEEE Access 2023, 11, 110827–110836. [Google Scholar] [CrossRef]
  16. Alshareef, M.J. An Effective Falcon Optimization Algorithm Based MPPT Under Partial Shaded Photovoltaic Systems. IEEE Access 2022, 10, 131345–131360. [Google Scholar] [CrossRef]
  17. Balaji, V.; Fathima, A.P. Hybrid algorithm for MPPT tracking using a single current sensor for partially shaded PV systems. Sustain. Energy Technol. Assess. 2022, 53, 102415. [Google Scholar] [CrossRef]
  18. Sharma, A.K.; Pachauri, R.K.; Choudhury, S.; Minai, A.F.; Alotaibi, M.A.; Malik, H.; Márquez, F.P.G. Role of Metaheuristic Approaches for Implementation of Integrated MPPT-PV Systems: A Comprehensive Study. Mathematics 2023, 11, 269. [Google Scholar] [CrossRef]
  19. Moghassemi, A.; Ebrahimi, S.; Padmanaban, S.; Mitolo, M.; Holm-Nielsen, J.B. Two fast metaheuristic-based MPPT techniques for partially shaded photovoltaic system. Int. J. Electr. Power Energy Syst. 2022, 137, 107567. [Google Scholar] [CrossRef]
  20. Hassan, A.; Bass, O.; Masoum, M.A. An improved genetic algorithm based fractional open circuit voltage MPPT for solar PV systems. Energy Rep. 2023, 9, 1535–1548. [Google Scholar] [CrossRef]
  21. Dagal, I.; Akın, B.; Akboy, E. MPPT mechanism based on novel hybrid particle swarm optimization and salp swarm optimization algorithm for battery charging through simulink. Sci. Rep. 2022, 12, 2664. [Google Scholar] [CrossRef]
  22. Refaat, A.; Khalifa, A.E.; Elsakka, M.M.; Elhenawy, Y.; Kalas, A.; Elfar, M.H. A novel metaheuristic MPPT technique based on enhanced autonomous group Particle Swarm Optimization Algorithm to track the GMPP under partial shading conditions-Experimental validation. Energy Convers. Manag. 2023, 287, 117124. [Google Scholar]
  23. Brahmi, M.; Regaya, C.B.; Hamdi, H.; Zaafouri, A. Comparative Study of P&O and PSO Particle Swarm Optimization MPPT Controllers for Photovoltaic Systems. In Proceedings of the 2022 8th International Conference on Control, Decision and Information Technologies (CoDIT), Istanbul, Turkey, 17–20 May 2022; pp. 1608–1613. [Google Scholar]
  24. Koh, J.S.; Tan, R.H.; Lim, W.H.; Tan, N.M. A Modified Particle Swarm Optimization for Efficient Maximum Power Point Tracking Under Partial Shading Condition. IEEE Trans. Sustain. Energy 2023, 14, 1822–1834. [Google Scholar]
  25. Chao, K.-H.; Li, J.-Y. Global Maximum Power Point Tracking of Photovoltaic Module Arrays Based on Improved Artificial Bee Colony Algorithm. Electronics 2022, 11, 1572. [Google Scholar] [CrossRef]
  26. Mensah, A.A.; Chen, H.; Otuo-Acheampong, D.; Mbuzi, T. Solar Power Generation System Based on Signal Search Artificial Bee Colony Optimization Algorithm for Maximum Power Point Tracking. In Proceedings of the 2022 12th International Conference on Power and Energy Systems (ICPES), Guangzhou, China, 23–25 December 2022; pp. 912–916. [Google Scholar]
  27. Pushpalatha, N.; Palpandian, P.; Banu, G.; Thirunavukkarasu, S.; Kokilavani, T.; Devi, B.P. AI Based Tagging the Optimal Power Point of a Solar Photovoltaic Using Artificial Bee Colony (ABC) Optimization Algorithm. In Proceedings of the 2023 10th IEEE Uttar Pradesh Section International Conference on Electrical, Electronics and Computer Engineering (UPCON), Gautam Buddha Nagar, India, 1–3 December 2023; pp. 1428–1432. [Google Scholar]
  28. Qi, P.; Xia, H.; Cai, X.; Yu, M.; Jiang, N.; Dai, Y. Novel Global MPPT Technique Based on Hybrid Cuckoo Search and Artificial Bee Colony under Partial-Shading Conditions. Electronics 2024, 13, 1337. [Google Scholar] [CrossRef]
  29. Mendez-Flores, E.; Ortiz, A.; Macias, I.; Molina, A. Experimental Validation of an Enhanced MPPT Algorithm and an Optimal DC–DC Converter Design Powered by Metaheuristic Optimization for PV Systems. Energies 2022, 15, 8043. [Google Scholar] [CrossRef]
  30. Watanabe, R.B.; Ando Junior, O.H.; Leandro, P.G.M.; Salvadori, F.; Beck, M.F.; Pereira, K.; Brandt, M.H.M.; de Oliveira, F.M. Implementation of the Bio-Inspired Metaheuristic Firefly Algorithm (FA) Applied to Maximum Power Point Tracking of Photovoltaic Systems. Energies 2022, 15, 5338. [Google Scholar] [CrossRef]
  31. Gupta, J.; Beryozkina, S.; Aljaidi, M.; Singla, M.K.; Safaraliev, M.; Gupta, A.; Nijhawan, P. Application of hybrid chaotic particle swarm optimization and slime mould algorithm to optimally estimate the parameter of fuel cell and solar PV system. Int. J. Hydrogen Energy 2024, 83, 1003–1023. [Google Scholar]
  32. Pandikumar, M.; Jenisha, K.J.; Baskar, M.; Swathi, M.; Rayaguru, N.K.; Baskaran, S. Optimized Power Quality Enhancement in PV-Integrated UPQC Systems Using Chaotic PSO-Based MPPT Algorithm. In Proceedings of the 2024 International Conference on Advancement in Renewable Energy and Intelligent Systems (AREIS), Thrissur, India, 5–6 December 2024; pp. 1–6. [Google Scholar]
  33. Fu, D.; Tang, L.; Ran, W.; Shi, Q.; Fu, M.; You, D. Application of Chaotic Particle Swarm Optimization to Maximum Power Point Tracking of Photovoltaic Arrays under Partial Shading Conditions. In Proceedings of the 2023 3rd International Conference on Energy Engineering and Power Systems (EEPS), Dali, China, 28–30 July 2023; pp. 430–438. [Google Scholar]
Figure 1. An example of PV characteristics of (a) P-V curve and (b) I-V curve.
Energies 18 01710 g001
Figure 2. PV modules under conditions with (a) four shading levels and (b) three shading levels.
Energies 18 01710 g002
Figure 3. The four-peak characteristics under a shading condition at 25 °C: (a) P-V curve; (b) I-V curve.
Energies 18 01710 g003
Figure 4. The three-peak characteristics under a shading condition at 45 °C: (a) P-V curve; (b) I-V curve.
Energies 18 01710 g004
Figure 5. A PV power conversion system with a boost DC-DC converter.
Energies 18 01710 g005
Figure 6. Folding cubic map.
Energies 18 01710 g006
Figure 7. Flowchart of the proposed CABC MPPT method.
Energies 18 01710 g007
Figure 8. PSO MPPT under 4-peak case: (a) start and end point; (b) tracking response (dash line is the maximum power value).
Energies 18 01710 g008
Figure 9. ABC MPPT under 4-peak case: (a) start and end point; (b) tracking response (dash line is the maximum power value).
Energies 18 01710 g009
Figure 10. CABC MPPT under 4-peak case: (a) start and end point; (b) tracking response (dash line is the maximum power value).
Energies 18 01710 g010
Figure 11. PSO MPPT under 3-peak case: (a) start and end point; (b) tracking response (dash line is the maximum power value).
Energies 18 01710 g011
Figure 12. ABC MPPT under 3-peak case: (a) start and end point; (b) tracking response (dash line is the maximum power value).
Energies 18 01710 g012
Figure 13. CABC MPPT under 3-peak case: (a) start and end point; (b) tracking response (dash line is the maximum power value).
Energies 18 01710 g013
Table 1. Electrical characteristics of a single PV module.
DescriptionValue
Maximum output power 70   W ± 10 %
Maximum operating current 3.89   A
Maximum operating voltage 18   V
Short   circuit   current   ( I s c ) 4.16   A
Open   circuit   voltage   ( V O C ) 21.6   V
PV   cell   in   series   ( N s ) 36   pcs
PV   cell   in   parallel   ( N p ) 1   pcs
P-N junction parameter (n) 1.62   V
Table 2. Comparison of three algorithms in two different cases.
EnvironmentAlgorithmTime to MPP (s)
Case1PSO0.42
ABC0.36
CABC0.24
Case2PSO0.38
ABC0.3
CABC0.16
Disclaimer/Publisher’s Note: The statements, opinions and data contained in all publications are solely those of the individual author(s) and contributor(s) and not of MDPI and/or the editor(s). MDPI and/or the editor(s) disclaim responsibility for any injury to people or property resulting from any ideas, methods, instructions or products referred to in the content.

