Article

Optical Detection and Cluster Analysis of Metal-Particle-Triggered Alternating Current Optical Partial Discharge in SF6

1
School of Electrical Engineering, Tsinghua University, Beijing 100084, China
2
China Electric Power Research Institute, Beijing 100192, China
*
Author to whom correspondence should be addressed.
Energies 2025, 18(7), 1649; https://doi.org/10.3390/en18071649
Submission received: 13 February 2025 / Revised: 27 February 2025 / Accepted: 11 March 2025 / Published: 26 March 2025

Abstract

:
Accurately detecting defect-induced photon emissions enables early defect detection and characterization. To address this, a defect evolution state recognition model based on phase-resolved photon counting and dimensionality reduction calculations is proposed under alternating current (AC) excitation. Initially, photon information from protruding metal defects simulated using needle–plane electrodes during partial discharge (PD) evolution is analyzed in SF6. Subsequently, phase-resolved photon counting (PRPC) techniques and statistical analysis are employed to extract feature parameters for quantitative characterization of defect-induced photon responses. Finally, a t-distributed stochastic neighbor embedding (t-SNE) dimensionality reduction analysis is utilized to establish criteria for categorizing defect evolution states. The findings reveal that metal-particle-triggered optical PRPC maintains the obvious polarity effect, and the entire evolution of the discharge can be divided into three processes. These research findings are expected to advance the accurate assessment of operational risks in gas-insulated systems.

1. Introduction

Gas-insulated equipment (GIE) is widely utilized in ultra-high-voltage transmission networks in China due to its excellent properties [1,2]. However, various defects (gas gap, scratch, metal particles, etc.) unavoidably exist inside gas-insulated equipment and evolve under prolonged exposure to strong electric fields, leading to discharge faults [3].
To characterize these defects, methods based on PD signals have been extensively reported [4,5]. Research indicates that defect types and sizes influence discharge characteristics, reflected in their phase-resolved partial discharge (PRPD) patterns [4,5]. Statistical analysis of PRPD patterns enables the quantitative analysis of defect states. Nevertheless, conventional PD detection methods are prone to false alarms and misses due to noise in field environments. In contrast, optical detection offers inherent advantages such as immunity to electromagnetic interference and equipment vibrations, enhanced by the fully enclosed structure of GIE [6]. Given this, the optical-based detection method is regarded as a potential tool for detecting defects in GIE.
Reviewing the existing research, optical-based studies are always performed under either direct current (DC) or AC conditions. A quite different measurement result can be observed when the applied voltage is in different forms [7]. It is revealed that the optical signal can be more readily collected under AC excitation compared with DC conditions. The reason for the above phenomena is attributed to the difference in the charge transportation mechanism [8]. In particular, two types of luminous phenomena can be observed in the entire AC phase, but the luminous phenomenon can be observed at a higher voltage that triggers excitation or ionization and even the discharge of the charges inside the insulation materials. Consequently, research under AC excitation deserves more attention. F. Baudoin et al. established a bipolar charge transport model using polyethylene’s electroluminescence to explain the microscopic principles of charge transport and luminescence in dry nitrogen [9]. Bamji identified the electroluminescence onset voltage as a threshold for polymer degradation, marking the onset of insulation deterioration in a vacuum [10]. Additionally, B. Qiao highlighted that optical emission from PD is typically orders of magnitude higher than electroluminescence in liquid nitrogen [11]. Thus, electroluminescence (EL) marks the initial stage of PD development, offering high sensitivity for detecting micro-defects and early warnings based on accurate photon emission measurements [12]. Given that SF6 is currently the most widely used insulating gas in GIE, research by Ren Ming et al. on optical measurements in SF6 across different wavelengths and discharge types demonstrated significant spectral differences in the spectrum for various defects [13,14]. Moreover, reference [15,16], which studied photon radiation, quantitatively explored electroluminescence characteristics induced by defects, showing significantly lower onset voltages and intensity correlating with defect severity compared to PD. The findings also revealed that one promising optical approach is phase-resolved photon counting (PRPC), which enables the detailed characterization of defect-induced photon emissions.
However, existing studies primarily focus on photon responses under different defect conditions, with limited reporting on the evolution of photon features during defect evolution. Given this, to explore photon emission information during defect evolution for the quantitative characterization of defects, this paper explores PRPC techniques to establish a more accurate defect assessment framework. Initially, it investigates the PRPC features of protruding metal defects under increasing excitation voltages, proposing multi-physical features for a quantitative description of the PRPC pattern through statistical analysis. Furthermore, it employs t-SNE [17] dimensionality reduction to analyze the different stages of defect evolution. The findings provide insights into defect severity classification and operational risk assessment.

2. Experimental Platform and Measurement Results

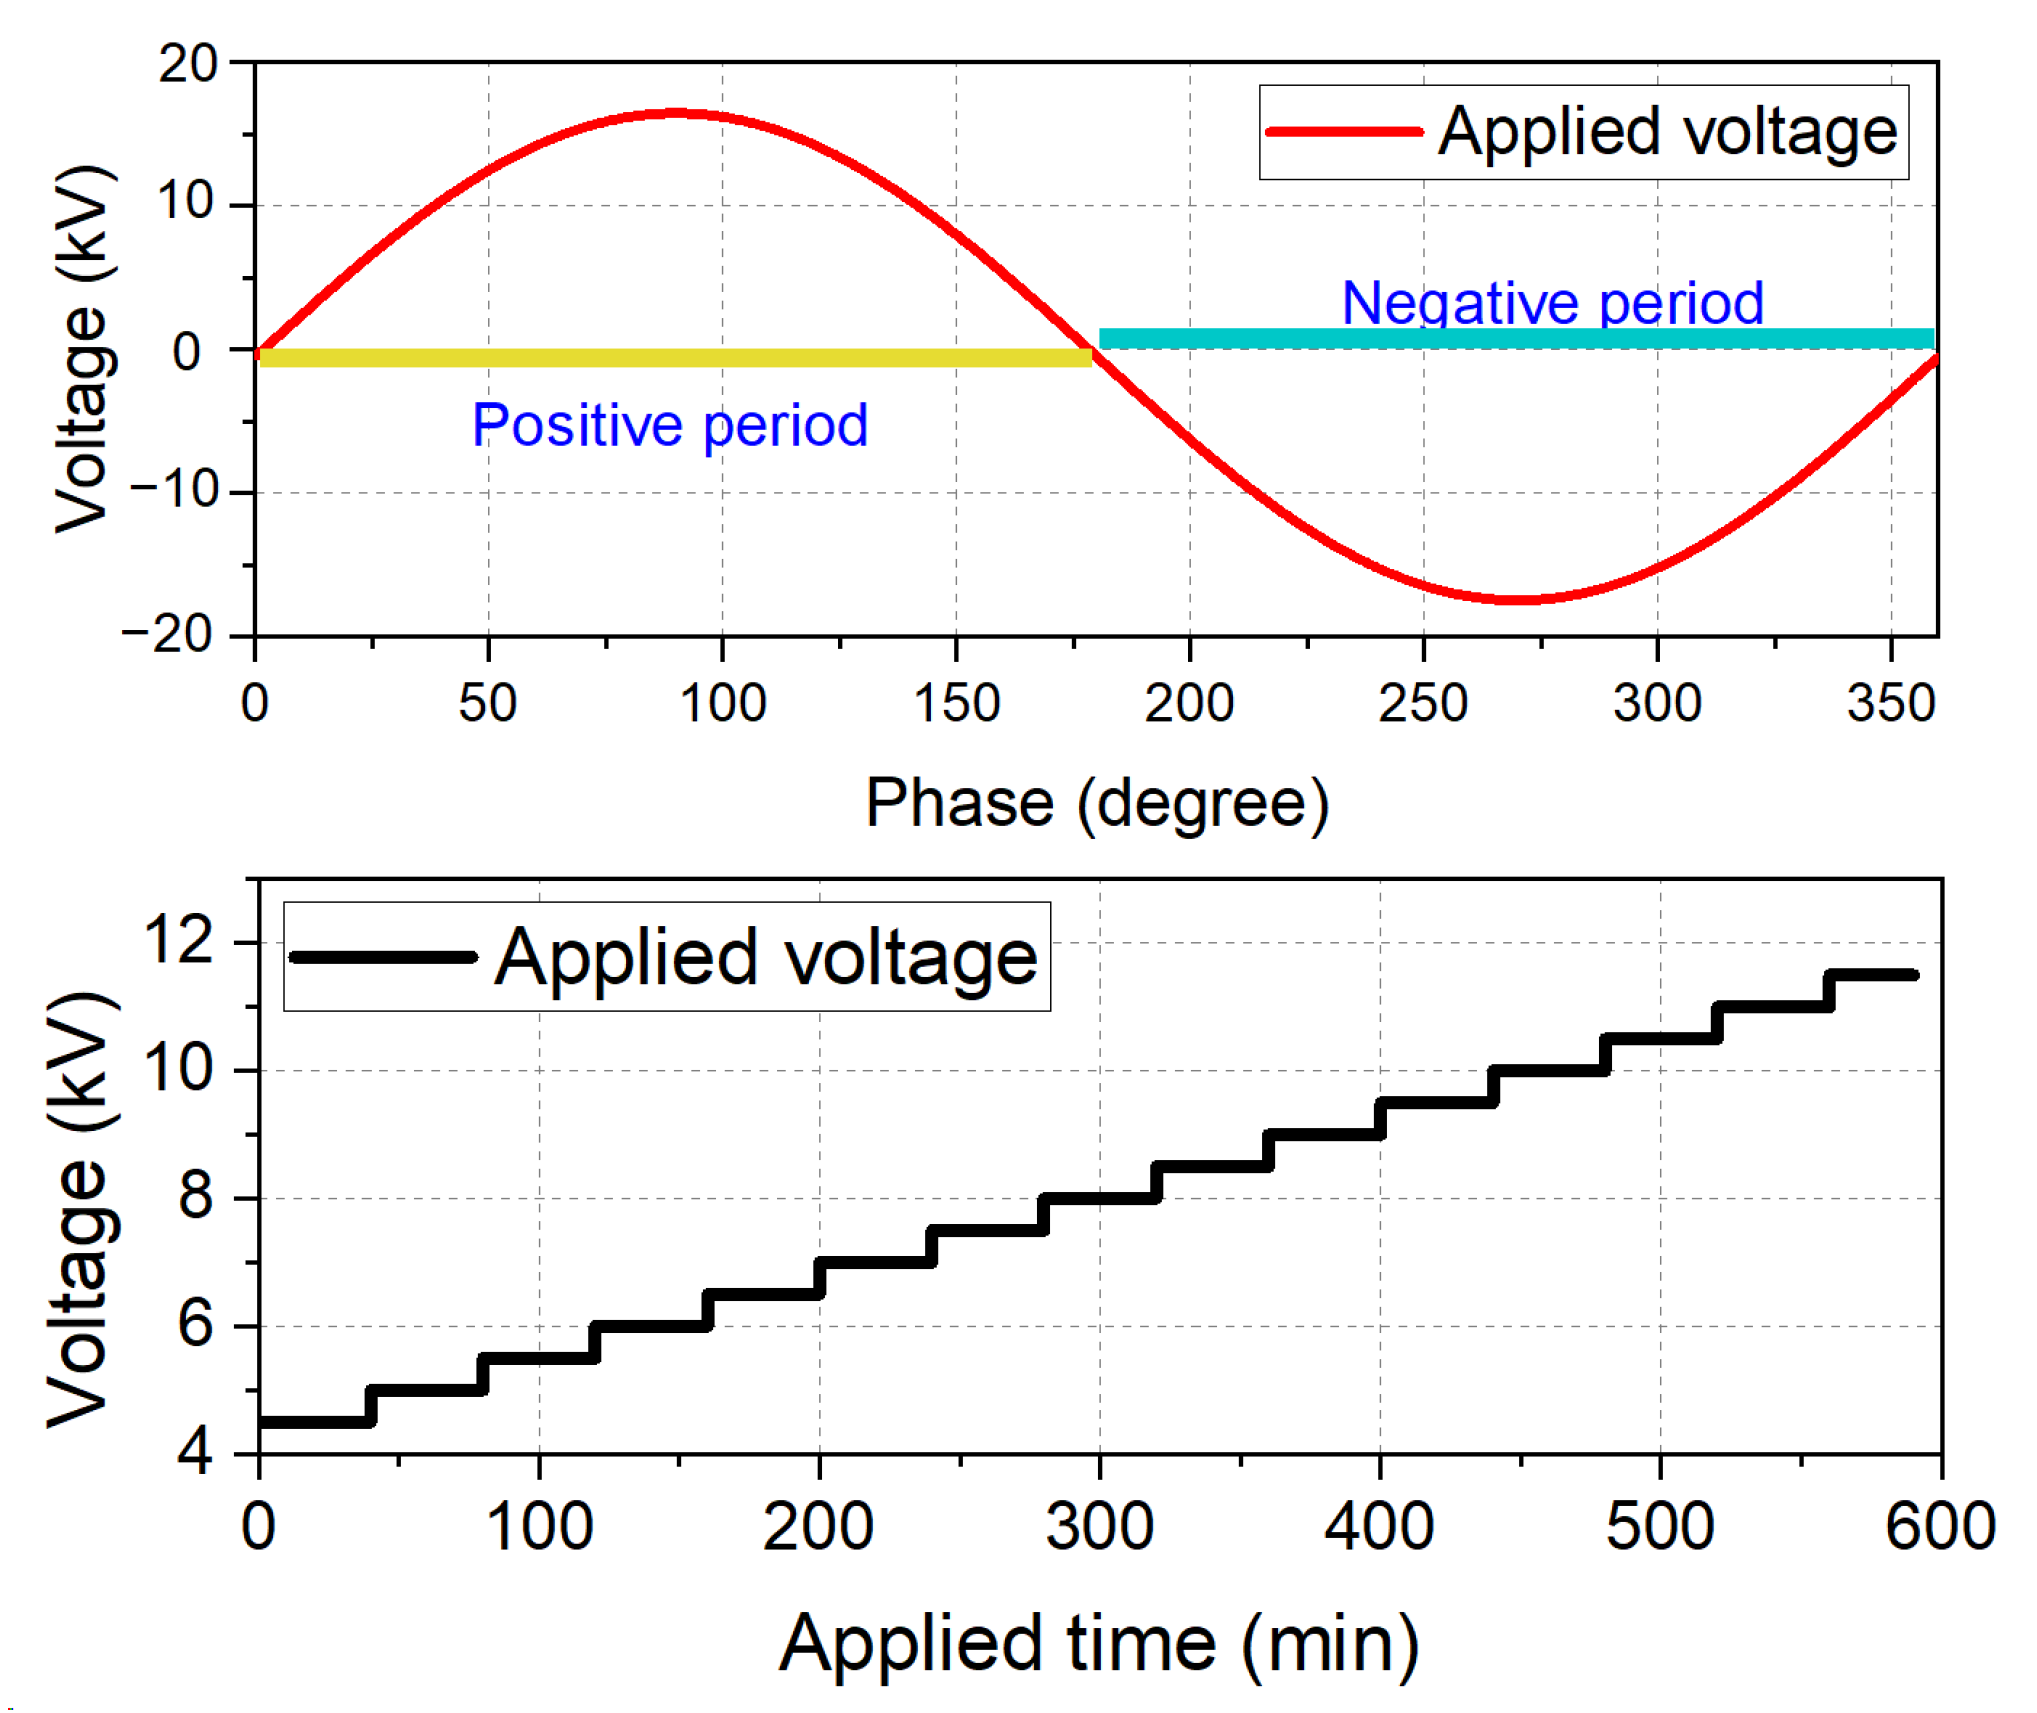
2.1. Experimental Platform

An aluminum needle (length is 10 mm, and tip curvature diameter is 1 mm) was utilized to simulate a metal protrusion in GIE equipment. The distance between the needle tip and the ground electrode was fixed at 7 mm. The simulation electrode and measurement circuit are plotted in Figure 1, in which the applied voltage was a growing 50 Hz AC voltage, and the released photons were recorded by a photon counting sensor (H8259-1, Hamamatsu Photon, Hamamatsu, Japan) with a resolution of less than 35 ns, a dark count of less than 80 s−1, and an available spectral region of 185 to 850 nm. The counting unit was used for transforming the output pulses into the counting results as well as providing the voltage. Then, a data recorder (Pico Scope 2000, Pico Technology, St. Neots, UK) was used to trigger the synchronizing measurements and for the visualization of the measurement results.
Then, a growing AC voltage with a range from 4.5 to 11.5 kV was applied, since the inception of the photons occurred at around 4.0 kV. As per to [15], to observe more photons compared with a higher pressure, all the performed tests were carried out under 0.1 Mpa SF6. The data record was divided into 15 steps, and each step lasted 20 min (the first 10 min was used to ensure stable luminescence) to collect the photon counting data with 200 AC cycles at room temperature. The scheme for applying the voltage is shown in Figure 2.

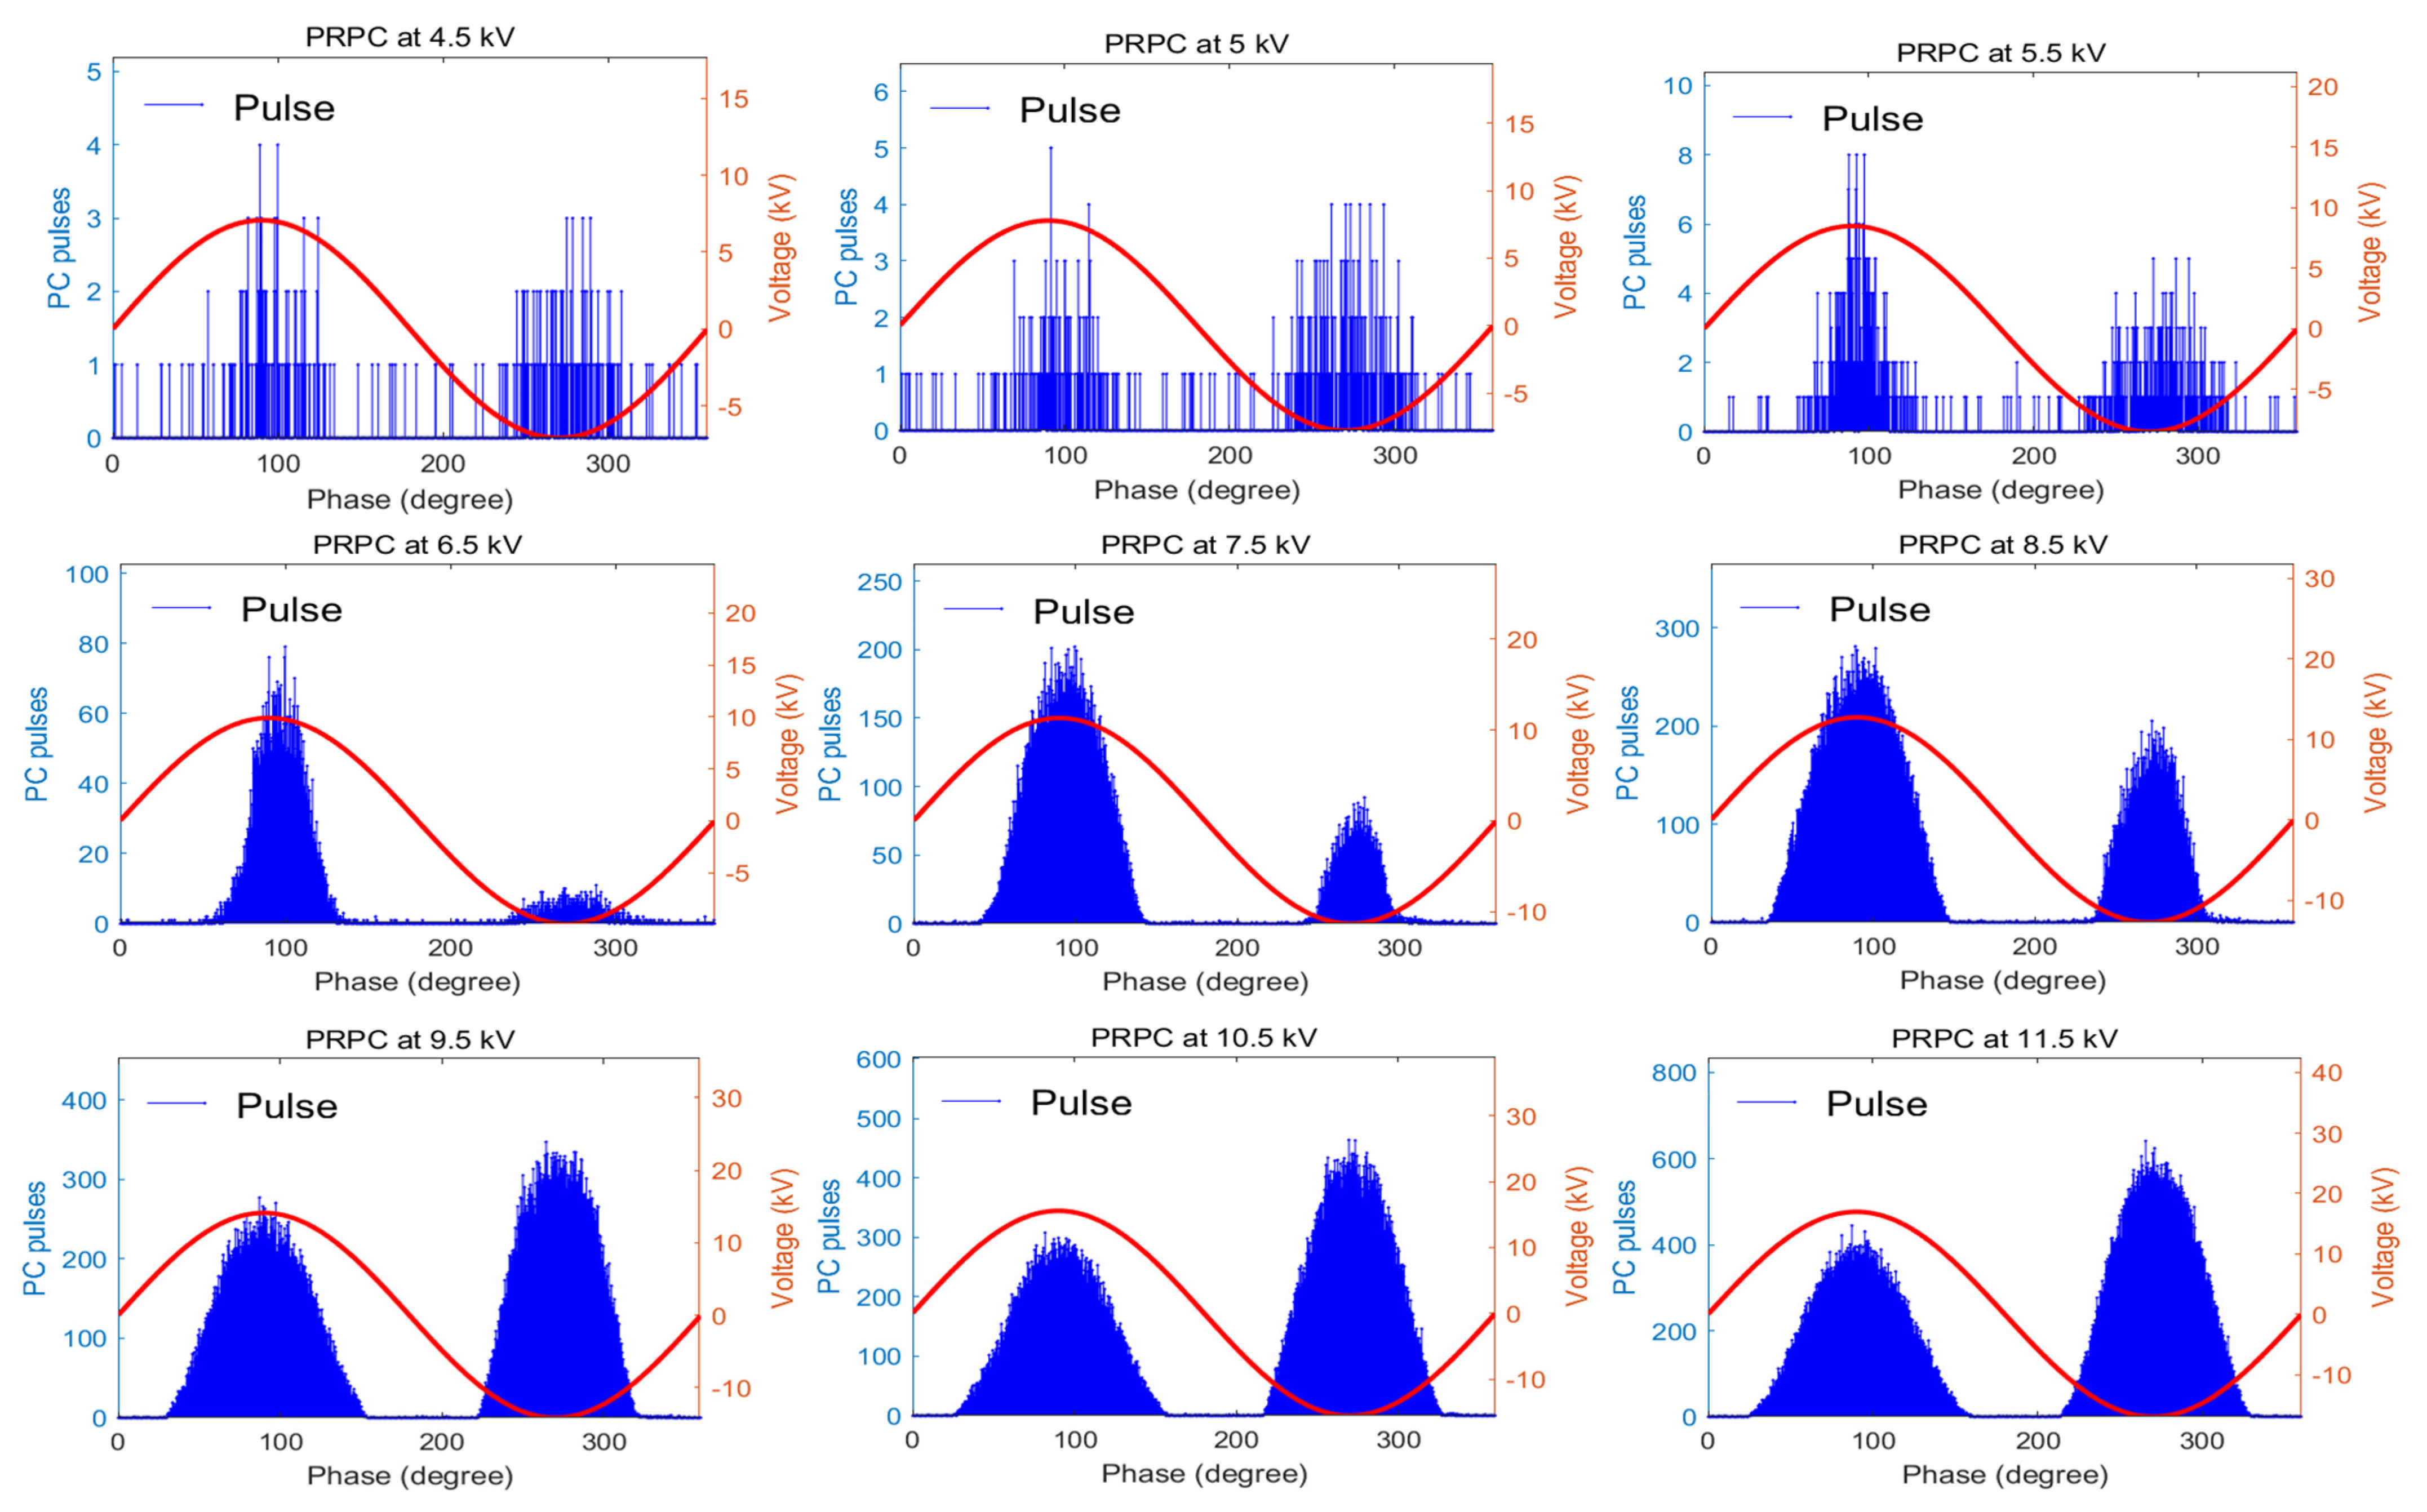
2.2. Measurement Results

The metal protrusion shown in Figure 1b was tested under 15 voltages, and a total of 9 voltages were selected and used for plotting the PRPC pattern shown in Figure 3. Specifically, the PRPC pattern was generated by correlating the time-domain photon counting pulses with the phase angle of the applied AC voltage. High-frequency sensors captured the pulses, recording their amplitude, timestamp, and phase angle relative to the voltage cycle’s zero-crossing reference. Each pulse was assigned to a phase bin, followed by statistical aggregation of the pulse counts and amplitude distributions within each bin. This phase–amplitude–density correlation enabled the non-invasive diagnosis of insulation degradation by linking the stochastic optical behavior to the voltage waveform’s periodic characteristics.
In Figure 3, each picture contains 2000 sampling points, and the photon pulse was counted in the corresponding gate time, where the unit is the photon pulse intensity (photons/microsecond). The PRPC was used to establish the polarity effect and amplitude distribution of defect-induced photon signals. As shown in Figure 3, the initial photon pulse intensity was 5 under the 4.5 kV AC voltage, and a value of merely 10 was reached when the voltage increased to 5.5 kV. However, a tenfold increase phenomenon was observed when the applied voltage reached 6.5 kV. Subsequently, the voltage increased through 12 stages, resulting in an eightfold increase in photon emission, with an average growth rate of 66%, markedly lower than the preceding phase. This can be attributed to the fact that at lower voltages, PD had not yet been initiated, and the photons originated from air ionization near the defects. Beyond 5.5 kV, PD initiation occurred, rapidly intensifying the photon emission. Further voltage escalation steadily promoted the photon emission, resulting in a smooth linear increase. A similar phenomenon was also observed in [6], in which the evolutionary process of luminescence caused by an increasing voltage was divided into four stages.
In addition, Figure 3 also illustrates the polarity effects evident in the PRPC induced by the metal protrusions. At different excitation voltages, the peak values in the spectra consistently aligned with the voltage peaks. At lower excitation voltages, the photon pulse intensity under positive polarity exceeded that under negative polarity. However, with the increase in the voltage, the PRPC revealed a steady rise in the photon pulses under a negative polarity, surpassing those under a positive polarity. This phenomenon was attributed to the following mechanism.
At lower excitation voltages, during the positive half-cycle, the protrusion with a positive charge attracted free electrons in the surrounding medium, forming a concentrated electric field region. This field was sufficient to ionize the surrounding gas molecules, generating electron–ion pairs that triggered a partial discharge. Due to enhanced electric field effects during the positive half-cycle, discharge events were more frequent, resulting in a higher photon emission. At higher voltages, both the positive and negative half-cycles sustained a sufficient electric field strength to induce a partial discharge. However, as the voltage increased, the discharge activity became more pronounced during the negative half-cycle. This was primarily due to the sustained strong electric field around the protrusion, even when it carried a negative charge during the negative half-cycle. Additionally, in the negative polarity discharge, the production and collision ionization of high-speed electrons were more efficient, resulting in increased photon emission.

3. Discharge State Analysis

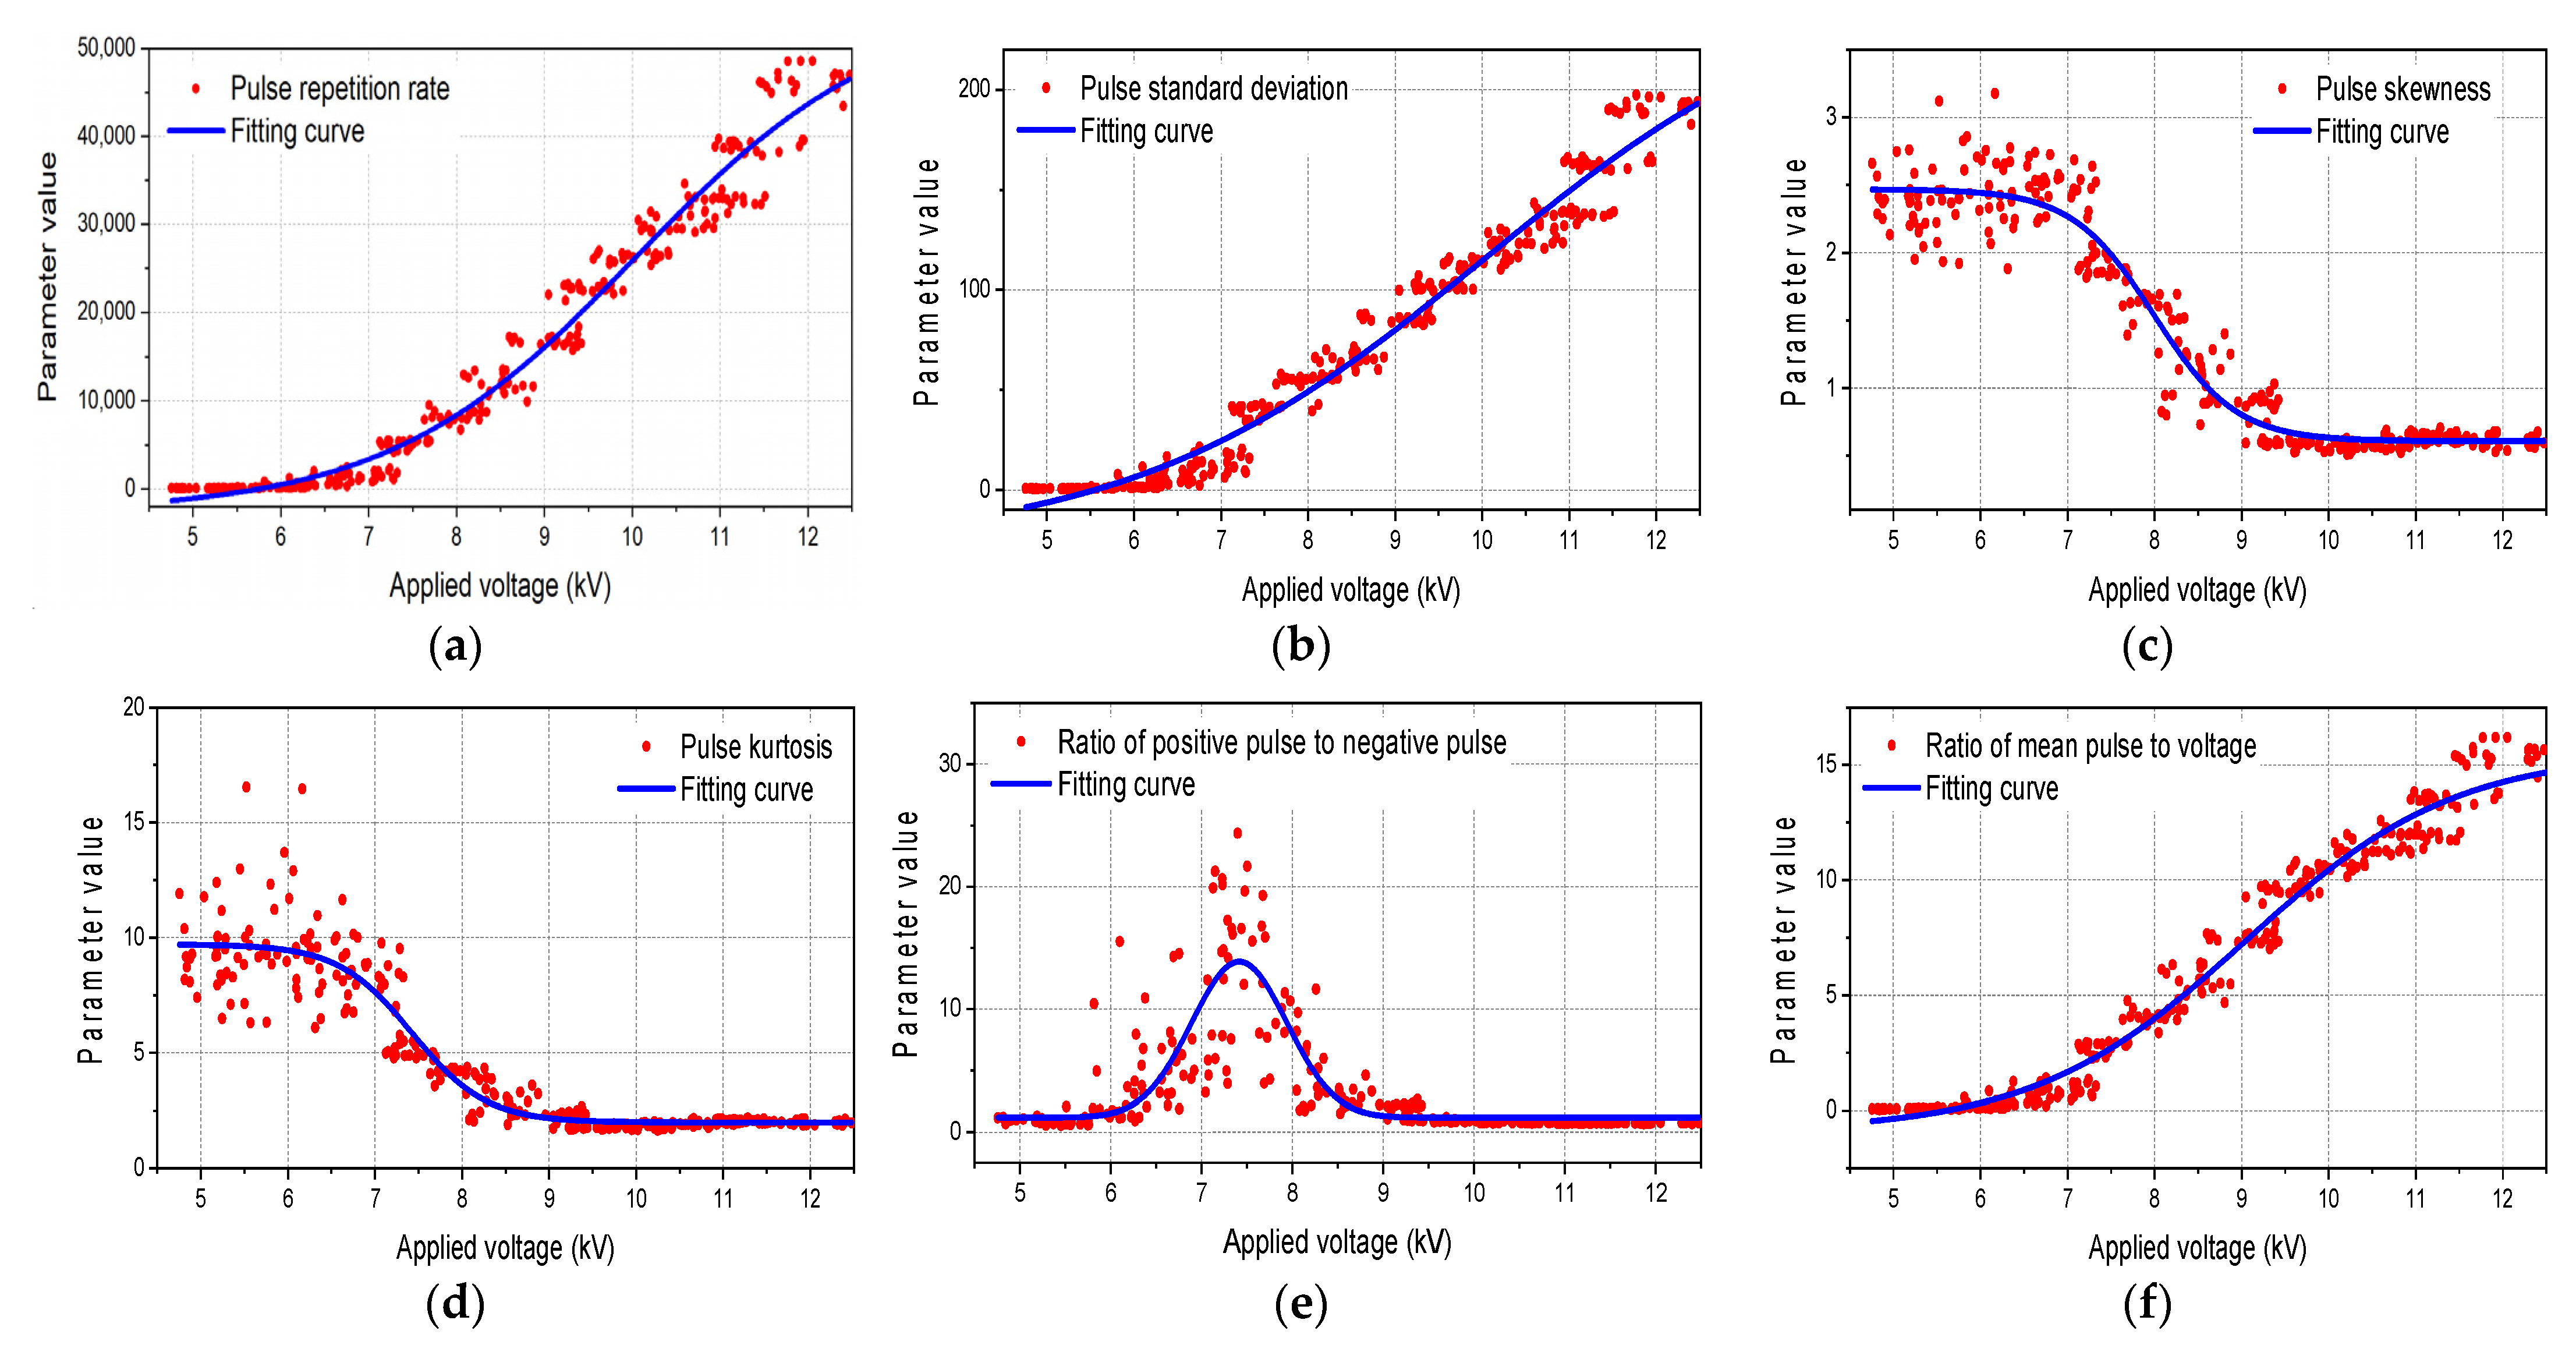
3.1. Features for Characterizing the PRPC Pattern

The variation law presented in Figure 3 shows that the photons were released by different mechanisms as the voltage increased, and the distinct pattern feature caused by the PRPC can be thus used to analyze the discharge state.
It was observed that a higher applied voltage led to a higher photon pulse. Then, the photon pulse repetition rate Prr is defined as follows:
P r r = i = 1 N Φ ( i ) / t
where Φ(i) is the pulse intensity of sampling point i in Figure 3, t is the measurement time, and t was equal to 4 s, and N is the total number of sampling points, where N = 2000.
Then, to quantify the degree of dispersion of the pulse amplitude or phase distribution, the standard deviation (Std) defined in Equation (2) was used.
S t d = i = 1 N [ Φ i Φ a v e r ] 2 N
Φaver is the average value of the photon pulse intensity. A high Std means that there may be multiple discharge modes or unstable discharges.
In addition, skewness (Ske) [18] describes the asymmetry of the distribution of PRPC, and kurtosis (Kur) [19] reflects the sharpness of the distribution curve, as defined in Equations (3) and (4):
S k e = i = 1 N [ Φ i Φ a v e r ] 4 N S t d 3
K u r = i = 1 N [ Φ i Φ a v e r ] 4 N S t d 4
As depicted in Figure 3, the photon pulse in both the positive and negative AC cycles changed with the voltage, and the corresponding pulse ratio (Rspn) is thus defined as follows:
R s p n = j = 1 O Φ ( j ) k = 1 p Φ ( k )
In (5), O and P are the total number of pulses in the positive and negative AC cycles.
Further, to normalize the impact of the voltage, the normalized ratio of the mean photon pulse to the voltage (Rmv) is defined in Equation (6). U is the applied AC voltage.
P r r = i = 1 N Φ ( i ) / N U
In the experiment, 20 repeated measurements were taken on the defect’s PRPC under the same voltage, and the corresponding data (300 samples) were then substituted into the defined formulas.
Then, the distribution between the calculated features and the voltage was plotted, as shown in Figure 4, and the fitting curves were also established to explore the variation law.
Figure 4 illustrates that Prr, Std, and Rmv increased gradually with the increase in the voltage. This evolution suggests that the number of photons released during the defect discharge process significantly increased as the voltage reached a certain level and gradually saturated. Conversely, Ske and Kur exhibited a gradual decrease and stabilization. This trend was attributed to the initial discharges from the metal protrusions potentially generating strong local discharges only at specific phase angles, hence the sharp peaks in the PRPC spectra. However, as the discharge progressed, it could occur over a wider phase range, resulting in a flatter distribution and a reduced peak height and sharpness. In addition, as shown in Figure 4e, the value of Rspn first increased and then decreased, consistent with the variation pattern shown in Figure 3. When the number of negative periodic photon pulses was greater than the number of positive periodic pulses, Rspn was less than 1.

3.2. Discharge Pattern Identification

Figure 3 and Figure 4 demonstrate that both the spectral and quantitative features of defect-induced discharges evolved systematically with the applied voltage. Therefore, quantitative analysis based on these patterns enables the assessment of the discharge development (severity). While Figure 4 presents six distinct feature parameters, their contributions to identifying the discharge processes are rather different. To address this issue, the feature fusion method is regarded as a useful approach to solve the high-dimensional issue. t-SNE outperforms principal component analysis (PCA) [20], linear discriminant analysis (LDA) [21], and singular value decomposition (SVD) [22] (all linear methods) in nonlinear data visualization, effectively capturing the local similarities of complex manifold structures, while PCA/SVD focus on global variance and LDA relies on linear separability. Compared to UMAP [23], UMAP tends to preserve a more global structure, which may lead to blurred local details, while t-SNE’s local optimization strategy makes similar clusters more compact and separates dissimilar clusters more distinctly. Additionally, UMAP is more efficient for large-scale data (greater than 10k samples), while t-SNE generates clearer cluster boundaries in smaller datasets (less than 5k samples), making it more suitable for exploratory analysis in research. Thus, a feature fusion approach based on the t-SNE model [15] was established, and the main steps include:
i.
Calculate the similarity matrix: Calculate a similarity matrix based on the similarity between each pair of data points in a high-dimensional dataset.
ii.
Initialization of embedding space: Randomly initialize a position for each data point in a low-dimensional space.
iii.
Define t-distribution probability distribution: Use the t-distribution to define the conditional probability distribution between data points in both the high-dimensional and low-dimensional spaces.
iv.
Optimization process: By minimizing the Kullback–Leibler divergence of the conditional probability distribution, adjust the position of the data in the low-dimensional space.
v.
Iterative optimization: Iteratively update the position of each data point in the low-dimensional space until the stopping condition is met.
vi.
Visualization and analysis: Finally, use the optimized data point positions in the low-dimensional space for visualization and analysis.
Then, the TSNE reduces the six-dimensional feature parameter matrix to three dimensions. Figure 5 illustrates the visualized distribution of features after dimensionality reduction, which indicates that the evolution stages of the discharge can be divided into three categories, which can be defined as slight discharge (SD), moderate discharge (MD), and severe discharge (SED). Then, Table 1 lists the distribution center and classification results.
By analyzing the distribution results shown in Figure 1, it was found that the samples under an excitation voltage range of 4.5~6.5 kV were located in the same region, with their corresponding coordinate center at (0.16, 0.59, 0.90). Therefore, the 100 sample points within this voltage range could be classified as the SD state. Similarly, the sample points in the second distribution region, composed of 80 samples from the 7.0~8.5 kV range, corresponded to the MD state, with their coordinate center at (0.66, 0.96, 0.09). Finally, the remaining 120 sample points belonged to the SED state, with their corresponding coordinate center at (0.80, 0.10, 0.25).
The research results show that the photon emission intensity at the defect site was positively correlated with the nearby electric field strength. A linear increase in the excitation voltage led to an exponential increase in the photon emission intensity, indicating a change in the dominant mechanism of the defect-induced luminescence process. According to previous studies [16], the iterative process of the luminescence mechanism for insulating systems should involve EL inside the solid insulation, ionization near defects, sporadic discharges near defects, and, finally, a stable discharge process. However, compared to epoxy insulating systems, the key difference in the insulating system studied here is the use of metal tip defects, meaning there is no EL process within the solid insulation. Therefore, it can be inferred that the defect-induced luminescence process in this study can be divided into three stages. The results shown in Table 1 and Figure 5 (three discharge states) confirmed this hypothesis. In summary, through clustering analysis of defect luminescence (discharge) states, the operational risks and potential hazards to GIE can be qualitatively described.

4. Conclusions

This work used photon counting to measure PD signals induced by metal protrusions and analyzed the discharge characteristics during the PD evolution process based on the PRPC pattern. The PRPC exhibited a significant polarity effect on the specimens when the applied voltage exceeded 5.5 kV, as shown in Figure 3. Specifically, the intensity of the photon pulses steadily increased with the increase in the excitation voltage, while the photons in the negative half-cycle first decreased and then increased compared to the photon pulses in the positive AC half-cycle. This phenomenon was mainly attributed to changes in AC polarity and changes in charge concentration near the needle tip. To further quantify the above changes, statistical analysis based on multiple features was proposed. Then, the quantitative relationship between the excitation voltage and these parameters was studied using fitting analysis. Finally, based on dimensionality reduction analysis, the diverse stages of the PD evolution were discussed, and their classification criteria were determined.
Given the increasing environmental requirements, research on SF6 alternative gases has gained widespread attention. Therefore, achieving optical measurements and defect detection in different gas environments has become particularly interesting. The authors’ further research will focus on the photon emission characteristics induced by defects under different gas compositions.

Author Contributions

Data curation, C.G.; Writing—original draft, H.L.; Writing—review & editing, Z.L.; Project administration, Y.L. All authors have read and agreed to the published version of the manuscript.

Funding

This work was supported by the Science & Technology Project of State Grid Corporation of China (5500-202355793A-3-8-KJ).

Data Availability Statement

Data are available on request from the authors.

Conflicts of Interest

Authors Yan Liu and Chong Guo were employed by China Electric Power Research Institute. The remaining authors declare that the research was conducted in the absence of any commercial or financial relationships that could be construed as a potential conflict of interest. The authors declare that this study received funding from State Grid Corporation of China. The funder was not involved in the study design, collection, analysis, interpretation of data, the writing of this article or the decision to submit it for publication.

References

  1. Li, C.Y.; Lin, C.; Chen, G.; Tu, Y.; Zhou, Y.; Li, Q.; Zhang, B.; He, J. Field-dependent charging phenomenon of HVDC spacers based on dominant charge behaviors. Appl. Phys. Lett. 2019, 114, 202904. [Google Scholar] [CrossRef]
  2. Wang, F.; Liang, F.; Zhong, L.; Chen, S.; Li, C.; Xie, Y. Short-time X-ray irradiation as a non-contact charge dissipation solution for insulators in HVDC GIS/GIL. IEEE Trans. Dielectr. Electr. Insul. 2021, 28, 704–709. [Google Scholar] [CrossRef]
  3. Wang, J.; Hu, Q.; Chang, Y.; Wang, J.; Liang, R.; Tu, Y.; Li, C.; Li, Q. Metal particle contamination in gas-insulated switchgears/gas-insulated transmission lines. CSEE J. Power Energy Syst. 2021, 7, 1011–1025. [Google Scholar]
  4. Albarracin, R.; Robles, G.; Martinez-Tarifa, J.M.; Ardila-Rey, J. Separation of sources in radiofrequency measurements of partial discharges using time-power ratio maps. ISA Trans. 2015, 58, 389–397. [Google Scholar] [CrossRef] [PubMed]
  5. Meng, X.; Li, X.; Lu, T. Statistical properties of corona current pulses in rod-plane air gap under AC–DC composite voltages. IEEE Trans. Dielectr. Electr. Insul. 2024, 3, 212–221. [Google Scholar] [CrossRef]
  6. Fan, X.; Niu, S.; Luo, H.; Liang, J.; Liu, F.; Li, W.; Liu, W.; Gao, W.; Huang, Y.; Li, C.; et al. Photon counting technique as a potential tool in micro-defect detection of epoxy insulation pull rod in gas-insulated switchgears. High Volt. 2024, 9, 267–274. [Google Scholar] [CrossRef]
  7. Pandey, J.C.; Gupta, N. Study of treeing in epoxy-alumina nanocomposites using electroluminescence. IEEE Trans. Dielectr. Electr. Insul. 2019, 26, 648–654. [Google Scholar] [CrossRef]
  8. Mary, D.; Albertini, M.; Laurent, C. Understanding optical emissions from electrically stressed insulating polymers: Electroluminescence in poly(ethylene terephthalate) and poly(ethylene 2,6-naphthalate) films. J. Phys. D Appl. Phys. 1997, 30, 171–184. [Google Scholar] [CrossRef]
  9. Baudoin, F.; Mills, D.H.; Lewin, P.L.; Le Roy, S.; Teyssedre, G.; Laurent, C. Modeling electroluminescence in insulating polymers under AC stress: Effect of excitation waveform. J. Phys. D Appl. Phys. 2011, 44, 165402. [Google Scholar] [CrossRef]
  10. Bamji, S.S.; Bulinski, A.T.; Densley, R.J. Threshold voltage of luminescence and electrical tree inception in low-density polyethylene. J. Appl. Phys. 2008, 16, 1376–1392. [Google Scholar] [CrossRef]
  11. Qiao, B.; Teyssedre, G.; Laurent, C. Uncover the electroluminescence in wide band gap polymers. J. Phys. D Appl. Phys. 2015, 48, 405102. [Google Scholar] [CrossRef]
  12. Yang, K.; Zhang, G.-J.; Tu, D.-M.; Yan, Z. Space charge and electroluminescence characteristics of thermally aged LDPE films. Appl. Surf. Sci. 2008, 255, 2735–2739. [Google Scholar] [CrossRef]
  13. Ren, M.; Song, B.; Zhuang, T.X.; Yang, S.J. Optical partial discharge diagnostic in SF6 gas insulated system via multi-spectral detection. ISA Trans. 2018, 75, 247–257. [Google Scholar] [CrossRef] [PubMed]
  14. Xia, C.J.; Ren, M.; Chen, R.F.; Yu, J.; Li, C.; Chen, Y.; Wang, K.; Wang, S.; Dong, M. Multispectral optical partial discharge detection, recognition, and assessment. IEEE Trans. Instrum. Meas. 2022, 71, 7002921. [Google Scholar] [CrossRef]
  15. Fan, X.; Luo, H.; Liang, F.; Hu, J.; Liu, W.; Li, C.; He, J. Photon count technique as a potential tool for insulation micro defect detection: Principles and primary results. iEnergy 2023, 2, 258–263. [Google Scholar] [CrossRef]
  16. Fan, X.; Liang, F.; Luo, H.; Zhang, X.; Huang, Z.; Li, C.; He, J. Detection of defect-induced luminescence in epoxy-based insulation materials via phase resolved photon counting method. J. Phys. D Appl. Phys. 2024, 57, 35. [Google Scholar] [CrossRef]
  17. Pezzotti, N.; Lelieveldt, B.P.F.; van der Maaten, L.; Hollt, T.; Eisemann, E.; Vilanova, A. Approximated and user steerable tSNE for progressive visual analytics. IEEE Trans. Vis. Comput. Graph. 2017, 23, 1739–1752. [Google Scholar] [CrossRef]
  18. Nakano, Y.; Kozako, M.; Hikita, M.; Tanaka, T.; Kobayashi, M. Estimation method of degraded vacuum in vacuum interrupter based on partial discharge measurement. IEEE Trans. Dielectr. Electr. Insul. 2019, 26, 1520–1526. [Google Scholar] [CrossRef]
  19. Chen, Y.; Zhao, M.; Liu, Z.; Ma, J.; Yang, L. Comparative analysis of offshore wind resources and optimal wind speed distribution models in China and Europe. Energies 2025, 18, 1108. [Google Scholar] [CrossRef]
  20. Zampolo, R.F.; Lopes, F.H.R.; de Oliveira, R.M.S.; Fernandes, M.F.; Dmitriev, V. Dimensionality Reduction and Clustering Strategies for Label Propagation in Partial Discharge Data Sets. Energies 2024, 17, 5936. [Google Scholar] [CrossRef]
  21. Ji, S.; Ye, J. Generalized linear discriminant analysis: A unified framework and efficient model selection. IEEE Trans. Neural Netw. 2008, 19, 1768–1782. [Google Scholar] [PubMed]
  22. Howland, P.; Park, H. Generalizing discriminant analysis using the generalized singular value decomposition. IEEE Trans. Pattern Anal. Mach. Intell. 2004, 26, 995–1006. [Google Scholar] [CrossRef] [PubMed]
  23. Fan, X.; Luo, H.; Liang, F.; Ma, T.; Hu, J.; Li, C.; He, J. Feature fusion of pulse current, ultrahigh frequency, and photon count signal: A novel discharge pattern recognition method of metal particles in GIS/GIL. IEEE Sens. J. 2024, 24, 36979–36986. [Google Scholar] [CrossRef]
Figure 1. (a) Measurement platform and circuit for photon counting measurement, (b) electrode model for simulating a metal protrusion defect in GIE equipment.
Energies 18 01649 g001
Figure 2. The phase of the applied voltage and the scheme for increasing the voltage.
Energies 18 01649 g002
Figure 3. The PRPC of metal protrusion defects under an increasing applied voltage.
Energies 18 01649 g003
Figure 4. The distribution of the feature parameters versus the applied voltage. (a) Pulse repetition rate, (b) pulse standard deviation, (c) pulse skewness, (d) pulse kurtosis, (e) ratio of positive pulse to negative pulse, (f) ratio of mean pulse to voltage.
Energies 18 01649 g004
Figure 5. The sample distribution by TSNE calculation (colors indicates the diverse samples).
Energies 18 01649 g005
Table 1. The classification center and discharge state.
ItemDischarge State
SDMDSED
Classification center(0.16, 0.59, 0.90)(0.66, 0.96, 0.09)(0.80, 0.10, 0.25)
Included voltages (kV)4.5 to 6.57.0 to 8.59.0 to 11.5
Disclaimer/Publisher’s Note: The statements, opinions and data contained in all publications are solely those of the individual author(s) and contributor(s) and not of MDPI and/or the editor(s). MDPI and/or the editor(s) disclaim responsibility for any injury to people or property resulting from any ideas, methods, instructions or products referred to in the content.

