1. Introduction
Polymer nanocomposites have significantly enhanced polymers’ properties, like thermal conductivity, by incorporating a small fraction of nanomaterial, preserving the original material’s weight while achieving significant improvements [
1,
2,
3,
4,
5]. For this, the interaction between nanofillers and the polymer matrix is crucial [
6,
7].
Thermal conductivity is important in dissipating heat from electronic devices, especially as power densities continue to grow in the progressive advancements of the electronics industry [
8]. One material that exhibits exceptional thermal conductivity is graphene, an allotrope of carbon that forms a single layer of atoms [
9,
10,
11]. As a result, graphene has emerged as one of the most extensively used nano-additives for enhancing the thermal characteristics of polymers in recent years [
11,
12,
13,
14,
15,
16,
17]. Despite this, the presence of graphene does not always lead to the anticipated high thermal conductivity values due to the interface between the different materials, which acts as a barrier against transferring heat energy. Two methods are classically developed [
15] to overcome the mentioned problems. The first method involves increasing the strength of the interfacial bonding [
18,
19]. The second method focuses on a larger overlap of vibrational modes between the materials at the interface [
20,
21]. These approaches aim to enhance the thermal conductivity in polymer–graphene composites and overcome the limitations originated in the interface.
Chien et al.’s [
22] study on hydrogen functionalization in graphene revealed that increasing hydrogen coverage reduced thermal conductivity by 40% due to phonon travel being decreased. Razzaghi et al. [
23] studied thermal conductivity in polyethylene-based nanocomposites with graphene, C
3N, and C
2N using molecular dynamics and finite element analysis. They found higher interfacial thermal conductance with nanofillers of lower thermal conductivity but observed higher effective thermal conductivity with nanofillers of higher thermal conductance. However, when they developed finite element analysis, they discovered that the effective thermal conductivity was higher in the nanocomposite that was reinforced with the nanofiller possessing a higher thermal conductance (a value of 0.74 W/mK with graphene was observed). Another study was conducted by Vahedi et al. [
24], focused on investigating the effective thermal conductivity of carbon nanotube/paraffin nanocomposites [
24]. To obtain accurate and reliable results, they combined the techniques of molecular dynamics (MD) and finite element analysis (FEM). Their study primarily aimed to evaluate the impact of three key factors—diameter, aspect ratio, and volume fraction—on the effective thermal conductivity. Their analysis deduced that the effective thermal conductivity increases as these three factors increase.
The functionalization of graphene sheets has enhanced thermal transport and reduced resistance, but scientific literature is limited, with most studies having focused on hydrogen functionalization effects [
25,
26].
Yang et al. [
27] studied the thermal conductivity of graphene oxide (GO) using classical MD simulations and non-equilibrium molecular dynamics. They found that vacancy defects have a greater impact than functional groups. But their research offers theoretical guidance for designing thermoelectric and thermal management devices using GO. In the research by Zhang et al. [
15], grafting polyvinyl alcohol–hydrogen-functionalized molecules on graphene increased interfacial thermal conductance by 6.22 and showed PVA chains to be more effective than hydroxyl groups and polyethylene chains.
Another study by Liu et al. [
28] focused on graphene/h-BN heterostructures. They found that doping interface topography optimization improved interfacial thermal conductance, with temperature having minimal impact. In a separate study, Jamirad et al. [
29] investigated surface-treated boron nitride nanosheets (BNNSs) and polylactic acid nanocomposites. They revealed that functional groups enhance interfacial interactions and thermal transport. Liu et al. [
30] investigated the impact of BNNS/epoxy composites and revealed that functionalization enhances thermal properties, aiding in high-power device management and optimizing thermal conductivity for microelectronic packaging.
Another study by Sharifian et al. [
31] investigated the thermal characteristics of spiral carbon-based nanomaterials exploring thermal rectification properties under varied conditions and suggesting the feasibility of a novel variable thermal diode. Shi et al. [
32] used graphene nanosheets (GNSs) and carbon nanotubes (CNTs) in a silicone-modified acrylic resin-based nanocomposite, enhancing thermal conductivity and corrosion protection while achieving improved mechanical performance homogeneity. Zhu et al. [
33] developed MP@GP/EP, a graphene composite coating, to enhance thermal stress resistance, corrosion protection, adhesion strength, impact toughness, and thermal shock cycles in extreme environments. Meisam Shabanian et al. [
34] focused on the synthesis and characterization of semi-aromatic polyamide (PA) nanocomposites reinforced with multiwall carbon nanotubes (CNTs). The results demonstrated significant improvements in thermal stability and flame retardancy of the nanocomposites compared to the pure polyamide matrix. Yuping He et al. [
35] investigated the heat transport in Si, Ge, and SiGe alloys using molecular dynamics and the Boltzmann transport equation, finding equilibrium MD effective for large samples. Similarly, Tengfei Luo et al. [
36] reviewed advances in computational and experimental methods for nanoscale thermal transport, highlighting key phenomena such as enhanced thermal conductivity in low-dimensional materials like graphene and CNTs, along with challenges in measuring interfacial phonon transmission and low-thermal-conductivity materials. Building on these insights, Jianwei Zhang et al. [
37] explored the thermal transport properties of carbon nanotube networks with different levels of polymer intercalation through molecular dynamics simulations. Their findings revealed that a low level of polymer aggregation improved interfacial thermal conductance, while excessive polymer wrapping negatively affected thermal conductivity along the CNT axis. In a related study, Claudia Caddeo et al. [
38] estimated the thermal conductivity of methylammonium lead halide using atomistic methods, revealing that its low thermal conductivity stemmed from the PbI lattice. By modifying the internal structure of organic cations, they demonstrated potential strategies for tuning the thermal conductivity of hybrid perovskites.
Jinlong He et al. [
39] had researched thermal transport in monocrystalline and polycrystalline lithium cobalt oxide (LiCoO
2) using molecular dynamics. They found that monocrystalline LiCoO
2 exhibited high, anisotropic thermal conductivities around 100 W m
−1 K
−1, while polycrystalline LiCoO
2 showed lower, more isotropic values influenced by grain size and boundaries. Their results had been integrated into thermal resistance models, predicting conductivity trends validated by simulations.
Finally, Hiroki Matsubara et al. [
40] investigated the effect of graphene filler in-plane aspect ratios on the thermal conductivity of paraffin/graphene composites. Their study showed that higher-aspect-ratio graphene fillers enhanced thermal conductivity by promoting ordered aggregation and improved intra-filler heat transfer, offering promising insights for designing advanced thermal management materials.
Here, we propose using a non-equilibrium molecular dynamics simulation to investigate the interfacial thermal conductance between functionalized graphene with different surface fractions and polyethylene. Graphene is subjected to functionalization with three different groups, namely hydrogen (H), methyl (CH3), and ethyl (C2H5). The surface coverage percentage of the functional groups on the graphene surface is varied from 0 to 30%, and the interfacial thermal conductance is calculated. Also, the thermal conductivity of pure polyethylene and then polyethylene with functionalized graphene is calculated, and finally, the frequency vibrational behavior of functionalized graphene and polyethylene is calculated and presented.
The choice of hydrogen (H), methyl (CH
3), and ethyl (C
2H
5) as functional groups is motivated by their distinct molecular sizes and bonding properties, enabling a systematic investigation of their effects on thermal transport across the polyethylene/graphene interface. Hydrogen, the smallest group, is widely studied for its ability to form covalent bonds and alter phonon scattering, as seen in Chien et al. [
22]. Methyl and ethyl groups, with increasing carbon chain lengths, offer greater steric and vibrational contributions, potentially enhancing interfacial coupling, as suggested by Zhang et al. [
15] for polymer–graphene systems. Notably, Karimi et al. [
41] also used these groups to study graphene–polyethylene nanocomposites, validating their relevance. These computationally feasible groups are practical for functionalization and ideal for probing thermal conductivity and interfacial conductance enhancements.
This study develops a novel molecular dynamics (MD) investigation of polyethylene (PE) reinforced with graphene functionalized by hydrogen (H), methyl (CH
3), and ethyl (C
2H
5) groups across 5–30% volume fractions. Unlike prior works having focused on single functional groups (e.g., Chien et al. [
22] on H or Yang et al. [
27] on graphene oxide), we uniquely compared three groups within one framework and revealed an increase in ethyl functionalization’s interfacial thermal conductance (ITC) of 250% (2.50 × 10
8 W/m
2K vs. 8.8 × 10
7 W/m
2K for pristine graphene) and a 17.4% conductivity boost (0.42 W/mK vs. 0.36 W/mK,
Section 3). Having integrated vibrational density of states (VDOS) analysis, our work further distinguished itself by having linked these enhancements to reduced phonon mismatch, offering a tailored approach optimized for thermal management in PE-based nanocomposites beyond trends observed in studies like Razzaghi et al. [
23] or Liu et al. [
28].
2. Methodology
The molecular dynamics simulations were carried out using the Large-scale Atomic/Molecular Massively Parallel Simulator (LAMMPS) package [
42], which employs the non-equilibrium molecular dynamics (NEMD) approach. The widely used adaptive intermolecular reactive empirical bond order (AIREBO) potential was implemented to accurately capture the behavior of systems containing carbon and hydrogen atoms.
The AIREBO potential was chosen due to its robust capability to model covalent C-C and C-H bonds, as well as torsional and non-bonding interactions, critical for accurately simulating the polyethylene chains and functionalized graphene in our study. Its adaptive nature ensures reliable representation of bond formation and breaking, particularly relevant for the H, CH
3, and C
2H
5 functional groups attached to graphene. This potential has been widely validated in graphene–polymer systems, such as in Luo and Lloyd [
18] and Razzaghi et al. [
23], making it well suited for investigating thermal transport in our nanocomposites. The Lennard–Jones potential function was employed to describe the nonbonding interactions between 2D nanostructures and polyethylene atoms. The representation of the Lennard–Jones coefficients can be found in
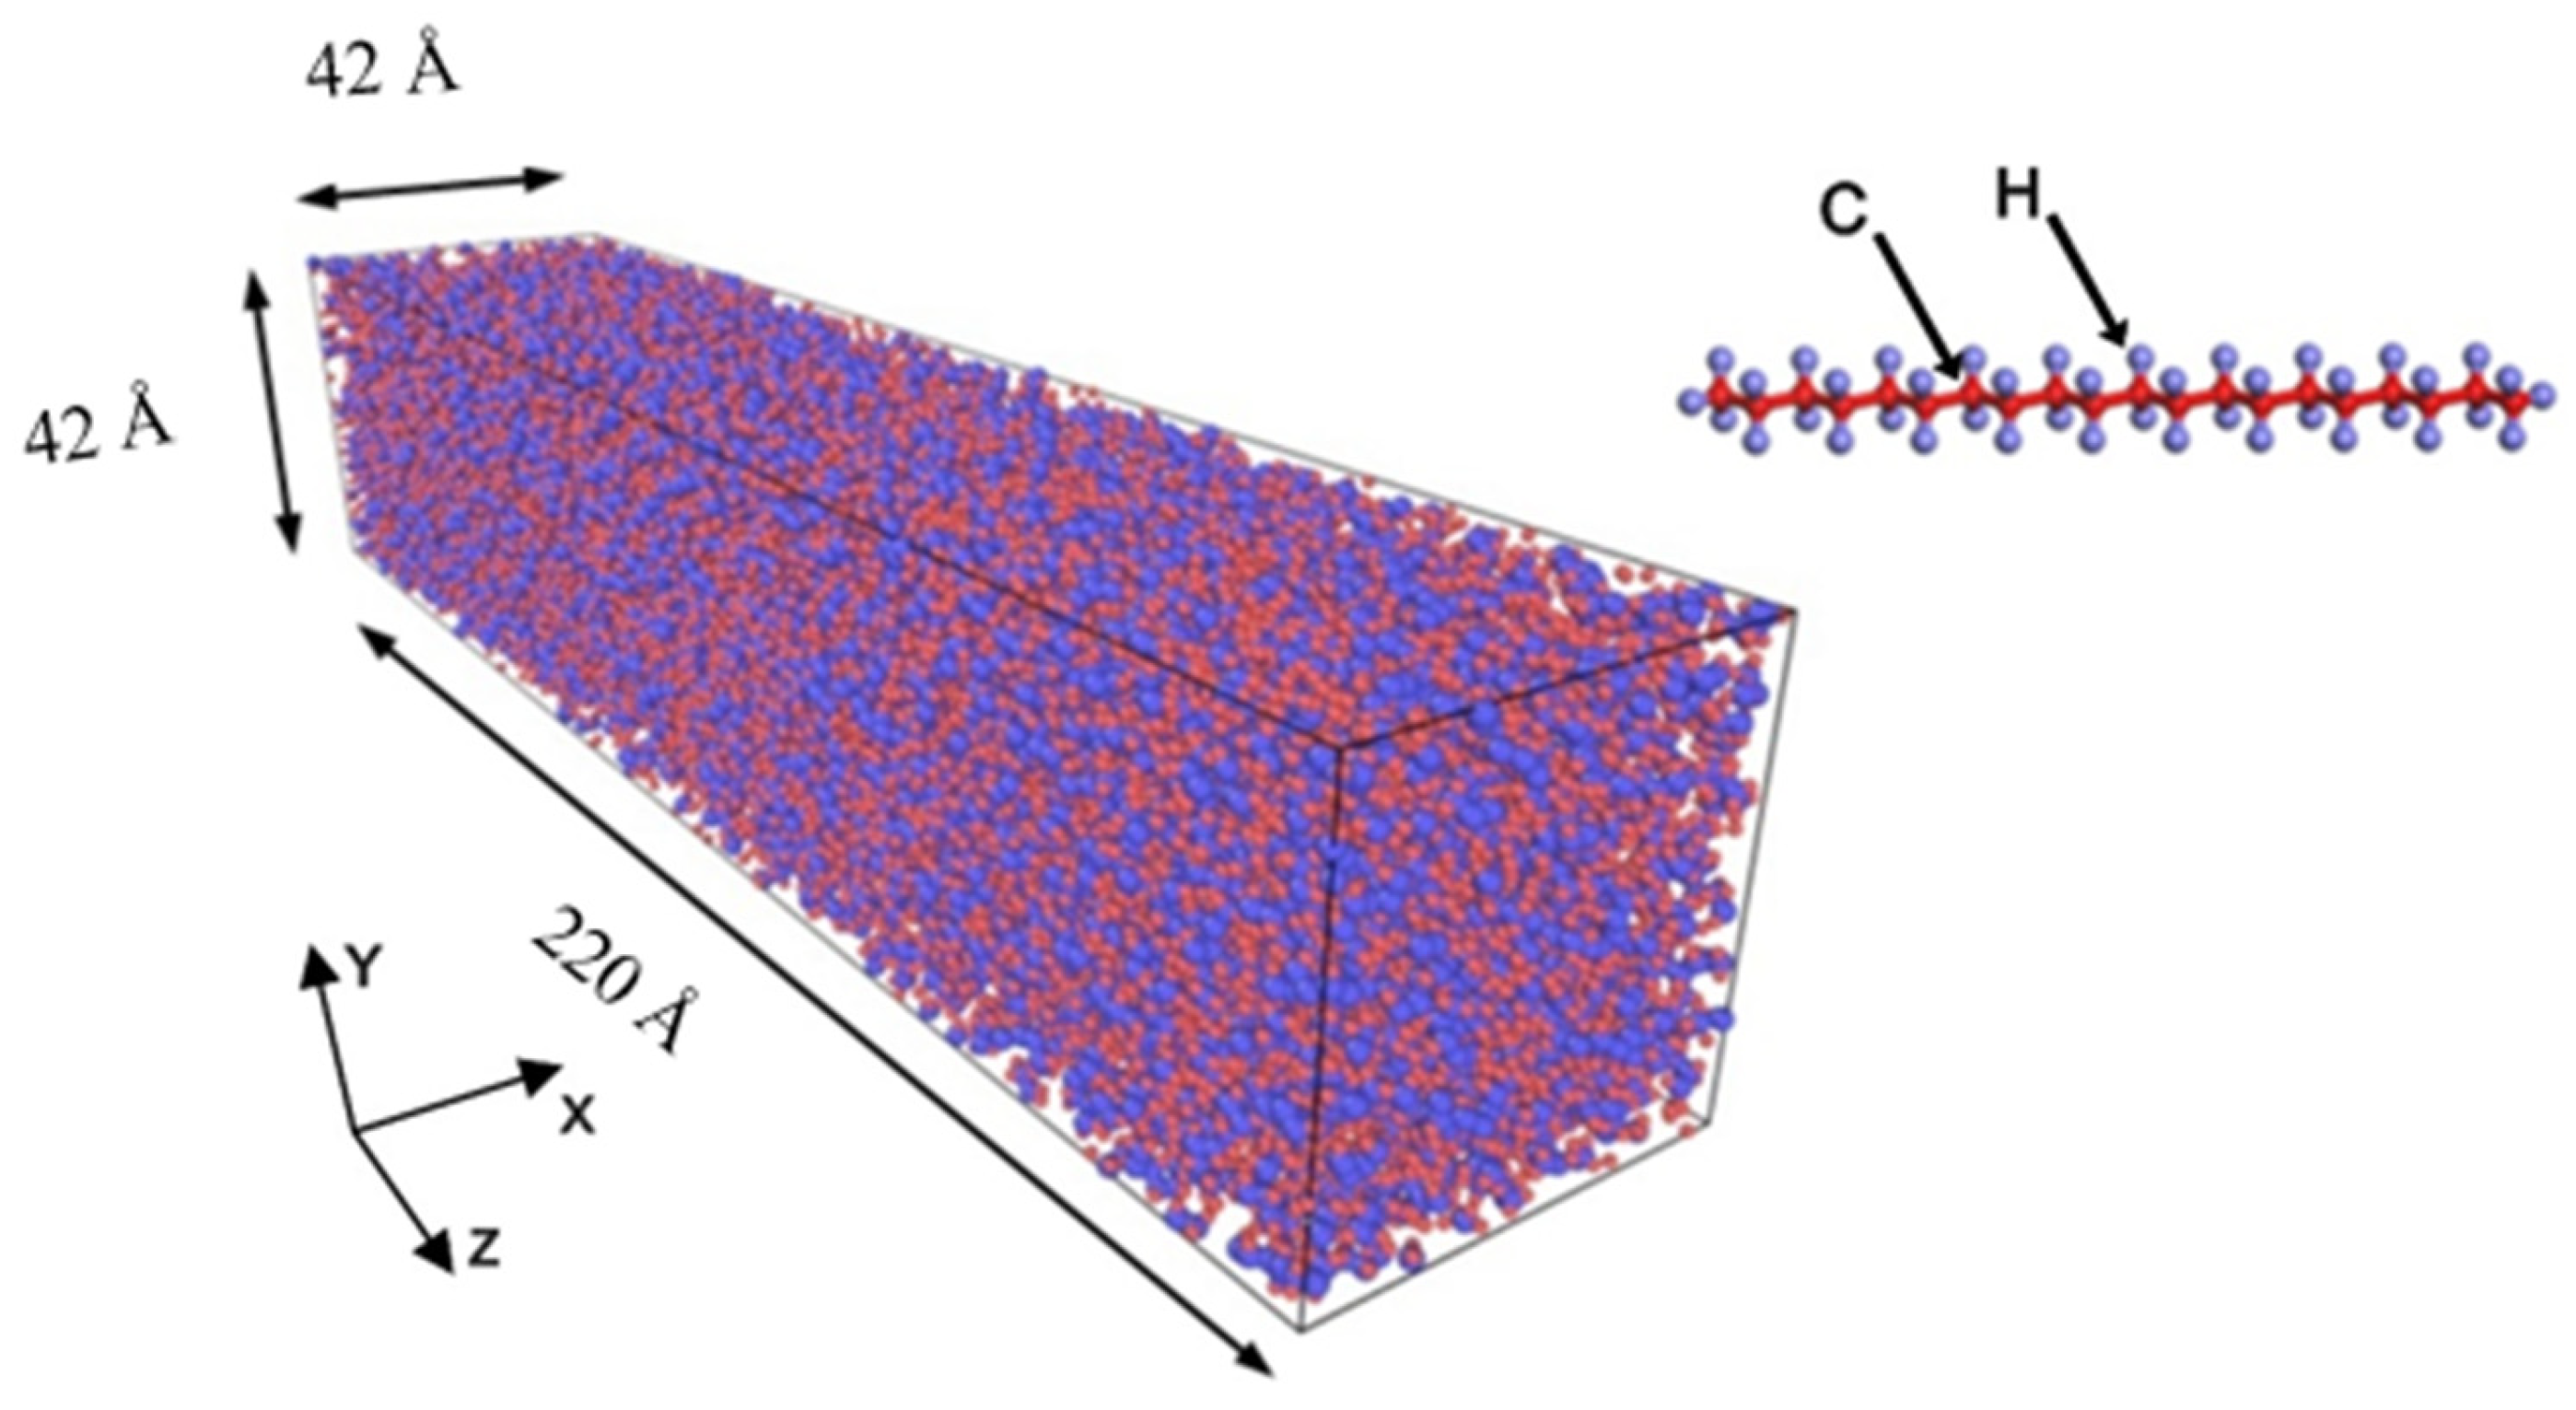
Table 1. In this study, we focused on investigating the thermal transport in polyethylene polymer. To do so, we constructed a rectangular cubic box with dimensions of 42 × 42 × 220 Å in the x-, y-, and z-directions, respectively, as shown in
Figure 1. This simulation box was then used to calculate the thermal conductivity of polyethylene/graphene and polyethylene/functionalized graphene nanocomposites. Considering the density of polyethylene, which is known to reach a maximum value of 0.975 g/cm
3, the box contained a total of 152,000 atoms. To minimize the finite size effect, a periodic boundary condition was imposed in the x- and y-directions of the box. The box was partitioned into 22 slabs along the z-direction, which also corresponded to the direction of the heat flux. The two slabs at both ends were fixed to ensure the heat insulation boundary condition.
The system underwent a relaxation state lasting 500 ps at the initial stage at a temperature of 300 K. This was followed by a phase of temperature equilibration, also lasting 500 ps. The purpose of the next phase was to eliminate any stress or voids present in the randomly distributed chains of the system. An annealing process was carried out under the conditions of an NVE ensemble. During this process, the box temperature gradually increased from 300 K to 380 K, which is close to the melting point of polyethylene. This temperature increase was carried out for 200 ps. Subsequently, the temperature was decreased at the same rate, which was 0.4 K/ps. Following this, a temperature gradient was introduced to the next slabs of the system from both ends. The magnitudes of the temperature heat baths were set to 320 K and 280 K. To maintain these temperatures, a Langevin thermostat was used. Finally, the net energy transfer in the polyethylene box was computed, and a plot of this energy versus time was created. The second simulation pertains to the polyethylene/graphene nanocomposite. The initial polyethylene model was divided into two halves with a length of 110 Å each. These two halves were then placed in the previous box, with a graphene sheet positioned between them, as illustrated in
Figure 2.
To simulate the van der Waals forces between the polymer and the graphene sheet, the Lenard–Jones potentials were employed (see
Table 1). This potential ensured that the intermolecular interactions between the polyethylene and graphene were properly accounted for, allowing an accurate representation of the system’s behavior. Steps previously taken were followed again to obtain the thermal conductivity of the nanocomposite. Firstly, a relaxation process was carried out, followed by an equilibrating phase. Subsequently, an annealing process was undertaken to alleviate any initial distortions or strains. Finally, a temperature gradient imposed a non-equilibrium steady-state heat transfer.
To comprehensively investigate and analyze the influence of functionalization on the thermal conductivity of the polyethylene/graphene nanocomposite, three distinct groups were used, each possessing unique characteristics, with differing densities on both sides of the graphene sheet. These functional groups dispersed randomly, adhering to predetermined values of 5, 10, 15, 20, 25, and 30%, and covering a wide range of possibilities and variations. Karimi et al. [
41] have used these percentages to represent the functional groups on the graphene sheet within the polyethylene polymer nanocomposite. The number of functionalized groups in polyethylene composites reinforced with functionalized graphene is crucial for determining their thermal properties. It is important to fix the right balance to achieve the desired thermal performance while maintaining other desirable properties, such as mechanical strength and electrical conductivity. It is important to note that all systems underwent a simulation process of 40 million time steps. Furthermore, each system was subjected to a complete re-structuring, followed by five separate simulations. This additional step was taken to effectively mitigate and eradicate any potential influence or interference caused by randomization, thus further enhancing the overall validity and credibility of the findings.
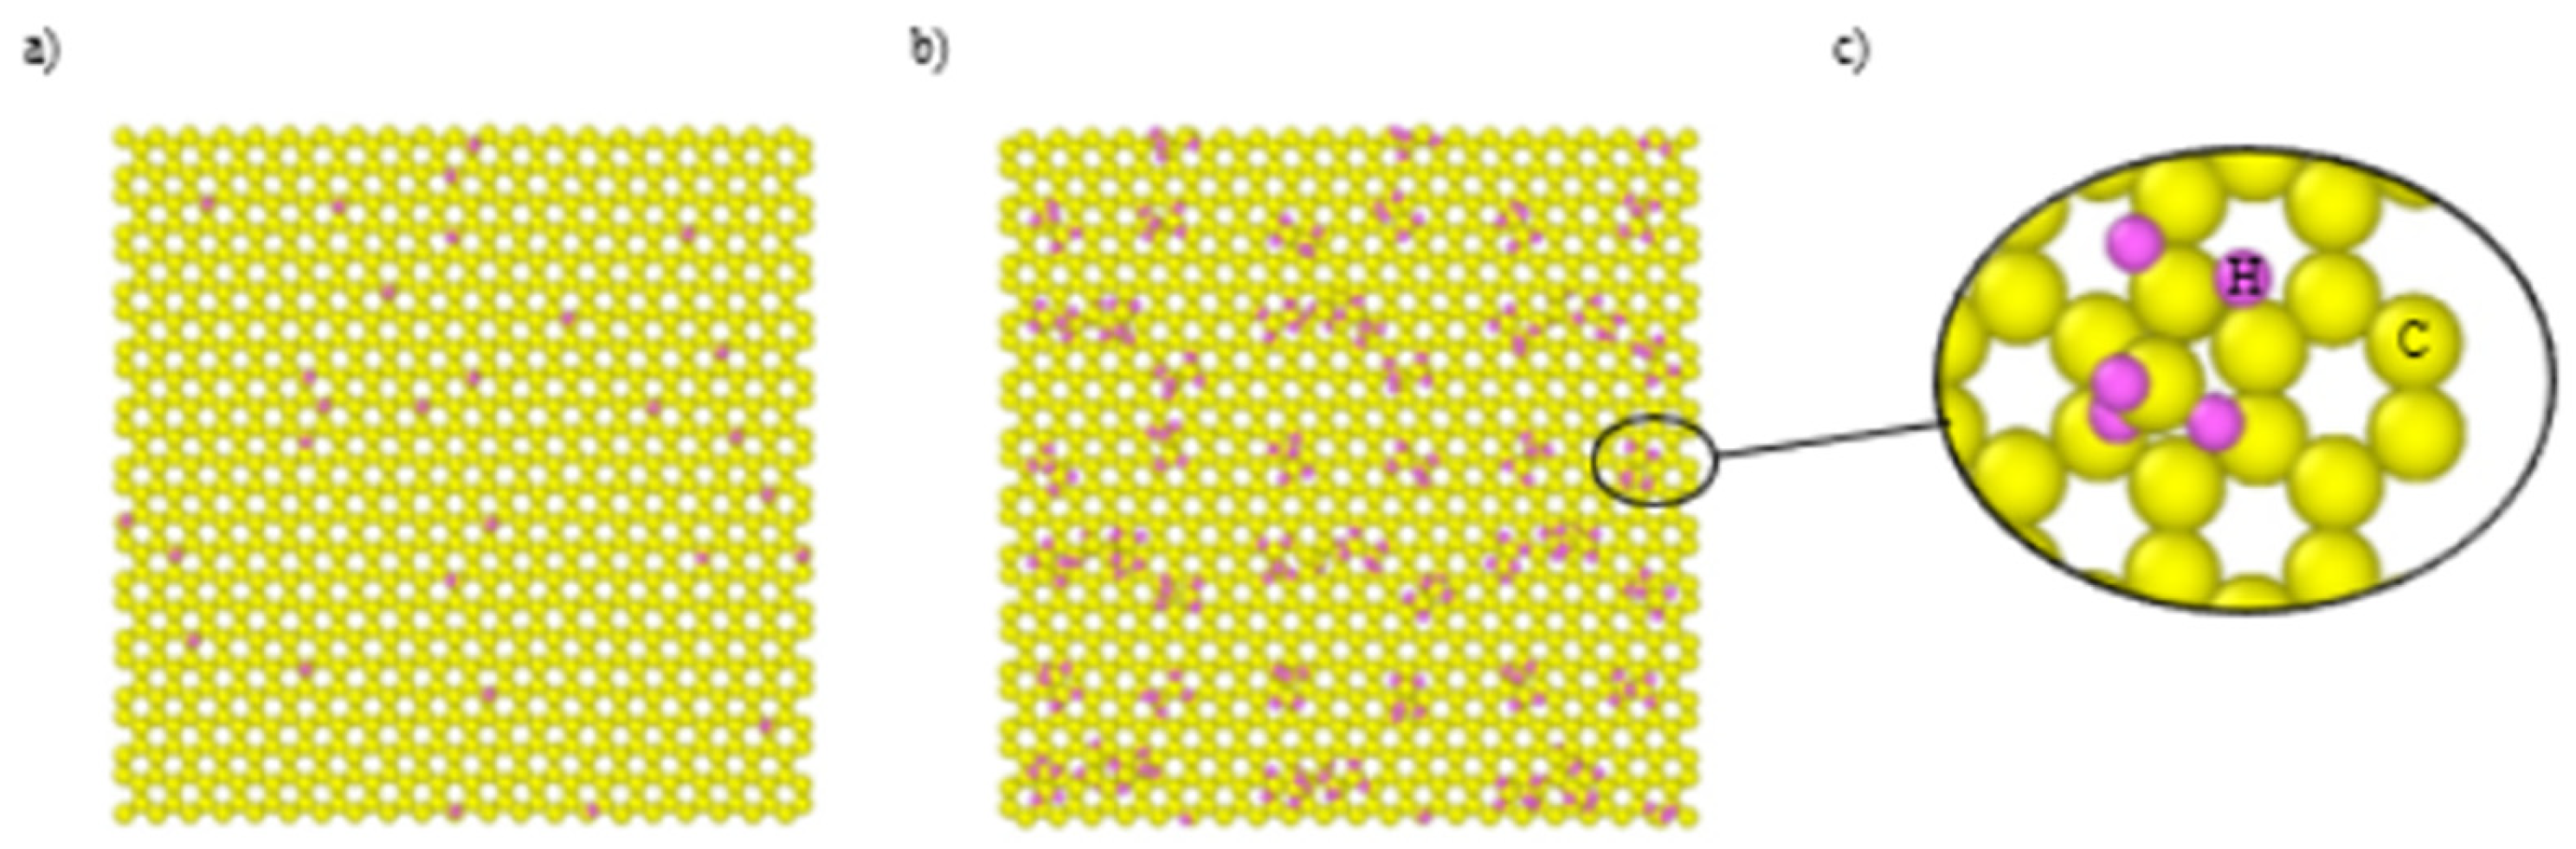
Graphane was constructed by placing the hydrogen atoms on all carbon atoms on both sides of the graphene. Next, the hydrogen atoms were randomly excluded from both sides of the graphene structure to obtain the desired volume fractions. The initial arrangement involved patterning methyl and ethyl groups to eliminate the possibility of two adjacent groups and ensure a more controlled and accurate representation. Subsequently, the remaining extra groups were randomly omitted to achieve a more reasonable arrangement. The resulting configuration in
Figure 3 presents a graphene structure with a volume fraction of functionalized groups amounting to 5%.
3. Results
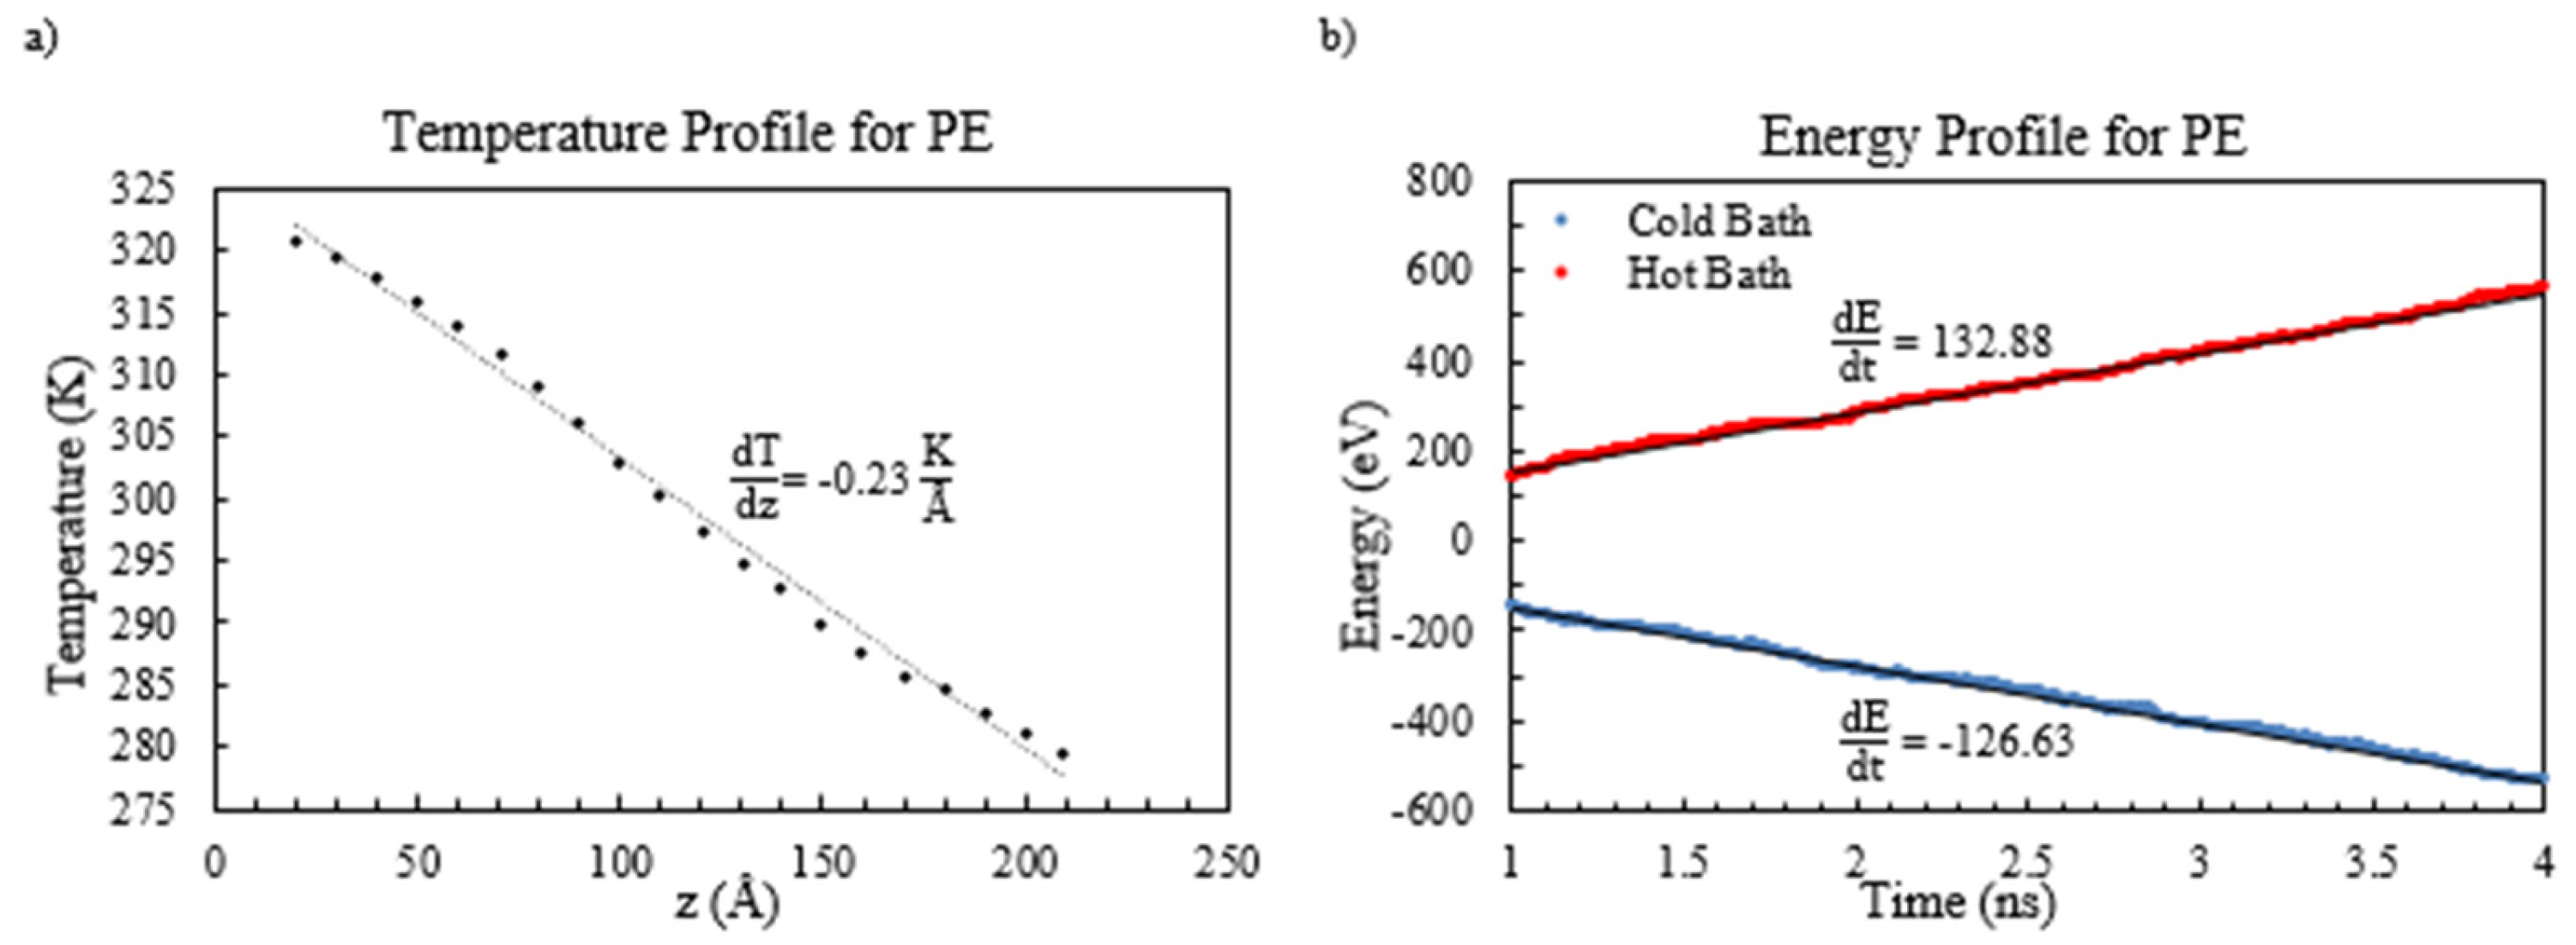
This study extensively investigated the thermal conductivity of polyethylene (PE) and PE-based nanocomposites employing molecular dynamics simulations. The impact of the functionalization of graphene sheets was also examined. The heat current was generated by establishing a temperature difference of 40 K between the hot and cold baths. It is essential to determine the thermal conductivity by measuring the input and output energy from the hot and cold baths in the steady-state heat current. These values are obtained by extracting the slope of the energy graph, which must be equal due to energy conservation. To calculate the thermal conductivity, one should consider the energy rate, the section’s surface area perpendicular to the direction of the heat current, and the temperature gradient. To visually represent the temperature profile of amorphous polyethylene,
Figure 4a shows the data obtained from one of the five trials. It should be noted that the data at the ends were deliberately omitted, as the phonon scattering caused by the hot and cold baths could significantly influence the temperature. The resulting temperature gradient, which is almost linear, exhibits a slope of −0.23 K/Å.
The energy profile depicted in
Figure 4b is visually presented for analysis. The initial 10 million steps are intentionally omitted to emphasize the steady state condition. Considering the parameters above, the average thermal conductivity of amorphous polyethylene can be determined as 0.45 W/mK. This value aligns with the thermal conductivity observed in experimental studies on high-density polyethylene (HDPE) [
43].
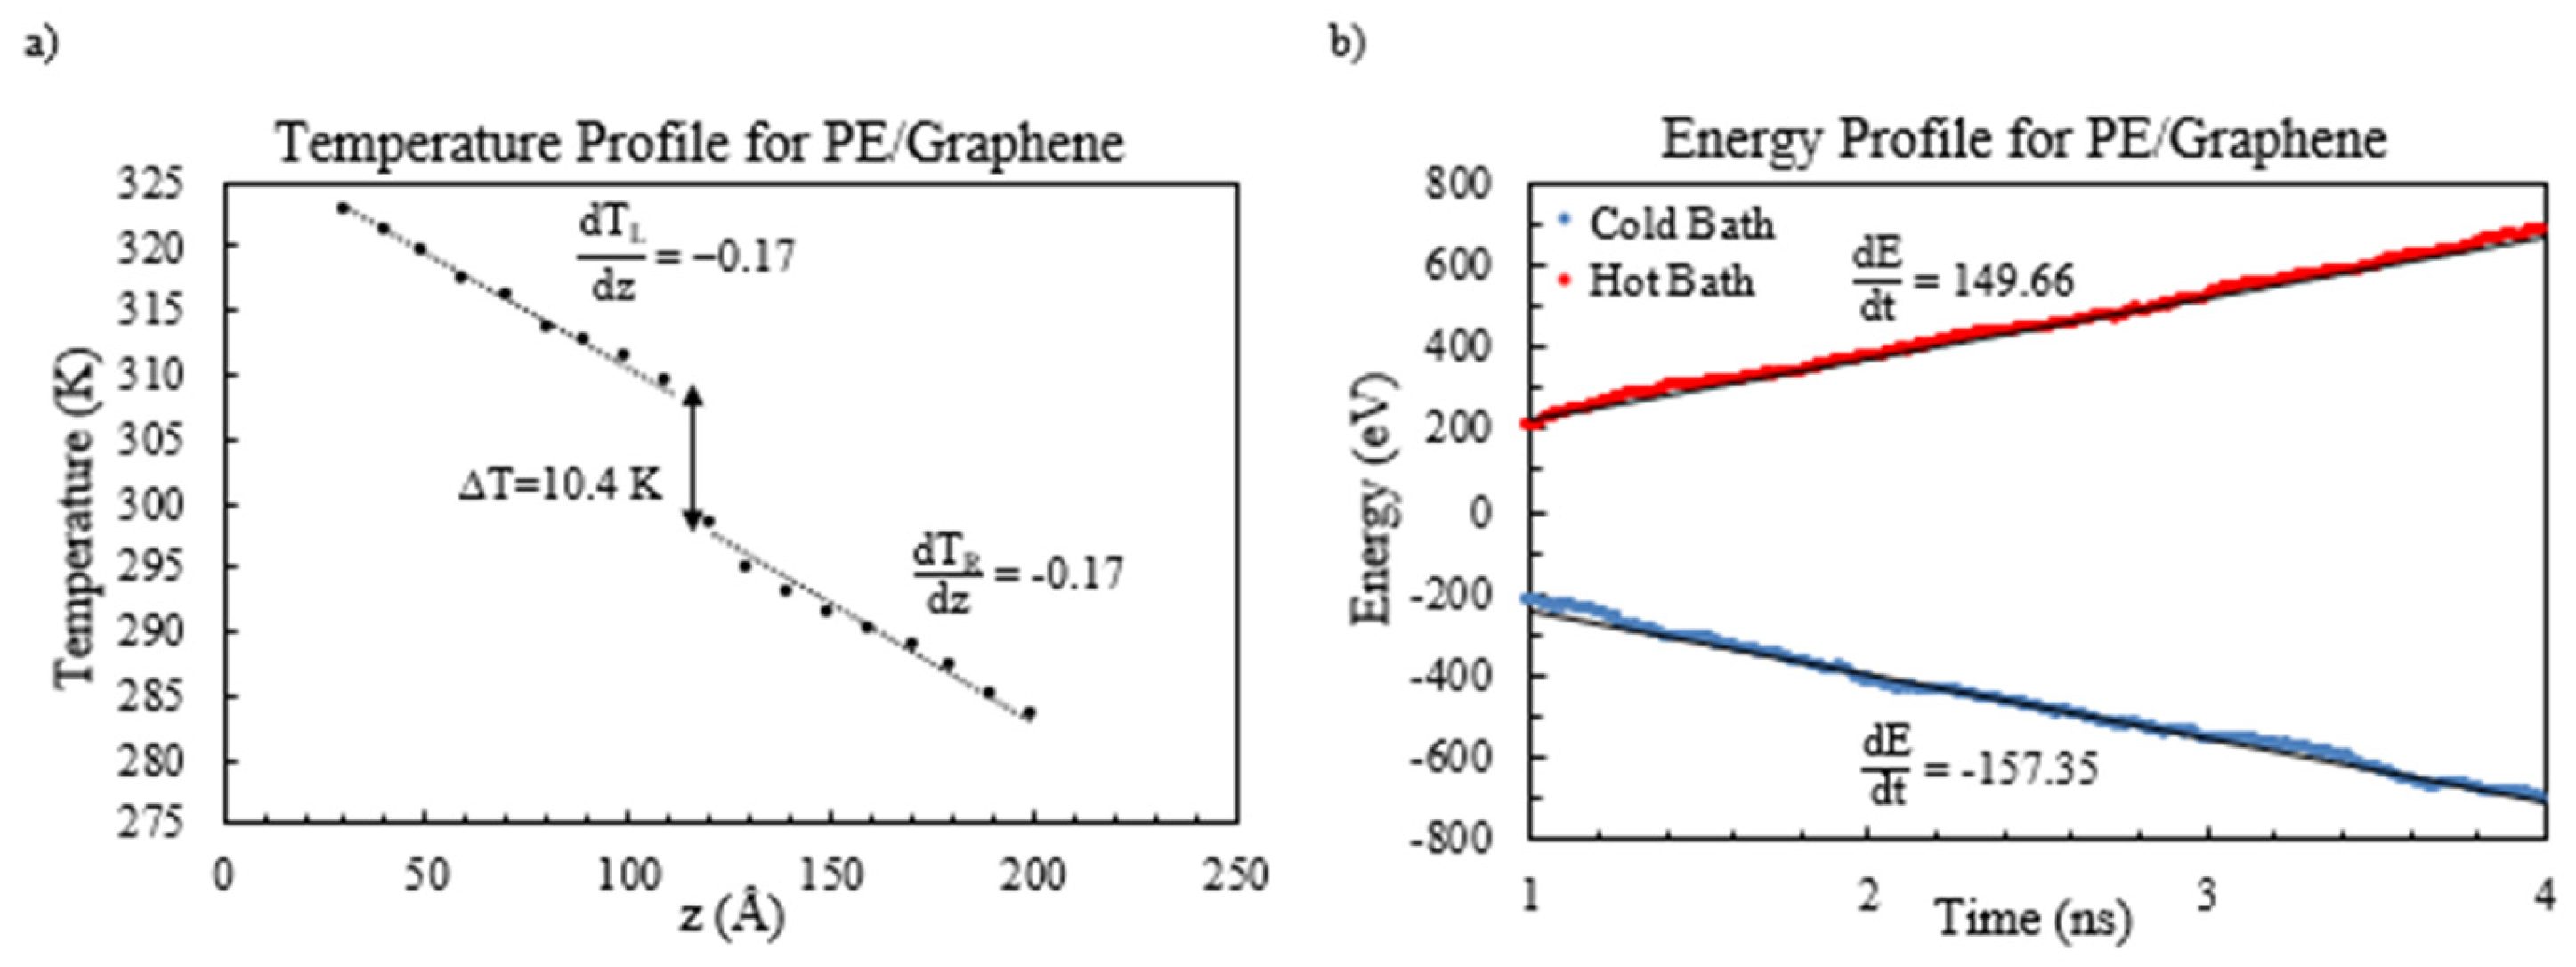
The act of incorporating a graphene sheet into the amorphous polyethylene has a direct impact on the effective thermal conductivity of the resulting nanocomposite. It has been previously mentioned that graphene sheets possess exceptionally high thermal conductivity. However, adding graphene to a polymer does not necessarily guarantee a significant increase in thermal conductivity, especially when the graphene is positioned perpendicular to the heat flux direction. The temperature profile of the PE/graphene nanocomposite is visually shown in
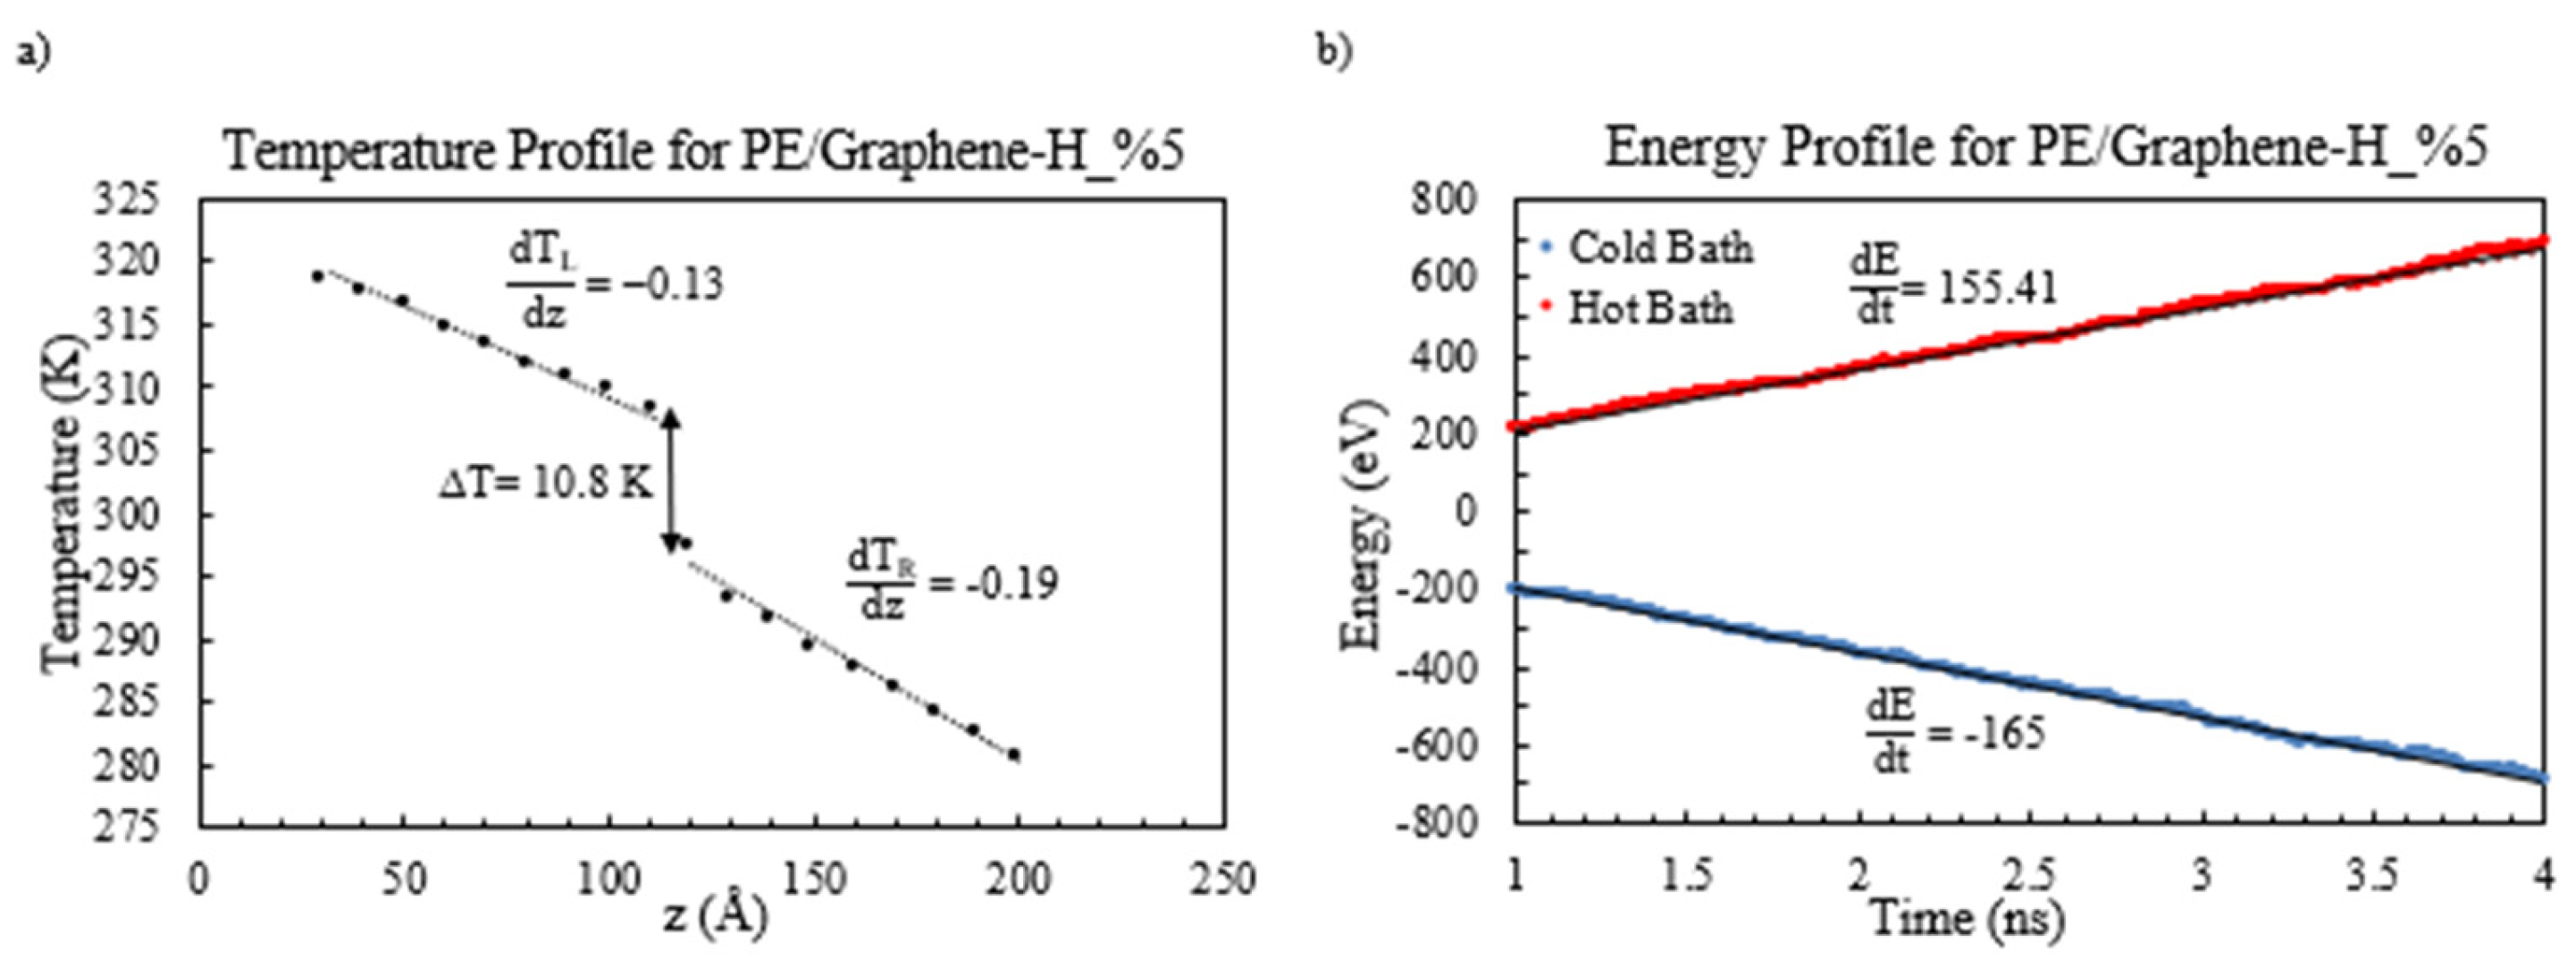
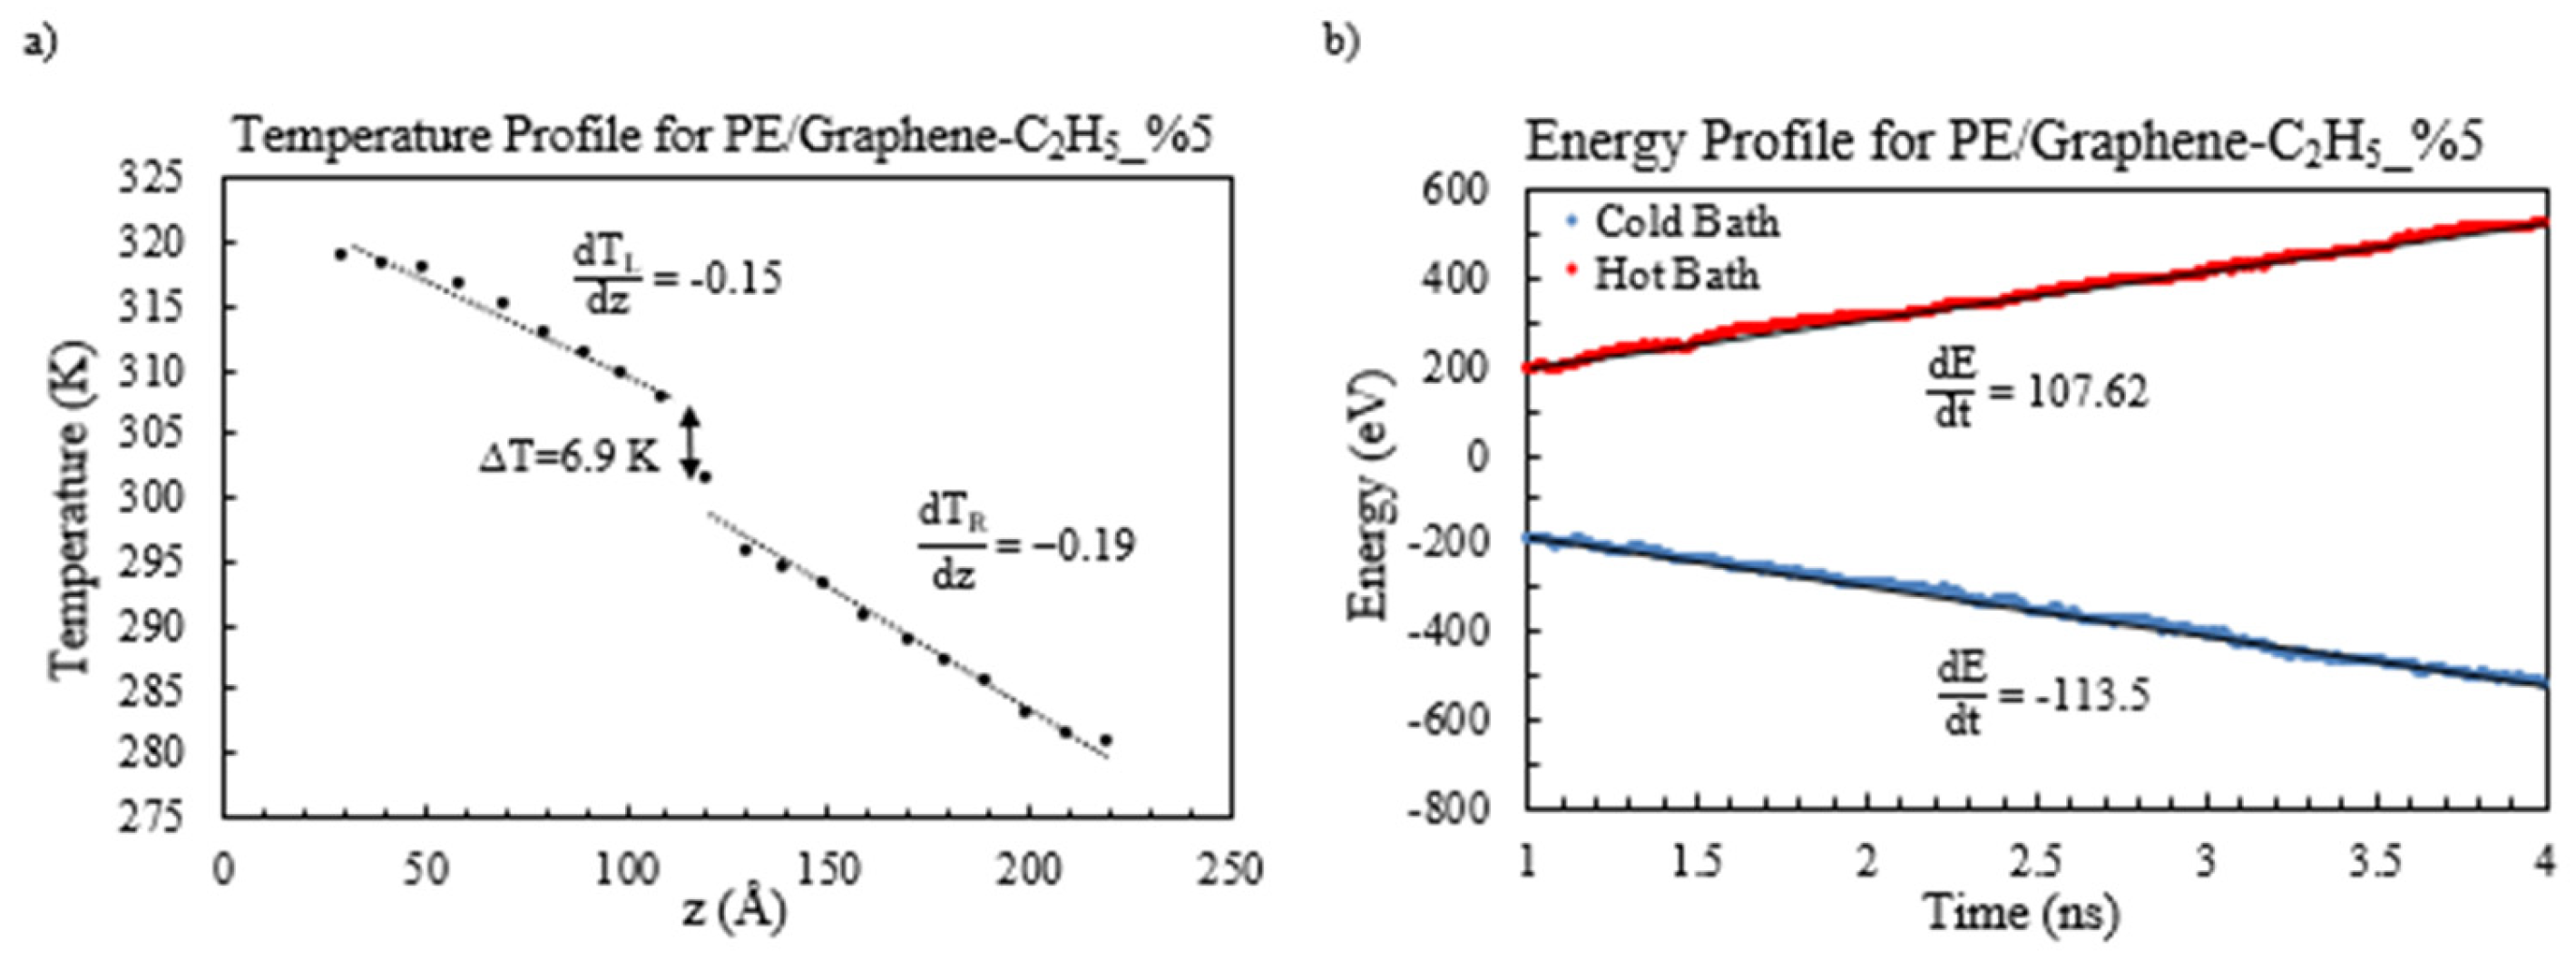
Figure 5a. Additionally, the temperature and energy profiles for the PE/functionalized graphene, specifically with a weight percentage of 5%, are visually presented in
Figure 6,
Figure 7 and
Figure 8.
The act of incorporating a graphene sheet into the amorphous polyethylene has a direct impact on the effective thermal conductivity of the resulting nanocomposite. It has previously been mentioned that graphene sheets possess an exceptionally high thermal conductivity. However, adding graphene to a polymer does not necessarily guarantee a significant increase in thermal conductivity, especially when the graphene is positioned perpendicular to the heat flux direction.
3.1. Thermal Conductivity
It is imperative to obtain an overall linear temperature gradient for calculating the PE/graphene nanocomposite thermal conductivity (as depicted in
Figure 5a). The left and right sides of the interface display a temperature gradient of −0.17 K/Å. By analyzing the temperature gradients, it is determined that the temperature jump is equal to 10.4 K. The energy profile illustrated in
Figure 5b represents the energy current flowing in the system. By calculating the average of the rates of energy transfer from both the hot and cold baths, one can derive the overall heat current as follows:
The thermal conductivity of the PE/graphene nanocomposite can be obtained as:
Having ensured statistical reliability, since each configuration was simulated five times (
Section 2), this yields was averaged for thermal conductivity and ITC. The standard deviation across these runs was ±0.02 W/mK for PE (0.45 W/mK, ~4.4% error) and ±0.01 W/mK for PE/graphene (0.36 W/mK, ~2.8% error), with ITC errors ranging from ±0.4 × 10
7 W/m
2K (~4.5% of 8.8 × 10
7 W/m
2K) for PE/graphene to ±0.1 × 10
8 W/m
2K (~4% of 2.50 × 10
8 W/m
2K) for PE/C
2H
5–graphene at 30%. These low variances affirmed the robustness and statistical significance of the reported trends, validating the findings.
The study consisted of replicating the structure of the nanocomposite five times, and this process was carried out for each of the structures and each nanocomposite. The average thermal conductivities were collected and are presented in
Figure 9. The obtained results demonstrate a significant decrease in the thermal conductivity of the PE/graphene nanocomposite, specifically by 20% compared to the pure base polymer. This result implies that the graphene material acts as a thermal barrier, limiting the heat flow in the polymer.
Having observed a counterintuitive 20% reduction in thermal conductivity from 0.45 W/mK for pure PE to 0.36 W/mK for PE/graphene (
Figure 9), this study probed the underlying mechanisms. This decrease, having contradicted expectations given graphene’s high intrinsic conductivity (~2000–5000 W/mK), resulted primarily from enhanced phonon scattering at the PE–graphene interface rather than poor interfacial bonding alone. The perpendicular graphene orientation, having disrupted phonon transmission along the heat flux direction (z-axis), created a thermal barrier, as evidenced by the temperature jump of 10.4 K (
Figure 5a). VDOS analysis (
Section 3.2), having shown significant mismatch between PE and pristine graphene (Figure 11), confirmed that phonon scattering dominated, aligning with Swartz and Pohl [
20] on interfacial resistance. Functionalization, having mitigated this effect (e.g., 0.42 W/mK with 30% H-coverage), underscored the critical role of interfacial phonon dynamics in dictating composite performance.
As can be inferred and deduced from
Figure 9, it is clear that the process of functionalization involving the introduction of hydrogen onto the graphene material yielded improvements in its thermal conductivity properties. Including a 5% hydrogen content resulted in an increase of approximately 4.7% in effective thermal conductivity compared to the counterpart composite containing non-functionalized graphene. Moreover, it is noteworthy to mention a direct correlation between the concentration of hydrogen incorporated into the graphene sheet and the thermal conductivity enhancement. This positive relationship is highlighted by the fact that as hydrogen concentration increases from 5% to 30%, the effective thermal conductivity of the composite material experiences a progressive rise. However, it is also essential to highlight that the positive impact of functionalization on thermal conductivity becomes less pronounced as the concentration of hydrogen surpasses the threshold of 15%. In fact, for values exceeding this concentration, the increase in thermal conductivity concerning the previous concentration becomes virtually negligible. Importantly, this pattern of diminishing returns also applies to the scenario of functionalization with the methyl group.
To assess the validity of our simulation results, we compared them with experimental data from the literature. The calculated thermal conductivity of amorphous polyethylene (PE) at 0.45 W/mK agrees well with experimental values for high-density polyethylene (HDPE), such as 0.43–0.47 W/mK reported by Ye et al. [
43], confirming the reliability of our NEMD approach. However, the 20% reduction to 0.36 W/mK in the PE/graphene nanocomposite contrasts with experimental enhancements (e.g., ~2 W/mK by Shahil and Balandin [
12]) where graphene is aligned parallel to the heat flux. This discrepancy arises from our perpendicular graphene orientation, which increases interfacial resistance, consistent with the theoretical predictions by Luo and Lloyd [
18]. For functionalized graphene, the maximum thermal conductivity of 0.42 W/mK (17.4% increase over PE/graphene at 30% H-coverage) remains 6.5% below that of pure PE, aligning with observations by Burger et al. that nanofillers often reduce effective conductivity unless optimally configured [
2]. These comparisons validate our findings while highlighting the role of graphene orientation and functionalization.
The results obtained for the PE/graphene material functionalized with methyl and ethyl groups exhibit a remarkable similarity. Upon closer examination, it is clear that the ethyl group demonstrates slightly more favorable outcomes, particularly when the concentrations are higher. It is worth mentioning, however, that these results fall short of those achieved through the functionalization process with hydrogen, with the latter yielding a 10% higher value in thermal conductivities (specifically at a concentration of 5%). Consequently, it is reasonable to assert that the functionalization with hydrogen resulted in higher levels of thermal conductivity. As the concentration increases, the thermal conductivity also experiences an upward trajectory. Conversely, the thermal conductivity is lower than that of non-functionalized graphene for lower quantities of methyl and ethyl groups. The functionalization with lower concentrations of these groups has a detrimental effect on the PE/G nanocomposite. We specifically note that the practical implementation of high concentrations of functionalization groups on graphene sheets is not feasible. In general, exceeding a concentration threshold of 30% does not yield any enhancements in material properties, as it is observed that the functionalization groups begin to distort the geometry and structure of the graphene sheet. This observation aligns with the results mentioned above, where it becomes apparent that the improvements diminish as the concentrations increase further.
Yang et al. [
27] confirmed that GO’s conductivity drops significantly (e.g., to ~1–2 W/mK) due to disrupted phonon transport. However, our study shows an increase in the nanocomposite’s effective thermal conductivity (e.g., 17.4% to 0.42 W/mK with 30% H-coverage,
Figure 9) and ITC (up to 250% with C
2H
5,
Figure 10). This enhancement stems from improved interfacial bonding and vibrational coupling (Figure 14), which outweigh the intrinsic reduction in graphene’s conductivity reported by Chien et al. [
22] (~40% drop with H-functionalization). Unlike GO, where defects dominate in-plane transport, our perpendicular heat flux configuration prioritizes interfacial effects, consistent with Zhang et al. [
15], who observed a 6.22-fold ITC increase with hydrogenated graphene. At 30% coverage, while structural distortion may limit further gains, the interfacial benefits drive the observed trends.
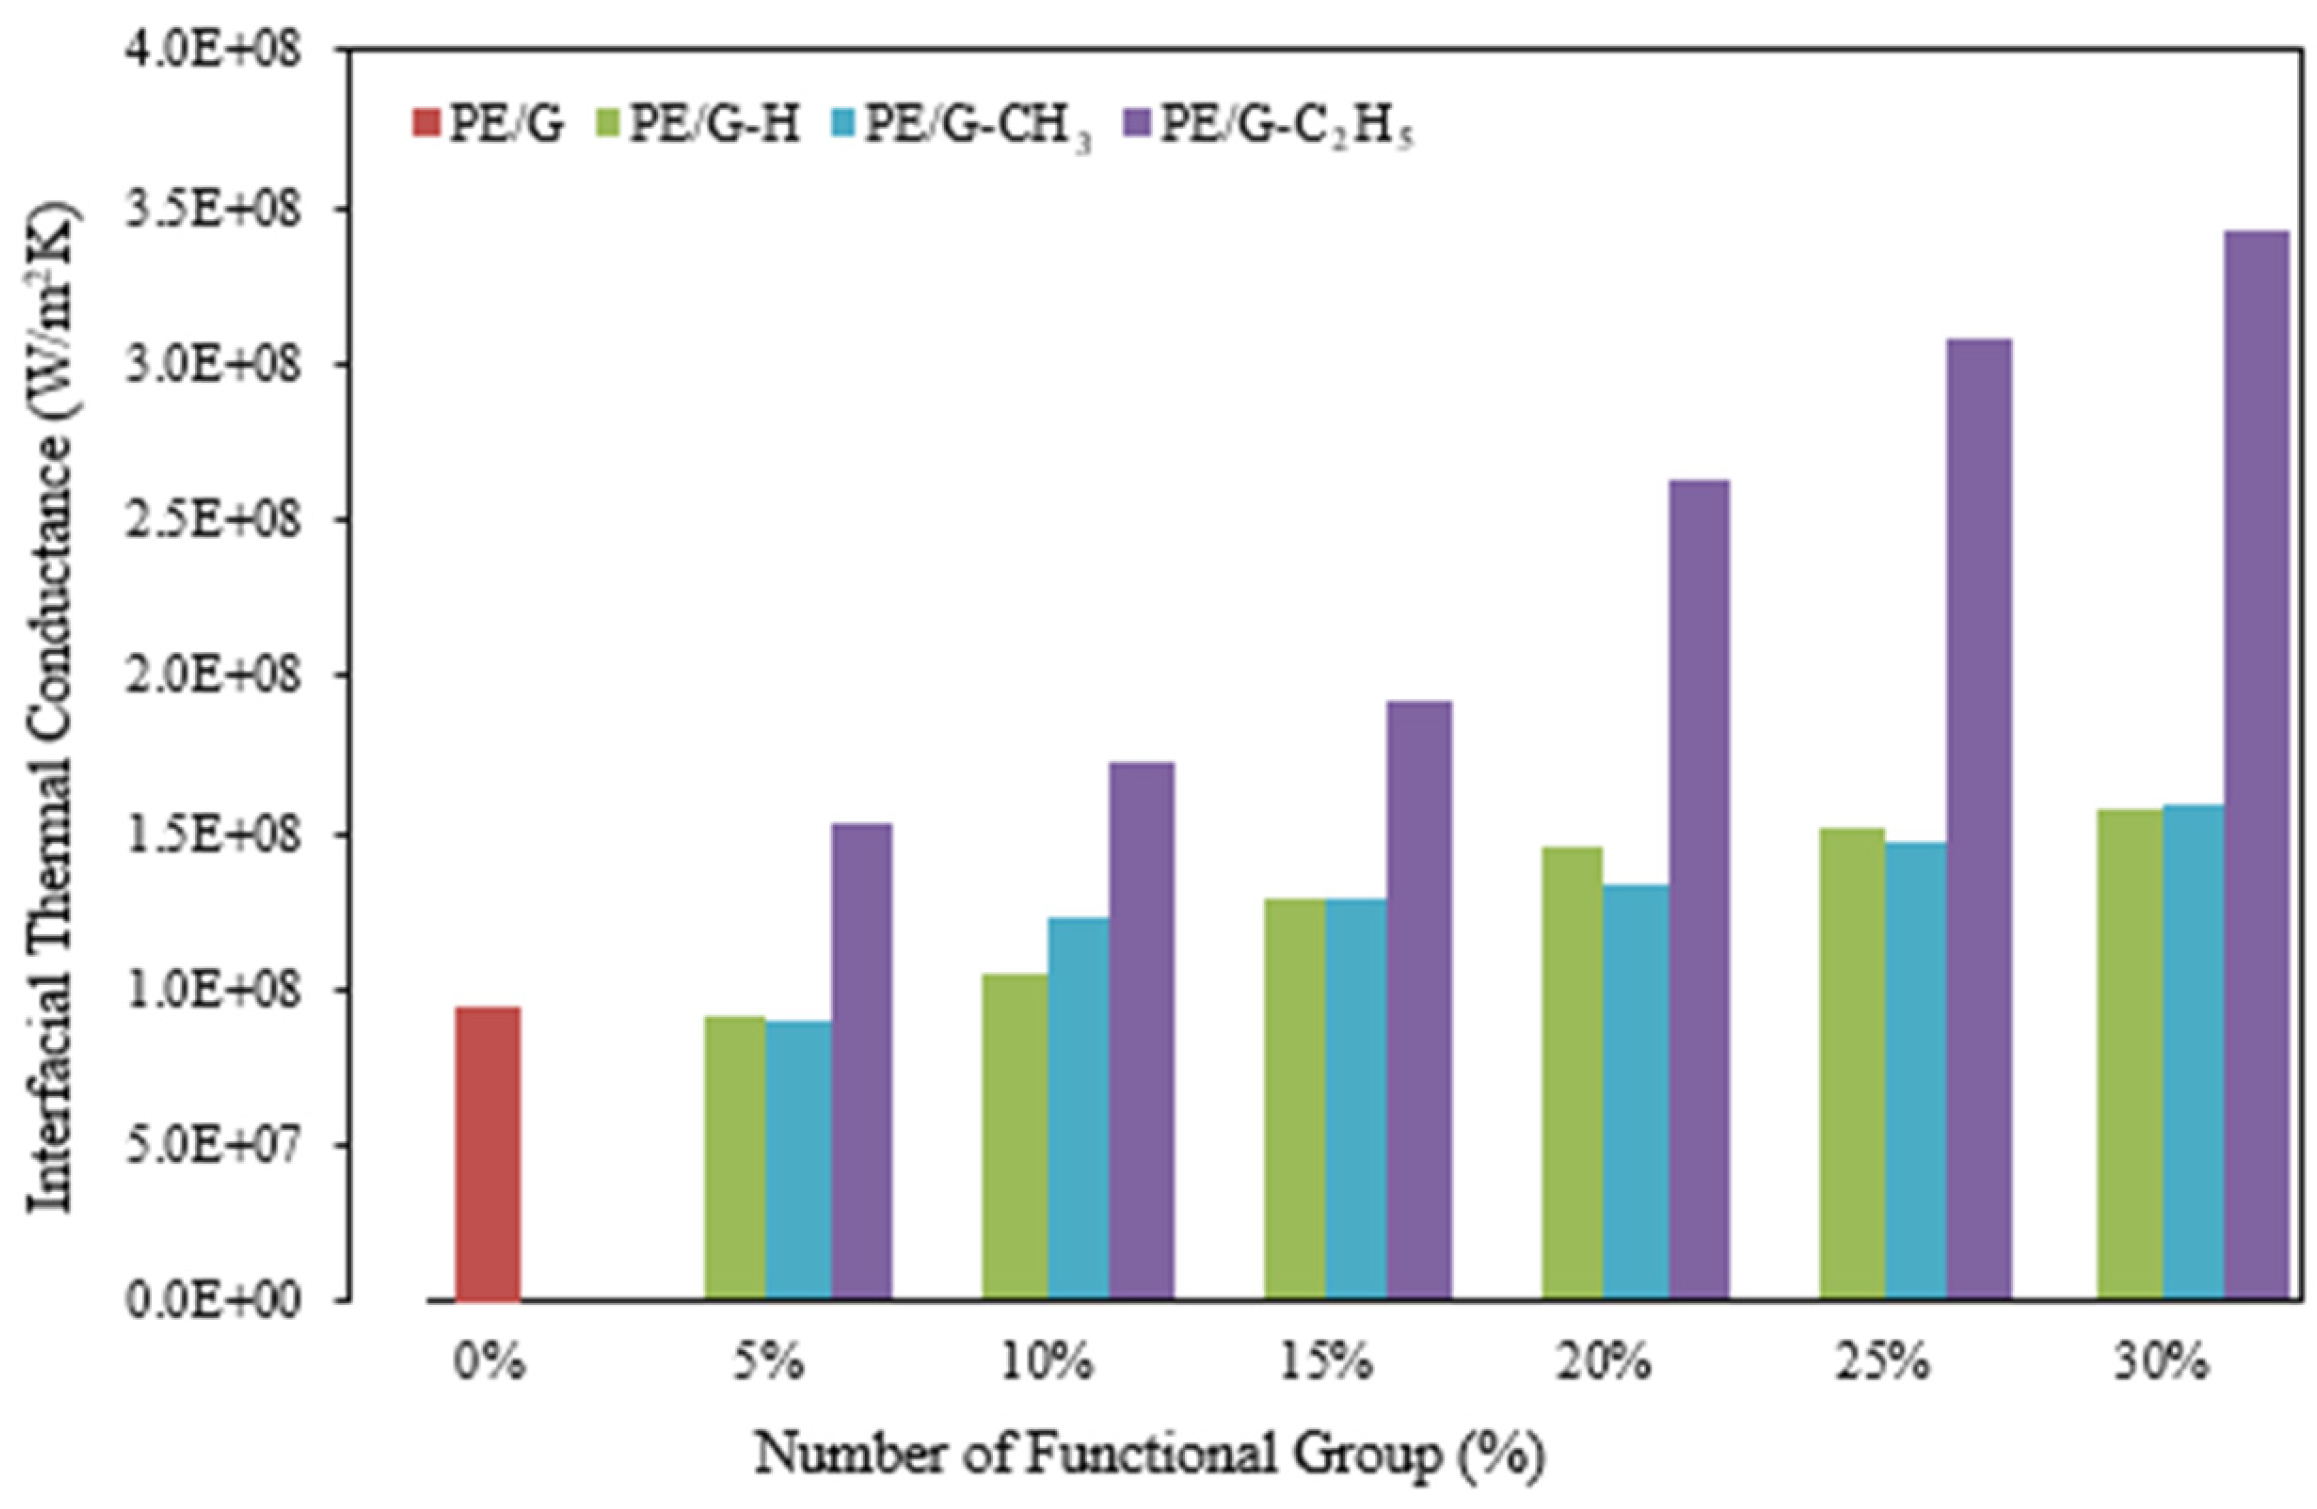
3.2. Interfacial Thermal Conductance
The investigation of thermal conductivity allows for an overall assessment of the nanocomposite’s capacity to transfer heat energy effectively. To gain a profound understanding of the thermal behavior exhibited by the material at the interface between the base polymer and nanosheet, as well as the interface structure’s capability to transport energy, it becomes imperative to delve into the study of interfacial thermal conductance (ITC) and its reciprocal counterpart, interfacial thermal resistance (ITR). Employing the non-equilibrium molecular dynamics (NEMD) method, the values corresponding to ITC within the diverse range of nanocomposites under examination in the present study are derived and subsequently presented in
Figure 10. For example, the interfacial thermal conductance (G) between PE and graphene can be found by dividing the rate of energy transfer to the temperature jump, both obtained from one out of five trials:
Having revealed a pronounced dependence on functionalization, the ITC results in
Figure 10 show values having risen from 8.8 × 10
7 W/m
2K for pristine PE/graphene to 2.50 × 10
8 W/m
2K for PE/C
2H
5–graphene at 30% coverage—a 250% enhancement. This trend, having reflected the increased density of covalent bonds at the interface, strengthened vibrational coupling and reduced phonon scattering, as corroborated by the VDOS overlap in Figure 14. Ethyl groups, having outperformed H and CH
3 due to their larger molecular structure, facilitated greater energy transfer, consistent with Zhang et al. [
15], who reported a 6.22-fold ITC increase with hydrogenated graphene. The saturation beyond 15% coverage, having suggested a balance between bond formation and structural distortion, aligned with Liu et al. [
28] on interface optimization. These findings, having underscored functionalization’s role, tailored interfacial heat transfer for practical nanocomposite applications.
As depicted in the figure mentioned above, it is evident that the process of functionalizing graphene exhibits an affirmative influence on the interfacial thermal conductance of the nanocomposites. It is important to note that the impact of the ethyl group functionalization agent surpasses that of the other two functionalization agents. Once again, it should be emphasized that by augmenting the volume concentration of the functional groups, there is a growth in the interfacial thermal conductance.
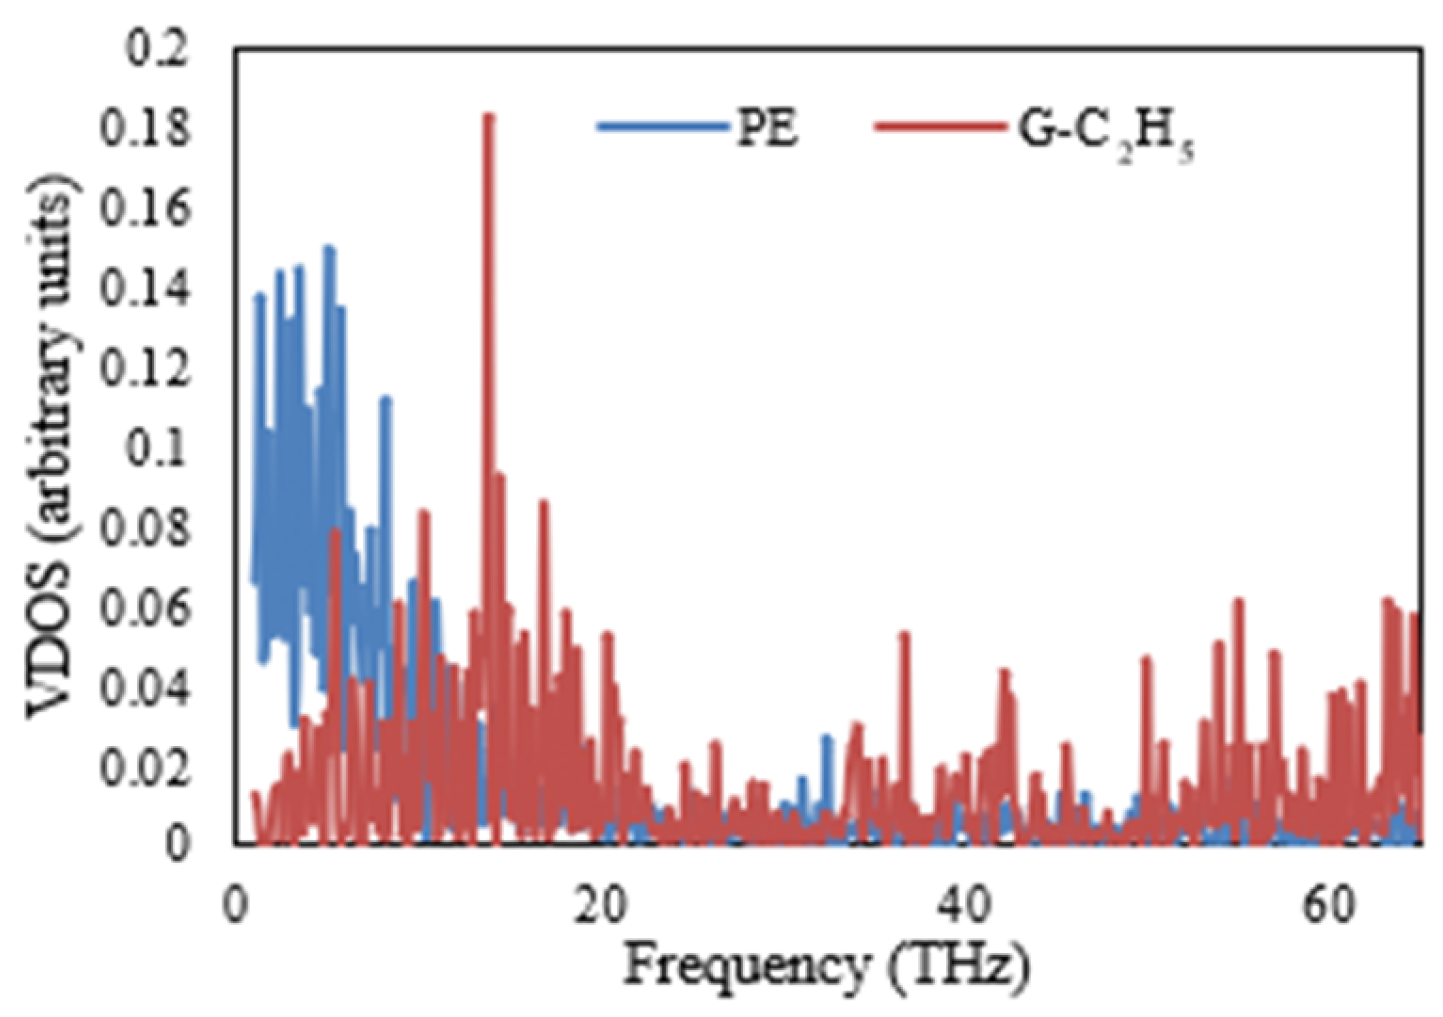
Having briefly mentioned phonon mismatch earlier, this analysis expanded its role in thermal transport. The significant VDOS disparity between PE and pristine graphene (
Figure 11), having indicated poor vibrational coupling, explained the baseline ITC of 8.8 × 10
7 W/m
2K. Functionalization, having aligned the vibrational modes—most notably with C
2H
5 (Figure 14)—boosted ITC to 2.50 × 10
8 W/m
2K at 30% coverage, a 250% enhancement (
Figure 10). This reduction in phonon mismatch, having facilitated energy transfer across the interface, highlights the ethyl groups’ superior coupling efficiency over H and CH
3, consistent with Gordiz and Henry [
21] on interfacial phonon modes. Such insights, having clarified the mechanism behind thermal barrier mitigation, emphasize functionalization’s potential to optimize nanocomposite heat dissipation.
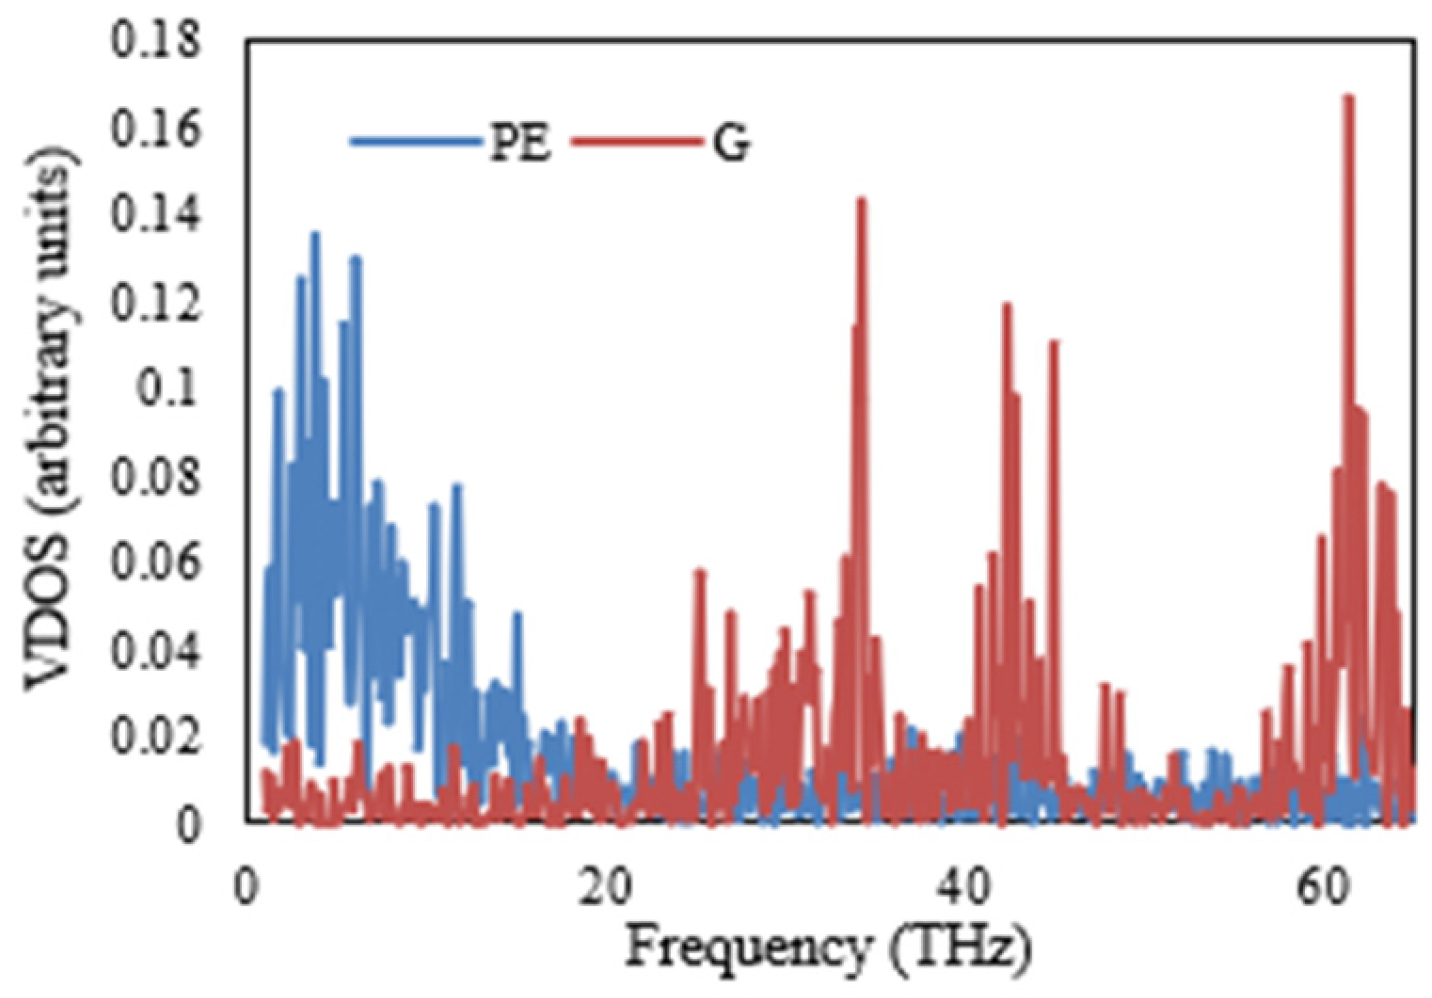
The quantity of chemical bonds that are generated at the interface has a significant impact on the interfacial thermal conductance between two materials. The addition of more bonds further magnifies the influence of these bonds. Examining the PE/functionalized-nonfunctionalized graphene composite models is expected to reveal more covalent bonds between the functionalized graphene and PE and a decrease in phonon scattering at the interfaces. This decrease can be attributed to the enhanced interfacial compatibility and strong interfacial interactions facilitated by the covalent bonds. As a result, the thermal conductance of the samples is enhanced. This phenomenon ultimately establishes vibrational coupling between the distinct constituents of the composite. Calculations are performed for the vibrational density of states (VDOS) for atoms at the interface to determine the vibration modes of the materials at the interface. To gain a more comprehensive understanding of the physical phenomena, the VDOS is obtained through the calculation of the Fourier transform of the atomic velocity autocorrelation function (VACF), which specifically pertains to the velocities of the atoms during an NVE ensemble run:
The parameters mj, vj, and ω represent the mass, velocity, and angular frequency of the atom j, respectively. It is well established that discrepancies in the vibrational characteristics of materials that are in contact with each other play a significant role in the transport of phonons across the interfaces between these materials. When there is a high level of overlap in the VDOS of the materials on both sides of an interface, it is indicative of a strong vibrational coupling between the two materials. This strong coupling then leads to a situation where any disparities or differences in the behavior of phonons at the interface are minimized or reduced, resulting in reduced thermal resistance in that specific interface region. Therefore, by comparing the degree of overlap between the VDOSs for specific frequency ranges, we can gain insightful information about the thermal transport that occurs across interfaces in a nanocomposite system.
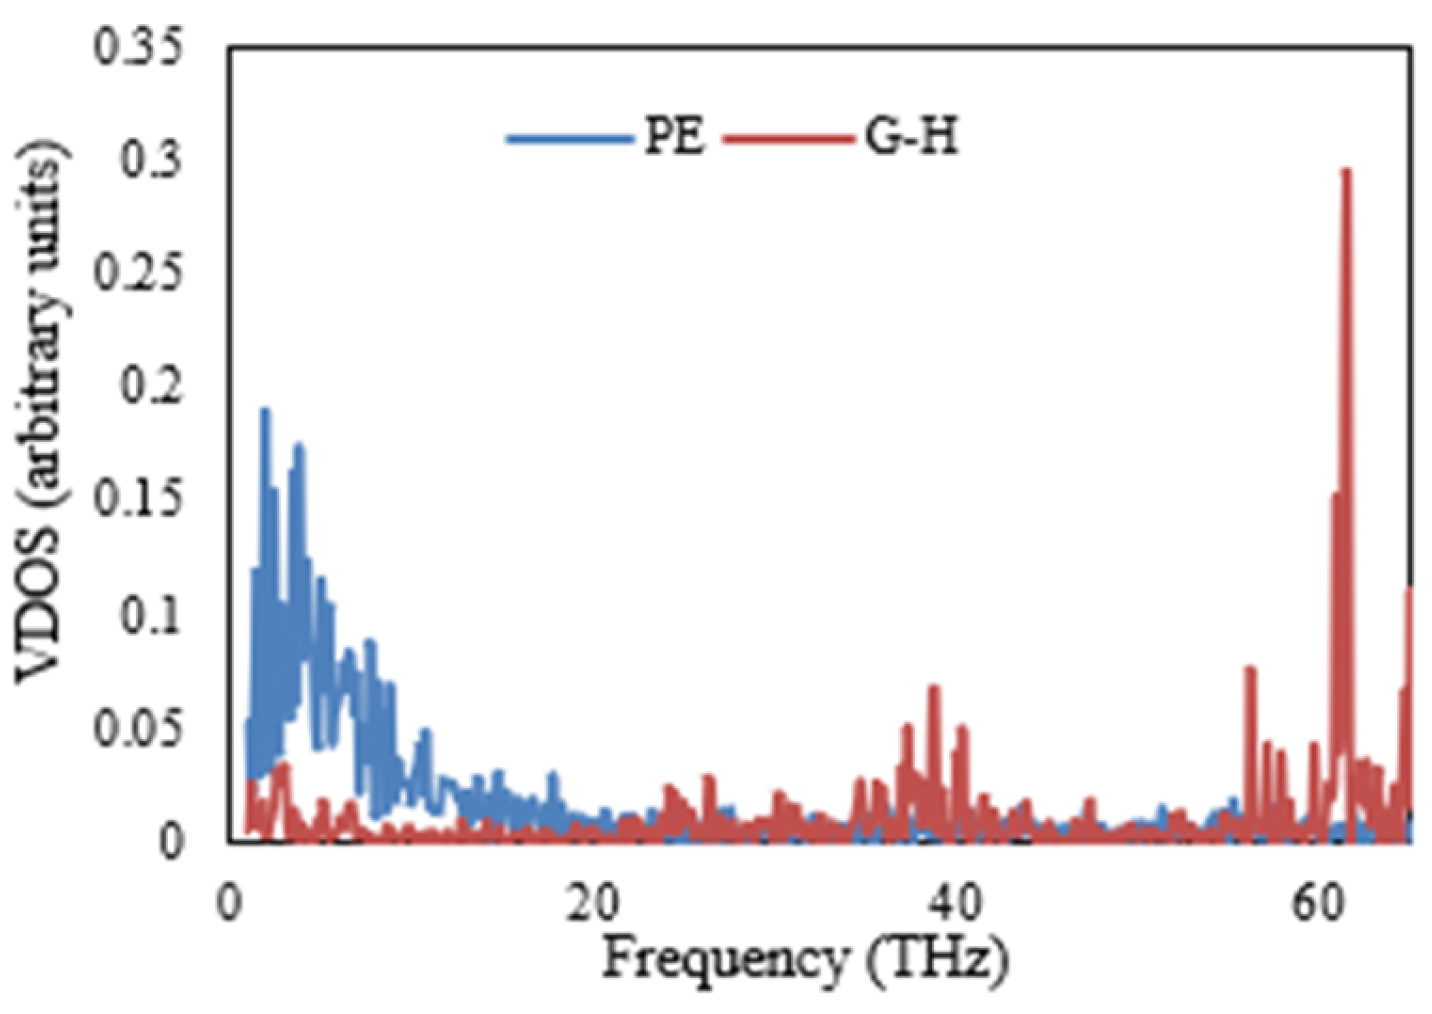
The VDOSs of the PE and various nanocomposites are illustrated in
Figure 11,
Figure 12,
Figure 13 and
Figure 14. Specifically,
Figure 11 shows a significant discrepancy between the vibrational modes of the PE/G nanocomposite. This finding is repeated in
Figure 12 and
Figure 13, illustrating the VDOS of the PE/G-H and PE/G-CH
3, respectively. In these figures, it is apparent that there is a poor coupling or connection between the materials at the interface, as indicated by the significant mismatch in vibrational modes. On the other hand,
Figure 14 presents the VDOS of the PE/G-C
2H
5, and in this figure, it is observed that there is a close matching between the vibrational modes at the interface of these materials. This finding is in accordance and agreement with the results of the interfacial thermal conductance, as shown in
Figure 10, which demonstrates that the interfacial thermal conductance of the PE/G-C
2H
5 nanocomposite is higher than that of the PE/G, PE/G-H, and PE/G-CH
3 nanocomposites.
4. Conclusions
In this study, we examined the thermal properties of various nanocomposites derived from polyethylene. These properties were calculated through molecular dynamics simulations. To achieve this, graphene, a two-dimensional allotrope of carbon with remarkable mechanical and thermal properties was subjected to functionalization with three distinct agents, namely hydrogen (H), methyl (CH3), and ethyl (C2H5). The functionalized graphene was placed in the polyethylene matrix. The inclusion of each functionalization group was tested across six different volume concentrations within the nanocomposites. This comprehensive investigation aims to shed light on the intricate interplay between the functionalization agents and the resultant thermal properties exhibited by the nanocomposites.
The effective thermal conductivity of amorphous polyethylene (PE), PE/graphene, and PE/functionalized graphene was determined through the implementation of the non-equilibrium molecular dynamics (NEMD) method, which is a well-established computational technique used to study heat transfer in materials. The AIREBO potential was employed to calculate the interactions between carbon and hydrogen atoms. Notably, the amorphous polyethylene utilized in this study was assumed to have a high density. The thermal conductivity of amorphous polyethylene was calculated and determined to be 0.45 W/mK.
We showed that the introduction of graphene into the base polymer (PE) significantly impacted the thermal conductivity of the resulting composite material. Interestingly, adding graphene decreased thermal conductivity by approximately 20%, thus acting as a thermal barrier.
Another important aspect investigated in this study is the effect of graphene’s functionalization on the composite materials’ thermal conductivity. It was found that graphene functionalization enhanced thermal conductivity, and the volume concentration of the functional group directly influenced this enhancement. Specifically, an increase in the volume concentration of the functional group led to an improvement in the thermal conductivity of the composite material.
Compared to the other groups, hydrogen groups exhibited a more effective influence on thermal conductivity for all volume fractions studied. Hydrogen consistently led to a maximum increase in thermal conductivity of 17.4% concerning the composite material containing non-functionalized graphene. This finding highlights the importance of considering the specific functional groups when aiming to enhance the thermal conductivity of composite materials.
We emphasize that, in general, adding nanofillers to polyethylene (PE) to make a composite material decreased thermal conductivity. Despite the enhancements achieved through the functionalization of graphene, we showed that the highest thermal conductivity achieved with functionalized graphene was still 6.5% lower than the thermal conductivity of the amorphous polyethylene. This study indicates that there are still opportunities for further improvements in enhancing the thermal conductivity of composite materials.
Having calculated the thermal conductivity of amorphous polyethylene (PE) at 0.45 W/mK, this study revealed a 20% decrease to 0.36 W/mK upon incorporating pristine graphene, attributed to phonon scattering acting as a thermal barrier. Functionalization, having raised conductivity to 0.42 W/mK with 30% hydrogen coverage—a 17.4% enhancement over PE/graphene, and ITC to 2.50 × 10⁸ W/m2K with 30% ethyl coverage—a 284% increase from 8.8 × 10⁷ W/m2K, highlighted the ethyl groups’ superior role in enhancing interfacial heat transfer. These improvements, having remained 6.5% below pure PE’s conductivity, underscore persistent challenges with nanofiller composites. Having linked these trends to reduced phonon mismatch via VDOS analysis, the findings offer a tailored approach to optimizing PE-based nanocomposites. Broadly, these advancements, having promised enhanced heat dissipation, hold significant potential for microelectronics, energy storage, and lightweight materials, driving future innovations in thermal management.
The results from this investigation reveal that, as a general trend, the functionalization process increased the thermal transport between the polymer and the graphene sheet. The ethyl group demonstrated a significant improvement in terms of interfacial thermal conductance compared to the other two groups studied.
The primary emphasis of this investigation lies in the atomic scale simulation, wherein the intricate workings of the nanocomposite’s thermal properties can be comprehended to a greater extent. In conjunction with this focus, alternative methodologies such as finite element modeling and empirical studies can be employed to supplement the results mentioned above. By doing so, a more comprehensive comprehension of functionalization’s impact on the nanocomposite’s thermal attributes can be achieved. Additionally, it is plausible to consider investigating other functional groups displaying comparable structure or behavior as potential subjects for future studies, aiming to delve deeper into the patterns exhibited by the outcomes.


 ,
, 


