
Characterization of Space Charge Accumulations in Alternative Gas-to-Liquid Oil-Immersed Paper Insulation Under Polarity Reversal Voltage Scenarios


Abstract
1. Introduction
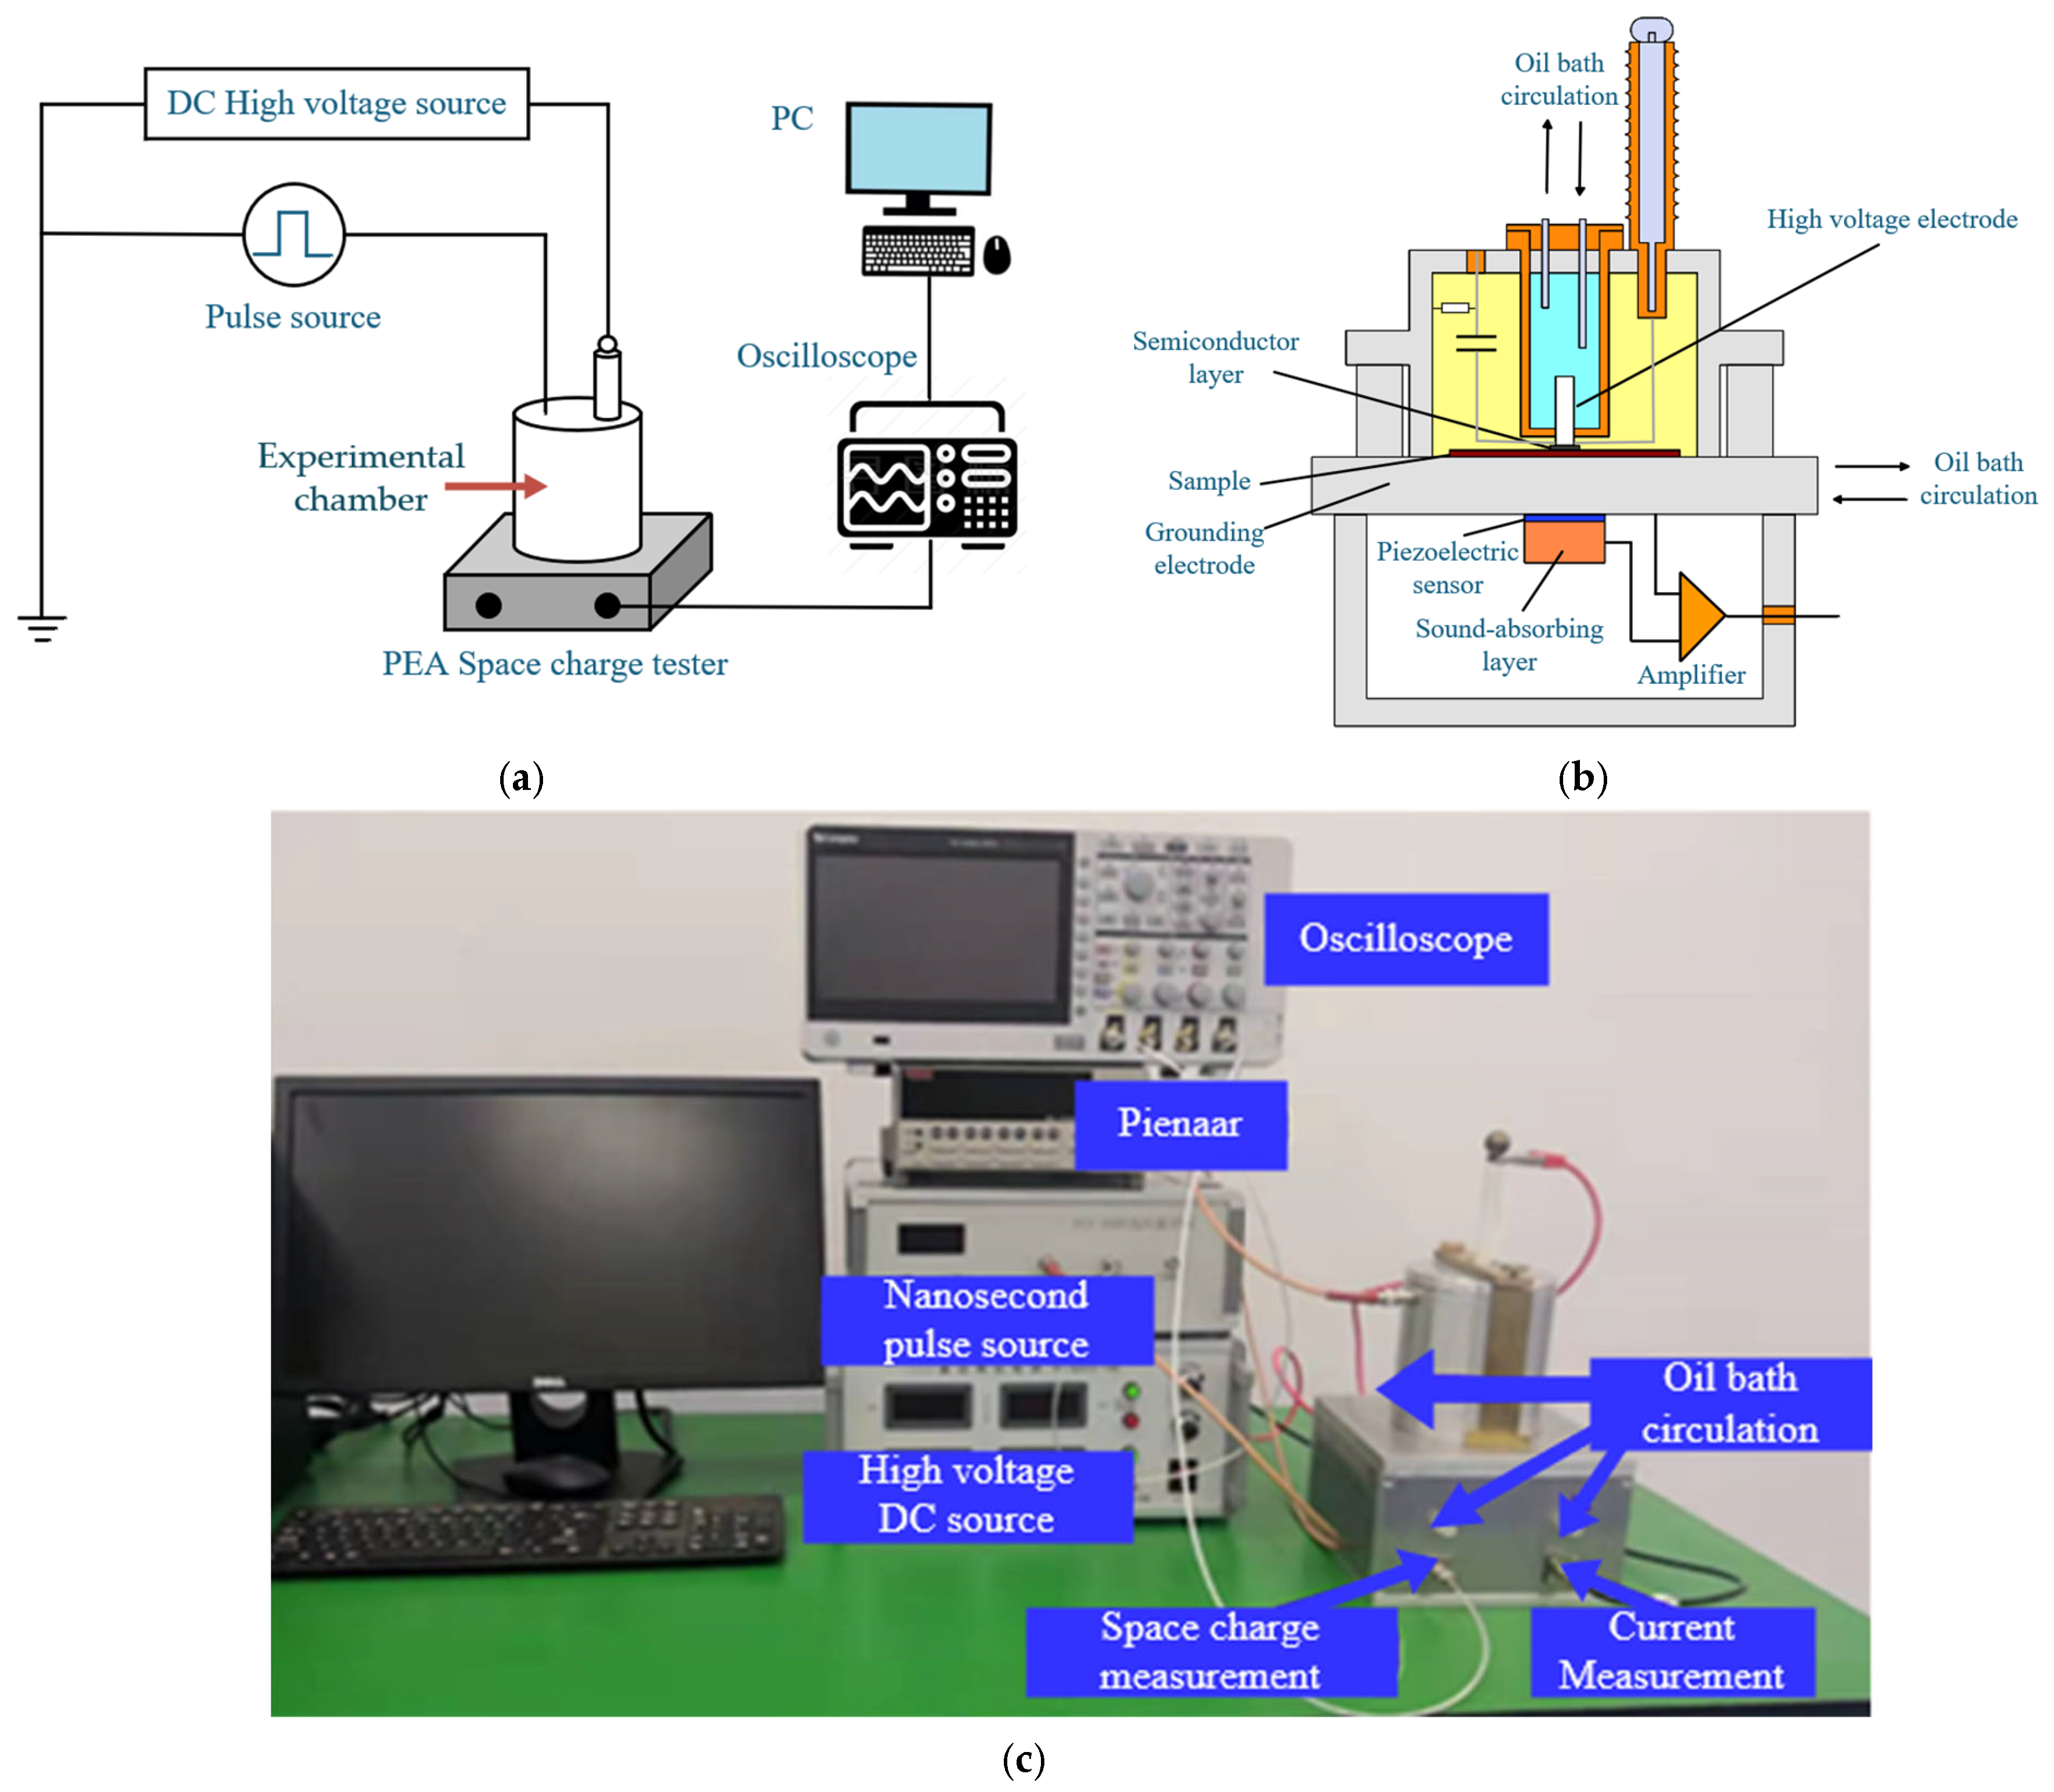
2. Experimental Methodology
3. Experimental Results and Discussions
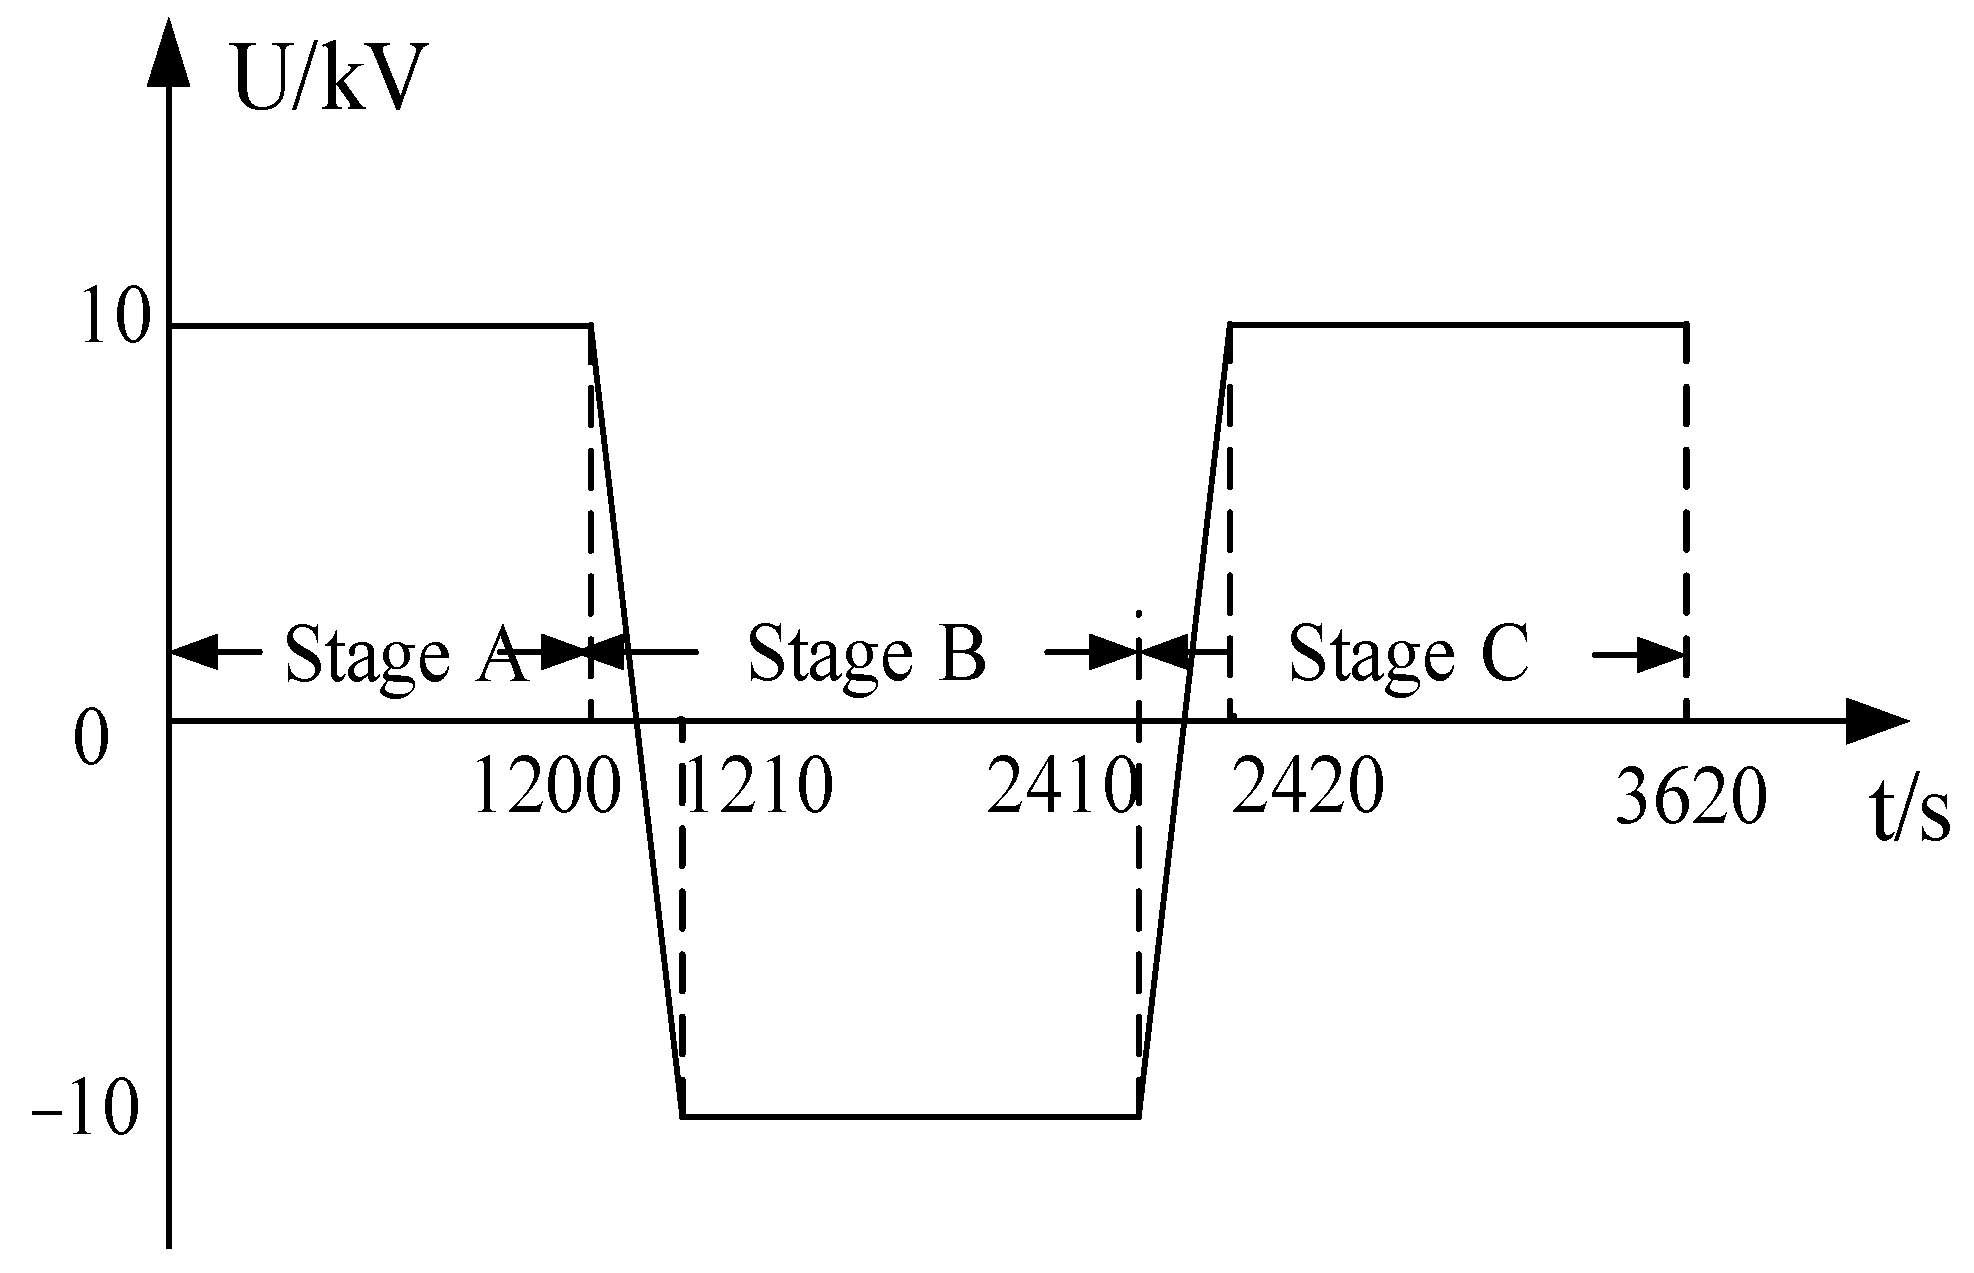
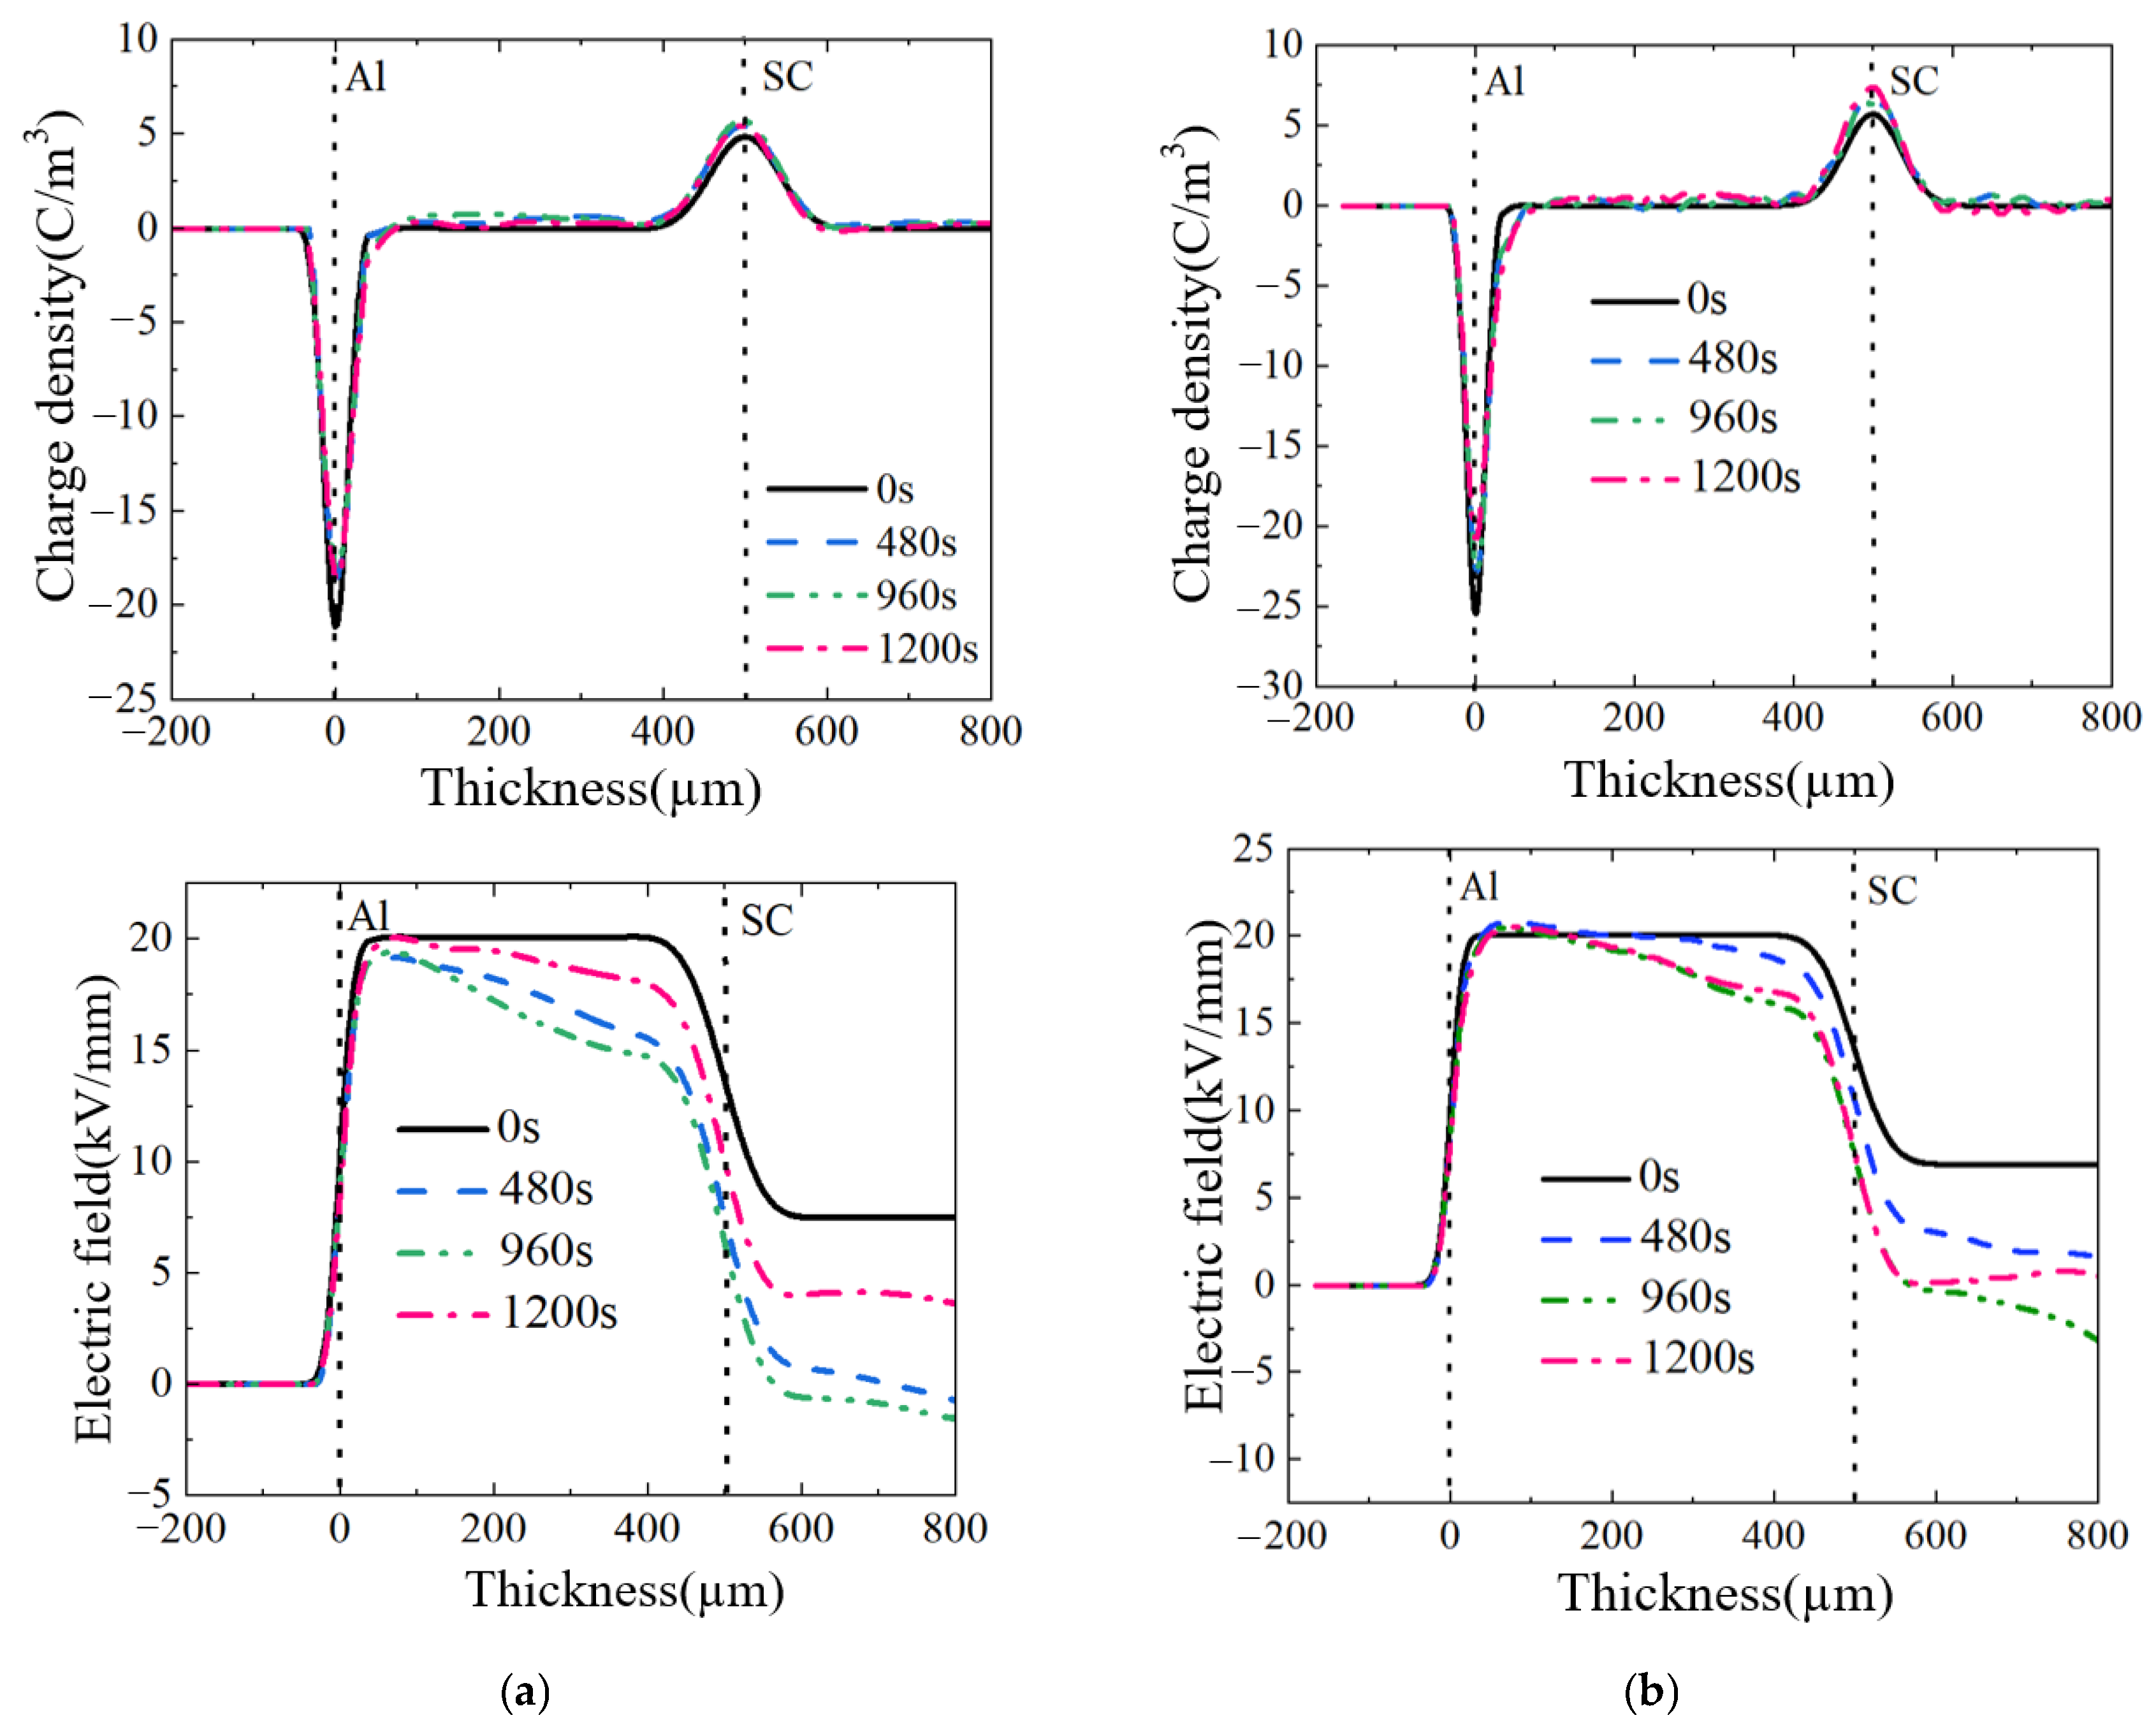
3.1. Stage A
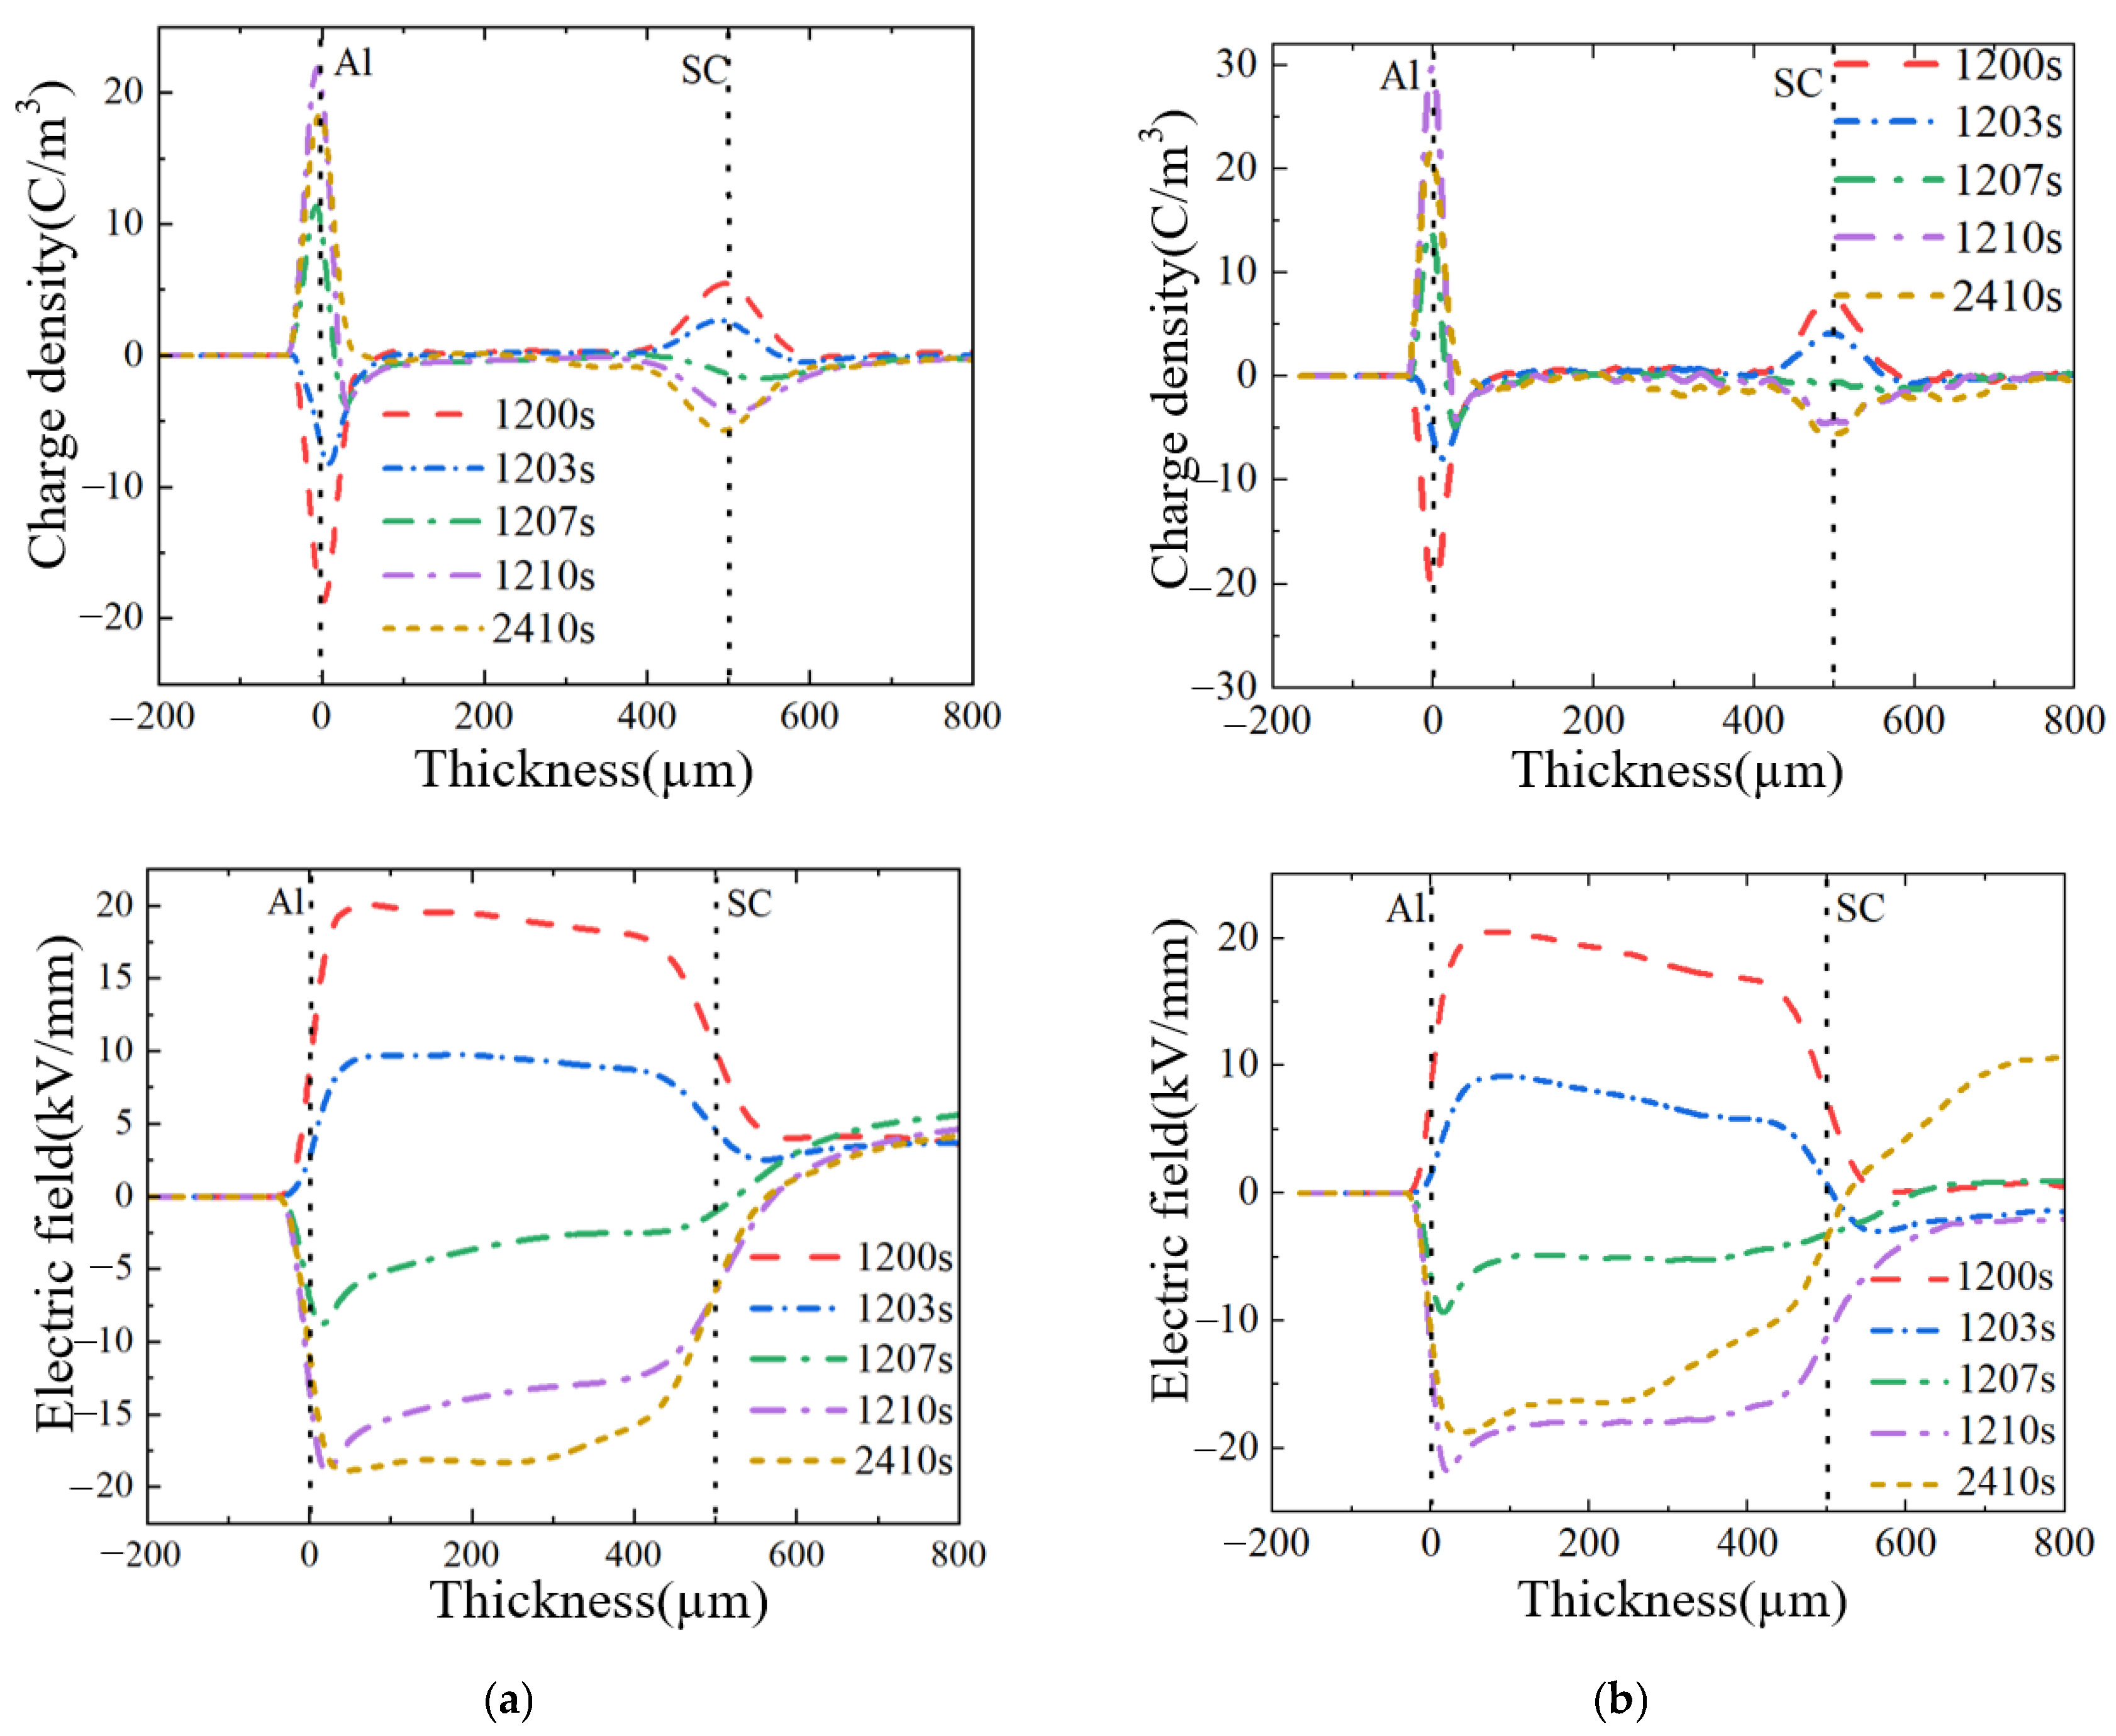
3.2. Stage B
3.3. Stage C
4. Numerical Calculations for Microscopic Analyses
5. Conclusions
- (1)
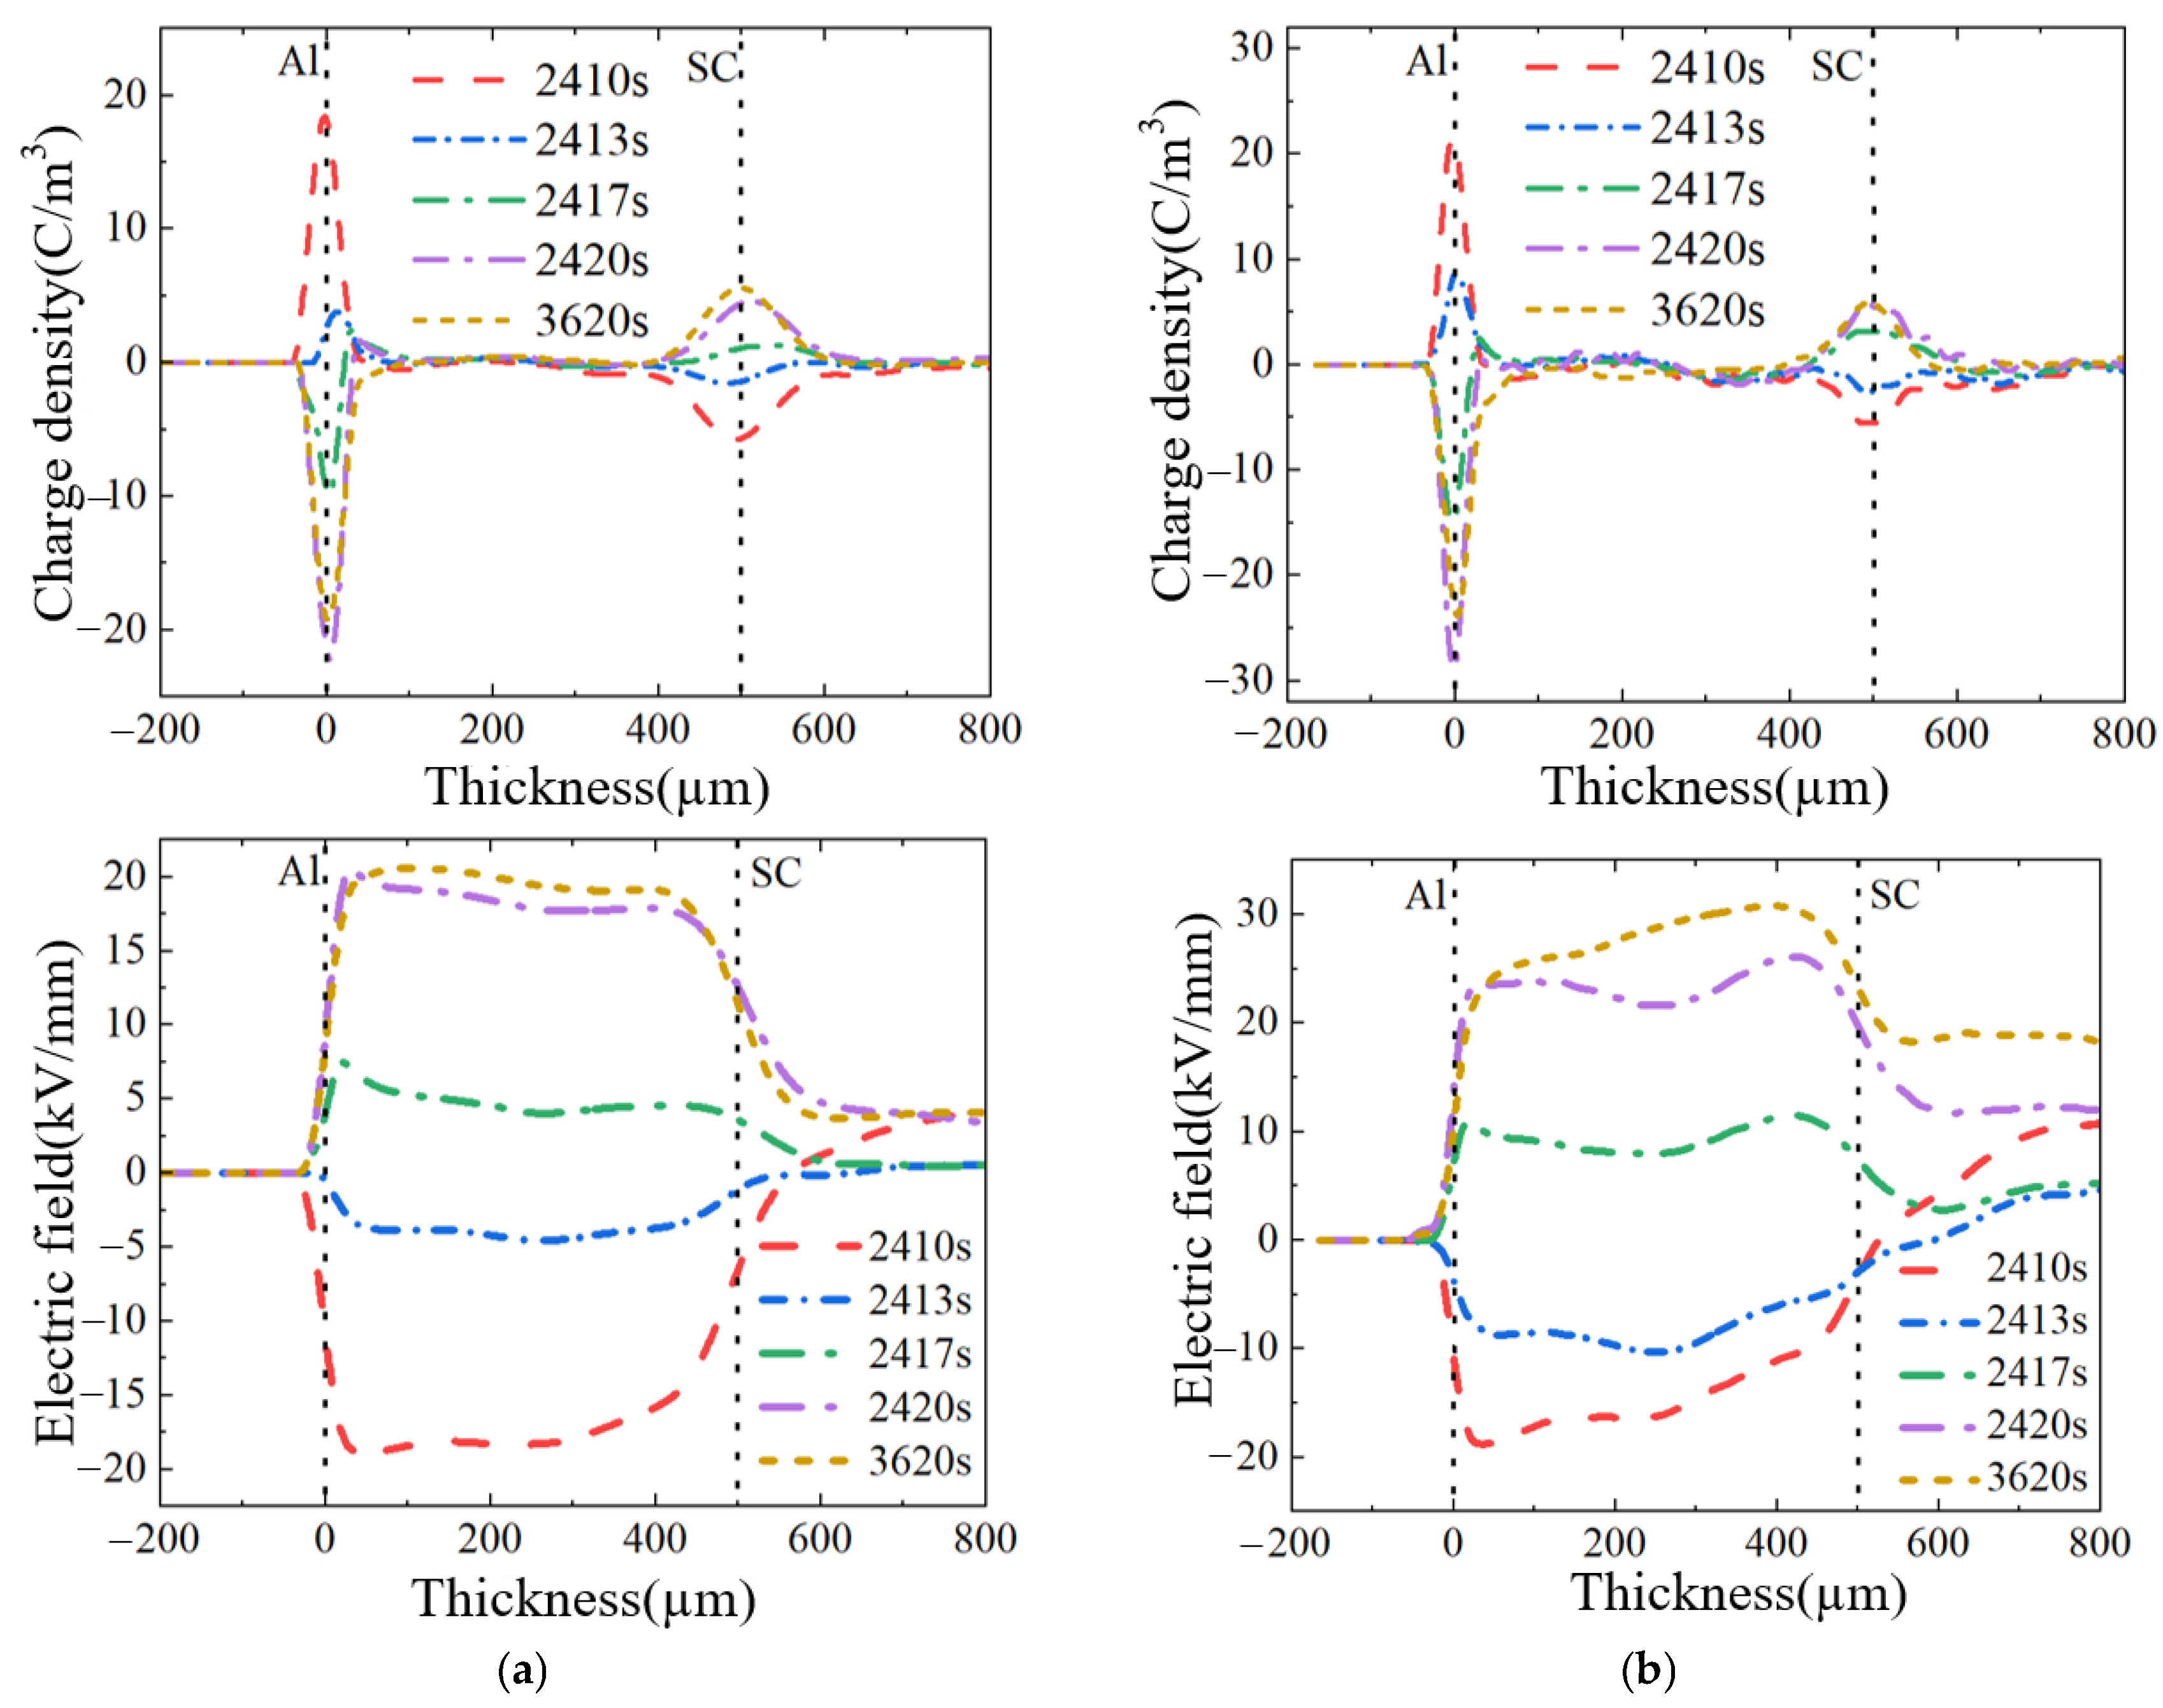
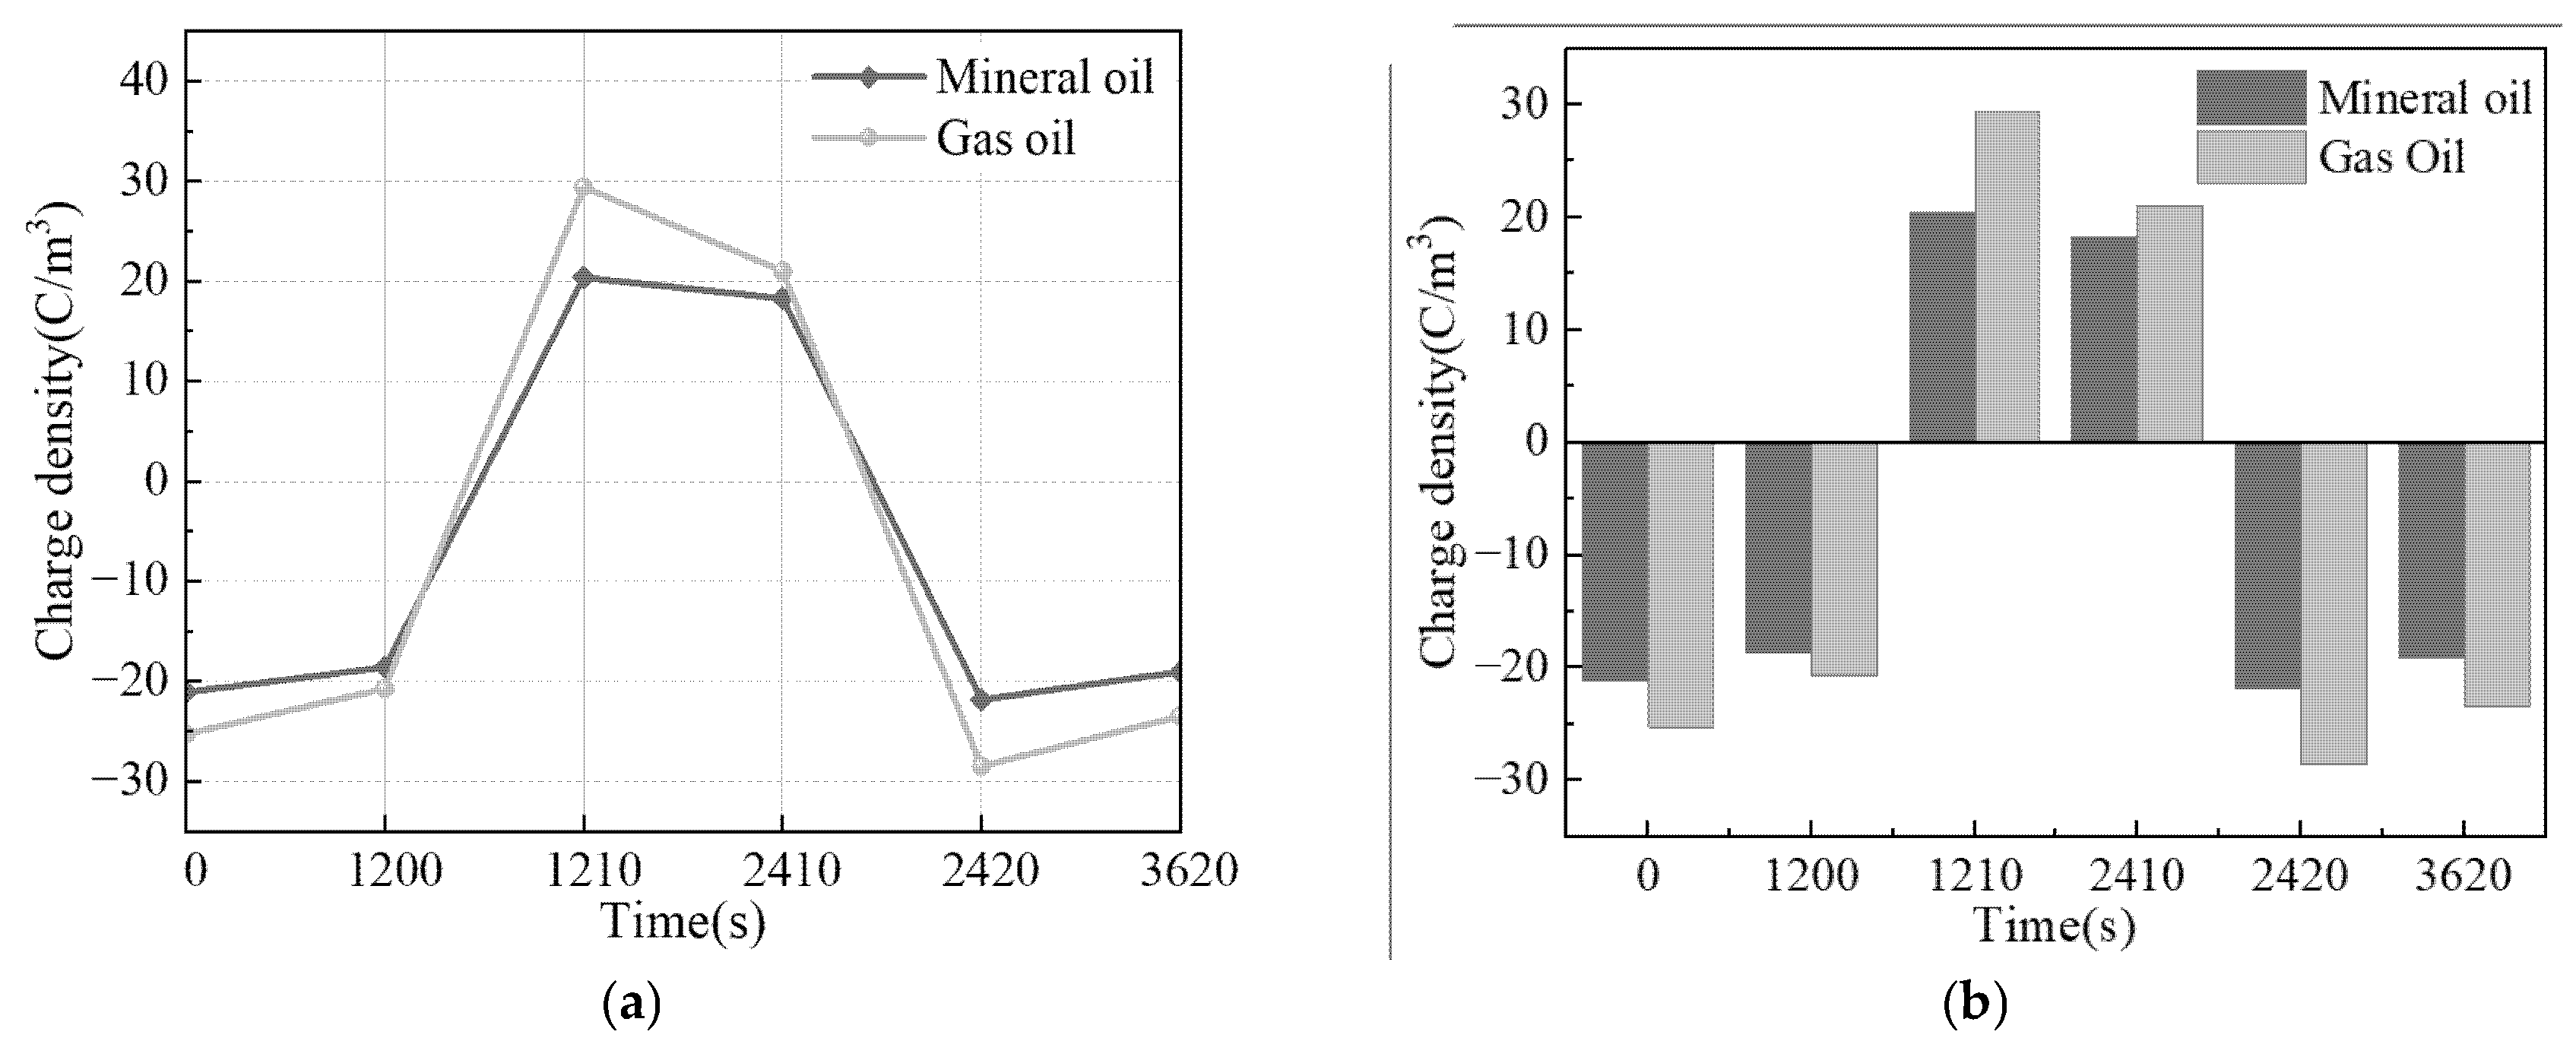
- The experimental results demonstrate that under positive–negative–positive polarity reversal voltage, the gas-impregnated pressboard exhibits significantly higher rates of space charge density variation (140% faster negative charge dissipation at the ground electrode in stage B) and electric field distortion (54.15% distortion rate near electrodes in stage C) compared with mineral oil-impregnated paper.
- (2)
- A simulation model based on bipolar carrier theory was developed to investigate space charge accumulation and field distortion mechanisms in oil–paper insulation under polarity reversal. The simulation results indicate that enhanced mobility reduces space charge accumulation at the electrodes while increasing bulk charge density, thereby mitigating interfacial electric fields. However, excessive mobility may exacerbate post reversal residual charge retention, intensifying field distortion.
- (3)
- The analysis of carrier transport mechanisms in oil-impregnated paper reveals the critical regulatory role of traps in charge/field distribution. Future research should explore modifying transformer oil–paper composites with titanium dioxide nanoparticles. This modification strategy shows potential for accelerating space charge dissipation, optimizing trap energy distribution, and alleviating interfacial field distortion in gas-impregnated pressboard [27], though its practical feasibility requires systematic investigation.
Author Contributions
Funding
Data Availability Statement
Conflicts of Interest
References
- Mao, G.L.; Zhao, F.; Li, S.J.; Ge, Z.; Li, S.T.; Yang, L.Q. Effect of Insulating Oil Types on DC Space Charge Characteristics of Oil-Paper Insulation. High Volt. Eng. 2022, 48, 1726–1736. [Google Scholar]
- Qian, Y.H.; Huang, Y.B.; Zhang, Y.; Zhong, Z.S. Recent progress and prospects of hydrogenated isomerized non-naphthenic transformer oil. Proc. CSEE 2020, 40, 5373–5383. [Google Scholar]
- Zhang, W.L.; Zhang, G.B. Technical specifications and key issues of transformer oil for UHV applications. Proc. CSEE 2009, 29, 1–6. [Google Scholar]
- Kato, K.; Nara, T.; Okubo, H.; Endo, F.; Yamazaki, A.; Koide, H.; Hatta, Y.; Hikosaka, T. Space charge behavior in palm oil fatty acid ester (PFAE) by electro-optic field measurement. IEEE Trans. Dielectr. Electr. Insul. 2009, 16, 1566–1573. [Google Scholar] [CrossRef]
- Zhang, J.F.; Dong, X.; Liu, S.L.; Yu, X.D.; Hao, L.Y.; Li, Y. Space charge characteristic of oil-paper insulation under polarity reversal voltage. High Volt. Eng. 2023, 49, 301–310. [Google Scholar]
- Wu, Z.S.; Dai, C.; Zhou, Y.X.; Huang, M. Space charge characteristics of Nomex insulation paper and Kraft insulation paper in KI50X insulation oil. High Volt. Eng. 2017, 43, 2911–2918. [Google Scholar]
- Zhou, Y.X.; Zhang, X.Z.; Huang, X.; Wang, H.J.; Xue, L. Influence of oil and paper aging states on space charge in oil-paper insulation. Sci. Sin. Technol. 2023, 53, 589–600. [Google Scholar] [CrossRef]
- He, D.X.; Gong, W.J.; Liu, H.S.; Zhao, X.L.; Li, S.M.; Li, Q.Q. Simulation study on partial discharge in wedge-shaped oil gap of oil-paper insulation under DC electric field. Proc. CSEE 2021, 41, 5779–5789. [Google Scholar]
- Li, C.; Ji, Z.; Yan, H.W. Influence of insulating paper characteristics and polarity reversal on space charge effect in oil-paper insulation. Proc. CSEE 2020, 40, 4708–4718. [Google Scholar]
- IEC 60554-3-5:2020; Specification for Cellulosic Papers for Electrical Purposes—Part 3–5: Specifications for Individual Materials—Electrical Insulating Papers. IEC: Geneva, Switzerland, 2020.
- Zhang, S.Q.; Zhao, X.L.; Qi, B.; Liu, X.; Li, C.R. Interface charge accumulation characteristics and dynamic process of paraffin-based and naphthenic transformer oil-paper under DC and polarity reversal voltages. Trans. China Electrotech. Soc. 2022, 37, 767–774, 792. [Google Scholar]
- Wang, J.Y.; Li, J.Z.; Zhang, S.Q.; Cheng, H.C.; Gao, F.; Bai, S. Typical performance analysis of gas-to-liquid transformer oil produced from natural gas. High Volt. Eng. 2016, 42, 2974–2979. [Google Scholar]
- IEC 60867:2022; Insulating Liquids—Specifications for Unused Liquids Based on Synthetic Aromatic Hydrocarbons. IEC: Geneva, Switzerland, 2022.
- ISO 2719:2016; Determination of Flash Point—Pensky-Martens Closed Cup Method. ISO: Geneva, Switzerland, 2016.
- ISO 3016:1994; Petroleum Products—Determination of Pour Point. ISO: Geneva, Switzerland, 1994.
- IEC 60247:2004; Insulating Liquids—Measurement of Relative Permittivity, Dielectric Dissipation Factor (tan δ) and d.c. Resistivity. IEC: Geneva, Switzerland, 2004.
- IEC 60156:2018; Insulating Liquids—Determination of the Breakdown Voltage at Power Frequency—Test Method. IEC: Geneva, Switzerland, 2018.
- IEC 61378-2:2001; Convertor Transformers—Part 2: Transformers for HVDC Applications. IEC: Geneva, Switzerland, 2001.
- Gong, W.J. Charge Characteristics of Oil-Paper Insulation Under Polarity Reversal Electric Field and Its Influence on Wedge Electrode Discharge. Ph.D. Thesis, Tsinghua University, Beijing, China, 2022. [Google Scholar]
- Ren, H.W.; Li, Q.M.; Li, C.Q.; Gao, H.Y.; Liu, T. Equivalent Transmission Line Model of Electro-Acoustic Pulse Measurement System and Acoustic Characteristics Analysis. High Volt. Eng. 2021, 47, 1485–1495. [Google Scholar]
- Zou, R.H.; Liao, R.J.; Hao, J.; Liu, C.; Wu, J. Simulation and deductive model of interface charge distribution in liquid-solid oil-paper insulation system under AC and AC/DC composite voltages. High Volt. Eng. 2021, 47, 1391–1402. [Google Scholar]
- Shi, H.Z. Research on Carrier Migration Velocity in Oil-Paper Insulation under High Temperature and High Electric Field. Master’s Thesis, North China Electric Power University (Beijing), Beijing, China, 2023. [Google Scholar]
- Gao, L.; Xu, H.; Qin, Y.; Lv, Z.; Wu, K. Influence of Composition Types of Oil-Paper Composite Insulation on Charge Transport Characteristics. High Volt. Eng. 2025, 51, 309–321. [Google Scholar]
- Zhang, G.Z.; Wang, K.; Yan, W.Y. Study on fiber impurity particles in liquid insulation of converter transformers. High Volt. Eng. 2022, 48, 4297–4305. [Google Scholar]
- Liao, R.J.; Xiang, M.; Yuan, Y.; Gao, B.L.; Zhu, T.N.; Li, W.M. Effect of Nano-Al2O3 doping on space charge and trap energy level distribution characteristics of insulating paper. High Volt. Eng. 2019, 45, 681–690. [Google Scholar]
- Gao, C.J. Research on the Generation Mechanism and Influencing Factors of Interface Charges in Oil-Paper Insulation under DC Electric Field. Master’s Thesis, North China Electric Power University (Beijing), Beijing, China, 2020. [Google Scholar]
- Hao, J.; Liao, R.J.; Chen, G.; Min, D.M.; Zhang, L.; Zou, R.H. Review of space/interface charge characteristics and suppression methods in oil-paper composite dielectrics. High Volt. Eng. 2019, 45, 3192–3206. [Google Scholar]


| Items | Experimental Methods | Shell Diala S3 ZX-IG | Shell Diala S4 ZX-I |
|---|---|---|---|
| Density/(kg/m3) | IEC 60867 [13] | 878 | 805 |
| Flash point/(°C) | ISO 2719 [14] | 140 | 191 |
| Pour point/(°C) | ISO 3016 [15] | −60 | −42 |
| Conductivity/(S/m) | IEC 60247 [16] | 3.9 × 10⁻¹³ | 8.9 × 10⁻¹³ |
| Dielectric loss factor | IEC 60247 [16] | 0.00281 | 0.00053 |
| Relative permittivity | IEC 60247 [16] | 2.02 | 2.00 |
| AC Breakdown voltage pretreatment/kV | IEC 60156 [17] | >30 | 70 |
| AC Breakdown voltage after treatment/kV | IEC 60156 [17] | >70 | 78 |
| Parameters | Numerical Value | Unit | Meaning |
|---|---|---|---|
| ε0 | 8.854 × 10⁻¹² | F/m | Vacuum dielectric constant |
| εr | 3.7 | 1 | Relative dielectric constant of paperboard |
| Be | 0.008 | 1/s | Entrapment factor of free electrons |
| Bh | 0.007 | 1/s | Entrapment factor for free positive charge |
| ωei | 1.18 | eV | Injection barrier for free electrons |
| ωhi | 1.20 | eV | Injection barrier for a free positive charge |
| μeμ | 5 × 10⁻¹⁵ | m2/(V·s) | Small mobility of free electrons |
| μeμ | 5 × 10⁻¹³ | m2/(V·s) | Large mobility of free electrons |
| μhμ | 4 × 10⁻¹⁵ | m2/(V·s) | Small mobility of free positive charge |
| μhμ | 4 × 10⁻¹³ | m2/(V·s) | Large mobility of free positive charge |
| S0 | 0 | m3/(s·C) | Composite coefficients of incoming electrons and incoming positive charges |
| S1 | 1 × 10⁻⁵ | m3/(s·C) | Complexity factor of free electrons with incoming positive charge |
| S2 | 1 × 10⁻⁵ | m3/(s·C) | Composite coefficient of free positive charge and incoming electrons |
| S3 | 1 × 10⁻⁵ | m3/(s·C) | Composite coefficient of free electrons and free positive charges |
| A | 1.2 × 10⁶ | A/(m·K)2 | Richardson’s constant |
| Kb | 1.3806 × 10⁻²³ | J/K | Boltzmann’s constant |
Disclaimer/Publisher’s Note: The statements, opinions and data contained in all publications are solely those of the individual author(s) and contributor(s) and not of MDPI and/or the editor(s). MDPI and/or the editor(s) disclaim responsibility for any injury to people or property resulting from any ideas, methods, instructions or products referred to in the content. |
© 2025 by the authors. Licensee MDPI, Basel, Switzerland. This article is an open access article distributed under the terms and conditions of the Creative Commons Attribution (CC BY) license (https://creativecommons.org/licenses/by/4.0/).
Share and Cite
Wang, Y.; Xiong, Y.; Wang, Z.; Lu, W. Characterization of Space Charge Accumulations in Alternative Gas-to-Liquid Oil-Immersed Paper Insulation Under Polarity Reversal Voltage Scenarios. Energies 2025, 18, 3152. https://doi.org/10.3390/en18123152
Wang Y, Xiong Y, Wang Z, Lu W. Characterization of Space Charge Accumulations in Alternative Gas-to-Liquid Oil-Immersed Paper Insulation Under Polarity Reversal Voltage Scenarios. Energies. 2025; 18(12):3152. https://doi.org/10.3390/en18123152
Chicago/Turabian StyleWang, Ya, Yifei Xiong, Zheming Wang, and Wu Lu. 2025. "Characterization of Space Charge Accumulations in Alternative Gas-to-Liquid Oil-Immersed Paper Insulation Under Polarity Reversal Voltage Scenarios" Energies 18, no. 12: 3152. https://doi.org/10.3390/en18123152
APA StyleWang, Y., Xiong, Y., Wang, Z., & Lu, W. (2025). Characterization of Space Charge Accumulations in Alternative Gas-to-Liquid Oil-Immersed Paper Insulation Under Polarity Reversal Voltage Scenarios. Energies, 18(12), 3152. https://doi.org/10.3390/en18123152