Abstract
Developing clean and renewable energy instead of the ones related to hydrocarbon resources has been known as one of the different ways to guarantee reduced greenhouse gas emissions. Geothermal systems and native hydrogen exploration could represent an opportunity to diversify the global energy matrix and lower carbon-related emissions. All of these natural energy sources require a well to be drilled for its access and/or extractions, similar to the petroleum industry. The main focuses of this technical–scientific contribution and research are (i) to evaluate the global energy matrix; (ii) to show the context over the years and future perspectives on geothermal systems and natural hydrogen exploration; and (iii) to present and analyze the importance of developing technologies on drilling process optimization aiming at accessing these natural energy resources. In 2022, the global energy matrix was composed mainly of nonrenewable sources such as oil, natural gas, and coal, where the combustion of fossil fuels produced approximately 37.15 billion tons of CO2 in the same year. In 2023, USD 1740 billion was invested globally in renewable energy to reduce CO2 emissions and combat greenhouse gas emissions. In this context, currently, about 353 geothermal power units are in operation worldwide with a capacity of 16,335 MW. In addition, globally, there are 35 geothermal power units under pre-construction (project phase), 93 already being constructed, and recently, 45 announced. Concerning hydrogen, the industry announced 680 large-scale project proposals, valued at USD 240 billion in direct investment by 2030. In Brazil, the energy company Petroleo Brasileiro SA (Petrobras, Rio de Janeiro, Brazil) will invest in the coming years nearly USD 4 million in research involving natural hydrogen generation, and since the exploration and access to natural energy resources (oil and gas, natural hydrogen, and geothermal systems, among others) are achieved through the drilling of wells, this document presents a technical–scientific contextualization of social interest.
1. Introduction
Reducing greenhouse gas emissions has been the common global goal in terms of energy strategies for years, gaining more importance recently [1]. Signed in 2015, the Paris Agreement has set a target, limiting the global mean temperature increase below 2 °C over the pre-industrial period and pursuing an effort to limit the temperature rise to 1.5 °C [2,3,4,5,6]. In addition, it aims to reach net zero greenhouse gas emissions in the second half of the 21st century [2,4]. To reach this goal, countries race to develop new technologies to secure the incorporation of renewable energy sources into the grid and enhance the adaptability of energy systems [7].
Developing clean and renewable energy, alongside a guarantee of less utilization of fossil fuels, is the main way to compile to the energy transition and mitigate climate change [1]. The International Energy Agency (IEA) has established a forecast for renewable energy sources, indicating it may represent approximately 40% of the worldwide electricity supply by 2030 [8,9]. The search for low-emission technologies and the requirements of complying with climate change needs has created the potential for geothermal and natural hydrogen energy as a considerably important supplying source
The drilling industry is essential to the exploration and production of several energy sources, such as oil and gas, geothermal energy, and natural hydrogen. The oil and gas sector remains the primary global energy source, driven by demand for fossil fuels and petrochemicals, although it faces challenges related to the energy transition. Geothermal energy is a clean and renewable energy source and can be used for different purposes, such as space heating, water heating, and electricity generation, among others [1]. It is a mature and commercially proven energy resource with considerable potential to become more competitive in the next few years, besides being a stable source, enabling uninterrupted electricity production independent of weather conditions [10,11]. Meanwhile, natural hydrogen is emerging as a promising alternative in the context of decarbonization, with in-progress research aiming to enable its commercial exploration [12]. In this scenario, advancements in drilling techniques are essential to optimize operational efficiency and reduce costs, making the exploration of these resources more viable and sustainable.
In oil and gas, geothermal, and natural hydrogen exploration/exploitation, it is necessary to have drilling wells connecting the surface to the subsurface/reservoir, i.e., a pathway to access the natural resources [1,13]. Rotary drilling is the predominant method employed for drilling in oil and gas fields worldwide [14]. The extraction of these natural resources (geothermal and natural hydrogen) faces challenges similar to those found in the oil and gas industry. One main issue is wellhead stability, as changes in temperature and pressure can compromise the integrity of the well structure. Additionally, geomechanical factors affect both hydrogen and oil drilling, with risks such as lost circulation, wellbore instability, and unwanted fractures that may compromise well integrity. Operational parameters and pressure control are also critical, since drilling fluid management is necessary to prevent formation collapse and avoid unexpected fluid influxes [15,16,17].
The rate of penetration (ROP) and mechanical specific energy (MSE) are key factors in measuring the efficiency of the drilling process [18,19,20]. Experimental results indicate that ROP and MSE are influenced by the physical characteristics of the rock, as well as drilling parameters. To overcome these challenges, pre-operational tests and multi-objective analyses must be performed. The pre-operational test is a practical procedure for measuring the relationship between the ROP and key drilling parameters, such as WOB and RPM, while multi-objective optimization searches for the ideal combination of high ROP and low MSE for a given lithology.
Due to the challenges presented, drilling activities have become one of the main and most expensive phases of energy resource exploration/exploitation [21]. The drilling operations are responsible for approximately 50% to 70% of the total expense of enhanced geothermal system (EGS) projects. The drilling operation alone, excluding casing and cementing phases, is responsible for 25% to 40% of the total drilling costs and over 40% of the total well construction time [22]. In this sense, the costs associated with the drilling and completion phases are often the decisive factors in determining if these energy resources are a technical and economically feasible energy source [23] when considering a wide and commercial scale.
In a general perspective, access and exploration to many energy-related natural resources, such as the ones emphasized in this paper, namely O&G, geothermal, and natural hydrogen, are drilling-dependent. In this context, the goals of this research are to evaluate the global energy matrix, highlighting the production and forecasts over the years and for the future, respectively, combining the relevance of the drilling engineering discipline.
2. Oil and Gas
Despite the progress over the years in terms of drilling methods, techniques, and technology, the process continues to be complex, challenging, and expensive. The parameters that affect the drilling process are divided in three categories as follows: (i) parameters related to machinery, equipment, and cutting tools; (ii) parameters related to the rock properties; and (iii) parameters related to the drilling activities itself, such as adjustable operational and technical parameters [21].
Currently, the focus of global O&G companies is exploring offshore deep and ultra-deep locations [24], mainly due to their potential, the continuous depletion of shallow resources, and continuous increase in global energy demands [25]. Offshore ultra-deep well drilling is a complex process which often involves challenges, high risk and costs, and in some unconventional locations, it reveals low rock-breaking efficiency (due to abrasiveness and high rock strength) and a low rate of penetration (ROP) [20,24,25,26,27].
The exploration and development of oil fields in deepwater and ultra-deepwater offshore regions have increased the risks associated with the drilling process [28]. One of the challenges facing pre-salt reservoirs is related to the creep in salt rocks, a phenomenon in which salt gradually deforms over time due to temperature fluctuations, viscosity, mechanical stresses, and microstructural properties [29]. During drilling, salt creep can lead to borehole closure and the drilling BHA becoming stuck, which significantly inflates the operational time and costs. In the same context, uncontrolled borehole enlargement caused by the dissolution of salt in non-saturated water-based drilling fluids can hinder casing installation and cementing [30]. Even though it is challenging, salt drilling has already been controlled by the industry so that know-how and technologies are already in place for such pre-salt operations. Still regarding this environment, carbonate rocks (pre-salt reservoir) are, to date, garnering a lot of attention given the high tendency of drilling fluid loss, a narrow mud window, low penetration speed (historically approximately from 0.5 to 8 m/h), and difficulties in maintaining a consistent drilling efficiency. In this context, MSE is extensively used to measure the effectiveness of the drilling process [20,31]. Mantegazini et al. (2024, 2025) [19,20] applied the MSE concept to analyze field datasets from a real pre-salt operation, where rooms for drilling efficiency improvements could be drawn from pre-operational drilling tests with a multi-objective focus.
In addition, there are costs related to the rent and operation of drilling platforms, drilling rigs, and/or drill ships. The daily rent of offshore drilling platforms in the South China Sea ranges from USD 294,000 to USD 515,000 depending on the platform’s characteristics [32], while the platform’s operating costs range from USD 300,000 (shallow water) to USD 500,000 per day (deep water) [24]. According to [33], the average cost to drill the pre-salt layers ranges from 641,985.00 to 1,374,755.00 [USD/day] depending on the type of the drilling platform in use and unexpected occurrences. It is estimated, in a general sense, that during the drilling operations, 48% of the time is spent effectively penetrating the rock (drilling the hole), 27% in round trips (e.g., drill bit replacement), and 25% for well measurements and formation evaluation (offset and not in real time) [14].
These facts show that exploring subsurface resources can be risky and requires a lot of capital. However, the O&G industry has acquired extensive know-how and advanced techniques/technologies in areas such as digital well monitoring, hydraulic fracturing, directional drilling, and analysis [34]. These advancements can offer inestimable support and lessons learned applicable to the exploration and exploitation of natural hydrogen and geothermal energy-related resources.
Currently, directional drilling and related operations combine the most advanced technologies used for accessing hydrocarbon reservoirs [35]. This technology allows for the effective control of the well trajectory, making the drill bit reach a designated target along a defined path [36,37]. Directional drilling presents some advantages, including enhanced production efficiency and reduced total drilling costs. Additionally, this technique also provides improved task execution when exposed to ground environment limitations due to complex formations like mountains and urban areas [35,38].
3. Geothermal Energy
Recently, the high demand for energy and the focus on low-emission technologies have made geothermal energy a promising renewable source. It is clean, renewable, potentially inexhaustible, highly reliable, and presents relatively low environmental impacts. It is fair to mention that it can be considered exempt from price volatility and can operate year-round, i.e., being weather-independent [39,40]. In this context, geothermal energy systems are an alternative support achieving the net-zero carbon emission target [41].
Deep geothermal energy, and geothermal energy in general, refers to using the heat (energy) naturally found in the subsurface of the Earth [34,42,43]. The main driver in using or not using geothermal energy in a specific location largely depends on the specific demand, available temperature, and costs [44]. Geothermal wells can be divided into three types according to the temperature, namely (i) low temperature (less than 150 °C); (ii) medium temperature (between 150 and 200 °C); and (iii) high temperature (greater than 200 °C) [45]. Geothermal energy system plants use three main technologies for converting heat into electricity, where medium- or high-temperature resources are required [42,46].
- Dry steam: Known as the most common technology, it uses steam at high pressure and temperatures (over 235 °C) to move a turbine paired with an electrical energy generator. After transferring its energy to the turbine, the steam condenses and is re-injected back into the Earth;
- Flash: Water tanks (above 150–170 °C) are used to supply energy to single- or double-flash systems. The water is brought to the surface through wells, and due to the sudden pressure drop from the tank to the atmosphere, it separates into steam, which is directed to the plant, and liquid, which is then reinjected into the tank (single flash). If the geothermal fluid reaches the surface at extremely high temperatures, it can undergo the process twice (double flash).
- Binary cycle: In tanks that generate water at moderate temperatures (between 120 and 180 °C), the geothermal fluid is used to vaporize a secondary liquid (typically isobutane or isopentane) through a heat exchanger, as this secondary fluid has a lower boiling point than water. The secondary fluid then expands in the turbine, condenses, and returns to the exchanger in a closed-loop system, with no interaction with the external environment.
Although the goals of the petroleum and geothermal industries are the same, there are differences in extracting these energy sources. Table 1 shows the main differences.

Table 1.
Comparison between petroleum and geothermal energy.
As shown in Table 1, there are differences in the extraction of petroleum and geothermal energy. One of the main differences is related to lithology. The most common types of formation rock in geothermal reservoirs are granite, quartzite, granodiorite, and greywacke [48]. These rocks are widely recognized for their hardness and abrasive nature [15]. Therefore, the main challenges in the exploration of geothermal resources are low ROP [49,50], high drill bit wear [49], and consequently low drill bit life [50].
Drilling fluid systems used in geothermal wells have evolved over the past decade and have been specifically designed to address the challenges encountered [51]. In geothermal wells, the high-temperature environment demands that drilling tools, fluids, and technologies resist high (or even extreme) temperatures, including the thermal limitations of drilling muds and directional drilling tools [34,52]. Some effects of high temperatures on drilling fluid performance are the degradation of chemical materials and undesired change in the rheological properties of the drilling fluid (in special bentonite-driven muds [1,53]), among others also impacting hole cleaning, filter cake formation, and general drilling hydraulics, which ultimately have effects on drilling parameters as well as in MSE and ROP [53].
Another important point is related to the diameter of the wells. Geothermal energy demands wells with higher diameters than petroleum. In addition, it is necessary to drill two wells to extract geothermal energy, while for oil, only one well is necessary.
There are approximately 3700 production wells in operation across the 198 geothermal fields worldwide. The countries with most wells operating are the United States of America (22.2%), Indonesia (14.1%), and the Philippines (11.5%) [54]. The economic viability of geothermal projects is heavily influenced by the costs associated with drilling operations. Typical costs for geothermal power plants range from 2000 USD/kW to 6000 USD/kW [10].
4. Natural Hydrogen
Parallel to geothermal energy, hydrogen is a clean, efficient, and flexible energy source [55]. Hydrogen, in the sense of an energy vector, is considerably versatile and applicable to different industry sectors, including construction and transportation, and it is a promising fuel [56,57]. Hydrogen can be produced from various sources, and Table 2 presents the most common color classification of hydrogen production by source.
Table 2.
Color classification of hydrogen by source of production and respective colors.
Among the types of hydrogen, green, blue, and white hydrogen are the most sustainable. Green hydrogen is obtained from the electrolysis of water powered by renewable energy sources, while blue hydrogen is obtained through the steam reforming technique in which the CO2 produced is captured. Black/brown and gray hydrogen are obtained, respectively, by gasification and from steam reforming without CO2 capturing [59,60].
Black or brown hydrogen is the hydrogen generated through coal gasification, in which the black hydrogen is produced by bituminous coal and the brown hydrogen is produced by lignite coal. Gray hydrogen is the hydrogen produced from fossil fuels, primarily through steam gas reforming or coal gasification [61]. The black or brown hydrogen process generates approximately 19 tons of CO2 per ton of H2 (tCO2/tH2), while the gray hydrogen process generates between 10 and 19 tCO2/tH2. It is important to highlight that over 95% of the world’s hydrogen consumption is gray hydrogen [61].
Natural hydrogen, also known as geological hydrogen, native hydrogen, gold hydrogen, or white hydrogen [56,62], refers to hydrogen produced deep within the Earth in most cases but also shallower hydrogen that gets confined by impermeable barriers as it moves toward the atmosphere, much like how oil and gas has been trapped and stored over time [56,63]. Natural hydrogen is found in different geological environments and rock types, such as igneous rocks (mainly), sedimentary rocks, volcanic rocks, salt rock deposits, ore bodies, coal basins, kimberlites, and ultrabasic rocks, among others [62]. The formation of natural hydrogen can occur through various geological processes, including chemical and biological processes (e.g., radiolysis, serpentinization, decomposition of organic matter, direct H2O reduction, and fermentative processes, among others) [64].
Like natural gas extraction, the drilling process continues to be the main approach for accessing and producing natural hydrogen, with natural hydrogen reservoirs being trapped by impermeable layers and accessible through well drilling [65]. In terms of hydrogen, its low density, high diffusivity, and chemical/biological reactivity present new challenges to operational integrity and wellbore integrity safety. Safety may be challenged due to issues such as tubing/casing damage, contamination of steel structures [66], cement failure potentialization, and eventual excessive annular pressure accumulation, among others [65]. From the literature, ways under study and development that may solve issues with casing and tubing structures are the usage of materials such as aluminum and nickel alloys, which have less susceptibility to hydrogen-related contamination [67].
Natural hydrogen reserves were neglected and sometimes unnoticed for decades, since exploration-phase equipment was not designed for its detection and also because it was thought that it would not be storable (due to its diffusivity) or would not even have commercial value [56]. Nowadays, however, it is common sense that there are important and commercially reserves around the globe, and it has been suggested that approximately 20 Mt per year of hydrogen (from natural reserves) is already escaping from the Earth’s surface to the atmosphere [63].
Natural hydrogen accumulations have been found in the United States of America, Russia, Canada, Finland, Philippines, Australia, Oman, Turkey, Mali, and recently in Brazil, among other places [68,69]. This implies that natural hydrogen is generated on a global scale [62]. Natural hydrogen surface emanations, also known as fairy circles, form circular depressions that are visible on satellite images [70].
The village of Bourakebougou in Mali (Africa) was the first community where natural hydrogen has been commercially used [71,72]. The drilling campaign by PETROMA (now HYDROMA, Montreal, QC, Canada) in the Taoudeni Basin, between the years of 2017 and 2018, has verified the existence of a significant commercial extensive hydrogen player extending over kilometers [70,72]. This project began in 2011 after having an old water well uncemented (drilled in 1987). Starting with a pilot hydrogen production well (Bougou-1), several more wells having been drilled since, initiating a considerable wide hydrogen exploration/exploitation campaign [72].
According to [73], natural hydrogen has also been detected in the chromite mine of Bulqizë, Albania. Bulqizë is one of the biggest chromium extraction areas worldwide, recovering over 20 million tons of high-grade ore, averaging 35% (wt) Cr2O3. The mine is located within the Bulqizë Jurassic ultramafic massif, about 40 km northeast of Tirana, encompassing an expansive area of 370 km2. At least 200 tons of H2 is released from the mine galleries, making it one of the highest recorded flow rates of H2 to date [73].
5. Energy Forecasts and Matrix Analysis
The global energy consumption in the next years will be decided by complex and interconnected dynamics across sectors, regions, and time. In all cases, energy consumption has been increasing globally, also driven by demographic and macroeconomic trends [74]. Figure 1 shows forecasts of primary energy use by source of fuel (2022–2050).
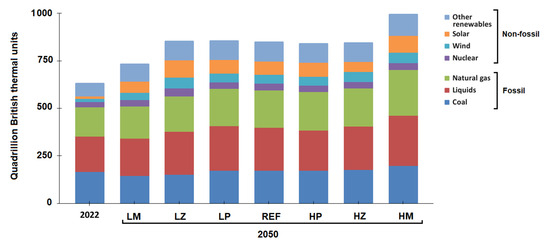
Figure 1.
Global projection of primary energy use by source of fuel (2022–2050). Note: biofuels are included in the “other renewables”; LM = low-economic-growth case; LZ = low-zero-carbon-technology-cost case; LP = low oil price; REF = reference case; HP = high-oil-price case; HZ = high-zero-carbon-cost case; HM = high-economic-growth case. Source: adapted from [74].
According to Figure 1, the Energy Information Administration (EIA) forecasts for 2050 that global energy consumption will have increased (2022 reference) from 638 quadrillion British thermal units (quads) to 855 quads in 2050 (34%). Following the trend where renewable energy consumption is gaining increasing relevance in a global perspective, solar and wind energy sources have been growing faster than any other energy source. Non-fossil fuel share as a primary energy source tends to increase over the years, from 21% in 2022 to up to 34% in 2050. Natural gas consumption has been recording the most significant increase among fossil fuels, from 153 quads in 2022 to up to 241 quads in 2050, an increase of approximately 57% [74]. Figure 2 shows the global energy matrix in 2023.
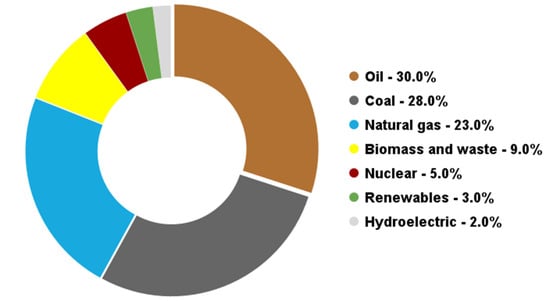
Figure 2.
Global energy matrix in 2023. Source: adapted from [75].
The global energy matrix in 2023 was composed of oil (30.0%), coal (28.0%), natural gas (23.0%), biomass and waste (9.0%), nuclear (5.0%), renewables (3.0%), and hydroelectric (2.0%) [75]. As seen, nonrenewable sources such as oil, natural gas, and coal minerals played a fundamental role. Over the past century, numerous studies predicted the decline of the oil and gas industry due to resource depletion. However, advancements in technology and reduced production costs have led to the discovery of new hydrocarbon reservoirs, while innovations in exploration and extraction techniques have made it possible to tap into unconventional and more challenging environments [76]. Figure 3 details a map with a global perspective showing the known largest O&G reserves, and Figure 4 shows the most relevant producers worldwide (2023).
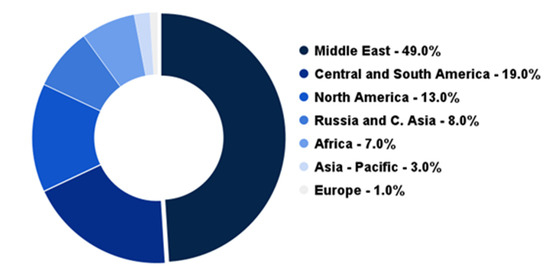
Figure 3.
Global oil reserves in 2023, organized by continent. Source: adapted from [75].
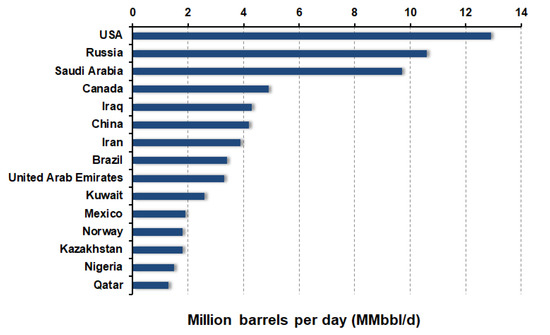
Figure 4.
World’s biggest oil producers in 2023 per country (MMbbl/d). Source: adapted from [77].
Globally, it is fair to indicate the total proven oil reserves to be, in 2023, 1777.06 billion barrels (Bbbl). Most parts of the reserves are located in Venezuela (303.00 Bbbl), Saudi Arabia (267.23 Bbbl), Iran (208.60 Bbbl), Canada (189. 49 Bbbl), Iraq (145.01 Bbbl), the United Arab Emirates (113.00 Bbbl), Russia (107.79 Bbbl), Kuwait (101.50 Bbbl), the United States (50.94 Bbbl), and Libya (48.36 Bbbl). The relevant oil producers worldwide, as of 2023, are detailed in Figure 4.
As shown in Figure 4, the USA led oil production in 2023, with an average of 12.90 MMbbl/d. Brazil was the eighth largest oil producer, producing approximately 3.40 MMbbl/d. This fact was only possible due to the discovery of the pre-salt accumulations in 2006 in Brazil [78]. Although both “MM” and “M” represent millions depending on the reference and system in use, the petroleum industry conventionally uses “MM”, as in MMbbl (million barrels of oil), while the International System of Units (SI) uses “M”, as in MW (megawatts) to denote power. Figure 5 shows Brazil’s oil production over the years, from 2012 until the second quarter of 2024.
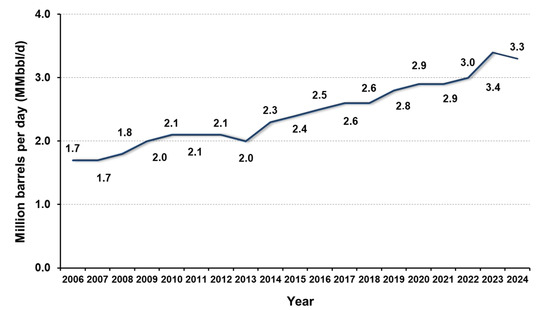
Figure 5.
Brazil’s oil production over the years from 2006 to date (MMbl/d). Source: adapted from [79].
The pre-salt carbonate reservoirs in Brazil represent one of the most important petroleum accumulations in the world [20,78]. In March 2024, the total production of oil in Brazil was approximately 3.35 MMbbl/d. Pre-salt production was responsible for 2.62 MMbbl/d, i.e., pre-salt production corresponded already to more than 75% of total production in Brazil [80].
According to the Ten-Year Energy Expansion Plan (PDE) 2031 from the Brazilian Public Energy Research Company (EPE), publicized in 2022, oil production in Brazil is expected to grow in the next years. It is expected to reach a total production in Brazil of about 5.20 MMbbl/d in 2029, driven mostly by the intention to increase the rate of production from the pre-salt fields in Brazil [81].
In recent decades, growing concerns about gas emission rates and their effects on the climate have prompted a global transformation in energy sources [82]. Figure 6 shows the countries that produced the most carbon dioxide (CO2) in 2023.
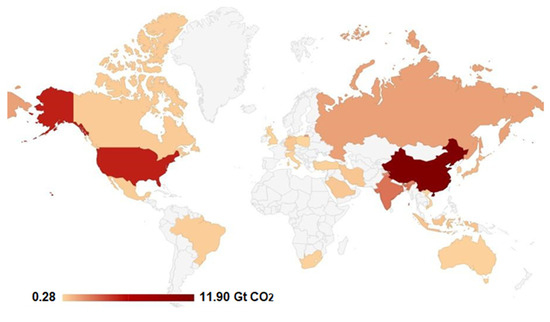
Figure 6.
Countries that produced the most CO2 in 2022. Source: adapted from [83].
In the world, approximately 39.02 billion of tons (Gt) of CO2 was emitted in 2023 [84]. Countries that most emitted CO2 in 2023 were China (11.90 billion metric tons—Gt), the United States (4.91 Gt), and India (3.06 Gt). Brazil was the twelfth largest CO2 emitter, producing approximately 0.48 Gt in the same year [83]. China, for example, has set ambitious goals to limit CO2 emissions by 2030 and achieve carbon neutrality by 2060, demonstrating a compromise to combatting climate change [13,85]. Figure 7 shows the total global CO2 emissions by sector in 2023.
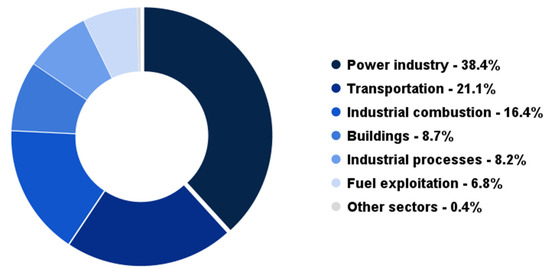
Figure 7.
Global CO2 emissions by sector in 2023. Source: adapted from [84].
According to Figure 7, the largest sources of CO2 emissions in 2023 were the power industry (14.92 Gt), transportation (8.23 Gt), industrial combustion (6.40 Gt), buildings (3.41 Gt), industrial processes (3.21 Gt), and fuel exploitation (2.66 Gt). The power industry was the largest contributor to CO2 emissions with an increase of 1.6% in 2023 [84]. To reduce CO2 emissions, large investments in renewable energy have been made in recent years, Figure 8 shows the energy investment in clean energy and fossil fuels.
According to Figure 8, USD 1740 billion was invested in clean energy and related industries in 2023. Investments were realized in renewable power sources (USD 659 billion), improvements in energy efficiency (USD 377 billion), grid systems (USD 331 billion), electric vehicles (USD 129 billion), battery storage (USD 37 billion), nuclear (USD 63 billion), and low-emission fuels and CCUS (USD 26 billion), among others. According to analyses developed by the Working Group on Renewable Energy Statistics (AGEE-Stat) in 2023, around 272.4 Terawatt hours (TWh) of renewable energy was generated, an increase of 7% compared to 2022 [86].
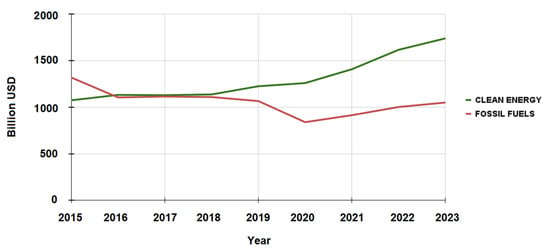
Figure 8.
Global energy investment in clean energy and fossil fuels. Source: adapted from [87].
Brazil’s energy matrix, despite the large amount of oil and natural gas produced, is more renewable and cleaner on a global scale [88]. The renewable energy sources in Brazil reached 47.4% in 2022, an increase of 2.6% compared to 2021. This fact occurred due to the expansion of hydroelectric power, growth in wind and solar power generation, and other renewable sources such as black liquor, biogas, and biomass [89]. This fact is important due to the need to reduce GHG emissions. Figure 9 shows the Brazilian energy matrix.
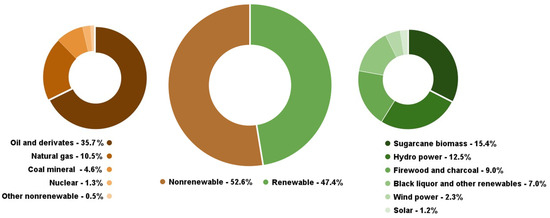
Figure 9.
Brazilian energy matrix in 2022. Source: adapted from [89].
The Brazilian energy matrix in 2022 was divided into nonrenewables (52.6%) and renewables (47.4%). The main nonrenewable sources were oil and derivates (35.7%), natural gas (10.5%), coal mineral (4.6%), and nuclear (1.3%). The main renewable sources were sugarcane biomass (15.4%), hydro (12.5%), and wind and solar (3.5%), among others. Figure 10 shows the primary energy consumption in the United States (reference: 2022).
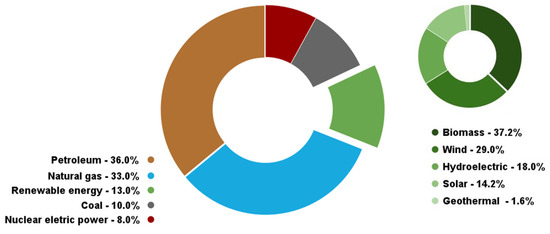
Figure 10.
U.S. primary energy consumption by energy source in 2022. Source: adapted from [90].
In 2022, renewable energy provided about 13% of all energy consumption in the United States (13.18 Btu) [91]. The main renewable energy source used was biomass (4.9%). Geothermal energy holds a unique place among renewable energy. However, it remains a small contributor, and it is overshadowed by other renewable energy sources [43]. Figure 11 shows the installed geothermal energy capacity over the years with a global perspective (megawatts—MW).
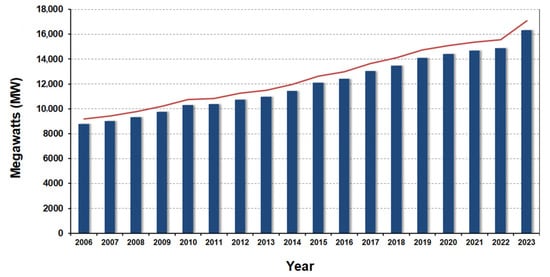
Figure 11.
Installed geothermal energy capacity around the world (MW) over the years. Source: adapted from [92].
Geothermal installed capacity worldwide has continued to grow in the last decade [10]. The total installed geothermal capacity in 2023 was approximately 16,335 MW. Between 2010 and 2020, the medium cost of electricity from geothermal power projects averaged between USD 0.049 and USD 0.085 per kWh [46]. Figure 12 shows the geothermal cumulative installed capacity worldwide in 2023.
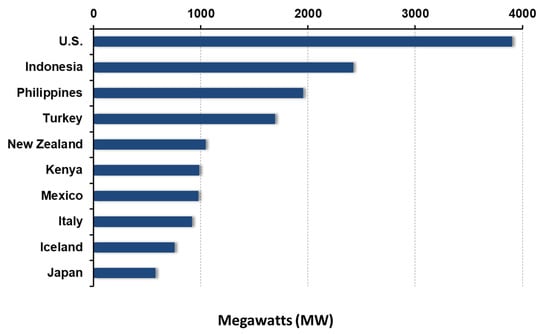
Figure 12.
Geothermal cumulative installed capacity worldwide in 2023 (MW). Source: adapted from [93].
The countries with the biggest cumulative installed capacity of geothermal energy as of the year-end in 2023 were the United States (3900 MW), Indonesia (2418 MW), the Philippines (1952 MW), Turkey (1691 MW), New Zealand (1042 MW), Kenya (985 MW), Mexico (976 MW), Italy (916 MW), Iceland (754 MW), and Japan (576 MW) [93]. In 2022, the heat and power sector in the United States employed 1539 [94]. Figure 13 shows the geothermal power units operating, pre-construction, and construction, as well as the announcements.
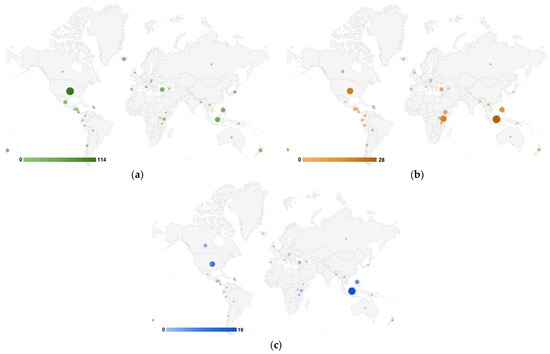
Figure 13.
Geothermal power units (May, 2024). (a) Operating; (b) pre-construction and construction; (c) announced. Source: adapted from [95].
Currently, distributed in 37 countries, there are 353 geothermal power units in operation, 35 in pre-construction, 93 in construction, and 45 announced [95]. The main geothermal projects in the world are shown in Table 3.
Table 3.
The main geothermal projects.
The Geysers Geothermal Complex is located in California (United States) and covers an area of approximately 78 km2. It is the world’s largest geothermal field in the world, consisting of 22 geothermal power plants with a total installed capacity of 1517 MW. With the first plant commissioned in 1913, the Larderello Geothermal Complex is one of the oldest geothermal plants in the world. The complex is located in central Italy and comprises 34 plants with a total capacity of 770 MW of electricity generation. Moreover, the geothermal reservoir depths range from 700 m to 4000 m below the surface. The Cerro Prieto Geothermal field is located in the northern part of Mexico. The initial plant started operating in 1973, while the fourth plant was put into service in 2000. A fifth plant, equipped with two 50 MW turbines, is presently under construction. The power station features four plants, comprising 13 units and 720 MW of capacity [96].
Parallel to geothermal energy, hydrogen exploration and production could offer a significant opportunity to reduce GHG emissions while ensuring a sustainable energy supply [12]. Figure 14 shows the hydrogen demand worldwide from 2019 to 2021 and a forecast for 2030.
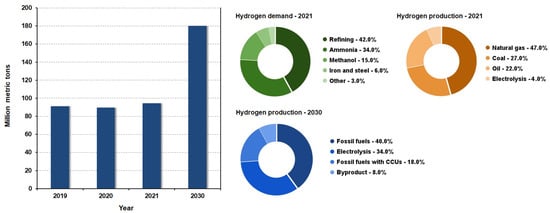
Figure 14.
Hydrogen demand worldwide from 2019 to 2021 and a forecast for 2030. Source: adapted from [56,97].
Global hydrogen demand reached 94 Mt (million metric tons) in 2021, and it is expected to double by 2030, reaching a total of 180 Mt [56]. Hydrogen was mainly used in the processes of refining (42.0%), ammonia (34.0%), methanol (15.0%), and iron and steel (6.0%). Currently, most of hydrogen production comes from fossil fuels, i.e., natural gas and coal [70,98]. From 94 Mt of hydrogen produced in 2021, only 0.04% was produced from water electrolysis using renewable energy sources [99]. Producing green hydrogen through water electrolysis is seen as the main method of hydrogen production; however, the current cost remains relatively high [62]. Figure 15 shows the hydrogen production cost in 2022–2023 and projections for 2060.
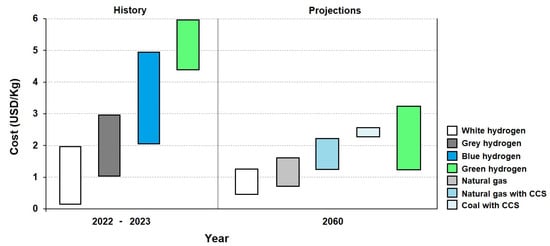
Figure 15.
Hydrogen production costs. Source: adapted from [100].
According to Figure 15, natural hydrogen (white hydrogen) was the lowest-cost method of production of hydrogen in 2022–2023 and will remain in 2060. Hydrogen production costs were as follows: white hydrogen (less than USD 2 per Kg), gray hydrogen (range of USD 1 to USD 3 per Kg), blue hydrogen (range of USD 2 to USD 5 per Kg), and green hydrogen (range of USD 4.5 to USD 6 per Kg). In addition, white and green hydrogen emit less than 1 Kg CO2e (carbon dioxide equivalent) per Kg H2, while blue and gray hydrogen produce 3 and 9 Kg CO2e per Kg H2, respectively [100]. However, over time, it is expected that the costs associated with electrolyzes will decrease because solar electricity will become cheaper and raw material costs in fossil fuel reforming will increase, favoring electrolysis [56]. Figure 16 shows the global hydrogen production in the sustainable development scenario (2019–2070).
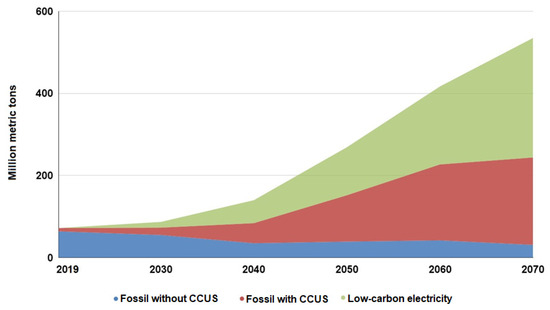
Figure 16.
Global hydrogen production in the sustainable development scenario, 2019–2070. Source: adapted from [101].
It is expected that by 2070, hydrogen production will suffer a gradual transformation, with the majority being generated from electricity sourced from renewable energies and fossil fuels associated with CCUS [58]. It is expected to produce the following amount of hydrogen in 2070: 31 Mt of fossil hydrogen (produced from fossil fuels) without CCUS, 213 Mt of fossil hydrogen with CCUS, and 291 Mt of low-carbon electricity [101]. This gradual change will occur due to several key factors. The main factor is the electrolysis cost reduction, with solar panel costs expected to decrease by 40% and turbine costs by 27%. With advancements in turbine size and solar panel technologies, annual operating hours could increase by 10 to 30% depending on the technology and region. Additionally, the capital costs of electrolyzers are projected to drop by 25 to 30% as financial risks continue to decrease. The growing demand for low-carbon energy in sectors like steel production, ammonia manufacturing, and aviation will further drive adoption. Policy and regulatory support will accelerate this change through subsidies, carbon pricing, and incentives promoting renewable hydrogen. Finally, energy security concerns and market changes will encourage countries to reduce reliance on fossil fuel imports by investing in domestic renewable hydrogen production, solidifying its role in the global energy landscape. Thus, the global average cost of green hydrogen, which was USD 5 per kg in 2020, is expected to reach USD 2 per kg [102]. Figure 17 shows the forecast hydrogen demand worldwide in a sustainable development scenario from 2019 to 2070 by sector.
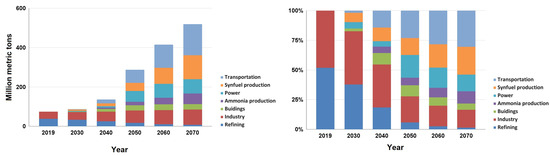
Figure 17.
Forecast hydrogen demand worldwide in a sustainable development scenario from 2019 to 2070 by sector. (a) Million metric tons; (b) percentage. Source: adapted from [103].
From the perspective of hydrogen demand, it is expected that the energy applications of hydrogen and its byproducts will become dominant, particularly as fuel for the transportation sector. In contrast, the use of hydrogen in the refining sector is projected to decline over this period [58]. All hydrogen produced in 2019 was used in industry (32.6 Mt) and refining (38.4 Mt). However, in 2070, this scenario will be changing, i.e., the main hydrogen demand will be transportation (158.2 Mt), synfuel production (121.5 Mt), power (72.9 Mt), industry (77.7 Mt), ammonia production (53.6 Mt), buildings (27.4 Mt), and refining (7.8 Mt).
To achieve net-zero emissions by 2050, the world will need to invest approximately USD 700 billion in hydrogen by 2030. Globally, the industry has announced 680 large-scale hydrogen project proposals in 2022, equivalent to USD 240 billion in direct investment through 2030 [104]. Of the USD 240 billion announced, about 65% is to clean hydrogen supply, 25% for end use, and 10 to transmission and distribution. However, only about 10% has reached the final investment decision or is under construction or operation. Europe leads, with over 30% of the proposed hydrogen investment globally [104].
Hydrogen production in Latin America from electrolysis could reach almost 6.0 Mt by 2030 due to announced projects, particularly in Chile (which accounts for 45.0% of the electrolytic hydrogen production of the announced projects in Latin America), as well as in Brazil and Argentina (which together represent 30.0% of the production) [105]. Investments announced in plants for green hydrogen production in Brazil total more than USD 25 billion [106]. In addition, Petrobras will invest nearly R$ 20 million in research about the processes for generating and extracting natural hydrogen in Brazil [107]. Figure 18 shows the hydrogen production projects in Brazil.
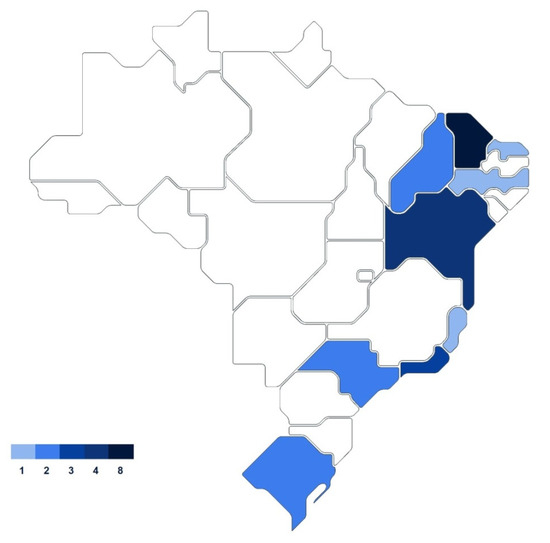
Figure 18.
Hydrogen production projects in Brazil. Source: adapted from [108].
Most of the investments are concentrated in the following ports: Port of Pecém (Ceará), Suape (Pernambuco), and Açu (Rio de Janeiro). The industrial port complexes combine strategic factors for the advancement of the hydrogen supply chain, including access to industrial hubs, logistics for export, and proximity to renewable energy sources [106]. The projects in Brazil, which total 12,921 MW and 2237 Kt per year of hydrogen production by 2030, are divided into the concept, demonstration project, feasibility study, construction, and operation [109]. These investments are part of the 2023–2025 Triennial Work Plan of the National Hydrogen Program, which defines the strategies for Brazil based on three timeframes as follows: (i) by 2025, establish pilot plants for low-carbon hydrogen throughout the country; (ii) by 2030, position Brazil as a competitive producer of low-carbon hydrogen; (iii) by 2035, develop and solidify low-carbon hydrogen hubs in Brazil [105].
6. Conclusions
The transition to renewable energy is crucial for reducing carbon emissions and combating climate change. Geothermal and natural hydrogen exploration/exploitation represent promising avenues for diversifying the global energy matrix. In 2022, fossil fuels dominated the global energy landscape, contributing significantly to CO2 emissions. However, substantial investments in renewable energy recently indicate a shift toward cleaner energy sources.
Geothermal energy, with its ability to provide a stable and weather-independent power supply, is a viable renewable energy source. Despite the challenges associated with drilling in high-temperature and hard rock formations, advancements in drilling technologies can guarantee efficient and optimized operations and reduce costs, making geothermal energy more competitive.
Natural hydrogen, although in its nascent stages, shows potential for becoming a major energy source. The geoscience-related processes that produce and accumulate natural hydrogen and the technology and knowledge transfer from the oil and gas industry, especially from the drilling discipline, can facilitate its extraction. The increasing global interest and investments in hydrogen projects underscore its global significance.
Overall, the exploration and development of geothermal and natural hydrogen resources are essential for reaching a sustainable and low-carbon future. The continued advancement of drilling technologies will play a vital role in making these energy sources economically feasible and sustainably explored, contributing to the global effort to reduce carbon emissions and deal with climate changes.
As a continuation of this specific research, the next step will be a more detailed look at drilling techniques and technologies in addition to advances in know-how, focusing on comparisons across the specificities and differences in drilling operations for access to different natural energy resources.
Author Contributions
Conceptualization, D.Z.M.; methodology, D.Z.M. and A.N.; formal analysis, D.Z.M. and A.N.; writing—original draft preparation, D.Z.M.; writing—review and editing, A.N., J.D.H., M.H.M. and M.R.; supervision, A.N. All authors have read and agreed to the published version of the manuscript.
Funding
This study was financed, in part, by the São Paulo Research Foundation (FAPESP), Brazil. process number 2024/10600-0; by the Human Resources Program from the National Agency of Petroleum, Natural Gas and Biofuels (PRH-ANP) through the PRH-ANP/FAPESP 34.1 FEG/UNESP, Brazil; by the National Council for Scientific and Technological Development (CNPq), Brazil; by the Coordenação de Aperfeiçoamento de Pessoal de Nível Superior (CAPES)—Finance Code 001, Brazil; and by the Alexander von Humboldt Foundation (AvH), Germany.
Conflicts of Interest
The authors declare no conflicts of interest.
References
- Song, X.; Li, G.; Huang, Z.; Shi, Y.; Wang, G.; Song, G.; Xu, F. Review of High-Temperature Geothermal Drilling and Exploitation Technologies. Gondwana Res. 2023, 122, 315–330. [Google Scholar] [CrossRef]
- Li, T.; Yue, X.G.; Qin, M.; Norena-Chavez, D. Towards Paris Climate Agreement Goals: The Essential Role of Green Finance and Green Technology. Energy Econ. 2024, 129, 107273. [Google Scholar] [CrossRef]
- Lewandowska-Śmierzchalska, J.; Uliasz-Misiak, B. Assessment of Potential Sites for Simultaneous Exploitation of Geothermal Energy and CO2 Storage in Aquifers: Multi-Criteria Approach. Renew. Energy 2024, 226, 120449. [Google Scholar] [CrossRef]
- Acen, C.; Bamisile, O.; Cai, D.; Ukwuoma, C.C.; Obiora, S.; Huang, Q.; Uzun Ozsahin, D.; Adun, H. The Complementary Role of Carbon Dioxide Removal: A Catalyst for Advancing the COP28 Pledges towards the 1.5 °C Paris Agreement Target. Sci. Total Environ. 2024, 947, 174302. [Google Scholar] [CrossRef] [PubMed]
- Salman, M.; Wang, G.; Qin, L.; He, X. G20 Roadmap for Carbon Neutrality: The Role of Paris Agreement, Artificial Intelligence, and Energy Transition in Changing Geopolitical Landscape. J. Environ. Manag. 2024, 367, 122080. [Google Scholar] [CrossRef] [PubMed]
- Chatjuthamard, P.; Singh, S.; Jiraporn, P.; Lee, S.M. Climate Change Exposure, Shareholder Wealth, and the Adoption of the Paris Agreement: A Text-Based Approach. Int. Rev. Financ. Anal. 2024, 94, 103327. [Google Scholar] [CrossRef]
- Korucan, A.; Derin-Gure, P.; Celebi, B.; Baker, D.; Vander Velde, M. Opportunities and Challenges of Geothermal Energy in Turkiye. Energy Sustain. Dev. 2024, 79, 101417. [Google Scholar] [CrossRef]
- Li, J.; Tarpani, R.R.Z.; Stamford, L.; Gallego-Schmid, A. Life Cycle Sustainability Assessment and Circularity of Geothermal Power Plants. Sustain. Prod. Consum. 2023, 35, 141–156. [Google Scholar] [CrossRef]
- World Energy Outlook 2020. Available online: https://www.iea.org/reports/world-energy-outlook-2020/outlook-for-electricity#abstract (accessed on 5 September 2024).
- Nardini, I. Geothermal Power Generation. In Palgrave Handbook of International Energy Economics; Springer International Publishing: Cham, Switzerland, 2022; pp. 183–194. [Google Scholar] [CrossRef]
- Kubota, H.; Hondo, H.; Hienuki, S.; Kaieda, H. Determining Barriers to Developing Geothermal Power Generation in Japan: Societal Acceptance by Stakeholders Involved in Hot Springs. Energy Policy 2013, 61, 1079–1087. [Google Scholar] [CrossRef]
- Elam, C.C.; Padró, C.E.G.; Sandrock, G.; Luzzi, A.; Lindblad, P.; Hagen, E.F. Realizing the Hydrogen Future: The International Energy Agency’s Efforts to Advance Hydrogen Energy Technologies. Int. J. Hydrogen Energy 2003, 28, 601–607. [Google Scholar] [CrossRef]
- Isania, F.; Elahifar, B. Advances in Geothermal Drilling: A Comparative Study with Oil and Gas Techniques. Geoenergy Sci. Eng. 2025, 246, 213638. [Google Scholar] [CrossRef]
- Gowida, A.; Gamal, H.; Elkatatny, S. Exploring the Potential of Laser Technology in Oil Well Drilling: An Overview. Geoenergy Sci. Eng. 2023, 230, 212278. [Google Scholar] [CrossRef]
- Feder, J. Geothermal Well Construction: A Step Change in Oil and Gas Technologies. J. Pet. Technol. 2021, 73, 32–35. [Google Scholar] [CrossRef]
- Li, Q.; Li, Q.; Wu, J.; Li, X.; Li, H.; Cheng, Y. Wellhead Stability During Development Process of Hydrate Reservoir in the Northern South China Sea: Evolution and Mechanism. Processes 2024, 13, 40. [Google Scholar] [CrossRef]
- Li, Q.; Li, Q.; Cao, H.; Wu, J.; Wang, F.; Wang, Y. The Crack Propagation Behaviour of CO2 Fracturing Fluid in Unconventional Low Permeability Reservoirs: Factor Analysis and Mechanism Revelation. Processes 2025, 13, 159. [Google Scholar] [CrossRef]
- Peymanian, M.H.; Kariminezhad, H.; Dehestani, M. Thermal Drilling for Application in Gas and Oil Wells: Efficiency Enhancement by Acoustic Inspection. Gas. Sci. Eng. 2023, 115, 205000. [Google Scholar] [CrossRef]
- Mantegazini, D.Z.; Guzman, R.; Nascimento, A.; Hugo Mathias, M.; Joel Romero Guzman, O.; Reich, M. Optimization of Rate of Penetration and Mechanical Specific Energy Using Response Surface Methodology and Multi-Objective Optimization. Appl. Sci. 2025, 15, 1390. [Google Scholar] [CrossRef]
- Mantegazini, D.Z.; Nascimento, A.; Dornelas, V.F.; Mathias, M.H. Analysis and Multi-Objective Optimization of the Rate of Penetration and Mechanical Specific Energy: A Case Study Applied to a Carbonate Hard Rock Reservoir Based on a Drill Rate Test Using Play-Back Methodology. Appl. Sci. 2024, 14, 2234. [Google Scholar] [CrossRef]
- Khoshouei, M.; Bagherpour, R. Measurement, Prediction, and Modeling of the Drilling Specific Energy by Soft Rock Properties during the Drilling Operation. Measurement 2023, 222, 113679. [Google Scholar] [CrossRef]
- Lee, S.S.; Kim, K.Y.; Seo, J.W. Development of a Trip Time for Bit Exchange Simulator for Drilling Time Estimation. Geothermics 2018, 71, 24–33. [Google Scholar] [CrossRef]
- Jamali, S.; Wittig, V.; Börner, J.; Bracke, R.; Ostendorf, A. Application of High Powered Laser Technology to Alter Hard Rock Properties towards Lower Strength Materials for More Efficient Drilling, Mining, and Geothermal Energy Production. Geomech. Energy Environ. 2019, 20, 100112. [Google Scholar] [CrossRef]
- Chen, X.; Yang, Q.; Yang, J.; Gao, D.; Zou, Y.; Zhu, M. The Stress Field Simulation of a Novel M-Type Convex Stepped Bottomhole and the Rate of Penetration Enhancement Mechanism of a New Type of Central-Grooved PDC Bit for Offshore Deep & Ultradeep Well Drilling. Ocean Eng. 2024, 293, 116706. [Google Scholar] [CrossRef]
- Liu, W.; Zhu, X.; Lv, Y.X.; Tong, H. On the Mechanism of Thermally Induced Micro-Cracking Assisted Rock Cutting in Hard Formation. J. Pet. Sci. Eng. 2021, 196, 107666. [Google Scholar] [CrossRef]
- Zhang, D.; Yang, Y.; Ren, H.; Huang, K.; Niu, S. Experimental Research on Efficiency and Vibration of Polycrystalline Diamond Compact Bit in Heterogeneous Rock. J. Pet. Sci. Eng. 2023, 220, 111175. [Google Scholar] [CrossRef]
- Khaled, M.S.; Wang, N.; Ashok, P.; van Oort, E. Downhole Heat Management for Drilling Shallow and Ultra-Deep High Enthalpy Geothermal Wells. Geothermics 2023, 107, 102604. [Google Scholar] [CrossRef]
- Hai, W.; Xue, Q.; Wang, M.; He, Y. Parameter Optimization Based on Deepwater Drilling System Simulation: A Pre-Salt Exploration Well in Brazil. Geoenergy Sci. Eng. 2024, 241, 213120. [Google Scholar] [CrossRef]
- Dias, W.; Mejia, C.; Roehl, D. Cavern Integrity under Cyclic Underground Hydrogen Storage in Heterogeneous Brazilian Pre-Salt Formations. Int. J. Hydrogen Energy 2024, 94, 922–933. [Google Scholar] [CrossRef]
- Gonzaga, H.M.; Novo, T.A.; Gama da Silva, J.T.; Fonte Boa, T.M.R.; Gonçalves, L.C.; Cordeiro, M. da S. Stratigraphy and Drilling Geomechanics of a Thick Salt Section: The Ariri Formation in the Eastern Portion of the Santos Basin. J. S. Am. Earth Sci. 2024, 135, 104802. [Google Scholar] [CrossRef]
- Chen, X.; Gao, D.; Guo, B.; Feng, Y. Real-Time Optimization of Drilling Parameters Based on Mechanical Specific Energy for Rotating Drilling with Positive Displacement Motor in the Hard Formation. J. Nat. Gas. Sci. Eng. 2016, 35, 686–694. [Google Scholar] [CrossRef]
- Chen, X.; Weng, C.; Du, X.; Yang, J.; Gao, D.; Wang, R. Prediction of the Rate of Penetration in Offshore Large-Scale Cluster Extended Reach Wells Drilling Based on Machine Learning and Big-Data Techniques. Ocean Eng. 2023, 285, 115404. [Google Scholar] [CrossRef]
- Nascimento, A. Mathematical Modeling for Drilling Optimization in Pre-Salt Sections: A Focus on South Atlantic Ocean Operations. Ph.D Thesis, Sao Paulo State University—UNESP, Sao Paulo, Brazil, 2016. [Google Scholar]
- Wang, X.; Zhang, F.; Wang, X.; Yu, Y.; Lou, W.; Peng, F. Evaluating the Maximum Drilling Length of Horizontal Geothermal Wells Utilizing Temperature Constraints. Geoenergy Sci. Eng. 2024, 238, 212884. [Google Scholar] [CrossRef]
- Hao, J.; You, Q.; Peng, Z.; Ma, D.; Tian, Y. A Model-Free Toolface Control Strategy for Cross-Well Intelligent Directional Drilling. Eng. Appl. Artif. Intell. 2024, 133, 108272. [Google Scholar] [CrossRef]
- Hao, J.; Ma, D.; Liu, W.; Peng, Z.; Chen, D.; Wang, Y. Adaptive Decision Method of Directional Drilling Tool Face Based on Model Free Online Learning. In Proceedings of the 2022 IEEE 61st Conference on Decision and Control (CDC), Cancun, Mexico, 6–9 December 2022; pp. 4688–4693. [Google Scholar] [CrossRef]
- Gillan, C.; Boone, S.; Kostiuk, G.; Schlembach, C.; Pinto, J.; LeBlanc, M. Applying Precision Drill Pipe Rotation and Oscillation to Slide Drilling Problems. In Proceedings of the SPE/IADC Drilling Conference and Exhibition, Amsterdam, The Netherlands, 17–19 March 2009; pp. 53–65. [Google Scholar] [CrossRef]
- Xu, B.L.; Liu, S.Y.; Li, H.S. Drill String’s Axial Force Transfer Law in Slide Directional Drilling in Underground Coal Mine. Tunn. Undergr. Space Technol. 2022, 130, 104701. [Google Scholar] [CrossRef]
- Benti, N.E.; Woldegiyorgis, T.A.; Geffe, C.A.; Gurmesa, G.S.; Chaka, M.D.; Mekonnen, Y.S. Overview of Geothermal Resources Utilization in Ethiopia: Potentials, Opportunities, and Challenges. Sci. Afr. 2023, 19, e01562. [Google Scholar] [CrossRef]
- Geothermal Energy. Available online: https://understand-energy.stanford.edu/energy-resources/renewable-energy/geothermal-energy (accessed on 28 September 2024).
- Walch, A.; Li, X.; Chambers, J.; Mohajeri, N.; Yilmaz, S.; Patel, M.; Scartezzini, J.L. Shallow Geothermal Energy Potential for Heating and Cooling of Buildings with Regeneration under Climate Change Scenarios. Energy 2022, 244, 123086. [Google Scholar] [CrossRef]
- Geothermal. Available online: https://www.irena.org/Energy-Transition/Technology/Geothermal-energy (accessed on 10 October 2024).
- Renewables 2023 Global Status Report Collection. Available online: https://www.ren21.net/gsr-2023/modules/energy_supply/02_market_developments/02_geothermal/ (accessed on 16 October 2024).
- Global Geothermal Market and Technology Assessment. Available online: https://www.irena.org/Publications/2023/Feb/Global-geothermal-market-and-technology-assessment (accessed on 16 October 2024).
- Kruszewski, M.; Wittig, V. Review of Failure Modes in Supercritical Geothermal Drilling Projects. Geotherm. Energy 2018, 6, 28. [Google Scholar] [CrossRef]
- Geothermal Plants. Available online: https://www.enelgreenpower.com/learning-hub/renewable-energies/geothermal-energy/geothermal-plants (accessed on 2 October 2024).
- Comparing Geothermal with Petroleum Drilling. Available online: https://www.thinkgeoenergy.com/comparing-geothermal-with-petroleum-drilling/ (accessed on 18 October 2024).
- Finger, J.; Blankenship, D. Handbook of Best Practices for Geothermal Drilling; Sandia Report 2010; Sandia National Laboratories: Albuquerque, NM, USA, 2010. Available online: https://www.energy.gov/eere/geothermal/articles/handbook-best-practices-geothermal-drilling (accessed on 20 October 2024).
- Lyu, Z.; Song, X.; Li, G. Numerical Analysis of Characteristics of Reaction in Hydrothermal Jet Drilling for Geothermal Energy. Geothermics 2019, 77, 62–74. [Google Scholar] [CrossRef]
- Yehia, T.; Gasser, M.; Ebaid, H.; Meehan, N.; Okoroafor, E.R. Comparative Analysis of Machine Learning Techniques for Predicting Drilling Rate of Penetration (ROP) in Geothermal Wells: A Case Study of FORGE Site. Geothermics 2024, 121, 103028. [Google Scholar] [CrossRef]
- Erge, O.; Sakaoglu, K.; Sonmez, A.; Bagatir, G.; Dogan, H.A.; Ay, A.; Gucuyener, I.H. Overview and Design Principles of Drilling Fluids Systems for Geothermal Wells in Turkey. Geothermics 2020, 88, 101897. [Google Scholar] [CrossRef]
- Mohamed, A.K.; Elkatatny, S.A.; Mahmoud, M.A.; Shawabkeh, R.A.; Al-Majed, A.A. The Evaluation of Micronized Barite as a Weighting Material for Completing HPHT Wells. In Proceedings of the SPE Middle East Oil and Gas Show and Conference, Manama, UK, 6–9 March 2017; pp. 697–712. [Google Scholar] [CrossRef]
- Mohamed, A.; Salehi, S.; Ahmed, R. Significance and Complications of Drilling Fluid Rheology in Geothermal Drilling: A Review. Geothermics 2021, 93, 102066. [Google Scholar] [CrossRef]
- Gutiérrez-Negrín, L.C.A. Evolution of Worldwide Geothermal Power 2020–2023. Geotherm. Energy 2024, 12, 14. [Google Scholar] [CrossRef]
- Jia, G.; Lei, M.; Li, M.; Xu, W.; Li, R.; Lu, Y.; Cai, M. Hydrogen Embrittlement in Hydrogen-Blended Natural Gas Transportation Systems: A Review. Int. J. Hydrogen Energy 2023, 48, 32137–32157. [Google Scholar] [CrossRef]
- Blay-Roger, R.; Bach, W.; Bobadilla, L.F.; Reina, T.R.; Odriozola, J.A.; Amils, R.; Blay, V. Natural Hydrogen in the Energy Transition: Fundamentals, Promise, and Enigmas. Renew. Sustain. Energy Rev. 2024, 189, 113888. [Google Scholar] [CrossRef]
- Balat, M. Possible Methods for Hydrogen Production. Energy Sources Part A Recover. Util. Environ. Eff. 2008, 31, 39–50. [Google Scholar] [CrossRef]
- Ten-Year Energy Expansion Plan 2031. Available online: https://www.epe.gov.br/en/press-room/news/mme-launches-english-version-of-the-ten-year-energy-expansion-plan-pde-2031 (accessed on 6 October 2024).
- Knez, D.; Zamani, O.A.M. Up-to-Date Status of Geoscience in the Field of Natural Hydrogen with Consideration of Petroleum Issues. Energies 2023, 16, 6580. [Google Scholar] [CrossRef]
- Ji, M.; Wang, J. Review and Comparison of Various Hydrogen Production Methods Based on Costs and Life Cycle Impact Assessment Indicators. Int. J. Hydrogen Energy 2021, 46, 38612–38635. [Google Scholar] [CrossRef]
- The Colors of Hydrogen. Available online: https://www.belfercenter.org/research-analysis/colors-hydrogen (accessed on 2 October 2024).
- Tian, Q.; Yao, S.; Shao, M.; Zhang, W.; Wang, H.; Tian, Q.; Yao, S.; Shao, M.; Zhang, W.; Wang, H. Origin, Discovery, Exploration and Development Status and Prospect of Global Natural Hydrogen under the Background of “Carbon Neutrality”. China Geol. 2022, 5, 722–733. [Google Scholar] [CrossRef]
- Zgonnik, V. The Occurrence and Geoscience of Natural Hydrogen: A Comprehensive Review. Earth-Sci. Rev. 2020, 203, 103140. [Google Scholar] [CrossRef]
- Milkov, A.V. Molecular Hydrogen in Surface and Subsurface Natural Gases: Abundance, Origins and Ideas for Deliberate Exploration. Earth-Sci. Rev. 2022, 230, 104063. [Google Scholar] [CrossRef]
- Sun, B.; Zhang, M.; Sun, Q.; Zhong, J.; Shao, G. Review on Natural Hydrogen Wells Safety. Nat. Commun. 2025, 16, 369. [Google Scholar] [CrossRef]
- Colombo, C.; Zafra García, A.; Belzunce, J.; Fernandez Pariente, I. Sensitivity to Hydrogen Embrittlement of AISI 4140 Steel: A Numerical Study on Fracture Toughness. Theor. Appl. Fract. Mech. 2020, 110, 102810. [Google Scholar] [CrossRef]
- Overview of Hydrogen Embrittlement. Available online: https://inspectioneering.com/tag/hydrogen+embrittlement (accessed on 26 October 2024).
- Brandt, A.R. Greenhouse Gas Intensity of Natural Hydrogen Produced from Subsurface Geologic Accumulations. Joule 2023, 7, 1818–1831. [Google Scholar] [CrossRef]
- Prinzhofer, A.; Moretti, I.; Françolin, J.; Pacheco, C.; D’Agostino, A.; Werly, J.; Rupin, F. Natural Hydrogen Continuous Emission from Sedimentary Basins: The Example of a Brazilian H2-Emitting Structure. Int. J. Hydrogen Energy 2019, 44, 5676–5685. [Google Scholar] [CrossRef]
- Frery, E.; Langhi, L.; Maison, M.; Moretti, I. Natural Hydrogen Seeps Identified in the North Perth Basin, Western Australia. Int. J. Hydrogen Energy 2021, 46, 31158–31173. [Google Scholar] [CrossRef]
- Arrouvel, C.; Prinzhofer, A. Genesis of Natural Hydrogen: New Insights from Thermodynamic Simulations. Int. J. Hydrogen Energy 2021, 46, 18780–18794. [Google Scholar] [CrossRef]
- Prinzhofer, A.; Tahara Cissé, C.S.; Diallo, A.B. Discovery of a Large Accumulation of Natural Hydrogen in Bourakebougou (Mali). Int. J. Hydrogen Energy 2018, 43, 19315–19326. [Google Scholar] [CrossRef]
- Truche, L.; Donzé, F.V.; Goskolli, E.; Muceku, B.; Loisy, C.; Monnin, C.; Dutoit, H.; Cerepi, A. A Deep Reservoir for Hydrogen Drives Intense Degassing in the Bulqizë Ophiolite. Science 2024, 383, 618–621. [Google Scholar] [CrossRef]
- International Energy Outlook 2023. Available online: https://www.eia.gov/outlooks/ieo/pdf/IEO2023_Narrative.pdf (accessed on 26 October 2024).
- World Energy Review 2024. Available online: https://www.eni.com/content/dam/enicom/documents/eng/visione/wer/2024/World-Energy-Review-2024.pdf (accessed on 26 October 2024).
- Hunt, J.D.; Nascimento, A.; Nascimento, N.; Vieira, L.W.; Romero, O.J. Possible Pathways for Oil and Gas Companies in a Sustainable Future: From the Perspective of a Hydrogen Economy. Renew. Sustain. Energy Rev. 2022, 160, 112291. [Google Scholar] [CrossRef]
- Maiores Produtores Mundiais de Petróleo Em 2023. Available online: https://www.ibp.org.br/observatorio-do-setor/snapshots/maiores-produtores-mundiais-de-petroleo/ (accessed on 28 October 2024).
- Rossoni, R.B.; Porcher, C.C.; Koester, E.; Sobiesiak, J.S.; da Silva, L.A.C.; Mexias, A.S.; Gomes, M.E.B.; Ramnani, C.W.; De Ros, L.F. The Role of Compaction in the Diagenetic Evolution of Pre-Salt Aptian Deposits of Santos Basin, Brazil. Sediment. Geol. 2024, 466, 106650. [Google Scholar] [CrossRef]
- Evolução Da Produção, Exportação e Importação de Petróleo No Brasil. Available online: https://www.ibp.org.br/observatorio-do-setor/producao-importacao-e-exportacao-de-petroleo/ (accessed on 28 October 2024).
- Boletim Mensal Da Produção de Petróleo e Gás Natural. Available online: https://www.gov.br/anp/pt-br/centrais-de-conteudo/publicacoes/boletins-anp/boletins/boletim-mensal-da-producao-de-petroleo-e-gas-natural (accessed on 18 December 2024).
- Petróleo Deve Elevar Fortemente Arrecadação Até 2030, Mas é Preciso Evitar Mau Uso Dessa Receita. Available online: https://portalibre.fgv.br/revista-conjuntura-economica/carta-da-conjuntura/petroleo-deve-elevar-fortemente-arrecadacao-ate (accessed on 24 October 2024).
- Lima, G.; Nascimento, A.; Oliveira, M.P.; Dias, F.L.G.; Lima, G.; Nascimento, A.; Oliveira, M.P.; Dias, F.L.G. Energy Efficiency Analysis: A Household Digital Transformation. AIMS Energy 2024, 12, 774–808. [Google Scholar] [CrossRef]
- Carbon Dioxide Emissions of the Most Polluting Countries Worldwide in 2010 and 2022. Available online: https://www.statista.com/statistics/270499/co2-emissions-in-selected-countries/ (accessed on 25 October 2024).
- Statista Global Fossil Carbon Dioxide Emissions from 1970 to 2023, by Sector. Available online: https://www.statista.com/statistics/276480/world-carbon-dioxide-emissions-by-sector/ (accessed on 8 November 2024).
- Shi, L.; Zou, D.; He, Z.; Gao, D. Fluid–Solid Coupling Simulation of a New Hydraulic Self-Adaptive PDC Cutter for Improving Well-Drilling Efficiency in Complex Formations. Energy Rep. 2021, 7, 5885–5894. [Google Scholar] [CrossRef]
- Renewable Energies Continue to Pick up Speed in 2023. Available online: https://www.umweltbundesamt.de/en/topics/renewable-energies-continue-to-pick-up-speed-in (accessed on 6 November 2024).
- Global Energy Investment in Clean Energy and in Fossil Fuels, 2015–2023. Available online: https://www.iea.org/data-and-statistics/charts/global-energy-investment-in-clean-energy-and-in-fossil-fuels-2015-2023 (accessed on 6 November 2024).
- Ávila, R. The Importance of Exploration and Production in the Energy Transition. In Proceedings of the Geosciences Technology Workshop 2023, Rio de Janeiro, Brazil, 9–10 May 2023. [Google Scholar]
- Summary Report 2023. Brazilian Energy Balanc. Available online: https://www.epe.gov.br/en/publications/publications/brazilian-oil-gas-report (accessed on 12 November 2024).
- What Is Energy? Available online: https://www.eia.gov/energyexplained/what-is-energy/sources-of-energy.php (accessed on 28 October 2024).
- Renewable Energy Explained. Available online: https://www.eia.gov/energyexplained/renewable-sources/ (accessed on 10 November 2024).
- Total Geothermal Capacity. Available online: https://ourworldindata.org/grapher/installed-geothermal-capacity?time=2022 (accessed on 8 November 2024).
- Top 10 Geothermal Countries 2023—Power Generation Capacity. Available online: https://www.thinkgeoenergy.com/thinkgeoenergys-top-10-geothermal-countries-2023-power-generation-capacity/ (accessed on 10 November 2024).
- Number Os Employees in Utilities in the United States in 2022. Available online: https://www.statista.com/statistics/186355/number-of-employees-at-utilities-in-the-us/ (accessed on 8 November 2024).
- Global Geothermal Power Tracker. Available online: https://globalenergymonitor.org/projects/global-geothermal-power-tracker/ (accessed on 22 November 2024).
- Geothermal Energy. Available online: https://www.oil-gasportal.com/main-world-geothermal-projects/ (accessed on 24 November 2024).
- Hydrogen Demand Worldwide from 2019 to 2021, with a Forecast for 2030. Available online: https://www.statista.com/statistics/1121206/global-hydrogen-demand/ (accessed on 22 November 2024).
- Wang, L.; Cheng, J.; Jin, Z.; Sun, Q.; Zou, R.; Meng, Q.; Liu, K.; Su, Y.; Zhang, Q. High-Pressure Hydrogen Adsorption in Clay Minerals: Insights on Natural Hydrogen Exploration. Fuel 2023, 344, 127919. [Google Scholar] [CrossRef]
- Incer-Valverde, J.; Korayem, A.; Tsatsaronis, G.; Morosuk, T. “Colors” of Hydrogen: Definitions and Carbon Intensity. Energy Convers. Manag. 2023, 291, 117294. [Google Scholar] [CrossRef]
- Solutions to the Green Hydrogen Deficit. Available online: https://helios-aragon.com/ (accessed on 26 November 2024).
- Global Hydrogen Production in the Sustainable Development Scenario, 2019–2070. Available online: https://www.iea.org/data-and-statistics/charts/global-hydrogen-production-in-the-sustainable-development-scenario-2019-2070 (accessed on 26 November 2024).
- Hydrogen Forecast to 2050. Available online: https://www.dnv.com/focus-areas/hydrogen/forecast-to-2050/ (accessed on 26 November 2024).
- Forecast Hydrogen Demand Worldwide in a Sustainable Development Scenario from 2019 to 2070, by Sector. Available online: https://www.statista.com/statistics/760001/global-hydrogen-demand-by-sector-sustainable-scenario/ (accessed on 29 November 2024).
- Hydrogen Insights 2022. Available online: https://hydrogencouncil.com/en/hydrogen-insights-2022/ (accessed on 29 November 2024).
- Global Hydrogen Review 2023. Available online: https://www.iea.org/reports/global-hydrogen-review-2023 (accessed on 30 November 2024).
- Hidrogênio de Baixo Carbono: Oportunidades Para o Protagonismo Brasileiro Na Produção de Energia Limpa. Available online: https://web.bndes.gov.br/bib/jspui/bitstream/1408/22665/1/PRLiv_Hidrog%C3%AAnio%20de%20baixo%20carbono_215712.pdf (accessed on 30 November 2024).
- Petrobras Investirá R$ 20 Milhões Em Pesquisas Sobre Hidrogênio Natural. Available online: https://agencia.petrobras.com.br/w/sustentabilidade/petrobras-investira-r-20-milhoes-em-pesquisas-sobre-hidrogenio-natural (accessed on 30 November 2024).
- Hydrogen Production and Infrastructure Projects Database. Available online: https://www.iea.org/data-and-statistics/data-product/hydrogen-production-and-infrastructure-projects-database (accessed on 30 November 2024).
- Hydrogen Production Projects Interactive Map. Available online: https://www.iea.org/data-and-statistics/data-tools/hydrogen-production-projects-interactive-map (accessed on 30 November 2024).
Disclaimer/Publisher’s Note: The statements, opinions and data contained in all publications are solely those of the individual author(s) and contributor(s) and not of MDPI and/or the editor(s). MDPI and/or the editor(s) disclaim responsibility for any injury to people or property resulting from any ideas, methods, instructions or products referred to in the content. |
© 2025 by the authors. Licensee MDPI, Basel, Switzerland. This article is an open access article distributed under the terms and conditions of the Creative Commons Attribution (CC BY) license (https://creativecommons.org/licenses/by/4.0/).