Article

Simulation Study of Natural Gas Charging and Gas–Water Occurrence Mechanisms in Ultra-High-Pressure and Low-Permeability Reservoirs

1
State Key Laboratory of Petroleum Resources and Engineering, China University of Petroleum (Beijing), Beijing 102249, China
2
College of Carbon Neutral Energy, China University of Petroleum (Beijing), Beijing 102249, China
3
College of Geoscience, China University of Petroleum (Beijing), Beijing 102249, China
4
Research Institute of Exploration and Development, Hainan Branch of CNOOC (China) Co., Ltd., Haikou 570311, China
*
Author to whom correspondence should be addressed.
Energies 2025, 18(7), 1607; https://doi.org/10.3390/en18071607
Submission received: 21 February 2025 / Revised: 16 March 2025 / Accepted: 18 March 2025 / Published: 24 March 2025
(This article belongs to the Section D: Energy Storage and Application)

Abstract

:
High-pressure low-permeability gas reservoirs have a complex gas–water distribution, a lack of a unified gas–water interface, and widespread water intrusion in localized high areas, which seriously constrain sweet spot prediction and development deployment. In this study, the high-pressure, low-permeability sandstone of Huangliu Formation in Yinggehai Basin is taken as the object, and the micro gas–water distribution mechanism and the main controlling factors are revealed by combining core expulsion experiments and COMSOL two-phase flow simulations. The results show that the gas saturation of the numerical simulation (20 MPa, 68.98%) is in high agreement with the results of the core replacement (66.45%), and the reliability of the model is verified. The natural gas preferentially forms continuous seepage channels along the large pore throats (0.5–10 μm), while residual water is trapped in the small throats (<0.5 μm) and the edges of the large pore throats that are not rippled by the gas. The breakthrough mechanism of filling pressure grading shows that the gas can fill the 0.5–10 μm radius of the pore throat at 5 MPa, and above 16 MPa, it can enter a 0.01–0.5 μm small throat channel. The distribution of gas and water in the reservoir is mainly controlled by the pore throat structure, formation temperature, and filling pressure, and the gas–liquid interfacial tension and wettability have weak influences. This study provides a theoretical basis for the prediction of sweet spots and optimization of development plans for low-permeability gas reservoirs.

1. Introduction

Since the 21st century, unconventional hydrocarbons have become integral to the global energy supply system. With the declining proportion of conventional resources, the development of unconventional hydrocarbons plays a pivotal strategic role in alleviating energy supply–demand imbalances, ensuring energy security, and facilitating low-carbon transition [1,2,3,4]. In China’s proven unconventional gas reserves, tight low-permeability gas reservoirs account for nearly half, whose large-scale exploitation is crucial for achieving energy self-sufficiency [5].
As a major component of unconventional gas, low-permeability reservoirs present development challenges, including complex percolation mechanisms and low single-well productivity. The percolation processes in these reservoirs are fundamentally governed by stress sensitivity, threshold pressure gradients, and water-blocking effects at micro-scales, demonstrating marked differences from conventional reservoirs [6]. The dual mechanisms of Darcy and non-Darcy flows constitute the theoretical foundation for optimizing low-permeability reservoir development [7,8,9]. A Darcy flow refers to a low-velocity laminar flow through porous media that adheres to Darcy’s law, characterized by a linear relationship between the flow velocity and pressure gradient, dominated by viscous forces, with a Reynolds number typically <10. It is applicable to homogeneous media and Newtonian fluids. A non-Darcy flow, in contrast, deviates from Darcy’s law and commonly occurs under high-velocity or complex conditions. It exhibits a nonlinear relationship between its flow velocity and pressure gradient, with Reynolds numbers >10, where inertial forces or turbulent effects become significant. A non-Darcy flow often involves gas slippage, threshold pressure gradients, or non-Newtonian fluid behavior [10,11]. Darcy’s law assumes a linear relationship between the seepage velocity and pressure gradient, which is applicable to medium- to high-permeability reservoirs. However, low-permeability reservoirs exhibit pronounced non-Darcy characteristics due to complex pore structures, narrow throats, fluid–solid interfacial interactions, and threshold pressure gradient effects. These features manifest as nonlinear velocity–pressure gradient relationships and stress sensitivity [10,12,13]. The traditional Darcy’s law overestimates reservoir permeability by neglecting these microscopic forces, leading to deviations in productivity predictions. By modifying the linear assumptions of Darcy’s law and incorporating threshold pressure gradients or piecewise functions to construct non-Darcy models, flow resistance during low-velocity seepage stages can be more accurately characterized, thereby optimizing production forecasts [14]. Macroscopically, gas–water distribution patterns are controlled by structural configurations, sedimentary microfacies, and reservoir heterogeneity [15,16]. Microscopically, gas–water percolation dynamics are predominantly regulated by the pore throat’s architecture, dynamic capillary pressures, and stress sensitivity [17,18]. Movable water displacement efficiency at pore edges exhibits a strong correlation with pore throat configurations, while high-temperature/high-pressure conditions amplify the complexity of gas–water transitional zones [19,20].
Current investigations predominantly rely on physical experiments and numerical simulations, which suffer from the insufficient application of high-resolution imaging technologies. Existing models often assume homogeneous reservoirs, inadequately addressing heterogeneous characteristics and coupled multi-factor flow mechanisms. The limited extrapolation capability of visualization simulations from micro-scale observations to macro-scale reservoir conditions introduces systemic errors in cross-scale studies, resulting in an incomplete understanding of dynamic gas–water distribution patterns [21,22,23,24]. The COMSOL Multiphysics 6.2 simulation demonstrates unique advantages in replicating subsurface conditions and investigating multiphysics coupling phenomena. The built-in multiphase flow module employs Navier–Stokes equations [25,26] to simulate gas–water distributions through interfacial motion characterization in porous media [27].
Enhanced oil recovery (EOR) refers to oil production methods applied during the late stages of oilfield development, where external substances such as gases, chemical agents, or thermal energy are injected into reservoirs to modify the physicochemical properties of the reservoir and its fluids, thereby improving macroscopic sweep efficiency and microscopic displacement efficiency [28]. CO2 sequestration involves the long-term storage of industrially emitted CO2 in geological formations to mitigate climate change [29,30,31].
Currently, COMSOL multiphase flow simulations have been widely utilized in oil and gas development for optimizing CO2 flooding processes and CO2 sequestration [32,33,34]. This method has also been extensively applied to investigate gas–water distribution mechanisms in tight sandstone reservoirs. Liu et al. (2017) combined micro-CT and digital core reconstruction technology with COMSOL to visualize water displacing gas in real pore structures, revealing the influence of micropore geometry on gas–water two-phase flow pathways [35]. Fei Mo (2019) coupled phase-field modeling with CFD simulations to elucidate the microscopic mechanisms of gas–water two-phase flow within permeability domains, uncovering correlations between the Jamin effect, critical pressure gradients, and tight sandstone seepage [36]. Haidong Shi (2023) employed the COMSOL phase-field method to simulate immiscible gas–water flows at the pore scale, comparing displacement characteristics during imbibition and drainage processes and analyzing the impact of capillary numbers on two-phase flows [37]. Ruifeng Yan (2024) further evaluated gas–water seepage patterns in low-productivity gas wells through multiphase flow simulations [38].
The Yinggehai Basin, a significant hydrocarbon province in the northern South China Sea, hosts abundant natural gas resources. Recent exploration has shifted focus towards ultra-low-permeability gas reservoirs under high-pressure conditions [39,40,41,42]. As China’s critical high-temperature/high-pressure low-permeability gas province, the basin confronts unique challenges: deep burial (>4000 m), extreme thermal conditions (a geothermal gradient of 3.5 °C/100 m), and intricate gas–water distribution patterns. Current studies indicate that gas wells in this region exhibit a high water production rate of up to 50%. Although gas–water contacts are present, significant reservoir heterogeneity and complex subsurface conditions result in substantial variations in the height of GWCs across different zones. The absence of a consistent gas–water interface introduces considerable uncertainties in dynamic reserve evaluations [19,20,43,44].
This study focuses on the characteristics of high-pressure low-permeability sandstone reservoirs in the Yinggehai Basin, integrating core flooding simulation experiments with COMSOL gas–liquid two-phase flow numerical simulations to investigate the microscopic gas–water occurrence mechanisms and dominant controlling factors of gas–water distribution in the XF area’s high-temperature/high-pressure low-permeability sandstone reservoirs. Compared with previous studies [8,35], this work first reveals the hierarchical control mechanism of multi-scale pore throats on gas–water differentiation in high-pressure low-permeability reservoirs. Furthermore, while traditional models often assume homogeneous reservoirs [8], this research employs true pore throat structure modeling to clarify the critical impact of heterogeneity on gas–water distributions, consistent with the flow simulation results of previous studies [24,38], but further quantifies the synergistic effects of temperature and pressure. The findings provide theoretical support for efficient gas reservoir development in the Yinggehai Basin and offer novel insights for the exploration and development of global analogous low-permeability gas reservoirs.

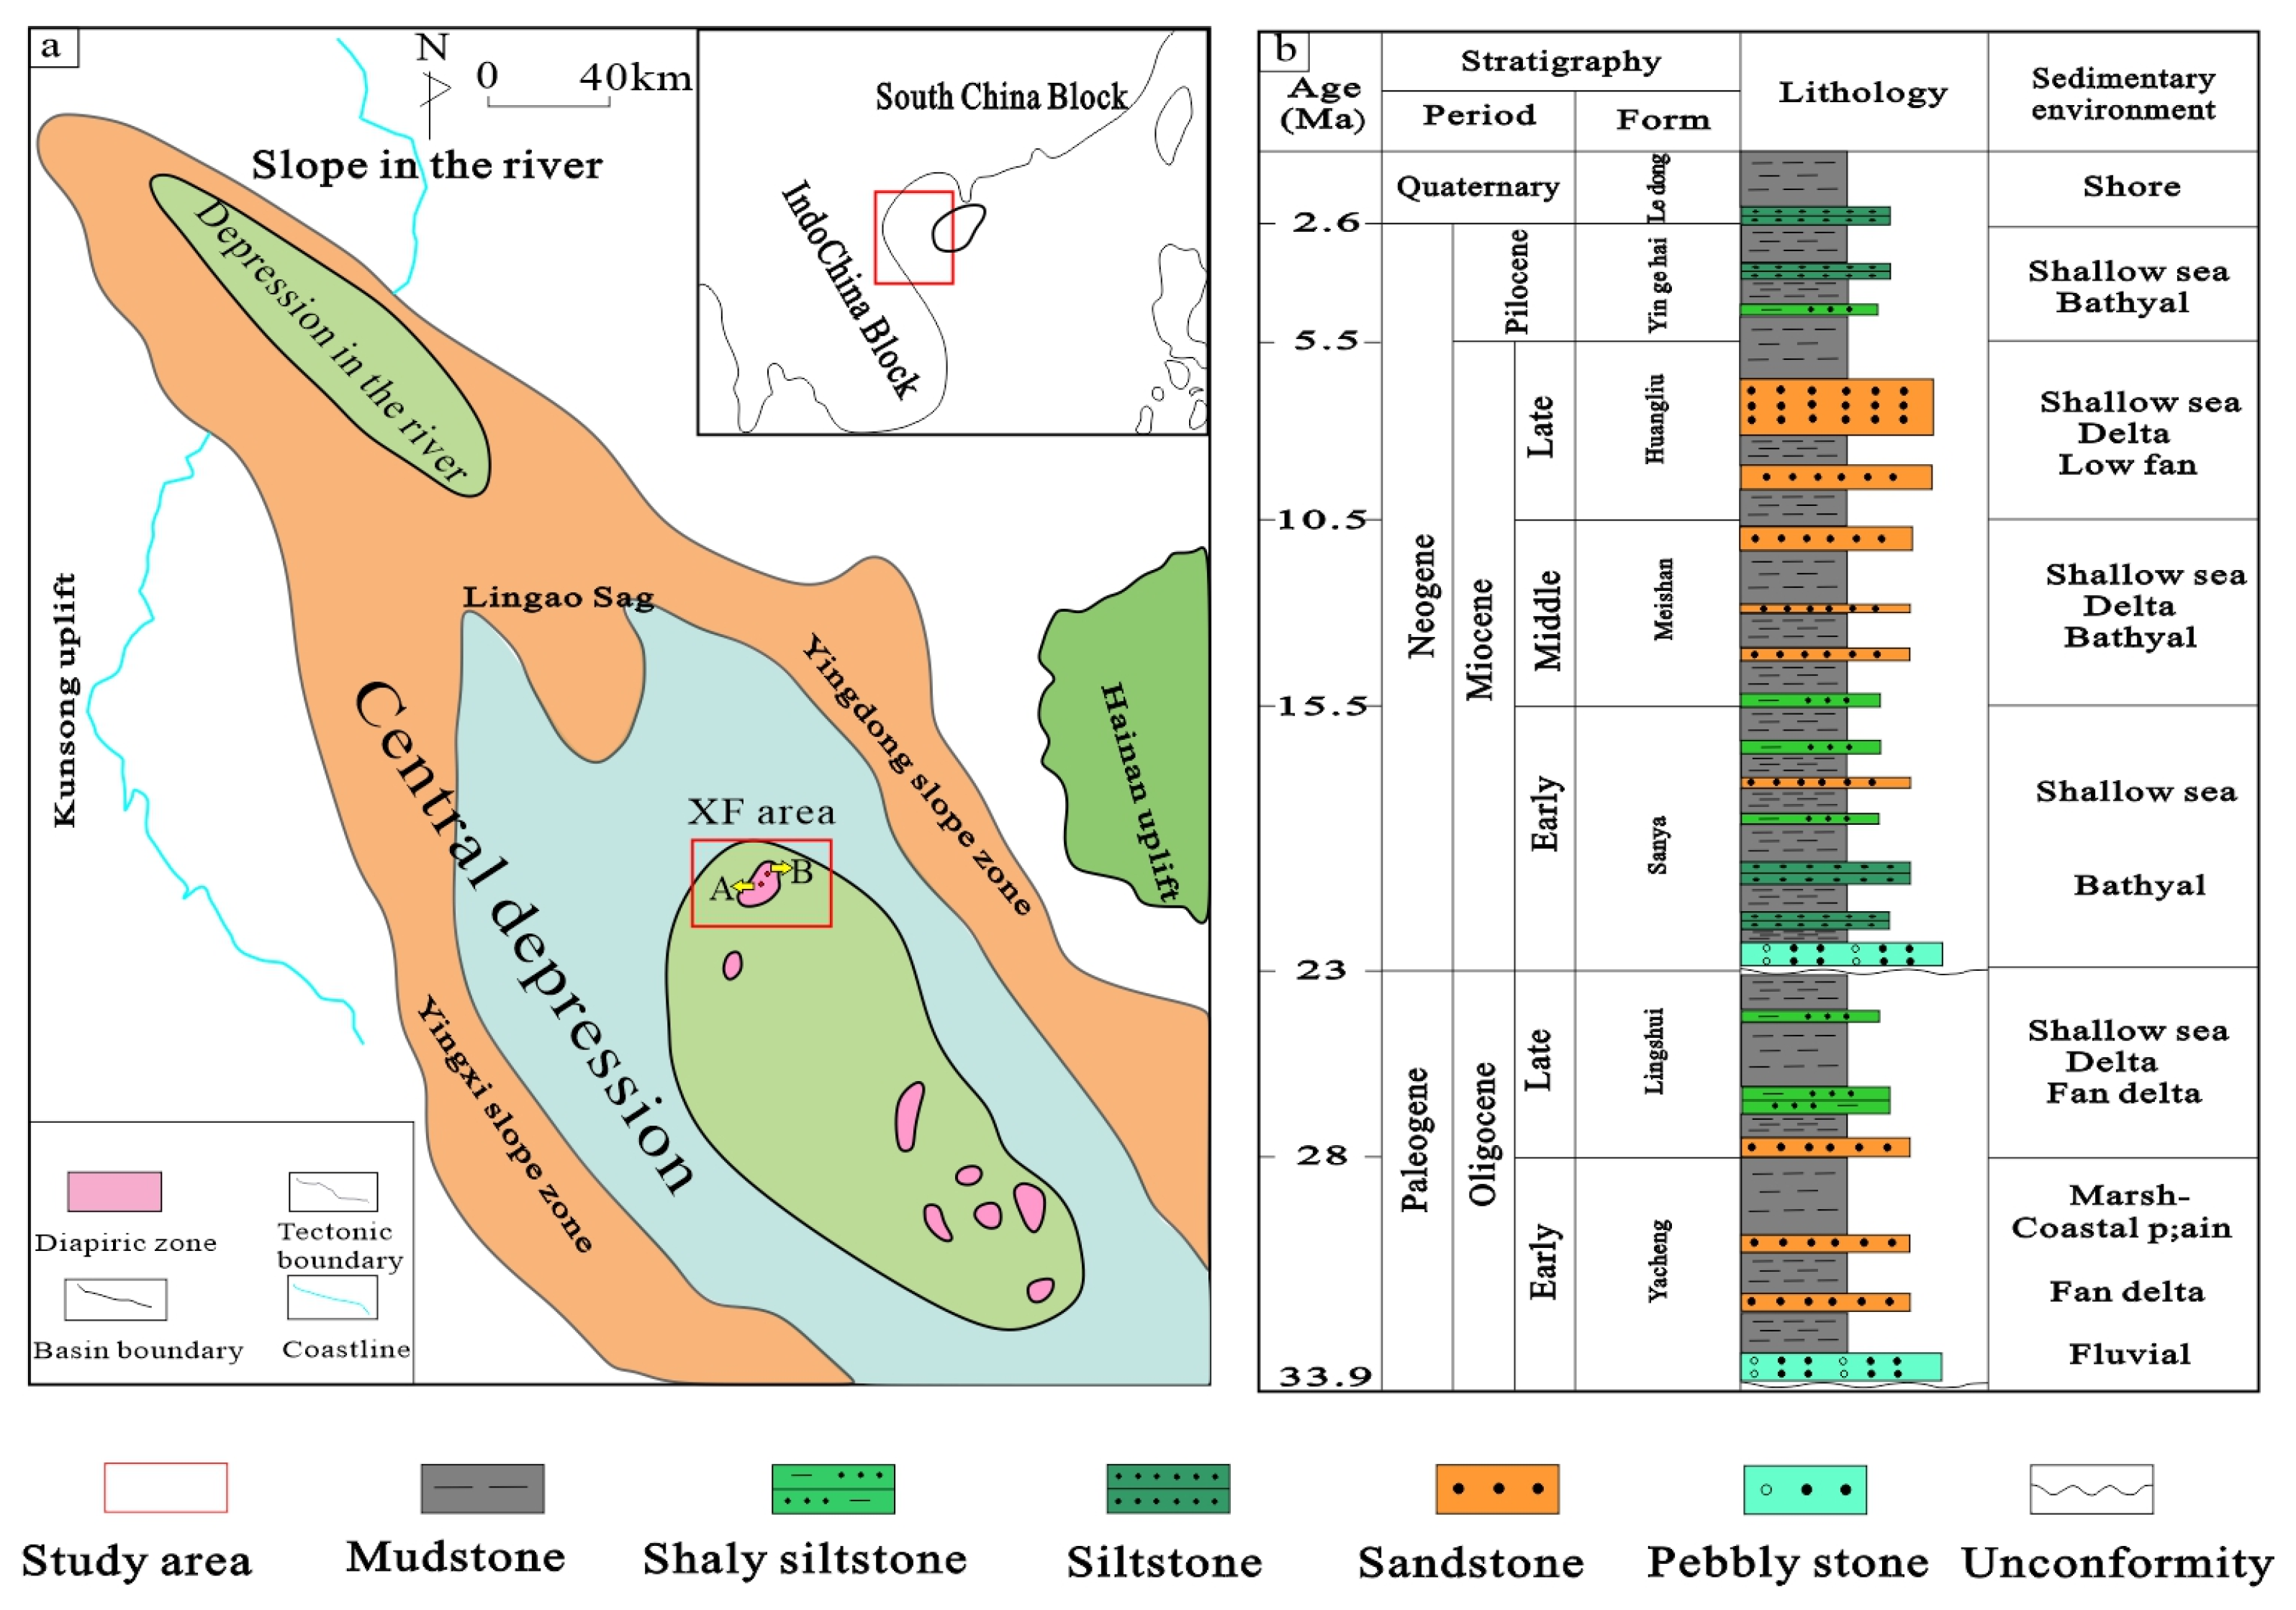
2. Geologic Background

The XF Area in the Yinggehai Basin exhibits distinctive depositional characteristics in the First Member of the Huangliu Formation, dominated by shallow marine gravity flow systems characterized by multi-type sedimentary architectures. Provenance analysis indicates that detrital materials were primarily sourced from the western Kun Song Uplift, with sediment supply intensification phases influenced by the right-lateral strike-slip activities of the Red River Fault [45,46]. Since the Cenozoic, the right-lateral strike-slip movement of the Red River Fault Zone has been the primary driving force for the rapid subsidence of the Yinggehai Basin. From 5.5 Ma onward, accelerated subsidence occurred in the western basin due to the fault zone’s right-lateral strike-slip activity, leading to a significant increase in sedimentation rates. This process resulted in the accumulation of thick sedimentary sequences, including the Huangliu Formation, Yinggehai Formation, and Ledong Formation, with sediment thickness increasing along the axial direction [47,48]. After 10.5 Ma, the Red River Fault transitioned from left-lateral to right-lateral strike-slip motion, causing the depocenter to migrate southeastward and forming the present-day depositional framework of the Yinggehai Basin, characterized by thicker sediments in the southeast and thinner deposits in the northwest [49]. This region features diverse sedimentary units, including sandy debris flow channels, turbidity channels, sand-rich lobes, and fan-fringing sands.
Tectonically, the XF Area is jointly controlled by the Red River strike-slip fault zone and deep-seated diapirism. Structurally, the basin adopts a NW–SE-trending rhombic configuration subdivided into the Yingdong Slope and the Central Depression. The Central Depression hosts multiple left-stepping en echelon diapiric structures, which not only induce localized stratigraphic uplift but also facilitate overpressured fluid migration [45,50]. Drilling data reveal extreme thermal conditions in the Meishan–Huangliu formations of the diapiric belt: formation temperatures exceeding 132 °C and pressure coefficients ranging from 1.56 to 2.23, classifying these strata as high-temperature overpressured systems [51,52].
The main reservoirs are mainly distributed in the Yinggehai Formation and Huangliu Formation. The main reservoirs in the XF area of the Yinggehai Basin are primarily distributed in the Yinggehai Formation and Huangliu Formation. The Huangliu Formation reservoirs are characterized by medium porosity and low permeability, with pore throat distributions exhibiting features of “large pores, small throats, and high pore throat ratios”, along with strong heterogeneity. The average throat radius of the Huangliu Formation reservoirs ranges from 1–5 μm, and the dominant throat radius is generally less than 5 μm. In low-permeability reservoirs (permeability: 0.1–10 × 10−3 μm2), the throat radius distribution is narrower, with a higher proportion of small throats [53,54]. The reservoir bodies exhibit significant internal heterogeneity and large variations in physical properties, with distinct “sweet spot” zones. The distribution of gas and water is primarily controlled by the lateral distribution of sandstones and changes in physical properties [20]. The formation of high-porosity low-permeability reservoirs in the XF District is mainly related to sedimentation. In addition, the dissolution caused by high temperatures and the maintenance of the pore space by overpressure are important reasons for the high porosity of the reservoir, and the fine lithology and high mud content are the main reasons for the formation of low-permeability reservoirs [55].
The hydrocarbon source rock layer is mainly distributed in the humic marine mudstone of the Meishan Formation and Sanya Formation, and the organic matter type is dominated by type II2 and type III, with a total organic carbon content (TOC) of up to 2–5%. This rock layer is in the mature–overmature stage and is the most important hydrocarbon source rock layer in the basin. The natural gas is transported upward vertically through bottom-opening fractures and microfractures and enters the reservoir for remote source formation [56,57,58,59].

3. Samples and Methods

3.1. Samples

The low-permeability gas reservoirs in the Yinggehai Basin are dominated by coal-type gas, and the main hydrocarbon source rocks are the marine land-based organic matter of the Middle Miocene Meishan Formation and the Lower Miocene Sanya Formation, which are driven by the bottom-breaking activities to form the overpressure transportation power [60]. Reservoirs are dominated by gravity-flow depositional systems (e.g., submarine fans and turbidite channels), controlled by the material sources of the Hainan Rise, and the reservoirs are strongly non-homogeneous [61,62]. Studies show that the permeability distribution of the reservoirs in the Yinggehai Basin spans three orders of magnitude (0.1~100 × 10−3 μm2), and the permeability difference between different layers in the same well area can be up to 10 times or more [43]. Although the overpressure environment is favorable for primary pore preservation, the degree of modification of the throat by cementation varies significantly [43,63].
In this study, two typical low-permeability gas-seeing wells in the XF area of the Yinggehai Basin were selected to study the low-permeability lithology samples of the Huangliu Formation with full consideration of the influence of bottoming-up activities and the characteristics of low-permeability reservoirs. The locations of the sampling wells are shown in Figure 1. Well A is far away from the core part of bottoming activities in the XF area, and the low-permeability reservoir of the Huangliu Formation is less affected by bottoming activities. Well B is located at the edge of the bottoming, and the low-permeability reservoir of the Huangliu Formation is more affected by the modification of the bottoming fluids.

3.2. Methods

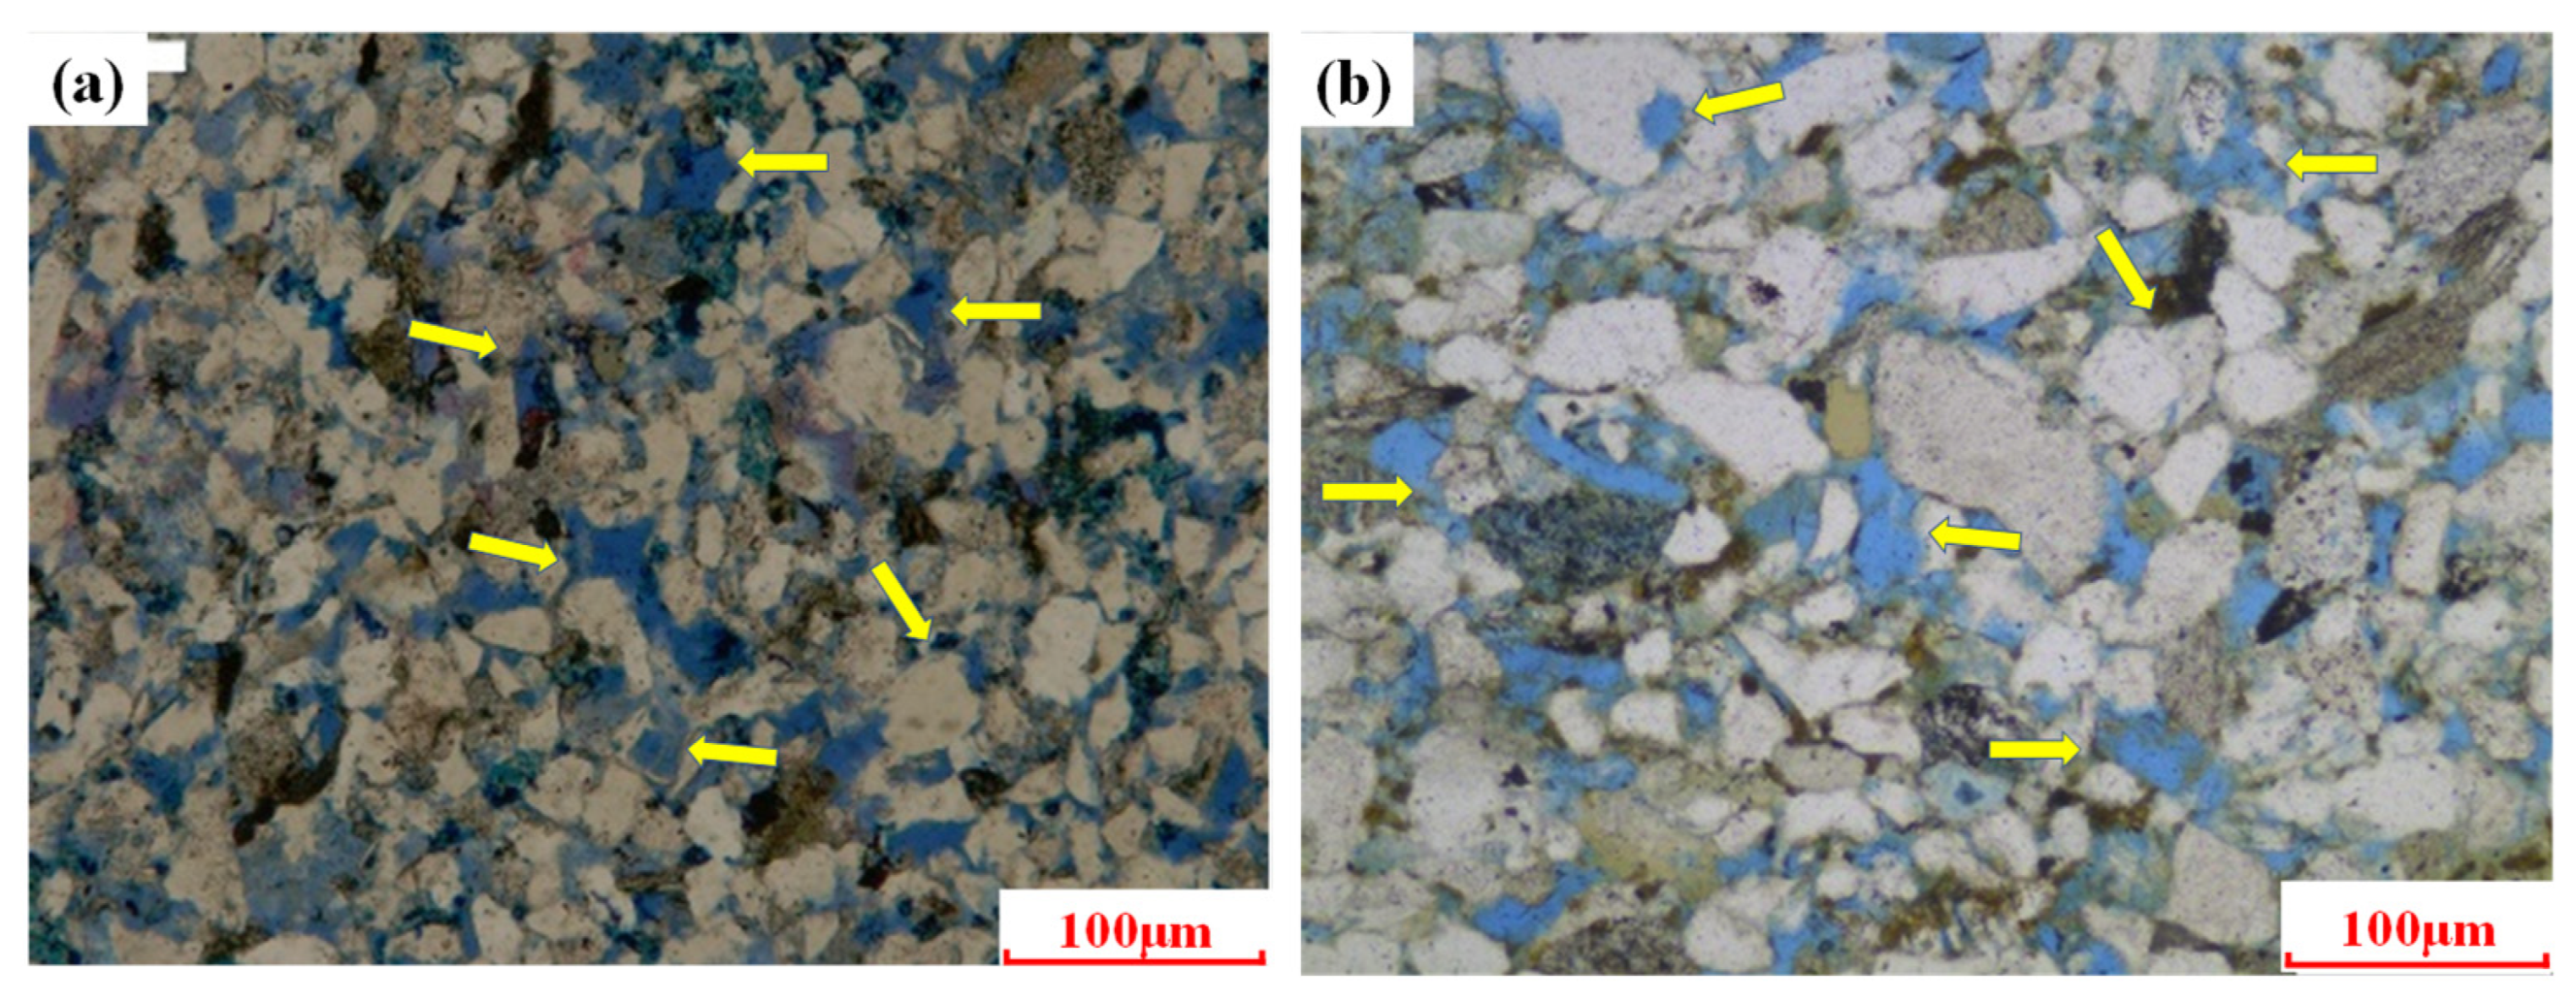
3.2.1. Observation of the Cast Thin Film

The casting thin section method is a research method that uses a polarized light microscope to observe the thin section of the rock core and identify the mineral composition and content of the core, pore content and characterization, cementation type and state, and other information. The principle of identification is to inject the colored liquid gum into the rock pore space under vacuum pressure, and then grind the rock flake after the liquid gum is cured. Since the rock pores are filled with colored glue, it is very eye-catching and easy to identify under the polarized light microscope. The cast thin section technique is one of the core methods for analyzing the pore throat structure of low-permeability reservoirs and is widely used in reservoir evaluation and petrogenesis studies [64,65,66]. The A1 and B1 samples were partially crushed to make cast thin sections, and the mineral composition and pore throat structure were observed using a polarizing microscope. In this study, the cast thin sections were observed with a LinKam-350 polarizing microscope from Germany, with a resolution of 0.2–0.4 μm, a magnification of 50~1000×, and an operating environment of 0–40 °C and ≤85% humidity.

3.2.2. Core Displacement Experiment

The core repulsion experiment involves various experiments to study the repulsion mechanism in conventional plunger cores and monitor the high-pressure gas water repulsion process with NMR, which is widely used in the study of enhanced recovery and gas–water distribution mechanisms [19,24,67,68]. The instrument simulates the high-temperature environment through the thermostat box, and the return valve simulates the actual formation pressure, so as to restore the seepage environment in the formation environment to the greatest extent possible. Nuclear magnetic resonance (NMR) analysis quantifies the relaxation characteristics of hydrogen nuclei (H) in rock pores. Variations in pore throat sizes generate distinct peaks on T2 spectra due to differential relaxation times, enabling pore throat structure characterization, porosity/permeability calculation, and pore size distribution estimation [69,70,71]. Smaller pores exhibit higher specific surface areas, intensifying surface relaxation effects and shortening T2 times; thus, large-pore domains correspond to long T2 peaks, while small-pore regions align with short T2 peaks [72,73]. NMR-derived T2 responses reflect the coupled influences of pore geometry, mineralogy, and fluid interactions [74]. Saturated core NMR analysis therefore enables the quantitative evaluation of movable fluid saturation and pore-scale fluid dynamics.
Relaxation time is a critical parameter in nuclear magnetic resonance (NMR) experiments, describing the process by which a substance transitions from an excited state back to equilibrium. In gas–water displacement NMR studies, the primary objectives of relaxation time calibration are to enhance measurement accuracy, differentiate between fluids and pore structures, and reduce experimental errors [75]. A NaCl solution can effectively fill pores and achieve complete saturation, thereby providing reliable testing conditions for NMR experiments and adapting well to rock samples with diverse pore structures [76,77]. Additionally, NaCl saturation treatment effectively eliminates water signals, ensuring accurate data acquisition in NMR studies [78].
In this study, the CFS-10000 multifunctional core flow system was used to test and analyze two plunger samples from two low-permeability reservoirs in the study area, and to obtain the NMR curves of the two samples under different filling pressures. The temperature and pressure data of the expulsion experiments were obtained from the drilling MDT measured data, and the parameters of the samples are shown in Table 1.
The steps of the core repulsion experiment are as follows.
  • The core sample was dried and weighed, the diameter and length of the core were measured, and the core was placed into the gripper;
  • The rock samples were vacuumed, saturated with brine under 20 MPa pressure for 24 h, weighed, and subjected to NMR T2 spectrum measurements;
  • For NMR T2 spectrum measurements, gas (N2) from one end of the core column sample (inlet end) was used to replace the free water in the core until the gas flow rate at the outlet end was stabilized;
  • The filling pressure of gas (N2) at the inlet end was increased, and step 2 was repeated until there was no change in the neighboring NMR T2 spectra twice;
  • After gas-driving the core column samples based on different charging pressures, NMR T2 spectra were measured for the samples to analyze the changes in gas saturation and free water replacement in the sandstone samples.

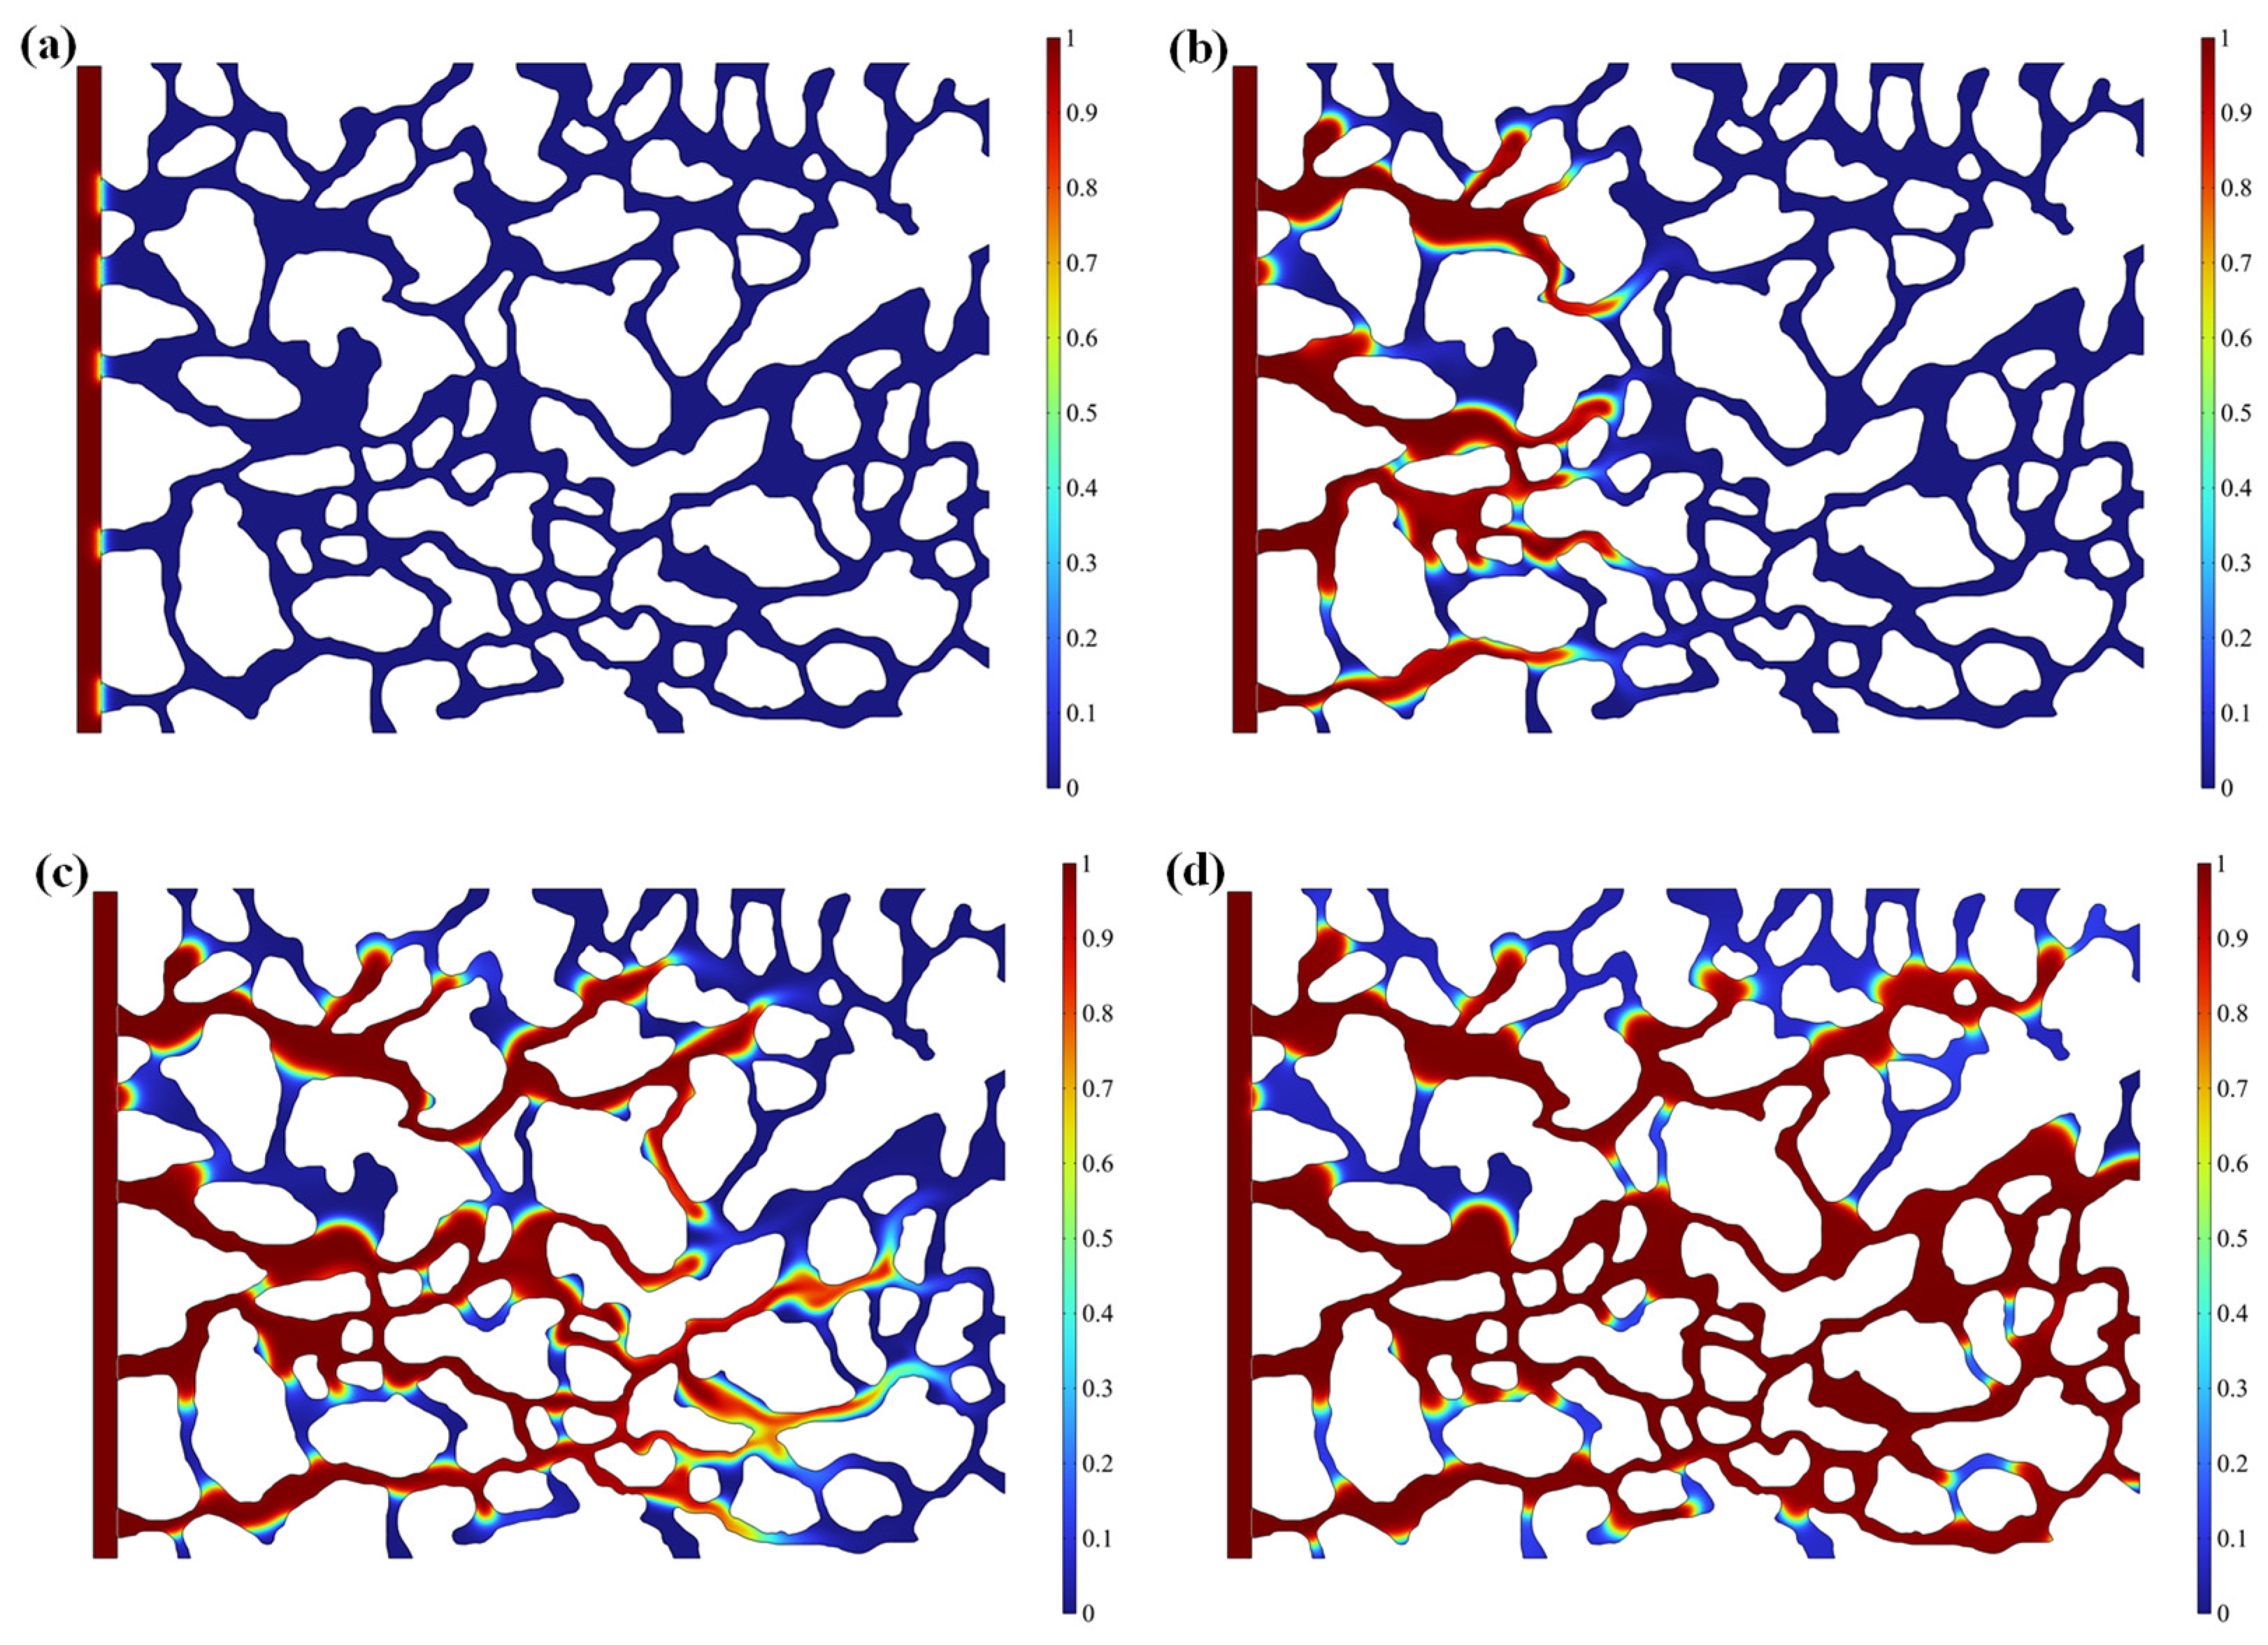
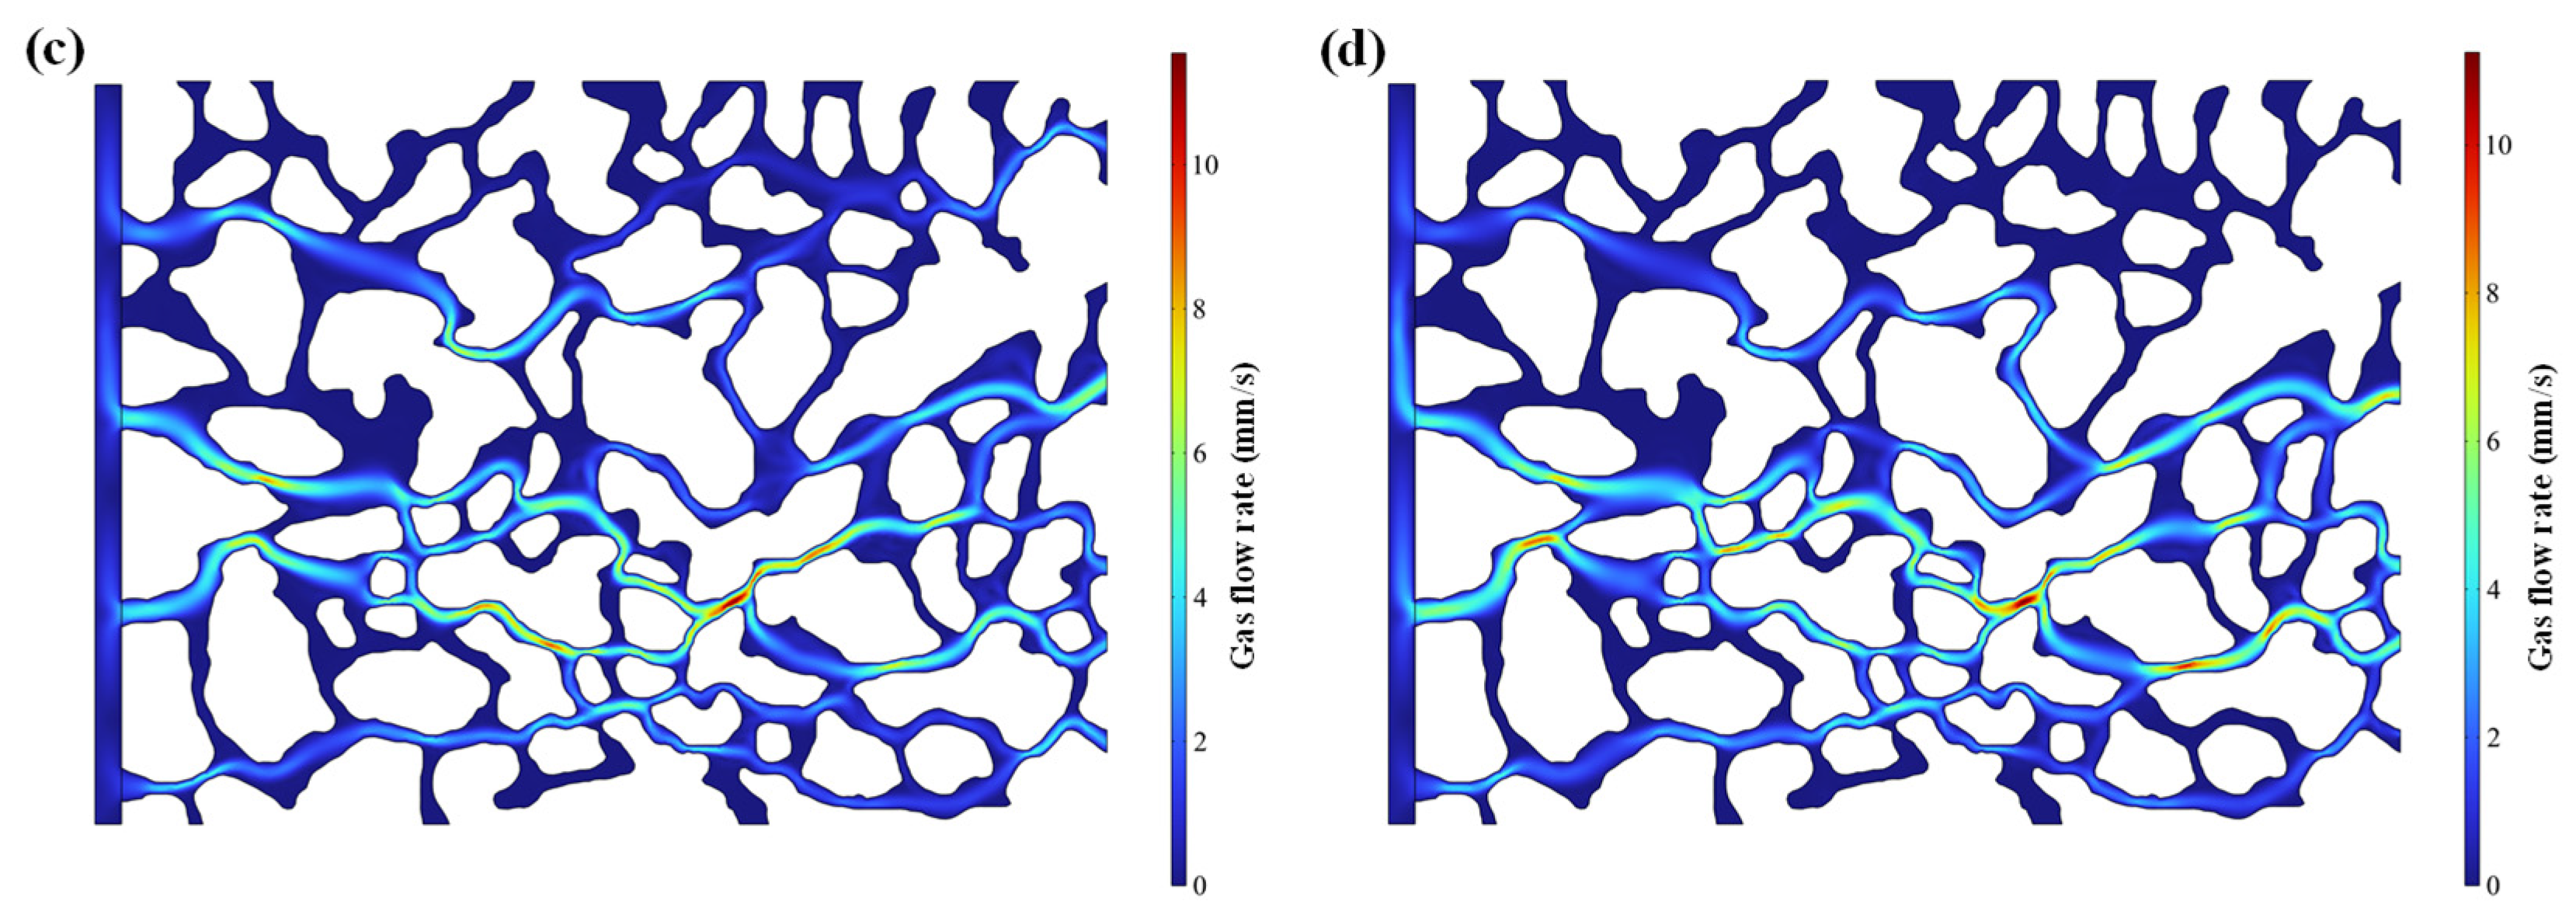
3.2.3. Numerical Simulation of Two-Phase Flow

The CFD module of COMSOL Multiphysics performs multiphase flow numerical simulations by incorporating Navier–Stokes equations and differential equations from the phase-field method. Compared to the single-fluid-field analysis of traditional CFD tools, COMSOL’s multiphysics coupling capability enables efficient resolution of complex fluid migration and interfacial interaction processes [27,33]. Previous studies have extensively investigated gas–water occurrence mechanisms in complex reservoirs using the phase-field method coupled with CFD simulations [35,36,37,38]. In this study, we used a B1 sample as an example, based on the coupled physical field of laminar and phase fields in multiphase flow, to study the flow and interface coupling of gas in a microscopic porous medium after natural gas enters the low-permeability reservoir under a high-temperature and -pressure environment.
The model is built using the image edge extraction method. The specific operation is as follows: the cast thin section image of the B1 sample was binarized with imageJ 1.54g software (Figure 2a), the image-to-curve plug-in of COMSOL Multiphysics 6.2 software was applied to model the pore throat structure, and Gaussian filtering of COMSOL image processing module was used for noise reduction (Figure 2b)this module is used to reduce the image edge roughness during image processing to get better results in modeling the pore structure.
The natural gas charging and drainage process is simplified into two-phase flow, and this paper adopts the physical field of “two-phase flow, phase field” for research. The model adopts the laminar flow model for the numerical simulation of the two-phase flow of gas–water-driven oil. The multiphysical field interface combines the laminar flow and fluid phase field interface, and the system will automatically add the “two-phase flow, phase field” multiphysical field coupling. The interface solves the Navier–Stokes equations for momentum conservation and the continuity equations for mass conservation, and tracks the interface position by solving two additional transport equations, one for the phase-field variables and the other for the mixing energy density. The surface motion is determined by the minimum free energy.
The initial condition of the reservoir is saturated with water, and a transition zone is set up on the left side to allow stable charging of natural gas into the reservoir. CH4 is injected from the left boundary, formation water is discharged to the right, and the simulation ends when the gas saturation stops increasing. The left side of the model is set up with a pressure inlet, and the inlet pressure is set to 20 MPa, while the right side is set up with a pressure outlet, and the outlet pressure is set to 0 MPa. The internal pore throat boundary of the reservoir is set up as a hydrophilic wetting wall, with a contact angle of 30° (Table 2).

4. Results

4.1. Cast Thin Sheet Results

Observations of the cast thin sections and (Figure 3) XRD (Table 3) data show that the A1 samples are small in grain size, dominated by siltstone and very-fine-grained to fine-grained sandstone, and moderately sorted, with a high quartz content and a generally high mud content. Mineral grains in the reservoir are mainly point and line contacts. Pore development, mainly secondary dissolution pores, intra-grain dissolution holes, and cast holes, is common, while primary pores are less common. The throat is small, mainly distributed in the range of 0.01~1 μm, and the shape is mostly of the necking type. Reservoir cementation is weak, dominated by dolomite cementation, and most of the throats are blocked by carbonate cement and mud, with poor connectivity between pores (Figure 3a).
B1 samples are of medium grain size, dominated by very-fine-grained and fine-grained sandstone, and poorly sorted, with a high quartz content and a generally high mud content. Mineral grains in the reservoir are mainly in point contact and line contact. Pore development, mainly secondary dissolution pores, intra-granular dissolution holes, and cast holes, is common, while primary pores are less common. The throat is fine, mainly distributed in the range of 0.01~10 μm, and the shape is mostly of the necking type. Reservoir cementation is weak and consists mainly of calcite salt cementation. Most of the throats are blocked by mud and carbonate cement, and the connectivity between pores is average (Figure 3b).

4.2. Core Displacement Results

The results of the core replacement experiments showed that the gas saturation of the A1 sample was 9.62%, 18.66%, 20.29%, and 21.09% at the filling pressures of 5 MPa, 10 MPa, 16 MPa, and 20 MPa. The corresponding gas saturation of the B1 sample at the filling pressures of 5, 10, 16, and 20 Mpa was 23.18%, 59.47%, 61.67%, and 66.45% (Figure 4).
In the A1 sample, the movable water in the large pores (0.09–1.0 μm) and small pores (0.01–0.09 μm) was driven away by a large number of large pores and dominated by the large pores during the filling at 5 MPa, and the movable water in the small pores (0.01–0.09 μm) was driven away during the filling at 8 MPa. After the filling pressure was greater than 8 MPa, the gas saturation increased only slightly, indicating that a large amount of binding water remained in the pores and was difficult to drive away (Figure 4). This is bound water, which is difficult to be driven away (Figure 4a). In sample B1, the movable water in large pores (0.5–10 μm) and small pores (0.01–0.5 μm) was driven away by a large amount of water and dominated by large pores during charging at pressures of 5–10 MPa, while the movable water in small pores of 0.01–0.5 μm was mainly driven away during charging at pressures of 16 MPa. After pressures of more than 16 MPa, the movable water in small pores of 0.01–0.5 μm was mainly driven away, with a small increase in gas saturation. The small increase in gas saturation indicates that the residual formation water within the sample pores is mainly end-stagnant water and bound water within the small pores (Figure 4b).

4.3. Numerical Simulation Results

The gas–liquid two-phase distribution (Figure 5) and CH4 flow rate distribution (Figure 6) in the reservoir at different moments when the charging pressure was set to 20 MPa are shown. At the beginning of charging, CH4 enters the pore space from the left inlet, and at 0.005 s, the flow rate in the large pore channel increases significantly to 5–9 mm/s, while the flow rate in the small channel reaches only 2–3 mm/s. CH4 rapidly fills up the large pore throat with a radius of 0.5–10 μm, and some of the free water is left in the edge of the large pore throat, which is difficult to drive away. With passage times of 0.015 s and 0.025 s, the flow rate in the macropore throat tends to stabilize and reach 4–10 mm/s, while the flow rate in the small throat increases slowly and can only reach 2–4 mm/s. Natural gas selectively flows along the 0.5–10 μm macropore throat during the filling process, forming the “dominant seepage channel”. The flow rate of natural gas in small throats of 0.01~0.5 μm is slow, and it is difficult for the water phase to be effectively displaced.
Figure 7 demonstrates the dynamic evolution curve of CH4 gas saturation in the reservoir at an injection pressure of 20 MPa. The results show that the gas saturation exhibits an obvious three-stage growth characteristic. In the initial rapid charging stage, the gas saturation climbs rapidly to 59.45% within 0.004 s. During the medium-rate growth stage, the gas saturation increased from 59.45% to 63.15% within 0.004–0.008 s, and the growth rate slowed down significantly. In the stabilization stage, the gas saturation increased to 66.09% in 0.015 s, and the subsequent gas injection only slightly increased. When 0.025 CH4 reached stabilization, the gas saturation of the reservoir was 68.98%, which was close to that of the gas saturation derived from the core replacement experiments (66.45%). This shows that the model’s design is reasonable.

5. Discussion

5.1. Mechanism of Gas–Water Occurrence

Previous studies are mostly based on physical simulation experiments and numerical simulations, lacking the application of high-precision imaging technology. Existing models mostly assume homogeneous reservoirs, with insufficient descriptions of complex seepage laws that are non-homogeneous and multi-factor-coupled [21,24,79]. In this paper, a combination of core replacement and COMSOL simulations is used to study the microscopic gas–water storage mechanism in low-permeability reservoirs, and the advantages of COMSOL’s multiphysical field coupling make up for the shortcomings of traditional single-factor studies. Meanwhile, the core expulsion experiment is used to verify the numerical simulation results, which improves the reliability of the research method.
The high porosity and low permeability characteristics of the low-permeability reservoirs of the Huangliu Formation in the XF District of the Yinggehai Basin are the result of the combined effects of sedimentation, diagenesis, an overpressure environment, and thermohydrodynamic activities [80,81,82]. The retention of high porosity mainly relies on overpressure to inhibit compaction and dissolution, while low permeability is controlled by fine-grained lithology, mud filling, and pore throat inhomogeneity [55]. In low-permeability reservoirs, capillary forces are significantly enhanced due to the small throat size and complex distribution, which greatly limit the gas flow capacity [83]. The observations from casting thin sections show that the reservoirs of the Huangliu Formation are generally small in grain size and dominated by siltstone and very-fine-grained to fine-grained sandstone, with a high quartz content, moderate sorting, and generally high mud content. Mineral grains are mainly point contact and line contact, with a thin throat and a necked shape. Reservoir pores are dominated by primary and secondary dissolution pores, reflecting the characteristics of weak compaction and bottom-penetrating fluid dissolution in the process of rock formation. The carbonate cement content is low, and most of the throats are blocked by mud and carbonate cement. The complex pore throat structure leads to poor connectivity between pores and low permeability.
The migration of natural gas in overpressured low-permeability reservoirs primarily relies on the charging pressure provided by the source–reservoir pressure difference, while the resistance originates from capillary forces within reservoir throats. Natural gas can only enter pores through throats when the charging pressure exceeds the capillary forces in the throats [83,84]. During gas seepage in low-permeability gas reservoirs, a threshold pressure gradient exists, which is positively correlated with water saturation. Reduced permeability significantly increases this threshold pressure gradient [79,85].
Integrated core flooding experiments and COMSOL simulations (Figure 4, Figure 5, Figure 6 and Figure 7) reveal that the XF area’s low-permeability reservoirs exhibit complex pore throat structures, requiring a high charging pressure (5 MPa) for gas entry. Additionally, throats of varying sizes possess distinct capillary forces, with throats with smaller radii demanding higher charging pressures to enable gas migration.
Low-permeability reservoirs are typically characterized by small throat radii and poor pore connectivity, leading to non-uniform flow fronts during gas displacement. Due to their lower viscosity compared to water, injected gas preferentially forms viscous fingering through larger throats or fractures, bypassing bound water in micropores [67,86,87,88]. Strong heterogeneity further drives gas to selectively flow through high-permeability pathways, creating preferential flow channels, while water in low-permeability zones remains poorly displaced [89]. The intricate pore networks in these reservoirs result in highly heterogeneous gas–water distributions, where tiny throats and dead-end pores trap isolated gas or residual water [24,79,90,91]. After CH4 enters the reservoir, it preferentially establishes continuous flow channels in macropores (0.5~10 μm). However, water in macropores deviating from these channels becomes trapped locally. In smaller throats (0.01~0.5 μm), CH4 encounters capillary resistance: if charging pressure exceeds capillary forces, CH4 displaces formation water forward; otherwise, CH4 remains trapped. This dynamic process repeats until a new force equilibrium is reached, stabilizing gas–water distribution. Ultimately, residual water persists in macropores and bound water in micropores, with gas saturation plateauing under these conditions.

5.2. Main Controlling Factors of Gas Water Distribution

Previous studies have shown that macroscopically, the gas–water distribution is controlled by tectonic relief, the sedimentary microphase, and reservoir inhomogeneity [92,93]. Microscopically, the reservoir’s pore throat structure, dynamic capillary force, and stress-sensitive effect significantly affect gas–water seepage behavior [94,95]. The overpressure differential pressure drives natural gas charging, and an insufficient hydrocarbon supply mostly leads to insufficient formation water repulsion, which is the root cause of residual water formation [96,97,98]. The pore throat’s structure and the non-homogeneity permeability of low-permeability reservoirs directly control the range of gas–water distribution and saturation. Areas with higher permeability are more likely to form gas-reservoir-dominant zones, while low-permeability zones are mostly characterized by a high water content [96,99]. Most of the previous studies are based on physical simulation experiments and numerical simulations, which lack the application of high-precision imaging technology, and it is difficult to directly extrapolate the conclusions of pore-scale experiments (e.g., three-dimensional visualization simulations) to the macroscopic reservoir. In addition, there are systematic errors in the cross-scale studies, which lead to an incomplete understanding of the dynamic distribution law of gas and water [21,24,79].
In this paper, on the basis of summarizing previous studies, we adopt the method of core expulsion experiments combined with COMSOL multiphysics field simulations to carry out research on the main controlling factors of gas–water distributions. It makes up for the shortcomings of traditional research, which is mostly based on the study of macroscopic factors. The microscopic–macroscopic combination is not close enough and does not realize multi-scale coupling analyses from macroscopic drive-off to microscopic flow, as well as the influence of different pore throat distributions, temperatures, filling pressures, interfacial tensions, wettability, and other factors on the distribution of natural gas and water formation in low-permeability reservoirs.

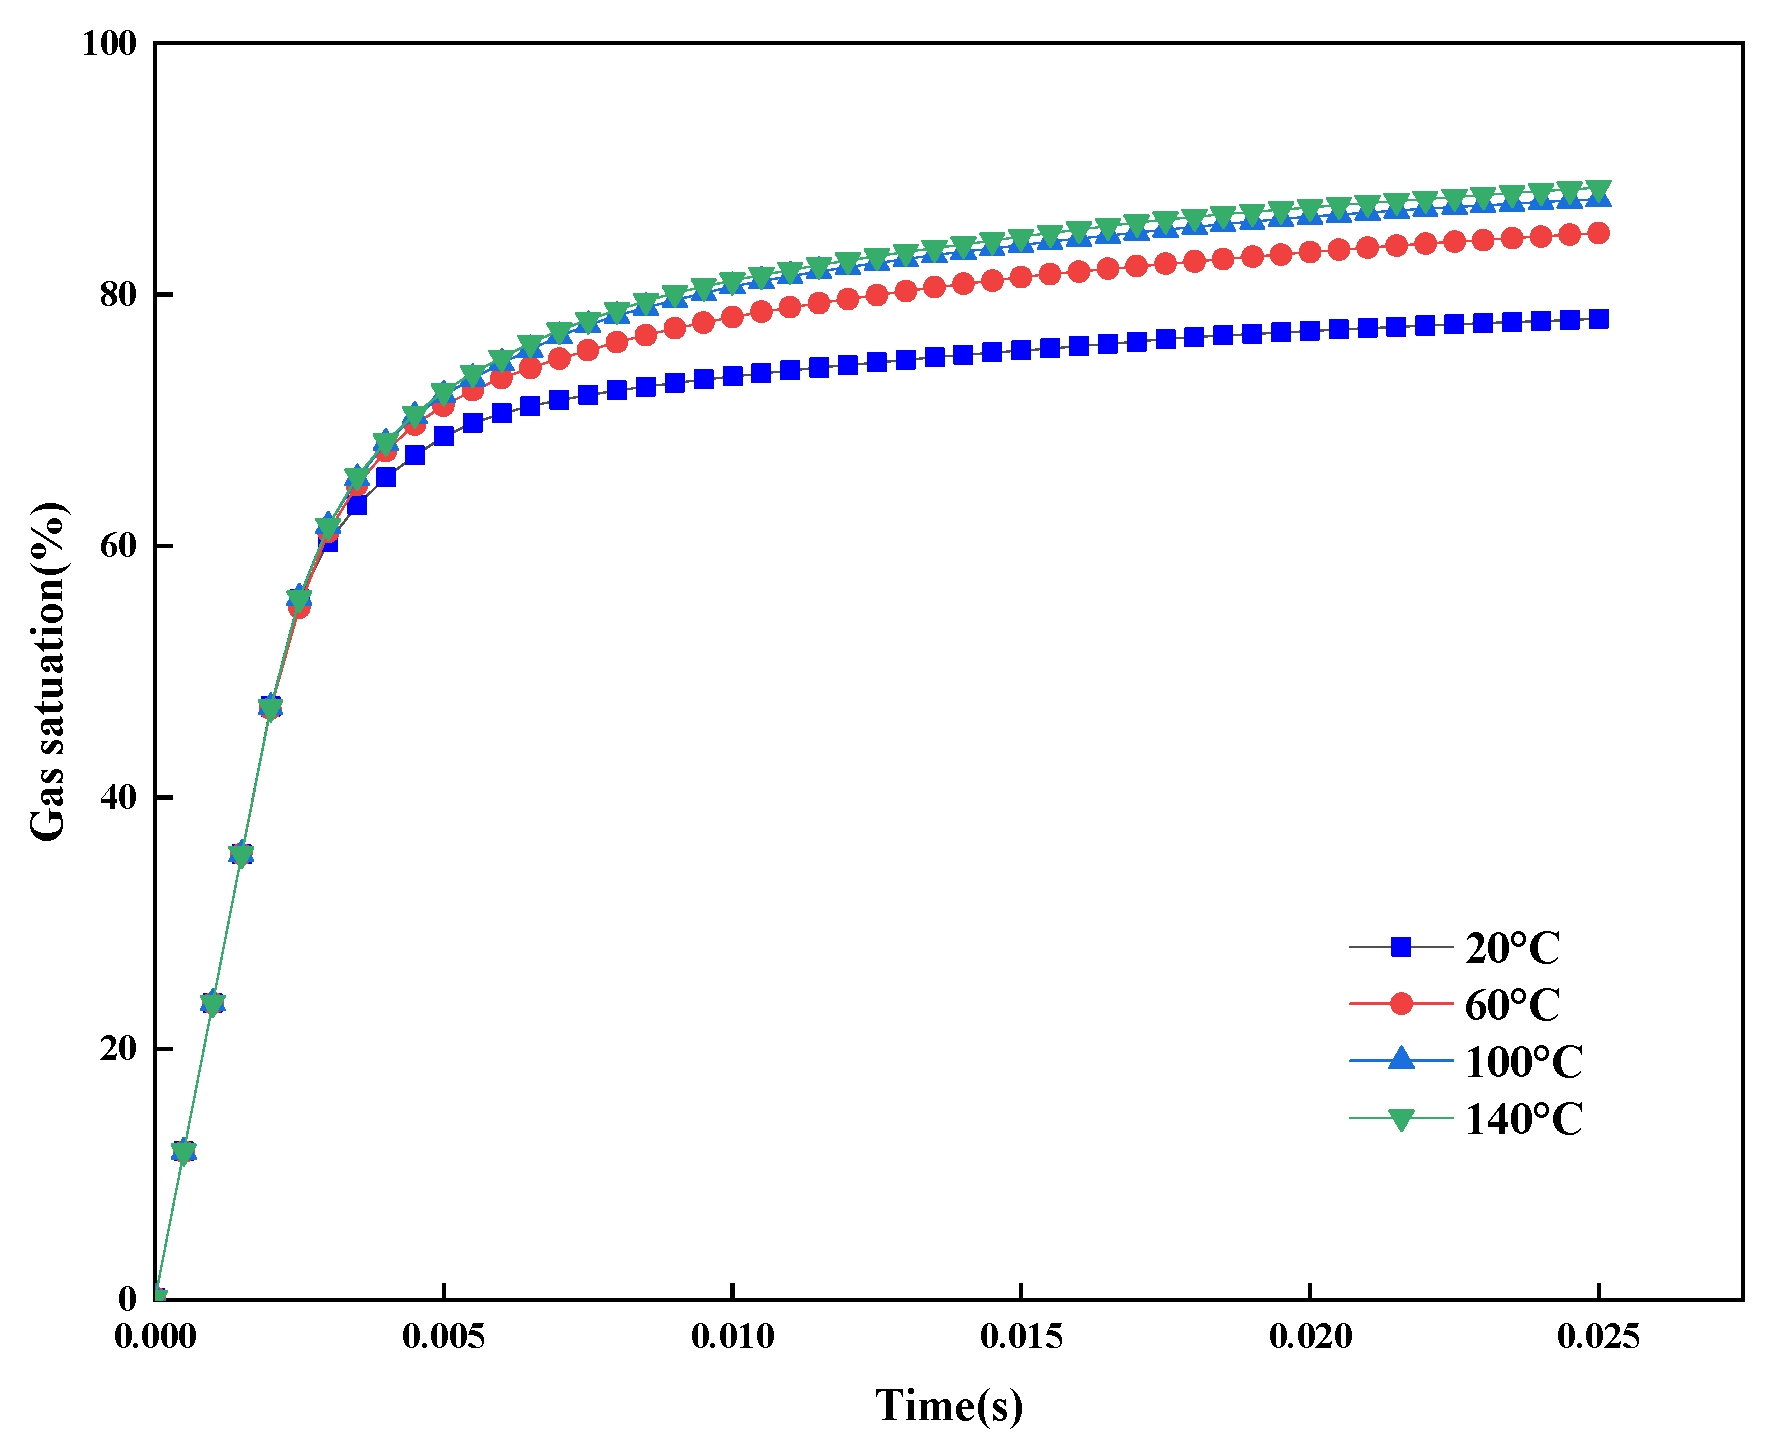
5.2.1. Formation Temperature

The rapid subsidence of the XF area during the Cenozoic era has led to sedimentary layer thicknesses exceeding 15 km, resulting in a significant high-temperature geothermal environment. The measured average geothermal gradient in this region reaches 4.0 °C/100 m, with gradients in diapiric structures ranging from 4.32 to 5.21 °C/100 m and heat flow values between 69 and 89 mW/m2, which are significantly higher than those in conventional basins, classifying it as a typical thermal basin [52,62]. Studies indicate that the high-temperature environment is closely linked to the vertical migration of deep thermal fluids, and thermal convection induced by diapiric activity has exacerbated the thermal anomalies in the strata [100]. Elevated temperatures indirectly influence gas–water interfacial dynamics by altering fluid properties such as viscosity and density [101].
Using sample B1 as an example, numerical simulations were conducted under constant parameters: a charging pressure of 30 MPa, a gas–liquid interfacial tension of 0.01 N/m, and a contact angle of 30°, with formation temperatures being systematically varied (20 °C, 60 °C, 100 °C, and 140 °C).
Figure 8 shows the gas–liquid distribution under stabilized flow with different formation temperatures at the last moment. From the analysis of the four curves, it can be seen that with the increase in the formation temperature, gas saturation increased greatly at first. Then, the increase decreased, and the gas saturation was the largest when the formation temperature was 140 °C. On the whole, when the formation temperature is below 60 °C, the gas saturation increases greatly with the increase in temperature; when the temperature is greater than 60 °C, the increase in gas saturation becomes moderate with the increase in temperature.
Microscopic pore throat structure studies have shown that the throat of low-permeability reservoirs is fine and its pore connectivity is poor. A change in temperature will exacerbate the action of the capillary force, affecting the efficiency of the two-phase seepage of gas and water [102,103]. Meanwhile, the temperature has a direct impact on the reservoir’s pore throat structure and the gas–water endowment state. An elevated temperature decreases the gas-phase flow initiation pressure gradient [104,105,106,107]. As the temperature increases, the kinetic energy of gas molecules intensifies, leading to heightened collision frequencies and momentum exchange among molecules, which significantly increase the viscosity of natural gas. In contrast, the viscosity of formation water decreases due to the disruption of hydrogen bonds between water molecules [108,109,110,111]. Simultaneously, the gas expansion effect strengthens under high temperatures, driving the conversion of bound water into mobile water within pores and further releasing pore space [112]. A high formation temperature synergistically promotes the conversion of bound water to mobile water within pores and releases reservoir space by enhancing the gas expansion effect, reducing gas-phase flow resistance, and disrupting hydrogen bonds between water molecules to lower formation water viscosity, ultimately leading to peak gas saturation at 140 °C. Overall, the significant disparities among the four curves indicate that the formation temperature exerts a substantial influence on gas–water distribution in low-permeability reservoirs.

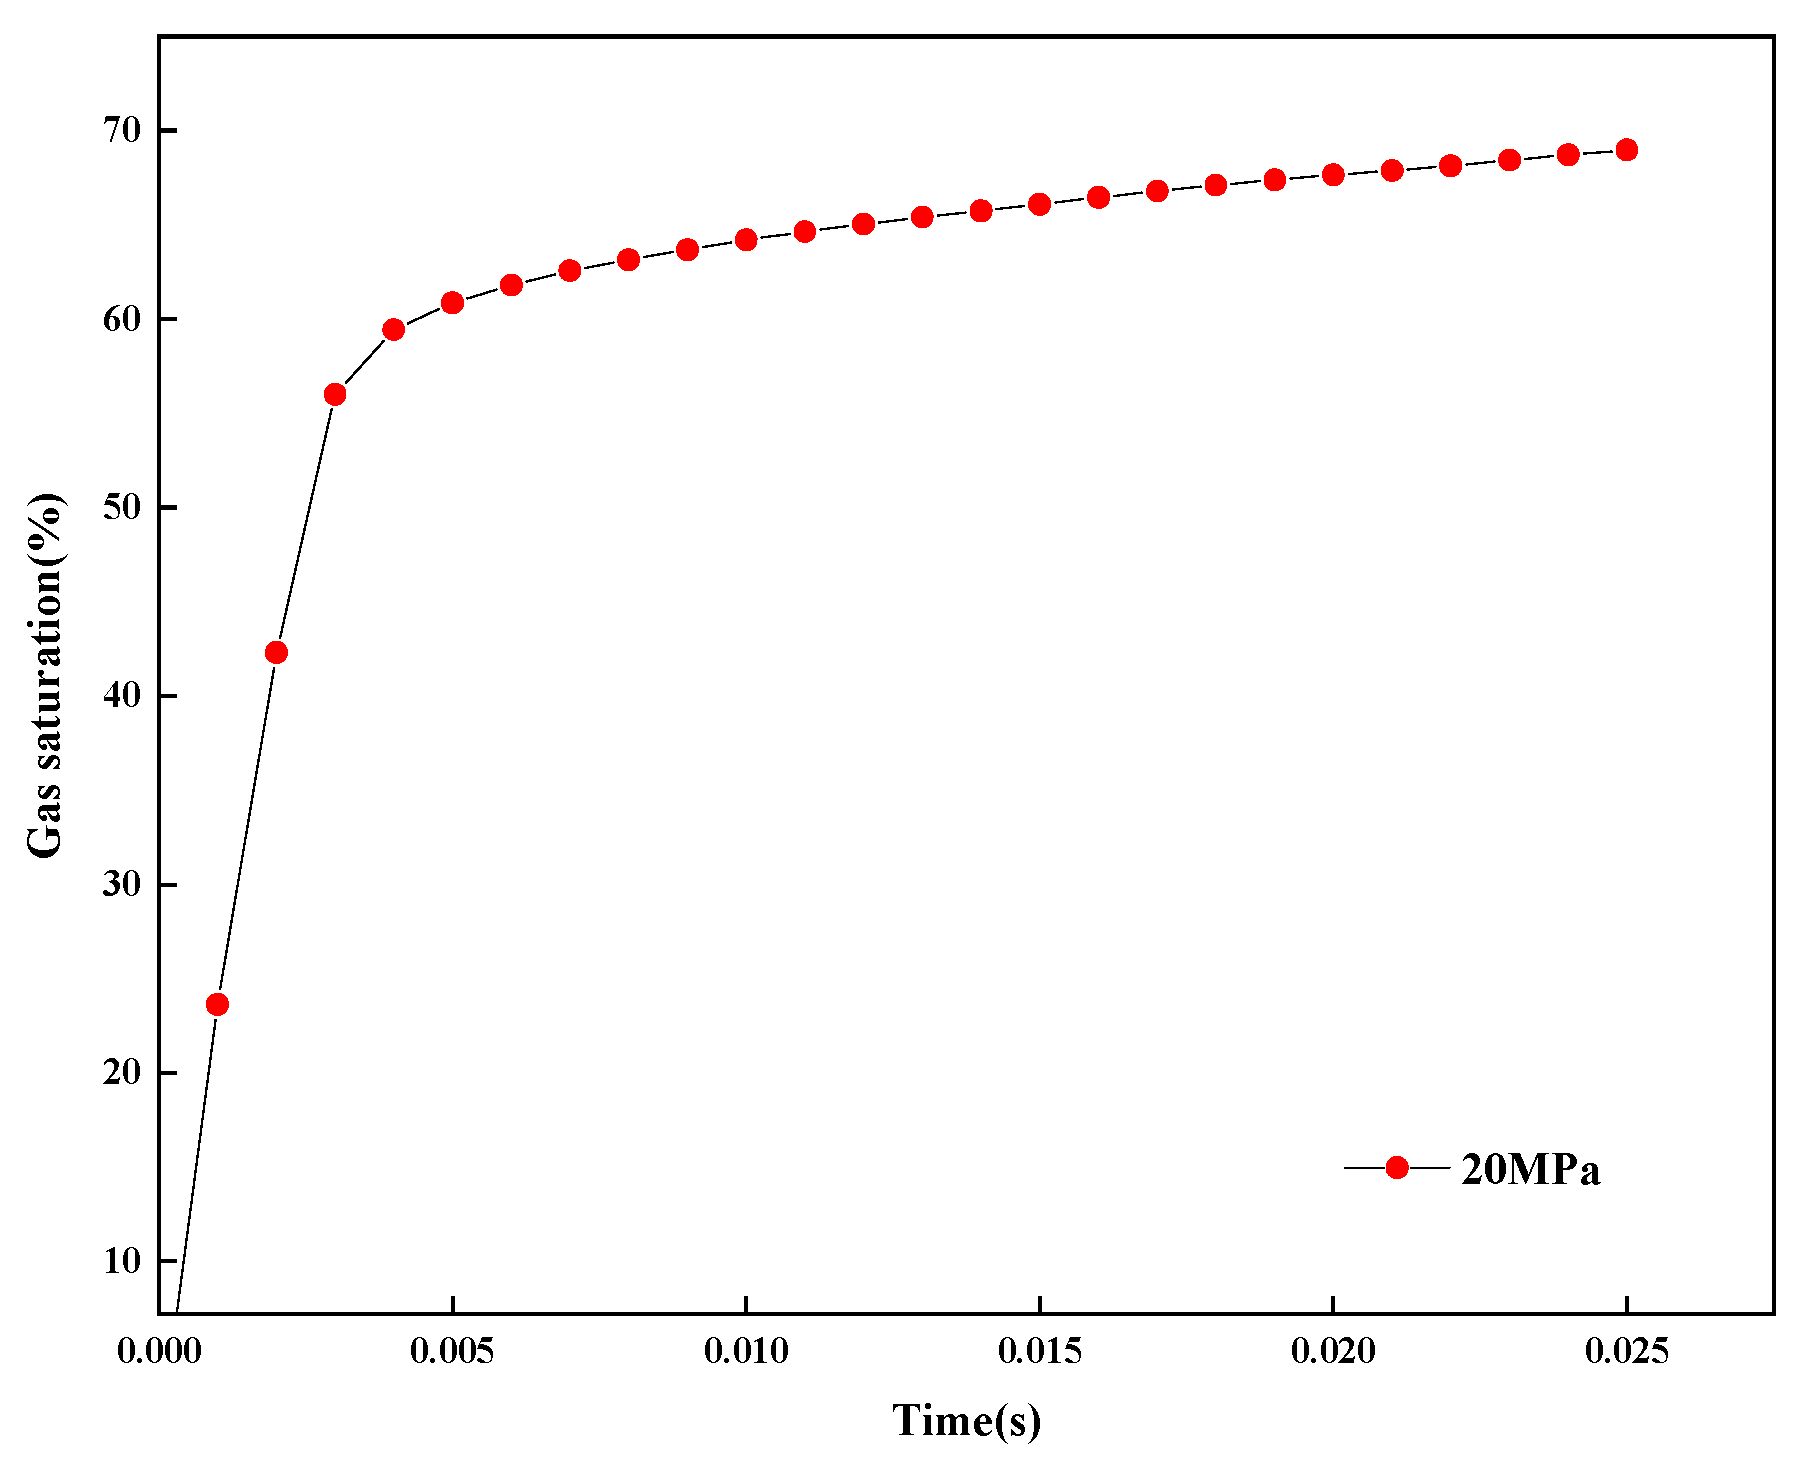
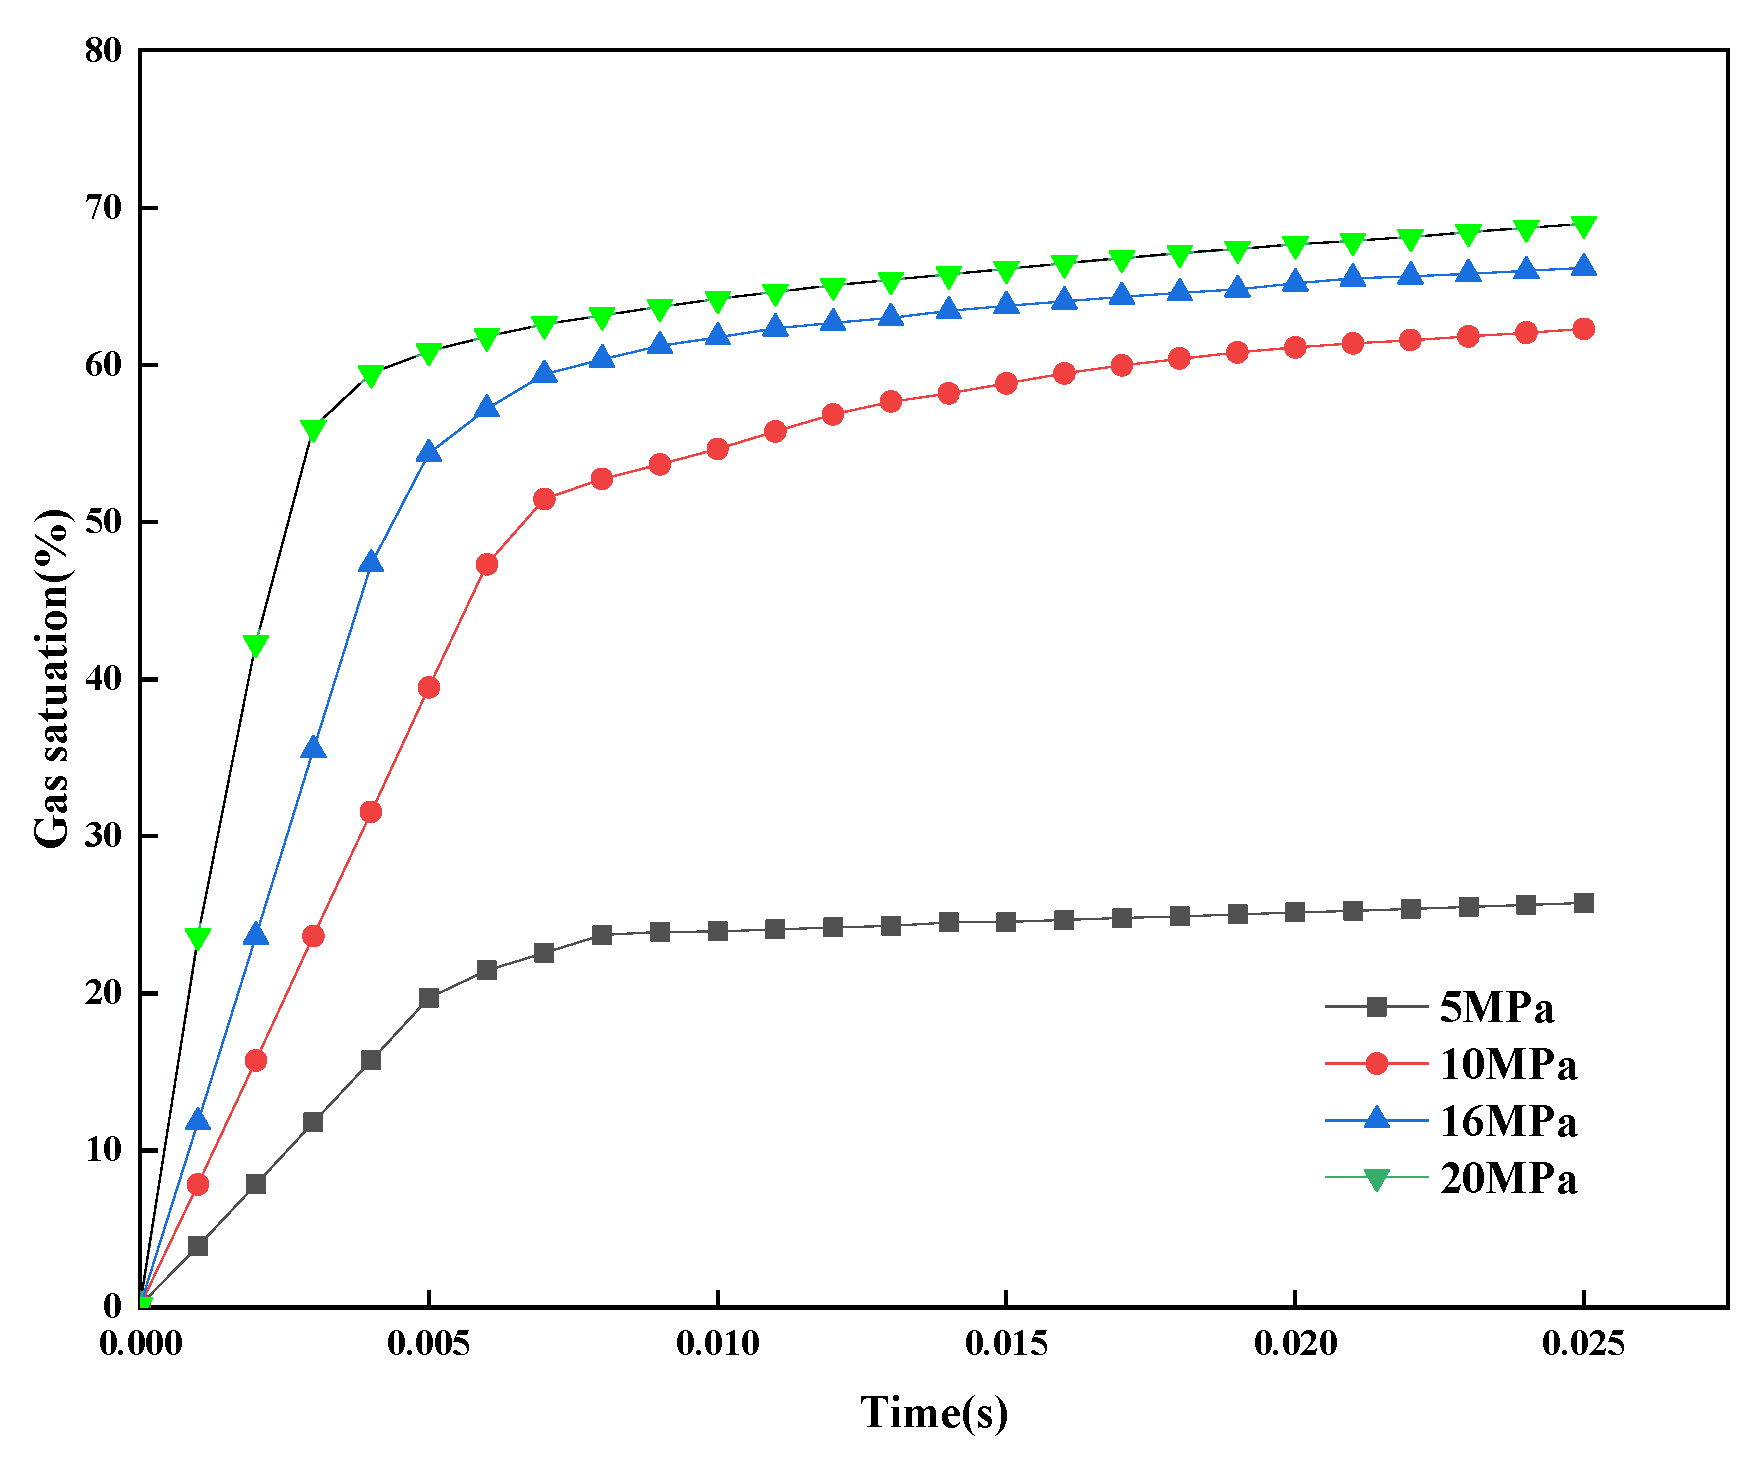
5.2.2. Charging Pressure

The XF area of the Yinggehai Basin is characterized by a unique overpressure system, with its top interface at a burial depth of approximately 3000 m, which is significantly shallower than conventional overpressure basins. Diapiric structural activity vertically transmits deep overpressured fluids, forming localized abnormal high-pressure zones where the pressure gradient decreases outward from the diapiric center. The pressure distribution in this area is strongly influenced by tectonic activity and diapirism, exhibiting distinct differences between the basin center and margins. The central region exhibits intense overpressure (pressure coefficient of 2.0–2.3) due to undercompaction from rapid sedimentation and deep-sourced high-pressure transmission, while the margins show relatively lower pressure (pressure coefficient of 1.8–2.0) resulting from coarser-grained sediments and pressure dissipation [51,62,104,105].
In low-permeability gas reservoirs, the main driving force for natural gas charging is the remaining pressure difference in the source reservoir, and the natural gas enters the low-permeability reservoir to form a reservoir after the charging driving force is greater than the start-up pressure of the low-permeability reservoir [84,113].
Taking the B1 sample as an example, a temperature of 137.41 °C, a gas–liquid interfacial tension of 0.01 N/m, and a wetting angle of 30° were set, and the filling pressure was set to 5 MPa, 10 MPa, 16 MPa, and 20 MPa for the filling simulation. The simulation results show that the filling pressure has an important effect on the gas-water distribution in the reservoir. When the filling pressure is less than 16 MPa, it is difficult to overcome the capillary force in the small pores with a throat radius of 0.01 μm~0.5 μm, and CH4 is locally trapped. When the charging pressure is greater than 16 MPa, a large number of small pore throats are broken through, multiple continuous seepage channels are formed inside the reservoir, and a large amount of formation water is driven away. After a new force balance is formed in the system, the large-pore stagnant water and small-pore bound water that are difficult to drive away remain inside the residual pore space (Figure 9).
Figure 10 shows the gas–liquid distribution curves under different charging pressures. From the analysis of the four curves, it can be seen that when the charging pressure is less than 10 MPa, the gas saturation increases greatly with the increase in charging pressure. When the charging pressure is greater than 10 MPa, the gas saturation increases slowly with the increase in temperature, and the gas saturation is maximum when the charging pressure is 20 MPa.
Low-permeability reservoirs are typically characterized by small throat radii and poor pore connectivity, which hinder the formation of uniform flow fronts during gas displacement. When gas is injected, its lower viscosity compared to the aqueous phase causes it to preferentially form viscous fingering through larger throats or fractures, bypassing bound water in micropores [86]. Additionally, the strong heterogeneity prevalent in low-permeability reservoirs drives gas to selectively flow through high-permeability pathways, creating “preferential flow channels”, while water in low-permeability zones remains poorly displaced [89]. Furthermore, the high gas–water viscosity ratio and capillary pressure effects in these reservoirs exacerbate viscous fingering. Under low-pressure conditions, gas tends to exhibit unstable flow, and capillary pressure impedes the displacement of water in micropores, ultimately leading to the “water-blocking phenomenon” [21,114,115].
The overpressure differential drives natural gas charging, while an insufficient hydrocarbon supply often results in the incomplete displacement of formation water, which is the root cause of residual water [96,97,98]. The combined effects of these factors contribute to the high water saturation observed in low-permeability reservoirs. Moreover, such reservoirs require overcoming a threshold pressure to initiate charging, with denser reservoirs demanding higher equilibrium pressures and exhibiting slower charging processes [102].
The results of this study show that when other conditions are certain, the filling pressure exceeds 5 MPa. With the increase in the filling pressure, the gas saturation of the low-permeability reservoir increases rapidly, and when the filling pressure exceeds 10 MPa, the increase in gas saturation slows. It indicates that different levels of borehole throats have different starting pressures, and small boreholes contain greater capillary force, so that natural gas can enter small boreholes only when the charging pressure reaches the starting pressure of small boreholes. Overall, the gap between the four curves is large, indicating that the charging pressure has a large influence on the change in gas–water distribution in the low-permeability reservoir. The charging pressure drives natural gas charging by overcoming pore throat capillary forces, but its efficiency varies nonlinearly with increasing pressure, controlled by reservoir non-homogeneity and pore throat grading.

5.2.3. Pore and Throat Distribution

From the overall morphology of the T2 spectrum of the core replacement experiment, the pore throat structure of the A1 sample is dominated by small pore throats, and there is a greater capillary force in the reservoir. Compared with the A1 hypotonic sample, the T2 spectrum of the B1 hypotonic sample is to the right overall and the signal amplitude is higher, which indicates that there is a higher proportion of large throats in the microscopic pore throats, and the average radius of the pore channels is larger and saturated with more water. From the charging results, it can be seen that the gas saturation under the maximum charging pressure of the A1 sample is 21.09%, the gas saturation under the maximum charging pressure of the B1 sample is 66.45%, and the gas saturation of the A1 sample is much smaller than that of the B1 sample.
Pore throats of different pore sizes dominate the expansion of the filling channel in stages, with large pore throats laying the basic lattice framework and small pore throats influencing the stable distribution in the later stages [24]. In the later stages of filling, the bound water in the tiny pore spaces and pore edges is difficult to drive off, which has become the key to limiting the gas-bearing saturation [22,90]. Core expulsion experiments of two low-permeability samples under different pressure conditions show that the distribution of pore throats in low-permeability reservoirs has a significant effect on gas and water distribution. For sample A1, it is difficult to effectively realize gas charging due to its small and complex pore throat structure, which leads to lower gas saturation. On the other hand, sample B1 has a higher gas saturation due to its more diversified pore throat dimensions and more efficient gas charging. Differences in pore throat structures significantly control the gas–water distribution in low-permeability reservoirs. Reservoirs with a high proportion of large throats and diversified pore size distributions have significantly higher gas saturations than those with small pore throat complexity and high capillary resistance due to more efficient gas charging and pore connectivity.

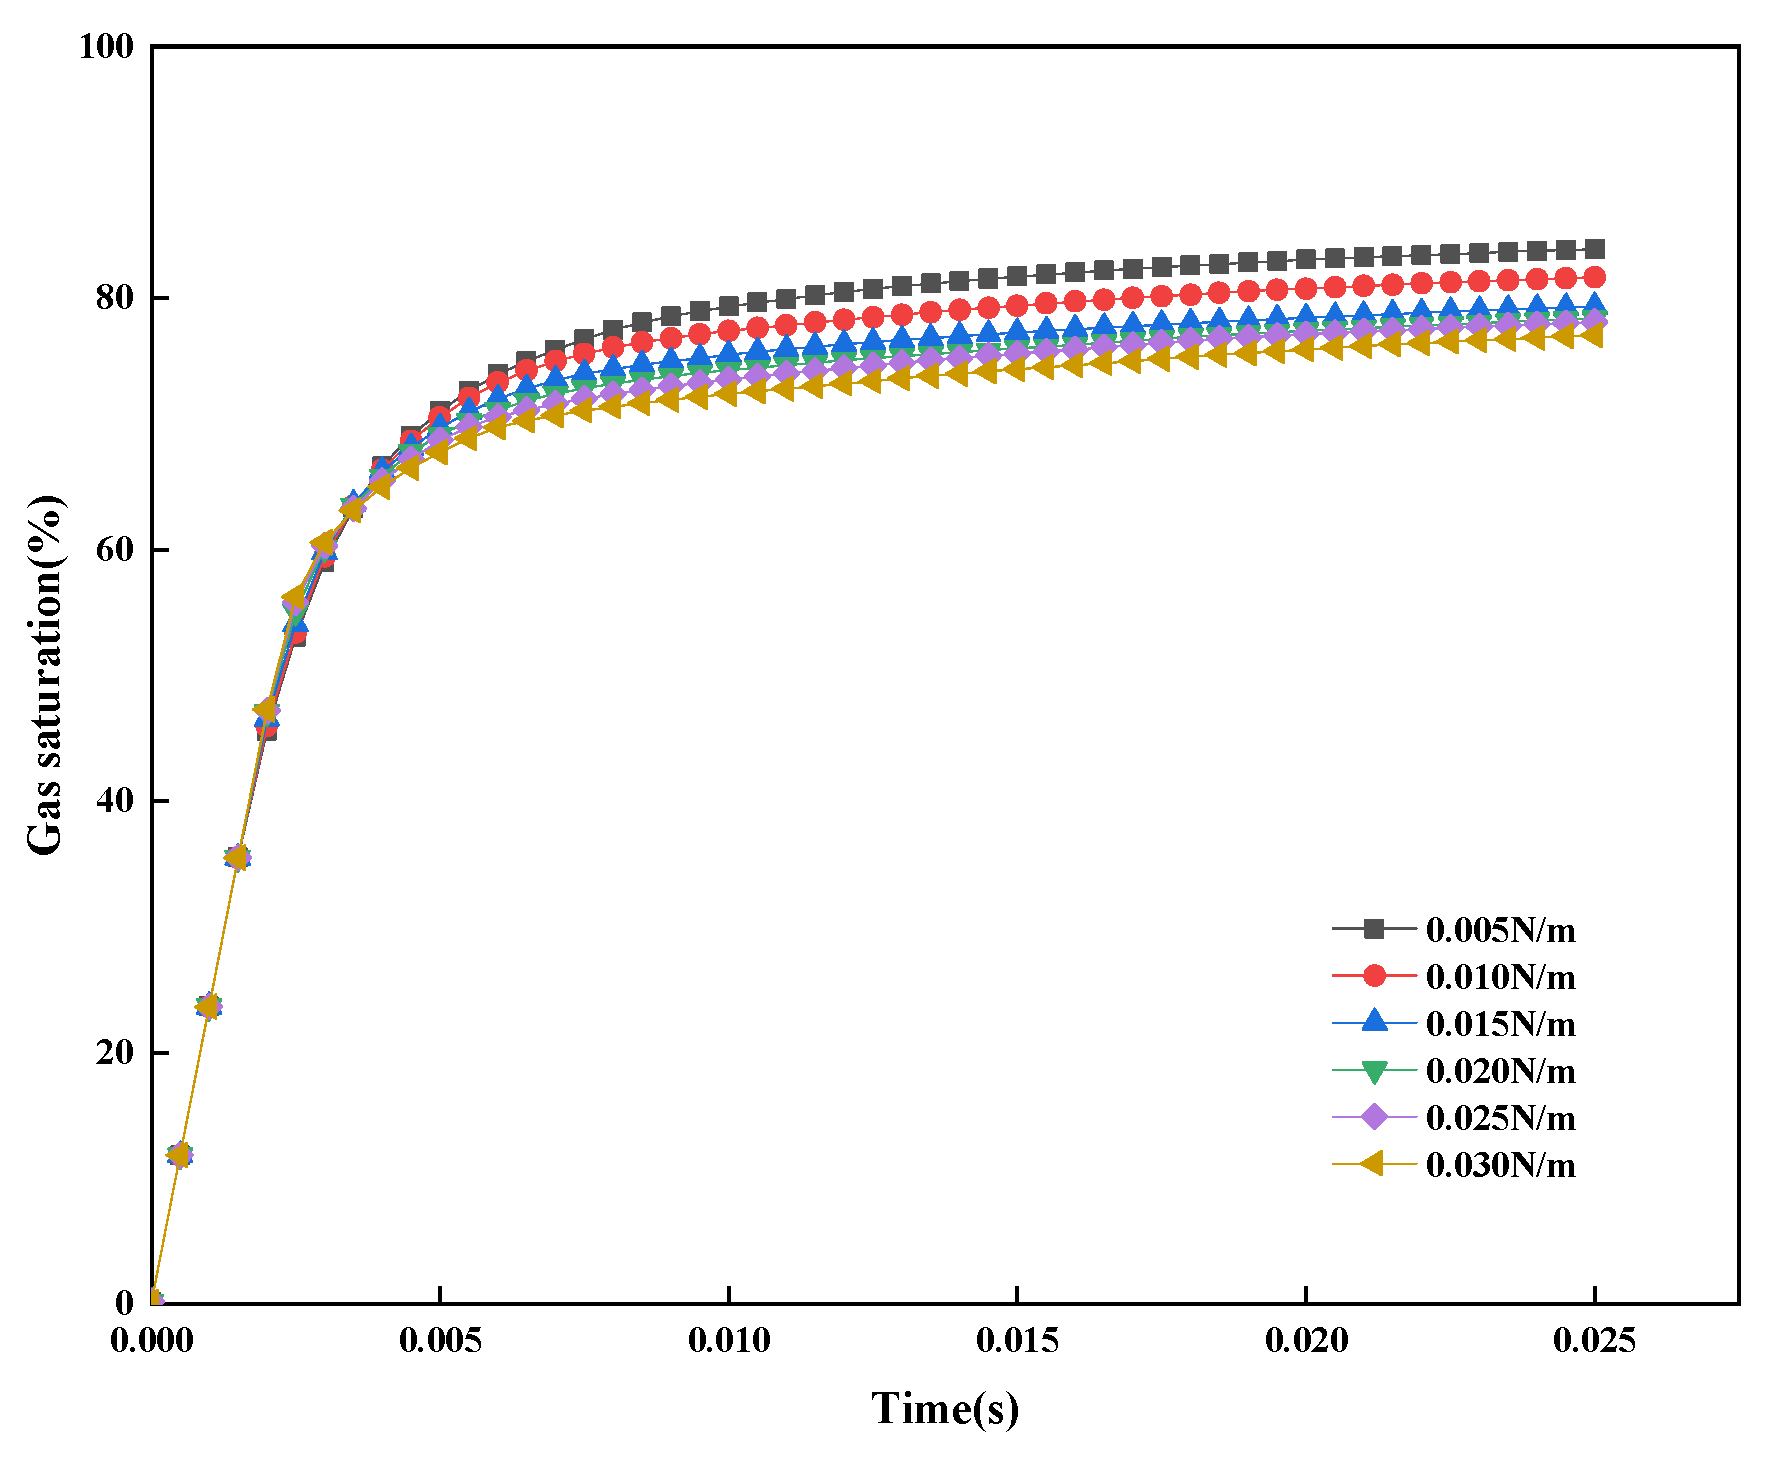
5.2.4. Interfacial Tension

Interfacial tension is the force generated at the interface between two immiscible fluids when they are in contact, and this force tends to minimize the interfacial area [101,115]. Taking the B1 sample as an example, the temperature was set to 137.41 °C, the charging pressure to 30 MPa, and the wetting angle to 30°. The gas–liquid two-phase interfacial tension was set to 0.005 N/m, 0.010 N/m, 0.015 N/m, 0.020 N/m, 0.025 N/m, and 0.030 N/m for simulations.
Figure 11 shows the gas–liquid distribution under steady flow with different gas–liquid two-phase interfacial tensions. Temperature elevation enhances the thermal motion of liquid-phase molecules, increasing intermolecular spacing, weakening hydrogen bonding networks and van der Waals forces, and reducing the imbalance of inward net attraction on surface-layer molecules [116,117]. Simultaneously, the density of gas-phase molecules increases due to intensified evaporation, narrowing the disparity in molecular force fields between phases and further alleviating interfacial tension [117,118]. Elevated pressure acts by enhancing gas-phase molecular solubility and interfacial adsorption: under high pressure, gas molecules more readily dissolve into the liquid phase and accumulate at interfacial regions, disrupting the ordered arrangement of water molecules and reducing liquid-phase density. Concurrently, increased gas-phase density diminishes the density difference between phases, attenuating the anisotropy of interfacial molecular forces [116,119]. Molecular dynamics simulations reveal that gas molecule adsorption and dissolution at interfaces under high pressure disrupt the ordered alignment of water molecules, thereby lowering interfacial tension [118,120]. Through the synergistic effects of molecular kinetic energy, phase density differences, and interfacial adsorption behavior, gas–water interfacial tension decreases with rising temperatures and pressures. The higher the temperature and pressure, the slower the gas–water interfacial tension decreases with increasing temperature [115,121]. From the analysis of the six curves, it can be seen that the gas saturation decreases slightly with the increase in the gas–liquid interfacial tension, and the gas saturation is maximum when the gas–liquid interfacial tension is 0.005 N/m. A lower interfacial tension helps the gas to separate and migrate from the liquid more easily, while a higher interfacial tension increases the resistance of the gas through the liquid layer. Overall, the six curves do not differ much from each other, indicating that the interfacial tension has a small effect on the variation of the gas saturation of CH4.

5.2.5. Wettability

The contact angle is the contact angle formed by a liquid droplet on a solid surface, which is usually expressed by θ. If the wetting angle θ < 90°, the solid surface is hydrophilic, i.e., the liquid is more likely to wet the solid; if the wetting angle θ = 90°, neutral wetting is indicated [101,115,122]. Taking the B1 sample as an example, the temperature was set to 137.41 °C, the charging pressure to 30 MPa, the gas–liquid interfacial tension to 0.01 N/m, and the wetting angle to 10°, 30°, 60°, and 90° for the simulation, respectively.
Figure 12 shows the gas–liquid two-phase distribution under stable flow with different wettability at the last moment of the refluxing stage, with the rest of the conditions remaining unchanged. In the actual reservoir, the contact angle is not fixed but dynamically adjusted with the changes in pressure, temperature, and chemical composition. Under overpressure conditions, the increase in gas solubility may lead to a decrease in the contact angle, thus changing the wettability [115,123]. From the analysis of the three curves, it can be seen that when the other conditions remain unchanged, the gas saturation increases slightly with the increase in the wetting angle, and the gas saturation is maximum when the wetting angle is 90°. The results of this study are consistent with the findings of previous studies. Overall, the three curves have a high degree of overlap, indicating that the wettability has a small effect on the change in gas saturation.
In summary, controlled by the depositional environment and tectonic conditions, the pore throat structure of the low-permeability reservoir of Huangliu Formation in the XF area of Yinggehai Basin is complex, with a large capillary force in the throat so that the natural gas needs a larger charging force to enter the reservoir to form a reservoir. At the same time, the high-temperature and high-pressure environment can reduce the capillary force in the low-permeability reservoir, which makes the low-permeability reservoir easier to form a reservoir. Formation temperature, charging pressure, and pore throat distribution have the greatest influences on reservoir gas saturation, followed by the gas–liquid two-phase interfacial tension. Reservoir wettability has a lesser influence on gas saturation. Although the effects of interfacial tension and reservoir wettability on gas saturation are relatively small, a lower interfacial tension and a higher contact angle can help the gas break through the small throats more easily and improve the filling effect. They are still important factors that influence the natural gas charging process and cannot be ignored.

6. Conclusions

This study integrates core flooding experiments with COMSOL multiphysics-coupled simulations to elucidate the microscopic gas–water occurrence mechanisms and dominant controlling factors of the gas–water distribution in high-temperature, high-pressure, and low-permeability reservoirs, providing theoretical guidance for the development of the Yinggehai Basin and analogous gas reservoirs. The main conclusions are as follows:
  • The pore throat structure of the low-permeability sandstone reservoirs of the Huangliu Formation in the Yinggehai Basin is complex, with significant high-porosity and low-permeability characteristics. Weak compaction and the dissolution of bottom-penetrating fluids make the reservoirs more porous, while a fine grain size, a small throat, more mud, and cementation lead to low reservoir permeability. The non-homogeneity of the pore throat structure and the difference in rock-forming action together shape the reservoir characteristics of “high porosity and low permeability”, which determines the local enrichment characteristics of the reservoir’s “sweet spot”.
  • Natural gas is preferentially charged along the large borehole throat to form a continuous seepage channel, and stagnant water exists in the small throat and in the large borehole throat where the gas does not pass locally. Only when the filling pressure is greater than the capillary force in the small hole can it enter the small hole. When the filling pressure reaches 5 MPa, the radius of the pore throat that can be filled with natural gas ranges from 0.5 to 10 μm, and the radius of the pore throat that can be filled with natural gas when the filling pressure exceeds 16 MPa ranges from 0.01 to 0.5 μm. The gradient variation of the charging pressure reveals the hierarchical control of multi-scale pore throats on gas migration.
  • The results of core driving and numerical simulation show that the reservoir’s pore throat distribution, formation temperature, and filling pressure are the main controlling factors for gas and water distribution in the low-permeability reservoir in the study area. The gas–liquid interface tension is the second factor, and the reservoir wettability has less influence on the gas saturation. The high-temperature and high-pressure environment can reduce the capillary force in the low-permeability reservoir and promote the formation of natural gas accumulation in the low-permeability reservoir. The synergistic effects of formation temperature and charging pressure dominate the gas–water distribution in low-permeability reservoirs. High-temperature and high-pressure conditions reduce capillary forces within these reservoirs, thereby enhancing their potential for natural gas accumulation.
  • The results of this research provide new inspiration for the development of high-pressure, low-permeability gas reservoirs. Sweet spot prediction should prioritize reservoir sections with a high proportion of large orifices and good orifice sorting. The design of gas-charging programs should be combined with reservoir temperature and pressure conditions, and a high-temperature environment can reduce the start-up pressure gradient and improve gas-driving efficiency. For the development of areas with small throats, it is necessary to break through the capillary resistance using ultra-high-pressure gas charging or fracturing modification. In the future, we can combine this with 3D digital core technology to establish a pore and throat network model to further optimize development strategies.

Author Contributions

Conceptualization, T.H. and Z.L.; Methodology, F.J.; Software T.H., T.Z. and J.S.; Validation, G.H. Formal analysis, T.H., B.Y. and Y.L.; Investigation, T.H., X.L. and Q.L.; Resources, G.H.; Data Curation, X.L. and Q.L.; Writing—original draft, T.H.; Writing—review and editing, Z.L., F.J. and G.H.; Visualization, T.Z., J.S., B.Y. and Y.L.; Supervision, F.J.; Project administration, X.L. Funding acquisition, Z.L. All authors have read and agreed to the published version of the manuscript.

Funding

National Natural Science Foundation of China (42472182, U24A20592).

Data Availability Statement

The original contributions presented in the study are included in the article, further inquiries can be directed to the corresponding author.

Conflicts of Interest

Author Gaowei Hu was employed by the company Hainan Branch of CNOOC (China) Co., Ltd. The remaining authors declare that the research was conducted in the absence of any commercial or financial relationships that could be construed as a potential conflict of interest.

References

  1. Holditch, S. Tight gas sands. J. Pet. Technol. 2006, 58, 86–93. [Google Scholar]
  2. Jia, C.; Zheng, M.; Zhang, Y. Unconventional hydrocarbon resources in China and the prospect of exploration and development. Pet. Explor. Dev. 2012, 39, 129–136. [Google Scholar]
  3. Zou, C.; Zhang, G.; Yang, Z.; Tao, S.; Hou, L.; Zhu, R.; Yuan, X.; Ran, Q.; Li, D.; Wang, Z. Geological concepts, characteristics, resource potential and key techniques of unconventional hydrocarbon: On unconventional petroleum geology. Pet. Explor. Dev. 2013, 40, 385–399+454. [Google Scholar]
  4. Li, G.; Lei, Z.; Dong, W.; Wang, H.; Zheng, X.; Tan, J. Progress, challenges and prospects of unconventional oil and gas development of CNPC. China Pet. Explor. 2022, 27, 1–11. [Google Scholar]
  5. Yang, S. Research on Fractional Derivative Modelling of Non-Darcian Flow and Solute Transport; China University of Mining & Technology: Beijing, China, 2019. [Google Scholar]
  6. Dai, Q.; Duan, Y.; Chen, W.; Huang, T.; Zhao, H. Present state of low permeability reservoir percolation study. Spec. Oil Gas Reserv. 2007, 1, 11–14+104. [Google Scholar]
  7. Zou, C.; Tao, S.; Zhang, X.; He, D.; Zhou, C.; Gao, X. Geologic characteristics, controlling factors and hydrocarbon accumulation mechanisms of China’s Large Gas Provinces of low porosity and permeability. Sci. China Ser. D 2009, 52, 1068–1090. [Google Scholar]
  8. Zeng, J.; Cheng, S.; Kong, X.; Guo, K.; Wang, H. Non-Darcy flow in oil accumulation (oil displacing water) and relative permeability and oil saturation characteristics of low-permeability sandstones. Pet. Sci. 2010, 7, 20–30. [Google Scholar]
  9. Zeng, J.; Zhang, Y.; Zhang, S.; Qiao, J.; Feng, X.; Feng, S. Experimental and theoretical characterization of the natural gas migration and accumulation mechanism in low-permeability (tight) sandstone cores. J. Nat. Gas Sci. Eng. 2016, 33, 1308–1315. [Google Scholar]
  10. Dai, J.; Wang, L.; Sun, X. Numerical investigation on the non-Darcy flow in fractures under the joint influence of fracture dilation and inertial effect. Hydrogeol. Eng. Geol. 2025, 52, 44–52. [Google Scholar]
  11. Hao, H.; Lv, J.; Chen, Y. Research advances in non-Darcy flow in low permeability media. J. Groundw. Sci. Eng. 2021, 9, 83–92. [Google Scholar]
  12. Sun, Z.; Ma, B.; Li, F. Nonlinear flow mechanism and characteristic analysis of fluid in low permeability reservoirs. J. Southwest Pet. Univ. (Nat. Sci. Ed.) 2019, 41, 109–117. [Google Scholar]
  13. Li, Z.; He, S. Discussion on non-Darcy flow mechanism in low permeability reservoirs. Spec. Oil Gas Reserv. 2005, 2, 35–38+105. [Google Scholar]
  14. Li, X.; Li, Y.; Shao, J.; Duan, H.; Zhu, H. Research on Productivity Characteristics and Correction of ProductivityEquations of Gas Wells in Fractured Gas Reservoirs. J. Southwest Pet. Univ. (Nat. Sci. Ed.) 2024, 46, 97–105. [Google Scholar]
  15. Liu, Y.; Tan, Z.; Lu, T.; Li, J.; Zhu, Y.; Luo, C.; Li, W.; Shi, L. Strategy and Study Suggestions for Development of Large and Low Permeability and Water Bearing Tight Gas Reservoir: A Case Study of The Sulige Gasfield. In Proceedings of the International Field Exploration and Development Conference 2016, Beijing, China, 11–12 August 2016. [Google Scholar]
  16. Wang, R.; Li, J.; He, T.; Wu, H. Study on the Sedimentary Facies and Gas-Water Distribution Regularity of Shanxi and Xiashihezi Formation in Su77 & Zhao51 Well region, Eastern Sulige Gas field. Groundwater 2013, 35, 26–28. [Google Scholar]
  17. Hao, G.; Liu, G.; Xie, Z.; Xie, M. Gas-Water Distributed Pattern in Xujiahe Formation Tight Gas Sandstone Reservoir and Influential Factor in Central Sichuan Basin. Nat. Gas Geosci. 2010, 21, 427–434. [Google Scholar]
  18. Zhang, G.; Zhao, K.; Zhao, A.; Wu, H.; Peng, T.; Cao, W. Water Production Mechanism and Analysis of Influencing Factors in Ultra-low Permeability Gas Reservoir. In Proceedings of the China Petroleum Association Natural Gas Commission, Fuzhou, China, 14 November 2018. [Google Scholar]
  19. Fan, C.; Huang, Z.; Deng, G.; Hou, J.; Zhao, J. Movable fluid characteristics and lower limit of natural gas charging in sandstone reservoirs of LD10 gas field in the Yinggehai Basin. Acta Geol. Sin. 2022, 96, 3994–4009. [Google Scholar]
  20. Zhang, Y.; Xu, X.; Wang, L.; Wu, Y.; Yuan, B.; Zhu, J.; He, S.; Liao, J. The Accumulation Process and Model of Overpressured Low Permeability Gas Pool in the North of South China Sea: A Case Study of XF13-1 Overpressured Gas Field in XF Area of the Yinggehai Basin. Nat. Gas Geosci. 2015, 26, 1679–1688. [Google Scholar]
  21. Yang, Z.; Jiang, H.; Zhu, G.; Li, S.; Shan, W. Research on reservoir evaluation index for low-permeability water-bearing gas reservoir. Acta Pet. Sin. 2008, 36, 252–255. [Google Scholar]
  22. Zhu, H.; Xu, X.; An, L.; Guo, C.; Xiao, J. An experimental on occurrence and mobility of pore water in tight gas reservoirs. Acta Pet. Sin. 2016, 37, 230–236. [Google Scholar]
  23. Armstrong, R.T.; Ott, H.; Georgiadis, A.; Rücker, M.; Schwing, A.; Berg, S. Subsecond pore-scale displacement processes and relaxation dynamics in multiphase flow. Water Resour. Res. 2014, 50, 9162–9176. [Google Scholar]
  24. Qiao, J.; Zeng, J.; Xia, Y. A Three Dimensional Visualized Physical Simulation for Natural Gas Charging in The Micro-Nano Pore System. Pet. Explor. Dev. 2022, 49, 306–318. [Google Scholar]
  25. Guo, Y.; Zhang, L.; Zhu, G.; Yao, J.; Sun, H.; Song, W.; Yang, Y.; Zhao, J. A pore-scale investigation of residual oil distributions and enhanced oil recovery methods. Energies 2019, 12, 3732. [Google Scholar] [CrossRef]
  26. Dlotko, T. Navier–Stokes–Cahn–Hilliard system of equations. J. Math. Phys. 2022, 63, 111511. [Google Scholar]
  27. COMSOL. COMSOL Multiphysics Reference Manual; COMSOL: Grenoble, France. Available online: https://doc.comsol.com/5.5/doc/com.comsol.help.comsol/COMSOL_ReferenceManual.pdf (accessed on 17 March 2025).
  28. Ji, B. Technological advances and prospects of enhanced oil recovery in domestic and foreign oilfields. Oil Gas Geol. 2012, 33, 111–117. [Google Scholar]
  29. Li, Y. Technical progress and prospects of CO2 flooding for enhanced oil recovery in low-permeability reservoirs. Pet. Geol. Recovery Effic. 2020, 27, 1–10. [Google Scholar]
  30. Wang, G.; Lyu, W.; Cui, K.; Ji, Z.; Wang, H.; He, C.; He, C. Technical progress and application of global carbon dioxide capture, utilization and storage cluster. Pet. Explor. Dev. 2025, 52, 1–10. [Google Scholar]
  31. Dou, L.; Sun, L.; Lyu, W.; Wang, M. Trend of global carbon dioxide capture, utilization and storage industry and challenges and countermeasures in China. Pet. Explor. Dev. 2023, 50, 1083–1096. [Google Scholar]
  32. Afzali, S.; Rezaei, N.; Zendehboundi, S.; Charzis, I. Computational fluid dynamic simulation of multi-phase flow in fractured porous media during water-alternating gas injection process. J. Hydrol. 2022, 610, 127852. [Google Scholar]
  33. Cui, C.; Li, G.; Li, J.; Li, A. Micro-numerical simulation study on the mechanism of residual sequestration of CO2 in saline aquifers. China Sci. Pap. 2024, 19, 1–7. [Google Scholar]
  34. Zhao, E.; Jin, Z.; Li, G.; Zhang, K.; Zeng, Y. Numerical simulation of CO2 storage with enhanced gas recovery in depleted tight sandstone gas reservoirs. Fuel 2024, 371, 131948. [Google Scholar]
  35. Liu, X.; Xiong, J.; Liang, L.; Yuan, W. Study on the characteristics of pore structure of tight sand based on micro-CT scanning and its influence on fluid flow. Prog. Geophys. 2017, 32, 1019–1028. [Google Scholar]
  36. Mo, F.; Du, Z.; Peng, X.; Liang, B. Pore-scale modeling of gas-water flow in permeability jail of tight sandstones. J. Porous Media 2019, 22, 1273–1288. [Google Scholar]
  37. Shi, H.; Zhu, Q.; Chen, Z.; Li, J.; Feng, D.; Zhang, S.; Ye, J.; Wu, K. Pore-scale modeling of water–gas flow in heterogeneous porous media. Phys. Fluids 2023, 35, 072114. [Google Scholar]
  38. Yan, R.; Zhang, Y.; Meng, W.; Sun, D.; Luo, D.; Ding, W. Micro-scale flow simulation study of low-yield wells in tight gas reservoirs. J. Phys. Conf. Ser. 2024, 2865, 012027. [Google Scholar]
  39. He, J.; Yang, J.; Chen, Z.; Zhu, J.; Tong, C. Characteristics of natural gas accumulation in the middle-deep layers of the Yinggehai Basin. Nat. Gas Ind. B 2003, 23, 15–19. [Google Scholar]
  40. Pei, J.; Yu, J.; Wang, L.; Hao, D. Key challenges and strategies for mid-deep natural gas exploration in the Yinggehai Basin. Acta Pet. Sin. 2011, 32, 573–579. [Google Scholar]
  41. Xu, C.; Gao, Y.; Zhang, J.; Zhang, X. Recent exploration situation, insights, and development strategy of CNOOC. China Offshore Oil Gas, 2025; in press. [Google Scholar]
  42. Xie, Y.; Zhang, Y.; Li, X.; Zhu, J.; Tong, C.; Zhong, Z.; Zhou, J.; He, S. Key controlling factors and accumulation models of high-temperature and overpressured gas reservoirs in the Yinggehai Basin. Acta Pet. Sin. 2012, 33, 601–609. [Google Scholar]
  43. Ma, J.; Huang, Z.; Li, X.; Pei, J.; Wu, H.; Zhu, J. Cause analysis of natural gas with high water saturation and low gas saturation in high-temperature and high-pressure zone of DF area in Yinggehai Basin. J. China Univ. Pet. Nat. Sci. 2015, 39, 43–49. [Google Scholar]
  44. Yu, J.; Liu, Q.; Wang, L.; Chao, C.; Hu, G. Gas-water distribution pattern of the DF13 gas field in the Yinggehai Basin. Mar. Orig. Pet. Geol. 2020, 25, 132–140. [Google Scholar]
  45. Jiang, G.; Xie, H.; Zhao, Z.; Shi, H.; Pan, H. Cenozoic tectonic-sedimentary evolution and dynamic mechanisms analysis of the Yinggehai Basin. Acta Oceanol. Sin. 2023, 45, 44–57. [Google Scholar]
  46. Hu, G.; Liu, X.; Chen, Y.; Qiu, H.; Li, Y. Comprehensive identification of sediment source in the First Member of Huangliu Formation in Yinggehai Basin. Mar. Geol. Front. 2024, 40, 62–74. [Google Scholar]
  47. Yuan, Y.; Yang, S.; Hu, S.; He, L. Tectonic subsidence history and controlling factors of Qiongdongnan Basin. Chin. J. Geophys. 2008, 51, 376–383. [Google Scholar]
  48. Zhang, J.; Song, R.; Zheng, F.; Zheng, Y.; Tang, X.; Li, B.; Dong, S. Natural gamma-ray log-derived heat production rates of strata and lithospheric thermal structure in the central depression, Yinggehai Basin. Coal Geol. Explor. 2024, 52, 10. [Google Scholar]
  49. Luo, D.; Cai, F.; Yan, G.; Wang, L.; Tong, C. Structural characteristics and deep crustal structure of Yinggehai-Song Hong Basin. Prog. Geophys. 2014, 29, 2917–2926. [Google Scholar]
  50. Li, C.; Luo, X.; Fan, C.; Zhang, L.; Liu, A.; Li, H.; Li, J. Generation mechanism of overpressure and its implication for natural gas accumulation in Miocene reservoir in Ledong A structure, Ledong slope, Yinggehai Basin. Chin. J. Geol. 2021, 56, 1034–1051. [Google Scholar]
  51. Feng, C.; Huang, Z.; Tong, C. Overpressure evolution and its relationship with migration and accumulation of gas in Yinggehai Basin. J. Jilin Univ. Earth Sci. 2013, 43, 1341–1350. [Google Scholar]
  52. Zhang, H.; Pei, J.; Zhang, Y. Overpressure reservoirs in the mid-deep Huangliu Formation of the Dongfang area, Yinggehai Basin, South China Sea. Pet. Explor. Dev. 2013, 40, 284–293. [Google Scholar] [CrossRef]
  53. Xie, Y.; Zhang, Y.; Zhang, S.; Zhang, Y.; Liu, J. Characteristics and influencing factors of low permeability reservoirs in the Huangliu Formation of Dongfang area, Yinggehai Basin. Pet. Geol. Exp. 2015, 37, 541–547. [Google Scholar]
  54. Ma, J.; Huang, Z.; Wu, H.; Liu, P.; Xu, X. Microscopic pore-throat characteristics of reservoirs in the Huangliu Formation of Dongfang area, Yinggehai Basin and their influence on physical properties. Acta Sedimentol. Sin. 2015, 33, 983–990. [Google Scholar]
  55. Huang, Z.; Zhu, J.; Ma, J.; Wu, H.; Zhang, Q. Characteristics and genesis of high-porosity and low-permeability reservoirs in the Huangliu Formation of high temperature and high pressure zone in Dongfang area, Yinggehai Basin. Oil Gas Geol. 2015, 36, 288–296. [Google Scholar]
  56. Huang, B.; Huang, H.; Li, L. Characteristics of Marine Source Rocks and Effect of High Temperature and Overpressure to Organic Matter Maturation in Yinggehai-Qiongdongnan Basins. Mar. Orig. Pet. Geol. 2010, 15, 11–18. [Google Scholar]
  57. Xie, Y.; Huang, B. Characteristics and accumulation mechanism of the high-temperature and overpressured DF13-1 gas field in the Yinggehai Basin, South China Sea. Sci. China Earth Sci. 2014, 44, 1731–1739. [Google Scholar]
  58. Xu, J.; Zhao, N.; Xu, S. Main controlling factors and development model of the Miocene marine source rocks in Yinggehai Basin. Bull. Geol. Sci. Technol. 2021, 40, 54–63. [Google Scholar]
  59. Wu, K.; Pei, J.; Hu, L. Accumulation model and exploration direction of medium-large gas fields in Yinggehai Basin. Acta Pet. Sin. 2023, 44, 2200–2216. [Google Scholar]
  60. Xiong, X.; Xu, X.; Gan, J.; Guo, X.; Liang, G. Differential Distribution and Accumulation Characteristics of Natural Gas in the Central Diapir Zone of Yinggehai Basin. Mar. Geol. Front. 2017, 33, 24–31. [Google Scholar]
  61. Ou, Y. Sedimentary Features and Distribution of High-Quality Reservoirs in the Ledong Area, Yinggehai Basin. Int. J. Geosci. 2023, 14, 337–350. [Google Scholar]
  62. Wu, X.; Liao, J.; Sun, W.; Liu, P.; Li, C. Migration, accumulation conditions and distribution enrichment patterns of natural gas in Yinggehai Basin. J. Geomech. 2021, 27, 963–974. [Google Scholar]
  63. Jin, B.; Liu, Z.; Li, X. Characteristics of Geothermal-Geopressure System and Its Implications for Natural Gas Accumulation in Yinggehai Basin. Nat. Gas Geosci. 2008, 1, 49–55. [Google Scholar]
  64. Sun, Z. Research on the Correlation Between Fractal Characteristics of Microstructure of Sandstone and Its Permeability. Master’s Thesis, North China Institute of Science and Technology, Langfang, China, 2020. [Google Scholar]
  65. Zhang, Z.; Lin, X.; Wang, H.; Wang, Y.; Yan, X.; Lin, N.; Zhu, S.; Zhou, J. Evaluation of tight sandstone reservoirs based on differences in micro porestructure: Taking Bashijiqike Formation of Zhongqiu 1 Block in Tarim Basin as an example. Nat. Gas Geosci. 2025, 1, 1–23. [Google Scholar]
  66. Wang, Z.; Liu, M.; Cao, B.; Yang, Y.; Huang, P.; Lian, C.; Huang, C. Diagenesis and High-Quality Reservoir Development Model of the Xu3 Member Tight Sandstone in the Western Sichuan Depression, Sichuan Basin. Acta Sedimentol. Sin. 2021, 40, 1–14. [Google Scholar]
  67. Gu, X.; Wang, Z.; Ge, Y.; Yan, H. Migration characteristics and influencing factors of gas injection front in low-permeability reservoirs. Complex Hydrocarb. Reserv. 2024, 17, 342–346. [Google Scholar]
  68. Zhang, L.; Tan, X.; Jiao, Y.; Jia, H.; Yu, H. Experimental study and numerical simulation on enhanced oil recovery by CO2 microfoam flooding in offshore low-permeability reservoirs. China Offshore Oil Gas 2023, 35, 145–153. [Google Scholar]
  69. Xiao, D.; Lu, S.; Lu, Z.; Huang, W.; Gu, M. Combining nuclear magnetic resonance and rate-controlled porosimetry to probe the pore-throat structure of tight sandstones. Pet. Explor. Dev. 2016, 43, 961–970. [Google Scholar] [CrossRef]
  70. Xiong, S.; Chu, S.; Pi, S. Micro-Pore Characteristics and Recoveravility of Tight Oil Reservoirs. Earth Sci. 2017, 42, 1379–1385. [Google Scholar]
  71. Guo, C.; Li, H.; Tao, Y.; Lang, L.; Niu, Z. Water invasion and remaining gas distribution in carbonate gas reservoirs using core displacement and NMR. J. Cent. South Univ. 2020, 27, 531–541. [Google Scholar]
  72. Pan, Y.; Huang, Z.; Guo, X. Analysis of accumulation conditions of lacustrine organic-rich shale oil affected by volcanic ash: A case study of the Lucaogou Formation in the Tiaohu-Malang sag, Santanghu basin. Acta Geol. Sin. 2022, 96, 1053–1068. [Google Scholar]
  73. Xie, Z.; Yang, C.; Li, J. Charging simulation experiment and characteristics of tight sandstone gas reservoirs: A case study of the Upper Triassic Xujiahe Formation sandstone gas reservoir in the central Sichuan Basin. Nat. Gas Ind. 2020, 40, 31–40. [Google Scholar]
  74. Zhong, H.; Zhang, F.; Zhao, Z. Micro-scale pore–throat distributions in tight sandstone reservoirs and its constrain to movable fluid. Exp. Pet. Geol. 2021, 43, 77–85. [Google Scholar]
  75. Lu, Y.; Cui, Y.; Zhu, M.; Zhao, S. New method for calculating clay-bound water in NMR logging. Pet. Geophys. Explor. 2022, 57, 713–718+497. [Google Scholar]
  76. Liu, Y.; Lin, C.; Lin, J.; Huang, X.; Liu, B. Pore structure characteristics and genetic analysis of deep tight sandstone in Xihu Depression, East China Sea Basin. Nat. Gas Geosci. 2024, 35, 405–422. [Google Scholar]
  77. Zhao, J.; Zheng, C.; Lin, Z.; He, X.; Qi, X.; Liu, X. Experimental simulation and regular pattern analysis of resistivity variation during waterflooding in sandstone reservoirs. Prog. Geophys. 2023, 38, 2219–2229. [Google Scholar]
  78. Guo, H.; Wang, B.; Kou, G.; Lin, Z.; Zhou, H.; Zhu, Y. New method for measuring saturation of Mahu conglomerate by closedcoring based on Coulomb method and nuclear magnetic resonance. Prog. Geophys. 2021, 36, 2693–2701. [Google Scholar]
  79. Zhu, H.; Zhu, W.; Luo, R. Research progress on development mechanism of low-permeability gas reservoirs. Nat. Gas Ind. 2010, 30, 44–47. [Google Scholar]
  80. Tong, Z.; Xi, X.; Wang, P. Reevaluation of hydrocarbon resource potential in Nanwu sag of the South Yellow Sea basin: Based on the numerical modeling method of hydrocarbon generation kinetics. China Offshore Oil Gas 2017, 29, 23–28. [Google Scholar]
  81. Huan, J.; Qi, Z.; Yang, C. Diagenetic Mechanisms and Pore Evolution of Huangliu Formation Member 1 Reservoirs in Dongfang Area, Yinggehai Basin. Geol. Sci. Technol. Inf. 2016, 35, 87–93. [Google Scholar]
  82. Guan, Y.; Ye, Q.; Zhang, C.; Chen, J.; Tang, X. Pore structure characteristics and classification evaluation of high-pressure low-permeability clastic reservoirs: A case study of the first member of Huangliu Formation in Dongfang A-1 area, Yinggehai Basin. J. Northeast Pet. Univ. 2024, 48, 75–89. [Google Scholar]
  83. Li, J.; Zheng, M.; Chen, X. Connotation analyses, source-reservoir assemblage types and development potential of unconventional hydrocarbon in China. Acta Pet. Sin. 2015, 36, 521–532. [Google Scholar]
  84. Zhao, X.; Zeng, J.; Han, G.; Feng, S.; Shi, Q.; Liu, Y.; Zong, J.; Lu, Y. Charging characteristics and accumulation process of deep low-permeability (tight) sand gas reservoirs in Banqiao Sag, Huanghua Depression. Oil Gas Geol. 2020, 41, 913–927. [Google Scholar]
  85. Gao, S.; Xiong, W.; Liu, X.; Hu, Z.; Xue, H. Experimental research status and new understanding of gas seepage mechanism in low-permeability sandstone gas reservoirs. Nat. Gas Ind. 2010, 30, 52–55. [Google Scholar]
  86. Pan, H.; Wang, J.; Fan, Z. Low Resistivity Oil(Gas)-Bearing Reservoir Conductive Model. Sci. China Ser. D—Earth Sci. 2001, 44, 346–355. [Google Scholar] [CrossRef]
  87. Wang, J.; Liu, J.; Wang, Y. Influencing Factors and Changes of Unsealing Behaviors in Fractured Water-Sealed Gas Reservoirs. Nat. Gas Ind. 2025, 45, 129–139. [Google Scholar]
  88. Zuo, W.; Cui, P.; Liu, Y. Characterisation of Non-Isothermal Gas-Water Two-Phase Displacement Based on The Phase Field Method. Acta Mech. Sin. 2025, 57, 261–272. [Google Scholar]
  89. Zhang, J.; Guo, X. Adaptability of Polymer to Reservoir Pore Structure in Pubei Oilfield. Lithol. Reserv. 2016, 28, 101–105. [Google Scholar]
  90. Wang, L.; Yang, S.; Peng, X.; Deng, H.; Li, L.; Meng, Z.; Qian, K.; Wang, Q. Visual experiments on the occurrence characteristics of multi-type reservoir water in fracture-cavity carbonate gas reservoir. Acta Pet. Sin. 2018, 39, 686–696. [Google Scholar]
  91. Wang, C. Evaluation of Pore Structure and Microscopic Occurrence Mechanism of Gas and Water in Tight Sandstone Reservoirs of Penglaizhen Formation in Western Sichuan. Master’s Thesis, Southwest Petroleum University, Chengdu, China, 2017. [Google Scholar]
  92. Liu, Y.; Tan, Z.; Lu, T.; Li, J.; Zhu, Y.; Luo, C.; Li, W.; Shi, L. Technical strategies for efficient development of large-scale low-permeability water-bearing tight sandstone gas reservoirs: A case study of Sulige Gas Field, Ordos Basin. In Proceedings of the 2016 International Conference on Oil and Gas Field Exploration and Development, Beijing, China, 11–12 August 2016. [Google Scholar]
  93. Wang, R.; Li, J.; He, T. Sedimentary microfacies and gas-water distribution of Shanxi-Lower Shihezi Formation in Su 77 and Zhao 51 blocks, eastern Sulige area. Groundwater 2013, 35, 26–28. [Google Scholar]
  94. Hao, G.; Liu, G.; Xie, Z. Gas-water distribution patterns and influencing factors of tight sandstone gas reservoirs in Xujiahe Formation, central Sichuan Basin. Nat. Gas Geosci. 2010, 21, 427–434. [Google Scholar]
  95. Zhang, G.; Zhao, K.; Zhao, A.; Wu, H.; Peng, T.; Cao, W. Mechanism and Influencing Factors of Water Production in Ultra-Low Permeability Gas Reservoirs. In Proceedings of the 2018 National Natural Gas Academic Annual Conference, Fuzhou, China, 11 November 2018. [Google Scholar]
  96. Fang, S.; Zhao, M.; Liu, K.; Liu, S.; Zhuo, Q.; Fan, J. Analysis of main controlling factors of gas-bearing properties in deep low-porosity and low-permeability reservoirs in thrust belts. In Proceedings of the Academic Symposium on Unconventional Oil and Gas Reservoir Formation and Exploration Evaluation, Daqing, China, 1 August 2013. [Google Scholar]
  97. Zhang, L.; Wang, P.; Yang, Z. Characteristics and main controlling factors of low-permeability reservoirs: A case study of X oil layer group in A oilfield. J. Oil Gas Technol. 2013, 35, 15–20. [Google Scholar]
  98. Sun, Z.; Zhang, Z.; Guo, Z. Geochemical characteristics of formation water and gas-water distribution in karst reservoirs: A case study of Ma 5-5 submember in the Majiagou Formation, southern Sulige Gas Field. Acta Sedimentol. 2024; in press. [Google Scholar]
  99. Dong, Q. A Research of Geological Controlling Factors of Gas Well Productivity in Tight Gas Reservoir: An example from SuX area in Sulige gas field. Master’s Thesis, Yangtze University, Jingzhou, China, 2023. [Google Scholar]
  100. Sun, Z.; Zhong, Z.; Zhou, D. The Analysis and Analogue Modeling of the Tectonic Evolution andStrong Subsidence in the Yinggehai Basin Basin. Earth Sci. 2007, 32, 347–356. [Google Scholar]
  101. Li, A. Petrophysics; China University of China Press: Beijing, China, 2011; pp. 244–257. [Google Scholar]
  102. Xu, X. Experimental study on micro-pore structure and seepage characteristics of ultra-low permeability reservoirs in Dongfenggang Oilfield. Petrol. Drill. Tech. 2017, 45, 96–100. [Google Scholar]
  103. Yi, F.; Pang, H.; Zhao, G. Gas-water distribution and main controlling factors of tight gas reservoirs in Block Su 39, Ordos Basin. Nat. Gas Geosci. 2023, 34, 1815–1827. [Google Scholar]
  104. Xie, Y. Pressure prediction model and new understanding of reservoir formation in Yinggehai high-temperature overpressure basin. Nat. Gas Ind. 2011, 31, 21–25+124–125. [Google Scholar]
  105. Gong, Z.; Li, S. Hydrocarbon Accumulation Dynamics in the Northern Continental Margin Basins of the South China Sea; Science Press: Beijing, China, 2004. [Google Scholar]
  106. Chen, J.; Yang, S.; Zou, C. Flow characteristics and influencing factors of low permeability-hydrous gas reservoirs in Xujiahe Formation, central Sichuan Basin. J. Nat. Gas Sci. Eng. 2019, 30, 400–406. [Google Scholar]
  107. Wang, G.; Gong, Y.; Cao, Z. Effect of paraffin precipitation on core flow in porous media capacity during fracturing. E3S Web Conf. 2022, 352, 01075. [Google Scholar]
  108. Liu, F.; Yang, H.; Yang, J.; Liu, H.; Chen, B.; Chen, Q.; Jia, G. Research on Chemical Mechanism of Gas Drive for Enhanced Oil Recoveryin Ultra Low Permeability and Tight Oilfield. Contemp. Chem. Ind. 2024, 53, 2045–2049. [Google Scholar]
  109. Wu, D. Discussion on types and distribution patterns of formation water in Honghe Oilfield. Oil Gas Geol. Eng. 2014, 28, 49–50. [Google Scholar]
  110. Zheng, J.; Zhang, H. Oil and Gas Field Development and Production; Petroleum Industry Press: Beijing, China, 2004. [Google Scholar]
  111. He, G. Reservoir Physics; Petroleum Industry Press: Beijing, China, 1994. [Google Scholar]
  112. Gao, S.; Ye, L.; Xiong, W.; Zhong, B.; Yang, H.; Hu, Z.; Liu, H.; Xue, H. Seepage Mechanism and Strategy for Development of Large and LowPermeability and Tight Sandstone Gas Reservoirs with Water Content. J. Pet. Nat. Gas 2013, 35, 93–99. [Google Scholar]
  113. Liu, G.; Sun, M. Significance of excess differential pressure in highly efficient gas accumulation in over-pressured basins. Oil Gas Geol. 2007, 28, 203–208. [Google Scholar]
  114. Gu, J.; Jiang, L. Characteristics, Genesis and Exploration Methods of Low-Permeability Reservoirs. In Proceedings of the China Petroleum Geology Annual Conference 2004; Petroleum Exploration and Production Research Institute, Beijing, China, 17 June 2004. [Google Scholar]
  115. Zhao, W.; Wu, K.; Jiang, L. Charging and microscopic gas-water occurrence characteristics of tight sandstone gas based on pore network model. Nat. Gas Ind. 2022, 42, 69–79. [Google Scholar]
  116. Yu, T.; Li, Q.; Tan, Y.; Hu, H. Research progress of CO2 flooding in tight sandstone reservoirs based on molecular dynamics. Nat. Gas Ind. 2024, 44, 146–159. [Google Scholar]
  117. Hassanizadeh, S.M. The origin of surface tension. Interpore J. 2024, 1, ipj260424–3. [Google Scholar]
  118. Naeiji, P.; Woo, T.K.; Ohmura, R.; Alavi, S. Molecular dynamics simulations of interfacial structure, dynamics, and interfacial tension of tetrabutylammonium bromide aqueous solution in the presence of methane and carbon dioxide. J. Chem. Phys. 2022, 157, 154702. [Google Scholar] [CrossRef] [PubMed]
  119. Choudhary, N.; Nair, A.K.N.; Sun, S. Interfacial behavior of the decane+ brine+ surfactant system in the presence of carbon dioxide, methane, and their mixture. Soft Matter 2021, 17, 10545–10554. [Google Scholar] [CrossRef] [PubMed]
  120. Mo, F.; Qi, Z.; Huang, X.; Yan, W.; Zhang, W.; Wang, C.; Fu, W. Methane–water interfacial tension in nanopores: A dissipative particle dynamics study. ACS Omega 2024, 9, 30794–30803. [Google Scholar] [CrossRef]
  121. Li, T.; Ren, D.; Sun, H.; Wang, H.; Tian, T.; Li, Q.; Yan, Z. Imbibition characteristics and influencing factors of the fracturing fluid in a tight sandstone reservoir. ACS Omega 2024, 9, 17204–17216. [Google Scholar] [CrossRef] [PubMed]
  122. Vijapurapu, C. The Effects of Rock and Fluids Characteristics on Reservoir Wettability; Louisiana State University and Agricultural & Mechanical College: Baton Rouge, LA, USA, 2002. [Google Scholar]
  123. Song, X.; Qin, Y.; Ma, H. Wettability and its influencing factors of tight sandstones in coal measures in Ordos Basin, China. ACS Omega, 2025; in press. [Google Scholar]
Figure 1. Location of the research area and comprehensive bar chart. (a) Location of the research area; (b) Comprehensive bar chart of the Yinggehai Basin, The subgraph of (a) indicates the location of the Yinggehai Basin, which is shown in the red box within the subgraph, the red box of (a) indicates the location of the XF area.
Energies 18 01607 g001
Figure 2. Modeling of the Pore throat structure. (a): Sample B1 casting thin sheet; (b): Pore throat structure model.
Energies 18 01607 g002
Figure 3. Pore throat structure Characteristics of the Huangliu Formation Reservoir in Well A, XF Area, Yinggehai Basin. (a), Sample A1, siltstone: Dominated by quartz and feldspar minerals. Mineral particles show point and linear contacts. Quartz exhibits authigenic overgrowths. Pores are primarily primary pores and dissolution pores. Plane-polarized light, cast thin section; (b), Sample B1, siltstone: Well-developed authigenic quartz overgrowths with edge dissolution. Loosely packed particles showing partial linear contacts. Strong dissolution of feldspar grains. Pores mainly consist of dissolution pores and moldic pores. Plane-polarized light, cast thin section. Yellow arrows point to dissolution holes and mold holes within the cast sheet.
Energies 18 01607 g003
Figure 4. Nuclear magnetic resonance curves after filling with different gas source pressures. (a) Sample A1; (b) Sample B1.
Energies 18 01607 g004
Figure 5. Simulation results of the gas–liquid two-phase flow at different times at 20 MPa. (a) 0 s; (b) 0.005 s; (c) 0.015 s; and (d), 0.025 s.
Energies 18 01607 g005
Figure 6. Gas flow rate distribution at different moments at 20 MPa: (a) 0 s; (b) 0.005 s; (c) 0.015 s; and (d) 0.025 s.
Energies 18 01607 g006aEnergies 18 01607 g006b
Figure 7. Variation curve of CH4 saturation during 20 MPa charging.
Energies 18 01607 g007
Figure 8. Variation curves of the gas saturation of CH4 at different stratigraphic temperatures. An increasing temperature significantly increases gas saturation, but the increase slows down with increasing temperatures.
Energies 18 01607 g008
Figure 9. Simulation results of the gas–water two-phase flow with different pressures: (a) 5 MPa; (b) 10 MPa; (c) 16 MPa; and (d) 20 Mpa. High-pressure driving gas breaks through the small throat and residual water is concentrated at the edge of the orifice throat.
Energies 18 01607 g009
Figure 10. Variation curve of the gas saturation of CH4 under different charging pressures. The gas saturation growth rate decreased significantly after the charging pressure was >10 MPa, reflecting the increased difficulty of small throat breakthrough.
Energies 18 01607 g010
Figure 11. Variation curves of CH4 saturation under different interfacial tensions between gas–liquid phases. A reduced interfacial tension raises saturation slightly, but the effect gradually diminishes.
Energies 18 01607 g011
Figure 12. Variation curves of the gas saturation of CH4 at different wetting angles. Increasing the wetting angle has a weak effect on gas saturation, which is slightly higher under neutral wetting conditions (θ = 90°).
Energies 18 01607 g012
Table 1. Parameters of low-permeability reservoir samples in Yinggehai Basin.
Sample NumberPorosity (%)Permeability (mD)Temperature (°C)Pressure (MPa)Charging Pressure (MPa)
A113.200.0597.6834.1016
B111.800.45137.4144.020
Table 2. Numerical simulation parameters.
Water Density
(kg·m−3)
Water Viscosity (Pa·s)CH4 Density (kg·m−3)CH4 Viscosity (Pa·s)Temperature
(°C)
Charging Pressure (MPa)Wetting Angle (°)Interfacial Tension (N·m−1)
1.03 × 1031.0 × 10−32.0 × 1020.01 × 10−3137.4120300.01
Table 3. X-Ray Diffraction Analysis of Core Mineral Properties.
CoresProperties (%)
QuartzK-FeldsparPlagioclaseCalciteDolomiteSideritePyriteClay Minerals
A159418010009
B161161720310
Disclaimer/Publisher’s Note: The statements, opinions and data contained in all publications are solely those of the individual author(s) and contributor(s) and not of MDPI and/or the editor(s). MDPI and/or the editor(s) disclaim responsibility for any injury to people or property resulting from any ideas, methods, instructions or products referred to in the content.

