

Optimizing Corporate Energy Choices: A Framework for the Net-Zero Emissions Transition


Abstract
1. Introduction
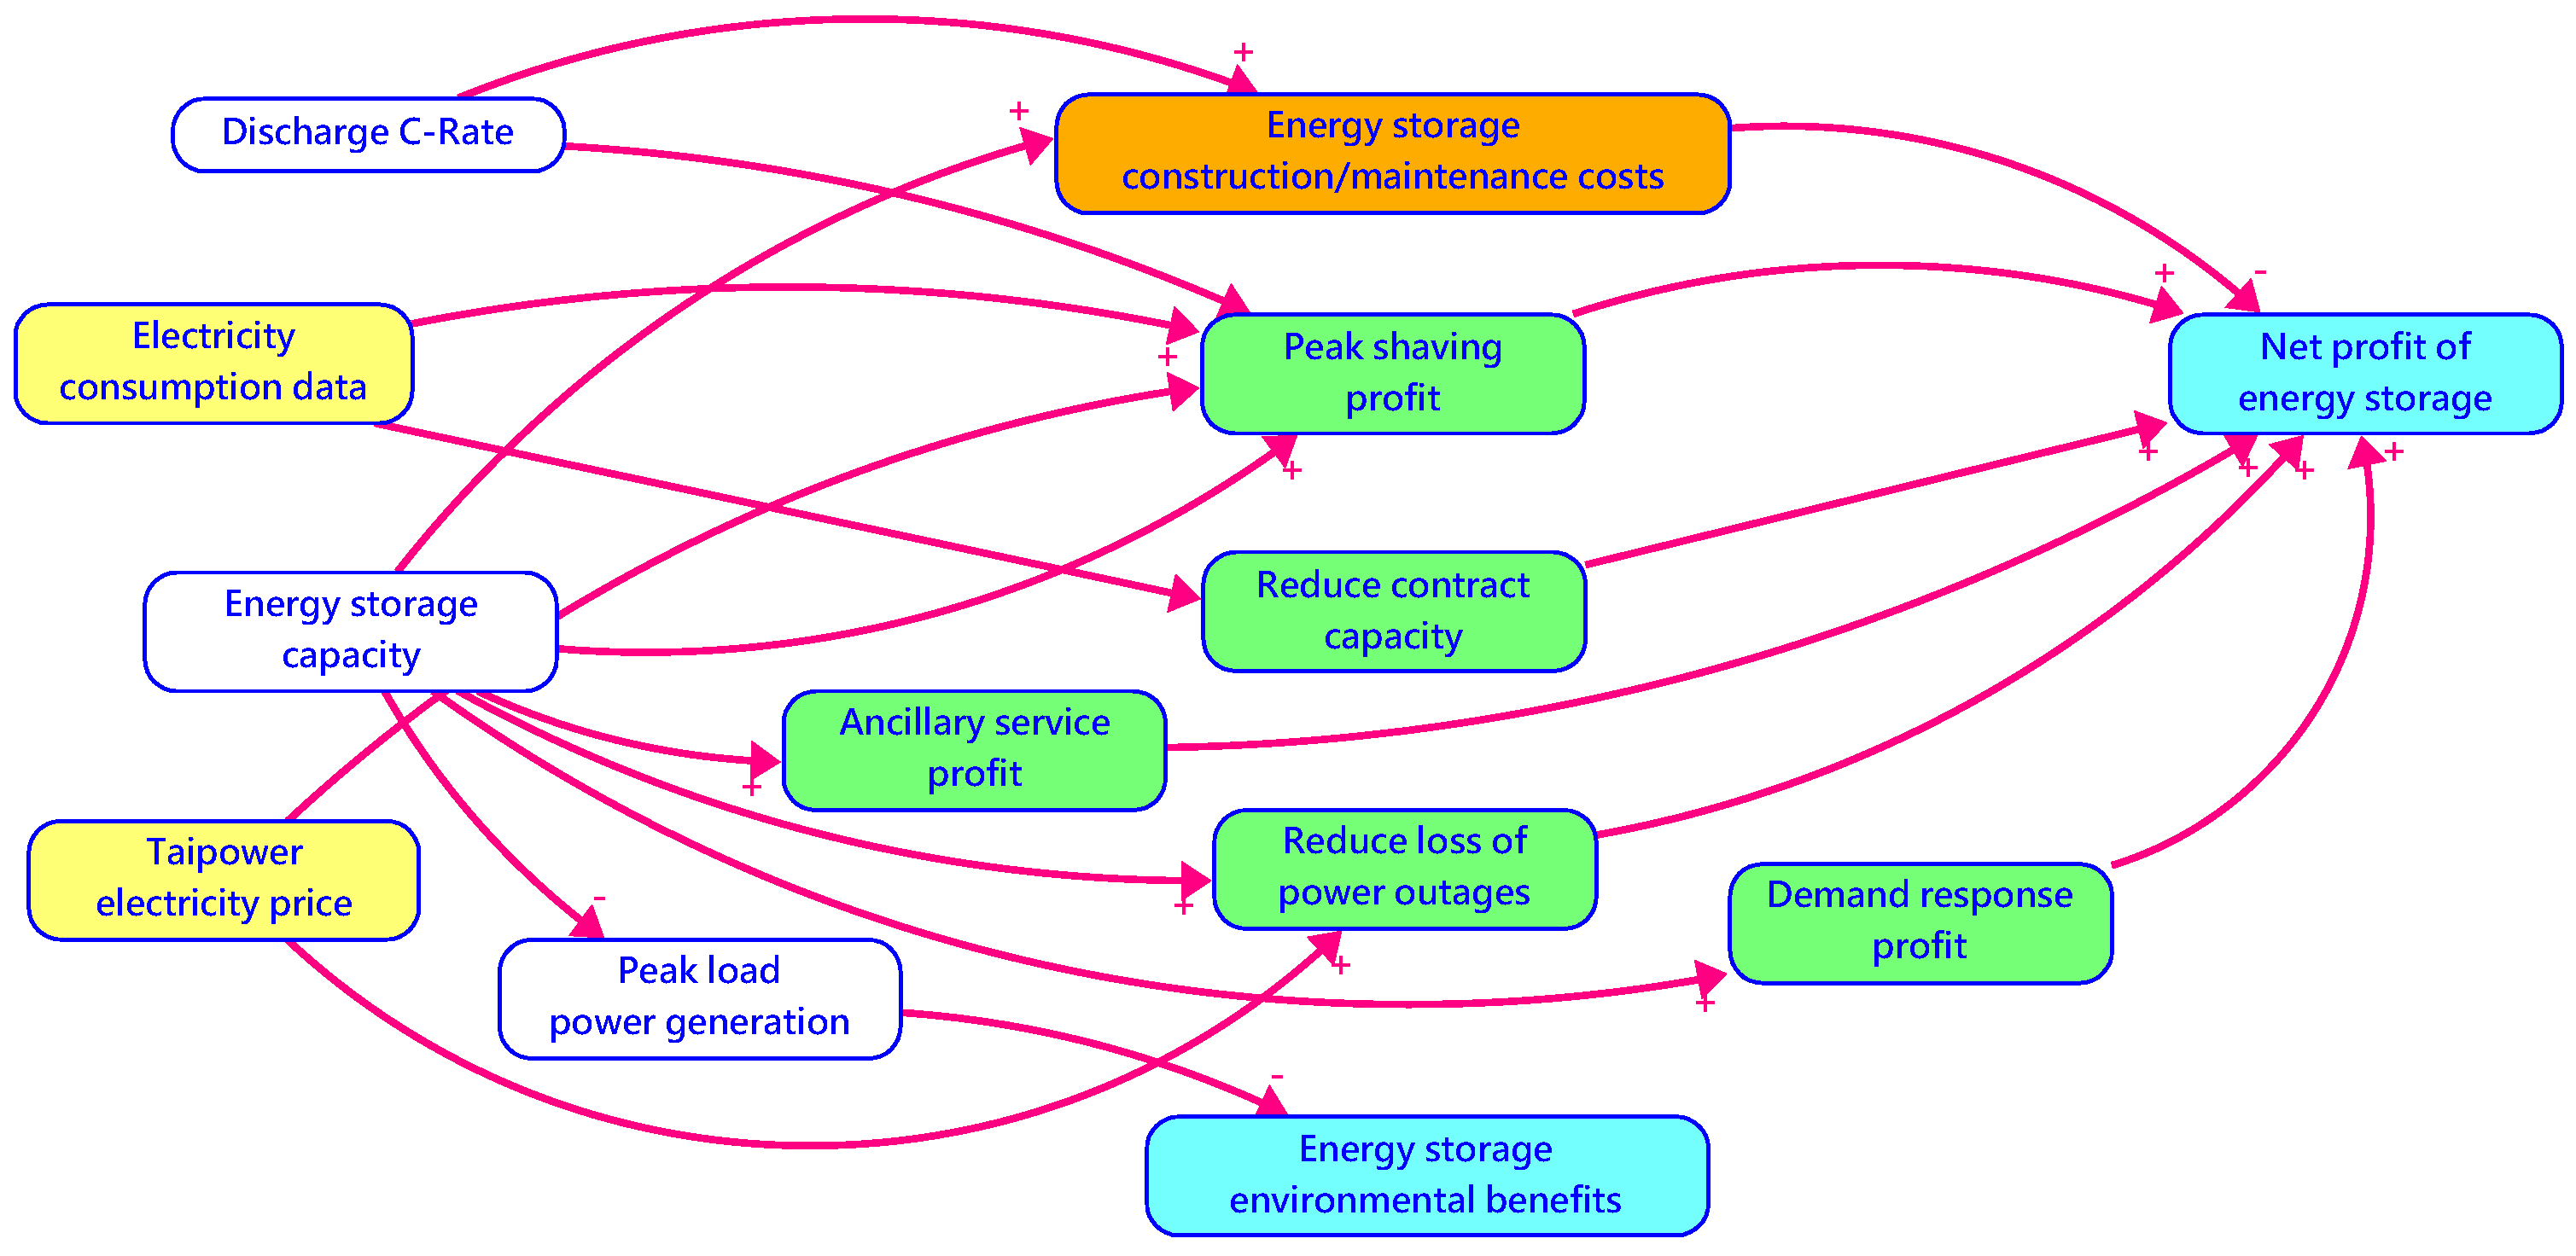
2. Cost-Benefit Analysis of Energy Storage and Solar Power Plants
- Power Conversion System Costs: The PCS is crucial for converting stored direct current (DC) power into alternating current (AC) for grid compatibility. Typically, PCS costs account for 10% to 20% of the total system cost [5].
- Environmental Benefits—from reducing greenhouse gas emissions and particulate matter by alleviating peak load demands on the grid.
- Revenue Benefits—from participation in demand response programs.
- Reduction in Power Outage Losses—by providing backup power during outages.
- Electricity Bill Savings—from peak load shifting and reduced contracted capacity.
3. Summarizing Historical Electricity Load Data
4. Key Parameters in the Financial Evaluation of Energy Storage Systems
- Frequency Regulation—Balancing transient demand and supply differences.
- Spinning Reserve—Ensuring grid reliability during unexpected generator failures.
- Others—Including voltage support, load following, peak shaving, arbitrage, backup power, and co-located generator firming.
4.1. Technical Parameters
- Total device capacity and application allocation
- Discharge efficiency, C-RateThe discharge efficiency of energy storage batteries is measured using the letter “C”, which represents capacity. The C-Rate indicates how quickly the battery can discharge its stored energy:
- -
- 1C: All capacity is released within 1 h.
- -
- 2C: All capacity is released within 0.5 h (30 min).
- Depth of Discharge, DOD
- Life Cycle
- End-of-Life (EOL) Capacity Ratio
= (1 − EOL capacity rate)/Service life
= (1 − 80%)/16
= 1.25%
4.2. Operation Strategy Parameters
- Load adjustment benefits
- E = Charging/discharging efficiency
- Di = Number of days per year for each time period
- Phi = Highest daily electricity price per time period
- Pli = Lowest daily electricity price per time period
- Low-peak benefits
- Ancillary service benefits
- Reducing power outage losses
- Benefits from participation in the demand response
= number of demand-response events per year × energy storage capacity × amount of electricity subsidy per kilowatt-hour
- Environmental benefits
= Edis × Ppl × (Cpl − Cnpl)
- Edis: Annual energy capacity of ESS operation (MWh)
- Ppl: per kilowatt-hour of energy storage discharge can reduce the proportion of power generation at peak load
- Cpl: Environmental cost of power generation mode during peak load hours
- Cnpl: Environmental cost of power generation mode during non-peak load hours
4.3. Non-Technical Parameters
- Inflation Rate:
- Discount Rate:
5. Key Parameters in the Financial Evaluation of a Solar Power Plant
5.1. Construction and Maintenance Costs
5.2. Technical Specifications
- Capacity Factor:
- Annual Attenuation Rate:
- Age of the Solar Power Plant:
5.3. Benefits
- Electricity Charge Substitution Benefits
= 1000 (KW) × 8760 (h) × Capacity factor × Average electricity price per kilowatt-hour of solar alternative electricity
- Environmental benefits
= 1000 (KW) × 8760 (h) × Capacity factor × Σ (emission factor of emission materials and electricity × environmental costs)
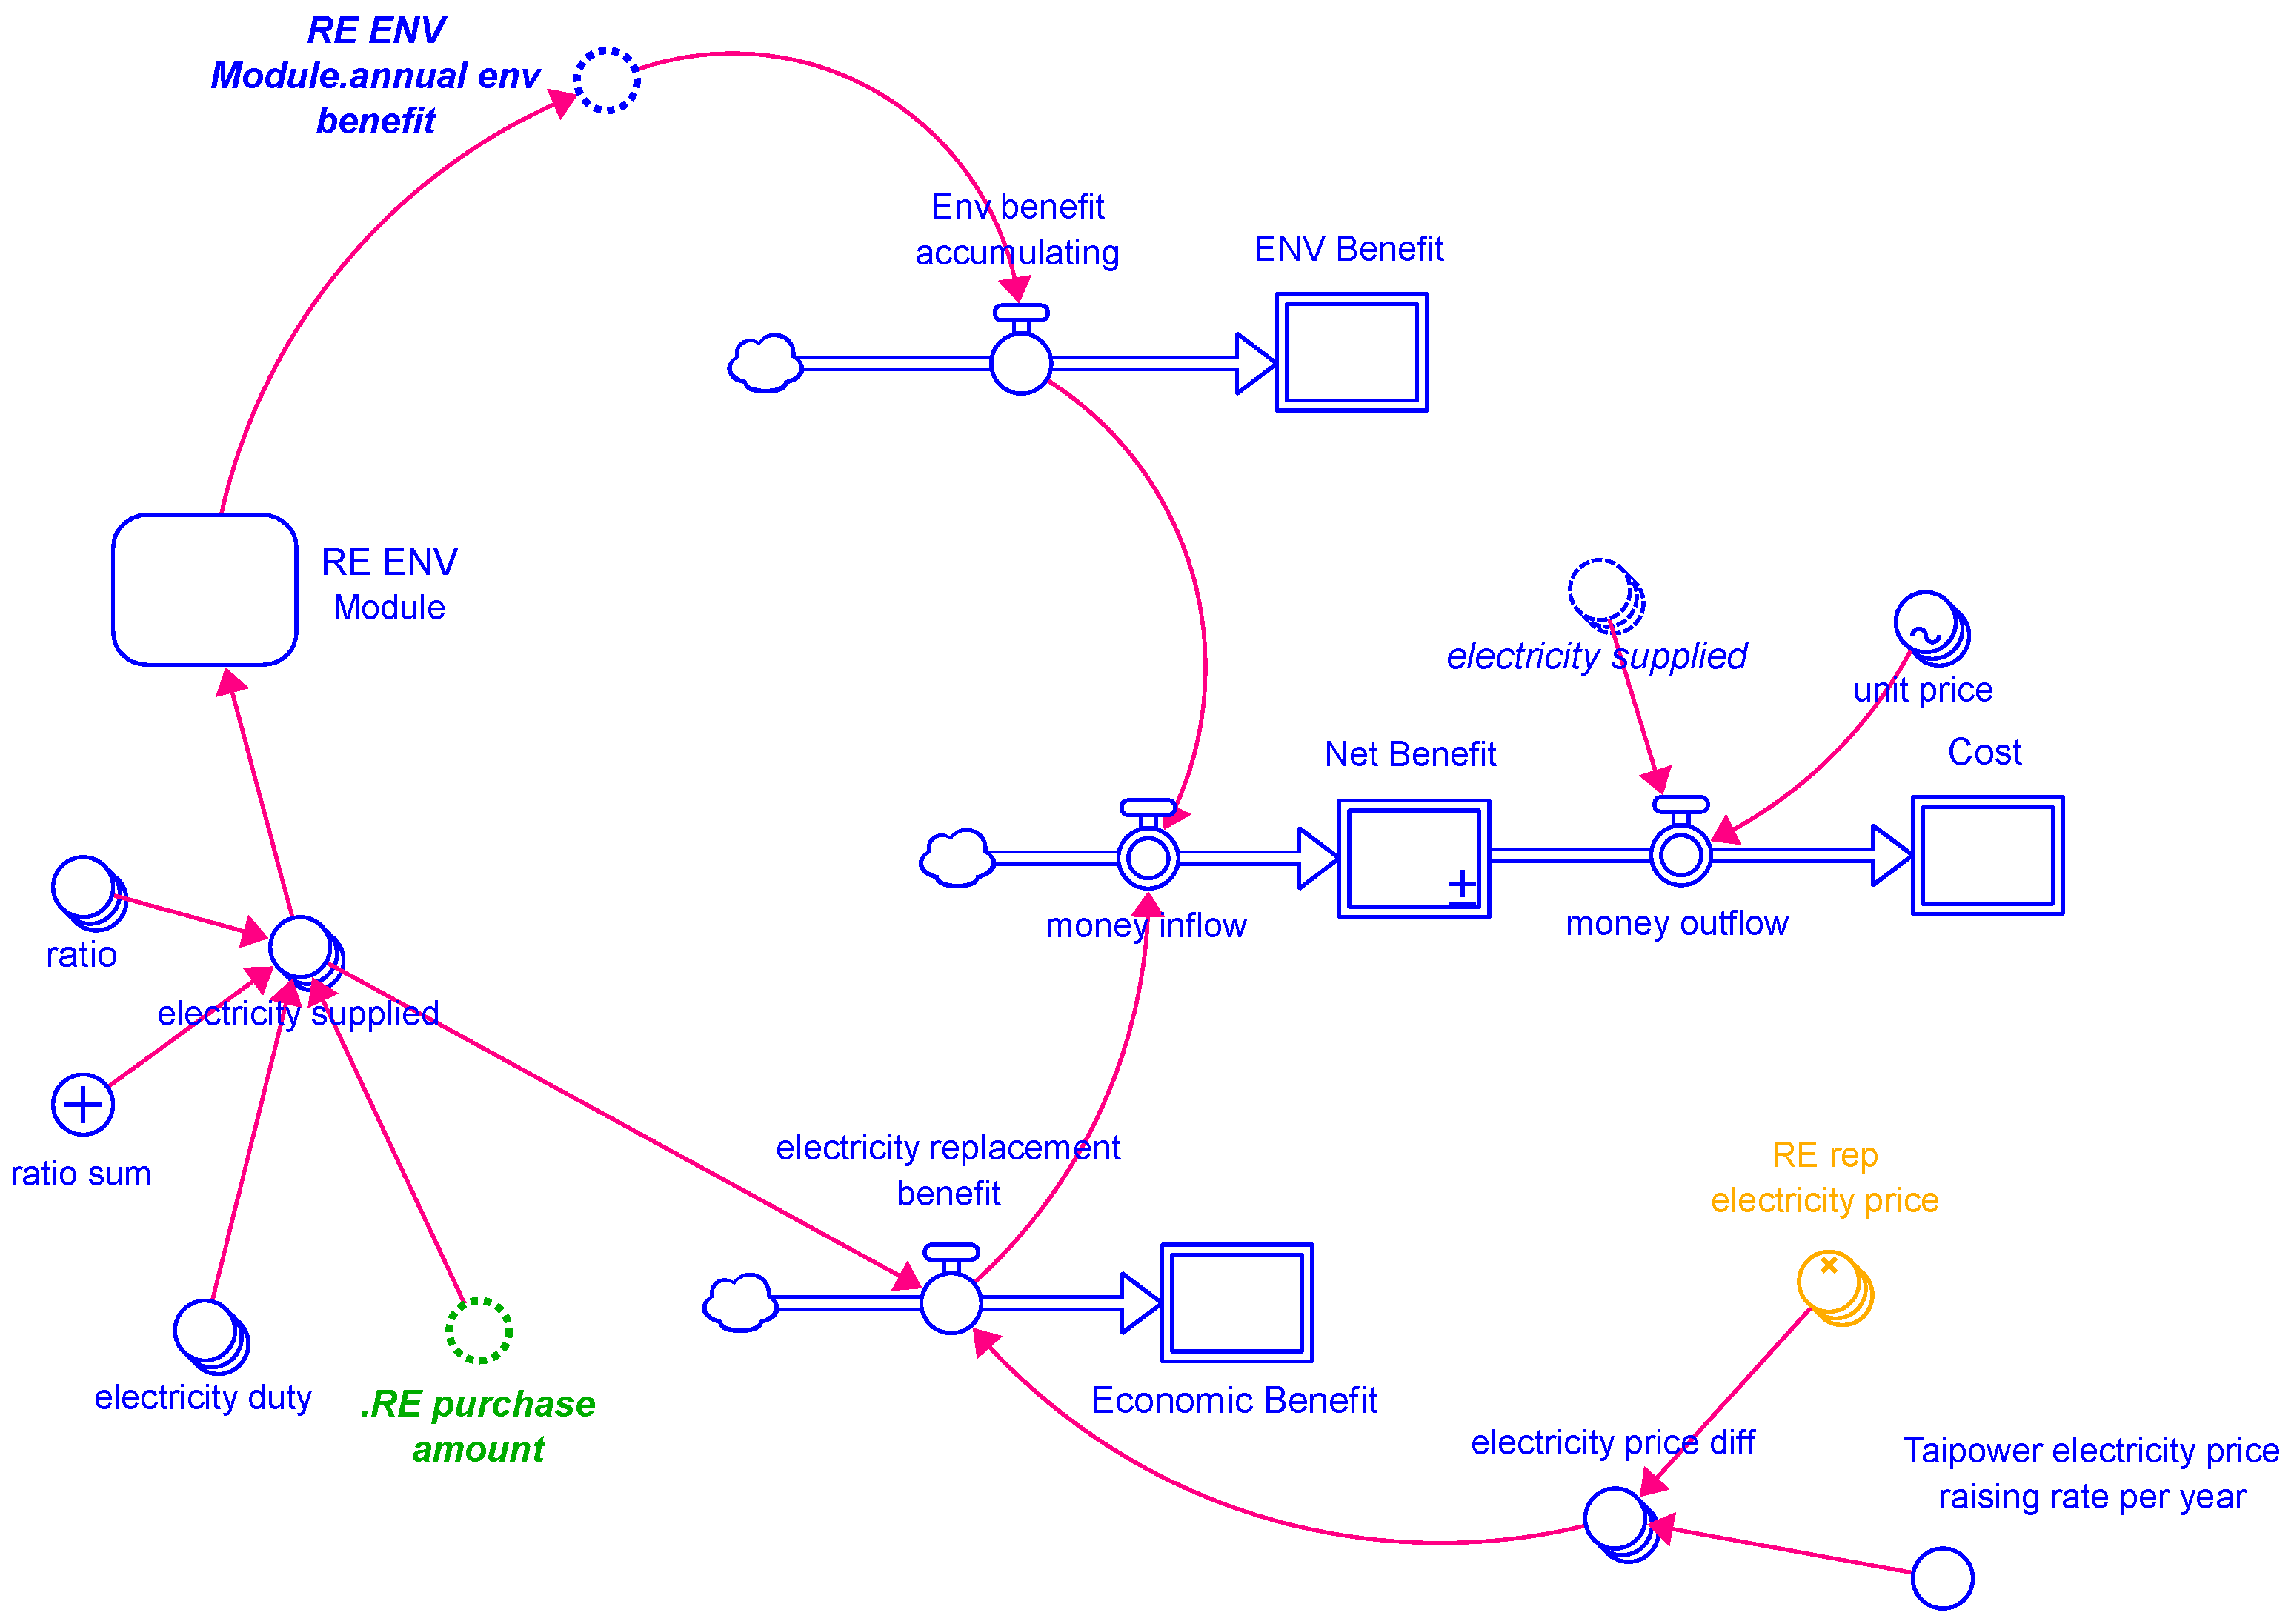
6. Building a System Dynamics Analysis Model
6.1. The System Dynamics Architecture
- Energy Storage Module: evaluates the cost-effectiveness of energy storage solutions and their integration with solar power.
- Solar Power Plant Module: analyzes the financial viability of solar installations and their operational efficiency.
- Renewable Energy Purchase Module: assesses the implications of acquiring renewable energy credits or vouchers.
6.2. Data Analysis
- Calculation of the basic carbon emissions from electricity use
- Benefits of load shifting and peak load reduction
- Estimation of the average electricity price during the renewable energy supply period
6.3. Building an Interactive Interface
7. Analysis of Trial Results
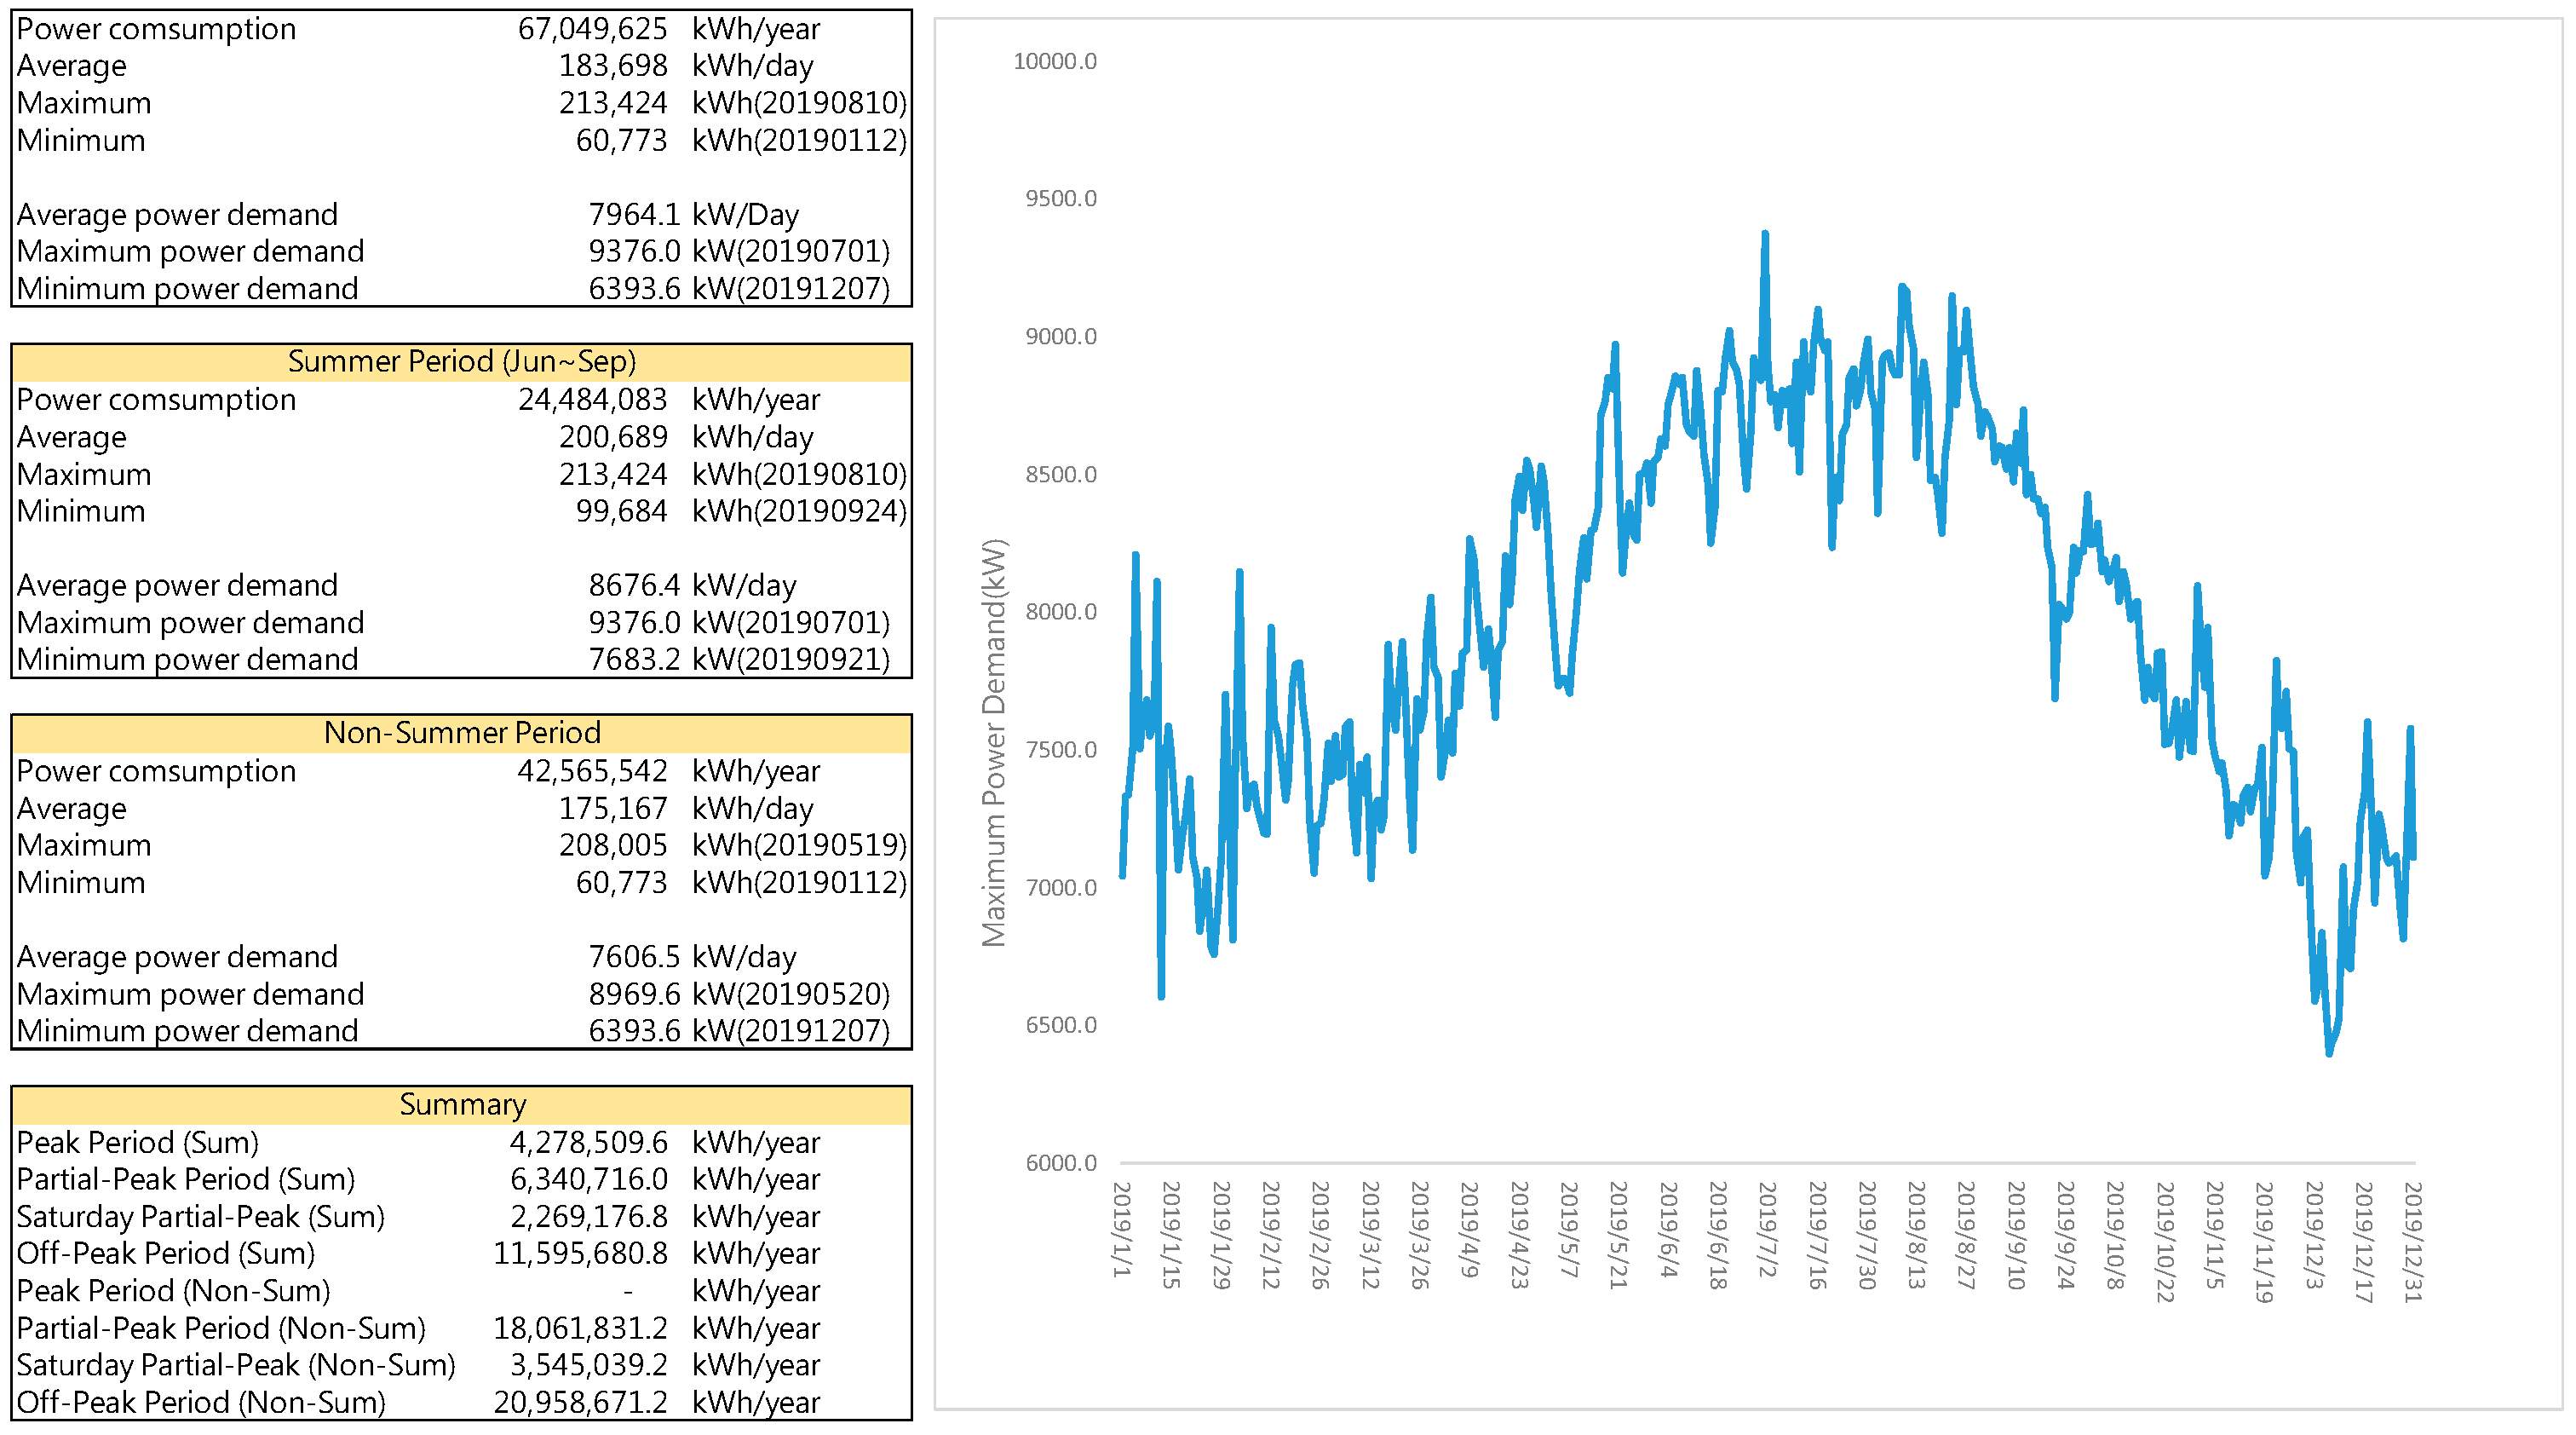
- Annual Load Curve (Figure 10):
- The annual load curve represents the electricity consumption patterns of the manufacturing plant throughout the year, illustrating peak and off-peak usage times. This is essential for understanding when energy storage systems can be most effectively utilized for peak shaving and valley filling.
- Statistical Analysis of Electricity Consumption (Table 5):
8. CBA Simulation for Large Electricity Consumers’ Obligations
9. CBA Simulations for Cross-Combination of Options
Self-Built Energy Storage System Participating in Taipower (AFC) vs. Self-Built Solar Plant
- If the energy storage system does not participate in AFC services, it yields lower net economic/environmental benefits compared to building a solar power plant.
- Participation in AFC significantly enhances the return on investment for the energy storage system while also contributing to grid stability.
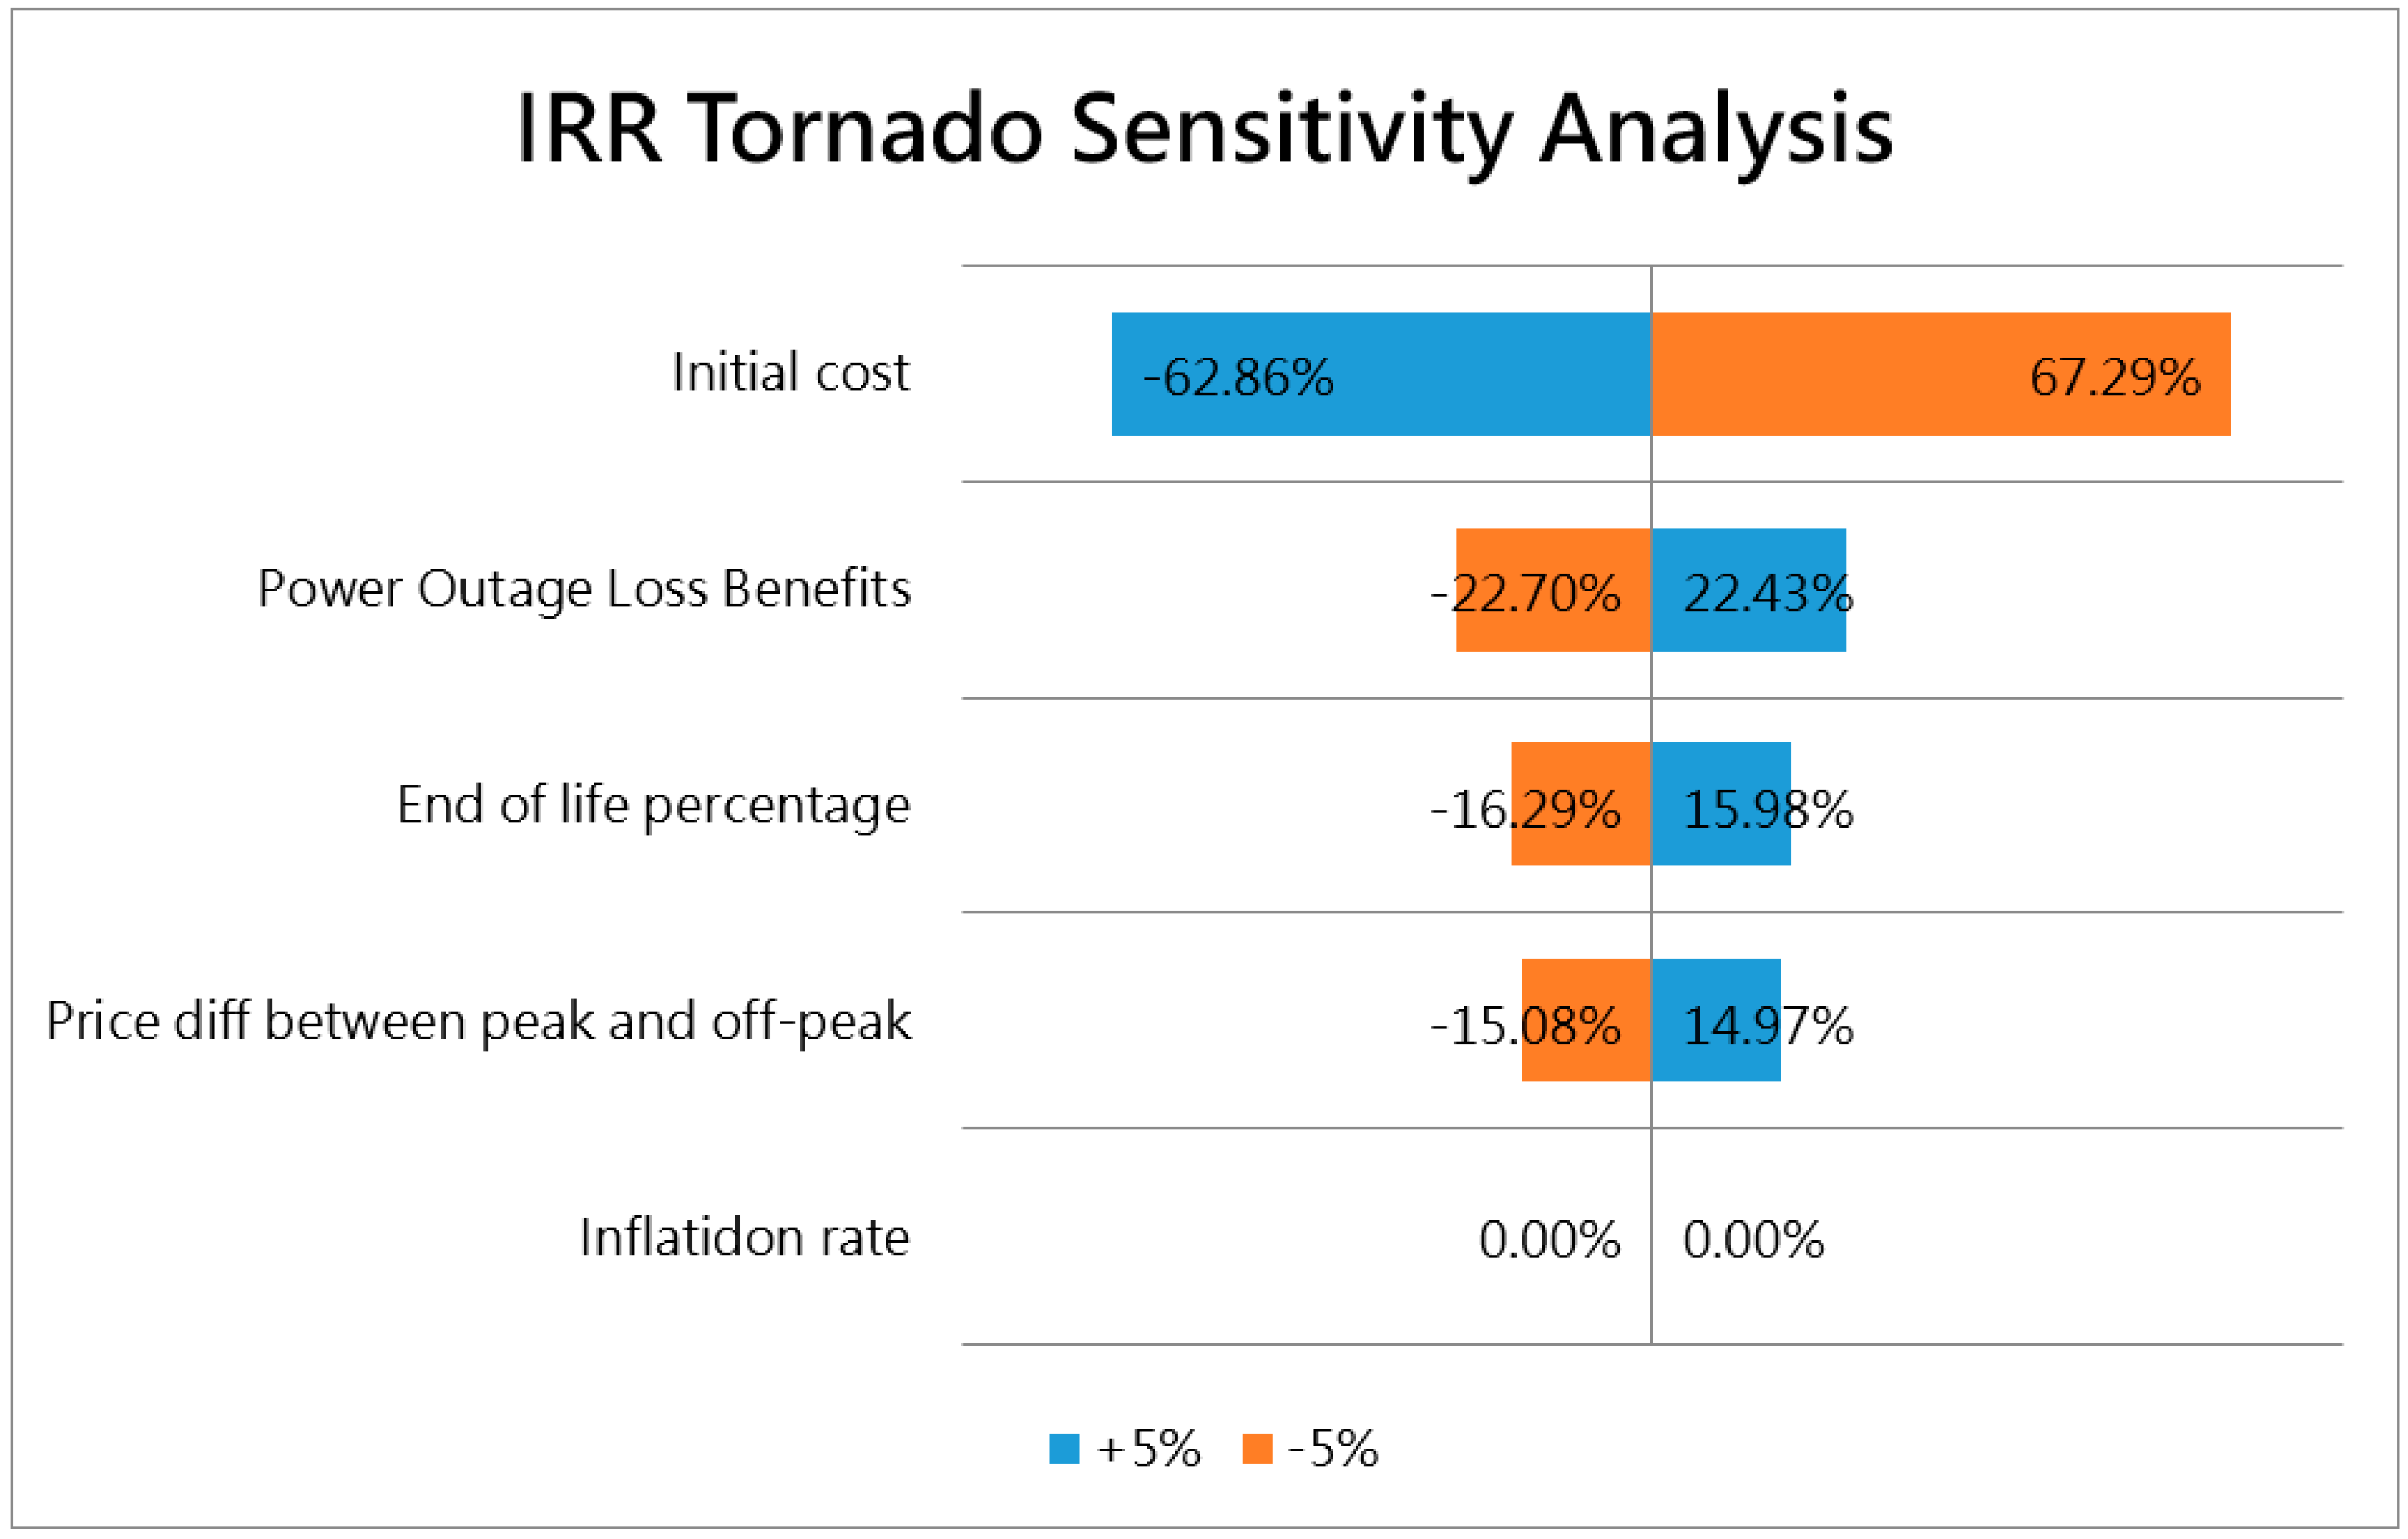
10. Benefit Sensitivity Analysis
- Initial Cost:The initial construction cost of energy storage systems is a critical factor influencing ROI. A 5% increase or decrease in initial costs can lead to significant changes in net benefits and internal rate of return (IRR).
- Benefits of Reducing Power Outage Losses:The financial benefits derived from minimizing power outage losses are also sensitive to changes. A 5% increase or decrease in these benefits can greatly impact the net economic benefit.
- Sharp Off-Peak Electricity Price Difference:The difference between off-peak and peak electricity prices affects the profitability of peak shaving and valley-filling strategies employed by energy storage systems. Greater price differentials enhance the economic benefits of utilizing stored energy during peak demand periods.
10.1. The Potential Benefits of Energy Storage Systems to Reduce Outage Losses
10.2. Comparison of Benefits by Energy Storage Prices
11. Conclusions
- For the enterprises:
- Self-built solar power plants: Self-built solar plant options are more suitable for meeting the green power obligations of large electricity consumers in terms of input cost and rate of return. The challenges are associated with obtaining large-scale land.
- Combined configuration: It is recommended that enterprises utilize self-built solar panels and energy storage systems to meet part of their green power obligations while purchasing green power certificates for the remainder.
- Priority order for purchasing renewable energy: The priority order for purchasing renewable energy is small hydropower, solar photovoltaic, and offshore wind power.
- Policy implications:
- Study limitations and future improvement on the model:
Author Contributions
Funding
Data Availability Statement
Conflicts of Interest
References
- Intergovernmental Panel on Climate Change (IPCC). Sixth Assessment Report; IPCC: Geneva, Switzerland, 2021. [Google Scholar]
- International Energy Agency (IEA). World Energy Outlook 2018; IEA: Paris, France, 2018. [Google Scholar]
- Department of Energy, Ministry of Economic Affairs (MOEA). Measures for the Administration of Renewable Energy Power Generation Equipment for Electricity Users with Electricity Subscribers Exceeding a Certain Contracted Capacity (Jing Neng Zi No. 10904606910); MOEA: Taipei City, Taiwan, 2021. [Google Scholar]
- Bloomberg NEF (BNEF). Energy Storage System Costs Survey 2018; BNEF: London, UK, 2018. [Google Scholar]
- Bloomberg NEF (BNEF). 2018 Long-Term Energy Storage Outlook. 2018. Available online: https://www.bnef.com (accessed on 15 December 2024).
- Bloomberg NEF (BNEF). Energy Project Valuation Model. 2020. Available online: https://www.bnef.com/insights/11068 (accessed on 15 December 2024).
- Bloomberg NEF (BNEF). Energy Storage Project Database; BNEF: London, UK, 2021; Available online: https://www.bnef.com/interactive-datasets/2d5d59acd900000c (accessed on 15 December 2024).
- U.S. Energy Information Administration (EIA). U.S. Battery Storage Market Trends; US EIA: Washington, DC, USA, 2018. [Google Scholar]
- Planning Office of Taiwan Power Corporation. 107 Taipower Statistical Annual Reports; Taiwan Power Corporation: Taipei City, Taiwan, 2019. [Google Scholar]
- Environmental Protection Administration of Taiwan. National Air Pollutant Emission Inventory System TEDS10.0; Environmental Protection Administration of Taiwan: Taipei City, Taiwan, 2019. Available online: https://air.moenv.gov.tw/airepaEn/EnvTopics/AirQuality_4.aspx (accessed on 15 December 2024).
- Directorate-General of Budget, Accounting and Statistics Office, Executive Yuan of Taiwan (DGBAS). Green National Income; DGBAS: Taipei City, Taiwan, 2018. Available online: https://www.stat.gov.tw/np.asp?ctNode=500 (accessed on 15 December 2024).
- Liu, J. Health Benefit Assessment of PM2.5 Reduction in Taiwan—Construction and Application of Homogenized Unit Benefit Index; Taiwan Institute of Economic Research Press: Taipei City, Taiwan, 2019. [Google Scholar]
- Liao, M.; Ma, M.; Lee, M.; Li, H. External cost analysis of the health impact of Taiwan’s thermal power generation. Taiwan Energy J. 2016, 3, 277–292. [Google Scholar]
- U.S. Environmental Protection Agency (EPA). EPA Fact Sheet: The Social Cost of Carbon; US EPA: Washington, DC, USA, 2016. Available online: https://19january2017snapshot.epa.gov/sites/production/files/2016-12/documents/social_cost_of_carbon_fact_sheet.pdf (accessed on 15 December 2024).
- Zeng, J.H. Integrated Economic and Ecological Benefits of Comprehensive Reduction of Greenhouse Gases and Air Pollution in a Recycling-Oriented Society; (NSC 94-2211-E-027-004); National Science Council: Taipei City, Taiwan, 2005.
- Ministry of Economic Affairs of Taiwan. Economic Statistic Data System; MOEA: Taipei City, Taiwan, 2020. Available online: https://dmz26.moea.gov.tw/GA/common/Common.aspx?code=M&no=8 (accessed on 15 December 2024).
- Electric Power Research Institute (EPRI). Estimating the Costs and Benefits of the Smart Grid; EPRI: Palo Alto, CA, USA, 2011; Available online: https://www.epri.com/research/products/000000000001022519 (accessed on 15 December 2024).


| Options | Description of the Options | Obligation Fulfillment Example (on a Contract Capacity of 5000 kW) |
|---|---|---|
| Self-Installation of Renewable Energy | If installed independently or provided at a designated location, the capacity of the obligated device must exceed 10% of the contract capacity, with the produced electricity utilized by the obligor. | Installation of 500 kW of renewable energy power generation equipment |
| Purchase of Green Electricity (Voucher) | The capacity of the obligated device is multiplied by quota parameters (kWh/kW). For instance,
| Purchase one of the following green electricity certificates:
|
| Self-Installation of Energy Storage Devices | The capacity of the obligated device is multiplied by at least two hours of power. The device must not participate in auxiliary services in the transmission and distribution sector and must maintain more than 80% operational power. | Installation of energy storage equipment with a capacity of 1000 kWh (500 kW × 2 h) |
| Cash Payment | 10% Capacity multiplied by 2500 kWh/kW × NT$4.06/kWh (estimated). | Payment of approximately NT$5.08 million annually |
| 2020 | 2021 | 2022 | 2023 | 2024 | 2025 | 2026 | 2027 | 2028 | 2029 | 2030 | |
|---|---|---|---|---|---|---|---|---|---|---|---|
| United States | 13,907 | 14,176 | 13,591 | 12,951 | 12,142 | 11,406 | 10,753 | 10,416 | 10,186 | 9922 | 9785 |
| Taiwan | 12,200 | 12,430 | 11,924 | 11,369 | 10,664 | 10,023 | 9455 | 9163 | 8966 | 8739 | 8623 |
| Japan | 14,095 | 14,278 | 13,537 | 12,777 | 11,879 | 11,050 | 10,322 | 9908 | 9599 | 9265 | 9053 |
| Germany | 13,903 | 14,109 | 13,495 | 12,843 | 12,028 | 11,281 | 10,622 | 10,275 | 10,034 | 9762 | 9614 |
| Rising and falling average | - | 1.65% | −4.43% | −4.95% | −6.45% | −6.32% | −5.95% | −3.38% | −2.45% | −2.83% | −1.63% |
| Generator Type | CO2 (ton/kWh) | NOx (ton/kWh) | SOx (ton/kWh) | PM2.5 (ton/kWh) | PM10 (ton/kWh) |
|---|---|---|---|---|---|
| Coal | 9.18 × 10⁻⁴ | 5.44 × 10⁻⁷ | 3.56 × 10⁻⁷ | N/A | 3.86 × 10⁻⁸ |
| Fuel Oil | 7.70 × 10⁻⁴ | 7.32 × 10⁻⁷ | 1.55 × 10⁻⁶ | N/A | 4.87 × 10⁻⁸ |
| Conventional Gas-Fired | 6.33 × 10⁻⁴ | 2.17 × 10⁻⁷ | 8.64 × 10⁻⁹ | N/A | 1.77 × 10⁻⁹ |
| New Gas | 5.33 × 10⁻⁴ | 2.08 × 10⁻⁷ | 7.77 × 10⁻⁹ | N/A | 1.66 × 10⁻⁹ |
| Average of Units | 5.30 × 10⁻⁴ | 2.90 × 10⁻⁷ | 2.00 × 10⁻⁷ | 1.29 × 10⁻⁸ | 1.61 × 10⁻⁸ |
| Environmental Cost (NT$/ton) | 19,914 | 28,136 | 25,767 | 24,350,000 | 60,000 |
| Month | Solar Average Price (NT$/kWh) | Wind Average Price (NT$/kWh) | Small Hydropower Average Price (NT$/kWh) | Overall Average Price (NT$/kWh) |
|---|---|---|---|---|
| July 2019 | 3.50 | 3.80 | 3.20 | 3.50 |
| August 2019 | 3.60 | 3.85 | 3.25 | 3.57 |
| September 2019 | 3.40 | 3.75 | 3.15 | 3.43 |
| October 2019 | 3.30 | 3.70 | 3.10 | 3.36 |
| November 2019 | 3.20 | 3.60 | 3.05 | 3.28 |
| December 2019 | 3.15 | 3.55 | 2.95 | 3.22 |
| January 2020 | 3.10 | 3.50 | 2.90 | 3.17 |
| February2020 | 3.05 | 3.45 | 2.85 | 3.12 |
| March 2020 | 3.00 | 3.40 | 2.80 | 3.07 |
| April 2020 | 2.95 | 3.35 | 2.75 | 3.02 |
| May 2020 | 2.90 | 3.30 | 2.70 | 2.97 |
| June 2020 | 2.85 | 3.25 | 2.65 | 2.91 |
| Statistic | Summer Months (kWh) | Non-Summer Months (kWh) | Annual Total (kWh) | Date of Occurrence |
|---|---|---|---|---|
| Total Electricity Consumption | 24,484,083 | 42,565,542 | 67,049,625 | |
| Average Daily Electricity Consumption | 200,689 | 175,167 | 183,698 | |
| Maximum Daily Electricity Consumption | 213,424 | 208,005 | 213,424 | 10 August 2019 |
| Minimum Daily Electricity Consumption | 99,684 | 60,773 | 60,773 | 12 January 2019 |
| Average of the Highest Daily Power Demand | 8693.5 | 7606.5 | 7969.8 | |
| Maximum Daily Power Demand | 10,064.0 | 8969.6 | 10,064.0 | 24 September 2019 |
| Minimum Daily Maximum Power Demand | 7683.2 | 6393.6 | 6393.6 | 7 December 2019 |
| Parametric Assumptions | ||
| Energy storage systems |
|
|
| Solar power plants |
|
|
| Purchase of Electricity from Renewable Energy (Certificate) |
|
|
| Other assumptions |
| |
| Options | Self-Built Energy Storage | Self-Built Solar Plants | Purchase Electricity from Solar Plants | Purchase Electricity from Wind | Purchase Electricity from Small Hydro |
|---|---|---|---|---|---|
| Initial Costs | −40,040 | −38,038 | 0 | 0 | 0 |
| Maintenance Costs | −6006 | −22,349 | −87,763 | −305,200 | −229,024 |
| Total Cost | −46,046 | −60,387 | −87,763 | −305,200 | −229,024 |
| Electricity Bill Savings | 23,103 | 73,070 | 74,476 | 182,916 | 188,063 |
| Reduce Power Outage Losses | 27,300 | 0 | 0 | 0 | 0 |
| Demand Response Benefits | 2730 | 0 | 0 | 0 | 0 |
| Total Benefits | 53,133 | 73,070 | 74,476 | 182,916 | 188,063 |
| Net Benefit (A) | 7087 | 12,683 | −13,287 | −122,284 | −40,961 |
| IRR (%) | 2.11% | 2.65% | - | - | - |
| Payback Period (Years) | 12.67 | 15.20 | - | - | - |
| CO2 Reduction (metric tons) | 305 | 11,830 | 12,057 | 36,173 | 37,619 |
| SOx Emission Reduction (metric tons) | 0.074 | 4.456 | 4.452 | 13.626 | 14.171 |
| NOx Emission Reduction (metric tons) | 0.416 | 6.465 | 6.589 | 19.768 | 20.559 |
| PM2.5 Emission Reduction (metric tons) | 0 | 0.289 | 0.294 | 0.883 | 0.919 |
| PM10 Emission Reduction (metric tons) | 0.053 | 0.360 | 0.367 | 1.100 | 1.144 |
| Environmental Benefits (Monetization) (B) | 601 | 29,995 | 30,573 | 91,718 | 95,386 |
| Economic/Environmental Benefits (A + B) | 7688 | 42,678 | 17,286 | −30,566 | 54,425 |
| Parameter | Self-Built Energy Storage | Self-Built Storage (w/AFC) | Self-Built Solar Plants |
|---|---|---|---|
| Initial Costs | −40,040 | −40,040 | −38,038 |
| Maintenance Costs | −6006 | −6006 | −22,349 |
| Total Cost | −46,046 | −46,046 | −60,387 |
| Electricity Bill Savings | 23,103 | 18,483 | 73,070 |
| Reduce Power Outage Losses | 27,300 | 27,300 | 0 |
| Demand Response Benefits | 2730 | 2730 | 0 |
| Ancillary Services Benefits | 0 | 30,133 | 0 |
| Total Benefits | 53,133 | 78,646 | 73,070 |
| Net Benefit (A) | 7087 | 32,600 | 12,683 |
| IRR (%) | 2.11% | 13.25% | 2.65% |
| Payback Period (Years) | 12.67 | 6.28 | 15.20 |
| CO2 Reduction (metric tons) | 305 | 305 | 11,830 |
| SOx Emission Reduction (metric tons) | 0.074 | 0.074 | 4.456 |
| NOx Emission Reduction (metric tons) | 0.416 | 0.416 | 6.465 |
| PM2.5 Emission Reduction (metric tons) | 0 | 0 | 0.289 |
| PM10 Emission Reduction (metric tons) | 0.053 | 0.053 | 0.360 |
| Environmental Benefits (Monetization) (B) | 601 | 601 | 29,995 |
| Net Economic/Environmental Benefits (A + B) | 7688 | 33,201 | 42,678 |
| IRRe (%) | 2.28% | 13.44% | 7.95% |
| Parameter | Domestic Energy Storage Prices | International Energy Storage Prices |
|---|---|---|
| Initial Costs | −40,040 | −22,204 |
| Maintenance Costs | −6006 | −3331 |
| Total Cost | −46,046 | −25,535 |
| Electricity Bill Savings | 23,103 | 23,103 |
| Reduce Power Outage Losses | 27,300 | 27,300 |
| Demand Response Benefits | 2730 | 2730 |
| Total Benefits | 53,133 | 53,133 |
| Net Benefit | 7087 | 27,598 |
| IRR (%) | 2.11% | 12.34% |
| Payback Period (Years) | 14.52 | 7.32 |
Disclaimer/Publisher’s Note: The statements, opinions and data contained in all publications are solely those of the individual author(s) and contributor(s) and not of MDPI and/or the editor(s). MDPI and/or the editor(s) disclaim responsibility for any injury to people or property resulting from any ideas, methods, instructions or products referred to in the content. |
© 2025 by the authors. Licensee MDPI, Basel, Switzerland. This article is an open access article distributed under the terms and conditions of the Creative Commons Attribution (CC BY) license (https://creativecommons.org/licenses/by/4.0/).
Share and Cite
Lin, C.-H.; Wen, L.-C.; Lo, J.-C. Optimizing Corporate Energy Choices: A Framework for the Net-Zero Emissions Transition. Energies 2025, 18, 1582. https://doi.org/10.3390/en18071582
Lin C-H, Wen L-C, Lo J-C. Optimizing Corporate Energy Choices: A Framework for the Net-Zero Emissions Transition. Energies. 2025; 18(7):1582. https://doi.org/10.3390/en18071582
Chicago/Turabian StyleLin, Chun-Hsu, Lih-Chyi Wen, and Jia-Cheh Lo. 2025. "Optimizing Corporate Energy Choices: A Framework for the Net-Zero Emissions Transition" Energies 18, no. 7: 1582. https://doi.org/10.3390/en18071582
APA StyleLin, C.-H., Wen, L.-C., & Lo, J.-C. (2025). Optimizing Corporate Energy Choices: A Framework for the Net-Zero Emissions Transition. Energies, 18(7), 1582. https://doi.org/10.3390/en18071582