1. Introduction
The application of modern, advanced sensing, information, and communication technologies is an essential factor that contributes to continuous advancement as far as the construction of smart grids is concerned. However, the combination of advanced cyber-information infrastructure and physical power-grid devices exposes the smart grids to similar threats as those faced by traditional computer systems and networks, i.e., to cyber-attacks.
Among various existing and smart-grid-oriented cyber attacks, false data injection attacks (FDIAs) belong to more severe threats to the power systems [
1,
2,
3,
4]. FDIAs—characterized by high levels of concealment and interference—consist in injecting false data through measurement units, control devices, and communication networks in order to tamper with measurement data and to cause deviations from estimates of the smart grid state.
Thus, the detection of FDIAs is a critical task as far as the operation of current smart grids is concerned. FDIA detection methods can be classified into two groups, i.e., model-based detection approaches and data-based or data-driven detection methods (see [
1] for a brief review). Model-based approaches—focused on collecting static system data for smart-grid modeling—are becoming less and less effective as the complexity of smart grids increases. In turn, the availability of big amounts of simulated or real data describing different aspects of FDIAs (see, e.g., the recently published data set [
2] that will be used in our experiments reported later in this paper) makes the data-based methods a reasonable choice for the FDIA detection. Moreover, the above-mentioned data create an excellent platform for the application of different machine learning (ML) methods. The notion of ML was introduced in 1959 by A. L. Samuel [
5]. He defined it in [
5] as a “field of study that gives computers the ability to learn without being explicitly programmed”. Currently, the ML notion—partially overlapping the data mining (DM) term introduced in the 1990s—also denotes the learning from data of valid and understandable patterns, trends, decision mechanisms, etc., to be used in future predictions (detections of future FDIAs).
Different ML/DM methods have been used to detect FDIAs in smart grids—see the following section of this paper for a brief review. Their essential drawback, however, is usually their black-box type and non- or hardly interpretable/transparent nature that focuses mostly on the accuracy of the FDIA detection. Thus, they neither provide any insight into FDIAs’ mechanisms nor formulate any deeper (or any) explanations and justifications for the generated FDIAs’ detection decisions. Moreover, some of the existing ML/DM methods applied to FDIAs’ detection are focused on detecting the presence of attacks while paying little attention to the localization of attacks [
1]. This paper is our attempt to address the aforementioned problems, i.e., FDIA detection and localization, in an effective way by employing our solution coming from the knowledge-based ML/DM area and characterized by high interpretability and transparency as well as high accuracy of generated detection and localization decisions. Based on the review of related works carried out in the next section of this paper and to the best of our knowledge, the proposed solution is one of the first interpretable, accurate, and fast approaches to FDIA detection and localization (or, possibly, the first such approach).
This paper presents the application of our knowledge discovery ML/DM method, i.e., fuzzy rule-based classifiers (FR-BCs) characterized by genetically optimized accuracy–interpretability trade-off (see, e.g., our paper [
6] published earlier in this journal) to decision support related to FDIA detection and localization. The main contribution and goal of this paper is to design a collection of fast, accurate, and interpretable FR-BCs for the purpose of FDIA detection and localization from the recently published data describing various aspects of the FDIAs in the smart grid. These data (discussed in [
2]) and their detailed generation process are available at
https://github.com/wsyCUHK/WSYCUHK_FDIA (accessed on 20 December 2024). Our fuzzy-rule-based knowledge discovery ML/DM method employs separate performance measures of the FR-BCs’ accuracy and interpretability. These measures are also used as optimization objectives in the process of designing FR-BCs from FDIA data. Since both optimization objectives have a contradictory/complementary nature, we use a multiobjective evolutionary optimization algorithm (M-OEOA) in the process of the FR-BCs’ structure and parameter optimization. That process is equivalent to the FR-BCs’ accuracy–interpretability trade-off optimization we want to achieve. As an M-OEOA, we use our generalization of the well-known strength Pareto evolutionary algorithm 2 (SPEA2) [
7]. The proposed generalization—referred to as SPEA3 and characterized by better performance than SPEA2—is introduced in [
8] and also presented in our earlier-mentioned paper [
6] published in this journal.
The remaining part of this paper is organized as follows: First, a review of related work on the application of different ML/DM approaches to FDIA detection (and possibly localization) is presented. Next, the main components of the proposed FR-BCs and the process of their design by means of SPEA3-M-OEOA-based learning and optimization are outlined. Then, the main goal of this paper, i.e., designing a collection of fast, accurate, and interpretable FR-BCs from the data of [
2] for effective FDIA detection and localization is presented. Finally, a comparative analysis with 12 available alternative approaches is performed and discussed.
2. Related Work
In this work, we show the application of our ML approach (FR-BCs) to FDIA detection and localization. For this reason, in the present section, we briefly review several alternative ML methods applied to the considered problem. First, it is worth stressing that the problem of both detection and localization of FDIAs in smart grids was very rarely addressed before 2020 (only some conference papers—mainly announcing this topic—are available; see, e.g., [
9,
10]). The existing literature reviews, covering the years up to 2020 (see, e.g., [
11,
12]) consider only the problem of FDIA detection. It is worth noting that the authors of [
11] state that both detection and localization of FDIAs are “either open research issues or are not sufficiently addressed in the existing literature” (a quote from [
11]; see Section 11 of [
11] on future research directions). Similar comments have also been formulated in some recently published works—see, e.g., [
13,
14,
15,
16].
A slight increase in the number of papers addressing not only detection but also localization of FDIAs in smart grids has occurred since 2020. The most recent literature review [
17], published in 2024 (its authors claim to be the only ones to compile a list of papers on FDIA detection and localization), lists only 23 papers (out of all 86 reviewed ones) that concern data-driven modeling applicable to both detection and localization of FDIAs (all papers were published in or before 2023). Such a small number of papers clearly shows that the localization of FDIAs in smart grids still remains a challenge in the scientific community. In order to fill the time gap between the period covered in [
17] and the present day, we focus our review on FDIA detection and localization approaches which are not discussed in [
17] and mainly have been presented after 2023.
By far the most commonly used ML-based tools for classifying FDIAs are deep learning approaches, especially the hybrid ones involving deep neural networks. For instance, in [
18] a hybrid approach combining convolutional neural networks (CNNs), long short-term memory (LSTM) neural network, and a genetic algorithm was investigated using IEEE 14-bus and 118-bus test systems achieving accuracies of 99.88% and 99.63%, respectively. The IEEE X-bus systems are the standardized experimental test platforms representing power grids with different connection complexities (X is the number of buses in a power grid that indicates its overall complexity). The X-values range from 9 to 500; the most popular is the platform characterized by X = 14. For this reason, the IEEE 14-bus system is also used in our experiments reported later in this paper. Another hybrid approach which consists of a coordinate attention module, two transformer encoder modules, a three-layer CNN, and multiple residual neural networks (ResNet) models is proposed in [
19]. The tests using IEEE 14-bus and IEEE 39-bus platforms have shown accuracies of 99.8% and 96.2%, respectively. In [
20], a detection method applying random matrix theory and CNNs to detect and distinguish FDIAs from replay attacks as well as to localize falsified measurements in IEEE 14-bus system (with an accuracy up to 99.26%) and IEEE 57-bus systems (with an accuracy up to 95.98%) is reported. The paper in [
13] introduces a multimodal deep learning detection model based on variational graph autoencoders (VGAEs), temporal convolutional networks (TCNs), and gated recurrent units (GRUs). This solution compared with alternative approaches such as CNNs, LSTM networks, CNN-LSTM networks, and TCNs-GRUs achieves the best accuracy of up to 98.2% for IEEE 14-bus system and up to 97.7% for IEEE 118-bus system. In [
14] several deep learning models are applied, i.e., CNNs, CNN-LSTM networks, CNN-bidirectional LSTM networks to FDIA localization in the IEEE 118-bus test platform. The considered approaches achieve up to 99.41% precision, up to 99.51% recall, and up to 99.45% F1 measure (accuracy is not reported). Other approaches use adversarial neural networks, e.g., semi-supervised multilabel adversarial networks in [
1] (an accuracy up to 92.26% for IEEE 14-bus system and up to 87.78% for IEEE 118-bus system is reported) or adversarial variational autoencoders in [
21] (accuracy is not reported).
A separate group of FDIA localization methods worth mentioning are those based on graph neural networks and/or on graph theory. In [
22], a node graph and its corresponding line graph representation of smart grid features are proposed to capture the inherent dynamic characteristics of power flows on branches and power injections on buses in smart grids. For processing data from branches and buses in both graph nodes and edges, a modified graph neural network referred to as a line message passing neural network (LMPNN) is employed. The considered approach achieves an accuracy of 99.91% for the IEEE 39-bus system and 99.87% for the IEEE 118-bus system. In [
11], a multimodal learning model based on graph autoencoder in cooperation with three different deep neural networks (i.e., ResNet, CNN, and DenseNet) for FDIA localization is proposed. The experiments using IEEE 9-, 57-, and 118-bus systems have shown accuracies of 94.69%, 83.8%, and 91.53%, respectively. In [
16], a spatio-temporal graph neural network allowing for adaptation to changing power system topologies is presented. It achieves accuracies of 98.85%, 98.04%, and 98.21% for IEEE 14-, 118-, and 300-bus systems, respectively.
There are also alternative, neither deep-learning-based nor graph-theory-based approaches to FDIA detection and localization. For instance, in [
15], a cluster partition–fuzzy broad learning system (CP-FBLS) is applied to solve the problem of the accuracy degradation caused by high-dimension data in large-scale smart grids. The proposed CP-FBLS recognizes the location of FDIAs with an accuracy of up to 98.64% for the IEEE 34-bus system and up to 99.27% for the IEEE 123-bus system. Another approach based on particle swarm optimization (PSO) coupled with chimp optimized extreme learning machine (ELM) is presented in [
23]. The ELM is employed to extract features from the power data and to ascertain anomalies at individual buses of the power grid. The PSO-ELM approach achieves accuracies of up to 97.75% for IEEE 14-bus system and up to 94.35% for IEEE 118-bus system outperforming in this regard classifiers based on support vector machines (SVMs) (accuracies of 92.78% and 91.78%, respectively) and even based on CNNs (accuracies of 96.31% and 92.65%, respectively).
In conclusion, all of the above-reviewed works present exclusively accuracy-oriented, black-box-type, non-interpretable, or non-transparent techniques, not providing any insight into the mechanisms governing the FDIAs. As we already mentioned in the introduction of this paper, our work is an attempt to address that problem (and thus to fill that knowledge gap) by introducing fast, accurate, and interpretable techniques for FDIA detection and localization.
3. An Outline of Our Methodology for Designing M-OEOA-Based FR-BCs from Data
In this section, we briefly characterize the main building blocks of the proposed approach to designing M-OEOA-based FR-BCs from data, in particular, from the data describing FDIAs. M-OEOAs perform the learning and optimization of FR-BCs’ structure and parameters from data; it also results in the FR-BCs’ accuracy–interpretability trade-off optimization. The proposed approach is an extension of the method we presented in our paper [
6] published earlier in this journal. The extension concerns the format of the fuzzy rule base used (see below in this section).
We consider an FR-BC with
n input attributes
. Its output is a fuzzy set over the set
of
c class labels. The proposed approach can process both numerical and categorical input attributes. However, since the FDIA detection and localization problem operates only on numerical input attributes, only that kind of input attribute is considered in this paper. The proposed FR-BC is designed from the learning data set
L in the supervised learning process.
L contains
K input–output samples:
where
(× denotes the Cartesian product of ordinary sets) represents the collection of numerical input attributes, and
represents the corresponding class label (
) for the
k-th data sample,
.
Each numerical input attribute
,
is represented by
fuzzy sets
,
, where
is a family of all fuzzy sets defined in the universe
,
.
represents an
S-type fuzzy set (it corresponds to linguistic term “
Small”),
represents an
L-type set (it corresponds to linguistic term “
Large”), and
represent
M-type sets (they correspond to linguistic terms “
Medium 1”, “
Medium 2”, …, “
Medium ”). For simplicity,
s also denote the corresponding linguistic terms. Fuzzy sets with trapezoidal membership functions are used in the reported experiments (see [
6] for details). In turn, each class label
,
is represented by a fuzzy singleton
characterized by the following membership function:
The FR-BC’s knowledge base contains
R genetically optimized fuzzy classification linguistic rules discovered in the learning data
L (
1).
R changes during the M-OEOA-based genetic learning and optimization process. The format of the
r-th rule,
, is the following:
The formula
in (
2) represents conditional inclusion of the
-part into a considered fuzzy classification rule if and only if the
-part is fulfilled.
returns the absolute value. In turn,
,
and
are switch-parameters controlling the presence/absence of the
i-th input attribute in the
r-th fuzzy rule. These parameters are set and modified by an M-OEOA.
, where
is the number of fuzzy sets (linguistic terms) representing the
i-th input attribute.
are defined as follows:
- (i)
for the i-th input attribute is excluded from (not active in) the r-th rule,
- (ii)
for the component () is included in the r-th rule,
- (iii)
for the component () is included in the r-th rule (not and ; and are membership functions of fuzzy sets and , respectively).
Therefore, the present format (
2) of a fuzzy rule allows us to include both
and
components representing a given input attribute in the considered rule. It results in more compact and thus more transparent and interpretable fuzzy rules in comparison with fuzzy rules based on the format operating only on
components, which we introduced in our earlier work [
6].
The FR-BC’s M-OEOA-based genetic learning and optimization process employs two independent objectives: the accuracy and the interpretability of FR-BCs. The FR-BC’s accuracy measure (objective function to be maximized) is defined in the following way:
where
in (
4) is the membership function of fuzzy set
, which is a response of system (
2) for the learning data sample
. In turn,
in (
4) (
) is the membership function of fuzzy singleton
, which is the desired fuzzy-singleton response for that sample (
).
The FR-BC’s interpretability includes two aspects:
- (i)
A system’s complexity-related interpretability.
- (ii)
A system’s semantics-related interpretability.
With respect to the first aspect, we introduce the following FR-BC’s interpretability measure (objective function to be maximized):
where
and
The FR-BC’s complexity measure
(
6) (
; 0 and 1 represent minimal and maximal complexities, respectively) is an average of three sub-measures:
- (i)
(
7)—it is an average complexity of particular rules (
in (
7) denotes the number of active input attributes in the
r-th rule),
- (ii)
(
7)—it is the complexity of the whole system in terms of its active inputs (
in (
7) denotes the number of active inputs in the whole system), and
- (iii)
(
7)—it is the whole-system complexity in terms of its active fuzzy sets (
in (
7) denotes the numbers of active fuzzy sets (linguistic terms) in the whole system).
With respect to the semantics-related interpretability of FR-BCs, we impose optimization constraints by applying the so-called strong fuzzy partitioning (SFP) [
24] for the domains of all numerical attributes. The constraints imposed by SFP enforce optimization of the membership function parameters in such a way that—for any domain value—the sum of the membership function values is equal to 1—see our paper [
6] for details.
(
3) and (
) (
5) are optimized by an appropriate M-OEOA. As we mentioned in the introduction to this paper, our generalization of the SPEA2 method (called SPEA3) is applied in experiments reported in the following section of this work. The essence of SPEA2’s generalization is to replace the ineffective environmental selection procedure, existing in SPEA2, with our original alternative procedure. It returns non-dominated solutions more evenly distributed in the objective space and characterized by a higher spread—see works [
6,
8] we authored for a detailed presentation and discussion of SPEA3.
4. Experiments, Comparative Analysis, and Discussion
This section addresses the main goal of this work, i.e., the application of our methodology to designing a collection of FR-BCs for accurate, interpretable, and fast FDIA detection and localization. A comparative analysis with 12 alternative approaches presented in [
2] is also carried out. First, we characterize the FDIA data sets used in our experiments.
As we already mentioned in the introduction of this paper, the recently published data sets used in our experiments are available at
https://github.com/wsyCUHK/WSYCUHK_FDIA; they are also discussed in [
2]. They include the data for the IEEE 14-bus system and for the IEEE 118-bus system. First, we report the results of our experiments carried out using the IEEE 14-bus system data. These data are collected in five data sets referred to as
data14_1
.mat,
data14_2
.mat,
data14_3
.mat,
data14_4
.mat, and
data14_5
.mat. Each of these data sets contains 100.000 learning data records and 10.000 test data records. In turn, each data record contains 19 numerical input attributes and 19 corresponding output attributes (class labels) assigning either “Normal” or “Attack” class labels to a given record. 19 input attributes represent measurements coming from 19 meters (their placement in the structure of the IEEE 14-bus system is shown in
Figure 1). Our goal is to design a collection of 19 independent FR-BCs indicating, in a transparent and accurate way whether, in a given measurement point, we deal with FDIA (class label “Attack”) or with normal operation of the smart grid (class label “Normal”). In such a way, we combine the FDIA’s detection and localization tasks. Now, we concentrate on the
data14_1
.mat data set—see
Table 1 for some details of particular records of that data set. Since output attribute Y9, corresponding to the X9 measurement point, is characterized only by “Normal”-class data, we are unable to design an FR-BC for that point. Thus, we design 18 independent FR-BCs for the remaining measurement points. For each of those FR-BCs—corresponding to particular output attributes
,
—the results of SPEA3-M-OEOA-based genetic learning and optimization experiments are presented in detail in
Figure 2. The original learning and test data sets containing 100.000 and 10.000 data records, respectively, are used in those experiments. Parts (a) of
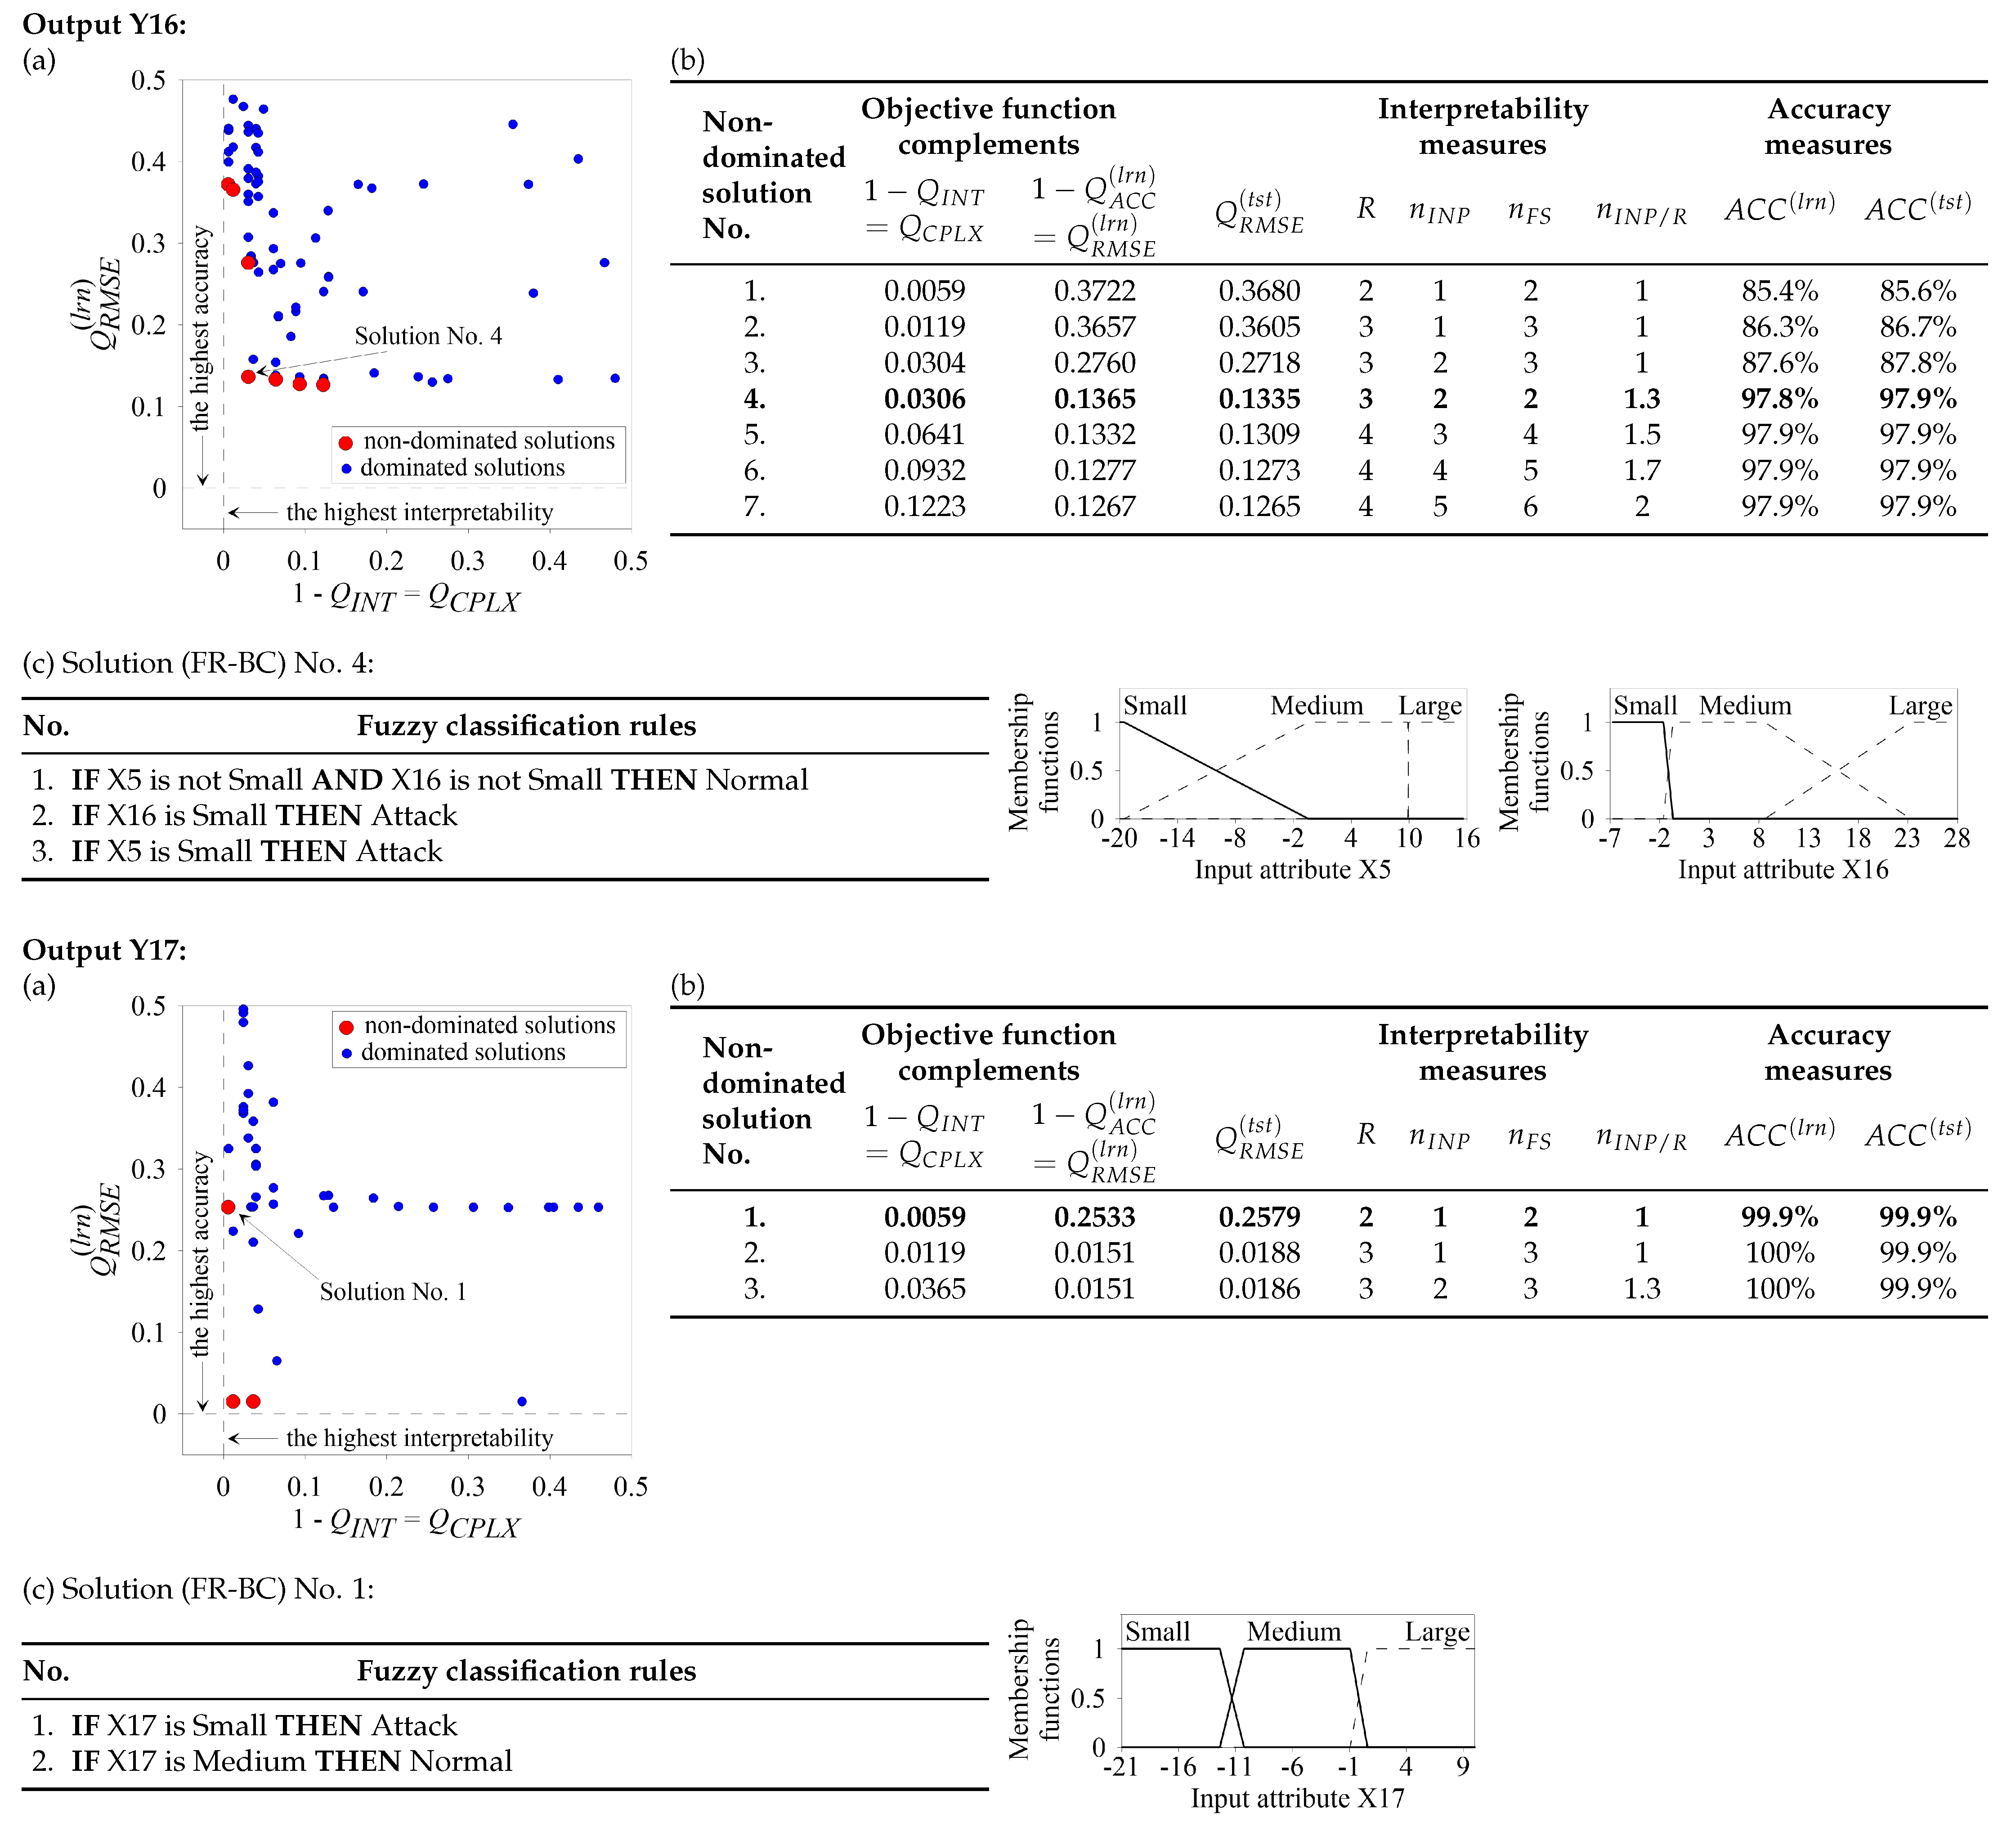
Figure 2 present families of dominated and non-dominated solutions (FR-BCs) generated by our SPEA3 method. A family of non-dominated solutions represents the best available Pareto-front approximation (used in further considerations) for a given output. Such a family of non-dominated solutions begins with solution No. 1 of highest interpretability and lowest accuracy and ends with the solution of lowest interpretability and highest accuracy (it is solution No. 3 for Y1, solution No. 10 for Y2, solution No. 3 for Y3, etc.). Numerical details of interpretability and accuracy measures of particular non-dominated solutions from a given part (a) of
Figure 2 are collected in the corresponding part (b), in which
is the number of input attributes per rule,
and
are the percentages of correct decisions in the learning and test data sets, respectively (the remaining parameters were defined in previous section of this paper). Particular non-dominated solutions from parts (a) and the corresponding parts (b) of
Figure 2 are characterized by different levels of optimized accuracy–interpretability trade-off. The user can select—for a given output—a single solution (a specific FR-BC) that is characterized by a desired level of compromise between accuracy and interpretability. For a given output, a single non-dominated solution of particular interest is the solution characterized by the highest accuracy in the test data set and the highest interpretability, i.e., the solution of highest generalizing capabilities combined with the highest transparency (such a solution is referred to as “the best solution” in
Figure 2). Such single solutions—for particular outputs—are marked in parts (a) and denoted by boldface in the corresponding parts (b). In turn, in the corresponding parts (c) of
Figure 2, their fuzzy rule bases are presented, including membership functions of fuzzy sets that occur in those rules.
It is worth emphasizing that after the completion of the SPEA3-based genetic learning and optimization process and after the selection of a single (the best) FR-BC for each output—due to a very low computational complexity of the fuzzy approximate inference engine—new decisions regarding FDIA detection and localization can be obtained almost instantaneously. The problem of computational complexity of fuzzy rule-based classifiers is briefly addressed, e.g., in [
25,
26] we authored. In turn, the computational complexity of fuzzy rule-based regression systems (that can be considered as generalizations of classifiers) is considered, e.g., in [
27,
28,
29]. Concluding, we provide not only an accurate and interpretable but also a fast theoretical tool (FR-BCs) to address the problem of FDIA detection and localization.
After completing the design process—from
data14_1
.mat data set—of 18 FR-BCs for particular outputs of our system and to obtain an overall image of the performance of our approach, in the first row of
Table 2, we present averaged values of the considered evaluation metrics. Additionally, we added three well-known metrics: precision, recall, and F1 (they are used in [
2] to evaluate 12 alternative approaches considered in the comparative analysis presented below). They are defined in the following way:
where TP stands for the number of true positive cases (i.e., FDIAs correctly classified), FP for the number of false positive cases (i.e., normal cases incorrectly classified as FDIAs), and FN for the number of false negative cases (i.e., FDIAs incorrectly classified as normal behavior). In [
2], these metrics are defined in an equivalent but slightly different way—see [
2] for details.
The above-presented experimental scenario applied to processing
data14_1
.mat data set is also used—in an analogous way—to independently process
data14_2
.mat through
data14_5
.mat data sets. The obtained averaged results for these data sets are included in the 2nd, 3rd, 4th, and 5th rows of
Table 2, respectively. The last row of
Table 2 (labeled as AVG) presents the overall (overall data sets) average of particular evaluation metrics. It is clear that a general conclusion arising from all these experiments is the following: the approach we propose generates FDIA detection and localization systems characterized not only by very high accuracies in both learning and test data sets (97.8% or more) but also by very low complexity and thus very high interpretability (on average 4.6 fuzzy rules with 1.7 input attributes per rule, i.e., a few very simple fuzzy rules).
As already mentioned, 12 alternative approaches are applied to the considered FDIA detection and localization problem in [
2]. They include multilayer perceptron (MLP) with 2, 3, 4, 5, and 6 layers, convolutional neural network (CNN) also with 2, 3, 4, 5, and 6 layers, support vector machine (SVM), and light gradient boosting machine (LightGBM). The averaged interpretability metrics and averaged accuracy metrics for the test data for all 12 alternative methods and for our approach are collected in
Table 3 (the accuracy
is calculated in [
2] in a slightly different way (see [
2] for details) than in our approach). The CNN-based methods give slightly higher values of some accuracy metrics, however, not exceeding, on average, 1.76% for
, 1.44% for
, and 1.95% for
.
In order to demonstrate the generalizability of our approach, its validation on the larger-scale grid such as the IEEE 118-bus system has also been carried out. As already said earlier in this section, the recently published IEEE 118-bus system data used in our experiments—similar to the already considered IEEE 14-bus system data—are available at
https://github.com/wsyCUHK/WSYCUHK_FDIA (they are also discussed in [
2]). The IEEE 118-bus system data are collected in five data sets, referred to as
data118_1
.mat through
data118_5
.mat. Each data set contains 100.000 learning data records and 10.000 test data records. Each data record is characterized by 180 numerical input attributes (representing measurements coming from 180 meters) and 180 corresponding output attributes that assign either “Normal” or “Attack” class labels to a given record. Analogously as for the IEEE 14-bus system experiments, we combine the FDIA’s detection and localization by designing a collection of 180 independent FR-BCs indicating, in an accurate and transparent way whether, in a given measurement point, we deal with FDIA (class label “Attack”) or with grid’s normal operation (class label “Normal”).
Due to (i) the high complexity of the IEEE 118-bus system experiments (the necessity to design 180 independent FR-BCs with optimized accuracy–interpretability trade-off) and (ii) an analogous—to the IEEE 14-bus problem—character of experiments, we present only the final results for the IEEE 118-bus problem; they are collected in
Table 4. It is constructed in an analogous way as
Table 3 for the IEEE 14-bus problem. The first row of
Table 4 contains the overall average of particular evaluation measures calculated over all data sets (i.e.,
data118_1
.mat through
data118_5
.mat). Similar to the IEEE 14-bus problem, one can see that our approach generates systems for FDIA detection and localization of very high accuracy (i.e., 99.5% in the test data set) and very high interpretability and transparency (i.e., on average only 3.8 fuzzy rules with 1.5 input attributes per rule). Ten alternative approaches are applied to the considered IEEE 118-bus problem in [
2] (they were also applied to the IEEE 14-bus problem as shown in
Table 3). Only some CNN-based methods give slightly higher values (but not exceeding, on average, 0.41%) of one accuracy metric (i.e.,
).
It is worth stressing, however, that all alternative methods are black-box-type approaches that focus exclusively on the accuracy of the FDIA detection and localization process. For this reason, they are favored in regard to our approach, which must optimize the compromise between the accuracy and interpretability of that process. Nevertheless, our approach provides not only highly accurate but also highly interpretable solutions. These solutions (collections of FR-BCs—each with a fuzzy rule base encapsulated in a compact set of a few easy-to-understand simple fuzzy linguistic rules) allow one to trace in detail the mechanisms governing the detection and localization of FDIAs.
5. Conclusions
In this paper, we consider the problem of accurate, transparent, and interpretable detection, as well as the localization of FDIAs in smart grids. In order to address that problem, we employ our knowledge discovery ML/DM approach—implemented as a collection of FR-BCs—characterized by a genetically optimized accuracy–interpretability trade-off. Our approach uses our generalization (showing better performance) of the well-known M-OEOA to carry out the genetic learning and optimization process. The accuracy of our approach represents its ability to both correctly detect and correctly localize possible FDIAs. In turn, the transparency and interpretability represent its ability to generate understandable, explicit, and compact explanations of mechanisms governing those attacks. Our approach generates sets of fuzzy linguistic classification rules of easy-to-grasp interpretation and comprehensibility. They belong to the most effective knowledge representation schemes in various domains including the FDIAs’ domain.
The main contribution of this work is designing—using our approach—a collection of fast, accurate, and interpretable FR-BCs for the FDIA detection and localization from the recently published FDIA data. These data—available
https://github.com/wsyCUHK/WSYCUHK_FDIA (see also [
2])—describe various aspects of FDIAs in the IEEE 14-bus and 118-bus smart grid systems. Our approach generates FDIA detection and localization systems characterized not only by very high accuracies in both learning and test data sets (97.8% or more for the IEEE 14-bus system and 99.5% for the IEEE 118-bus system) but also by very low complexity and thus very high interpretability (on average, 4.6 fuzzy rules with 1.7 input attributes per rule for the IEEE 14-bus system and, on average, 3.8 fuzzy rules with 1.5 input attributes per rule for the IEEE 118-bus system, i.e., in each case, a few very simple and easy-to-comprehend fuzzy rules). The contribution of this paper also includes a comparative analysis of our approach and 12 alternative methods applied to the same FDIA data. That analysis shows that our approach totally outperforms the alternative approaches in terms of transparency and interpretability of FDIA detection and localization decisions while remaining competitive or superior in terms of the accuracy of generated decisions. The alternative approaches are exclusively accuracy-oriented black-box-type ones. Based on the review of related works carried out in the second section of this paper and, to the best of our knowledge, the proposed approach is either one of the first ones or the first one as far as interpretable, accurate, and fast approaches to FDIA detection and localization are concerned.
Our future research will focus on two areas. First, as far as further analysis of the FDIA data sets considered in this work is concerned, we intend to design a multiclass FR-BC with multiple outputs and associated multiple fuzzy rule bases operating on a common collection of fuzzy sets for input attributes. In this way, we expect to improve the semantics-related interpretability of generated FR-BCs. Second, as far as further development of our methodology is concerned, we intend to work on improving our original mechanism for balancing FR-BCs’ locations on the generated Pareto-front approximations (implemented in our SPEA3 method) to carry out optimization processes with more than two optimization criteria. It is one of the important directions in designing modern M-OEOAs that can effectively be used in explainable artificial intelligence systems (see, e.g., [
30,
31]) or interpretable machine learning systems (see, e.g., [
32,
33]).


