1. Introduction
The global energy sector is at a crucial turning point, with a significant shift towards renewable energy integration and intelligent infrastructure solutions. In 2021, carbon-free electricity sources accounted for 38% of the total electricity generated worldwide [
1]. The proposed Hybrid Renewable Energy System (HRES), which combines solar and wind with the already existing diesel generators, could be a game-changer in isolated areas. However, to fully realize the potential of the hybrid system, monitoring, control, and optimization mechanisms are needed—such as Supervisory Control and Data Acquisition (SCADA) systems—enhanced with Internet of Things (IoT). The architectural design of a standard SCADA system begins with microcontrollers or microprocessors, known as a Remote Terminal Unit (RTU). RTUs interact with the energy systems via Field Instrumentation Devices (FIDs). These FIDs are sensors, actuators, valves, pumps, and transmitters, enabling the system to collect data and execute control mechanisms. The information they collect then goes through a SCADA Communication Channel to the SCADA computers, known as Master Terminal Units (MTUs). These MTUs play a crucial role in the system, as they interpret and display the events on a Human–Machine Interface (HMI), enabling operators and key decision-makers to analyze and respond to process events.
In hybrid systems, SCADA ensures that an optimal mix of renewable and traditional energy sources is always used. SCADA also reduces operational inefficiencies, lowers emissions, provides reliable energy security for the isolated community, and reduces operational costs by cutting down the number of on-site visits for system monitoring [
2]. The proposed location for the study is the isolated community of Cartwright, Labrador. The real-time data collection and system automation provided by the Arduino UNO R4 Wi-Fi-based SCADA system with IoT capabilities will be of great benefit to Cartwright.
IoT-based SCADA systems are increasingly recognized for improving hybrid energy systems’ efficiency, reliability, and operational control. Studies indicate that the IoT approach to implementing SCADA offers three main advantages for renewable energy systems. It allows the monitoring of individual Photovoltaic (PV) modules, which is crucial for large systems. Secondly, it enables better on-site and external data integration to improve energy forecasting. Lastly, IoT-SCADA architecture can facilitate the integration of other data sources. The above reasons buttress the point that an IoT-SCADA system can enhance operations and maintenance management through predictive maintenance, leading to higher economic gains and improved reliability in renewable energy delivery [
3].
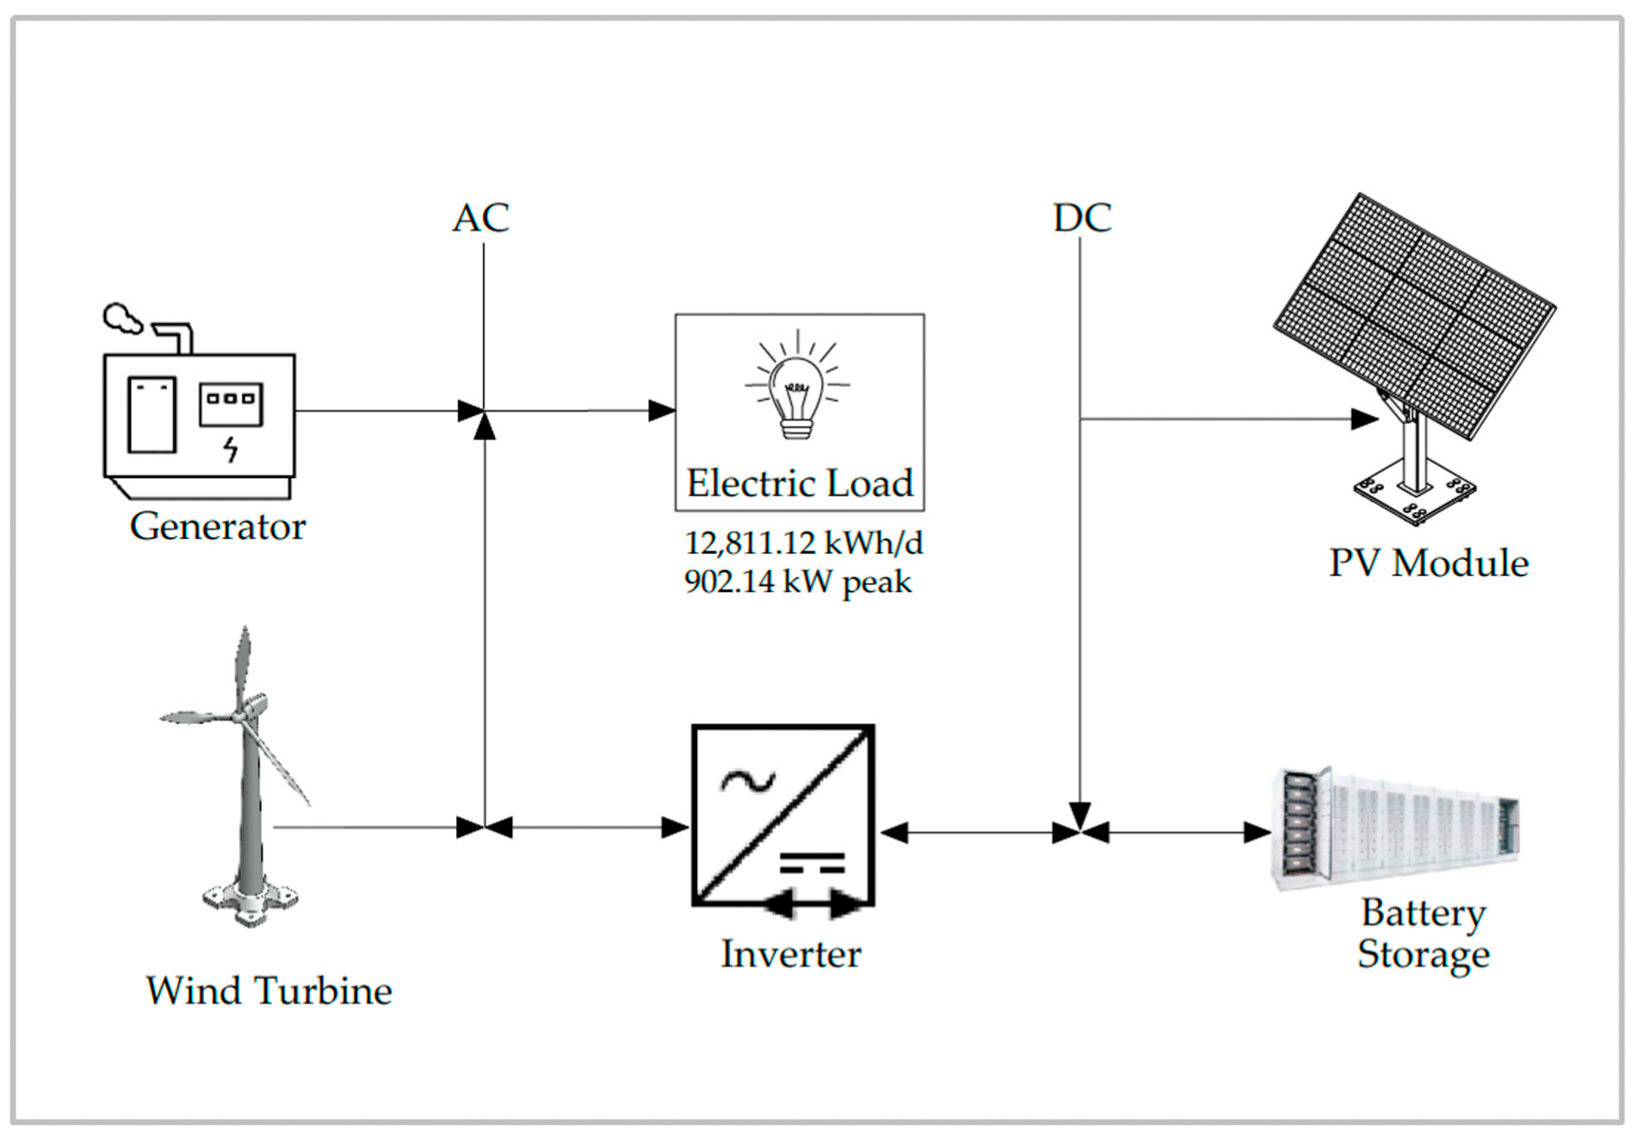
The proposed hybrid system for Cartwright was designed using renewable energy resources, battery storage, and an existing diesel generator. The system was analyzed and evaluated on the Homer Pro software by selecting each specific model of energy resource. The power-sharing ratio is tuned to 30% for solar power and 70% for wind power [
4].
Figure 1 shows the designed hybrid power system for Cartwright.
2. Literature Review
A literature review was conducted for this research, which bordered on implementing an IoT-based SCADA system in renewable technologies using microcontrollers. Some studies have designed IoT-enhanced SCADA systems, with a few being outlined in this literature review. The reviewed literature employed different microcontrollers, but the Arduino UNO R4 microcontroller has emerged as a significant tool in developing low-cost, reliable SCADA systems.
Fikril Alan et al. [
5] described a PV monitoring system which was implemented using an Arduino Uno R4 integrated with sensors such as ZMPT101B for AC voltage and ACS712 for current readings. The system was then validated under various environmental conditions, and was found to be highly accurate for continuous solar energy monitoring with an error rate of less than 0.1%. In comparison, this IoT-enhanced SCADA for Cartwright was aimed at a hybrid energy system, which comprised solar, wind, and diesel energy sources, unlike PV-only, as observed from the solution by Fikril Alan et al. Furthermore, the Cartwright design applies Arduino IoT cloud-based monitoring capabilities which did not feature in the solution presented by the authors.
Ferlito et al. [
6] conducted a study considering large-scale PV utility plants based on IoT-enabled SCADA systems. The solution of Ferlito et al. employed lightweight protocols and was implemented with edge computing to facilitate real-time decision-making with very low data transmission overhead, thus enabling predictive maintenance. Large-scale PV utility plants based on IoT-enabled SCADA systems study underline the scalability and fault tolerance enabled by integrating IoT technologies into SCADA systems, thus ensuring better efficiency and security. The authors highlighted that primary benefits include real-time monitoring of the performance of each PV module, more intensive data integration from different sources like weather forecasts, optimizing energy generation, and minimizing operational disruption. The proposed IoT-SCADA system for Cartwright was designed for small-scale hybrid microgrids, whereas Ferlito et al. focused on large-scale PV-only farms. This paper employed WPA2 encryption for RTU communication, which Ferlito et al. do not emphasize.
Patel et al. [
7] also presented an open-source SCADA system for hybrid energy systems with solar and diesel generators. The design under review employed an Arduino-based data logger for monitoring different power generation sources. Critical operational data were stored on an SD card and later analyzed for energy management. Using open-source platforms and low-cost hardware such as Arduino makes such systems accessible and scalable for rural or remote regions. Despite the SCADA system by Patel et al. successfully executing low-cost hybrid energy monitoring and data logging, it is limited because of its inability to execute real-time monitoring on the cloud or via remote control capabilities. In contrast, the SCADA system for Cartwright is IoT-enhanced. It offers real-time monitoring and was designed to accommodate wind as an additional energy source, making it a better and more realistic option for hybrid energy management.
Oton and Iqbal [
8] demonstrated that Arduino IoT cloud-based SCADA systems use the Arduino IoT cloud integrated with microcontrollers such as the ESP32 to create a low-cost SCADA system. The system proposed by the authors was designed for remote sites like Base Transceiver Stations (BTSs), where power conditions (voltage and temperature) are monitored and controlled using sensors. The Arduino IoT cloud used in the reviewed solution provides an online dashboard for remote monitoring and control. A simple interface and mobile application which added flexibility by enabling system management from anywhere. Although the authors utilized the Arduino IoT cloud for monitoring the power of Base Transceiver Stations (BTSs), the system had limitations. It lacked the capability for hybrid energy integration, and the ESP32 RTU used in the research required a separate Wi-Fi router to enable remote connections, which increased both the cost and complexity of the system. In contrast, this project employs the Arduino UNO R4 Wi-Fi RTU, which features a built-in Wi-Fi module. The design in this paper made the IoT-enhanced SCADA deployment simpler and reduced the overall system cost.
The distinction between this research and other similar implementations is the physical alert mechanism. The novelty of this paper is that a buzzer was introduced in the RTU circuitry. It works like a trigger signal for an alarm to ring and thus indicates, with noticeable noise, to the system operator where there is a power interruption. The inclusion of a buzzer in this SCADA system’s energy management process is vital to real-time warning and controlling. The RTU monitors battery voltage via sensors. When the battery storage voltage drops to a critical threshold, such as 12.3 V, as applied in this paper, the buzzer is activated, which provides an immediate alert, thus enabling the personnel to be aware of the battery conditions. This alarm signal will also provide logic for driving switching devices such as relays for seamless transitions into other power supplies.
The main advantage of having a buzzer alert on-site is that it enhances the safety and reliability of the hybrid system by ensuring an effective localized alert in case of communication failures with the Master Terminal Unit (MTU). From the literature reviewed, no SCADA solution for a hybrid energy system with a buzzer concept was identified.
3. Components of the Proposed SCADA System
To implement this proposed low-cost, open-source SCADA solution, the analog sensors were connected to the Festo Solar PV System to collect the required data from the system, and the Arduino R4 Wi-Fi micro-controller was programmed with an Arduino Integrated Development Environment (IDE) to receive these sensor data and to display them on the Arduino IDE Serial Monitor. The sensor data were then sent via a locally configured Wi-Fi network to the Arduino cloud platform, which was used for remote monitoring and visualizing the data being read by the sensors.
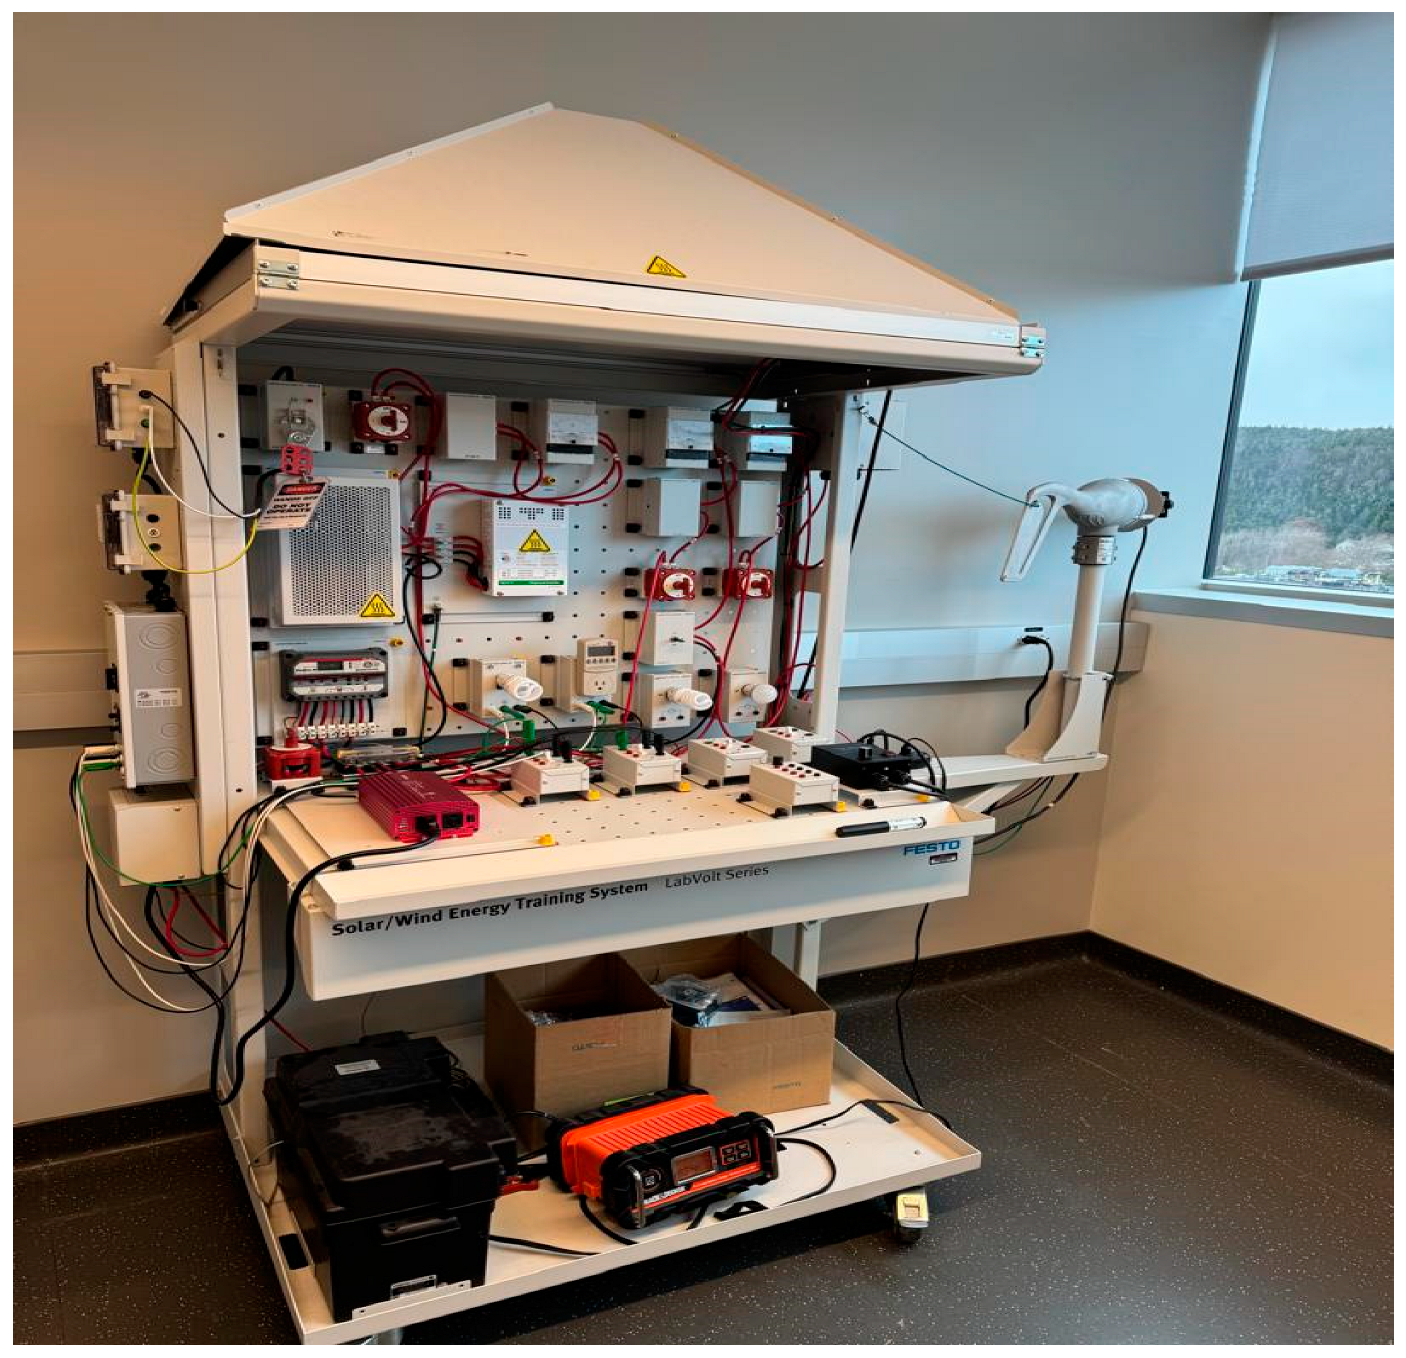
3.1. FESTO Solar and Wind Energy Power-Generating Equipment
The FESTO unit, shown in
Figure 2, mimics wind and solar energy sources for testing purposes [
9].
This equipment is situated in the Renewable Energy Laboratory at Memorial University of Newfoundland.
3.1.1. Solar Energy Source
A simulator with an 87 W solar PV panel and a 600 W, 120 VAC lamp emulating sunshine/solar irradiation.
3.1.2. Inverter
A Direct Current–Alternating Current (DC-AC) converter rated 1000 W that changes 12 VDC power to 120 VAC (sinusoidal) power.
3.1.3. Wind Energy Source
The wind energy source is simulated by a wind turbine propelled by a DC motor rated 16.5 A and has an operational voltage range between 12 and 24 V. The speed of the engine is variable from 1800 to 4200 RPM by a DC motor controller in steps of 10%.
3.1.4. Diversion Controller/Dump Load/Loads
This is a resistive module that dissipates power as the head. It diverts excessive power from the wind turbine and prevents it from spinning too fast under no-load conditions to avoid permanent damage to the wind turbine.
3.1.5. Battery Bank
The battery is a 12 V, 110 Ah deep-cycle sealed lead-acid Absorbent Glass Mat (AGM) storage battery that stores renewable energy from solar and wind sources.
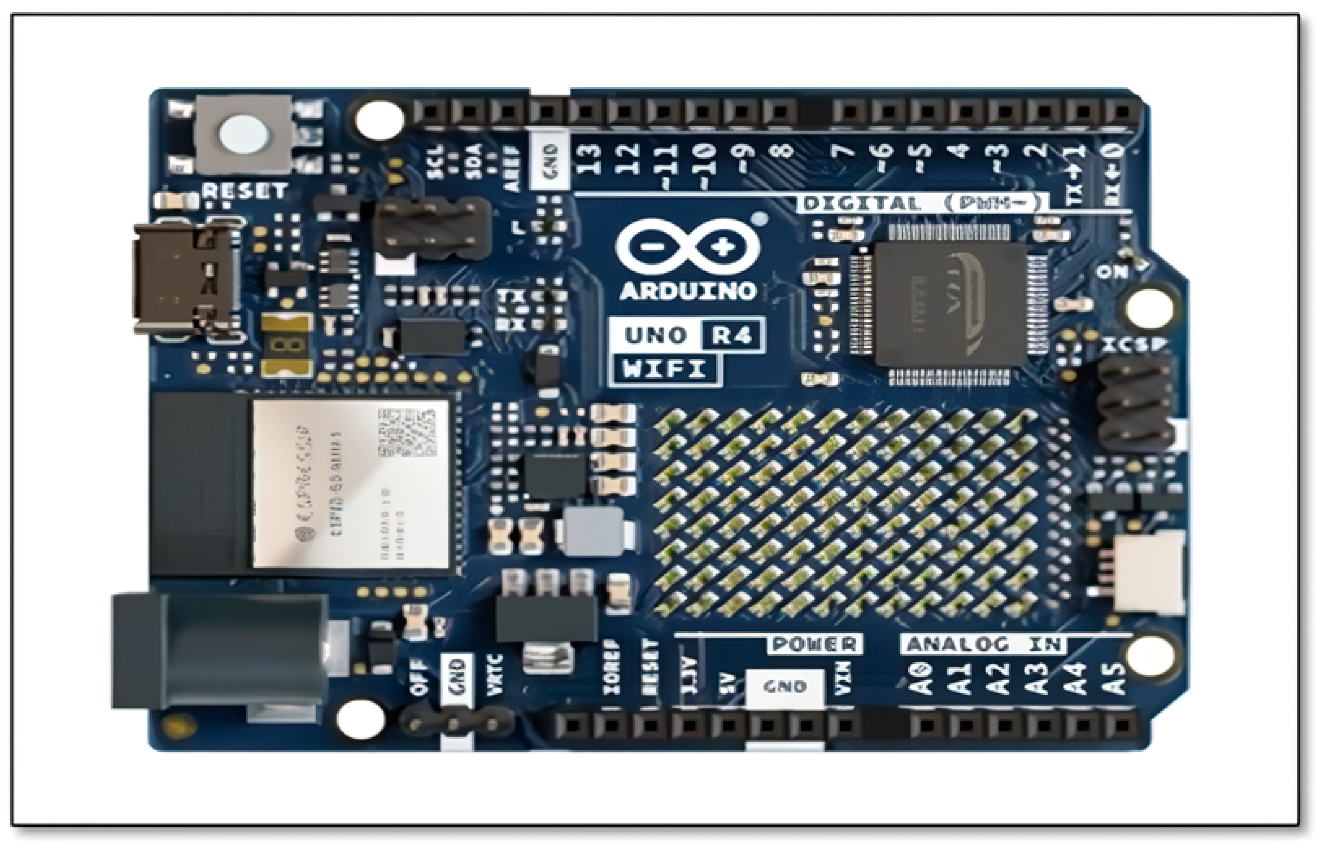
3.2. Arduino UNO R4 Wi-Fi Board
The Arduino UNO R4 Wi-Fi is a 32-bit microcontroller that processes the signals from the hardware, implements control instructions, and wirelessly interfaces these with the Arduino cloud [
10].
Arduino UNO R4 Wi-Fi was selected for this research because its wireless connectivity on-board simplifies system design by removing additional modules. Its affordability and strong product community backing enable immediate prototyping. Furthermore, its processing capability and inherent compatibility with the Arduino IoT cloud enable effortless real-time data retrieval and remote monitoring, which are critical features for hybrid power applications in resource-constrained environments.
Figure 3 displays the Arduino UNO Wi-Fi board which serves as the RTU for this SCADA design, and
Table 1 above depicts its specifications.
3.3. Sensors
Sensors are used in the SCADA system to measure and collect data on the field. Voltages and currents are the parameters measured. For these measurements, one MH electronic voltage sensor and four ACS 712 Hall effect sensors were employed in the SCADA. Detailed technical specifications of these sensors are discussed below.
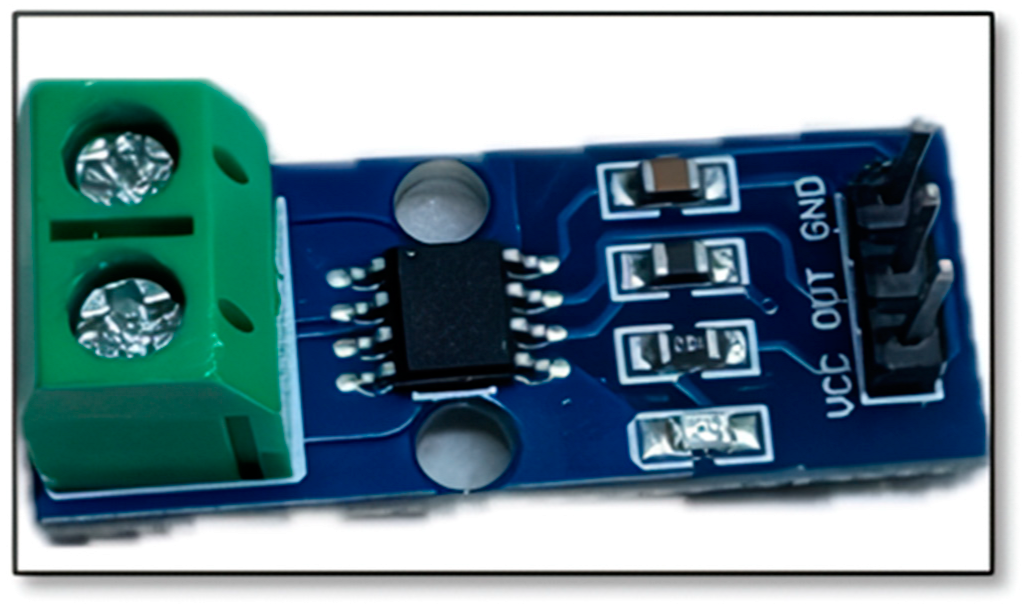
3.3.1. ACS 712 Hall Effect Current Sensor
The ACS 712 Hall effect current sensor measures the electric current flowing through a conductor, providing an analog voltage output proportional to the current.
Figure 4 shows the current sensor, and its specifications are as shown in
Table 2.
The SCADA setup included four ASC 712 Hall effect sensor units connected in series to the solar, wind, DC, and AC loads [
11]. These sensors operate based on the Hall effect principle. The current flowing through the sensors causes a magnetic field to be generated, which is proportional to the input currents being measured, which are sent out as output voltages between 0 and 5 V to the signal pins A1, A2, A3, and A4 on the Arduino R4 UNO Wi-Fi board.
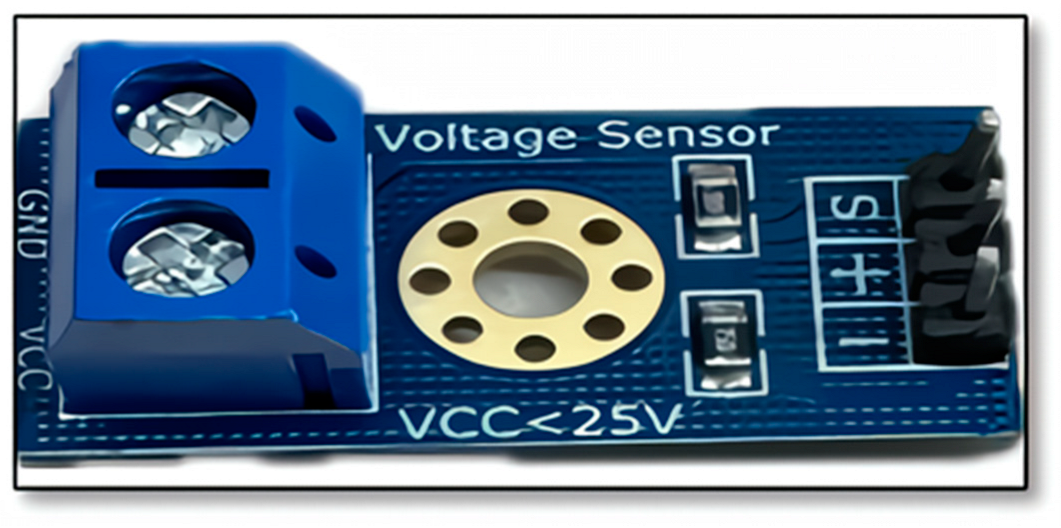
3.3.2. MH Electronic Voltage Sensor
Figure 5 below shows the MH electronic voltage sensor, which measures the voltage across a load or power source, delivering an analog voltage output representative of the voltage measured. Its specifications are as shown in
Table 3.
The sensor design is built primarily with a voltage divider circuit principle, and the input voltage ranges from 0 to 25 V [
12]. The voltage divider circuit comprises a 7.5 kΩ resistor and a 30 kΩ resistor connected in series and outputs an analogue voltage signal from 0 to 5 V. The input terminals Vcc and Ground (GND) are connected in parallel to the battery terminals to measure the voltage values. The signal Pin S on the sensor is connected to analog pin A0 on the Arduino UNO R4 Wi-Fi board. The Positive Pin (+) from the sensor output is connected to the 5 V bus on the breadboard. While the Negative pin (–) is connected to the ground on the Arduino board.
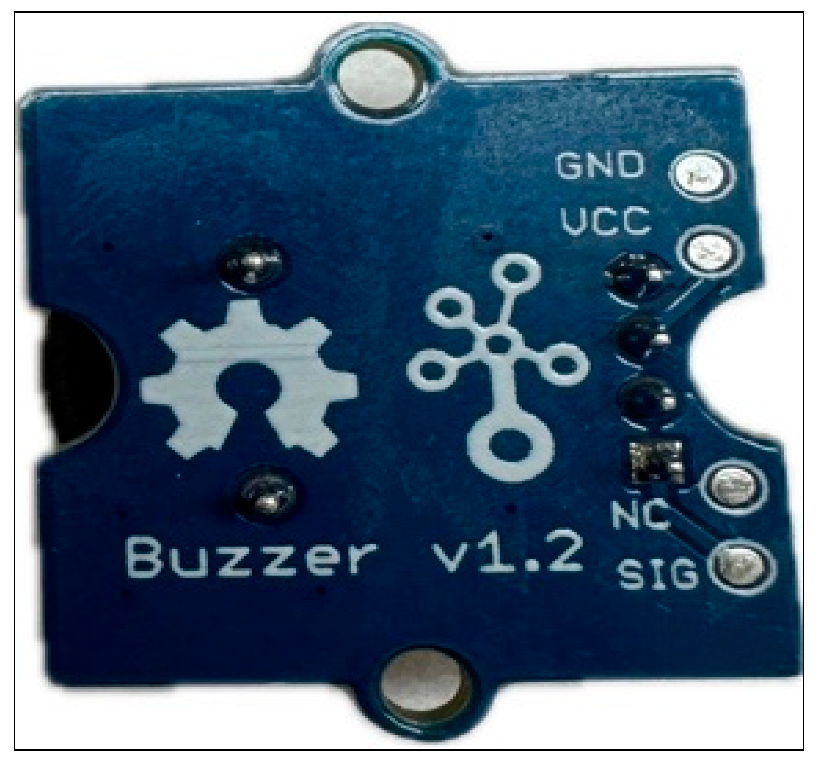
3.3.3. Grove-Buzzer Module
Figure 6 shows the Grove-Buzzer module used for this research, a fundamental component that can output sound when driven.
Table 4 displays the specifications of the buzzer module.
The buzzer module has three primary connections. A Positive Terminal (Vcc or +), a Negative Terminal (GND −), and the Signal Pin (SIG) [
13].
Negative to GND on RTU Pin 8 also provides digital output and will produce either a HIGH or LOW signal to the buzzer, thus turning it on or off. Software control of the buzzer was achieved using the ‘digitalWrite()’ function embedded in the code using the if-else, which checks if the measured input voltage on the battery terminals drops below a threshold value of 12.3 V. If the voltage is below 12.3 V, the buzzer is activated. Otherwise, the buzzer is in the ‘OFF’ state. The SCADA system continuously reads voltage and checks the threshold. The buzzer then creates an audible alert if the condition is met, i.e., voltage below 12.3 V. Implementing a buzzer is a simple, practical, low-cost addition with a high operational impact for Cartwright’s proposed hybrid power system.
3.3.4. Laptop Computer
The laptop computer has the Arduino IDE and Arduino cloud platform capabilities and serves as the MTU.
4. Methodology
In this research, the Arduino UNO R4 Wi-Fi microcontroller module (RTU) was selected to read data from various sensors (FIDs). The sensor measurements were carefully calibrated to ensure accuracy. The data collected were then transmitted to the Arduino cloud using the advanced Wi-Fi capabilities of the microcontroller. The Arduino R4 Wi-Fi microcontroller code was developed and executed to enable effective real-time voltage and current monitoring within the FESTO hybrid energy equipment.
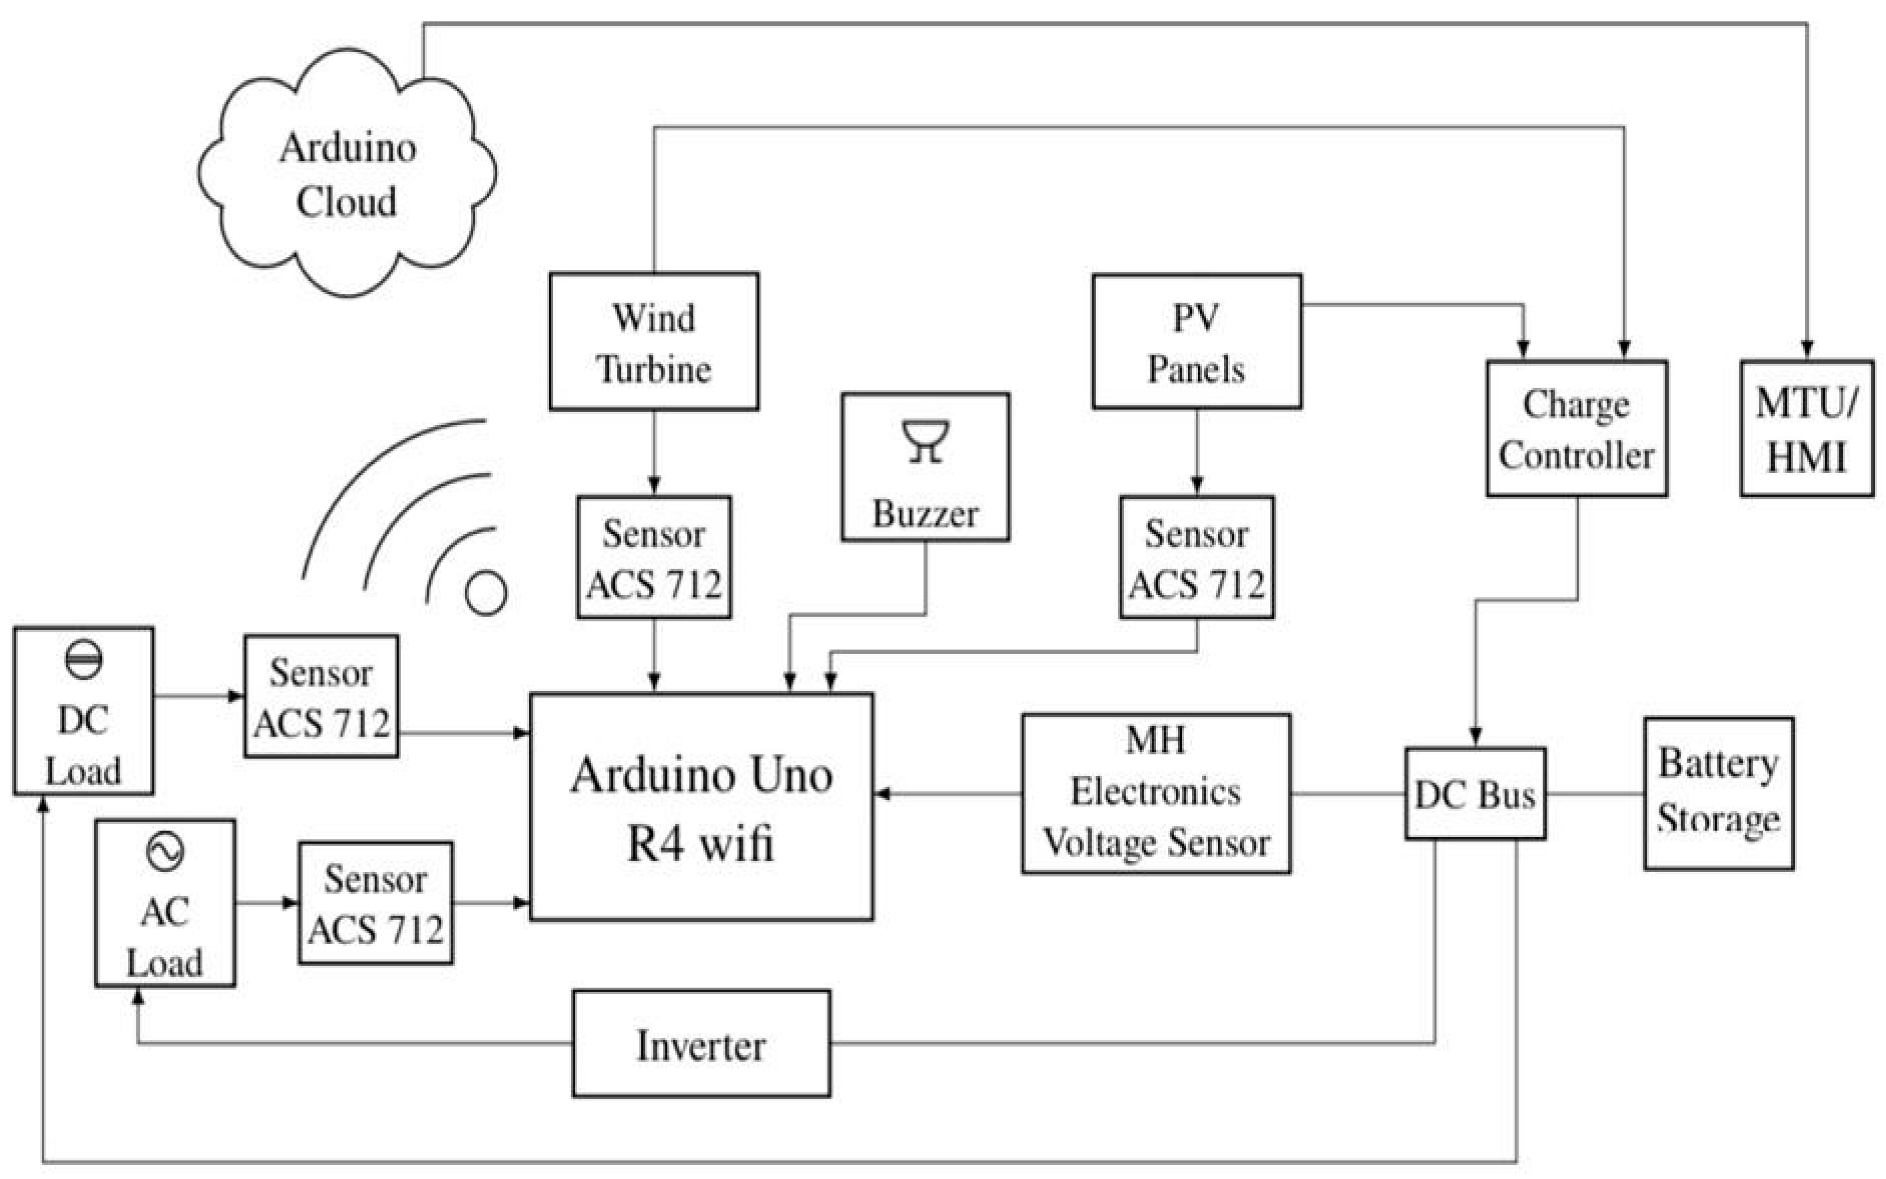
Figure 7 below shows how the FIDs were connected to the RTU and its communication and data transmission to the Arduino cloud via Wi-Fi. The MTU accessed the data from the cloud, and the values were displayed on the Arduino cloud dashboard.
4.1. Circuit Connection and Data Transmission
The four ACS712 Hall effect current sensors and one MH electronics voltage sensor were connected in a circuit, as shown in
Figure 8.
The single voltage and four current sensors were interfaced with the Arduino R4 Wi-Fi board via the analog pins A0, A1, A2, A3, and A4. It is worth noting that sensors often have default zero errors, making the read parameters inaccurate. To minimize such errors, sensor calibrations were incorporated within the code to significantly reduce inaccurate readings and ensure accurate voltage and current readings. The buzzer signal pin was connected to Pin 8 of the RTU.
The system was designed such that acquisition and processing of real-time sensor data was possible in the Arduino IDE. The baud rate was set at 9600 bps, suitable for serial communication in the serial monitor of Arduino IDE, allowing for real-time sensor data viewing and accurate monitoring during system operation. The process was implemented on a private Wireless Local Area Network (WLAN) that used Wi-Fi Protected Access 2 (WPA2) for its encryption, thereby implementing Advanced Encryption Standard (AES) to safeguard the information exchanged. A wireless network setup where a pre-shared secret key was created with credentials ensured that this kind of IoT configuration was performed in such a manner to prevent unauthorized access. A one-word character string was the wireless network Service Set Identifier (SSID) of the laboratory for easy identification and configuration. The Arduino UNO R4 Wi-Fi with an integrated ESP32-S3 Wi-Fi chip is initialized and connected to the WLAN through an Arduino Sketch. The setup allowed for good communication between the RTU and the Arduino IoT cloud, taking advantage of the WPA2 secure network to transmit sensor data with high reliability and safety against interception or tampering. The integration of these technologies ensured safe and efficient data acquisition for SCADA operations.
The process of creating an IoT project involves several steps. The steps taken included setting up an Arduino IoT cloud account, selecting a plan, and creating a “Thing”, which serves as the virtual representation of connected devices, variables, and network data. Further steps involved connecting the RTU to a Wi-Fi network using credentials like SSID and a secret key generated from the IoT cloud, declaring variables in the cloud for data storage and management for monitoring or control purposes, and creating sketches and dashboards that will define commands and show the visualization of the data. The Arduino cloud platform made the development easier by automatically generating parts of the sketch while creating a “Thing”, which made the integration of devices and variables easier.
4.2. Software Requirements/Arduino Code
The Arduino has an IDE which is an open-source program that enables the development of codes that can be put into any compatible board. The Arduino IDE software (Version: 2.3.3) was downloaded and installed on a laptop computer. To configure the Arduino UNO and SCADA software, a new library to the Arduino IDE was installed. A code was developed to activate the Wi-Fi capability of the Arduino device as well as to connect it to a Local Area Network (LAN).
4.3. Sensor Calibration
The MH electronic voltage sensor and ACS 712 current sensors were calibrated using the ‘Zero Offset’ adjustment. The Zero Offset adjustment involved taking an initial measurement of the voltage and current sensors’ output with the PV panel, wind source, AC load, and DC load battery turned off. Then, the offset was determined by recording the deviation of all the sensors’ output from zero values. Calibration values were applied to adjust the sensor output by adding the offset values to Equations (1)–(4) and subtracting the offset value from Equation (6).
4.3.1. Current Measurement
The Current Measurement was achieved by connecting four individual ACS 712 current sensors in series with the Wind Turbine Output, DC load, AC load via the inverter output, and the PV panel output, respectively.
where ‘sens’ is the sensitivity 185 mV/A, and ‘Vcc’ is the Voltage Common Collector 5 V for the 5 A sensor. The current is calculated based on the output voltage from the ACS712 sensor. The sensor’s output voltage varies depending on the measured current. Vcc/2 is the zero-current point, and the change in voltage is proportional to the current. The ‘avg()’ function was used to obtain the average analog reading for more accurate measurements.
4.3.2. Voltage Measurement
An MH electronic voltage sensor was used to measure the voltage by connecting in parallel to the battery terminal.
where the reference voltage of the sensor is 5 V.
R1 = 30,000 Ω and
R2 = 7500 Ω are the resistance values of the Voltage Divider circuit of the sensor.
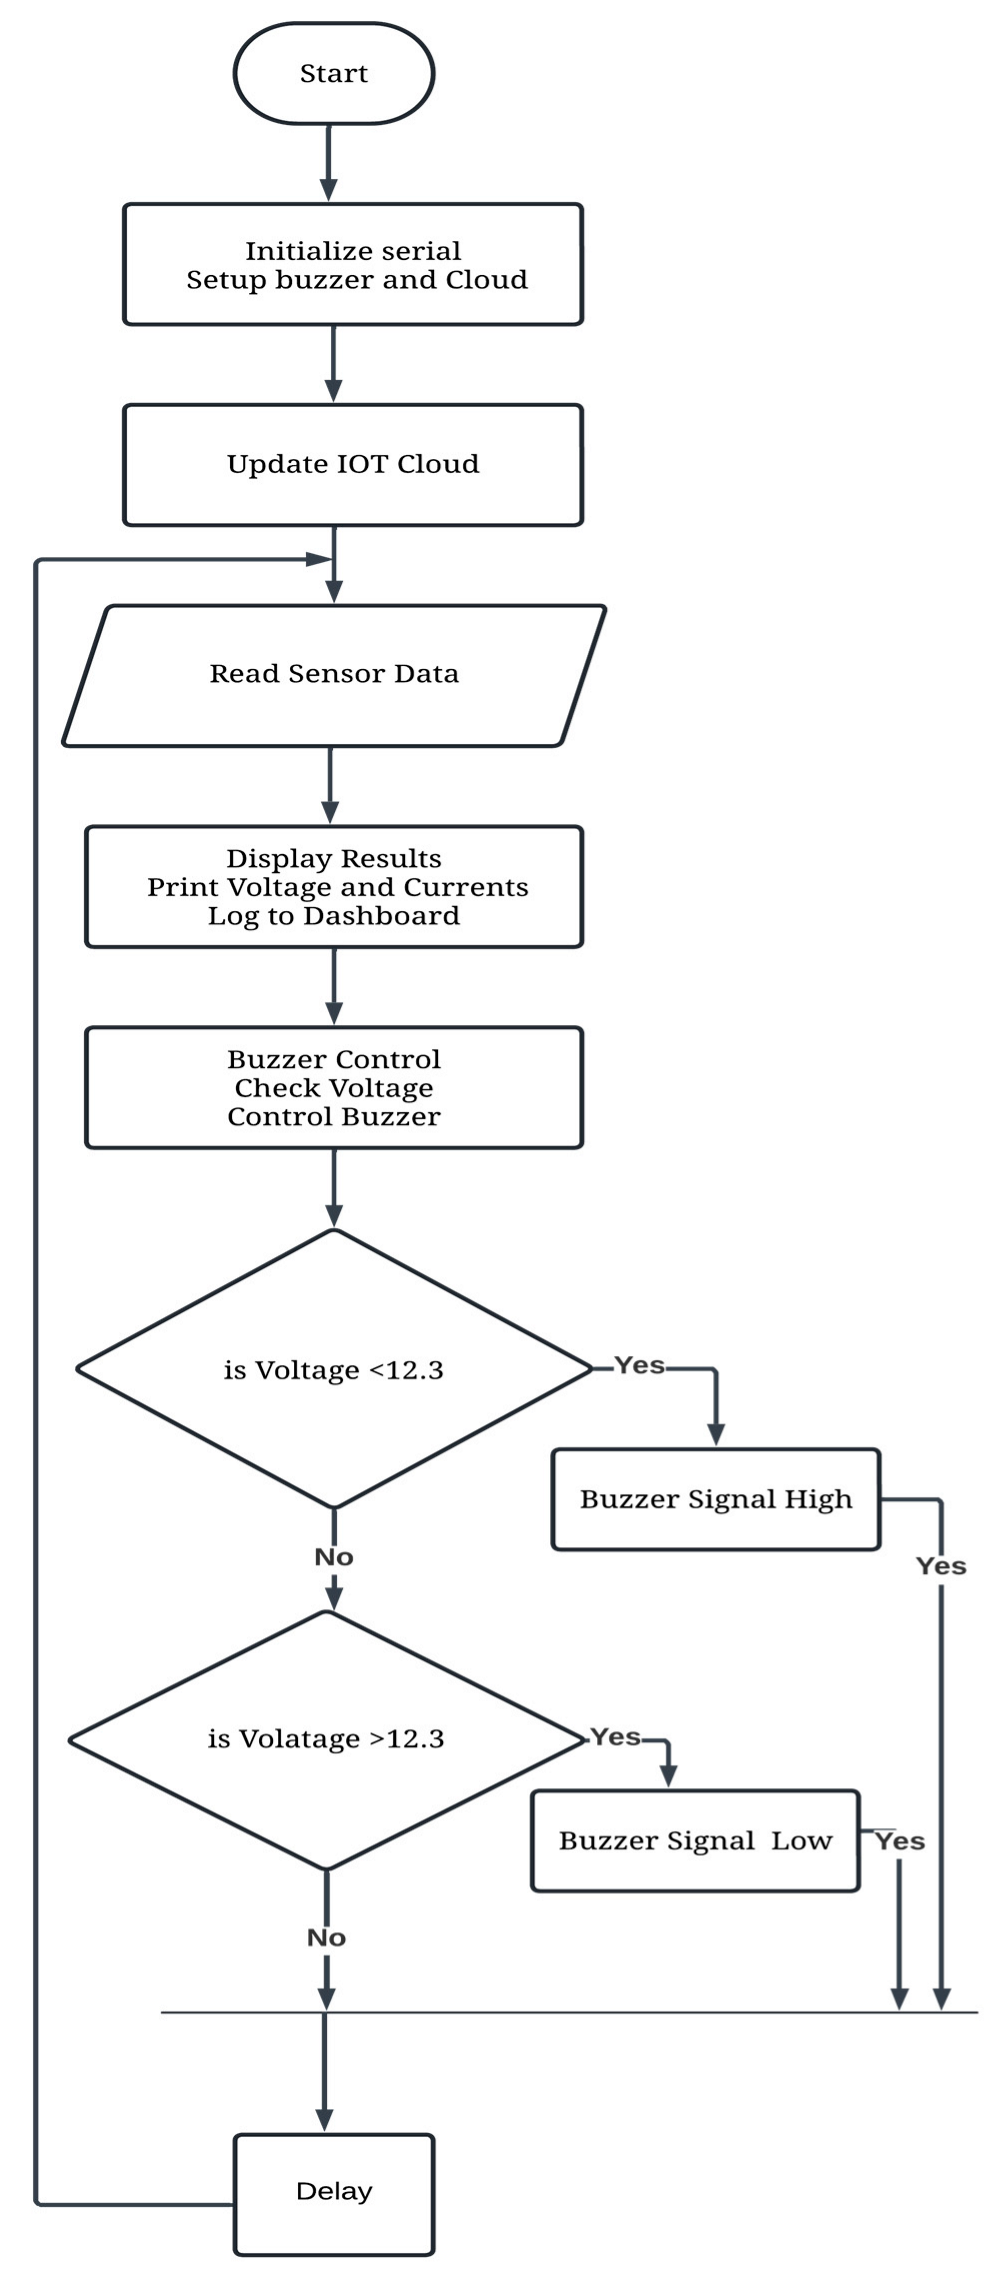
4.4. SCADA Implementation
The process begins with the initialization of serial communication, followed by the setup of the connection to the IoT cloud, and the buzzer activated when the voltage readings from the battery terminals are less than 12.3 V.
The flowchart in the paper summarizes the SCADA implementation process for the hybrid power system in Cartwright, Labrador. It represents the logical sequence of operations for real-time data acquisition, processing, cloud integration, and alert mechanisms within the IoT-based SCADA system.
Figure 9 shows the flowchart outlining the process for SCADA implementation.
5. Testing and Measurements
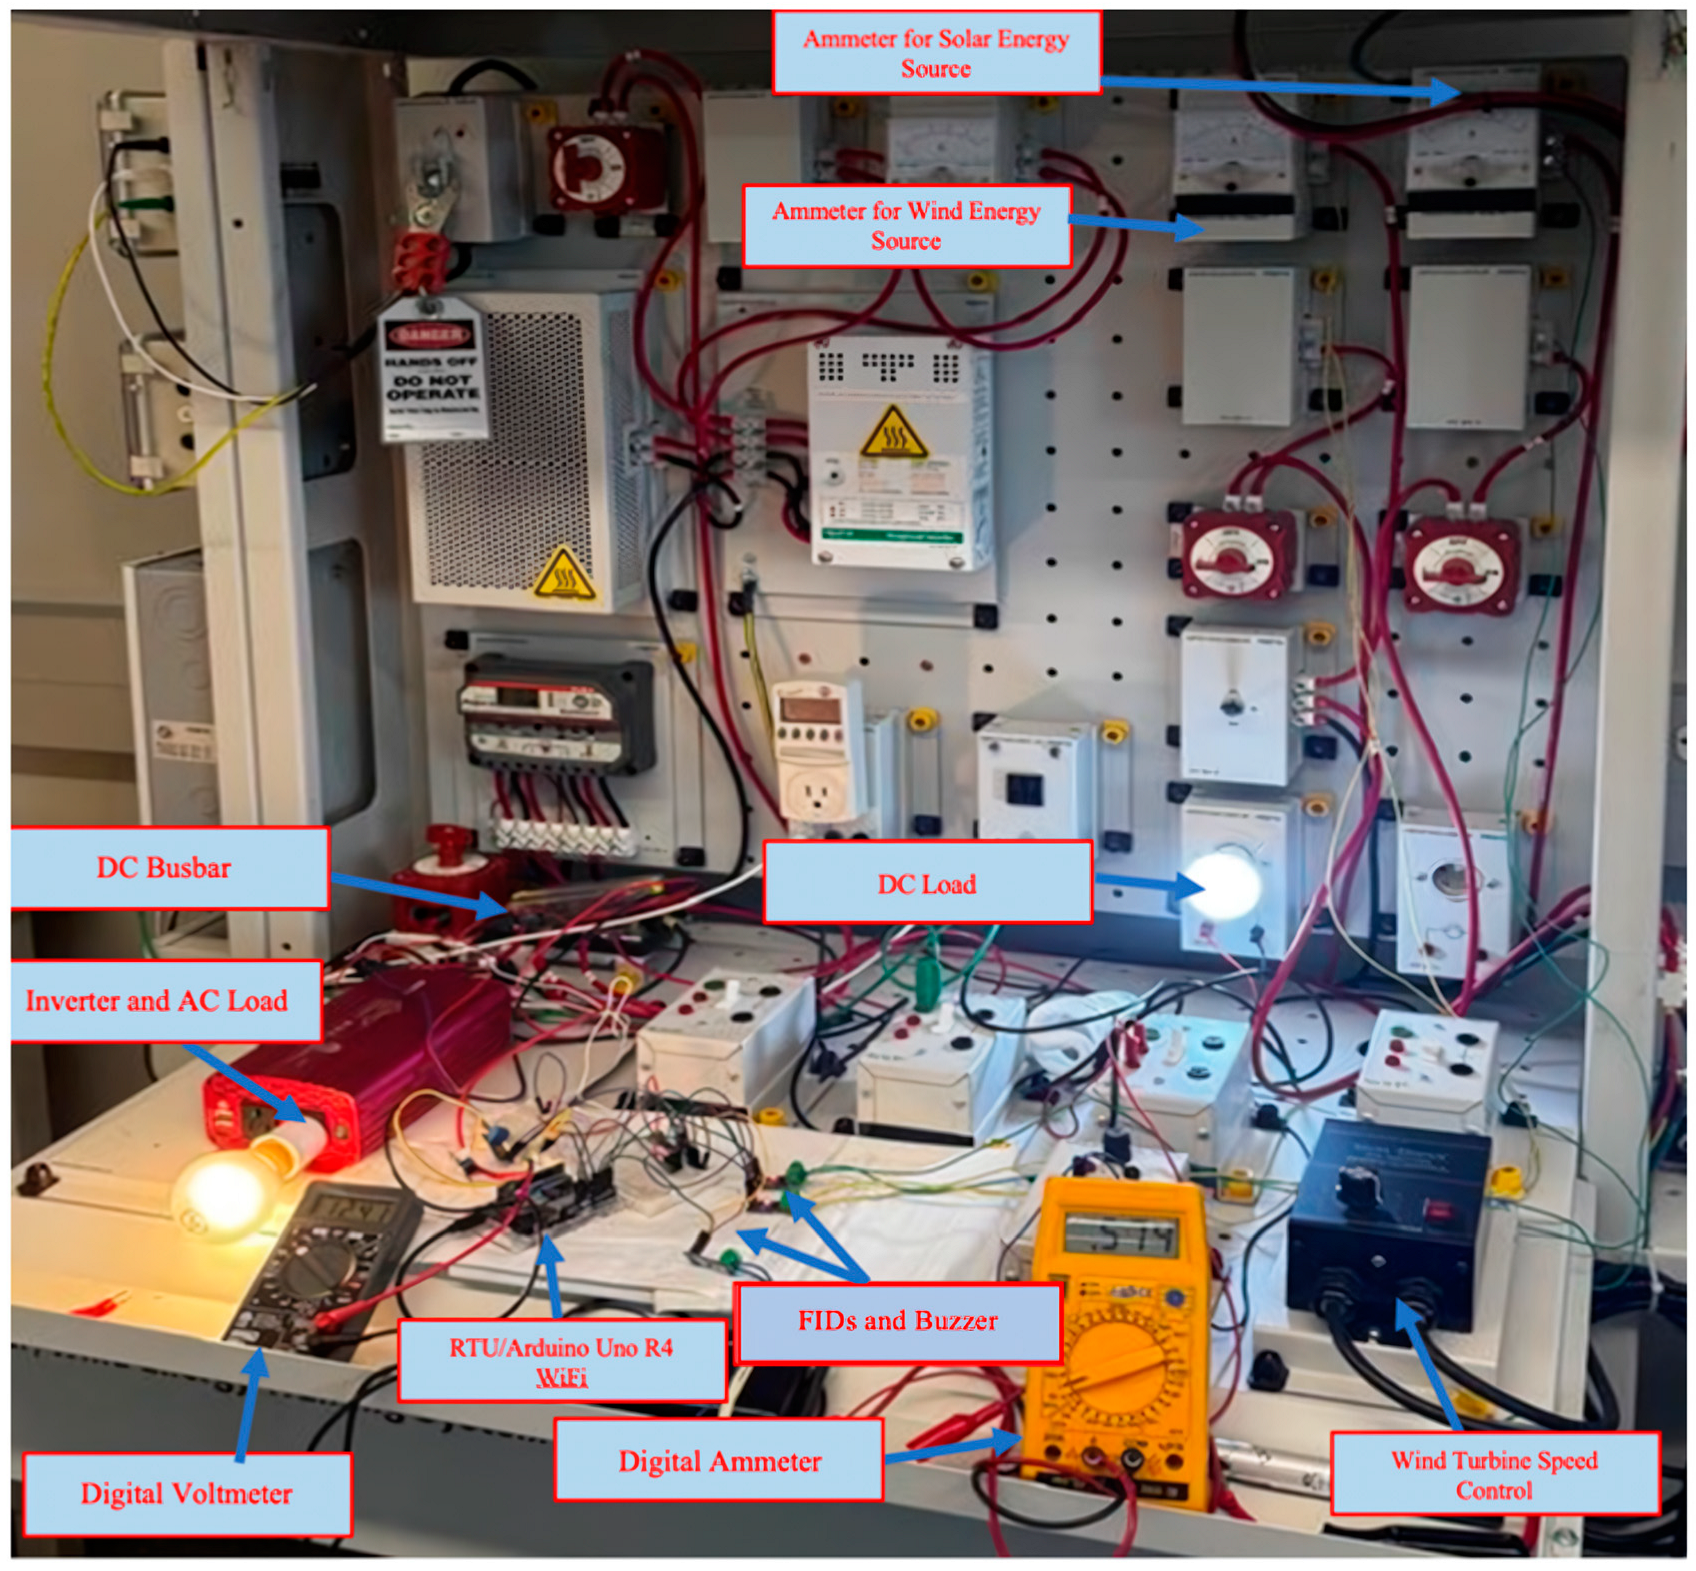
The performance of any SCADA system is determined by the success of the hardware in carrying out its tasks. In this section, the ability of the hardware to read voltages and currents is assessed. The experimental setup of the proposed SCADA system is shown in
Figure 10.
Using the above-stated hardware and operating principles, real-time readings and measurements were obtained from an hour-long testing and data logging session sub-divided into six parts of ten minutes each. The experiment was conducted in the Renewable Energy Laboratory at the Memorial University of Newfoundland.
The FIDs were connected to the Arduino, and these relate to the MTU, which is a laptop computer. Separate hybrid power supplies were read by the FIDs. A 12 VDC Light Emitting Diode (LED) bulb was used as a DC load to generate the load current. A 65 W incandescent bulb was used on the AC side as a load. After connecting all the field devices to the RTU, it was connected to the MTU wirelessly via a WLAN network which provided communication and transmitted data onto the Arduino cloud.
The system was energized for one hour, and data logging was performed. During the testing of the system, different digital multimeters were connected to points of interest to observe the value of the parameters. Various dashboards were created to observe the trend of different values and to create a user-friendly environment for observations.
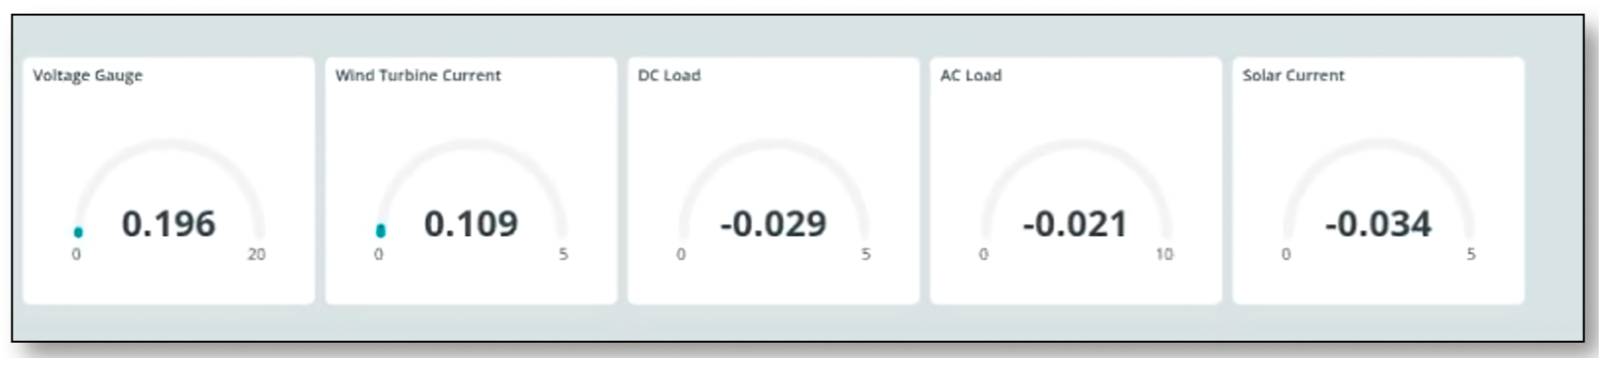
Figure 11 displays results from the first ten minutes, specifically 10:50 a.m. to 11:00 a.m. At initial conditions, values from the system were captured with all power sources disconnected. Readings from each of the sensors are as displayed above. The voltage sensor from the battery terminal read 0.196 V; the current from the wind turbine sensor read 0.109 A; DC and AC Load current sensors readings were both approximately −0.02 A, whereas the solar current sensor displayed a value of −0.034 A. The slight deviations of these readings from zero can be attributed to default zero errors of the sensors. These deviations were minimized as much as possible by means of calibrations in the Arduino code.
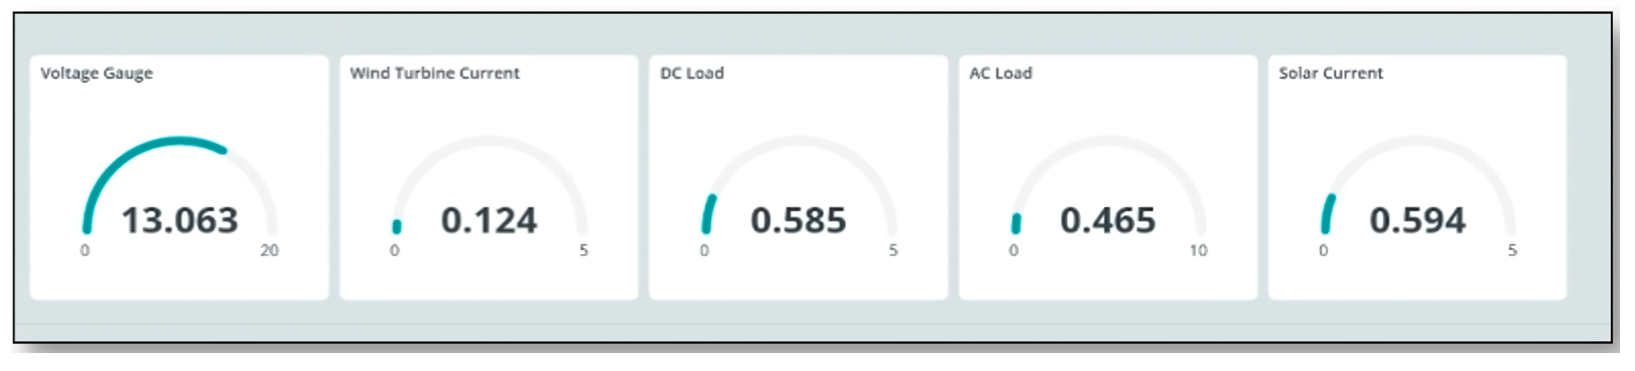
The values obtained between 11:00 and 11:10 a.m. were as displayed in
Figure 12. The system was energized, and separate conditions were applied to each test variable. Voltage across the battery terminal was optimal (13.063 V). The wind turbine was run at 20% of its total rated speed; DC load was made active, with its sensor displaying a value of 0.585 A. The inverter was run at no load, and the value obtained was 0.465 A. The solar panels were in full operation, recording a current of 0.594 A.
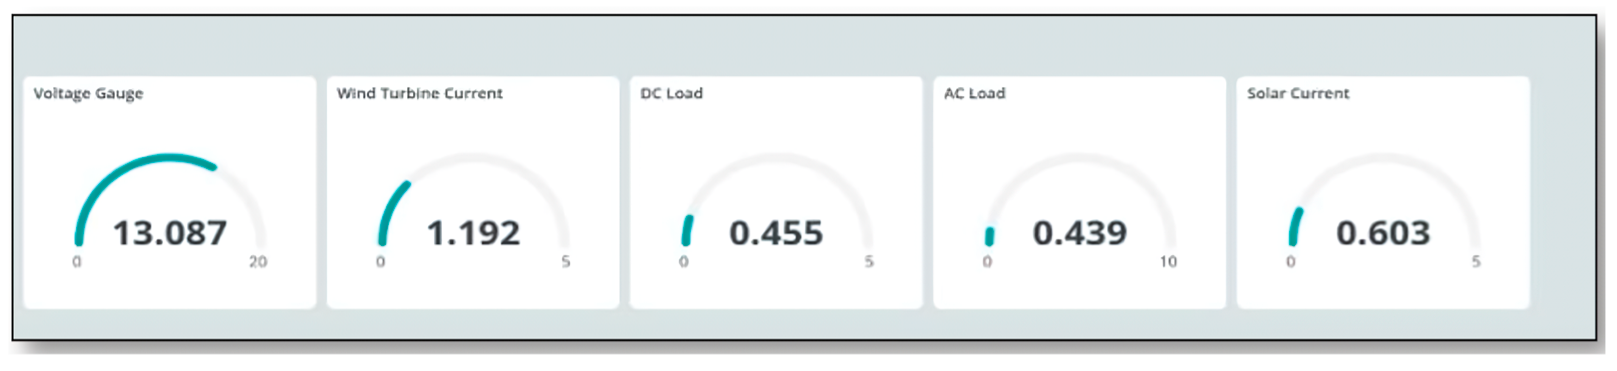
As shown in
Figure 13, the period from 11:10 to 11:20 a.m. had all conditions maintained as in the previous ten minutes, except for the wind turbine running at 40% speed. Accordingly, an increase was observed in the wind turbine current generated, producing a reading of 1.192 A.
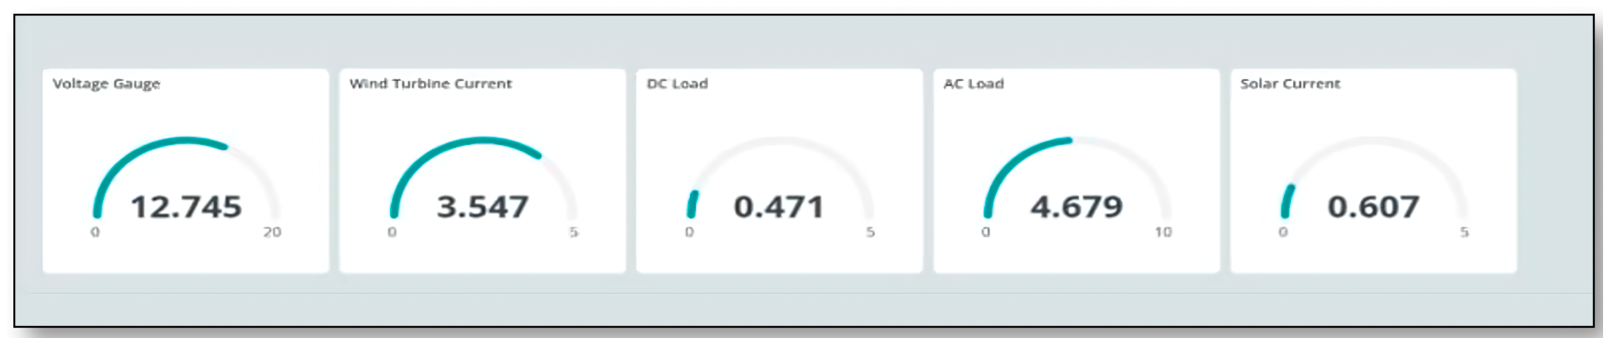
Figure 14 captures the fourth session from 11:20 to 11:30 a.m. The voltage, DC load, and solar panel conditions remained in the same condition as the previous ten minutes. The wind turbine had its speed increased to 60%, resulting in an increase in current of about 2.355 A, about twice what was obtained at 40% speed (1.192 A). The AC load was connected, resulting in a rise in the current reading from its sensor from 0.439 A to 4.679 A.
In
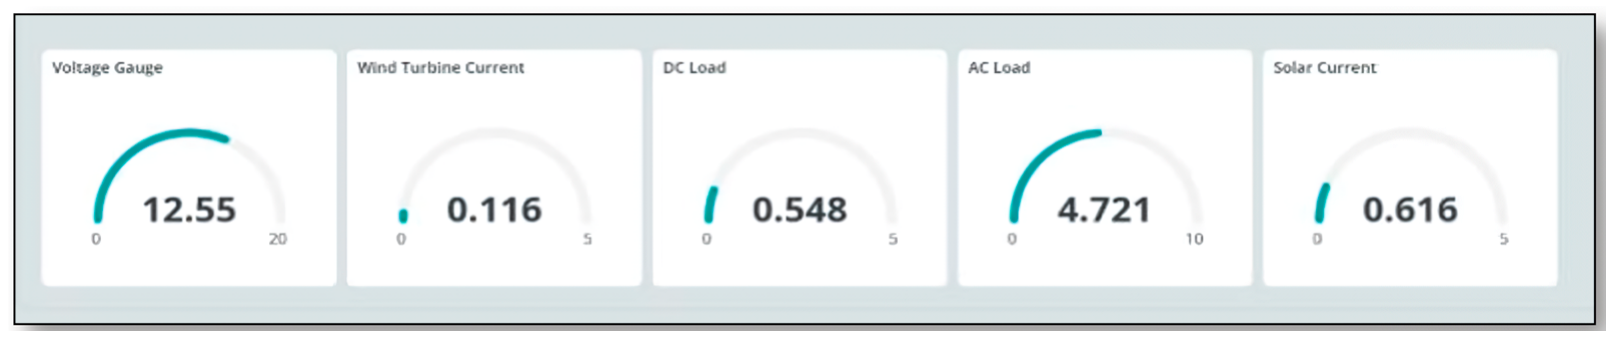
Figure 15, measurements are displayed for the period between 11:30 a.m. and 11:40 a.m. All system conditions were maintained as in the previous ten minutes, except for the wind turbine being disconnected. The wind turbine current decreased significantly to approximately 0.1 A from its prior value of 3.547 A.
Readings in
Figure 16 are for the period between 11:40 a.m. and 11:50 a.m. During this time, the entire system was de-energized once more. The readings of the system are like that obtained during the first ten-minute period. It was also observed that the voltage did not die down to a near zero value instantaneously. As a result of charges stored at the battery terminals from the capacitive elements of the circuit, dissipation is prolonged.
6. Results and Discussion
On each graph, the timestamp data for each parameter is displayed. These data can be matched to corresponding dashboard readings that have been discussed earlier. With no power source, the voltage graph in
Figure 17 shows 0 volts as expected. From 11:00 to 11:40 when the system was powered, the voltages recorded values slightly above 12 V, as shown on the corresponding dashboard gauges. The values returned to zero as the system was de-energized during the final ten minutes of the experiment.
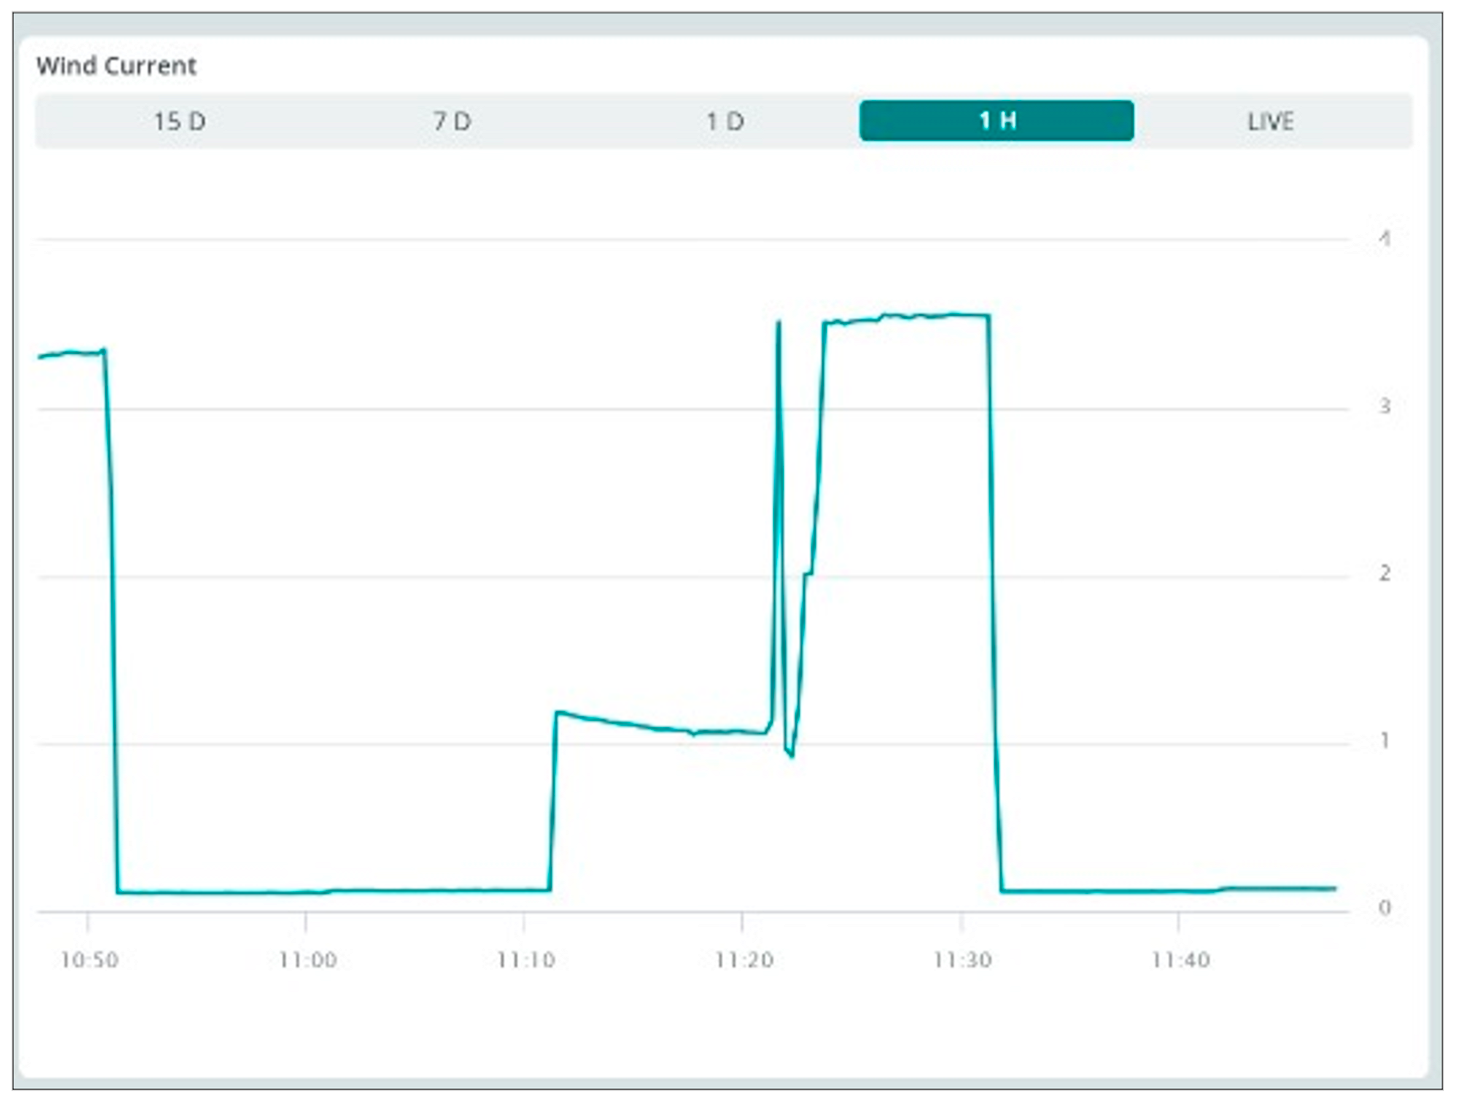
From 10:50 to 11:00 a.m., the turbine was off, and it shows an almost zero value. This is shown in
Figure 18. A slight increase in the current is seen in the next ten minutes as the speed was set to 20%. For the period from 11:10 to 11:20, the speed was now raised to 40% and the current rises to values above 1 A. The following ten minutes see values above 3 A for a turbine speed of 60%. The speed of the wind turbine was set to zero for the final twenty minutes, and this can be observed on the graph.
In
Figure 19, it was observed that the values of the DC load current are close to zero, as the system had not been powered yet. Once it was powered, the DC load source was maintained constant for forty minutes, and this can be seen as the period from 11:00 to 11:40. The system was returned to the initial conditions, and the DC load current returned to initial values.
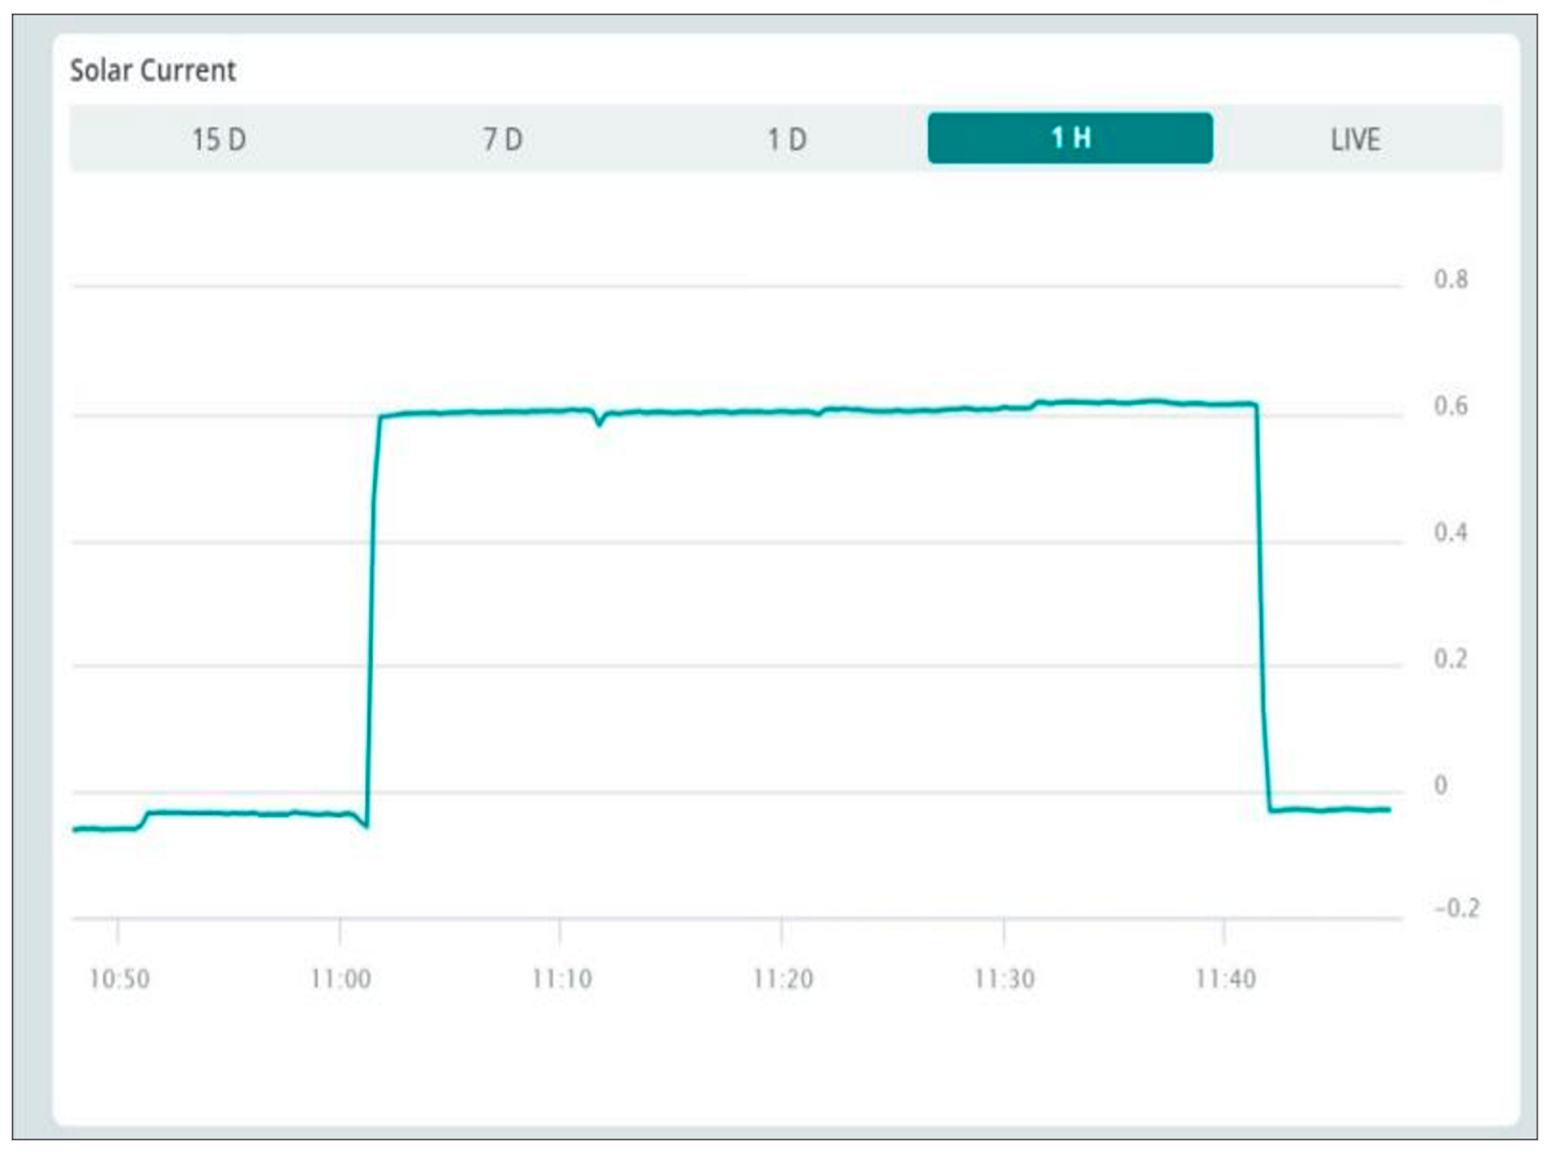
For the PV panel current measurements, approximately zero readings were recorded from 10:50 to 11:00, as the system had no power supply. The PV panel power was kept on for the next forty minutes, and it can be seen from
Figure 20 that current was constant for that period. The last ten minutes of the experiment has the current falling back to its initial values, as the system was de-energized once more.
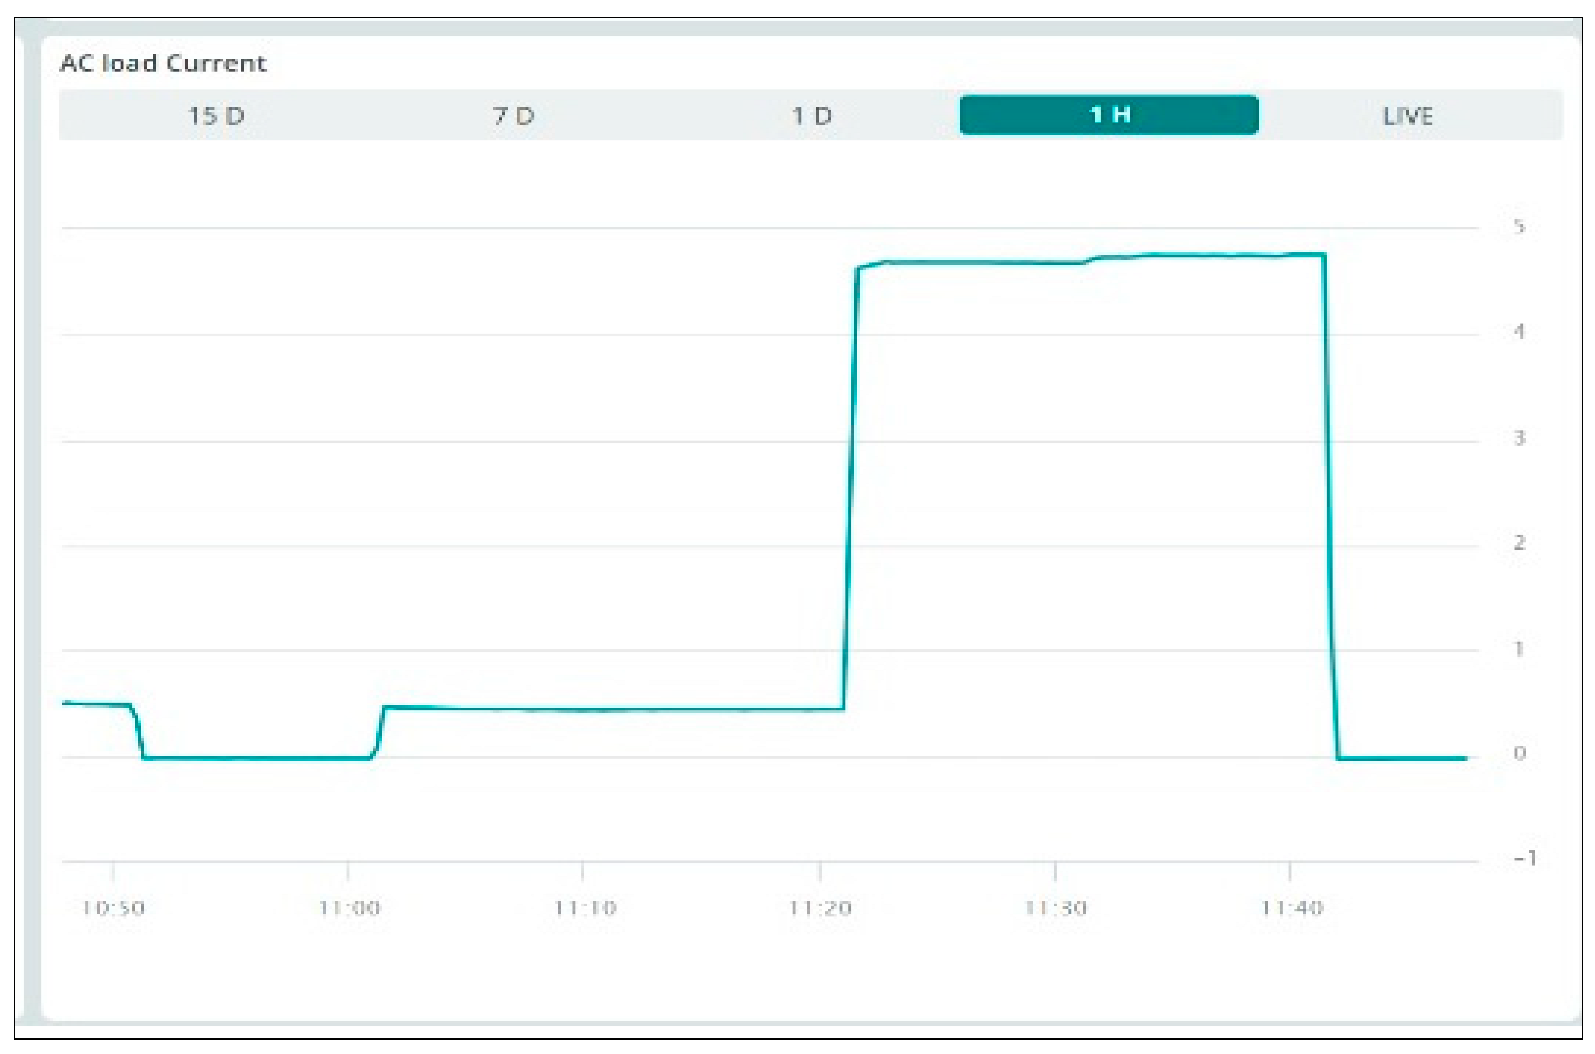
The graph in
Figure 21 depicts the behavior of the AC load under various conditions. In the first ten minutes from 10:50 to 11:00, the values measured as AC load current were zero since the system was off. From 11:00 to 11:20, the inverter was energized at no load (bulb), and current values were of approximately 0.5 A. From 11:20 to 11:40, a load was connected to the inverter. This caused recorded current values of 4.5 A, indicating an 800% increase in current. The current returns to the initial condition during the final ten minutes as the system is shut off.
7. Conclusions
SCADA systems, with their efficient monitoring and control of energy systems in remote locations, provide a reliable platform. The ability to log data, monitor events and initiate control actions not only manages a power system but gives the system operators a secure platform to easily visualize systems data in a graphical format on a robust dashboard from any geographical location in the world through enhanced IoT infrastructure. The SCADA system designed for Cartwright’s proposed hybrid power system demonstrated the ability to log data in real-time and transmit via the cloud interface. It was achieved using five sensors to read the voltage and current of crucial systems components.
The Arduino R4 UNO Wi-Fi module costs CAD 27.50; four units of ACS 712 current sensors cost a total of CAD 15, at about CAD 3.75 per sensor; one unit of a MH electronic voltage sensor is valued at CAD 2. Summing up the above component prices, the total cost comes out as roughly CAD 46.30. This would be the approximate current market cost for all the listed components combined, based on recent prices from reputable electronics retailers at the time research was conducted. The cost is significantly less than those in the reviewed literature and most proprietary SCADA hardware and software, which implies the economic viability of the research.
In this paper, extensive experimental validation confirmed the accuracy and reliability of the IoT-enhanced SCADA system. Here, the voltage and current measurements from the IoT-SCADA setup closely matched those from multimeter readings, indeed proving that the sensor calibration process was effective. Also, real-time monitoring of battery voltage, wind turbine current, PV current, and AC/DC loads was successfully implemented, demonstrating the system’s capability to track energy flow.
For data security, the use of WPA2 encryption in the network architecture addressed security concerns, making the enhanced IoT-SCADA system more robust against cyber threats compared to other open-source SCADA implementations.
Finally, the alert mechanism which is activated in the event of under-voltage readings in the battery terminals at a threshold of 12.3 V successfully triggered intervention from the operators to take action to ensure the reliability, minimize downtime, and maximize the use of the power sources. The buzzer control feature also introduced an additional layer of safety that ensures the battery storage system is not discharged critically to ensure longevity. While the buzzer is not directly tied to current readings in the code, it can be programmed to signal issues like over-current.
Future work would consider incorporating an algorithm to auto-start and disconnect the generator based on analyzing received signals from the sensor when the battery state of charge is determined. Also, providing timely notification alerts via e-mail and text messages for system faults could be explored. As the worldwide energy landscape metamorphoses toward more intelligent, greener infrastructure, Cartwright stands to gain immensely by adopting this innovation for a sustainable energy future.


