
Optimal Configuration Strategy of PV and ESS for Enhancing the Regulation Capability of Electric Vehicles Under the Scenario of Orderly Power Utilization

Abstract
1. Introduction
- (1)
- An EV charging and discharging load model is developed based on traffic road and distribution network topology.
- (2)
- An optimal configuration model of PV and ESS that accounts for EV travel characteristics is established.
- (3)
- Based on the PV and ESS configuration scheme, an orderly power utilization incentive strategy for EV users is proposed to promote the supply–demand balance of the power system.
2. EV, PV, and ESS Operation Model
2.1. EV Operation Model
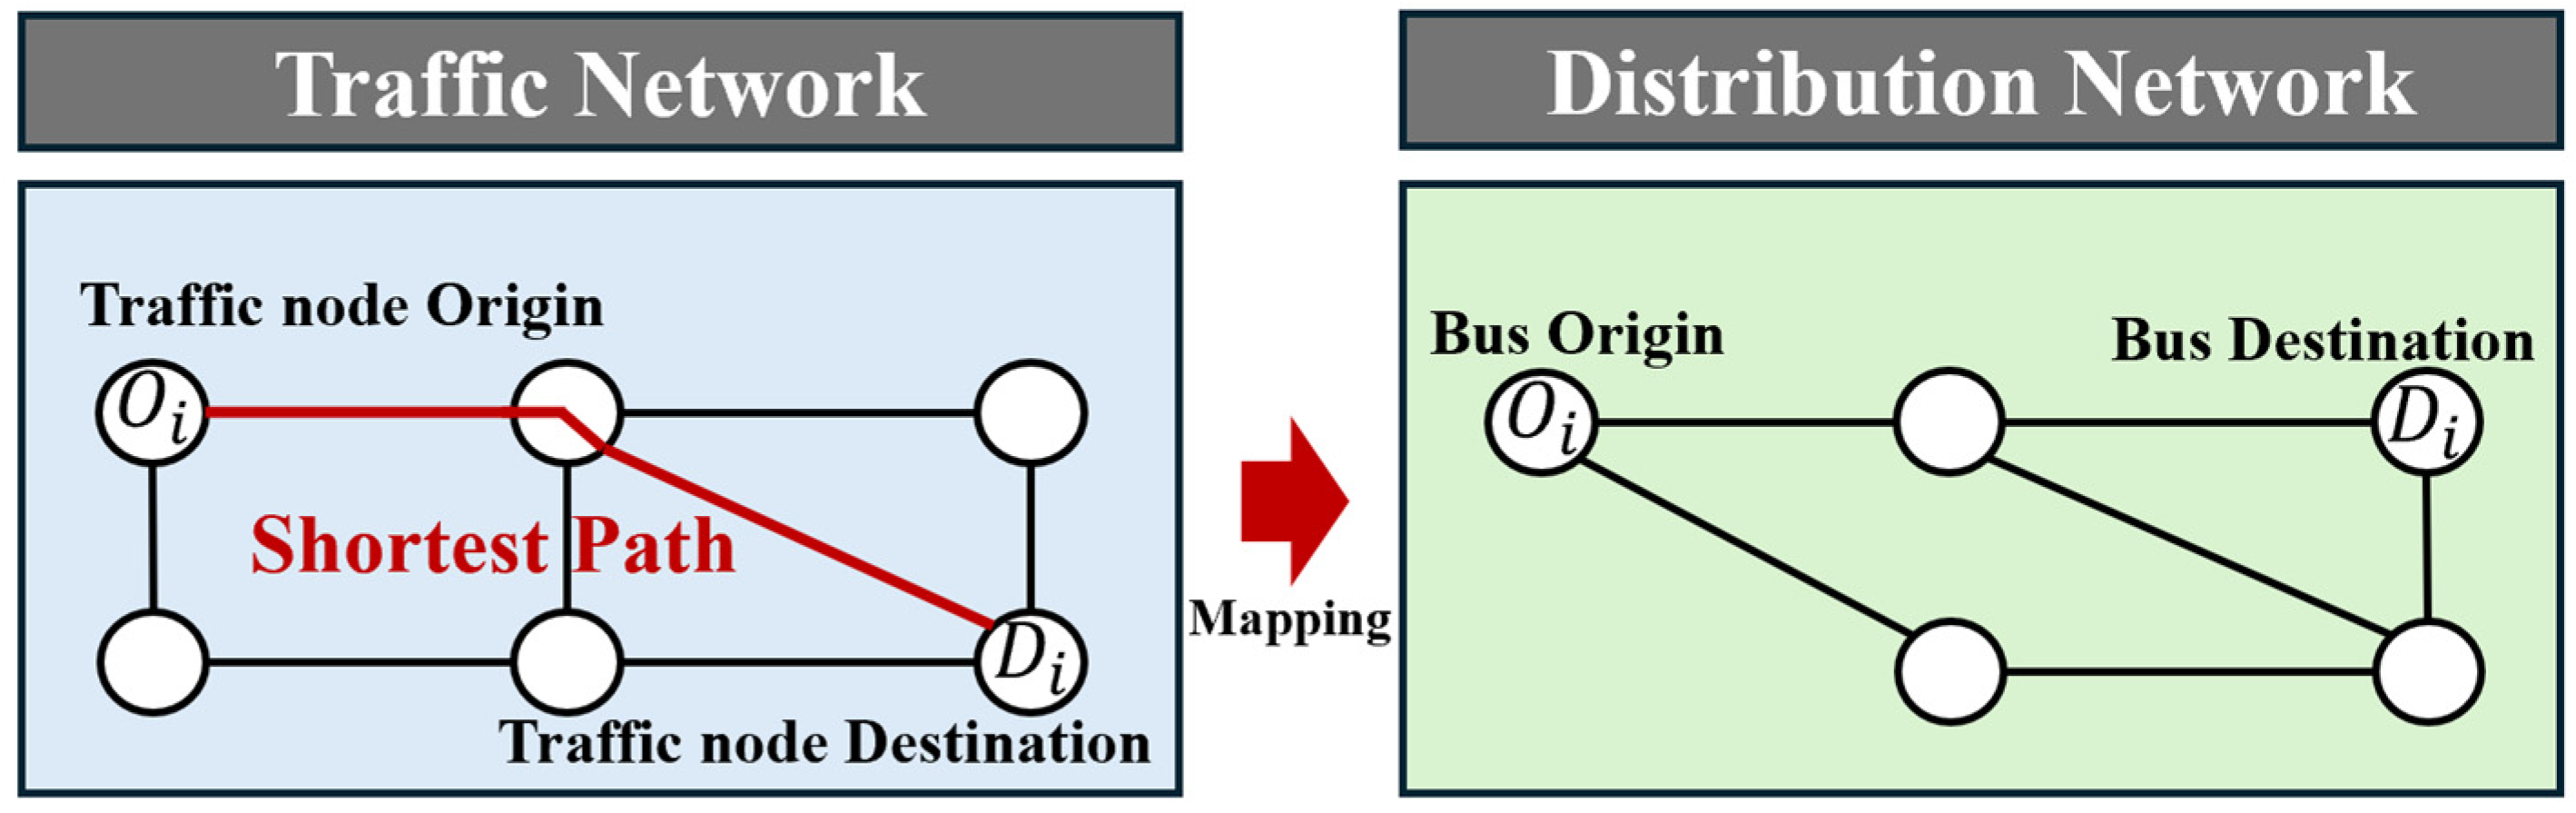
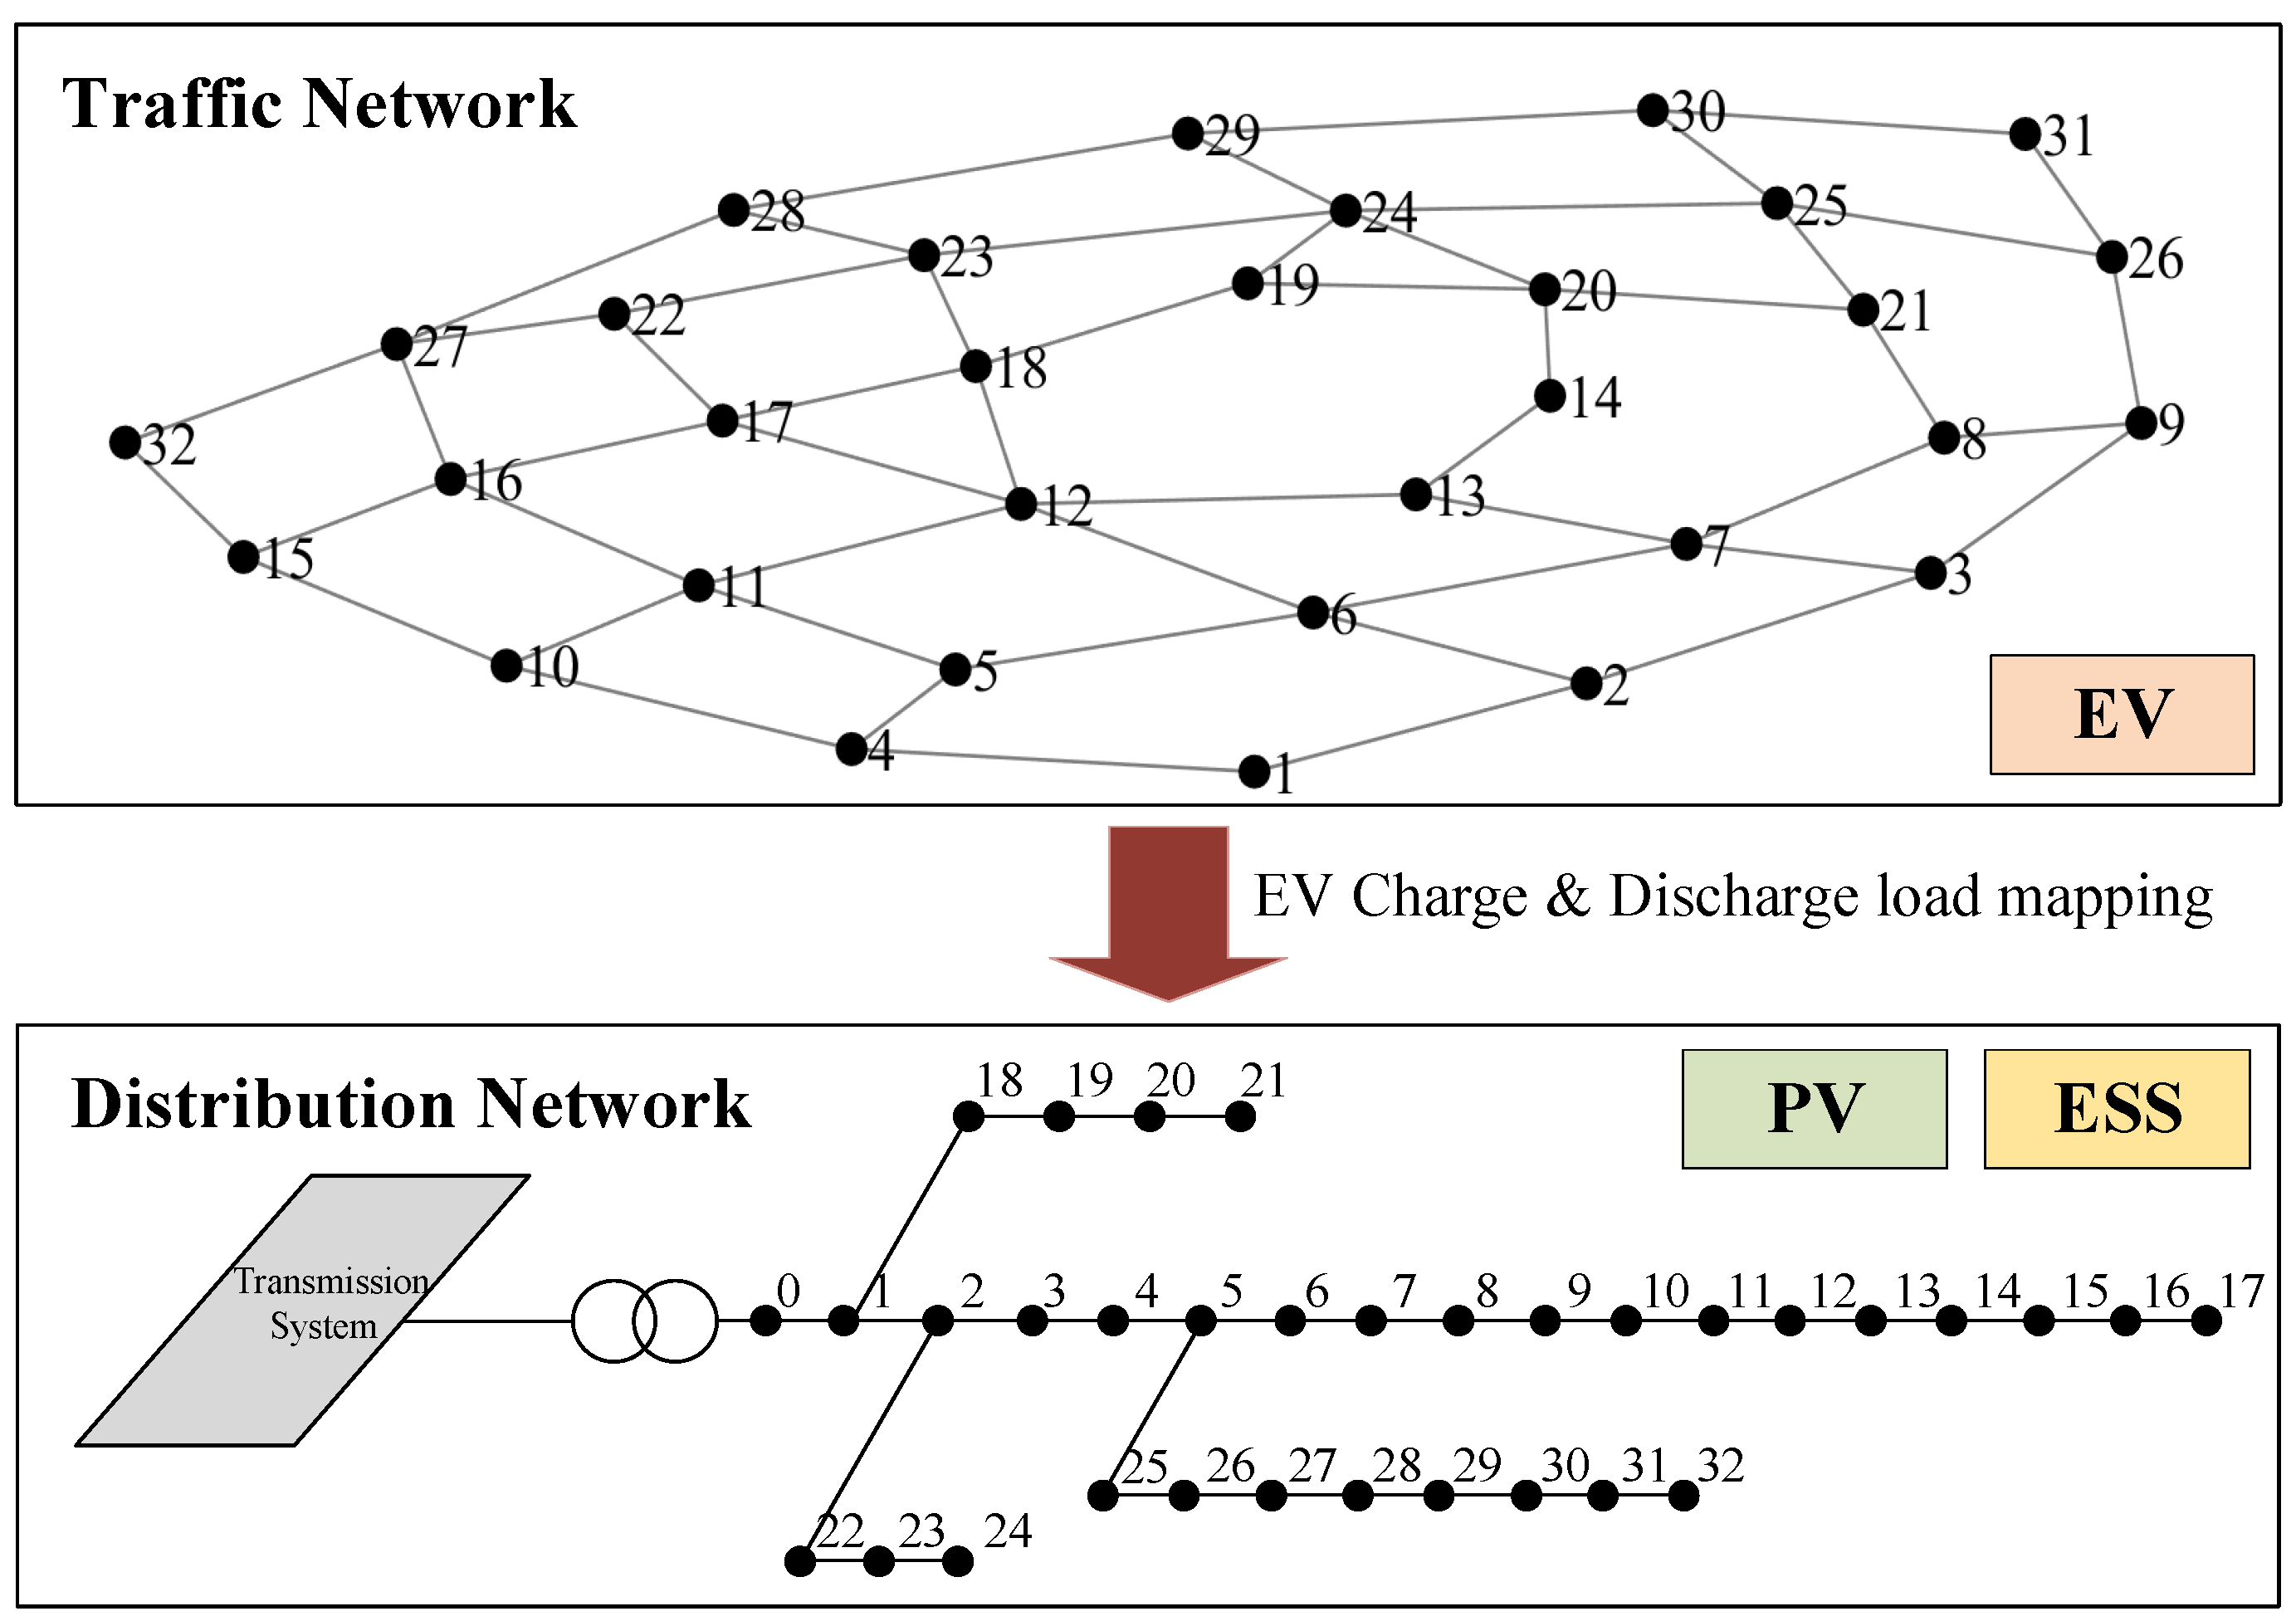
2.1.1. Traffic Network–Distribution Network Model
2.1.2. EV Travel Model
2.1.3. EV Charging and Discharging Model
2.2. PV and ESS Operation Model
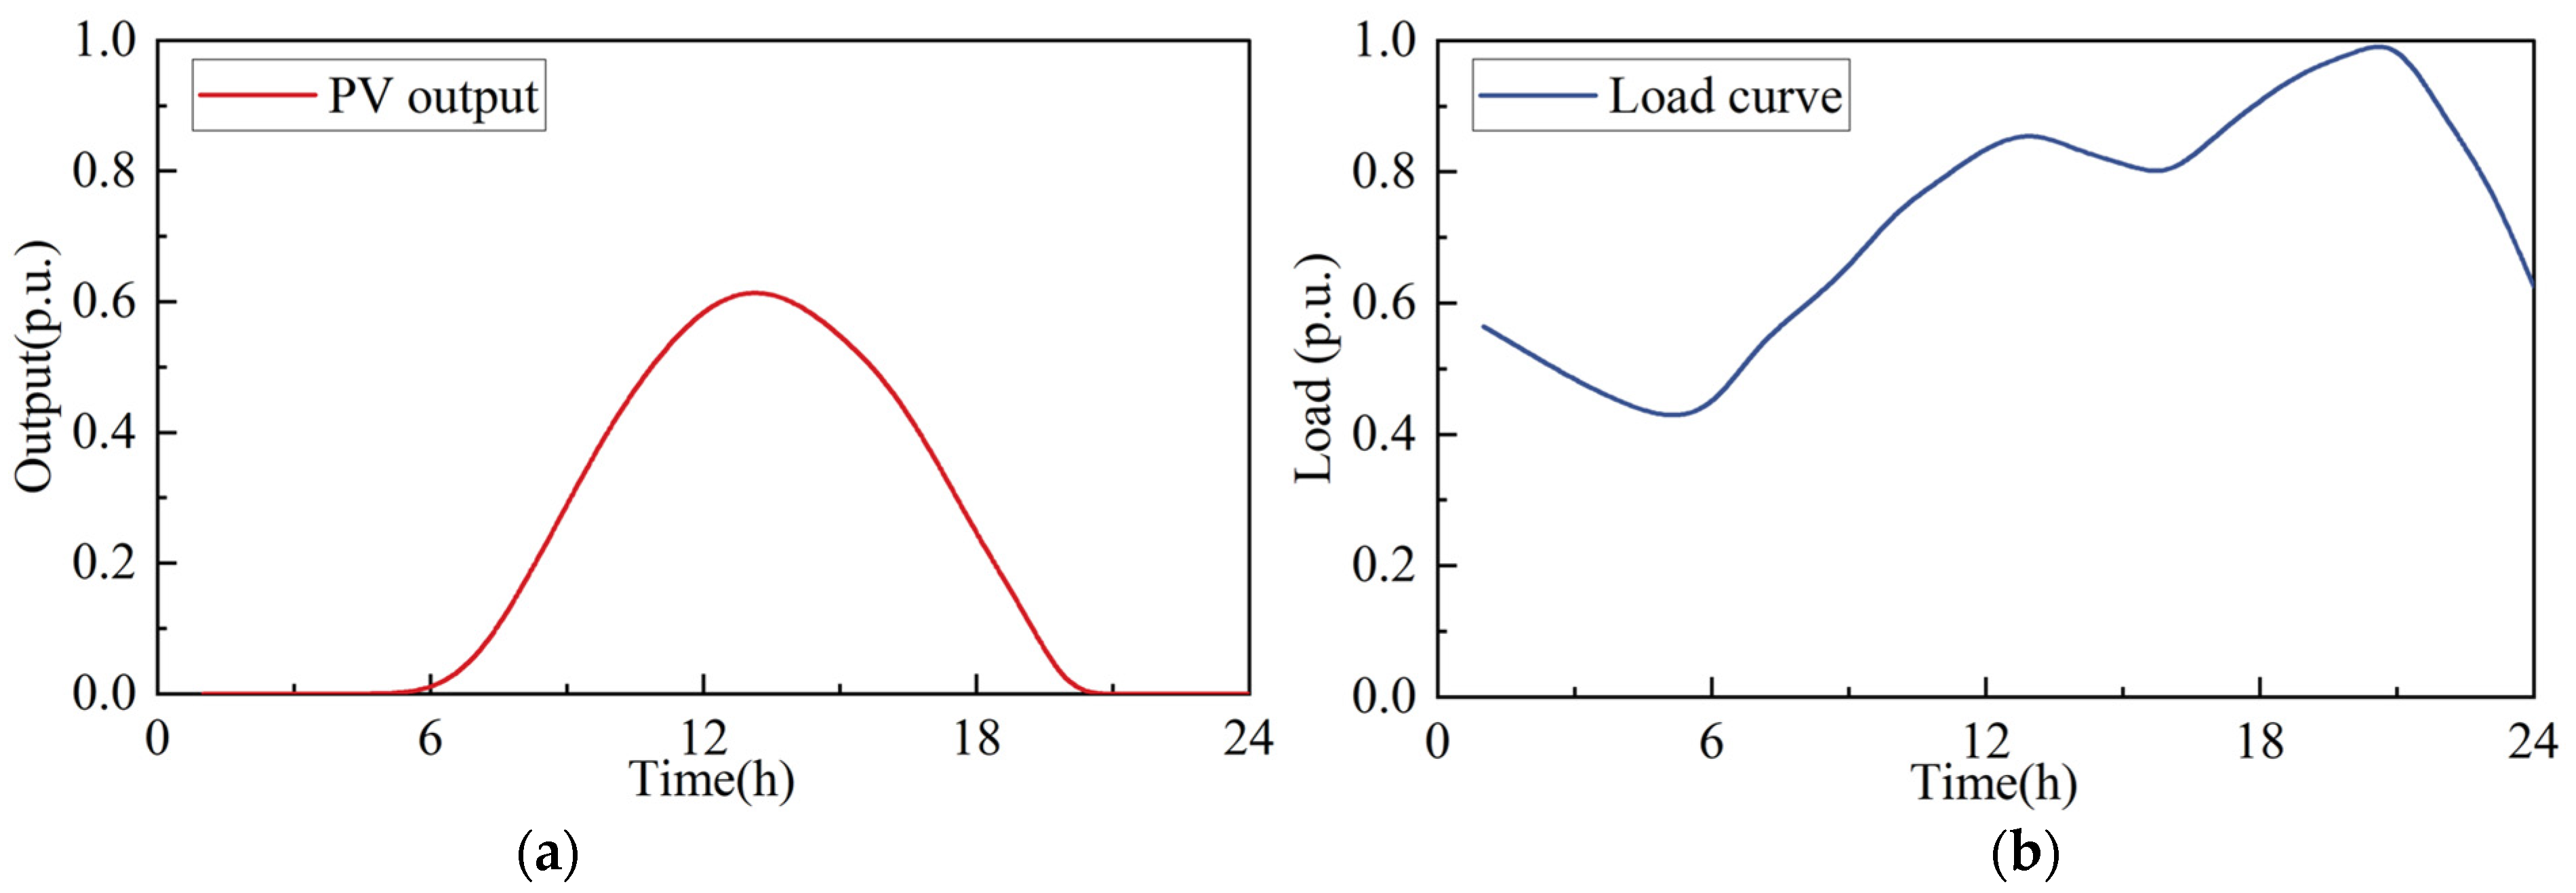
2.2.1. Distributed PV Power Plant Modeling
2.2.2. Energy Storage System Modeling
3. PV and ESS Optimal Configuration Model
3.1. Objective Function
3.2. Constraints
4. EV Power Utilization Incentive Strategy
4.1. EV Objective Function
4.2. EV Constraints
5. Example Analysis
5.1. Simulation System Establishment
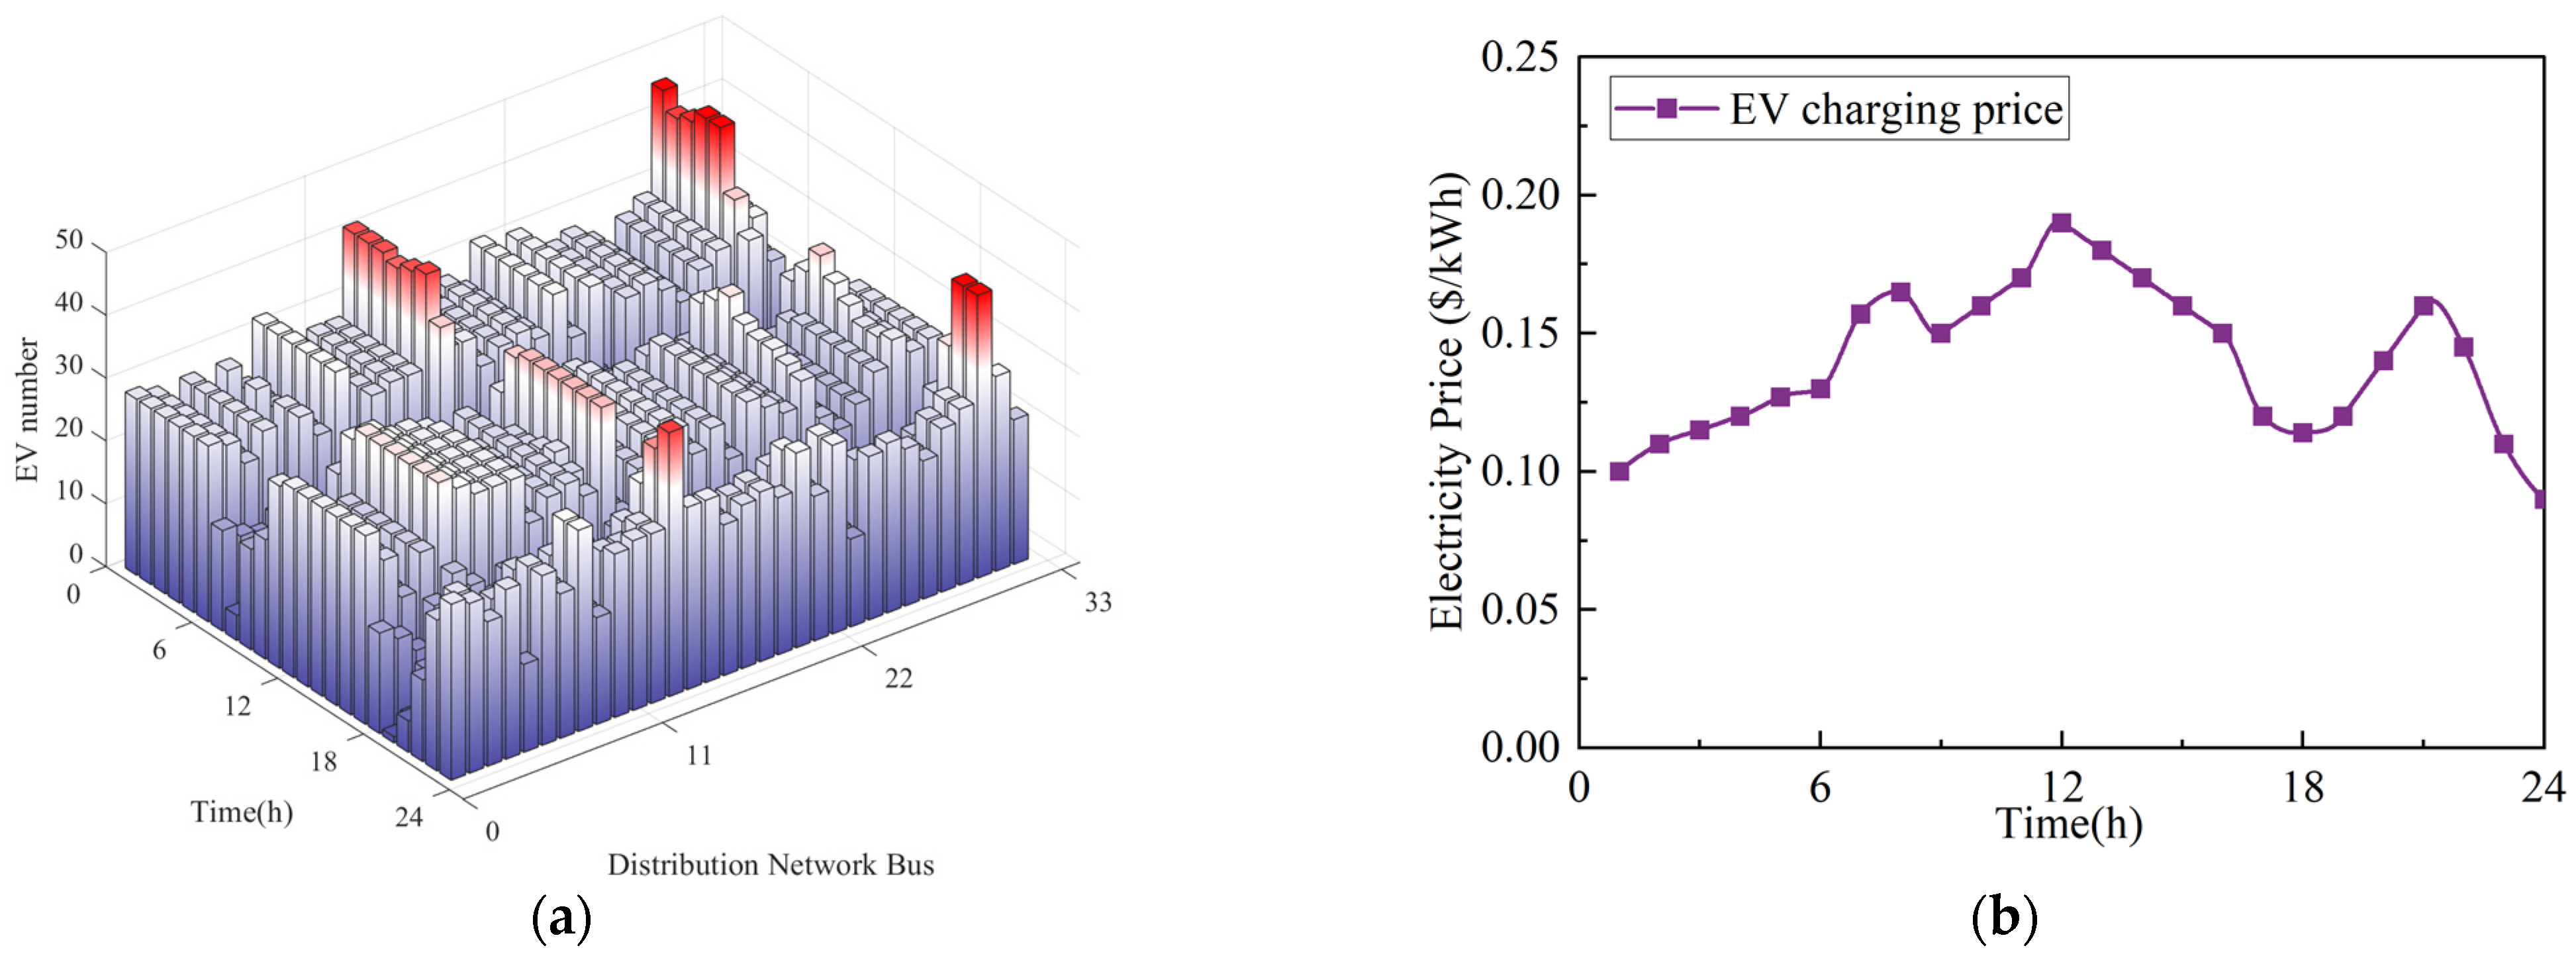
5.2. Results Analysis
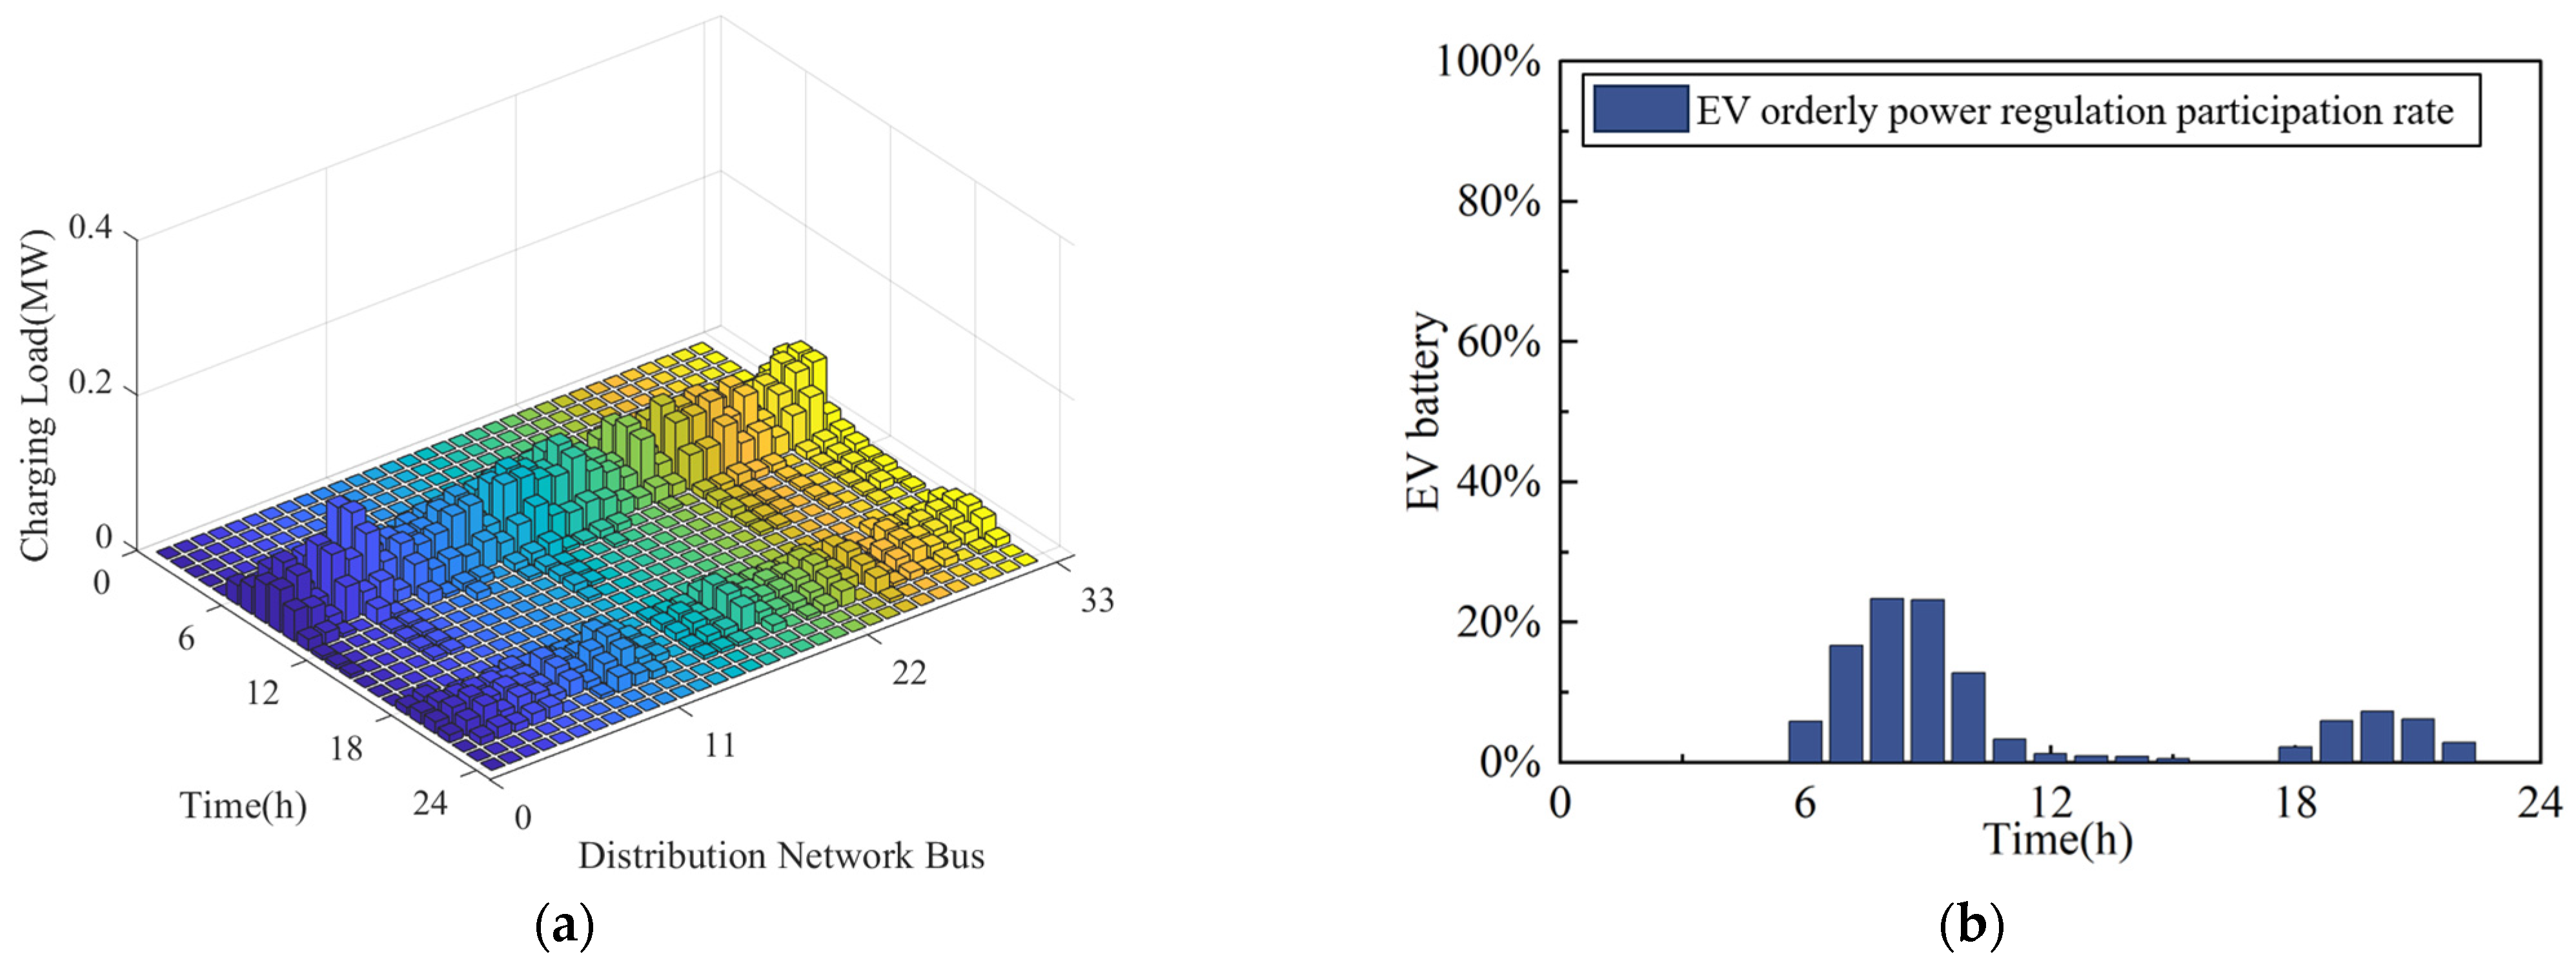
5.2.1. Scenario 1
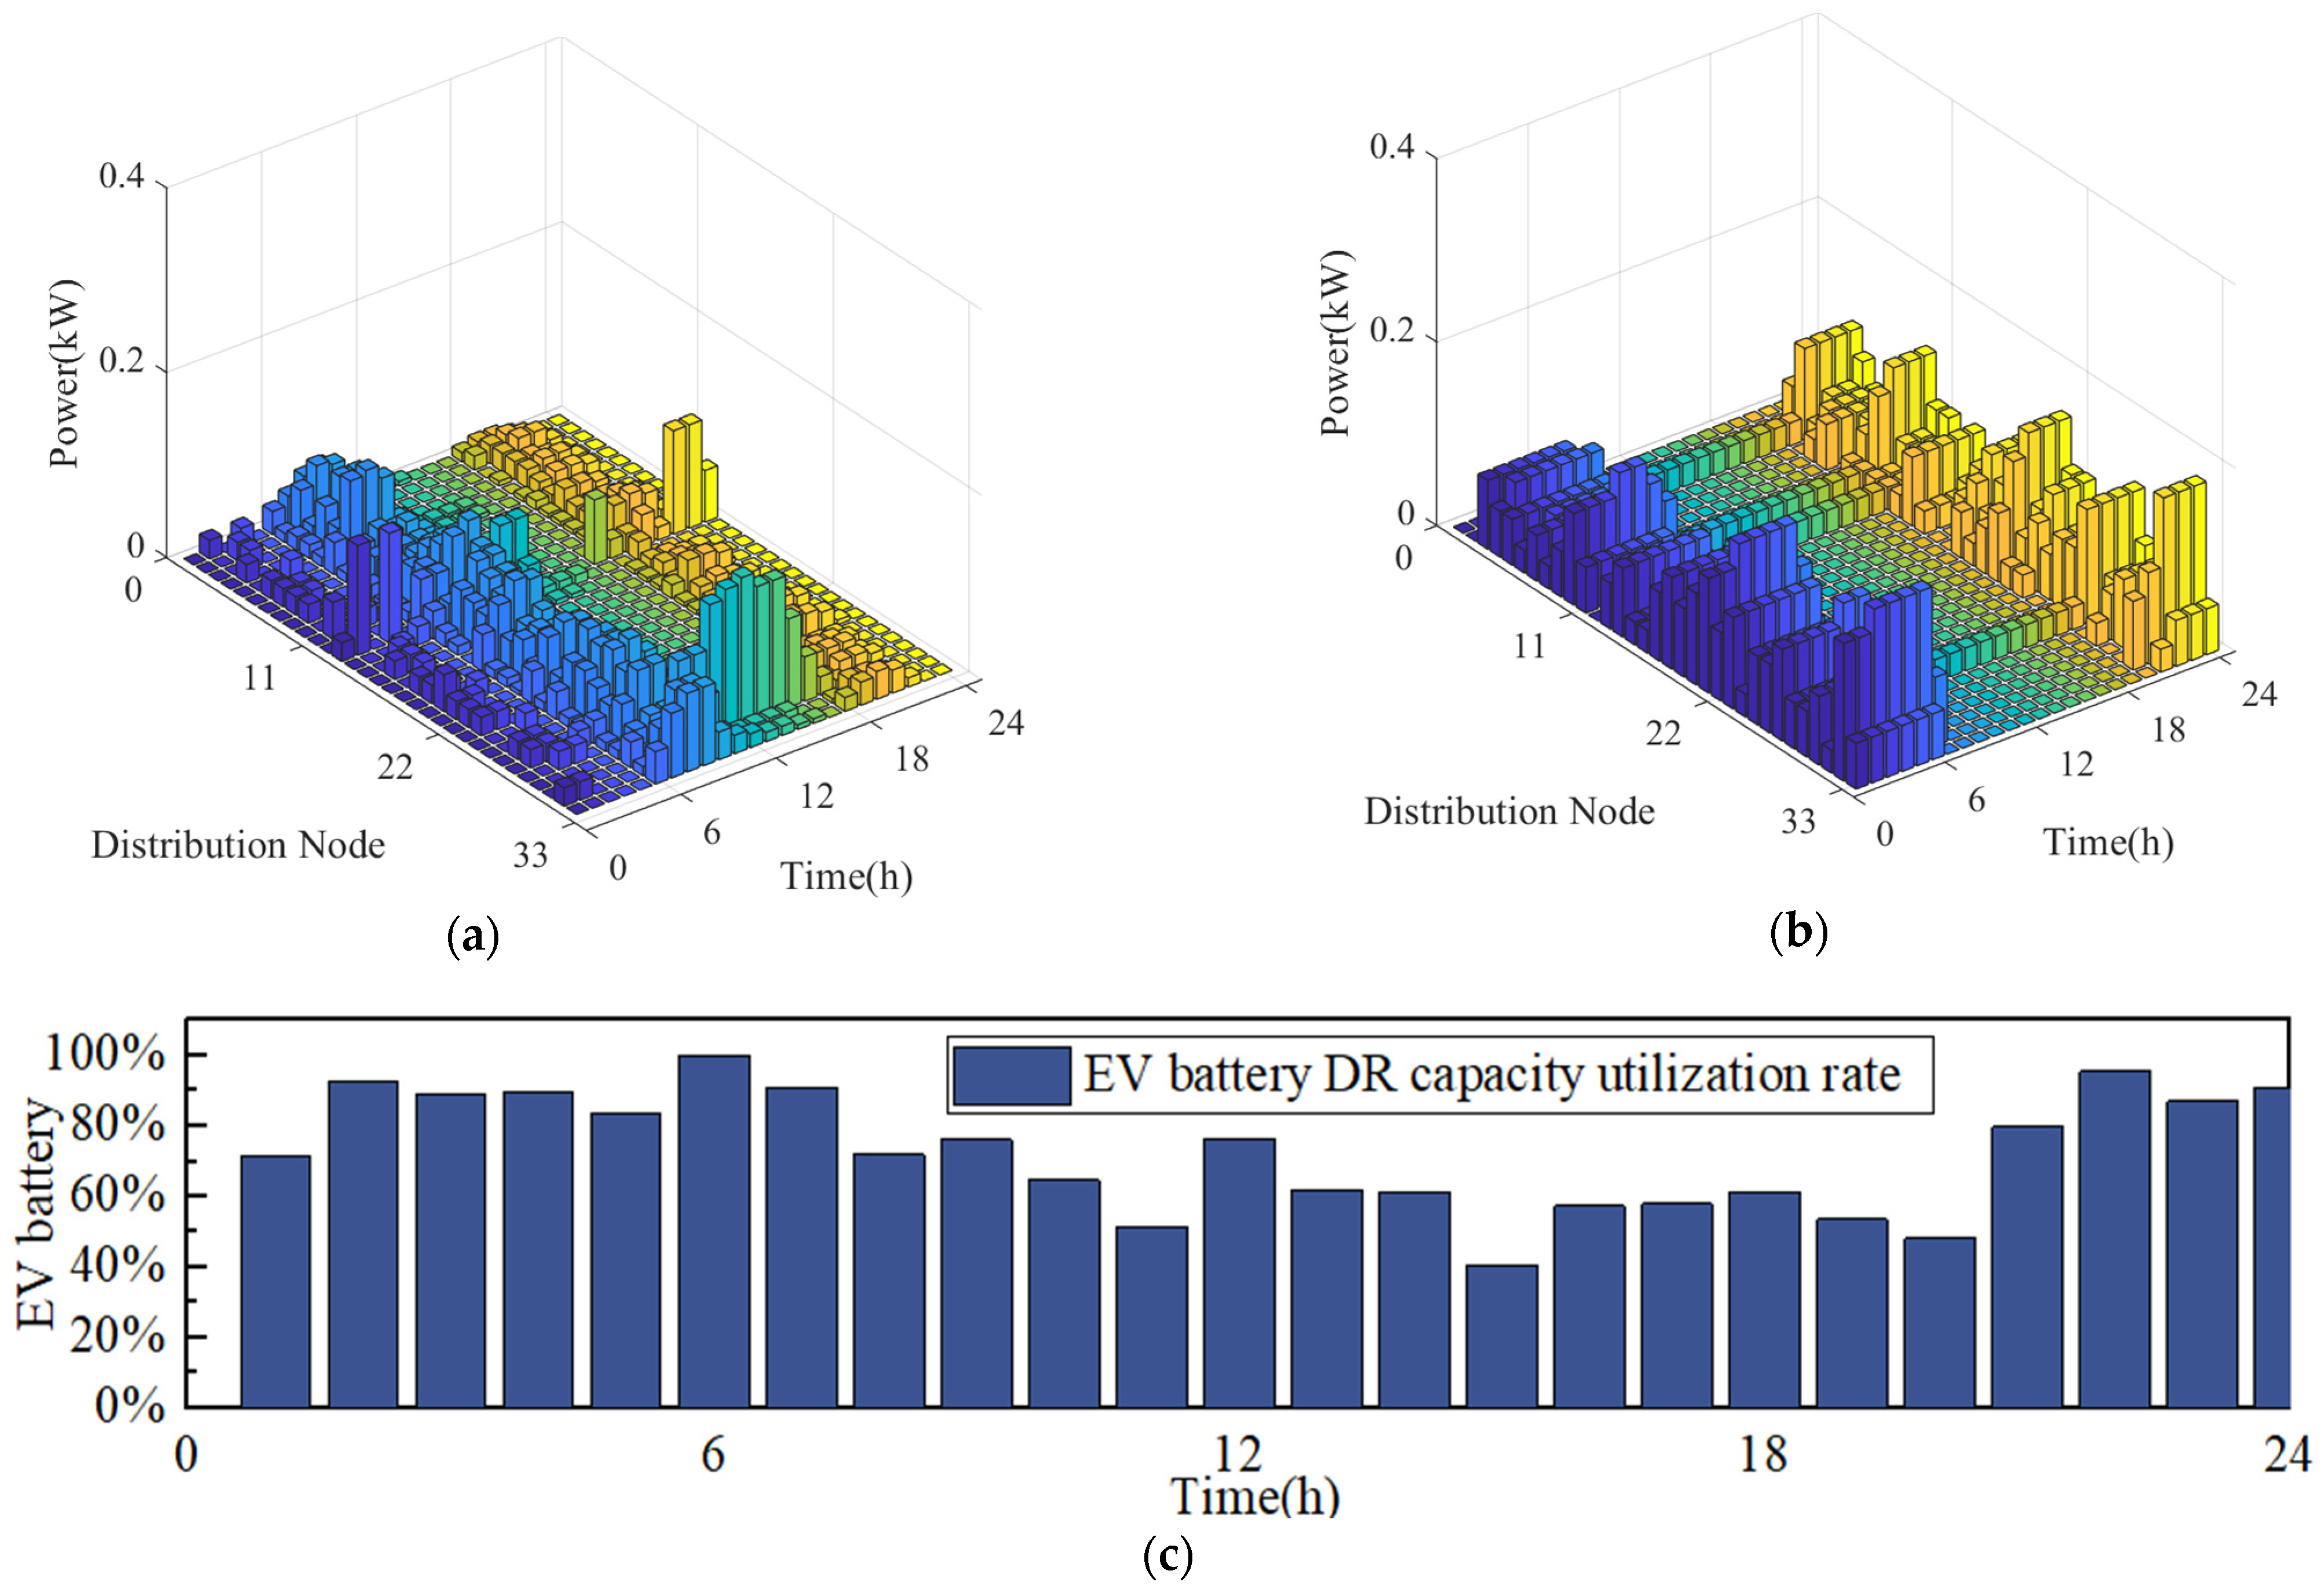
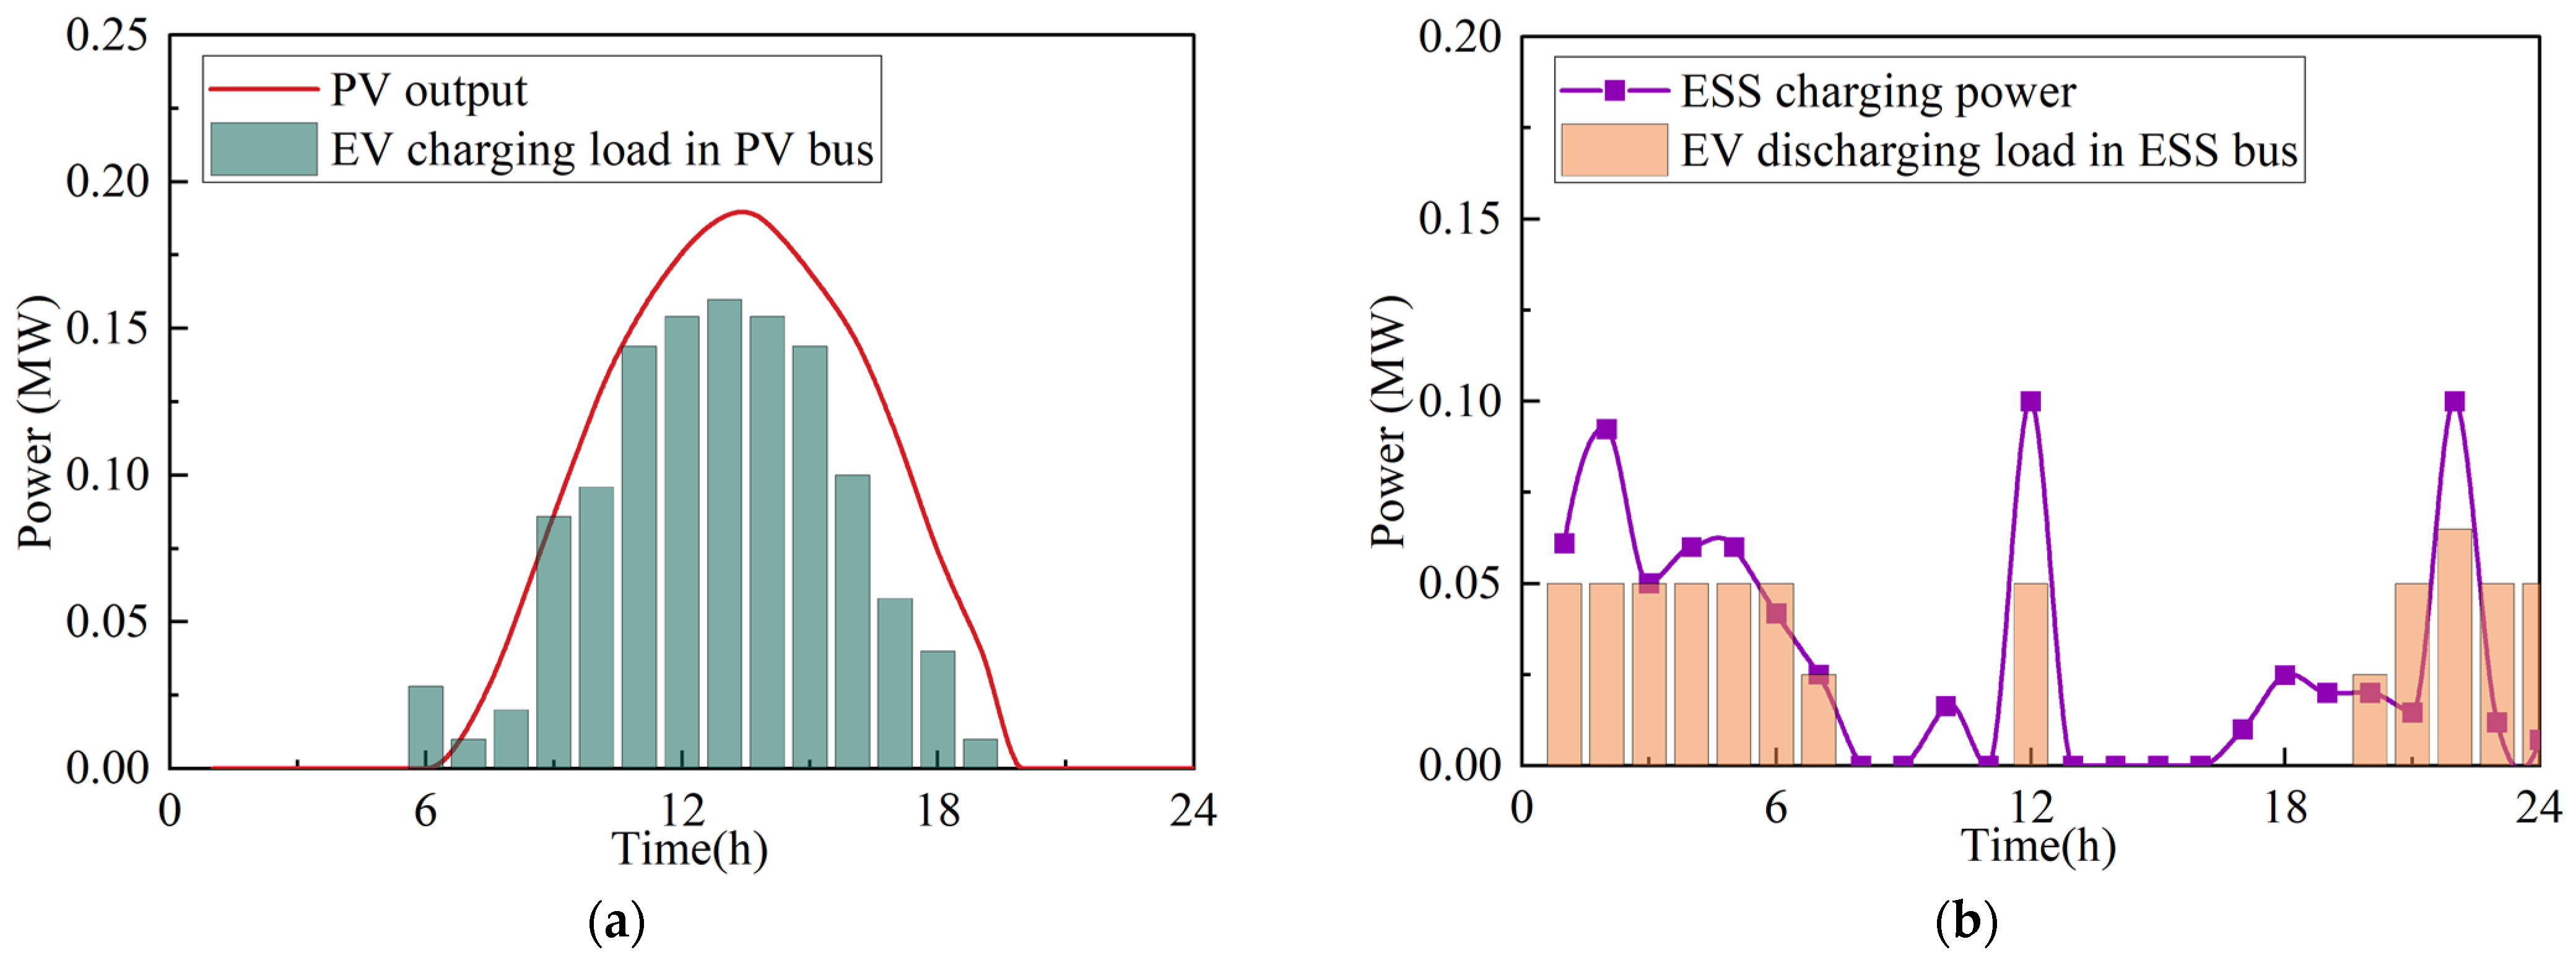
5.2.2. Scenario 2
6. Conclusions
- (1)
- By implementing electricity price incentives, EV users can be effectively guided to participate in orderly power utilization, reducing the pressure on renewable energy consumption. As shown in the simulation results, the regulation capacity utilization rate of EVs increased from 30% to 95%, achieving negative cost travel. Additionally, the participation rate of EVs in the consumption of distributed photovoltaics reached 100%.
- (2)
- The charging and discharging behavior of EV users can closely match the output of renewable energy, promote the balance between supply and demand, and play a coordinating role between PV and ESS configuration to improve the economic efficiency of EV operation. In the scenarios considered in this paper, the operation of electric vehicles (EVs) is taken into account to further reduce the configuration costs of distributed resources.
- (3)
- The OD travel matrix model of EVs is used to simulate the daily travel demand of EV users. The modeling of EV charging and discharging characteristics is more precise, which can accurately simulate the SOC state of each EV user, so as to evaluate the surplus capacity of EV users for OPU.
- (4)
- By incorporating the number and capacity of EVs, the configuration location of DERs can be modified, which can effectively improve the interaction depth between EVs and DERs.
Author Contributions
Funding
Data Availability Statement
Conflicts of Interest
References
- Esmaeilnezhad, B.; Amini, H.; Noroozian, R.; Jalilzadeh, S. Flexible Reconfiguration for Optimal Operation of Distribution Network Under Renewable Generation and Load Uncertainty. Energies 2025, 18, 266. [Google Scholar] [CrossRef]
- Zhang, Y.; Shotorbani, A.M.; Wang, L.; Li, W. Distributed Voltage Regulation and Automatic Power Sharing in Multi-Terminal HVDC Grids. IEEE Trans. Power Syst. 2020, 35, 3739–3752. [Google Scholar] [CrossRef]
- Zhang, Y.; Wang, L.; Li, W. Autonomous DC Line Power Flow Regulation Using Adaptive Droop Control in HVDC Grid. IEEE Trans. Power Deliv. 2021, 36, 3550–3560. [Google Scholar] [CrossRef]
- Zhang, Y.; Meng, X.; Shotorbani, A.M.; Wang, L. Minimization of AC-DC Grid Transmission Loss and DC Voltage Deviation Using Adaptive Droop Control and Improved AC-DC Power Flow Algorithm. IEEE Trans. Power Syst. 2021, 36, 744–756. [Google Scholar] [CrossRef]
- Hu, Q.; Han, R.; Quan, X.; Wu, Z.; Tang, C.; Li, W.; Wang, W. Grid-Forming Inverter Enabled Virtual Power Plants With Inertia Support Capability. IEEE Trans. Smart Grid 2022, 13, 4134–4143. [Google Scholar] [CrossRef]
- Zhang, Y.; Meng, X.; Malik, A.; Wang, L. The Use of Analytical Converter Loss Formula to Eliminate DC Slack/Droop Bus Iteration in Sequential AC-DC Power Flow Algorithm. Int. J. Electr. Power Energy Syst. 2022, 137, 107596. [Google Scholar] [CrossRef]
- Islam, M.T.; Hossain, M.J.; Habib, M.A.; Zamee, M.A. Adaptive Hosting Capacity Forecasting in Distribution Networks with Distributed Energy Resources. Energies 2025, 18, 263. [Google Scholar] [CrossRef]
- Wang, L.; Liu, H.; Wang, Q.; Cao, B.; Cong, Y.; Ding, Y.; Zheng, X. An Intraday Dispatch Strategy for Demand-Side Flexible Resources Based on Two-Stage Optimization. Front. Energy Res. 2024, 12, 1343728. [Google Scholar] [CrossRef]
- Zhang, Y.; Ge, Y.; Wang, S.; Pan, W.; Feng, Y.; Qiu, P. Research on the Optimal Operation of a Prosumer Micro Energy Network Centred on Data Centres. IET Renew. Power Gener. 2024, 18, 3869–3889. [Google Scholar] [CrossRef]
- Mahmoud, M.; Ben Slama, S. Deep Learning-Based Home Energy Management Incorporating Vehicle-to-Home and Home-to-Vehicle Technologies for Renewable Integration. Energies 2025, 18, 129. [Google Scholar] [CrossRef]
- Wang, Z.; Liu, M.; Yan, H.; Zhao, Y.; Yan, J. Improving Flexibility of Thermal Power Plant through Control Strategy Optimization Based on Orderly Utilization of Energy Storage. Appl. Therm. Eng. 2024, 240, 122231. [Google Scholar] [CrossRef]
- Zou, B.; Zhang, Y.; Chen, Q.; Hu, Q.; Hu, X.; Shi, J.; Li, Z.; Wang, Q. Low-carbon Economic Schedule of the H2 DRI-EAF Steel Plant Integrated with a Power-to-hydrogen System Driven by Blue Hydrogen and Green Hydrogen. IET Renew. Power Gen 2024, 18, 3839–3854. [Google Scholar] [CrossRef]
- Hu, Q.; Liang, Y.; Ding, H.; Quan, X.; Wang, Q.; Bai, L. Topological Partition Based Multi-Energy Flow Calculation Method for Complex Integrated Energy Systems. Energy 2022, 244, 123152. [Google Scholar] [CrossRef]
- Zhang, Y.; Shotorbani, A.M.; Wang, L.; Mohammadi-Ivatloo, B. Distributed Secondary Control of a Microgrid with a Generalized PI Finite-Time Controller. IEEE Open Access J. Power Energy 2021, 8, 57–67. [Google Scholar] [CrossRef]
- Xu, T.; Chen, T.; Gao, C.; Hui, H. Intelligent Home Energy Management Strategy With Internal Pricing Mechanism Based on Multiagent Artificial Intelligence-of-Things. IEEE Syst. J. 2023, 17, 6045–6056. [Google Scholar] [CrossRef]
- Jing, Z.; Gao, L.; Mu, Y.; Liang, D. Flexibility-Constrained Energy Storage System Placement for Flexible Interconnected Distribution Networks. Sustainability 2024, 16, 9129. [Google Scholar] [CrossRef]
- Pan, L.; Chen, J. Optimal Energy Storage Configuration of Prosumers with Uncertain Photovoltaic in the Presence of Customized Pricing-Based Demand Response. Sustainability 2024, 16, 2230. [Google Scholar] [CrossRef]
- Zhang, Y.; Yuan, C.; Du, X.; Chen, T.; Hu, Q.; Wang, Z.; Lu, J. Capacity Configuration of Hybrid Energy Storage System for Ocean Renewables. J. Energy Storage 2025, 116, 116090. [Google Scholar] [CrossRef]
- Krishna, S.; Deepak, M.; Sunitha, R. Locational Marginal Price Based Scheduling Strategy for Effective Utilization of Battery Energy Storage in PV Integrated Distribution System. J. Energy Storage 2024, 94, 112102. [Google Scholar] [CrossRef]
- Gazafroudi, A.S.; Prieto-Castrillo, F.; Pinto, T.; Prieto, J.; Corchado, J.M.; Bajo, J. Energy Flexibility Management Based on Predictive Dispatch Model of Domestic Energy Management System. Energies 2017, 10, 1397. [Google Scholar] [CrossRef]
- Wang, R.; Yu, X.; Sun, Q.; Li, D.; Gui, Y.; Wang, P. The Integrated Reference Region Analysis for Parallel DFIGs’ Interfacing Inductors. IEEE Trans. Power Electron. 2024, 39, 7632–7642. [Google Scholar] [CrossRef]
- Rui, W.; Qiuye, S.; Pinjia, Z.; Yonghao, G.; Dehao, Q.; Peng, W. Reduced-Order Transfer Function Model of the Droop-Controlled Inverter via Jordan Continued-Fraction Expansion. IEEE Trans. Energy Convers. 2020, 35, 1585–1595. [Google Scholar] [CrossRef]
- Hu, Q.; Li, F.; Fang, X.; Bai, L. A Framework of Residential Demand Aggregation With Financial Incentives. IEEE Trans. Smart Grid 2018, 9, 497–505. [Google Scholar] [CrossRef]
- Zhang, Y.; Qian, W.; Ye, Y.; Li, Y.; Tang, Y.; Long, Y.; Duan, M. A Novel Non-Intrusive Load Monitoring Method Based on ResNet-Seq2seq Networks for Energy Disaggregation of Distributed Energy Resources Integrated with Residential Houses. Appl. Energy 2023, 349, 121703. [Google Scholar] [CrossRef]
- Hou, H.; Xu, T.; Wu, X.; Wang, H.; Tang, A.; Chen, Y. Optimal Capacity Configuration of the Wind-Photovoltaic-Storage Hybrid Power System Based on Gravity Energy Storage System. Appl. Energy 2020, 271, 115052. [Google Scholar] [CrossRef]
- Zhang, Y.; Zou, B.; Liang, Y.; Luo, Y.; Chen, M.; Ye, J.; Li, S.; Li, Y.; Hu, X.; Pan, W. Potential Assessment of Coordinated Regulation of Power Load of Emerging Industrial Users Based on Extreme Scenarios of Electric Vehicle Aggregators. IET Renew. Power Gener. 2024, 18, 4004–4019. [Google Scholar] [CrossRef]
- Ravada, B.R.; Tummuru, N.R.; Ande, B.N.L. Photovoltaic-Wind and Hybrid Energy Storage Integrated Multisource Converter Configuration-Based Grid-Interactive Microgrid. IEEE Trans. Ind. Electron. 2021, 68, 4004–4013. [Google Scholar] [CrossRef]
- Li, J.; Zhang, Z.; Shen, B.; Gao, Z.; Ma, D.; Yue, P.; Pan, J. The Capacity Allocation Method of Photovoltaic and Energy Storage Hybrid System Considering the Whole Life Cycle. J. Clean. Prod. 2020, 275, 122902. [Google Scholar] [CrossRef]
- El-Ela, A.A.A.; El-Seheimy, R.A.; Shaheen, A.M.; Wahbi, W.A.; Mouwafi, M.T. PV and Battery Energy Storage Integration in Distribution Networks Using Equilibrium Algorithm. J. Energy Storage 2021, 42, 103041. [Google Scholar] [CrossRef]
- Saldarini, A.; Longo, M.; Brenna, M.; Zaninelli, D. Battery Electric Storage Systems: Advances, Challenges, and Market Trends. Energies 2023, 16, 7566. [Google Scholar] [CrossRef]
- Menghwar, M.; Yan, J.; Chi, Y.; Asim Amin, M.; Liu, Y. A Market-Based Real-Time Algorithm for Congestion Alleviation Incorporating EV Demand Response in Active Distribution Networks. Appl. Energy 2024, 356, 122426. [Google Scholar] [CrossRef]
- Liang, Z.; Qian, T.; Hu, Q.; Wu, Z. A Low Carbon Demand Response Approach via Road Tolls in Traffic-Power Coupled System. In Proceedings of the 2023 IEEE 7th Conference on Energy Internet and Energy System Integration (EI2), Hangzhou, China, 15–18 December 2023; pp. 4735–4740. [Google Scholar]
- Zhang, Y.; Zou, B.; Jin, X.; Luo, Y.; Song, M.; Ye, Y.; Hu, Q.; Chen, Q.; Zambroni, A.C. Mitigating Power Grid Impact from Proactive Data Center Workload Shifts: A Coordinated Scheduling Strategy Integrating Synergistic Traffic - Data - Power Networks. Appl. Energy 2025, 377, 124697. [Google Scholar] [CrossRef]
- Zhang, F.; Gu, W.; Zhang, Y.; Wang, L.; Li, W. General Linearized Model of Voltage Source Converter With Fixed Nodal Admittance Matrix. IEEE Trans. Power Electron. 2024, 39, 12143–12148. [Google Scholar] [CrossRef]
- Jaman, S.; Verbrugge, B.; Zhaksylyk, A.; Geury, T.; Baghdadi, M.E.; Hegazy, O. Development of Smart Charging Scheduling and Power Management Strategy of a PV-ESS Based Scalable EV Charging Station. Transp. Res. Procedia 2023, 72, 1240–1247. [Google Scholar] [CrossRef]
- Jiang, W.; Zhen, Y. A Real-Time EV Charging Scheduling for Parking Lots With PV System and Energy Store System. IEEE Access 2019, 7, 86184–86193. [Google Scholar] [CrossRef]
- Salari, M.; Armaghani, S.; Moravej, Z. A Novel Solution Methodology for Electrical Vehicles Charging Schedule in Coordinated with Full Flexible Resources in Microgrid. J. Energy Storage 2024, 90, 111765. [Google Scholar] [CrossRef]
- Fu, Y.; Bai, H.; Cai, Y.; Yang, W.; Li, Y. Optimal Configuration Method of Demand-Side Flexible Resources for Enhancing Renewable Energy Integration. Sci. Rep. 2024, 14, 7658. [Google Scholar] [CrossRef]
- Hu, Q.; Li, F.; Chen, C. A Smart Home Test Bed for Undergraduate Education to Bridge the Curriculum Gap From Traditional Power Systems to Modernized Smart Grids. IEEE Trans. Educ. 2015, 58, 32–38. [Google Scholar] [CrossRef]
- Hu, Q.; Li, F. Hardware Design of Smart Home Energy Management System With Dynamic Price Response. IEEE Trans. Smart Grid 2013, 4, 1878–1887. [Google Scholar] [CrossRef]
- Zhang, Y.; Qian, W.; Feng, Y.; Zhang, F.; Zheng, C.; Hu, Q.; Wang, L. An Adaptive Voltage Reference Based Multi-Objective Line Flow Control Methods for MMC-MTDC System. Int. J. Electr. Power Energy Syst. 2025, 164, 110373. [Google Scholar] [CrossRef]
- Hussain, E.; Bhaskar, A.; Chung, E. Transit OD Matrix Estimation Using Smartcard Data: Recent Developments and Future Research Challenges. Transp. Res. Part C: Emerg. Technol. 2021, 125, 103044. [Google Scholar] [CrossRef]
- Zhang, Q.; Lu, J.; Kuang, W.; Wu, L.; Wang, Z. Short-Term Charging Load Prediction of Electric Vehicles with Dynamic Traffic Information Based on a Support Vector Machine. World Electr. Veh. J. 2024, 15, 189. [Google Scholar] [CrossRef]
- Liu, L.; Lin, J.; Yao, J.; He, D.; Zheng, J.; Huang, J.; Shi, P. Path Planning for Smart Car Based on Dijkstra Algorithm and Dynamic Window Approach. Wirel. Commun. Mob. Comput. 2021, 2021, 8881684. [Google Scholar] [CrossRef]
- Zhang, Y.; Shotorbani, A.M.; Wang, L.; Li, W. A Combined Hierarchical and Autonomous DC Grid Control for Proportional Power Sharing with Minimized Voltage Variation and Transmission Loss. IEEE Trans. Power Deliv. 2021, 37, 3213–3224. [Google Scholar] [CrossRef]


| PV | ESS | ||
|---|---|---|---|
| Investment cost | 715.2 $/kW | Investment cost | 1142.9 $/kWh |
| Operating cost | 0.014 $/kW | Operating cost | 0.007 $/kW |
| Range of capacity | 0~750 kW | Range of capacity | 0~200 kW/800 kWh |
| Abandon light cost | 0.095 $/kW | Charge efficiency | 90% |
| Discount rate | 0.08 | ||
| Service life | 10 year | ||
| EV Parameters | |
|---|---|
| EV total number | 1000 |
| EV charging power | 40 kW |
| EV discharging power | 25 kW |
| EV charging and discharging efficiency | 90% |
| EV capacity | 45~50 kWh |
| Scenario | Parameters | |
|---|---|---|
| Scenario 1 | EV charging cost ($) | 187.25 |
| EV discharging subsidy ($) | 0 | |
| EV user total cost ($) | 187.25 | |
| Scenario 2 | PV investment cost ($) | 26,607 |
| PV operation cost ($) | 81 | |
| ESS investment cost ($) | 28,948 | |
| Network loss cost ($) | 1353 | |
| EV configuration subsidy ($) | −1759 | |
| Total cost ($) | 55,230 | |
| EV charging cost ($) | 179.45 | |
| EV discharging subsidy ($) | 551.71 | |
| EV user total cost ($) | −372.26 |
| PV | ESS | ||
|---|---|---|---|
| Location | Capacity | Location | Capacity |
| 30 | 310.7 kW | 13 | 100 kW/400 kWh |
Disclaimer/Publisher’s Note: The statements, opinions and data contained in all publications are solely those of the individual author(s) and contributor(s) and not of MDPI and/or the editor(s). MDPI and/or the editor(s) disclaim responsibility for any injury to people or property resulting from any ideas, methods, instructions or products referred to in the content. |
© 2025 by the authors. Licensee MDPI, Basel, Switzerland. This article is an open access article distributed under the terms and conditions of the Creative Commons Attribution (CC BY) license (https://creativecommons.org/licenses/by/4.0/).
Share and Cite
Wang, S.; Qiu, P.; Feng, Y.; Jin, X. Optimal Configuration Strategy of PV and ESS for Enhancing the Regulation Capability of Electric Vehicles Under the Scenario of Orderly Power Utilization. Energies 2025, 18, 1530. https://doi.org/10.3390/en18061530
Wang S, Qiu P, Feng Y, Jin X. Optimal Configuration Strategy of PV and ESS for Enhancing the Regulation Capability of Electric Vehicles Under the Scenario of Orderly Power Utilization. Energies. 2025; 18(6):1530. https://doi.org/10.3390/en18061530
Chicago/Turabian StyleWang, Shunjiang, Peng Qiu, Yiwen Feng, and Xu Jin. 2025. "Optimal Configuration Strategy of PV and ESS for Enhancing the Regulation Capability of Electric Vehicles Under the Scenario of Orderly Power Utilization" Energies 18, no. 6: 1530. https://doi.org/10.3390/en18061530
APA StyleWang, S., Qiu, P., Feng, Y., & Jin, X. (2025). Optimal Configuration Strategy of PV and ESS for Enhancing the Regulation Capability of Electric Vehicles Under the Scenario of Orderly Power Utilization. Energies, 18(6), 1530. https://doi.org/10.3390/en18061530