Article

Stability and Flame Structure Analysis of a Semi-Industrial Swirl-Stabilized Oxy-Fuel Combustion Chamber System for Biomass

Insitute for Energy Systems and Technology, Technical University of Darmstadt, Otto Berndt Straße 2, 64287 Darmstadt, Germany
*
Author to whom correspondence should be addressed.
Energies 2025, 18(6), 1513; https://doi.org/10.3390/en18061513
Submission received: 15 January 2025 / Revised: 14 February 2025 / Accepted: 3 March 2025 / Published: 19 March 2025
(This article belongs to the Topic CO2 Capture and Renewable Energy)

Abstract

:
Oxy-fuel combustion is a promising way to avoid process-based CO2 emissions. In this paper, the operational range of a new semi-industrial oxy-fuel combustion chamber for pulverized biomass is analyzed. This approach is used to gain a deeper understanding of the combustion setup and to examine the differences between air and oxy-fuel combustion on an industrial scale. Both analyzed parameters—flame spread and temperature distribution—have a significant influence on heat transfer in commercial boilers. The stability of various operating conditions is assessed by monitoring the CO content in the flue gas via a gas analyzer unit. For stable operation using walnut shells as fuel in an air atmosphere, an overall air-to-fuel ratio of 1.57–1.75 and a local air-to-fuel ratio of 0.75–0.95 provide the most stable conditions. A high swirl number of 0.9 is found to be critical for stability, as the increased fuel momentum entering the combustion chamber promotes a fuel jet-dominated swirl flame. For the corresponding oxy-fuel combustion with the same volume flows and three different oxygen concentrations between 27% and 33%, stable combustion behavior is also observed. Using a camera setup to analyze flame shape and spread, it is observed that the flame formed with an oxygen content of 33% most closely resembles the flame shape achieved under air combustion conditions. However, the combustion temperatures most closely match those of the air operating condition when the oxygen content is 27%. Overall, it is shown that the approach for corresponding oxy-fuel conditions features similar flame shapes to oxy-fuel combustion with flue gas recirculation in a semi-industrial combustion chamber.

1. Introduction

To reduce the overall release of greenhouse gases into the atmosphere, the heat and electricity production sectors must decrease their CO2 emissions. One promising approach for reducing CO2 emissions is the use of biogenic fuels combined with the removal of CO2 from exhaust gases. The captured CO2 can either be stored (Carbon Capture and Storage, CCS) or utilized (Carbon Capture and Utilization, CCU). One possible method is to extract CO2 from the flue gas in the exhaust stream. However, the main challenge is the significant efficiency loss due to the regeneration of sorbents [1]. Alternatively, replacing air with pure oxygen as the oxidizer can generate high-purity CO2 in the flue gas. This method, known as the oxy-fuel process, is a promising alternative for reducing CO2 emissions due to the high purity of CO2 in the flue gas and thus for reducing the costs of CO2 sequestration [1,2,3]. In addition, the construction space of the power plant is reduced due to the decreased volume flows of the oxidizer stream for similar thermal powers. This leads to reduced construction costs [1].
However, switching from air to pure oxygen as the oxidizer leads to much higher combustion temperatures, which exceed the material failure temperatures of the combustion chamber. To mitigate this, the oxidizer is diluted with recycled flue gas, avoiding the introduction of nitrogen into the combustion process [1]. Compared to nitrogen, CO2 has a higher heat capacity and increases radiative heat transfer. This requires adjustments in the oxygen concentration of the oxidizer to achieve combustion characteristics similar to those observed in conventional air combustion [4,5,6]. These changes necessitate a detailed investigation into the flame stability, temperature distribution, and flame structure in oxyfuel combustion. Toporov et al. [7] demonstrated that an oxygen content of 27% in the oxidizer is required to achieve flame temperatures comparable to those of air combustion. Maintaining similar temperatures is essential for ensuring the continuous ignition of the fuel. Another option is to preheat the oxidizer to increase its reactivity. For this analysis, a 40 kWth top–down-fired swirl burner with coal as fuel was used. Wall et al. [6] found that the higher heat capacity of CO2 compared to N2 causes an ignition delay. This delay can be counteracted by increasing the reactivity of the oxidizer, typically by raising the O2 content. The stability of air and oxy-fuel operating conditions can be assessed using the CO concentration in the flue gas, which serves as an indicator of stability [8,9]. Under unstable conditions, the CO concentration is higher due to flame quenching in the boundary layers, which results in incomplete CO burnout [8]. Habermehl et al. [9] also used OH* chemiluminescence imaging to differentiate between stable and unstable conditions. They found that higher CO emissions are associated with flame lift-off from the burner diffuser, indicating a lack of continuous flame stabilization. This disrupts the recirculation zone and leads to increased fluctuations and a higher risk of flame quenching. Özer et al. [10,11] investigated methane enrichment in air and oxy-fuel flames, revealing significant differences in the flow field and a more localized reaction zone in the flame. Using a camera setup for a heat release analysis and laser Doppler velocimetry for velocity measurements, Özer studied both coal and biomass fuels. All experiments conducted by Habermehl et al. [9], Hees et al. [8], Özer et al. [10,11], and Toporov et al. [7] were carried out in a refractory-lined combustion chamber with heated walls. At lower power, Schneider et al. [12] analyzed the flow fields and temperature distributions of biomass oxy-fuel combustion in a 40 kWth combustor. He found that the flow field most closely resembled the air case at an oxygen content of 33%. Using a two-color pyrometer, Schneider measured particle temperatures and found that they were similar in oxy-fuel and air combustion at this oxygen concentration [13]. Both the flow field and the temperature of the particles near the burner play a significant role in flame stability [9]. Emmert et al. [14] analyzed coal combustion under oxy-fuel combustion conditions in the same combustion chamber as Schneider et al. [12,13]. He showed that the temperature distribution in the upper part of the flame is most similar with a oxygen concentration of 33% in the oxidizer.
However, using a pure mixture of CO2 and O2 differs from the industrial process, where flue gas is recirculated. Flue gas contains impurities such as H2O, which can influence the combustion process. Therefore, the impact of flue gas recirculation on oxyfuel combustion must be analyzed separately. Smart et al. [15] conducted experimental studies on flame stability under air and oxy-fuel conditions with coal combustion in a 500 kWth test facility. They found that the recycling ratio in the oxidizer stream influenced flame stability, which was quantified through temperature profiles and oscillation frequencies of the flame intensity. Hjärtstam et al. [16] also performed experiments with recycled flue gas in a 100 kWth combustion chamber at Chalmers University. Their results indicated that a higher oxygen content in the oxidizer stream led to earlier ignition and more intense combustion.
Recent publications have primarily focused on laboratory-scale analyses [17,18,19,20], concentrated on gathering detailed and important information on the gasification and pyrolysis behavior of different biomass fuels, analyzed oxy-fuel combustion on a pilot scale with coal as fuel, or been conducted in test facilities with low thermal power [12,14,21]. There is a lack of experimental data from semi-industrial combustion chambers with flue gas recirculation. This data gap makes it challenging to validate the scalability of findings obtained from pilot and lab-scale combustion chambers to full-scale, semi-industrial applications. To ensure the successful transition from smaller-scale experimental setups to larger systems, more comprehensive data from real-world semi-industrial conditions are necessary. This will allow for more accurate predictions and optimizations of combustion efficiency, emissions control, and overall system performance at an industrial scale. The aim of this investigation is to analyze the operational range of a new burner, upscaled by Richter et al. [22], and to determine the boundary conditions that influence flame stability. This will enhance the understanding of oxy-fuel combustion at an industrial scale. For this purpose, the CO content in the flue gas is used as an indicator for different air operating conditions. By using stable air operating conditions as a benchmark, the impact of various oxygen contents in the oxidizer feeding line is evaluated. Flame images are recorded and analyzed for flame position and length, while temperature profiles in the combustion chamber are measured using thermocouples. Both flame spread and temperature distribution are crucial design parameters for commercial boiler systems. Therefore, understanding the correlation between air and oxy-fuel operating conditions is essential for retrofitting older systems and transferring knowledge from air combustion to oxy-fuel combustion.

2. Materials and Methods

2.1. Experimental Setup

The combustion chamber is top–down-fired and consists of two main components. The upper part has a hexagonal cross-section, measuring 1200 mm in width and 4150 mm in length. The lower part, which is refractory-lined, has a height of 3000 mm and a diameter of 2650 mm. The walls of the upper part are water-cooled, similar to commercial boilers. Adjacent to the combustion chamber, in the flow direction, there is a convective heat exchanger and a particle filter. The combustion chamber can be operated in both air and oxy-fuel modes. For oxy-fuel combustion, either a CO2−O2 mixture or a recirculated flue gas with oxygen enrichment can be used. When flue gas recirculation is employed, the flue gas is first supplied to the primary fan and then mixed with pure oxygen before being fed into the burner. When using a CO2−O2 mixture, the primary fan is not used, and both gases are supplied from tanks. A schematic of the entire setup is shown in Figure 1.
For analysis purposes, various ports are positioned at six different heights within the combustion chamber. Additionally, multiple connections for thermocouples are mounted throughout the chamber. Three thermocouples are installed at distances of 0.4 m, 1.2 m, and 2.1 m from the burner plane, which is defined as the lower end of the burner diffuser. A gas analyzer unit is installed in both the off-gas line and the oxidizer line to monitor the flue gas and the oxidizer. A detailed view of the upper part of the combustion chamber, including the measurement connections, is shown in Figure 2.
A new burner has been developed for the existing test facility (Stroh et al. [23] and Richter et al. [22]). This burner was upscaled from a 60 kWth burner at the Institute of Heat and Mass Transfer at RWTH Aachen (Stadler et al. [24]) to 500 kWth, as described in the studies by Richter et al. [22]. It was designed to accommodate a range of operating conditions. A sketch of the burner inlets is shown in Figure 3, and the geometric dimensions are provided in Table 1.
At the centerline of the burner, the primary air stream, natural gas injection, and pulverized fuel inlet are located. The two secondary air inlets are positioned adjacent to each other. These two channels allow for the adjustment of the swirl number between 0 and 1. One channel is equipped with a swirl generator, while the other is not. The diffuser has an opening angle of 21 and a maximum opening radius of 219 mm. The vertical distance from the inlet streams to the end of the burner diffuser is 235 mm. Additionally, tertiary air is supplied through 24 bores in the diffuser stones.

2.2. Fuel Analysis

The used fuel consists of milled walnut shells (WSs). The fuel properties are given in Table 2. The walnut shells have a stoichiometric oxygen demand of 0.96 Nm3/kgfuel. A fuel analysis is performed based on the DIN norm for proximate (DIN 51718, DIN 51719, and DIN 51720), ultimate (DIN 51733), and heating value (DIN 51900) analyses ([25,26,27,28,29]). Table 3 shows the particle size distribution of the fuel. It is measured with an Olympus SZ-40 microscope and a spherical particle model.

2.3. Measurement Technique

A flue gas analysis is conducted using two gas analyzer units from ABB. For oxygen measurement in the off-gas, an ABB Magnos is used, while an ABB Ltd. (Zürich, Switzerland) Uras 26 analyzes other combustion species such as CO and CO2. The systems have a measuring range, as shown in the table. Both systems operate under dry flue gas conditions. Moisture is measured separately with a Bartec (Bad Mergentheim, Germany) HYDROPHIL H2430-11. Gas extraction takes place behind the dust filter unit. A second gas analyzer setup, similar to the one in the flue gas line, is used to analyze the oxidizer stream. The measuring range for CO2 and O2 is up to 90 % and 40 % , respectively. All systems are supplied with 80 L/min of measuring gas. Detailed information regarding the measuring range of the gas analyzer in the flue gas line are given in Table 4.
Flame visualization is performed with two CMOS camera setups, which can be repositioned to different ports of the combustion chamber (see Figure 2). These cameras are mounted at port position b in water-cooled housings and shielded with quartz glass. To prevent fouling by particles, the port is flushed with either CO2 or air, depending on the combustion conditions. The cameras operate at 50 fps with a resolution of 2560 × 2160 pixels, using Nikkor 50 mm f 1.2 objective lenses. Post-processing is performed using DaVis 10.2.1 software, which includes spherical aberration correction. Each camera captures a field of view of 200 × 250 mm within the combustion chamber, oriented so that the left side of the image aligns with the geometric centerline. The cameras are focused on a target at the center of the chamber, but, due to the line-of-sight nature of the measurements, the visible background is significantly larger than the field of view. This setup allows for an analysis of the main part of the flame. By repositioning the cameras to different heights (see Figure 2), the entire flame can be visualized. No filter is used in the setup, so the recorded flame intensity is a combination of black-body radiation from fuel particles and soot, gas-phase radiation, and chemiluminescence from various light-emitting radicals (Lauer et al. [30] and Johansson et al. [31]). This approach is preferred because isolating CH* or OH* wavelengths is complicated by the strong black-body radiation from particles and soot. Additionally, the high strain rate of the swirl-stabilized flame results in nonlinear behavior of the CH* and OH* radicals, making it impossible to resolve the heat release zone locally (Lauer et al. [30]). For a flame analysis, 500 images are averaged.

2.4. Operating Conditions

The investigated operating conditions focus on flames with thermal power inputs of 500 kWth and 750 kWth. To stabilize the flame, an additional 1.5 Nm3/h of natural gas, corresponding to 15 kWth, is required. The range of operating conditions for the air case is shown in Table 5. These selected conditions are based on those for which the burner was originally developed (Richter et al. [32]).
The local and global air-to-fuel ratios are calculated according to Equations (1) and (2):
λ l o c = V ˙ O 2 , T G + V ˙ O 2 , S e c V ˙ O 2 , s t o i ,
λ g l o b = V ˙ O 2 , T G + V ˙ O 2 , S e c + V ˙ O 2 , T e r V ˙ O 2 , s t o i .
For the local air ratio, the oxygen volume flows entering the combustion chamber through the transport gas line and the secondary stream are considered. The primary stream is not used during solid fuel combustion. The global air ratio also includes the tertiary stream. In these equations, V ˙ O 2 and V ˙ O 2 , s t o i represent the oxygen volume flows in the corresponding oxidizer streams and the stoichiometric oxygen demand of the fuel, respectively. The subscripts T G , S e c , and T e r denote the transport gas, secondary, and tertiary oxidizer streams, respectively. The stoichiometric oxygen demand is calculated from the fuel mass flow and the ultimate analysis of the fuel.
The geometric swirl number is determined from the momentum ratio between the angular and axial momentum of the secondary oxidizer stream, as described by Equation (3) (Richter et al. [32]):
S = L s w i r l r I a x i a l = r s w i r l V ˙ s w i r l u s w i r l c o s ( α ) r s w i r l V ˙ s w i r l u s w i r l s i n ( α ) + r a x i a l V ˙ a x i a l u a x i a l .
where L s w i r l is the angular momentum, r is the radius of the axial momentum components, and I a x i a l represents the momentum of the axial oxidizer flows. With a swirl angle of 45 in the secondary swirl channel, a maximum value of S = 1 can be achieved when the axial stream is zero. This assumption is supported by Claypole et al. [33], who demonstrated a linear correlation between the geometric swirl number and the actual swirl number. To achieve similar inlet velocities in the burner for both air and oxy-fuel conditions, the oxy-fuel operating conditions are designed with a higher thermal power and an increased oxygen concentration in the oxidizer line compared to the air case. However, the volume flows in the secondary and tertiary streams remain constant. The transport of solid fuel from the feeding unit to the combustor is carried out with air in the air combustion case and with a CO2-O2 mixture in the oxy-fuel case. The transport gas amount is determined by the maximum solid fuel mass flow and remains constant across all operating conditions. Additionally, the fuel momentum in the combustion chamber must be similar in both operating conditions. Thus, the transport gas is set to 110 Nm3/h for air combustion and 95 Nm3/h for oxy-fuel combustion. While varying the fuel flow, the total momentum of the fuel—which consists of the transported fuel mass flow and the transport gas—will differ. For safety reasons, the oxygen content in the transport gas in the oxy-fuel case is set to 15% O2 in CO2.
For a comparison of the air and oxy-fuel operating conditions, three stable air operating conditions and their corresponding oxy-fuel conditions are selected. The first condition, featuring a classical air staging approach (AirAS), is discussed in detail in this paper. The second and third conditions, labeled high momentum (AirHM) and low power (AirLP), correspond to a lower thermal power of 400 kWth and a local air ratio greater than one. A comparison of the three operating conditions is presented in Table 6. The second and third conditions will be discussed and analyzed in more detail in subsequent publications.
The analyzed air staging operating condition features a swirl number of 0.95 , along with local and global air ratios of 0.95 and 1.65 , respectively. The corresponding oxy-fuel conditions for these air operating conditions are developed by employing an approach to achieve flow field similarity, alongside varying the inlet oxygen content between 27% and 33%, with flue gas recirculation. This oxygen content range is well established in the literature as being effective for achieving similar flame temperatures in oxy-fuel combustion and similar combustion behavior [12,21,34]. In this setup, dust is removed from the off-gas but not dried, meaning that the combustion gases consist of oxygen, carbon dioxide, water vapor, and other trace elements. For consistent operating conditions between the air and oxy-fuel combustion, the inlet streams must have similar volume flows into the combustion chamber. When adjusting the oxygen content in the oxidizer stream, the overall thermal power must vary to maintain a constant local air ratio. However, the global air ratio typically remains stable. Detailed information regarding the similarities and differences between the four operating conditions, as well as the oxidizer composition, is provided in Table 7. The inlet temperatures of the oxidizer streams are not actively regulated but stabilize at approximately 50   ° C for air combustion and between 70   ° C and 80   ° C for oxy-fuel combustion. In the air case, the air is heated through the primary fan, while in the oxy-fuel case, the air is heated by the recirculated hot flue gas.

3. Results

3.1. Stability Analysis of the Air Operating Conditions

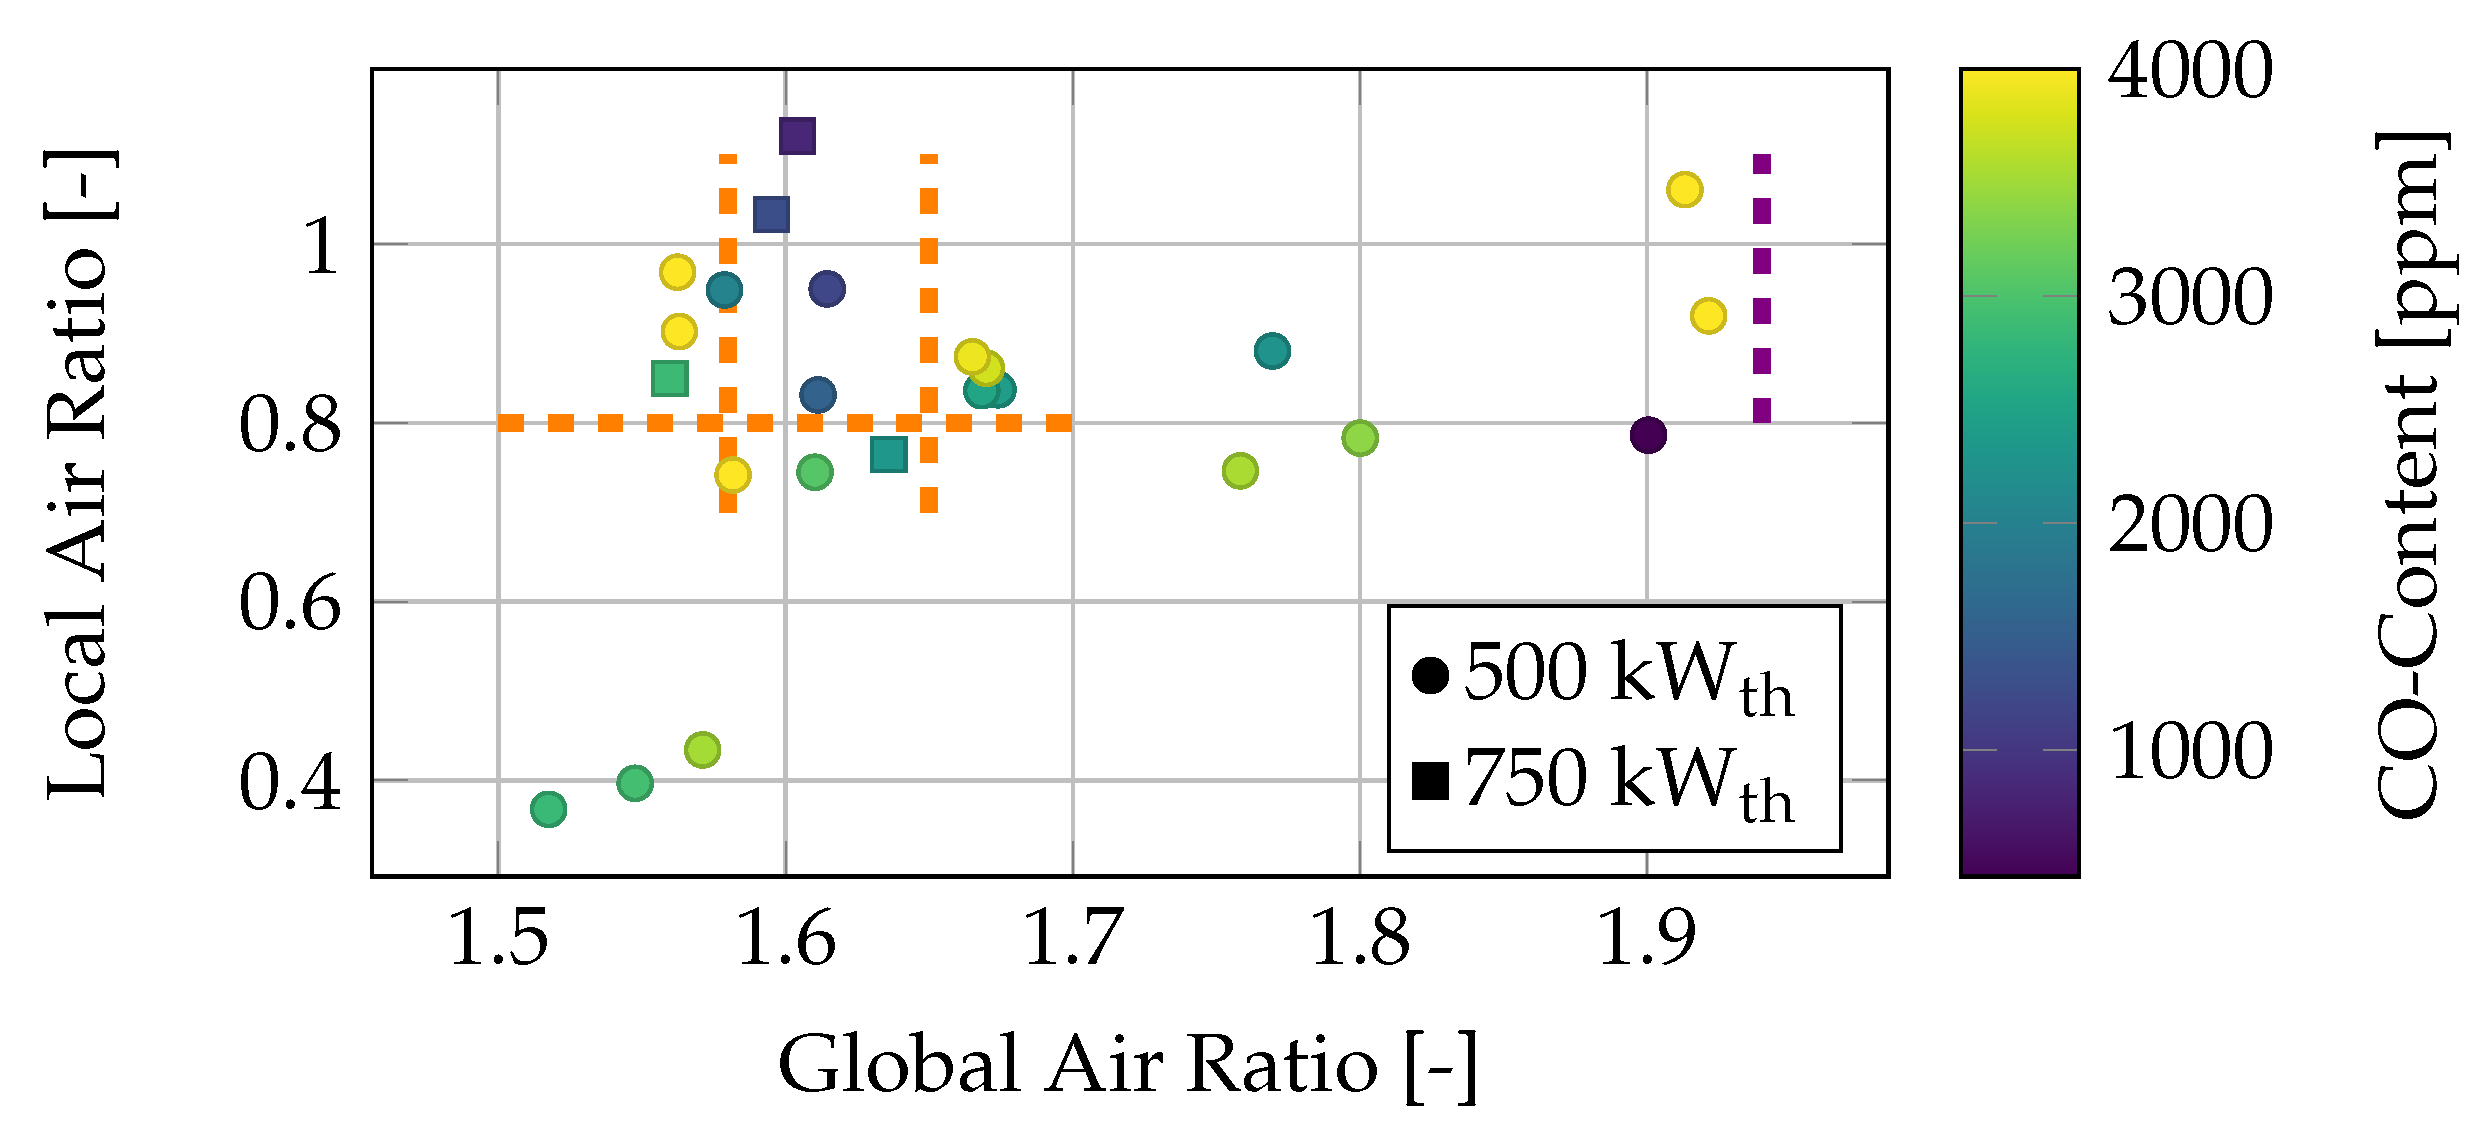
For an initial analysis of the oxy-fuel burner, the CO concentration in the flue gas is used as an indicator to characterize the stability of different air operating conditions. In Figure 4, the CO concentrations in various operating conditions (refer to Table 5) are plotted as a function of the local and global air ratios. The data are mostly gathered during two weeks of operation.
The CO content in the flue gas ranges from 500 ppm to 6000 ppm, with all operating conditions showing CO concentrations greater than 4000 ppm, as marked in yellow. Generally, the CO emissions are much higher than those typically observed in commercial boilers. This is attributed to the large particle size of the walnut shells, combined with the small combustion chamber dimensions for biomass combustion, which increases the likelihood of flame quenching due to the longer flame length [35]. Operating conditions with a local air ratio higher than 1 and a global air ratio around 1.6 tend to have relatively low CO concentrations in the flue gas. This could be due to the significant amount of oxygen in the primary combustion zone. In contrast, it is anticipated that, for higher global air ratios, the increased tertiary stream may quench the flame before complete combustion occurs, leading to higher CO emissions. In the upper left portion of Figure 4, where the local air ratio is around 0.9 and the global air ratio is 1.6 , a decrease in CO emissions is observed, followed by a subsequent increase. This area, marked by three dashed orange lines, represents the most stable operational range for the use of pulverized walnut shells as fuel. All tested operating conditions in this region exhibit CO emissions below 1500 ppm. Both the 500 kWth and 750 kWth operating conditions display the same trend. On the right side of Figure 4, the lean blowout limit is marked with a violet line. The most stable operating conditions are found within a global air ratio range of 1.57–1.65 and a local air ratio higher than 0.8 . However, especially to reduce NOx emissions, a local air ratio lower than one should be used. It is assumed that a high tertiary air flow, and thus a high global air ratio, promotes rapid mixing and faster combustion in the fringe areas of the combustion chamber before the flame is thermally quenched by the walls. For thermal powers below 500 kWth, a classical air staging approach is not feasible due to insufficient swirl momentum, which is discussed in more detail later. To achieve a higher swirl momentum in low-power operation, a local air ratio greater than one is necessary.
To better understand the individual phenomena of the flame, the CO content in the flue gas is plotted as a function of the global air ratio in Figure 5. It is observed that CO emissions reach a minimum at a global air ratio of 1.6 . From furnace camera observations, it can be seen that, with a decreasing global air ratio, the flame touches the walls, suggesting that flame quenching occurs upon contact with the walls. For higher global air ratios, it is assumed that the flame is quenched by the high flow velocity of the tertiary stream. The CO emissions from the flame exhibit significant fluctuations, with high overall emissions under unstable operating conditions. In contrast, when the system operates under stable conditions at a global air ratio of 1.6 , both the fluctuations and the overall CO emission are reduced.
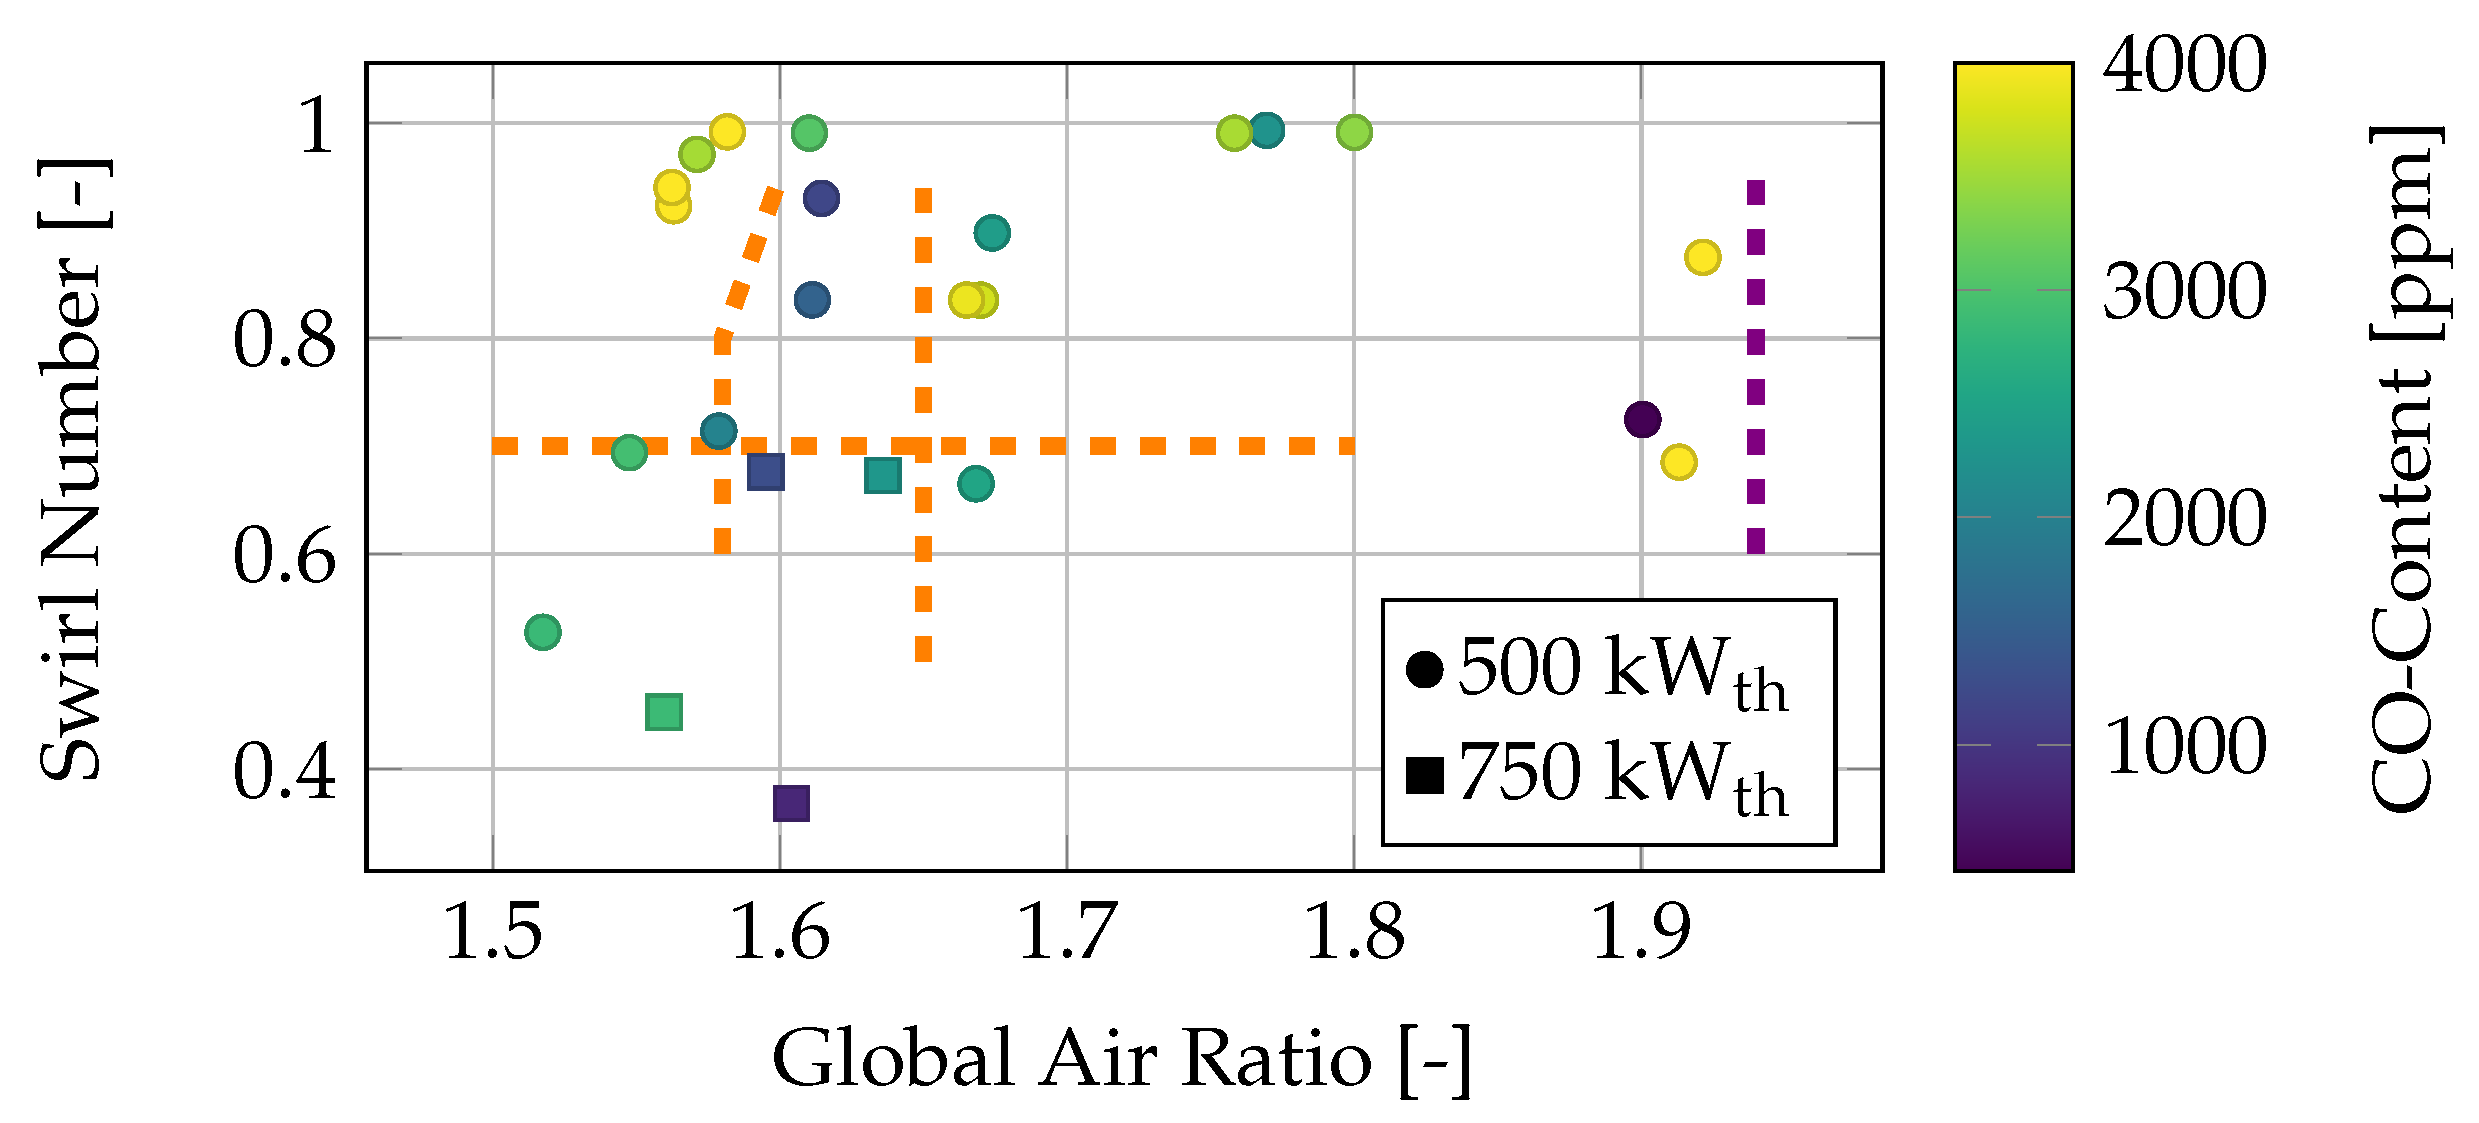
The second characteristic, the swirl number, is shown in Figure 6.
The CO emissions of different air operating conditions are visualized in relation to the swirl number and global air ratio. Figure 6 displays the same operating conditions as Figure 4. Again, an area with decreased CO emissions is observed between a global air ratio of λ g l o b = 1.57 1.65 and S = 0.7 , with all three limits marked by dashed orange lines in the diagram. The lean blowout limit is also shown in violet. Due to the high fuel momentum, which is greater than other types of fuel injection, a higher swirl momentum is required to form a proper recirculation zone in the center of the flame. This recirculation zone plays a key role in flame stabilization by providing a feedback loop of hot, burned gases to the diffusor. The recirculation ensures early ignition and contributes to the reduction of unburned components, such as CO. When comparing the 750 kWth operating conditions (marked with a square) with the 500 kWth conditions, it is evident that, for the higher power, a lower swirl is sufficient to achieve low CO concentrations in the flue gas and thus ensure stable flame operation. This difference is attributed to the air-to-fuel momentum ratio, which is discussed later.
All operating conditions with a local air ratio greater than 1.0 also show low CO concentrations in the flue gas, even at low swirl numbers. This correlation can be better understood by examining the axial and swirl velocities of the secondary stream in more detail, as shown in
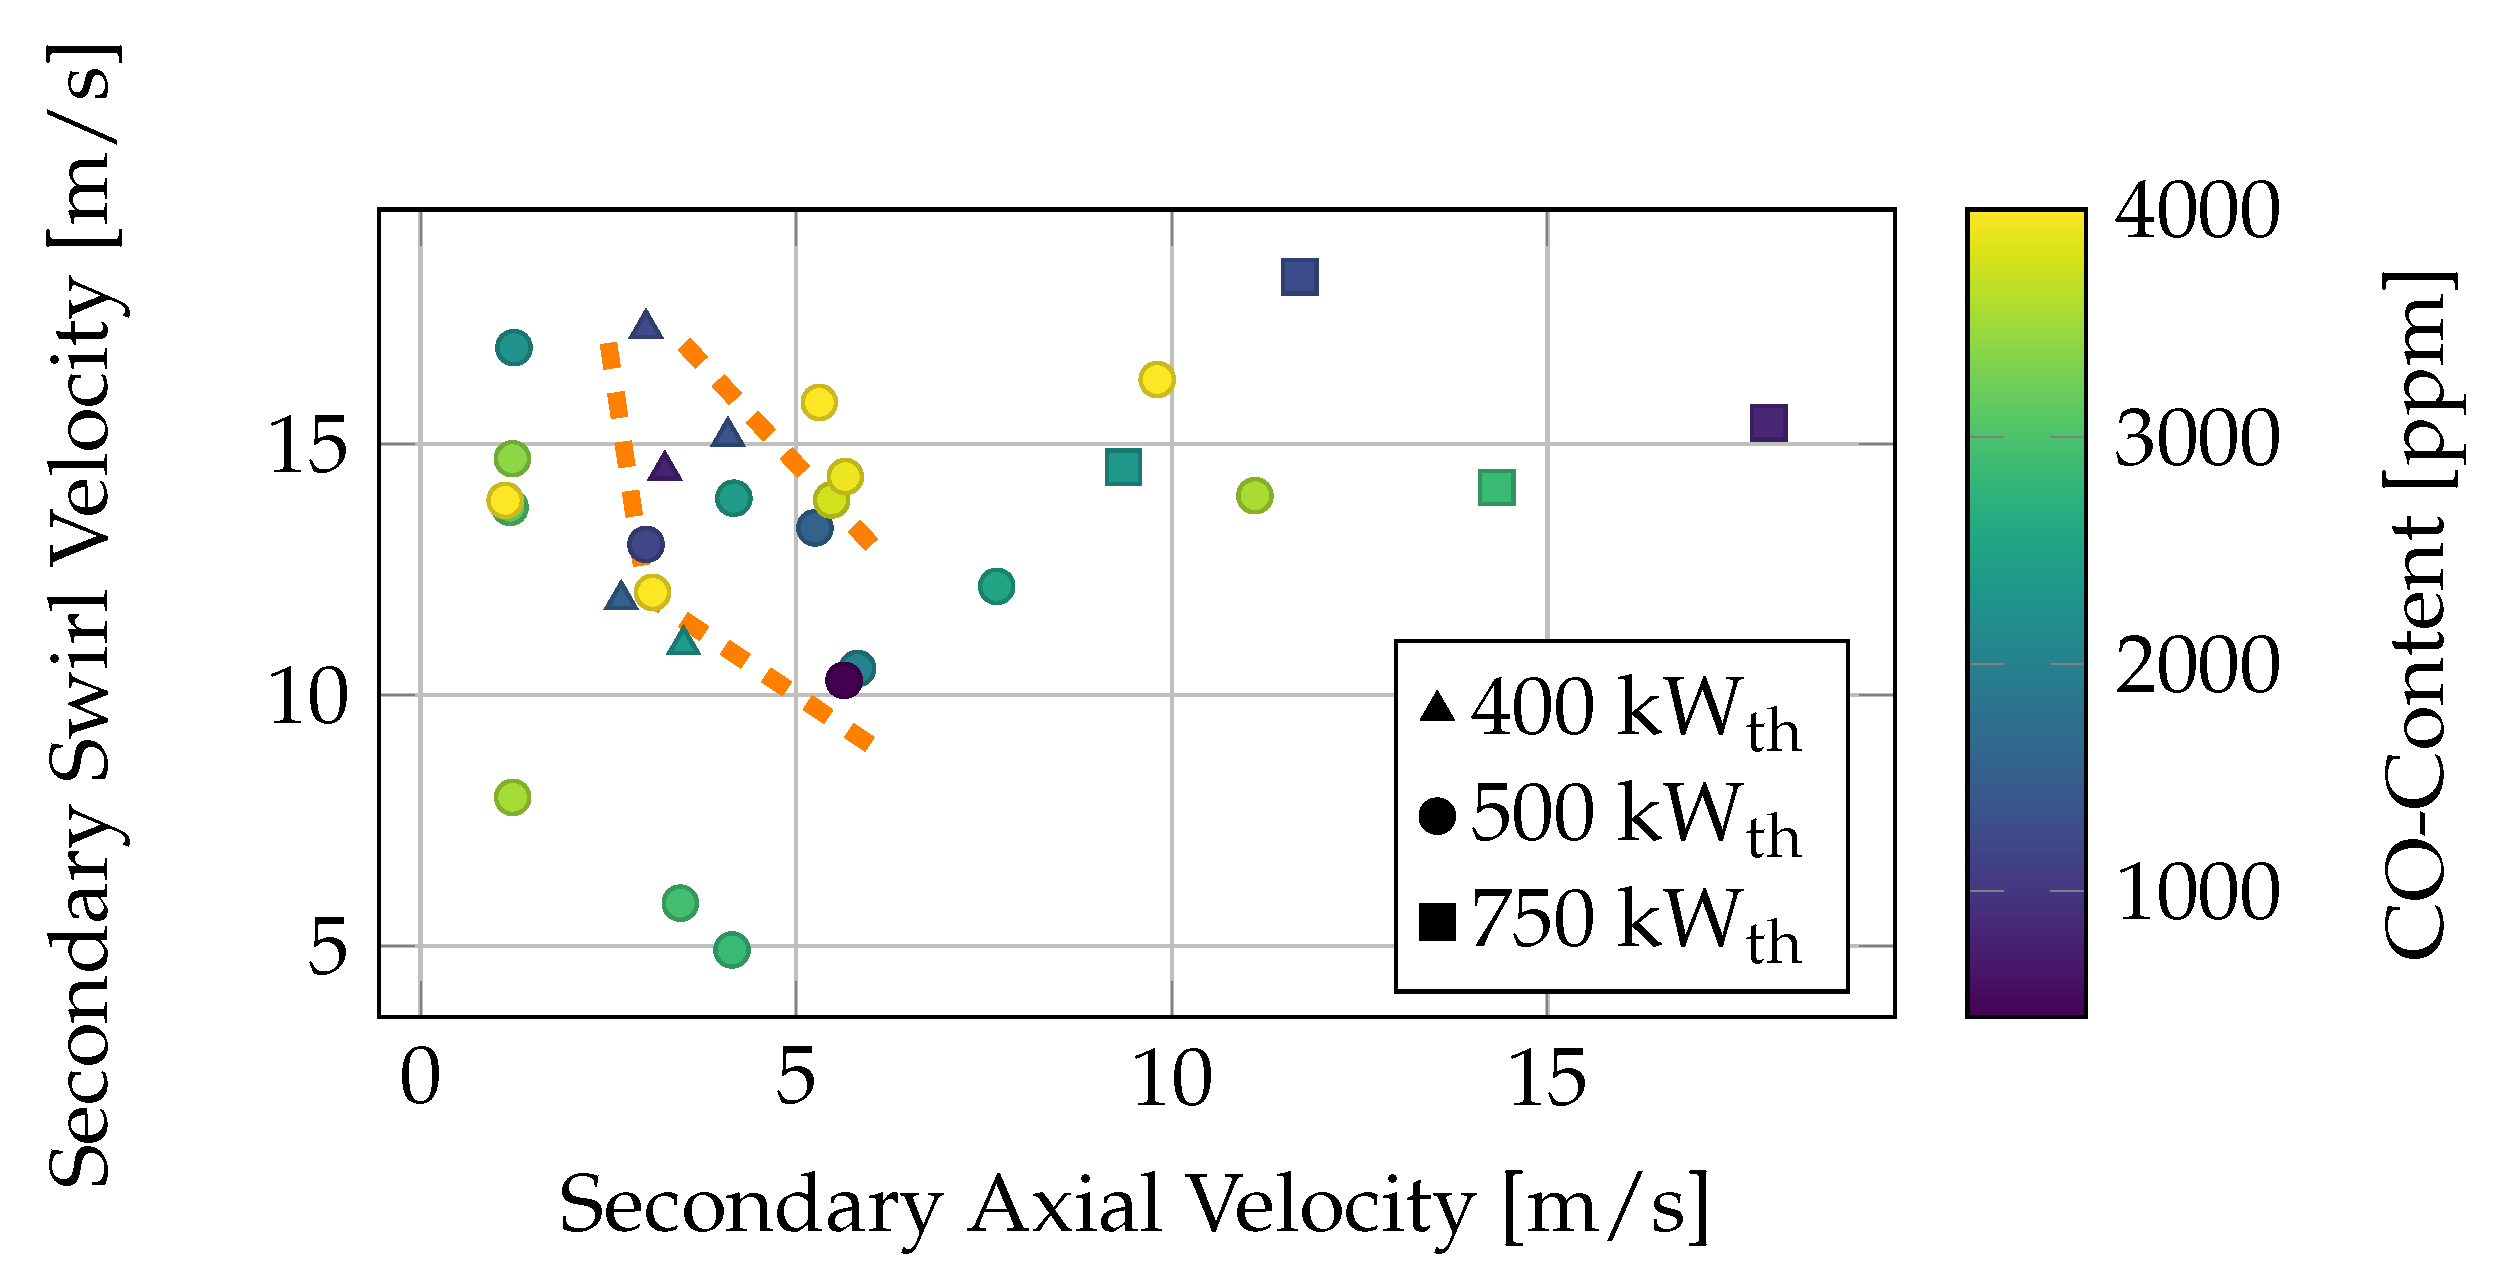
 Figure 7.
The CO concentration of the different operating conditions is visualized as a function of the inlet velocity of the secondary axial and swirl streams. It is observed that the most stable operating conditions for the lower thermal power of 500 kWth (marked with a dot) lie within an axial velocity range of 3–8 m/s and a swirl inlet velocity range of 10–14 m/s. These operational values are lower than the designed inlet velocity of 18 m/s (Richter et al. [32]). For higher thermal power, the inlet velocity increases, and the CO content in the flue gas decreases. One operating condition must be excluded, namely, the yellow operating condition, which has a swirl velocity of 14 m/s and an axial inlet velocity of 44 m/s. Despite having the same inlet velocities as the other stable operating conditions, it has a lower global air ratio, leading to higher CO emissions (see Figure 4). Increasing both the axial and swirl velocities results in higher CO emissions for the 500 kWth operating conditions. The transition from stable operating conditions to lean blowout occurs very quickly, causing the operating conditions to be clustered closely together. For lower swirl velocities, the flame becomes unstable due to a high fuel momentum flux, leading to a dominant axial moment in the combustion chamber (orange line). This is also noticeable in the operating conditions for the lower thermal power of 400 kWth, which exhibit stable behavior only when the local air ratio exceeds one. These conditions fall within the same area as the stable 500 kWth operating conditions.
For higher power, the most stable operating conditions shift to higher inlet velocities of both the axial and swirl streams. This shift is due to the higher total volume flow of the oxidizer with increased power. Additionally, with a higher fuel-to-air momentum ratio, the burner exhibits more stable operating conditions, even at lower swirl numbers. This phenomenon is described by the fuel-to-air momentum ratio in Equation (4) (Chen et al. [36]):
M R = m ˙ f u e l u f u e l 2 1 V ˙ f u e l m ˙ S w i r l u S w i r l 2 1 V ˙ S w i r l
with
m ˙ f u e l = m ˙ s o l i d + m ˙ T G .
This equation describes the ratio between the momentum that shapes the recirculation zone and the momentum that counteracts it. Notably, the fuel mass flow increases with the thermal power, but the air mass flow also increases correspondingly. Since the transport gas volume flow remains constant, the fuel inlet velocity does not change significantly, resulting in a decrease in the fuel-to-air momentum flux ratio. When calculating the momentum ratio for three stable operating conditions at different thermal powers, the ratio is found to vary between 1.28 for the highest power and 1.87 for the lowest. In the literature, two types of recirculating flames are described: strongly recirculating flames, which occur at low fuel momentum ratios, and fuel-penetrating recirculation flames, where the fuel jet penetrates the recirculation zone (Marinov et al. [37]). Chen et al. [36] discusses the differences between fuel jet-dominated flames and strongly recirculating flames, demonstrating that a momentum ratio greater than 0.6 results in a fuel-penetrating recirculation zone. This can also be observed in the analysis of the flame shape in the following section. Despite the influence of fuel momentum, the swirl plays a significant role in shaping the flame and determining its stability.
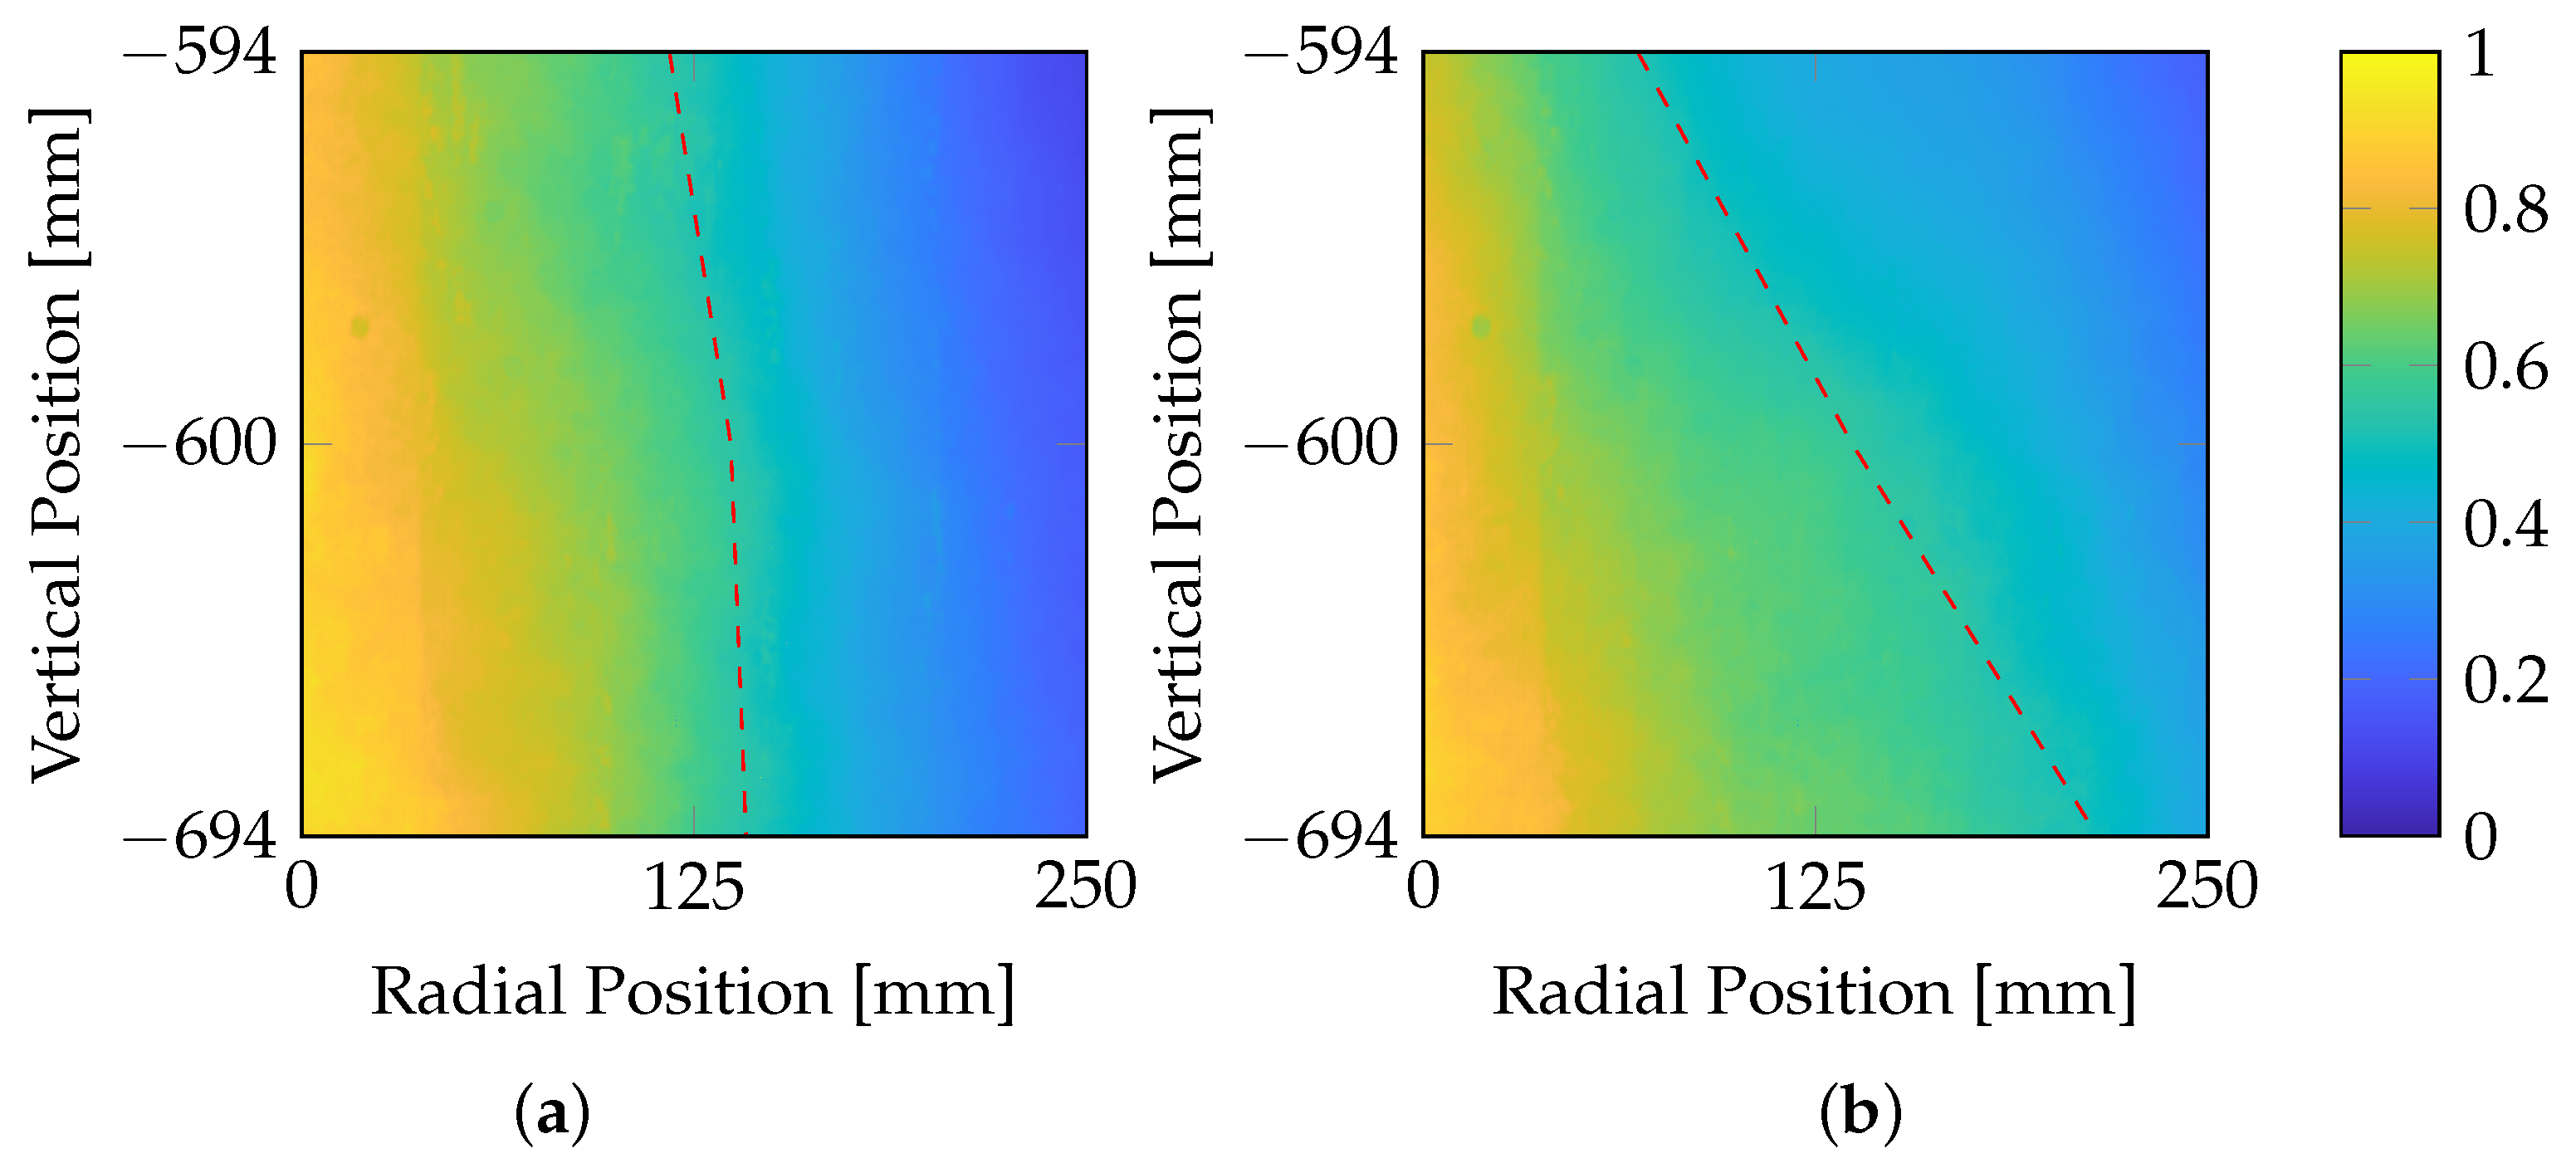
To obtain a better insight, two different swirl numbers and thus swirl inlet velocities are shown in Figure 8.
An analysis of different operating conditions reveals that the swirl number has the most pronounced influence on the flame shape at port heights three and four. It is evident that the flame with a higher swirl (a) exhibits a larger diameter in the upper part of the flame than the flame with a lower swirl (b). However, as the distance from the burner increases, the flame with the lower swirl (b) shows greater radial spread. This suggests that, with an increased swirl, the flame exhibits better spread and enhanced mixing in the middle part of the flame, compared to a lower swirl. From the stability analysis, it can be inferred that a sufficient amount of tertiary air is essential to prevent flame quenching at the combustion chamber walls. The high fuel momentum of the solid fuel combined with the transport gas leads to a fuel-dominated swirl flame, characterized by a more jet-like shape. A high swirl momentum is crucial for ensuring the recirculation of flue gas, thereby maintaining stable combustion.

3.2. Comparison of Oxy-Fuel and Air Operating Conditions

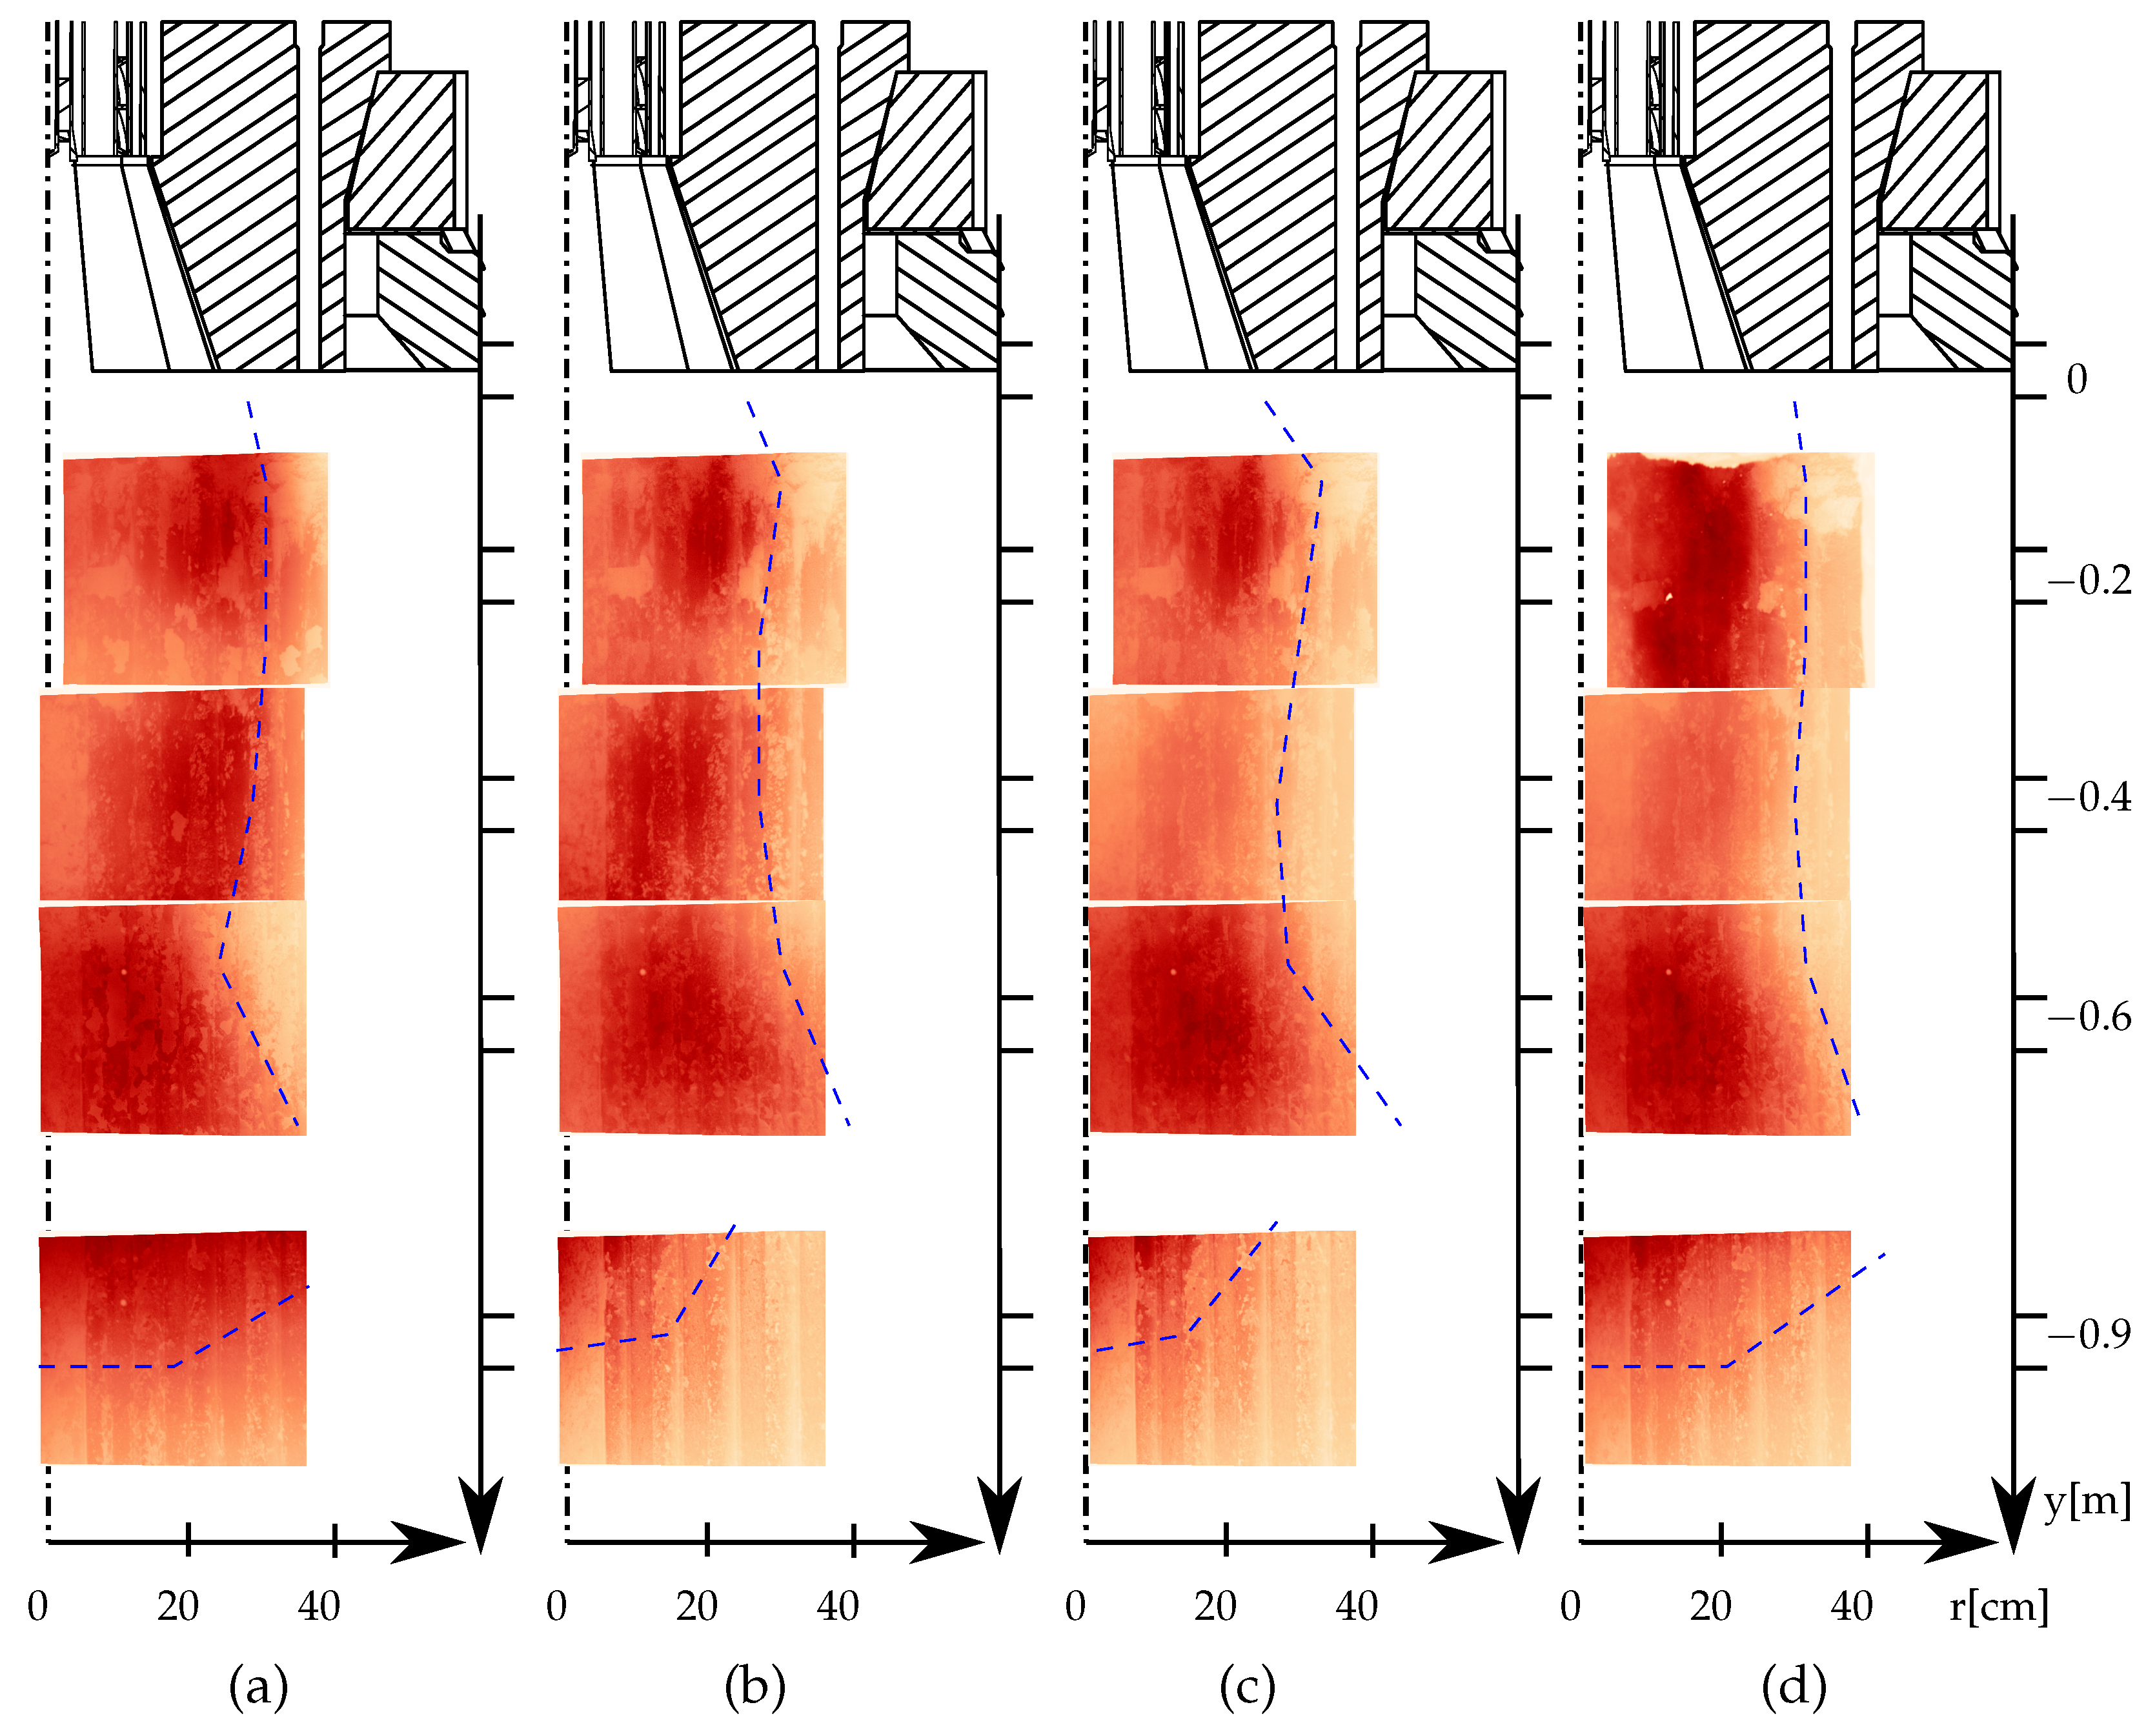
Figure 9 shows flame images of the air (a) and the corresponding oxy (b)–(d) operating conditions. On the top, the burner diffusor is sketched. The first image starts at the y-position y = 94 mm. Each image shows a field of view of 250 × 200 mm of the combustion chamber.
Each image is normalized by its maximum intensity value, allowing for an easier analysis of the position of the highest flame intensity in each image. However, a direct quantitative comparison between different images is not feasible. By identifying the region of highest radiation intensity, the position of heat release can be estimated. The pattern observed in the background of the images is caused by reflections from the wall. For all four operating conditions, the highest intensity is found in the first two radial positions, which correspond to the diffusor’s radial extent (with a radius of 219 mm). This suggests that primary combustion occurs in the shear layer between the burner-attached secondary air and the centrally injected fuel. Images taken at port three indicate a widening flame behavior, with the flame spreading radially over a larger area. At a distance of 0.9 m from the burner plane, the highest intensity is predominantly located in the upper region, indicating that this image captures the end of the flame.
When comparing the air and oxy-fuel operating conditions, it is observed that the oxy-fuel flames (OXY-27p and OXY-30p) exhibit less radial spread than the air case at the first two heights. Additionally, the oxy-fuel flames appear shorter and more compact. This is particularly evident in the image at a height of 0.9 m, where the inclination angle of the blue line in image three is lower. This difference is assumed to be due to the increased oxygen content in the oxy-fuel operating conditions, which accelerates ignition and results in a shorter flame. As the oxygen content and thermal power increase, the flame shape becomes more similar to the air case, as seen in the radial position, shape, and length of the flame. This was also demonstrated by Schneider et al. [12] for a similar combustion chamber operating at 40 kWth and led to a more similar flow field for the oxy-fuel operation with 33% and air combustion. The shift of the heat release zone closer to the burner plane is further corroborated by the temperature profile, which aligns with findings of Hjärtstam et al. [16] and Smart et al. [15]. Figure 10 illustrates the temperature and its standard deviation at three different heights in the combustion chamber. All four operating conditions display similar trends. The highest temperatures are observed at the second position, located 1200 mm from the burner plane. This is consistent with the flame’s radial widening observed at 900 mm, which leads to the transport of hot gases near the wall. At the first position, temperatures are similar across all operating conditions, as noted by Toporov et al. [7]. However, with an increasing distance from the burner, the differences between the air and oxy-fuel conditions become more pronounced. These differences can be attributed to the higher thermal load under the oxy-fuel operating conditions, as well as the increased reactivity and higher adiabatic flame temperature due to the elevated oxygen content.
Changes in the intensity distribution and position of the flame not only affect the temperature distribution within the combustion chamber but also influence the radiation emissions of the flame. Richter et al. [32] conducted radiative heat flux measurements in the same combustion chamber using natural gas, Rhenish lignite, and walnut shells as fuels. These measurements show a behavior similar to that observed in the flame images: the radiative heat flux increases from port three to port four and then decreases again for all operating conditions. Like the temperature profiles, the oxy-fuel operating conditions exhibit higher radiative heat flux values than air combustion at a constant thermal power. At a distance of 600 mm from the burner plane, the radiative heat flux and temperature are comparable across both air and oxy-fuel conditions. However, as the distance from the burner increases, the differences between the air and oxy-fuel conditions become more pronounced. Overall, the results show that the application of oxy-fuel biomass combustion with flue gas recirculation is possible with the constant flow field approach used in this publication.

4. Conclusions

In this work, the operational range of a semi-industrial oxy-fuel burner is analyzed through a stability analysis of the CO emissions in the flue gas, followed by a comparison of the flame structure for one stable air and three oxy-fuel operating conditions using optical measurement techniques. Milled walnut shells are used as the fuel. This approach is used to gain a deeper understanding of the developed combustion setup, as well as the differences between oxy-fuel and air combustion on an industrial scale. A stability analysis demonstrates that the burner operates most stably within a global air ratio range of 1.57–1.7 and a local air ratio range of 0.8–0.95 for thermal powers above 500 kWth. High global air ratios are necessary to prevent thermal quenching of the flame at the cooled walls, particularly when using biomass fuel. This range is believed to be directly linked to the velocity of the inlet streams entering the combustion chamber. Sufficient oxidizer momentum is crucial to form a proper recirculation zone, which, in turn, stabilizes the flame. With increasing thermal power, the development of the recirculation zone becomes easier, thereby enhancing flame stability.
In a comparison of air and oxy-fuel operating conditions, three different oxygen contents (27%, 30%, and 33%) with flue gas recirculation are analyzed. The results show that oxy-fuel combustion behaves stably for the chosen conditions, maintaining a constant air ratio and volume flow. However, achieving perfect similarity between the air and oxy-fuel flames is not possible for every boundary condition. A similar flame shape and length can be obtained in the air and oxy-fuel cases when using an oxygen content of 33%. Alternatively, an oxygen content of 27% in the oxy-fuel case can achieve combustion temperatures in the chamber similar to those in the air combustion case. This implies that the radiative heat transfer from the flame to the boiler walls and the temperature distribution in the flue gas cannot be directly aligned between oxy-fuel and air combustion. The results presented in this paper contribute to the development of new burners for oxy-fuel combustion, particularly for retrofitting existing power plants. However, further knowledge of the system is necessary to optimize the development process. To gather detailed information on oxy-fuel processes, several approaches are feasible. First, detailed analyses of the combustion chemistry should be conducted to gain a deeper understanding of the process. Second, the optimization of the process to align with traditional air combustion parameters and facilitate the retrofit of combustion systems could be explored. For this purpose, it is important not only to interpret individual parameters but also to consider the overall deviation from conventional air combustion.

Author Contributions

Conceptualization, D.K. and M.R.; methodology, D.K.; validation, D.K.; formal analysis, D.K.; data curation, D.K.; writing—original draft preparation, D.K., M.R. and J.S.; writing—review and editing, D.K.; visualization, D.K.; supervision, J.S. and B.E.; funding acquisition, B.E. All authors have read and agreed to the published version of the manuscript.

Funding

This study was funded by the Deutsche Forschungsgemeinschaft (DFG, German Research Foundation)— Project No. 215035359—TRR 129 ‘Development of Models and Methods to describe Solid Fuel Combustion in an Oxy-Fuel Atmosphere’ (Subproject C7).

Data Availability Statement

The original contributions presented in the study are included in the article; further inquiries can be directed to the corresponding author.

Conflicts of Interest

The authors declare no conflicts of interest.

Abbreviations

The following abbreviations are used in this manuscript:
Abbreviations:
ARas-recieved
DRYdry
DAFdry and ash-free
OPoperating condition
WSwalnut shell
Latin Symbols:
I[N]momentum
L[Nm]angular momentum
m ˙ [kg/s]mass flow
M R [-]fuel momentum ratio
r[m]radius
S[-]swirl number
u[m/s]velocity
V ˙ [kg/s]volume flow
Subscripts:
axialaxial
fuelfuel
globglobal
loclocal
O2oxygen
secsecondary
solidsolid
Stoistoichiometric
swirlswirl
tertertiary
TGtransport gas
Greek Symbols:
α [ ° ]swirl angle of incidence
λ [-]air-to-fuel ratio

References

  1. Chen, L.; Yong, S.Z.; Ghoniem, A.F. Oxy-fuel combustion of pulverized coal: Characterization, fundamentals, stabilization and CFD modeling. Prog. Energy Combust. Sci. 2012, 38, 156–214. [Google Scholar] [CrossRef]
  2. Kindra, V.; Rogalev, A.; Lisin, E.; Osipov, S.; Zlyvko, O. Techno-Economic Analysis of the Oxy-Fuel Combustion Power Cycles with Near-Zero Emissions. Energies 2021, 14, 5358. [Google Scholar] [CrossRef]
  3. Rogalev, N.; Rogalev, A.; Kindra, V.; Zlyvko, O.; Bryzgunov, P. Review of Closed SCO2 and Semi-Closed Oxy–Fuel Combustion Power Cycles for Multi-Scale Power Generation in Terms of Energy, Ecology and Economic Efficiency. Energies 2022, 15, 9226. [Google Scholar] [CrossRef]
  4. Silva, R.C.; Kangwanpongpan, T.; Krautz, H.J. Flame pattern, temperatures and stability limits of pulverized oxy-coal combustion. Fuel 2014, 115, 507–520. [Google Scholar] [CrossRef]
  5. Guo, J.; Zhang, T.; Huang, X.; Luo, W.; Hu, F.; Luo, Z.; Li, P.; Liu, Z. Oxy-Fuel Combustion Characteristics of Pulverized Coal in a 3 MW Pilot-Scale Furnace. Energy Fuels 2018, 32, 10522–10529. [Google Scholar] [CrossRef]
  6. Wall, T.; Liu, Y.; Elliott, C.S.L.; Khare, S.; Rathnam, R.; Zeenathal, F.; Moghtaderi, B.; Buhre, B.; Sheng, C.; Gupta, R.; et al. An overview on oxyfuel coal combustion—State of the art research and technology development. Chem. Eng. Res. Des. 2009, 87, 1003–1016. [Google Scholar] [CrossRef]
  7. Toporov, D.; Bocian, P.; Heil, P.; Kellermann, A.; Stadler, H.; Tschunko, S.; Förster, M.; Kneer, R. Detailed investigation of a pulverized fuel swirl flame in CO2/O2 atmosphere. Combust. Flame 2008, 155, 605–618. [Google Scholar] [CrossRef]
  8. Hees, J.; Zabrodiec, D.; Massmeyer, A.; Pielsticker, S.; Gövert, B.; Habermehl, M.; Hatzfeld, O.; Kneer, R. Detailed analyzes of pulverized coal swirl flames in oxy-fuel atmospheres. Combust. Flame 2016, 172, 289–301. [Google Scholar] [CrossRef]
  9. Habermehl, M.; Hees, J.; Maßmayer, A.; Zabrodiec, D.; Hatzfeld, O.; Kneer, R. Comparison of Flame Stability Under Air and Oxy-Fuel Conditions for an Aerodynamically Stabilized Pulverized Coal Swirl Flame. J. Energy Resour. Technol. 2016, 138, 042209. [Google Scholar] [CrossRef]
  10. Özer, B.; Maßmeyer, A.; Zabrodiec, D.; Hatzfeld, O.; Kneer, R. Experimental Study on the Influence of Methane- Cofiring on Pulverized Coal Flames under Air and Oxy- Fuel Conditions. In Proceedings of the 30. Deutscher Flammentag, Hannover-Garbsen, Germany, 28–29 September 2021; Available online: https://d-nb.info/1253376840/34 (accessed on 10 September 2024).
  11. Özer, B.; Zabrodiec, D.; Kneer, R.; Maßmeyer, A. Experimental investigation of 40 kWth methane-assisted and self-sustained pulverized biomass flames. Proc. Combstion Inst. 2023, 39, 3343–3351. [Google Scholar] [CrossRef]
  12. Schneider, H.; Bonarens, M.; Hebel, J.; Hamel, H.; Emmert, J.; Böhm, B.; Wagner, S.; Kneer, R.; Dreizler, A. Combined flow, temperature and soot investigation in oxy-fuel biomass combustion under varying oxygen concentrations using laser-optical diagnostics. Fuel 2024, 362, 130771. [Google Scholar] [CrossRef]
  13. Schneider, H.; Valentiner, S.; Vorobiev, N.; Böhm, B.; Schiemann, M.; Scherer, V.; Kneer, R.; Dreizler, A. Investigation on flow dynamics and temperatures of solid fuel particles in a gas-assisted oxy-fuel combustion chamber. Fuel 2021, 286, 119424. [Google Scholar] [CrossRef]
  14. Emmert, J.; Schneider, H.; Meißner, C.; Sidiropoulos, E.; Hölzer, J.I.; Seeger, T.; Böhm, B.; Dreizler, A.; Wagner, S. Characterization of temperature distributions in a swirled oxy-fuel coal combustor using tomographic absorption spectroscopy with fluctuation modelling. Appl. Energy Combust. Sci. 2021, 6, 100025. [Google Scholar] [CrossRef]
  15. Smart, J.; Lu, G.; Yan, Y.; Riley, G. Characterisation of an oxy-coal flame through digital imaging. Combust. Flame 2010, 157, 1132–1139. [Google Scholar] [CrossRef]
  16. Hjärtstam, S.; Andersson, K.; Johnsson, F.; Leckner, B. Combustion characteristics of lignite-fired oxy-fuel flames. Fuel 2009, 88, 2216–2224. [Google Scholar] [CrossRef]
  17. Becker, L.G.; Kosaka, H.; Böhm, B.; Doost, S.; Knappstein, R.; Habermehl, M.; Kneer, R.; Janicka, J.; Dreizler, A. Experimental investigation of flame stabilization inside the quarl of an oxyfuel swirl burner. Fuel 2017, 201, 124–135. [Google Scholar] [CrossRef]
  18. Becker, L.G.; Pielsticker, S.; Böhm, B.; Kneer, R.; Dreizler, A. Particle dynamics in a gas assisted coal combustion chamber using advanced laser diagnostics. Fuel 2020, 269, 117188. [Google Scholar] [CrossRef]
  19. Lei, J.; Wang, Y.; Wang, Q.; Deng, S.; Fu, Y. Evaluation of Kinetic and Thermodynamic Parameters of Pyrolysis and Combustion Processes for Bamboo Using Thermogravimetric Analysis. Processes 2024, 12, 2458. [Google Scholar] [CrossRef]
  20. Pielsticker, S.; Gövert, B.; Kreitzberg, T.; Habermehl, M.; Hatzfeld, O.; Kneer, R. Simultaneous investigation into the yields of 22 pyrolysis gases from coal and biomass in a small-scale fluidized bed reactor. Fuel 2017, 190, 420–434. [Google Scholar] [CrossRef]
  21. Zabrodiec, D.; Massmeyer, A.; Hees, J.; Hatzfeld, O.; Kneer, R. Flow Pattern and Behavior of 40 kWth Pulverized Torrefied Biomass Flames under Atmospheric and Oxy-fuel Conditions. Renew. Sustain. Energy Rev. 2019, 138, 110493. [Google Scholar] [CrossRef]
  22. Richter, M.; Ströhle, J.; Epple, B. Up-scaling of a laboratory-scale pulverised oxyfuel burner to semi-industrial-scale through a flow similarity approach. Fuel 2024, 371, 131809. [Google Scholar] [CrossRef]
  23. Stroh, A.; Alobaid, F.; Busch, J.; Stroehle, J.; Epple, B. 3-D numerical simulation for co-firing of torrefied biomass in a pulverized-fired 1 MWth combustion chamber. Energy 2015, 85, 105–116. [Google Scholar] [CrossRef]
  24. Stadler, H.; Christ, D.; Habermehl, M.; Heil, P.; Kellermann, A.; Ohliger, A.; Toporov, D.; Kneer, R. Experimental investigation of NOx emissions in oxycoal combustion. Fuel 2011, 90, 1604–1611. [Google Scholar] [CrossRef]
  25. DIN 51718; Testing of Solid Fuels—Determination of the Water Content and the Moisture of Analysis Sample. DIN e.V.: Berlin, Germany, 2002.
  26. DIN 51719; Testing of Solid Fuels—Solid Mineral Fuels - Determination of Ash Content. DIN e.V.: Berlin, Germany, 1997.
  27. DIN 51720; Testing of Solid Fuels—Determination of Volatile Matter Content. DIN e.V.: Berlin, Germany, 2001.
  28. DIN 51733; Testing of Solid Mineral Fuels—Ultimate Analysis and Calculation of Oxygen Content. DIN e.V.: Berlin, Germany, 2016.
  29. DIN 51900; Testing of Solid and Liquid Fuels—Determination of Gross Calorific Value by the Bomb Calorimeter and Calculation of Net Calorific Value. DIN e.V.: Berlin, Germany, 2023.
  30. Lauer, M.; Zellhuber, M.; Sattelmayer, T. Determination of the Heat Release Distribution in Turbulent Flames by a Model Based Correction of OH Chemiluminescence. J. Eng. Gas Turbines Power 2011, 133, 121501. [Google Scholar] [CrossRef]
  31. Johansson, R.; Leckner, B.; Andersson, K.; Johnsson, F. Influence of particle and gas radiation in oxy-fuel combustion. Int. J. Heat Mass Transf. 2013, 65, 143–152. [Google Scholar] [CrossRef]
  32. Richter, M.; König, D.; Ströhle, J.; Epple, B. Radiative Heat Flux Measurement in a Semi-Industrial Oxyfuel Combustion Chamber with Biomass and Coal. Energies 2024, 17, 2735. [Google Scholar] [CrossRef]
  33. Claypole, T.C.; Syred, N. The Effect of Swirl Burner Aerodynamics on NOx Formation. Eighteenth Symp. Combust. 1981, 18, 81–89. [Google Scholar] [CrossRef]
  34. Croiset, E.; Thambimuthu, K.; Palmer, A. Coal combustion in O2/CO2 mixtures compared with air. Can. J. Chem. Eng. 2000, 78, 402–407. [Google Scholar] [CrossRef]
  35. González-Cencerrado, A.; Peña, B.; Gil, A. Experimental analysis of biomass co-firing flames in a pulverized fuel swirl burner using a CCD based visualization system. Fuel Process. Technol. 2015, 130, 299–310. [Google Scholar] [CrossRef]
  36. Chen, R.H.; Driscoll, J.F.; Kelly, J.; Namazian, M.; Schefer, R.W. A Comparison of Bluff-Body and Swirl-Stabilized Flames. Combust. Sci. Technol. 1990, 71, 197–217. [Google Scholar] [CrossRef]
  37. Marinov, S. Untersuchung der Flammenstabilität von Geometrisch ähnlichen Brennern für zukünftige Magere Triebwerksbrennkammerkonzepte. 2015. Available online: https://core.ac.uk/download/pdf/197546023.pdf (accessed on 4 August 2024).
Figure 1. Scheme of the oxy-fuel combustion chamber setup for solid fuel combustion. Three different operating modes are possible: air, oxy-fuel with flue gas recirculation, and synthetic oxy-fuel combustion.
Energies 18 01513 g001
Figure 2. (Left) vertical cut of the combustion chamber setup with the measurement ports I–VI. (Right) radial cut of the combustion chamber and thus the different measurement ports. The two a ports have a height of 100 mm and a width of 20 mm, and the b port has a square size with an edge length of 100 mm. The three ports c, d, and e have a cylindrical shape with a diameter of 80 mm. The camera is mounted at port b.
Energies 18 01513 g002
Figure 3. Detailed view of the inlet streams of the burner, shown in Figure 2. A-A depicts the central outlet of the primary, secondary, and fuel streams.
Energies 18 01513 g003
Figure 4. CO concentration in different operating conditions depicted over the local and global ARs. Operating conditions marked with a dot have a thermal power of 500 kWth, and those marked with a square have a thermal power of 750 kWth. Dashed lines visualize the stability boundary (orange) and the lean blow of limit (purple).
Energies 18 01513 g004
Figure 5. Detailed view of four operating conditions with a constant local air ratio of 0.88 , a constant swirl number of 0.95 , and variations in the global air ratio.
Energies 18 01513 g005
Figure 6. The CO concentration in different air operating conditions over the global AR and the swirl number. Operating conditions marked with a dot have a thermal power of 500 kWth, and those marked with a square have a thermal power of 750 kWth. Dashed lines visualize the stability boundary (orange) and the lean blow of limit (purple).
Energies 18 01513 g006
Figure 7. CO concentration in different operating conditions written over the inlet velocity of the axial and swirl secondary streams. Operating conditions marked with a dot have a thermal power of 500 kWth, and those marked with a square have a thermal power of 750 kWth. The operating conditions marked with a triangle feature a thermal power of at least 400 kWth. Dashed orange lines visualize the stability boundary.
Energies 18 01513 g007
Figure 8. Two mean images at port four for different swirl numbers but similar thermal power, global, and local air ratios. Yellow shows a higher intensity, and blue shows a lower intensity. A high intensity depicts an increased flame radiation and thus the position of the heat release of the flame. The left side (a) shows a flame with a higher swirl number, and the right side (b) shows a flame with a lower swirl number.
Energies 18 01513 g008
Figure 9. Normalized intensity images of the flame in the combustion chamber for (a) air operating conditions and oxy 27% (b), oxy 30% (c), and oxy 33% (d) operating conditions. Darker red shows a higher intensity, and lighter red shows a lower intensity. A higher intensity describes an increased flame radiation at this position and thus the flame position. Slight variations in the images are due to a changed field of view of the camera setup. The dotted blue line symbolizes the outer flame shape and the end of the flame.
Energies 18 01513 g009
Figure 10. Temperature distribution for the air (red) and three oxy operating conditions with 27% O2 content (blue), 30% O2 content (black), and 33% O2 content (green) at different heights. The error bars show the standard deviation of the temperature over the measurement.
Energies 18 01513 g010
Table 1. Geometric dimensions of the different input flows of the burner.
ChannelMean RadiusChannel WidthAngle of Incidence
[mm][mm][ ° ]
Solid Fuel 45.9 9.8 0.0
Primary Stream 24.2 15.5 45.0
Secondary Stream Swirl 98.2 12.5 45.0
Secondary Stream Axial 112.7 6.4 0.0
Tertiary Stream 332.5 28.0   1 0.0
1 Diameter of one tertiary stream channel.
Table 2. Ultimate and proximate analyses of walnut shells. The acronyms AR, DRY, and DAF describe the fuel as as-received, dry, and dry and ash-free, respectively.
UnitARDRYDAF
C[wt%] 47.6 51.2 51.6
H[wt%] 6.0 6.5 6.5
O[wt%] 38.1 41.1 41.4
N[wt%] 0.3 0.3 0.3
S[wt%] 0.0 0.0 0.0
Ash[wt%] 0.7 0.7
H2O[wt%] 7.1
C (fix)[wt%] 11.3 12.2 12.2
Volatiles[wt%] 80.8 87.1 87.7
LHV[MJ/kg] 16.0 17.2 17.3
HHV[MJ/kg] 18.9 20.3 20.5
Table 3. Particle size distribution of walnut shells.
PropertyUnitValue
Vol. Mean Diameter[µm] 190.6
D10[µm] 153.8
D50[µm] 193.6
D90[µm] 220.7
Vol. Mean Diameter Sphericity[-] 0.7492
Vol. Mean Aspect Ratio[-] 1.52
Vol. Mean Eccentricity[-] 0.71
Table 4. Measuring range of the gas analyzer units in the flue gas. All species are measured under dry conditions.
PropertyUnitValue
O2[Vol%]0–30
CO2[Vol%]0–100
CO[Vol%]0–5
NO[ppm]0–1000
Table 5. Range of the varied operating conditions for the stability analysis.
ParameterOperational Range
Global Air Ratio1.5–2.0
Local Air Ratio0.7–1.2
Swirl Number0.7–1.0
Table 6. Summary of the analyzed operation conditions in the combustion chamber.
Parameter AirASAirHMAirLP
Global Air Ratio[-] 1.65 1.75 1.7
Local Air Ratio[-] 0.95 1.3 1.2
Th. Power[kWth] 520.0 410.0 420.0
Table 7. Analyzed air and oxy-fuel operating conditions in the air staging case.
Parameter AirOXY-27pOXY-30pOXY-33p
Global Air Ratio[-] 1.65 1.75 1.75 1.75
Local Air Ratio[-] 0.95 0.95 0.95 0.95
Th. Power[kWth] 520.0 570.0 610.0 650.0
Oxidizer Inlet Temperature[ ° C] 50.0 80.0 70.0 70.0
O2 Content Oxidizer[Vol%] 21.0 27.0 30.0 33.0
Moisture Oxidizer[Vol%]ambient 7.9 7.8 7.7
O2 Content Transport Gas[%] 21.0 15.0 15.0 15.0
Disclaimer/Publisher’s Note: The statements, opinions and data contained in all publications are solely those of the individual author(s) and contributor(s) and not of MDPI and/or the editor(s). MDPI and/or the editor(s) disclaim responsibility for any injury to people or property resulting from any ideas, methods, instructions or products referred to in the content.

