1. Introduction
Bucket elevators are used for transporting bulk or fine-grained materials (such as grain, fine coal, or coke) and for powdery or dusty materials (e.g., cement, lime), especially in the vertical direction. For this reason, they are used in agriculture, mining, factories, and power plants. Their use is particularly justified in cases where materials need to be moved to great heights but there is limited floor space. Thus, some of the most notable advantages of bucket elevators include their ability to transport material to heights exceeding 50 m while taking up a relatively small area compared to, for example, belt conveyors; their high conveying capacities of up to several hundred tons per hour; and their sealed housing, which eliminates environmental pollution when handling dusty materials. The efficiency of the transport process depends on both the properties of the transported material and the design of the device [
1,
2,
3,
4,
5,
6].
However, bucket elevators are not suitable for transporting non-flowing materials that clump and cause problems at the discharge point when the buckets are emptied. There are also other limitations regarding their applicability that stem from their disadvantages, such as their heavy weight and sensitivity to overloading, which can damage the chain and cause elevator blockage. Another disadvantage is the relatively low durability of the chain, buckets, and sprockets, which are especially susceptible to wear when transporting highly abrasive and corrosive materials. With this in mind, the development and implementation of an effective diagnostic method is desirable.
An important component of bucket elevators is their drive system. Reference [
7] presents a detailed and advanced numerical analysis of the components of the drive system of a bucket elevator. The article presents a methodology for designing and assessing the safety of drive systems, which can be successfully applied to other systems.
Most often, chain or belt systems are used as the operating mechanisms of roller conveyors [
4,
7,
8,
9,
10,
11].
An advanced operation-simulation method for evaluating the conveying process in bucket elevators is presented in reference [
12]. An analysis revealed that the number of buckets, the feed input rate, and the belt velocity are of crucial importance for the performance of these devices. Another key insight was that the characteristics of the transported material and the geometry of its particles significantly affect the operation of bucket elevators. Other important factors that affect the performance of these elevators include the size and shape of the buckets as well as the amount of material transported in each bucket [
4].
Another work that analyzes the process of discharging bulk material transported by a bucket elevator is [
13]. By comparing the results of a computer simulation with a recording of an actual discharge, the article details the behavior of particles of the transported granular medium during the discharge cycle of a bucket elevator.
The issue of achieving adequate performance of bucket elevators is also analyzed in reference [
14]. By a combined analytical and graphical approach, the authors developed a method that, if applied at the design stage, helps to improve the kinematic parameters of the entire mechanism. Thus, it is possible to determine a geometry of the elevator that eliminates the interference between adjacent buckets. The application of the described method also increases the efficiency of the entire device by providing a more favorable configuration of discharges.
One of the key problems when using bucket elevators is the lack of control regarding the amount of material hauled by individual buckets. This limitation arises from the difficulty of accessing the buckets, because they are enclosed by design. If the distribution of partial masses in the entire elevator is uneven, such a situation may cause overloading, among other things [
15]. It can also lead to disturbances in stability, which are a significant problem not only for bucket elevators [
16,
17,
18].
The amount of material traveling through the conveying space can also affect the flow rate of the bulk cargo and lead to elevator damage under certain conditions. This issue is analyzed in detail in [
19]. An automated method for controlling the filling of individual buckets is presented in [
20]. The method makes use of binocular cameras in conjunction with the Global Filter Network, which enables better control of the transported material. This is essential, because improper bulk cargo control is a fundamental industry problem [
20].
An important factor affecting the operation of bucket elevator systems is vibration. Therefore, the effect of vibrations and the possibility of their damping must be considered when modeling and designing these systems. It is also important to determine the tension force of the working chain so that the elevator operates smoothly [
7,
21,
22,
23,
24].
The service life of bucket elevators can be increased by using a ratchet mechanism that includes a pawl, a spring, and a toothed wheel [
24]. According to the method presented in [
24], the benefit of its application is that it protects the drive system’s components from dropping in the case of chain failure.
Reference [
25] presents a bucket elevator solution that can operate at different speeds, which is achieved by varying the diameter of the pulleys.
In many cases, bucket elevators are operated continuously 24/7 and, therefore, require the maximum possible durability and reliability. This is achieved by making these devices particularly resistant to the destructive effects of degradation processes, such as tribological wear, fatigue, and corrosion [
26].
For these reasons, condition monitoring and diagnosis of possible failures of components and assemblies should be among the main priorities in strategies aimed at ensuring the operational reliability and maintenance of these devices.
Classic diagnostic indicators are the subject of numerous publications, but most of them are concerned with assessing the technical condition of bearings and gear transmissions. This is understandable, as these components and subassemblies are produced and used in large quantities. As a result, appropriate standards and industry guidelines have been developed, specifying, among other things, requirements for the conditions for performing diagnostic tests, as well as criteria for classifying the technical condition of these components (e.g., [
27,
28], and the diagnostic guidelines developed by bearing manufacturers).
In contrast, bucket elevators are manufactured on a much smaller scale and are generally made to order for a specific customer. This is especially true of large-scale bucket elevators. As a consequence, the literature in the field of diagnosis of this class of equipment, especially that concerning the working assemblies of “belt-buckets”, is less numerous. Additionally, to the best of my knowledge, there are no generally available guidelines or recommendations for implementing diagnostic assessment and classification of the technical condition of these assemblies. An analysis of the state of the art further indicates that advanced diagnostic procedures for bucket elevators are lacking [
29,
30,
31].
With this in mind, this article attempts to experimentally verify whether diagnostic indicators are useful in assessing the overall technical condition of bucket elevator working assemblies, i.e., the “belt-buckets” components. This is because these assemblies are crucial for the proper operation of bucket elevators.
This article focuses on the evaluation and verification of the practical application of effective methods and diagnostic factors in real industrial conditions. In particular, excess kurtosis is widely used to diagnose rolling bearings and toothed gears. However, to the best of my knowledge, the classic diagnostic factors have not been used for bucket elevators, and their effectiveness has not been proven or confirmed.
The novelty of this article lies in the introduction of a complex diagnostic approach for assessing the large-scale “belt-buckets” assemblies and the successful verification of the suitability of this approach (which includes, among others, the classic factors, the determination of statistical distributions of vibration signals, and the detection of outliers, as well as my proposed quantile peak factor).
The results of tests conducted under laboratory conditions on an experimental bucket elevator were chosen as the starting point and the basis for this research. Conclusions from the aforementioned experimental studies were used in industrial conditions while testing three large-scale bucket elevators operating in a power plant. In summary, the findings were used to develop fundamentals of condition monitoring system for bucket elevators, which constitutes the main contribution of this article.
2. Purpose of the Research
Machinery diagnostics employs various methods and techniques that focus on testing the residual processes (i.e., those that accompany the main working processes).
Degradation mechanisms that occur in the drive assemblies and working assemblies of bucket elevators can lead to damage. Such degradation is accompanied by vibroacoustic processes (vibration and noise), whose intensity (amplitude) is generally inversely proportional to the technical condition of the components and assemblies.
In real operating conditions, especially when diagnosing large-scale machinery and equipment, such as industrial bucket elevators, the most important vibroacoustic methods are those that use the velocity and acceleration of mechanical vibrations (or acoustic vibrations) as signals containing information about the technical condition of the assemblies under study [
32,
33,
34,
35,
36,
37,
38].
However, when attempting to effectively obtain such information, it is important to choose whether to monitor vibration or noise.
Diagnostic signals such as mechanical vibrations generated by a specific type of damage can be distorted by vibrations generated by nearby kinematic pairs and their potential damage. In such cases, under real operating test conditions, acceleration signals are typically more susceptible to noise than vibration velocity signals.
Moreover, acoustic signals can be further distorted by signals from the surroundings. However, one of the main advantages of acoustic diagnostics is that it is non-invasive, i.e., there is no need to install any sensors, which is particularly important in testing hard-to-reach assemblies.
Vibroacoustic signals with encoded information about the technical condition and operational quality of the device under test are usually stochastic.
Regardless of the chosen methods and measurement apparatus, a crucial prerequisite for a reliable diagnostic evaluation is the processing of signals and the application of appropriate measures to characterize the statistical properties of those signals.
In the context of the diagnosis of bucket elevators, of particular importance are the so-called dimensionless indicators, which, within a specific range, allow for an overall assessment of the technical condition and a comparative assessment of two or more elevators of different sizes and capacities.
The following is a list of equally important attributes that are required for effective diagnostic indicators:
Low sensitivity to the changes in the operating conditions of the device under study (the value of the indicator should not depend on the magnitude of vibroacoustic phenomena).
Explicit correlation between the technical condition (operational quality of the unit) and the value of the indicator.
In diagnosing large-scale machinery and equipment, it can be beneficial to use the so-called dimensionless amplitude parameters, such as the coefficient of variation, crest factor, skewness, and kurtosis (or excess kurtosis) [
31,
39,
40,
41,
42,
43,
44,
45,
46,
47,
48].
Acceptable values for such indices can be found in the literature for ball bearings (e.g., in Bruel and Kjaer publications) or gear transmissions (e.g., [
27,
28]).
However, to the best of my knowledge, the literature lacks recommendations relating to the working assemblies of “belt-buckets” of bucket elevators and the diagnostic criteria that would help define when such devices should be classified as unconditionally acceptable, conditionally acceptable, or unacceptable for long-term operation.
With this in mind, I have attempted to fill the gap in this area. Accordingly, the following were adopted as the main objectives of this research:
Evaluation of the stability of selected diagnostic indicators under varying operating conditions, i.e., for different operating speeds (based on tests on an experimental elevator under laboratory conditions).
Experimental validation of the usefulness of selected diagnostic indicators for assessing the technical condition and operational quality of working assemblies of selected industrial bucket elevators (based on tests under operating conditions).
3. Diagnostic Problems
In order to reliably assess the technical condition of the working assemblies in a bucket elevator, it is necessary to choose a testing method that can also be used effectively in the real operating conditions of such machines. This entails the necessity of adopting a process that serves as the source of information about the technical condition of the tested assembly and choosing signals that are the carriers of such information. Secondly, measures and indicators for these signals must be selected that guarantee an unequivocal diagnostic evaluation.
In mechanical engineering, vibroacoustic methods are deservedly “popular” in diagnosing mechanical machinery and equipment. One of the reasons for this popularity is that vibroacoustic processes and the signals that they generate are generally closely correlated with the technical condition of the machine under study or its assembly. At the same time, vibroacoustic signals (vibration or noise) contain diagnostically relevant information that indicates causal relationships, and they are relatively easy to obtain.
It is much more difficult to select measures (estimators) and indicators of vibroacoustic processes and determine what values should serve as the basis for the final diagnostic evaluation.
The fact is that, in the case of “belt-bucket” working assemblies in bucket elevators, the literature does not offer any recommendations or guidelines that would help to explicitly classify the technical condition of these assemblies as unconditionally acceptable, conditionally acceptable, or unacceptable for long-term operation.
4. Materials and Methods
In my choice of research method, and in performing the evaluation of the usefulness of diagnostic indicators for working assemblies in bucket elevators, I was guided by the following considerations arising from the nature of the studied machines and how they operate:
Bucket elevators usually move material vertically, along a route that is inclined at a significant angle to the horizontal, in suitable buckets attached to an endless belt or chain.
The handled material is most commonly scooped up by the buckets in the boot of the elevator.
The material is hauled upwards inside the filled buckets attached to the belt or chain, which travels along the so-called shaft.
The discharge of the material takes place in the head of the elevator when the buckets are passed over the head wheel. Depending on the speed of the traveling buckets, the material is discharged either by means of centrifugal force or by gravity.
The boundary between these two modes of discharge is determined by the so-called critical speed of travel of the buckets
vcr, given by the following formula:
where
g is the gravitational acceleration,
D is the diameter of the head wheel of the bucket elevator,
h is the mean height of the bucket’s cross-section, and α is the angle of inclination of the bucket during discharge (measured from the vertical in accordance with the rotation of the drive shaft).
Formula (1) results from the balance between the gravity force of the material in the bucket and the centrifugal force acting on that material, which is treated as a concentrated mass.
If the velocity of the buckets is lower than the critical velocity vcr, then the material is discharged in the gravity mode because the force of gravity of the excavated material is greater than the centrifugal force. Conversely, if the velocity of the buckets is greater than the critical velocity vcr, the material is discharged in the centrifugal mode.
The frequency of the above processes depends on the traveling speed and the spacing of the buckets.
Thus, the characteristic dynamic feature of the “belt-buckets” working assembly during operation is a vibration that matches the frequency of bucket discharges and is inversely proportional to the technical condition of the assembly.
In the case of improper operation of the “belt-buckets” working assembly—for instance, due to deterioration or damage—the intensity of vibrations of this assembly increases.
The dynamics of the “belt-buckets” assembly, characterized by the vibration intensity of the bearing nodes, are correlated with the technical condition and the operational quality of this assembly.
Given the above, the rms value of vibration velocity measured on the housing of the bearing nodes of the drive drums in the bucket elevators was selected as the primary diagnostic signal for evaluating the operational quality of the “belt-bucket” assemblies. The usefulness of the rms value of vibration acceleration as a complementary signal was also tested.
The following were adopted as specific objectives and consecutive stages of the diagnostic study:
Determination of numerical values of classic dimensionless indicators: coefficient of variation (CV), crest factor (CF), skewness, and excess kurtosis (K).
Determination of histograms of the values of diagnostic signals of both vibration velocity and vibration acceleration, in the context of evaluating the nature of their statistical distributions.
Detection of outliers (i.e., results that differ significantly from the rest of the results in a given measurement series) based on the analysis of the boxplots for vibration velocity and acceleration signals measured at the bearing nodes of the drive shafts of the bucket elevators under study.
The crest factor is a diagnostic indicator that uses the value of the single most significant peak identified in the signal. However, in tests carried out under industrial conditions, diagnostic signals are generally heavily distorted, and it is not always possible to assess whether single peaks are a symptom of an inferior technical condition (e.g., wear or damage to a component) or the result of a disturbance (e.g., the influence of structural vibrations). This fact can call into question the reliability of a diagnostic assessment based on this indicator.
In view of the above, instead of the classic crest factor, I propose using the quantile peak factor, defined as follows:
where
Q0.95,
Q0.99, and
Me are the 0.95th quantile, the 0.99th quantile, and the median of a signal, respectively.
The quantile peak factor (QPF) is more resistant to random disturbances (noise) that can occur in a signal.
When assessing the technical condition and the operational quality of equipment using classical diagnostic indicators (e.g., the coefficient of variation, excess kurtosis, skewness), it is assumed that diagnostic signals are random variables with normal distributions (i.e., random Gaussian variables).
However, in real industrial conditions, the diagnostic signals usually have non-Gaussian distributions and are generally skewed to the right. This factor is confirmed, among other things, by the author’s research results (e.g., references [
29,
30,
31]).
For this reason, the estimated position parameters, i.e., the mean value and the dispersion or standard deviation, which are the basis for formulating classic diagnostic indicators, may be subject to errors. Even a relatively small number of extreme outliers can significantly affect the results of estimations of these indicators. This influence is thus even more prominent when there are many outliers.
The proposed approach to this problem has the advantage that it strengthens the reliability of the diagnostic evaluation by, among other things, (a) verifying the assumptions that the statistical distributions of signals are normal, (b) assuming more appropriate statistical distributions for analysis, and (c) using outlier detection.
The proposed method does not contest the validity of classic diagnostic factors, primarily the excess kurtosis and the crest factor. Both factors can be suitable provided that there is justification in assuming that the signals are random Gaussian variables.
However, my experience shows that the above condition is not always met in tests carried out under real operating conditions.
5. Object of the Research
The following machines were used to test the usefulness of the diagnostic indicators:
A laboratory bucket elevator installed in the laboratory of the Department of Mechanical Engineering at Wroclaw University of Science and Technology, designated as “LBE”,
Three large industrial bucket elevators operated in a power plant, designated as”IBE#1”, “IBE#2”, and “IBE#3”.
One of the required characteristics of diagnostic indicators is that they should relate to the technical condition of the machine or equipment under test while being relatively insensitive to the operating conditions, especially to operating speeds and loads.
Since the technical condition of a bucket elevator does not change during testing, the diagnostic indicators should also have a constant value (or at most change only slightly), even when the operating parameters of the elevator change (for example, the traveling speed of the buckets).
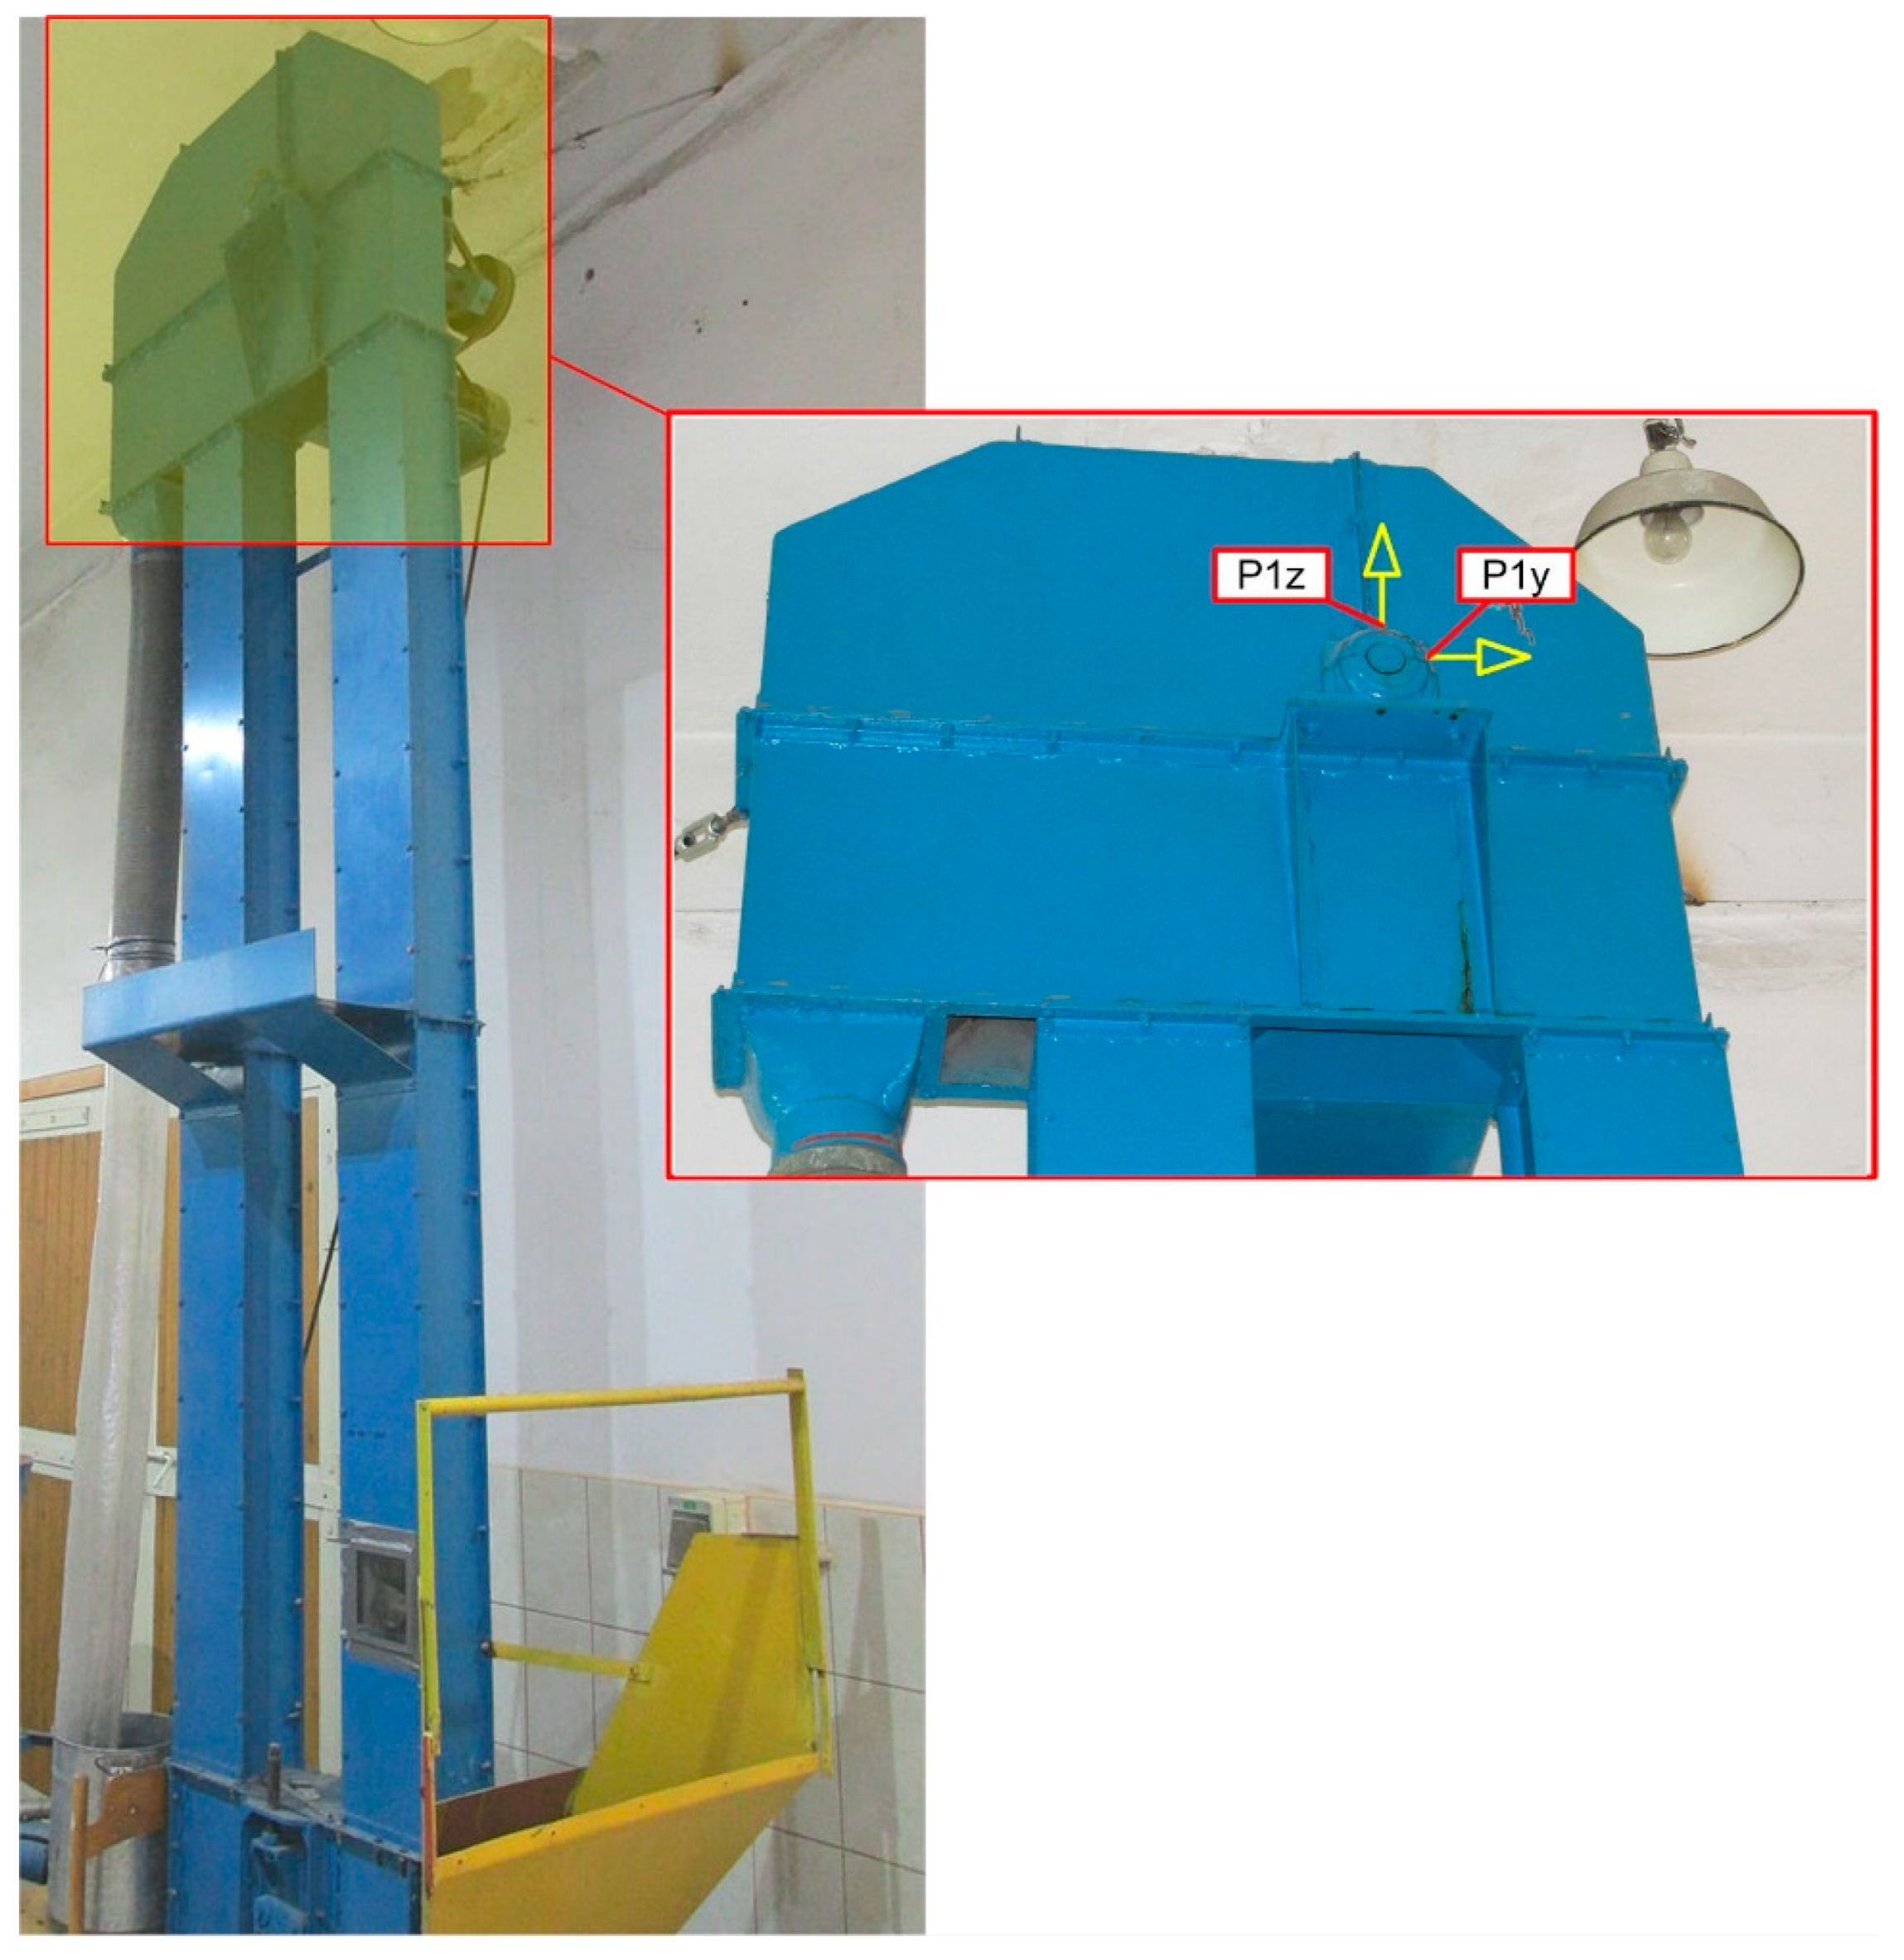
This premise was taken into consideration during an experiment on a laboratory elevator with a conveying height of 3.5 m (s.
Figure 1), which was conducted for several traveling speeds of the buckets. The drive unit of the laboratory bucket elevator comprised an electric motor with an inverter circuit for controlling the speed, which ranged from 0.25 to 1.5 times the critical speed of travel
vcr, as well as a belt transmission to reduce the influence of engine vibrations on the drive shaft.
Similarly, the verification experiment was conducted under actual operating conditions on three large centrifugally discharging elevators operated in a power plant. The conveying heights in those elevators were ca. 27 and 31 m.
For confidentiality reasons, detailed technical data of the tested bucket elevators are not provided here.
Following the recommendations of [
28] the bucket elevators were tested without loading and at the nominal traveling speed of the buckets, as provided by the designer.
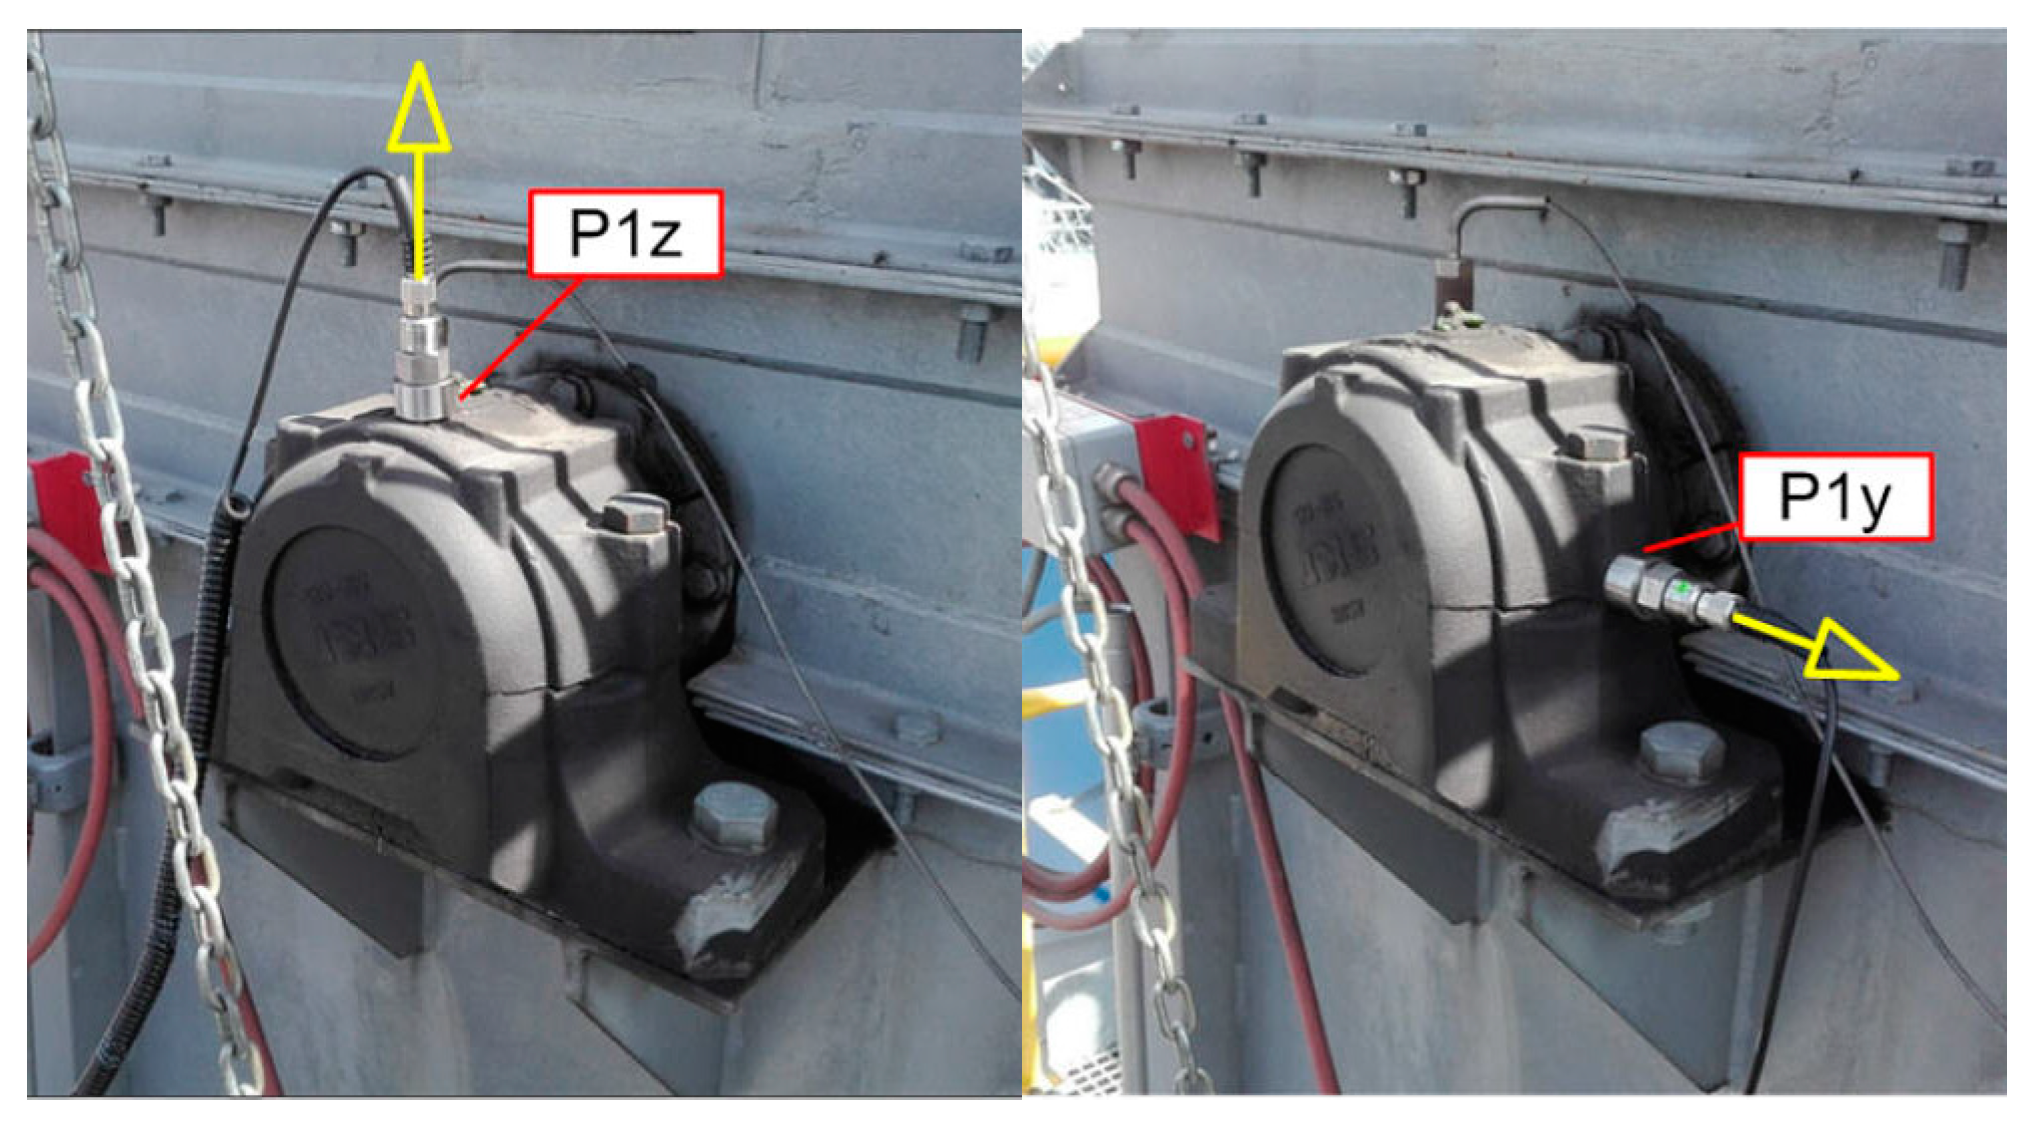
The location of the vibration measurement points, using one industrial elevator as an example, is shown in
Figure 2.
6. Research in Laboratory Conditions
6.1. Results in the Time Domain
Tests on the laboratory bucket elevator (LBE) were carried out for several operating speeds, ranging from k = 0.75 to k = 1.25 of the critical speed vcr (where k = vb/vcr denotes the velocity factor, defined as the ratio of the operating speed of the buckets vb to the critical speed vcr, as determined by Formula (1)).
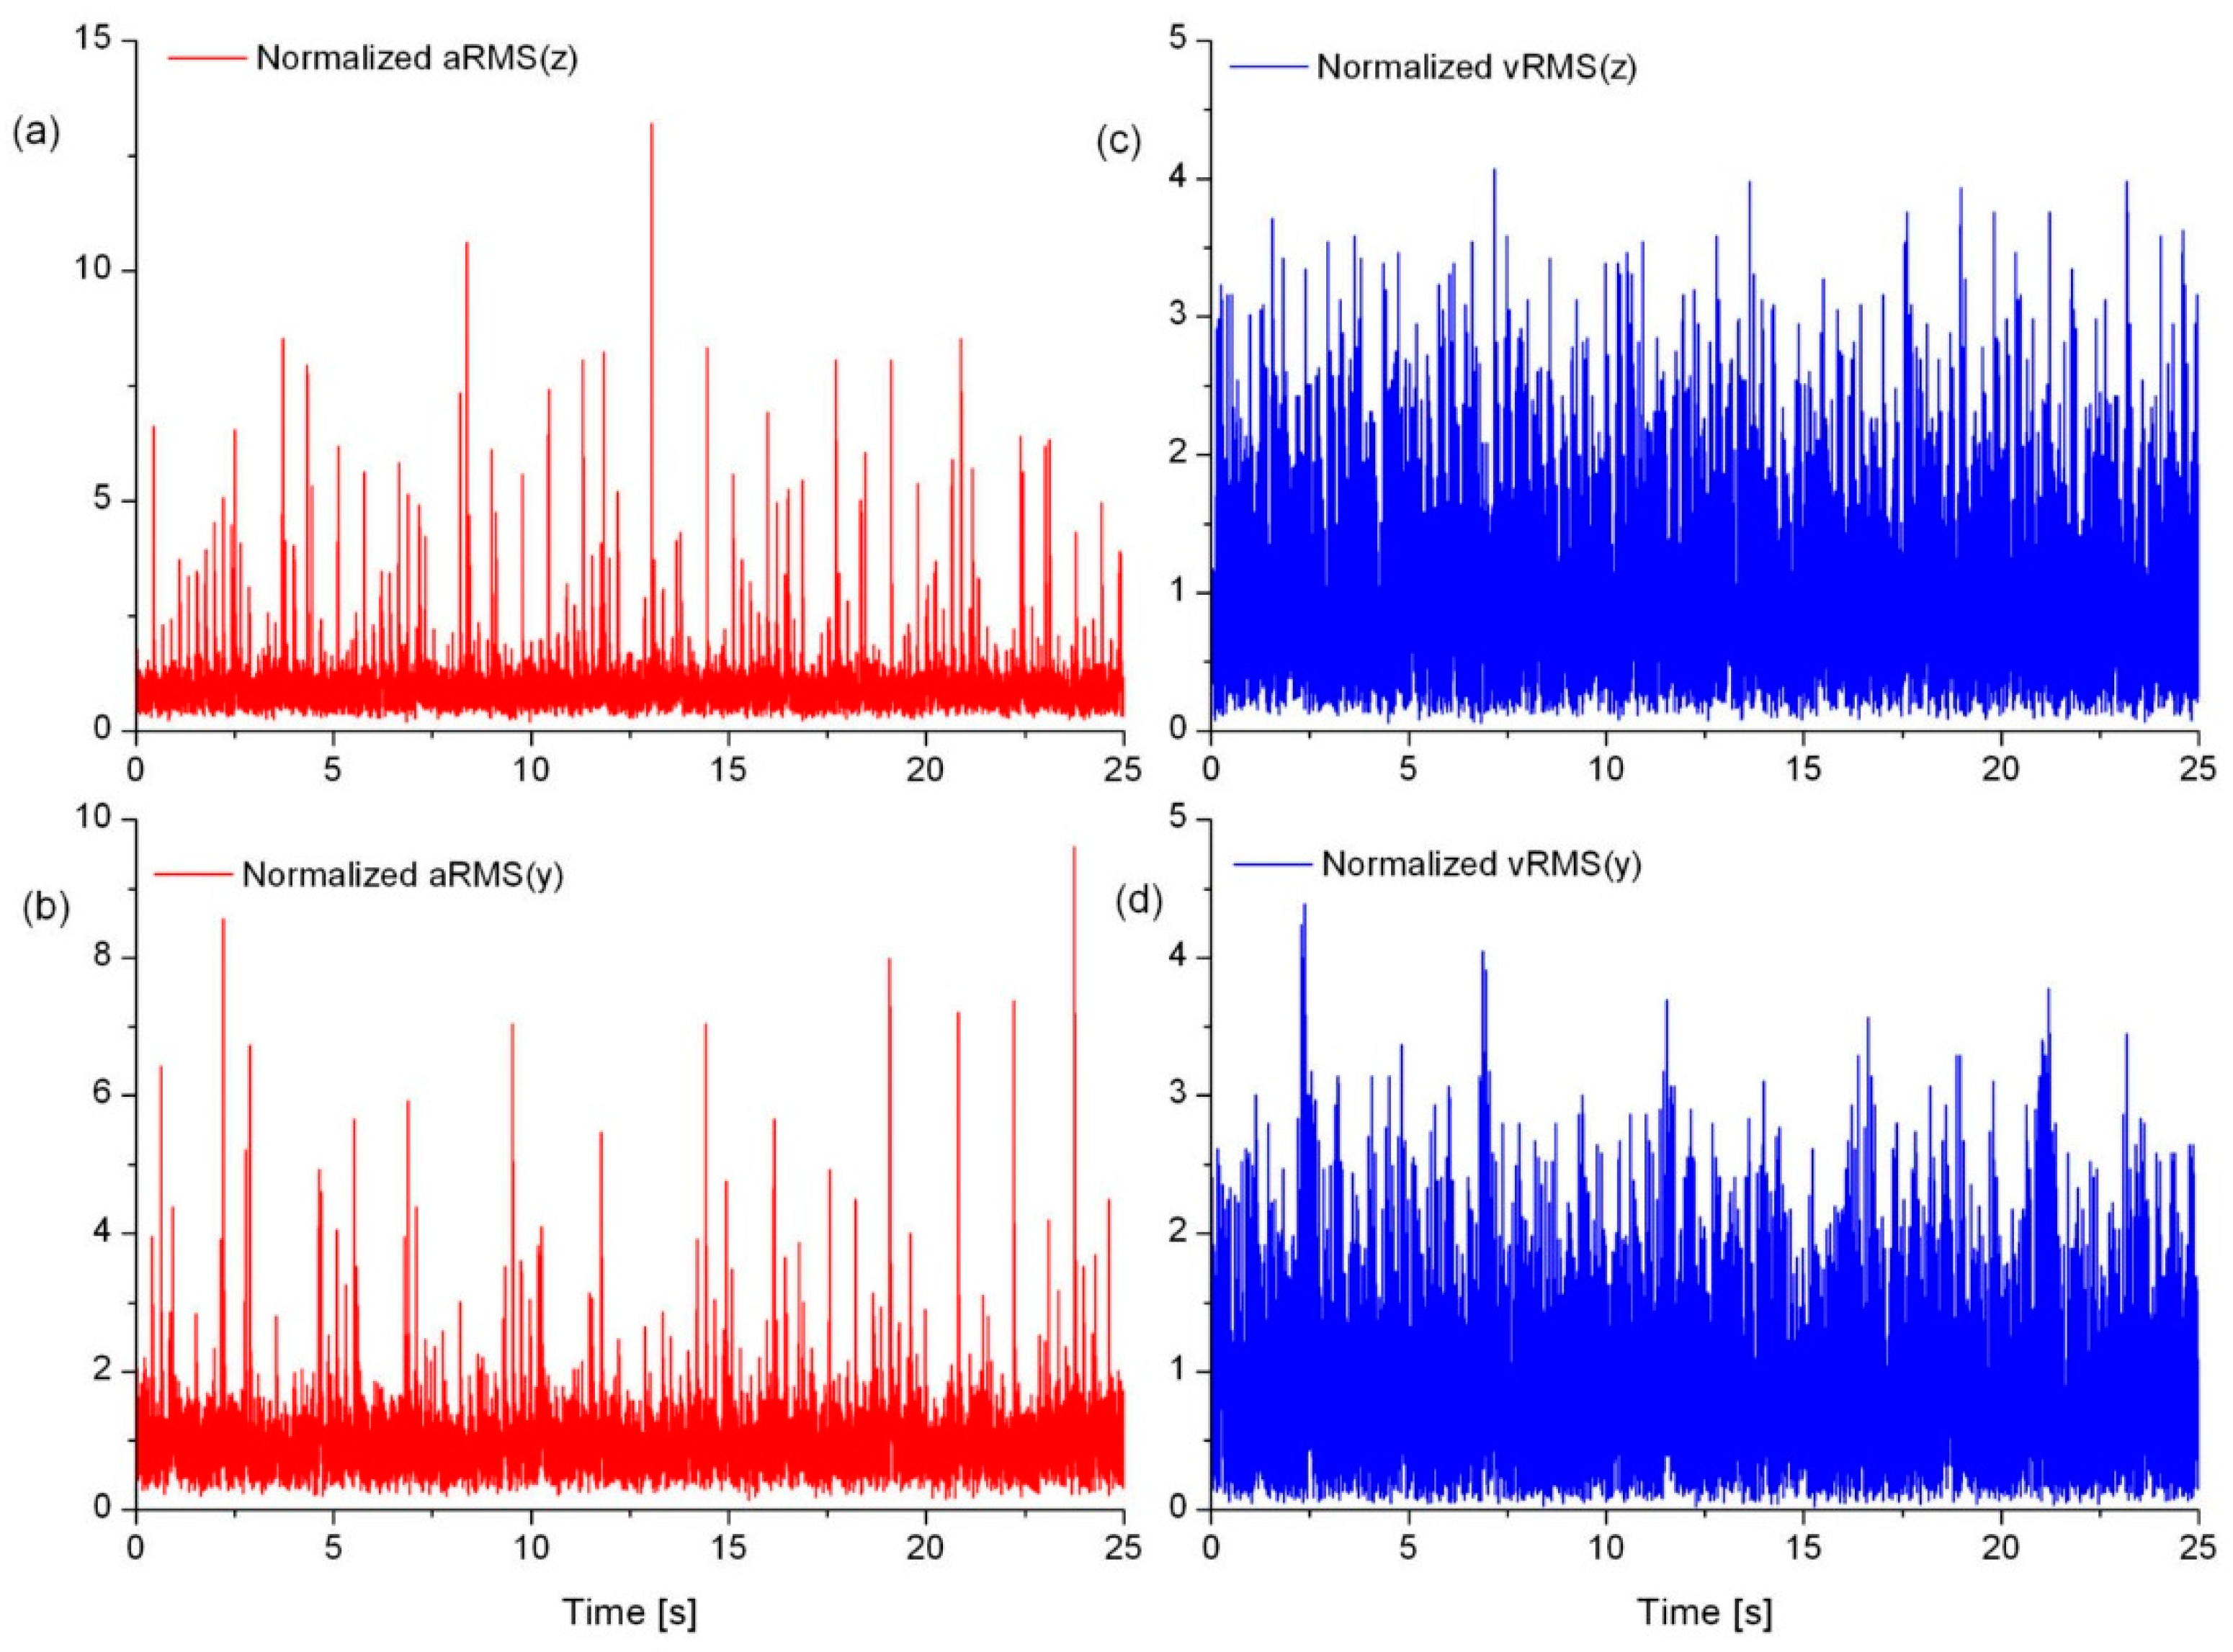
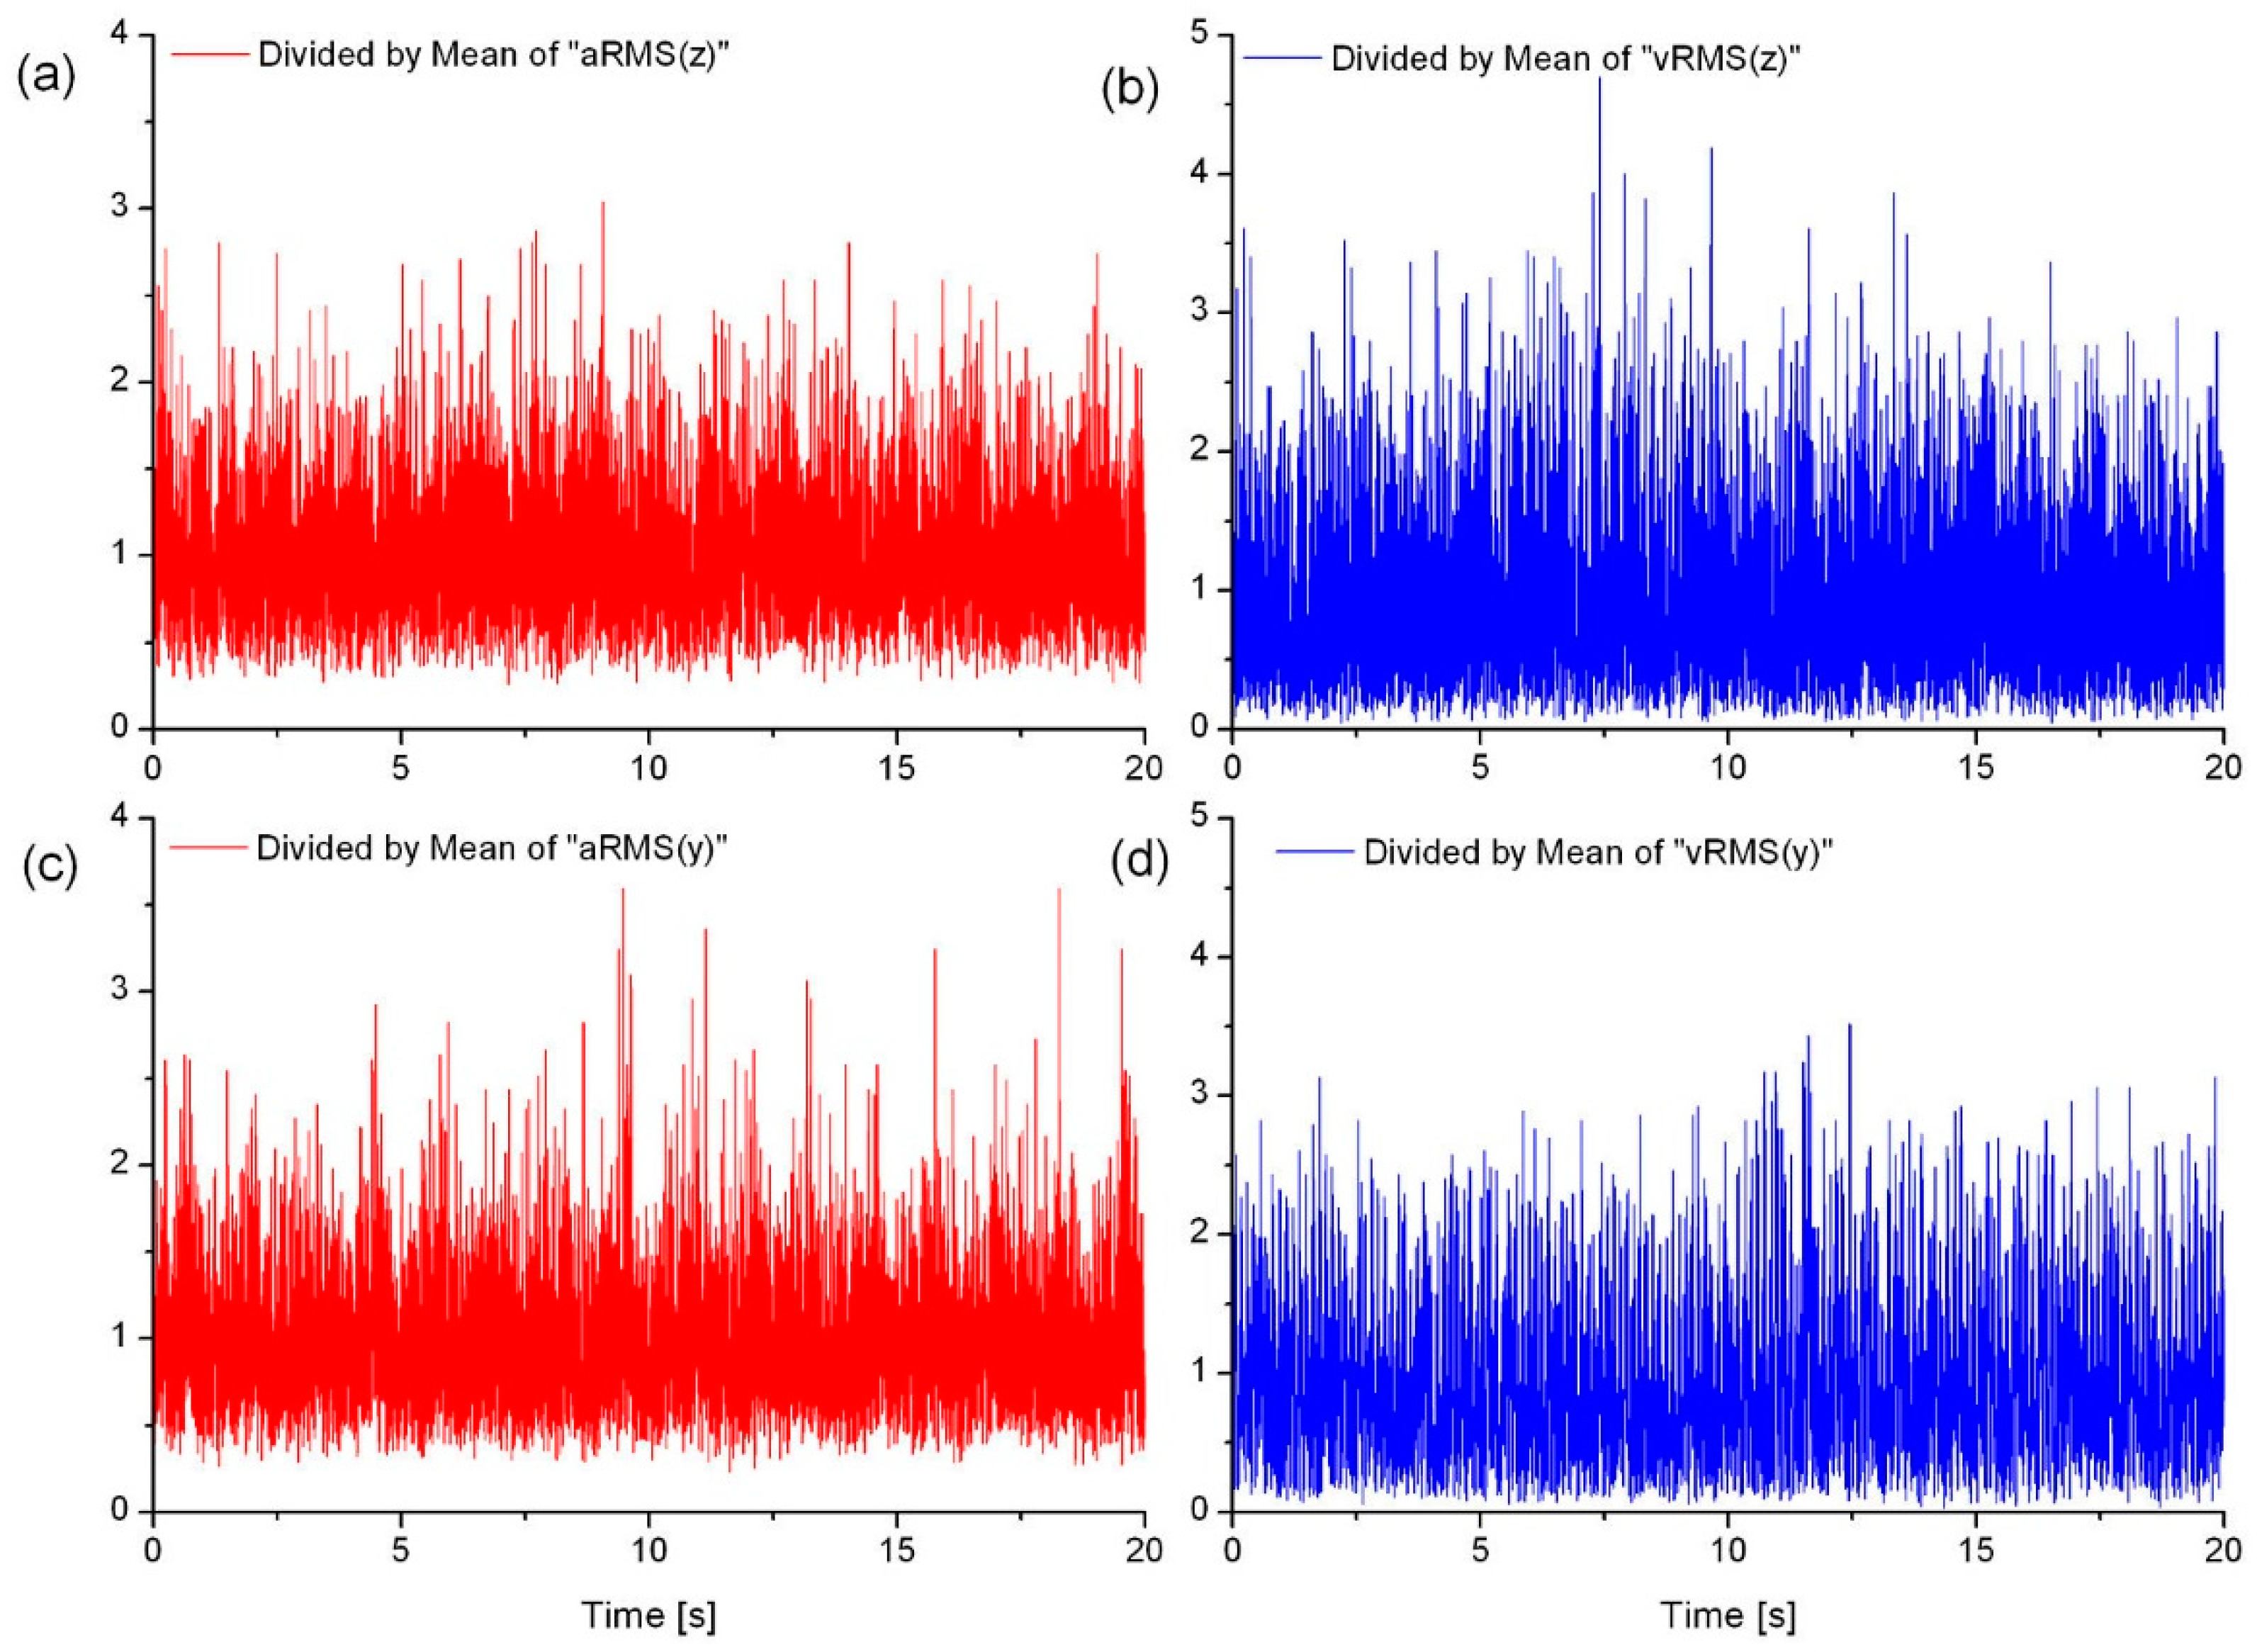
Examples of waveforms of acceleration and vibration velocity measured on the housing of the drive shaft bearing node in the head of the LBE are shown in
Figure 3. Generalized results are presented in the form of normalized signals, i.e., the raw signals divided by their mean values.
The time waveforms of vibration acceleration were characterized by greater dynamics of value changes and greater “noise” compared to the time waveforms of vibration velocity (see
Figure 3).
This sensitivity to potential changes in the technical condition is an advantage of acceleration signals but, on the other hand, they are more susceptible to the influence of disturbances generated by other assemblies that are not being tested, such as structural vibrations of the thin-shelled housing. In other words, vibration acceleration signals are generally more “noisy” than vibration velocity signals.
This fact was taken into consideration when selecting the method for further processing of diagnostic signals.
6.2. Classic Diagnostic Factors
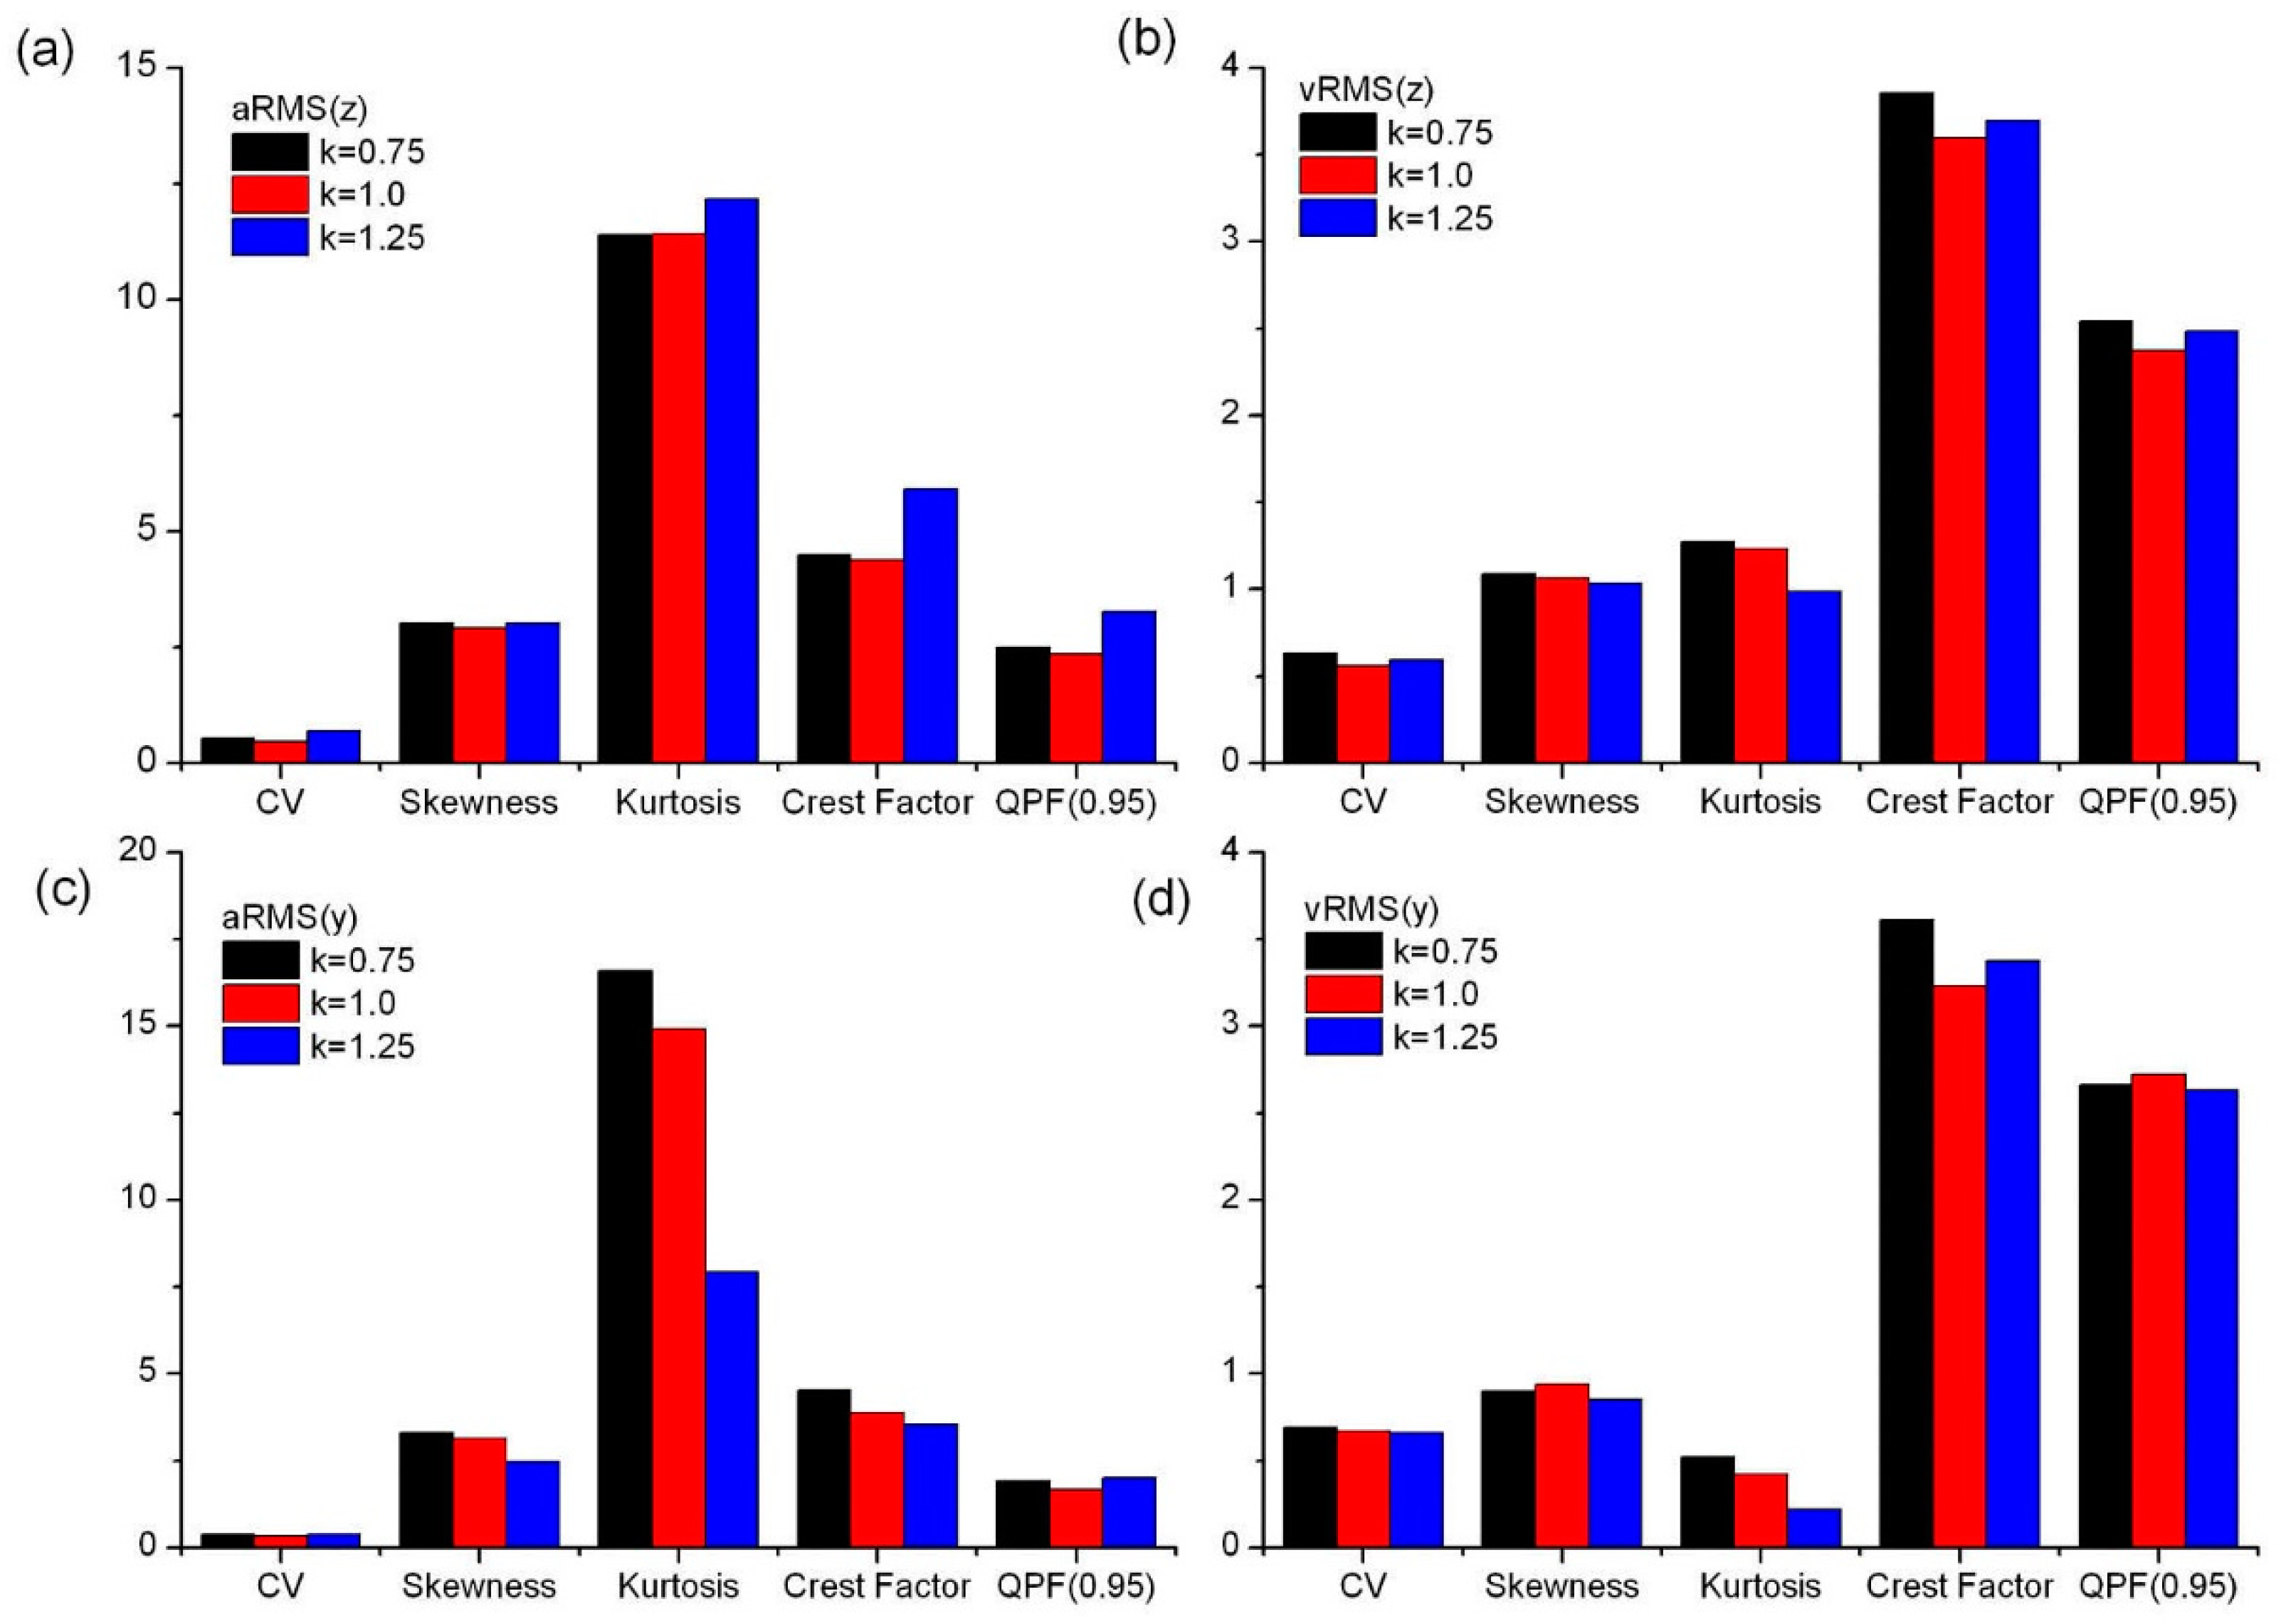
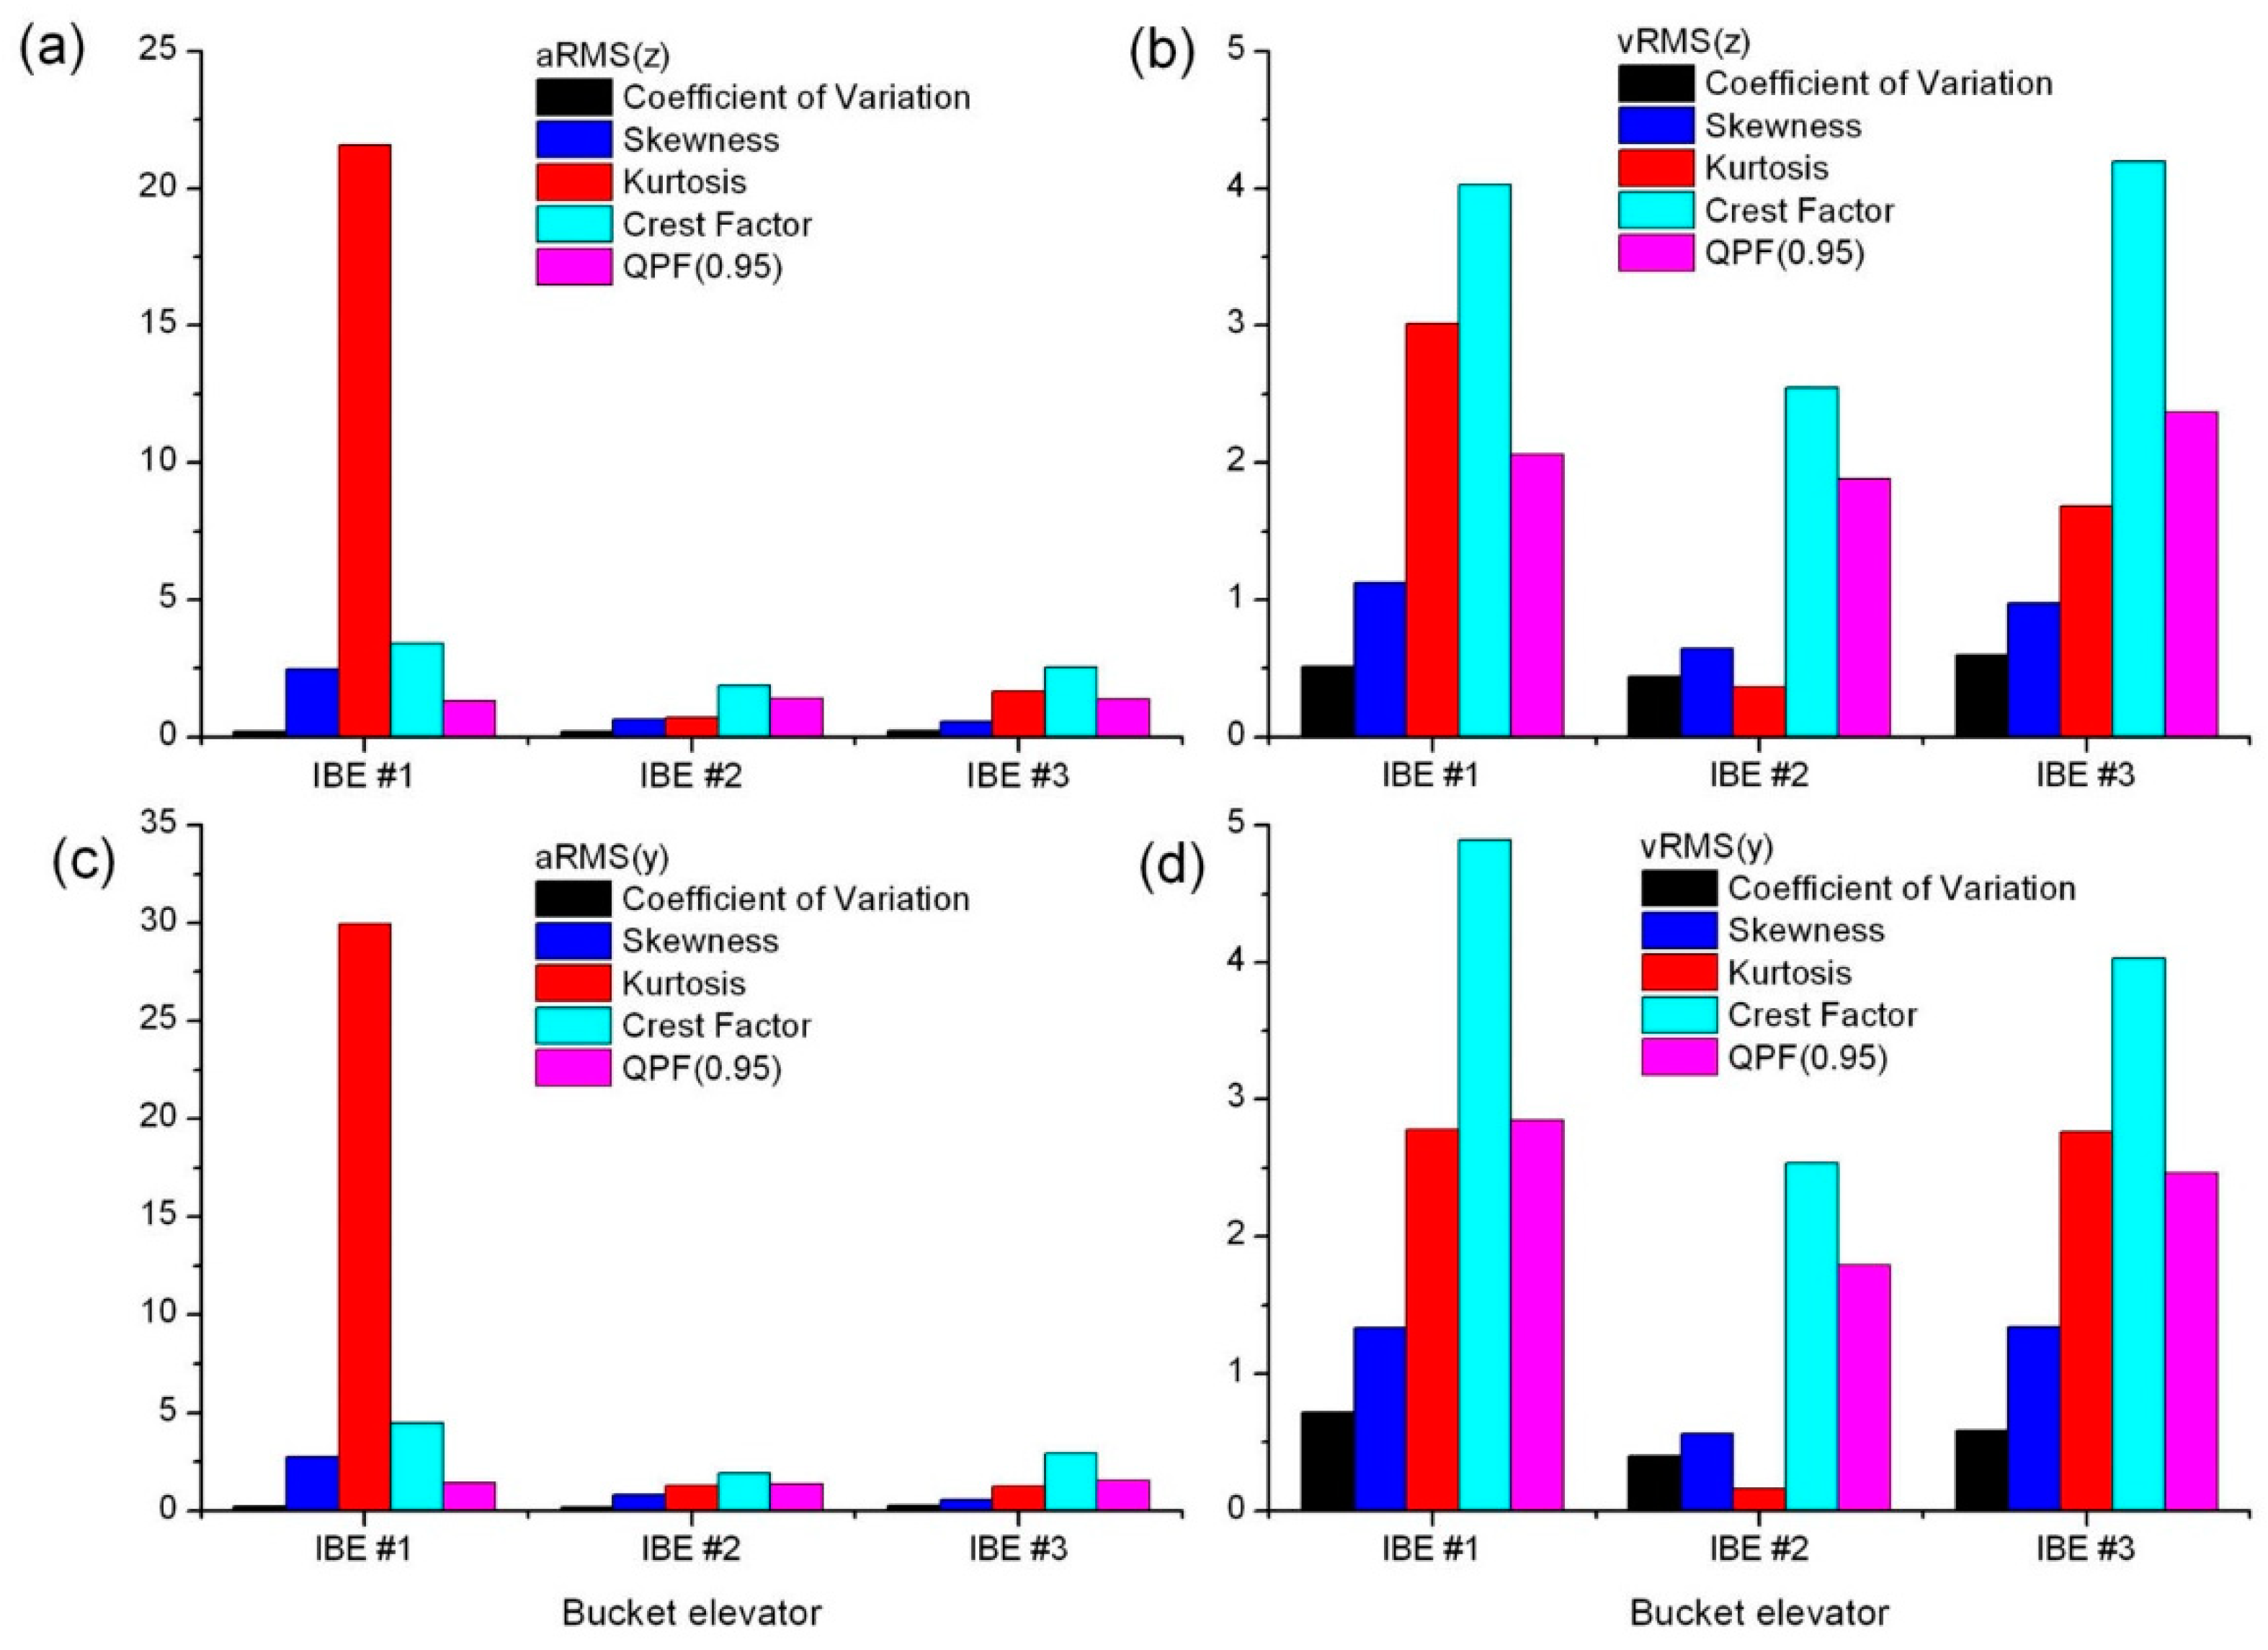
The measured signals were subjected to relevant preprocessing, including low-pass filtering and denoising. Then, the classic diagnostic factors and my proposed quantile peak factor were estimated. The mean values of those factors are presented in
Figure 4.
The results of tests on the laboratory bucket elevator (LBE) were analyzed in order to assess the stability of the values of the determined indicators of diagnostic signals (acceleration and vibration velocity).
It was taken into account that the applicable indicators should be correlated with the technical condition of the bucket elevator while being as independent as possible from its operating conditions, e.g., the operating speed, load, etc.
Diagnostic experiments under laboratory conditions on the LBE were carried out for different bucket traveling speeds, and during this time the technical condition of the elevator did not change.
Therefore, in order to be considered useful for diagnostic purposes, signal indicators should be insensitive to changes in the operating conditions of the elevator, particularly to changes in the operating speed of the buckets.
Rather than assessing the values of diagnostic indicators, the analysis of the test results focused on their stability while the operating speed of the buckets changed. In this context, among other things, the analysis showed the following:
When the buckets’ traveling speed changes, classic diagnostic indicators—such as the coefficient of variation (CV), skewness, kurtosis, crest factor (CF), and quantile peak factor (0.95)—determined for vibration velocity show greater stability than similar indices for vibration acceleration (see
Figure 4),
Relatively, the kurtosis of vibration acceleration in the horizontal direction
y (see
Figure 4c) showed the greatest instability in values, which was due, among other things, to the greater sensitivity of acceleration signals to interference, as well as to the lower rigidity of the elevator’s housing structure in the horizontal direction.
Thus, the results of this study showed that the classic diagnostic coefficients—such as the coefficient of variation (CV), skewness, crest factor (CF), and quantile peak factor (0.95)—formulated for vibration velocity have a relatively low sensitivity to changes in the operating speed of the buckets and, therefore, may be more beneficial for a preliminary diagnostic evaluation of bucket elevators. This is especially true for comparative evaluation, provided that the correlation between these coefficients and the technical condition of the “belt-buckets” assemblies is experimentally verified.
These conclusions were used in diagnostic tests conducted on the industrial bucket elevators. The results of these studies are presented later in the article.
6.3. Statistical Distributions of Diagnostic Signals
When estimating the values of classic diagnostic indicators, it is generally assumed that the measurement data (diagnostic signals) have a normal or near-normal distribution. However, this assumption is not always justified, especially in tests carried out under real operating conditions, when the influence of disturbances is difficult (or practically impossible) to eliminate, as demonstrated in my previous research (e.g., [
29,
31]).
Consequently, the subsequent stage of the analysis focused on estimating the character of the statistical distributions of the values of the diagnostic signals, i.e., acceleration and vibration velocity at the measuring point on the LBE.
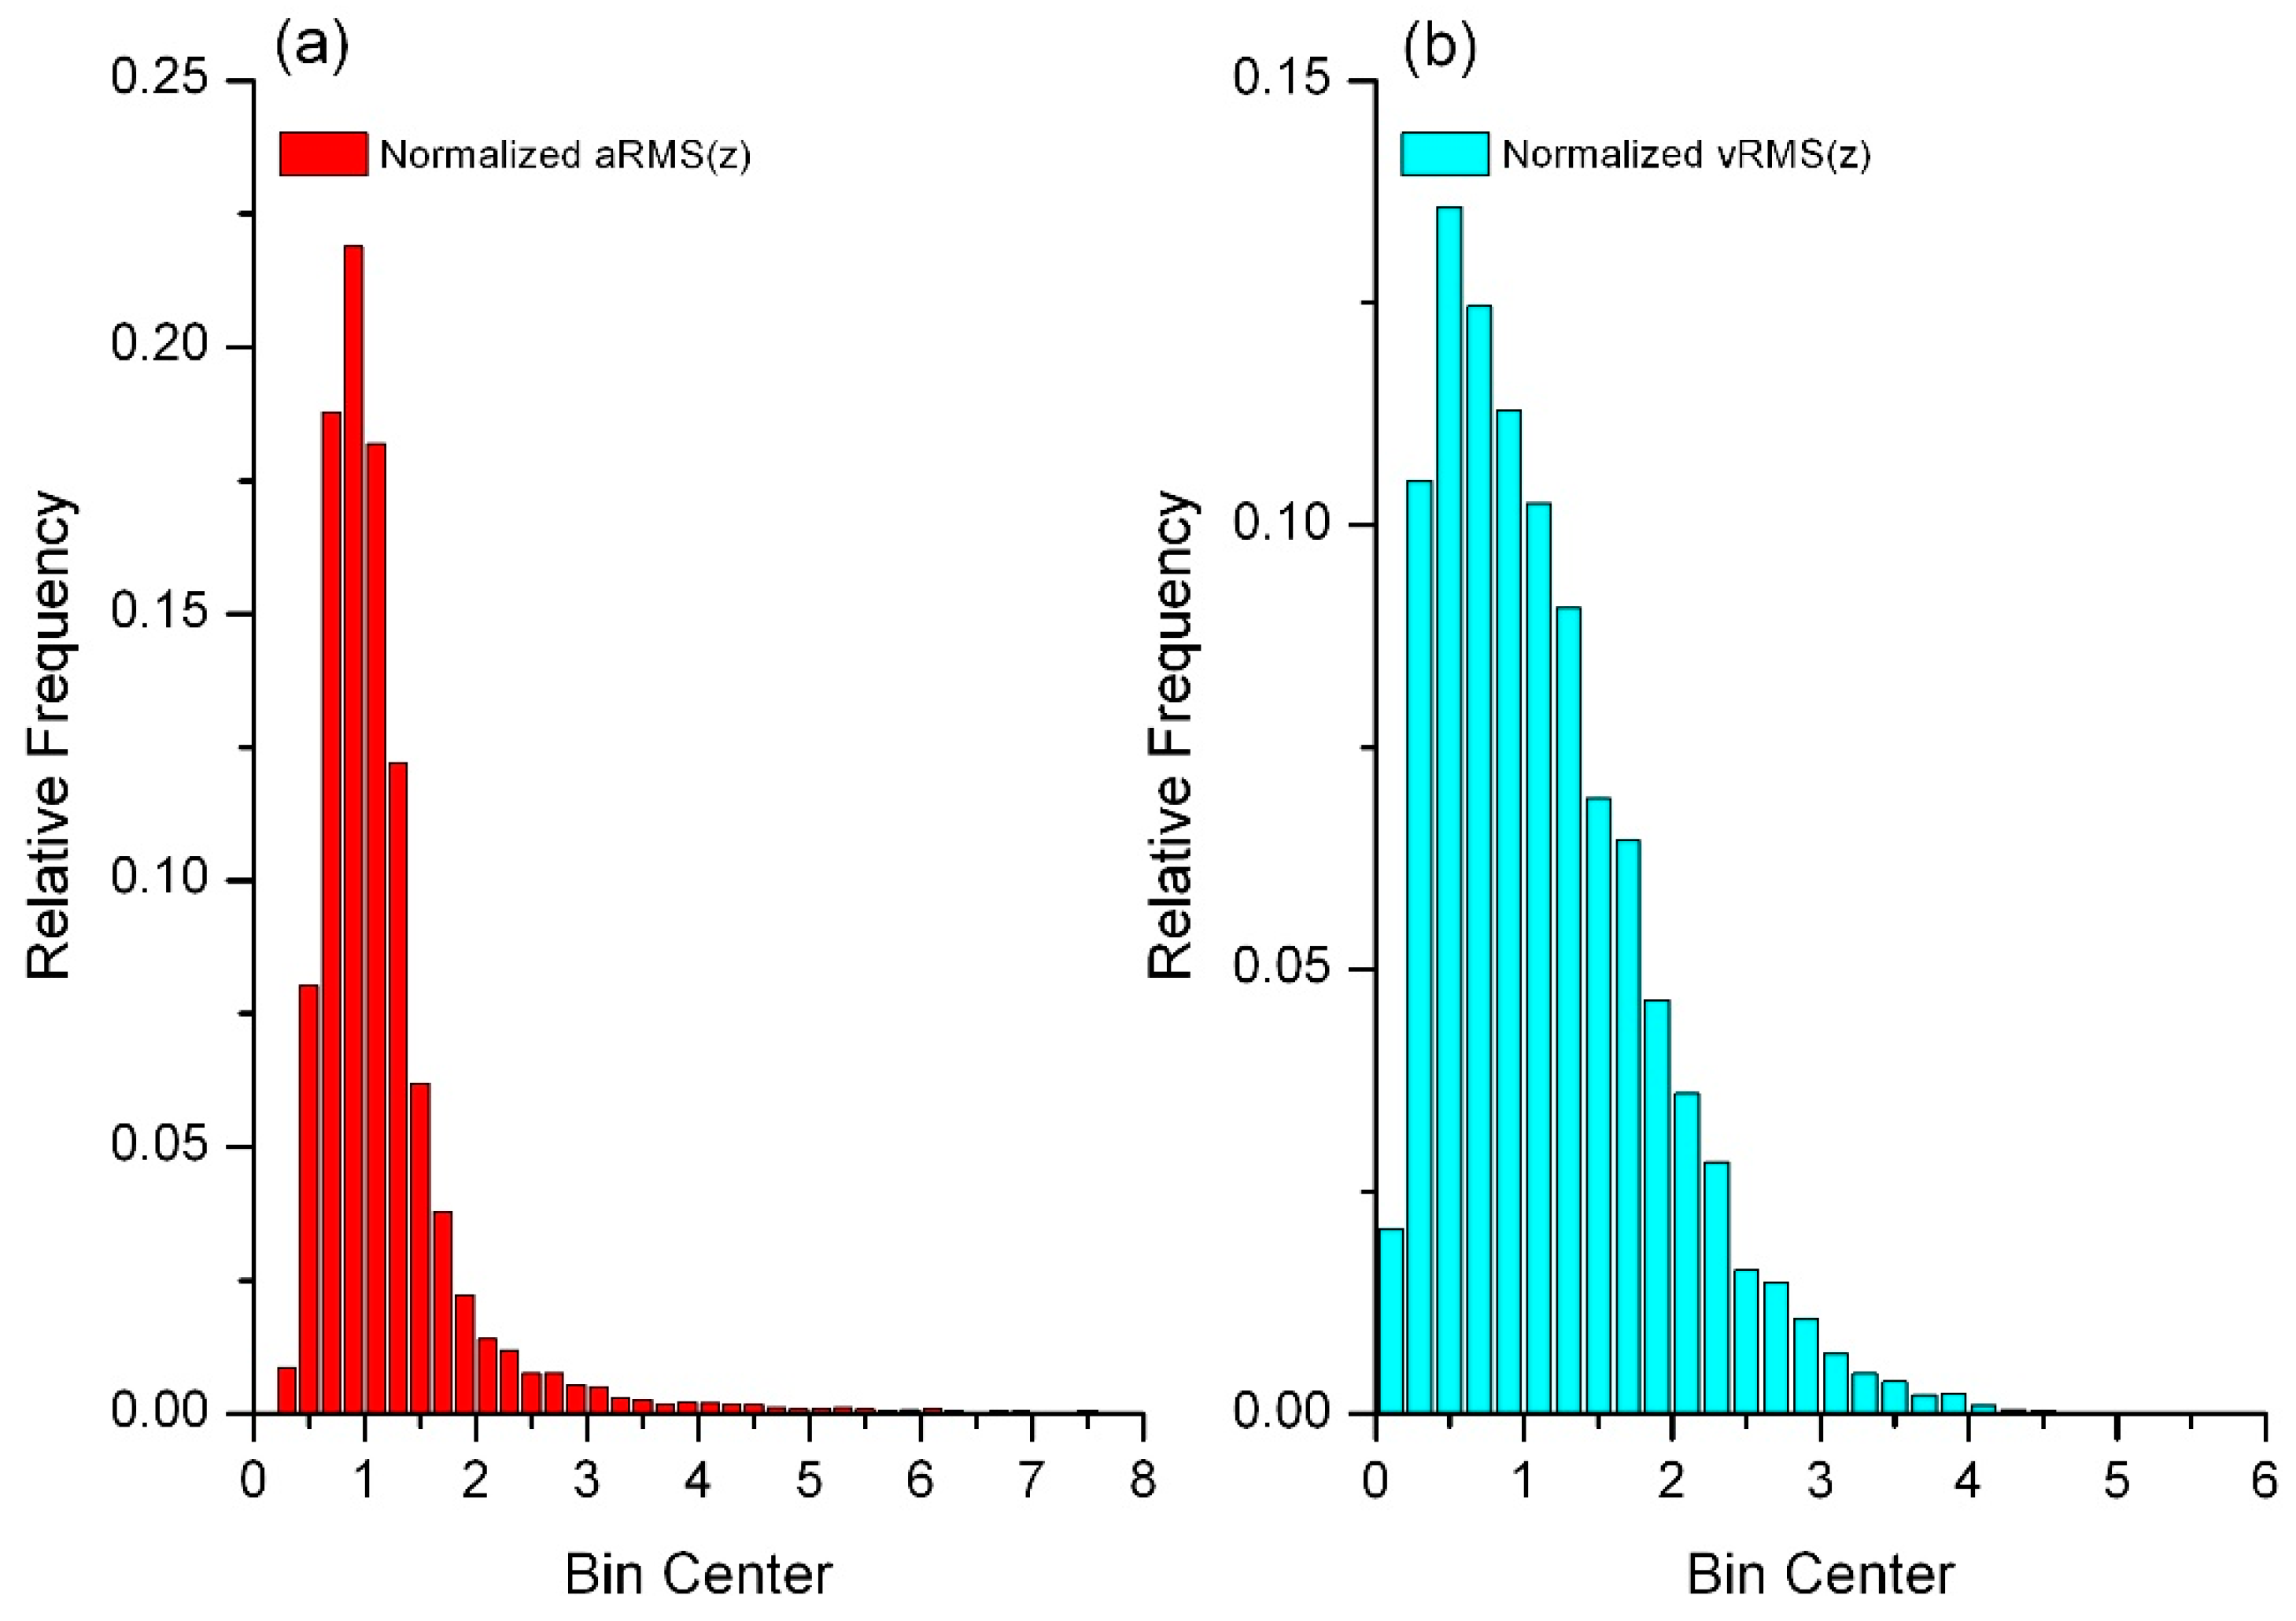
Figure 5 shows examples of results in the form of histograms of normalized signals, i.e., the raw signals divided by the medians.
An analysis of the histograms of the diagnostic signals revealed that both the acceleration and vibration velocity signals (measured on the bearing node housing of the drive drum of the LBE) were random variables with right-skewed distributions, with the statistical distributions of acceleration being relatively less skewed, i.e., more centered around the average values than those regarding vibration velocity (see
Figure 5).
Therefore, the assumption that the diagnostic signals are random variables with a Gaussian distribution is unjustified.
For this reason, classic diagnostic indicators that use estimators based on normal distributions (mean value, standard deviation, central moments) can be subject to errors. This is especially true in cases with many so-called outlier results, i.e., values significantly differing from the average values in each individual measurement series [
49,
50,
51,
52,
53,
54,
55].
An alternative to classic diagnostic indicators, which can be used for measurement results that have a large number of outliers, is factors based on robust measures of signals that are more resistant to the influence of outliers. For example, the interquartile range can be used as an alternative to the coefficient of variation.
However, it must be noted that outliers, especially in larger amounts, can be caused by the malfunctioning of the “belt-buckets” assembly. In such cases, rather than discarding the outliers, their abundance can be treated as a measure and a specific symptom of the deteriorating technical condition. According to the literature, the use of outliers to detect the malfunction of or damage to the object under study is an important and useful diagnostic tool [
54,
56,
57,
58,
59].
6.4. Summary of the Results of Laboratory Tests
Laboratory tests performed on the experimental LBE to assess the usefulness of the selected diagnostic indicators showed the following:
The diagnostic signals of acceleration and vibration velocity measured on the bearing node housing of the experimental elevator’s drive shaft are random variables characterized by non-Gaussian distributions.
The distributions of the diagnostic signals are skewed to the right, but the statistical distributions of the acceleration signals are relatively less skewed than those of the velocity signals.
The classic diagnostic indicators, i.e., coefficient of variation (CV), skewness, kurtosis, crest factor (CF), and my proposed quantile peak factor, when tested for vibration velocity, were characterized by greater stability in comparison with similar indicators tested for acceleration signals, i.e., the values of the former varied less when changes were made to the operating conditions of the elevator (i.e., changes in the operating speed of the buckets).
The coefficient of variation (CV), skewness, kurtosis, crest factor (CF), and my proposed quantile peak factor for vibration velocity meet the first requirement for their suitability as indicators for diagnostic purposes (as defined above in the section entitled “Purpose of the research”), i.e., they are independent of changes in the operating conditions (operating speed of the buckets).
The second requirement for the suitability of indicators for diagnostic purposes, i.e., the correlation between their values and the technical condition of the “belt-buckets” assemblies, was verified in the course of tests conducted under industrial conditions on large bucket elevators. The results of these studies are presented later in the article.
7. Research in Industrial Conditions
7.1. Results in the Time Domain
Diagnostic tests were also carried out on three industrial bucket elevators installed at a power plant and designated as IBE#1, IBE#2, and IBE#3.
The results presented in this article are excerpts from a comprehensive study that I conducted. However, due to the confidentiality of the data, this article provides only the information necessary to assess the usefulness of the selected diagnostic indicators under real operating conditions.
Figure 6 shows examples of waveforms of acceleration and vibration velocity measured at both ends of the drive shaft bearing node in the head of one of these industrial elevators. As in the case of the laboratory elevator, the results are presented in the form of normalized signals, e.g., the raw signals divided by their mean values.
All measured signals were subjected to the appropriate preprocessing, including, among other things, low-pass filtering and denoising.
7.2. Classic Diagnostic Factors of the Industrial Bucket Elevators
The above measurements served as the basis for estimating the classic diagnostic factors, i.e., the coefficient of variation (CV), skewness, kurtosis, crest factor (CF), and my proposed quantile peak factor, for the “belt-buckets” working assemblies of the industrial elevators under study. Their relevant mean values are presented in
Figure 7.
An analysis of the results of the estimation of classic diagnostic indicators for the studied industrial bucket elevators revealed the following:
The kurtosis values for vibration acceleration were the highest in IBE#1 and also significantly greater than the values for vibration velocity (about 7 times higher in the vertical direction z and about 10 times higher in the horizontal direction y).
The kurtosis values for vibration velocity varied significantly in each of the tested industrial elevators, with the smallest values observed for IBE#2.
The values for the crest and quantile peak factors of vibration velocity followed a similar pattern as the kurtosis values for vibration velocity.
The skewness of vibration velocity showed a slight variation in values for IBE#1, IBE#2, and IBE#3.
The coefficient of variation (CV) for both vibration velocity and acceleration showed little (practically negligible) variation in values for IBE#1, IBE#2, and IBE#3.
In light of the conclusions from tests carried out on the laboratory elevator, the kurtosis values of vibration velocity for the vertical direction
z (see
Figure 7b) were used as the basis for a comparative evaluation of the tested industrial elevators IBE#1, IBE#2, and IBE#3.
With respect to this indicator, the IBE#2 elevator ranked best, the IBE#3 elevator performed slightly worse, and the IBE#1 elevator performed least favorably (see
Figure 7b).
Similar conclusions can be drawn from an evaluation based on the kurtosis of vibration velocity in the vertical direction, although in this case the differences between IBE#1 and IBE#3 were insignificant (see
Figure 7d).
On the other hand, the kurtosis of vibration acceleration indicates an inferior technical condition of the working assembly of IBE#1. For this bucket elevator, the average kurtosis values of acceleration are many times greater for both vibration directions compared to the kurtosis values of acceleration for IBE#2 and IBE#3.
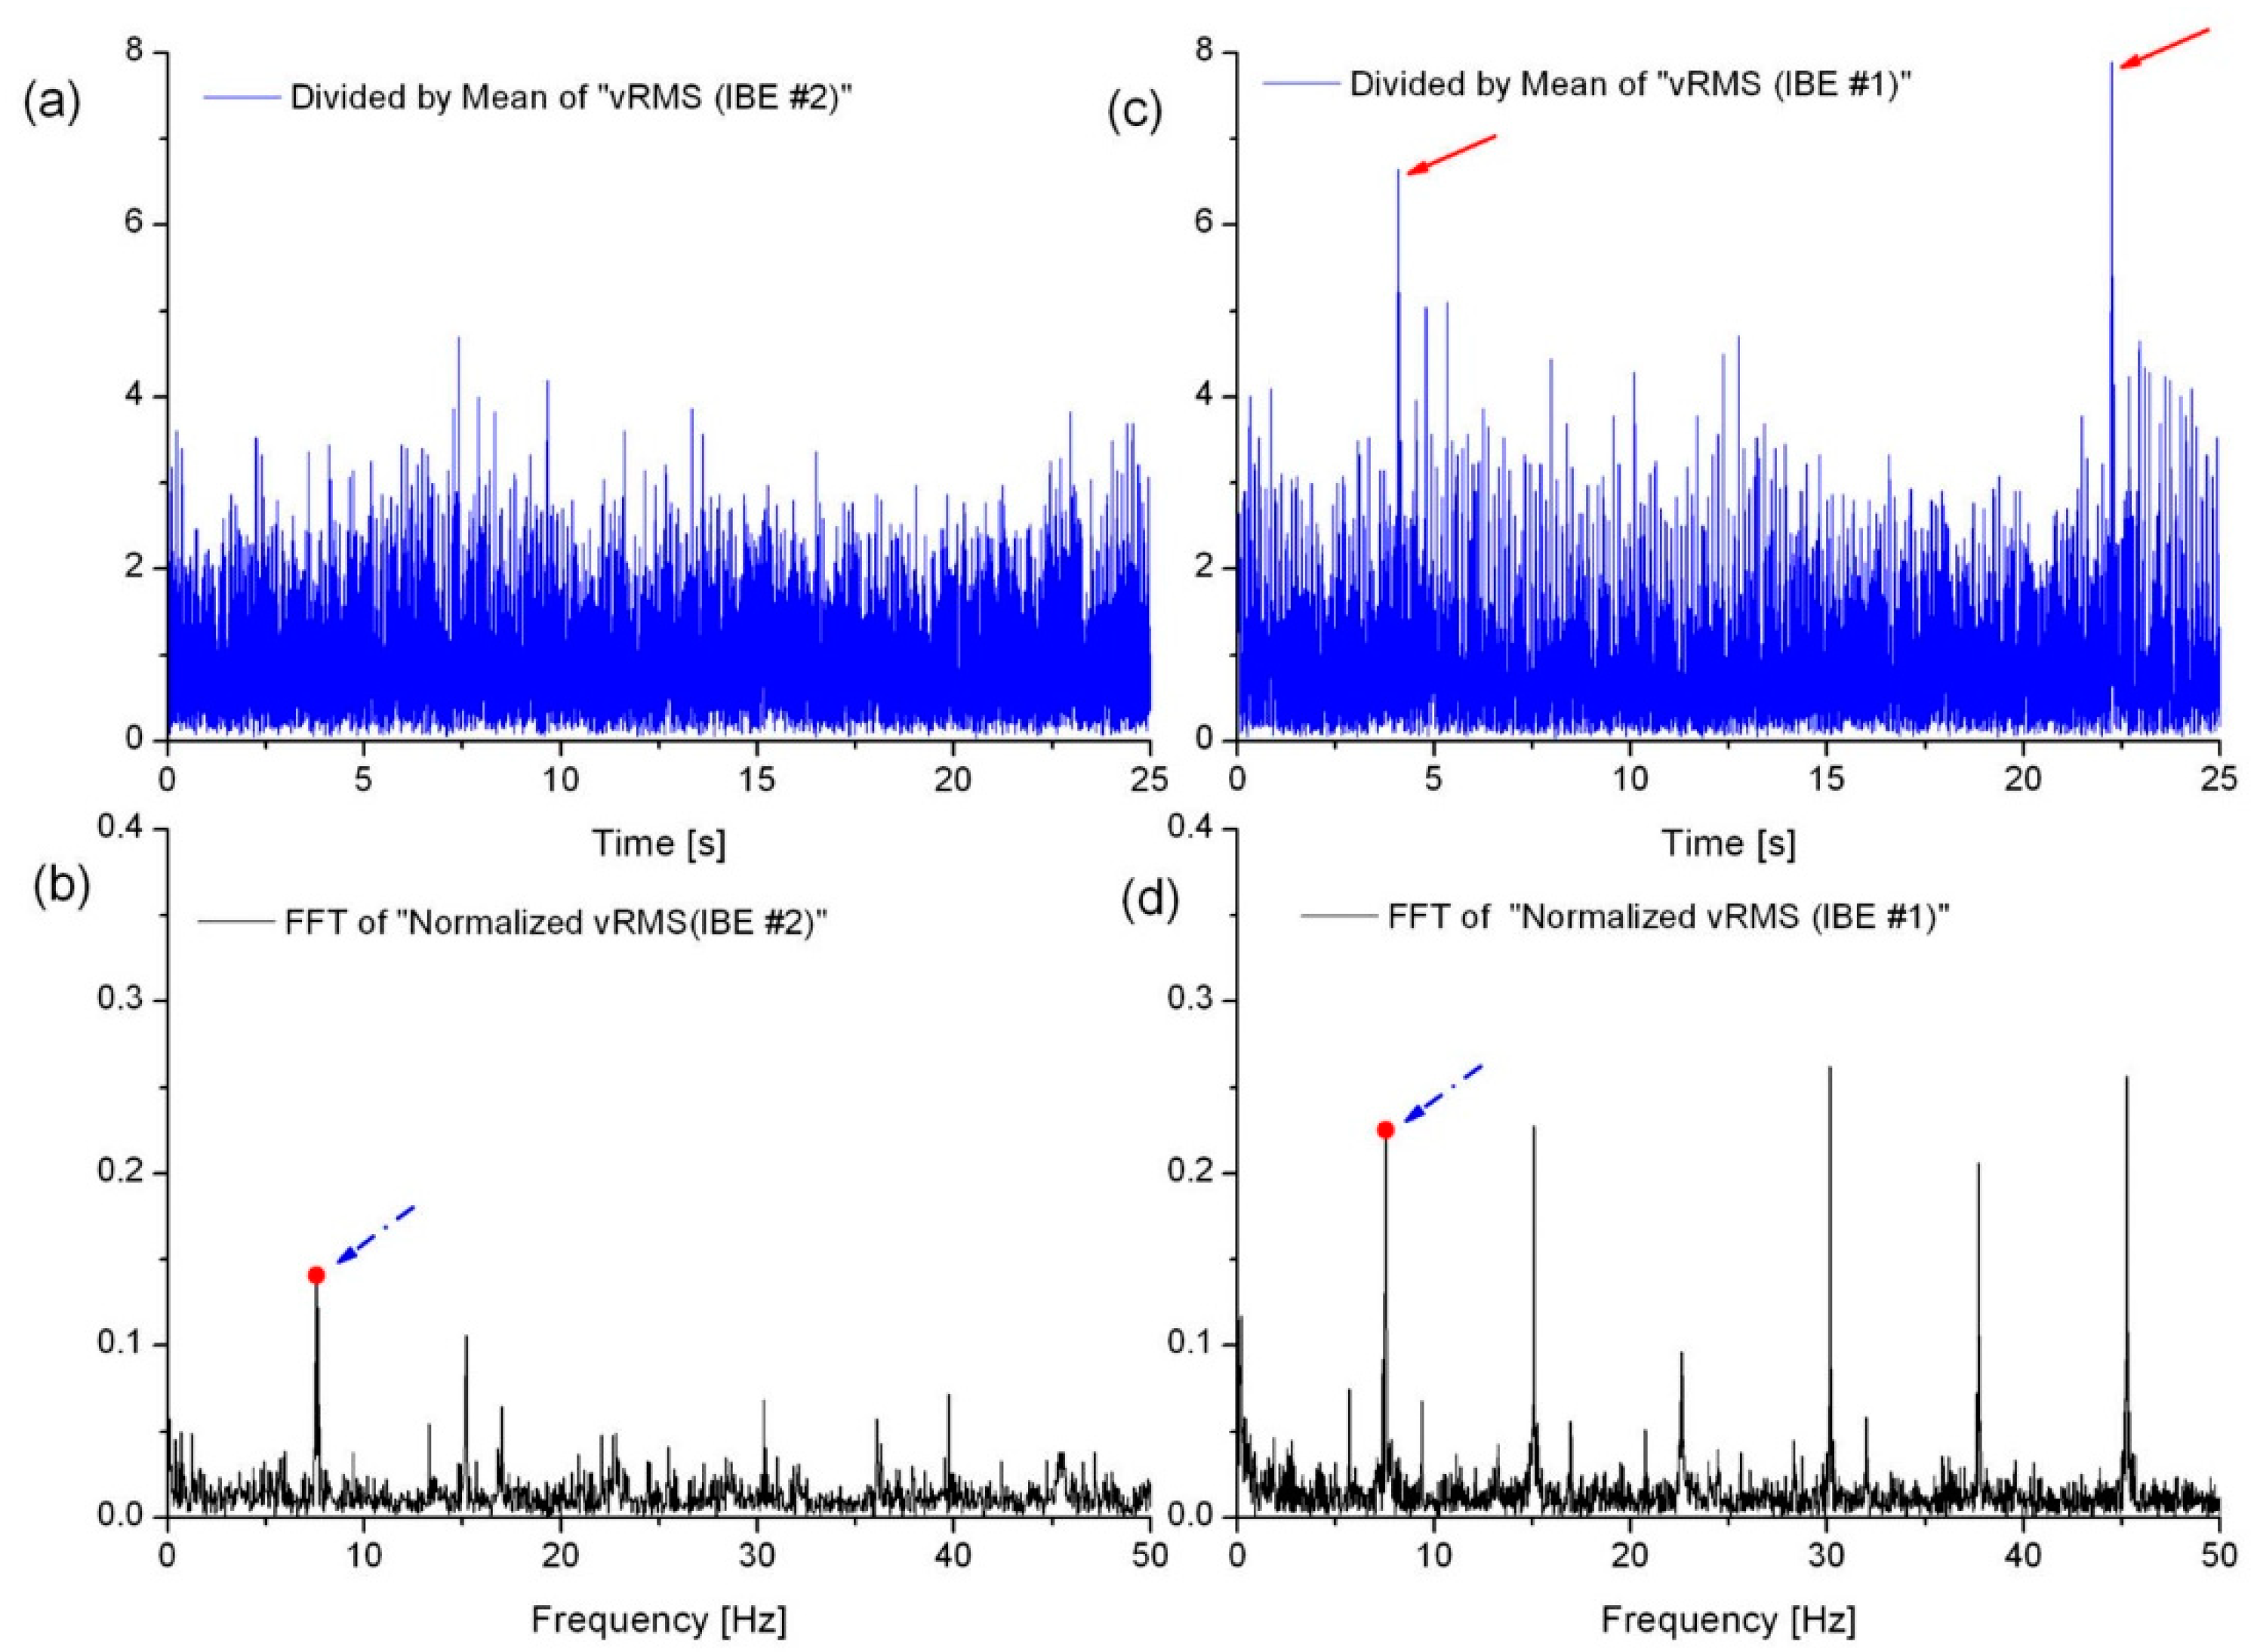
The results of the evaluation were based on the kurtosis values of vibration velocity and vibration acceleration, which were then verified using the amplitude spectra of vibration velocities measured in the vertical direction z. Examples of these results are shown in
Figure 8.
A spectral analysis of the vibration velocity signals allowed for the following observations:
The characteristic feature of the vibration velocity spectrum for IBE#2 in the frequency band 0–50 Hz is that it includes the first harmonic in the frequency band of bucket discharge fb (the amplitude of this harmonic is at about 15% of the average value of the signal) and the second harmonic with an amplitude of about 10% of the average value of the signal. There are sidebands of small amplitude around the second harmonic.
In contrast, the characteristic feature of the vibration velocity spectrum of IBE#1 in the 0–50 Hz frequency band is the presence of six harmonics, with harmonics No.1, No.2, No.4, No.5, and No.6 having relatively large amplitudes, and the amplitude of harmonic No.3 reaching a level about two times smaller.
While the first harmonic in the vibration spectrum is a “natural” consequence resulting from the kinematics of bucket elevator operation (cyclically repetitive processes of filling and emptying buckets), the appearance of subsequent harmonics is not a favorable symptom.
Successive harmonics (second, third, etc.) with relatively large amplitudes in the vibration spectrum are one of the characteristic symptoms of deterioration of the “belt-buckets” system. The potential causes of such a situation are as follows:
The belt was probably too loose or excessively deformed, which caused it to swing from side to side and produce the effect of transverse vibrations, or the so-called “whipping”.
The bolts that attach the buckets to the belt were loose or fell out; therefore, the buckets were misaligned with the belt axis and consequently swayed from side to side.
However, a detailed assessment of the technical condition of the tested elevators, combined with an indication of possible causes of malfunction of the “belt-buckets” working assemblies, is not the subject of this article.
In conclusion, based on the above analysis, it can be stated that the experiments successfully demonstrated the usefulness of vibration velocity kurtosis as a diagnostic indicator for the overall assessment of the operational quality of the “belt-buckets” assemblies of bucket elevators.
7.3. Statistical Distribution of Diagnostic Signals and Detection of Outliers
Similar to the tests on the laboratory elevator, the statistical distributions of the diagnostic signals obtained during industrial testing of IBE#1, IBE#2, and IBE#3 were estimated.
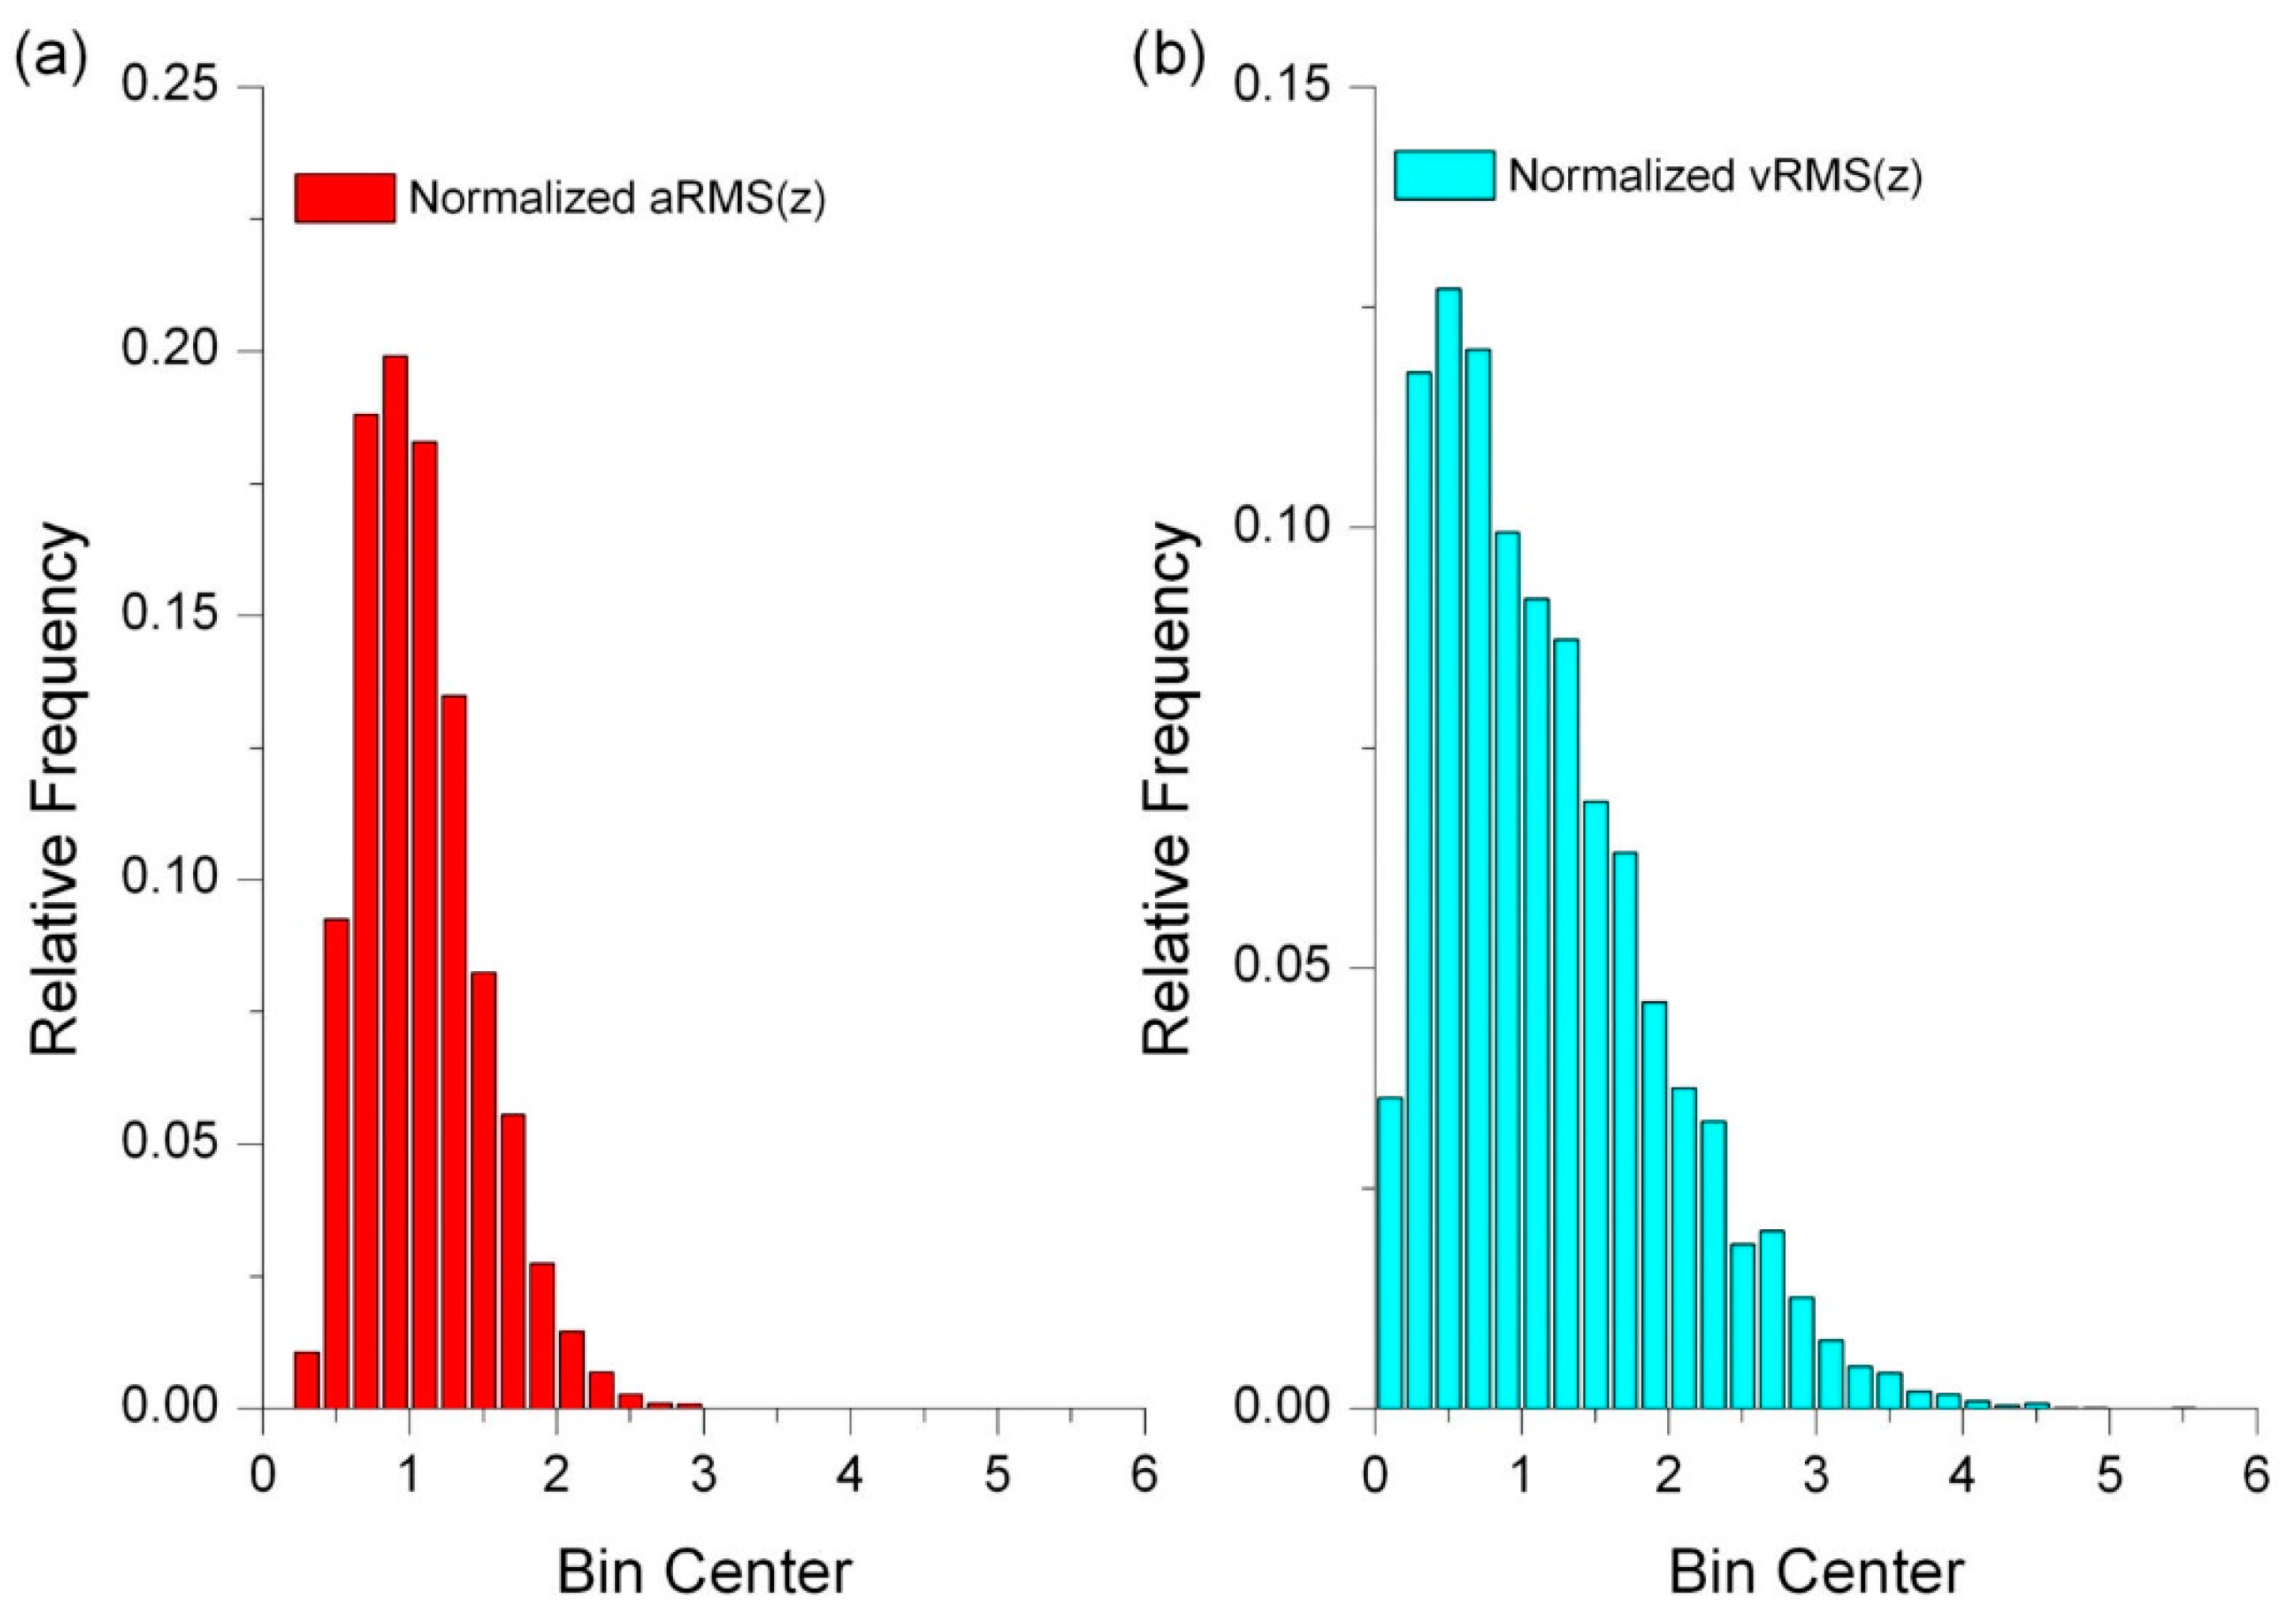
Figure 9 shows the approximate results in the form of histograms of the normalized signal values, i.e., the raw signals divided by the medians.
An analysis of the histograms of the diagnostic signals showed that both the acceleration signals and the vibration velocity signals (measured on the bearing node housings of the industrial elevators’ drive drums) had right-skewed distributions, but the statistical distributions of acceleration were more centered around the average values (see
Figure 9). Therefore, the assumption that the diagnostic signals have Gaussian distributions was also not confirmed.
These circumstances have a significant impact on the approach to diagnostic evaluation, because classic indicators (such as the coefficient of variation, skewness, kurtosis, and crest factor) can be error-prone, especially in cases with a significant number of outliers.
In the case of bucket elevators (especially those operating in industrial environments), outliers in the results of diagnostic measurements should be expected.
Outliers can appear for different reasons, e.g., anomalies in the operation or damage to the belt-buckets system, such as uneven belt deformation and the so-called belt whipping phenomenon, side-to-side swaying of buckets due to the loosening of fasteners that attach them to the belt, the rubbing of buckets against shaft walls, etc.
Outliers can also be caused by interference from other assemblies, such as structural vibrations of tall, thin-walled enclosures.
There are various methods and techniques to detect outliers. In technical applications for analyzing diagnostic test results, visualization techniques using boxplots or Q-Q (quantile–quantile) plots are particularly useful [
60,
61,
62,
63].
Skeletal boxplots are usually constructed based on the first (lower) and third (upper) quartiles of the values of signals, as well as the whiskers, which determine the boundaries of the outlier zones.
With the above conclusions in mind, diagnostic signals (acceleration and vibration velocity) from tests on industrial elevators IBE#1–IBE#3 were analyzed to detect possible outliers. In doing so, the following outlier classification criteria were adopted:
where
Q3 is the third quartile and
IQR is the interquartile range of the relevant signal.
The outliers in the zones between the inner and outer fences were considered mild, whereas those above the Upper Outer Fence were treated as extreme outliers.
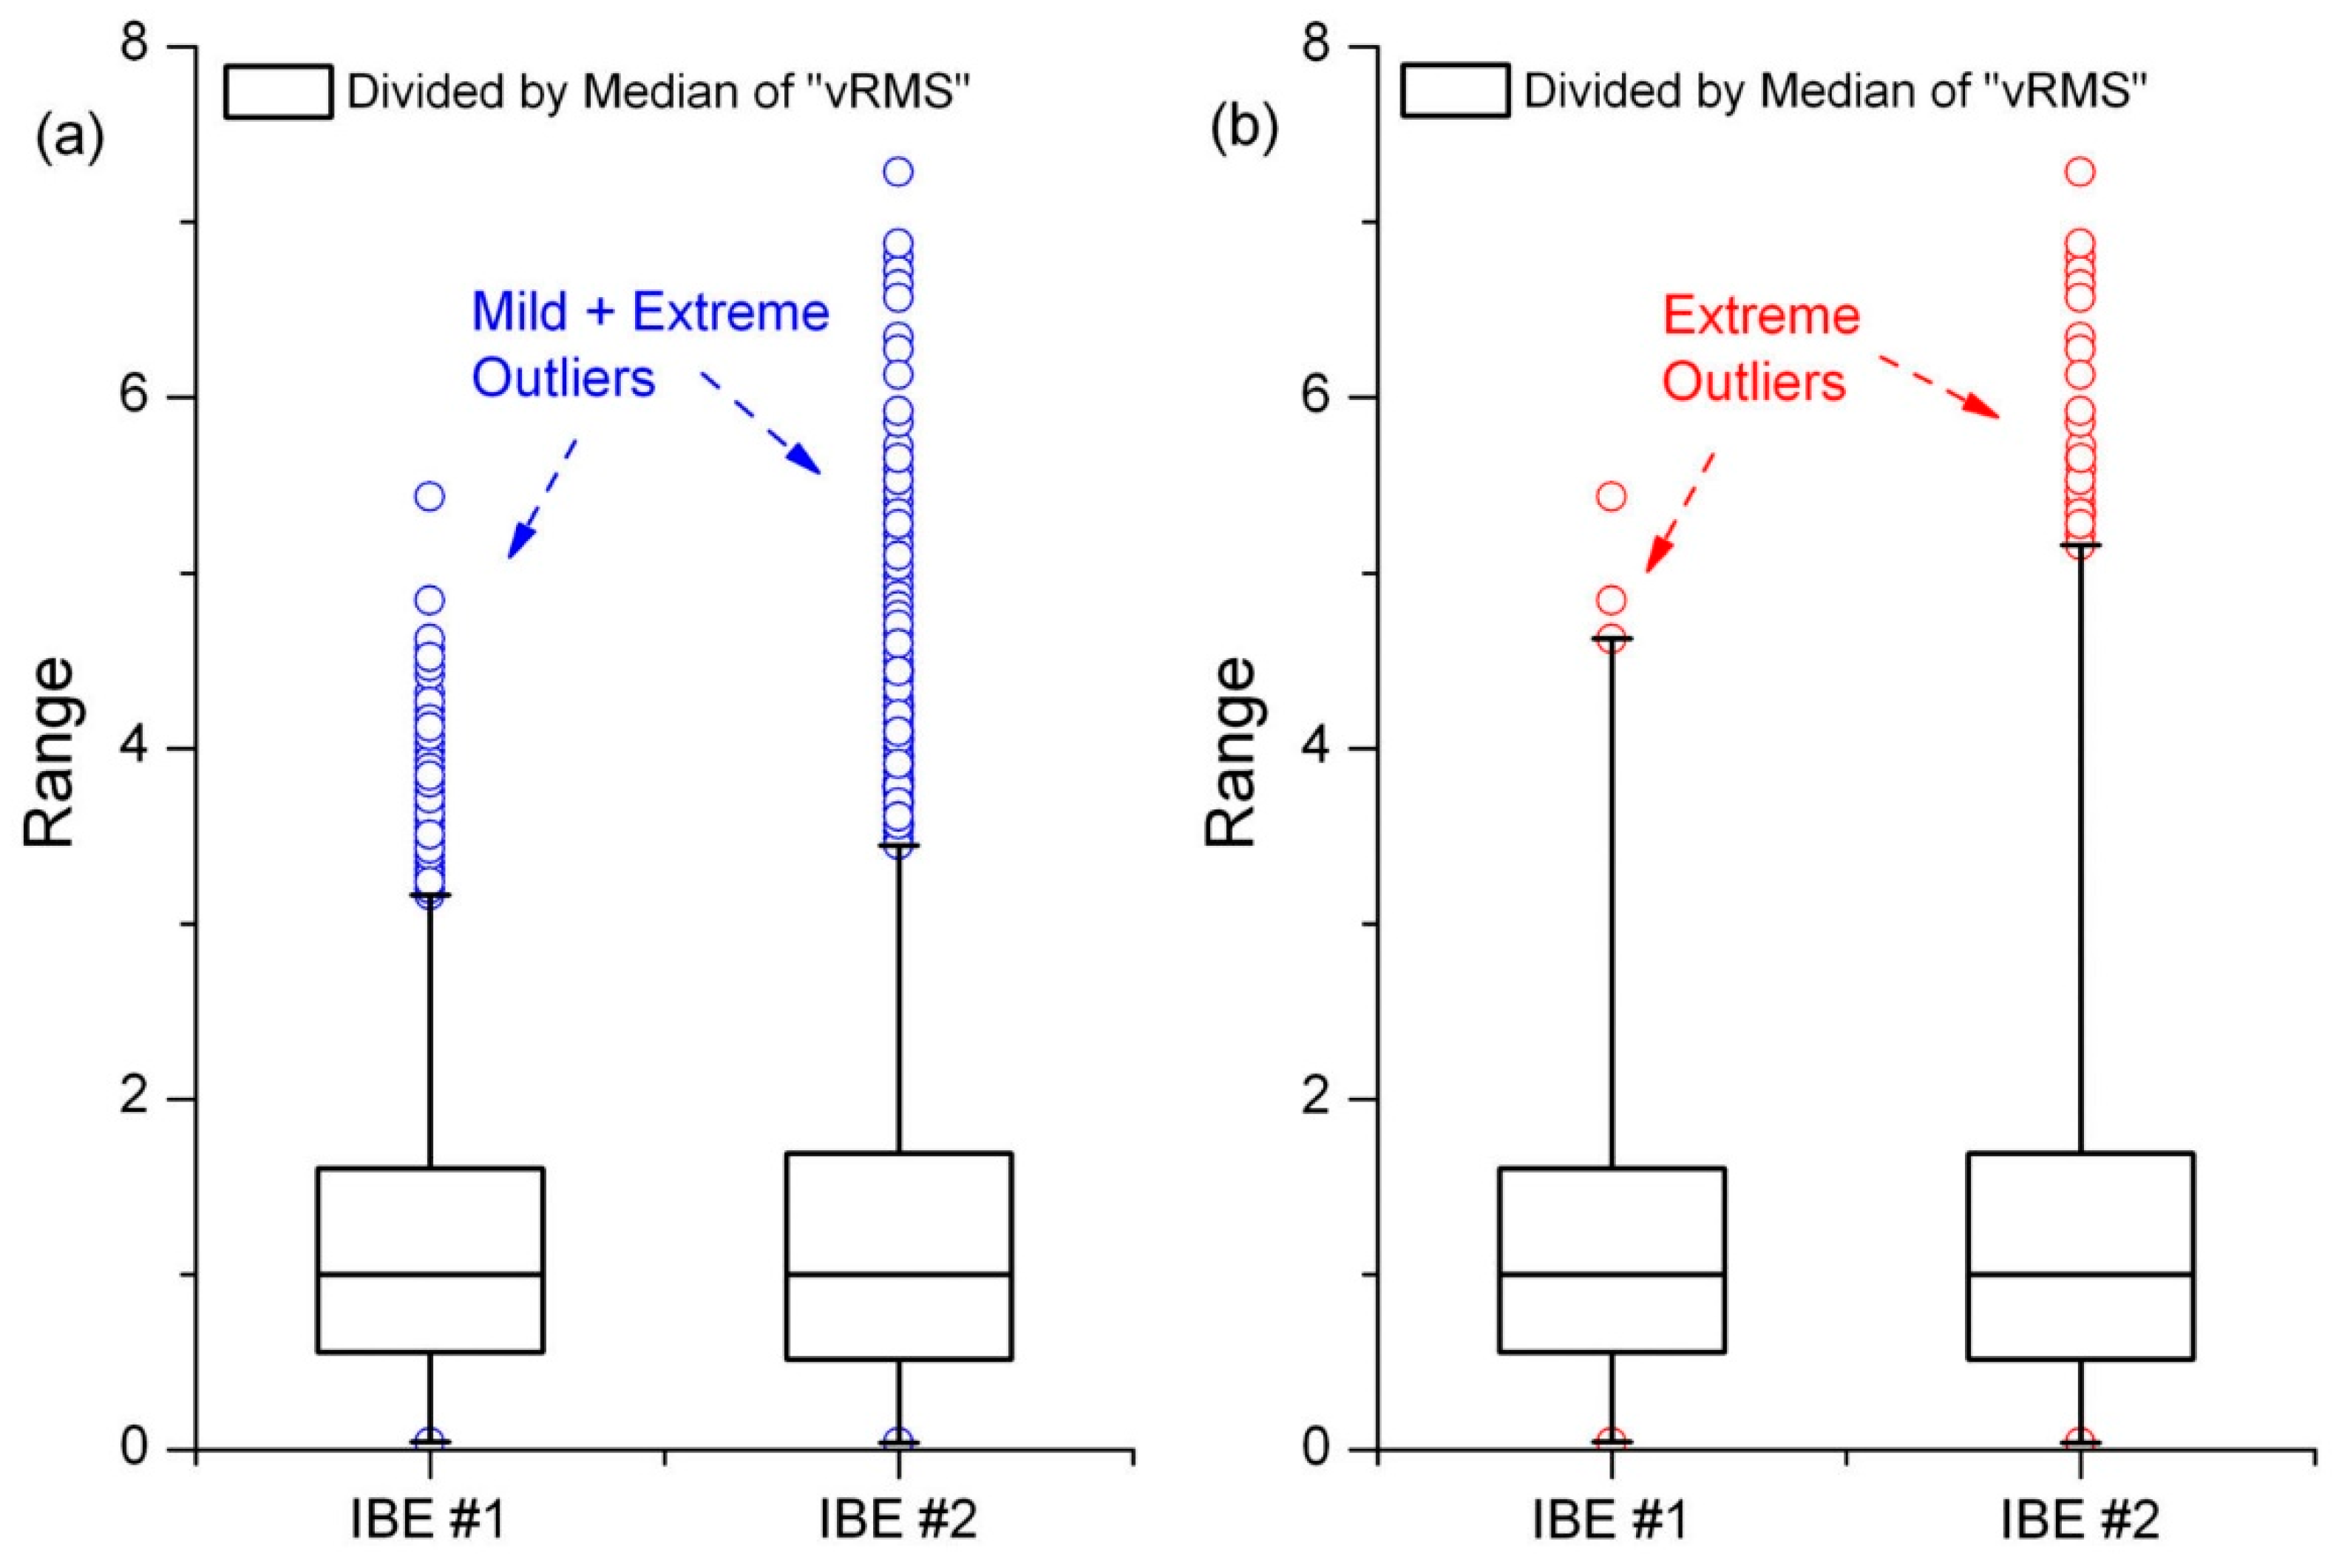
Figure 10 shows examples of results for the detection of outliers in the acceleration and velocity signals of vibrations.
The analysis showed that there were significantly more outliers in the vibration velocity signals in IBE#1 than in the corresponding signals measured for IBE#2, with only a few extreme outliers detected in the vibration velocity diagnostic signals for IBE#1 (see
Figure 10). The Q-Q plots include scatterplots created by the points P(x
i,y
i), denoted as blue circles, whose coordinates are equal to the i-th quantiles of the experimental data (x coordinate) and the expected data based on the estimated Weibull distribution (y coordinate). The signal values that did not sufficiently follow the reference lines y = x, denoted by red lines, were treated as outliers.
The detection of outliers with boxplots is formally based on the 68-95-99.7 rule from the normal distribution. In other words, the accuracy of this method depends on the degree of agreement of the actual statistical distribution of the signal with the Gaussian distribution. In cases of significant inconsistency, the “1.5 × IQR” length of the whiskers used for outlier detection should be appropriately changed.
Considering the above, outlier detection was also carried out using the Q-Q (quantile–quantile) plot method. The Weibull distribution was used as the best reference probability distribution.
Figure 11 shows examples of the obtained results.
Similar to the evaluation using boxplots, the re-detection based on Q-Q plots also showed significantly more outliers in the vibration velocity signals from IBE#1 than in those from IBE#2 (see
Figure 11).
The results of the outlier detection confirm the results of the evaluation of the technical condition of IBE#1, IBE#2, and IBE#3 based on the kurtosis values of diagnostic signals.
Outliers can be used as an additional diagnostic indicator, where a higher number of such outliers is a symptom of a deteriorating technical condition and signifies a decrease in the operational quality of the “belt-buckets” assemblies.
7.4. Accuracy of the Experimental Assessment of Diagnostic Factors
A class 1 digital vibration meter and analyzer was used in the measurements on the laboratory bucket elevator and industrial bucket elevators. This equipment allowed for the simultaneous measurement of acceleration, velocity, and displacement, and the signals were stored in the instrument’s internal memory. Then, the data were downloaded to a computer and subjected to relevant further processing. The aforementioned measuring device also performed a real-time 1/1 and 1/3 octave analysis of the signals.
The accuracy of the assessment of diagnostic factors was determined using a statistical approach, in accordance with the recommendations published in the “Guide to the Expression of Uncertainty in Measurement” by the International Organization of Legal Metrology (Edition 2023).
Following the guidelines in this document, the accuracy of the assessment of diagnostic factors was estimated by the Type A expanded uncertainty, defined as follows:
where
k is the coverage factor,
t1−α/2,n−1 is the quantile of a Student’s t-distribution (assumed as an appropriate coverage factor for the small sample size
n < 10),
u is the standard uncertainty,
s is the sample’s standard deviation,
n is the sample size,
α is the significance level, and
n − 1 is the number of degrees of freedom.
On this basis, the confidence interval for each of the diagnostic factors (denoted as
Y variables) was determined as follows:
where
Y is the measurand (i.e., the quantity being estimated) and
yMean is the sample mean.
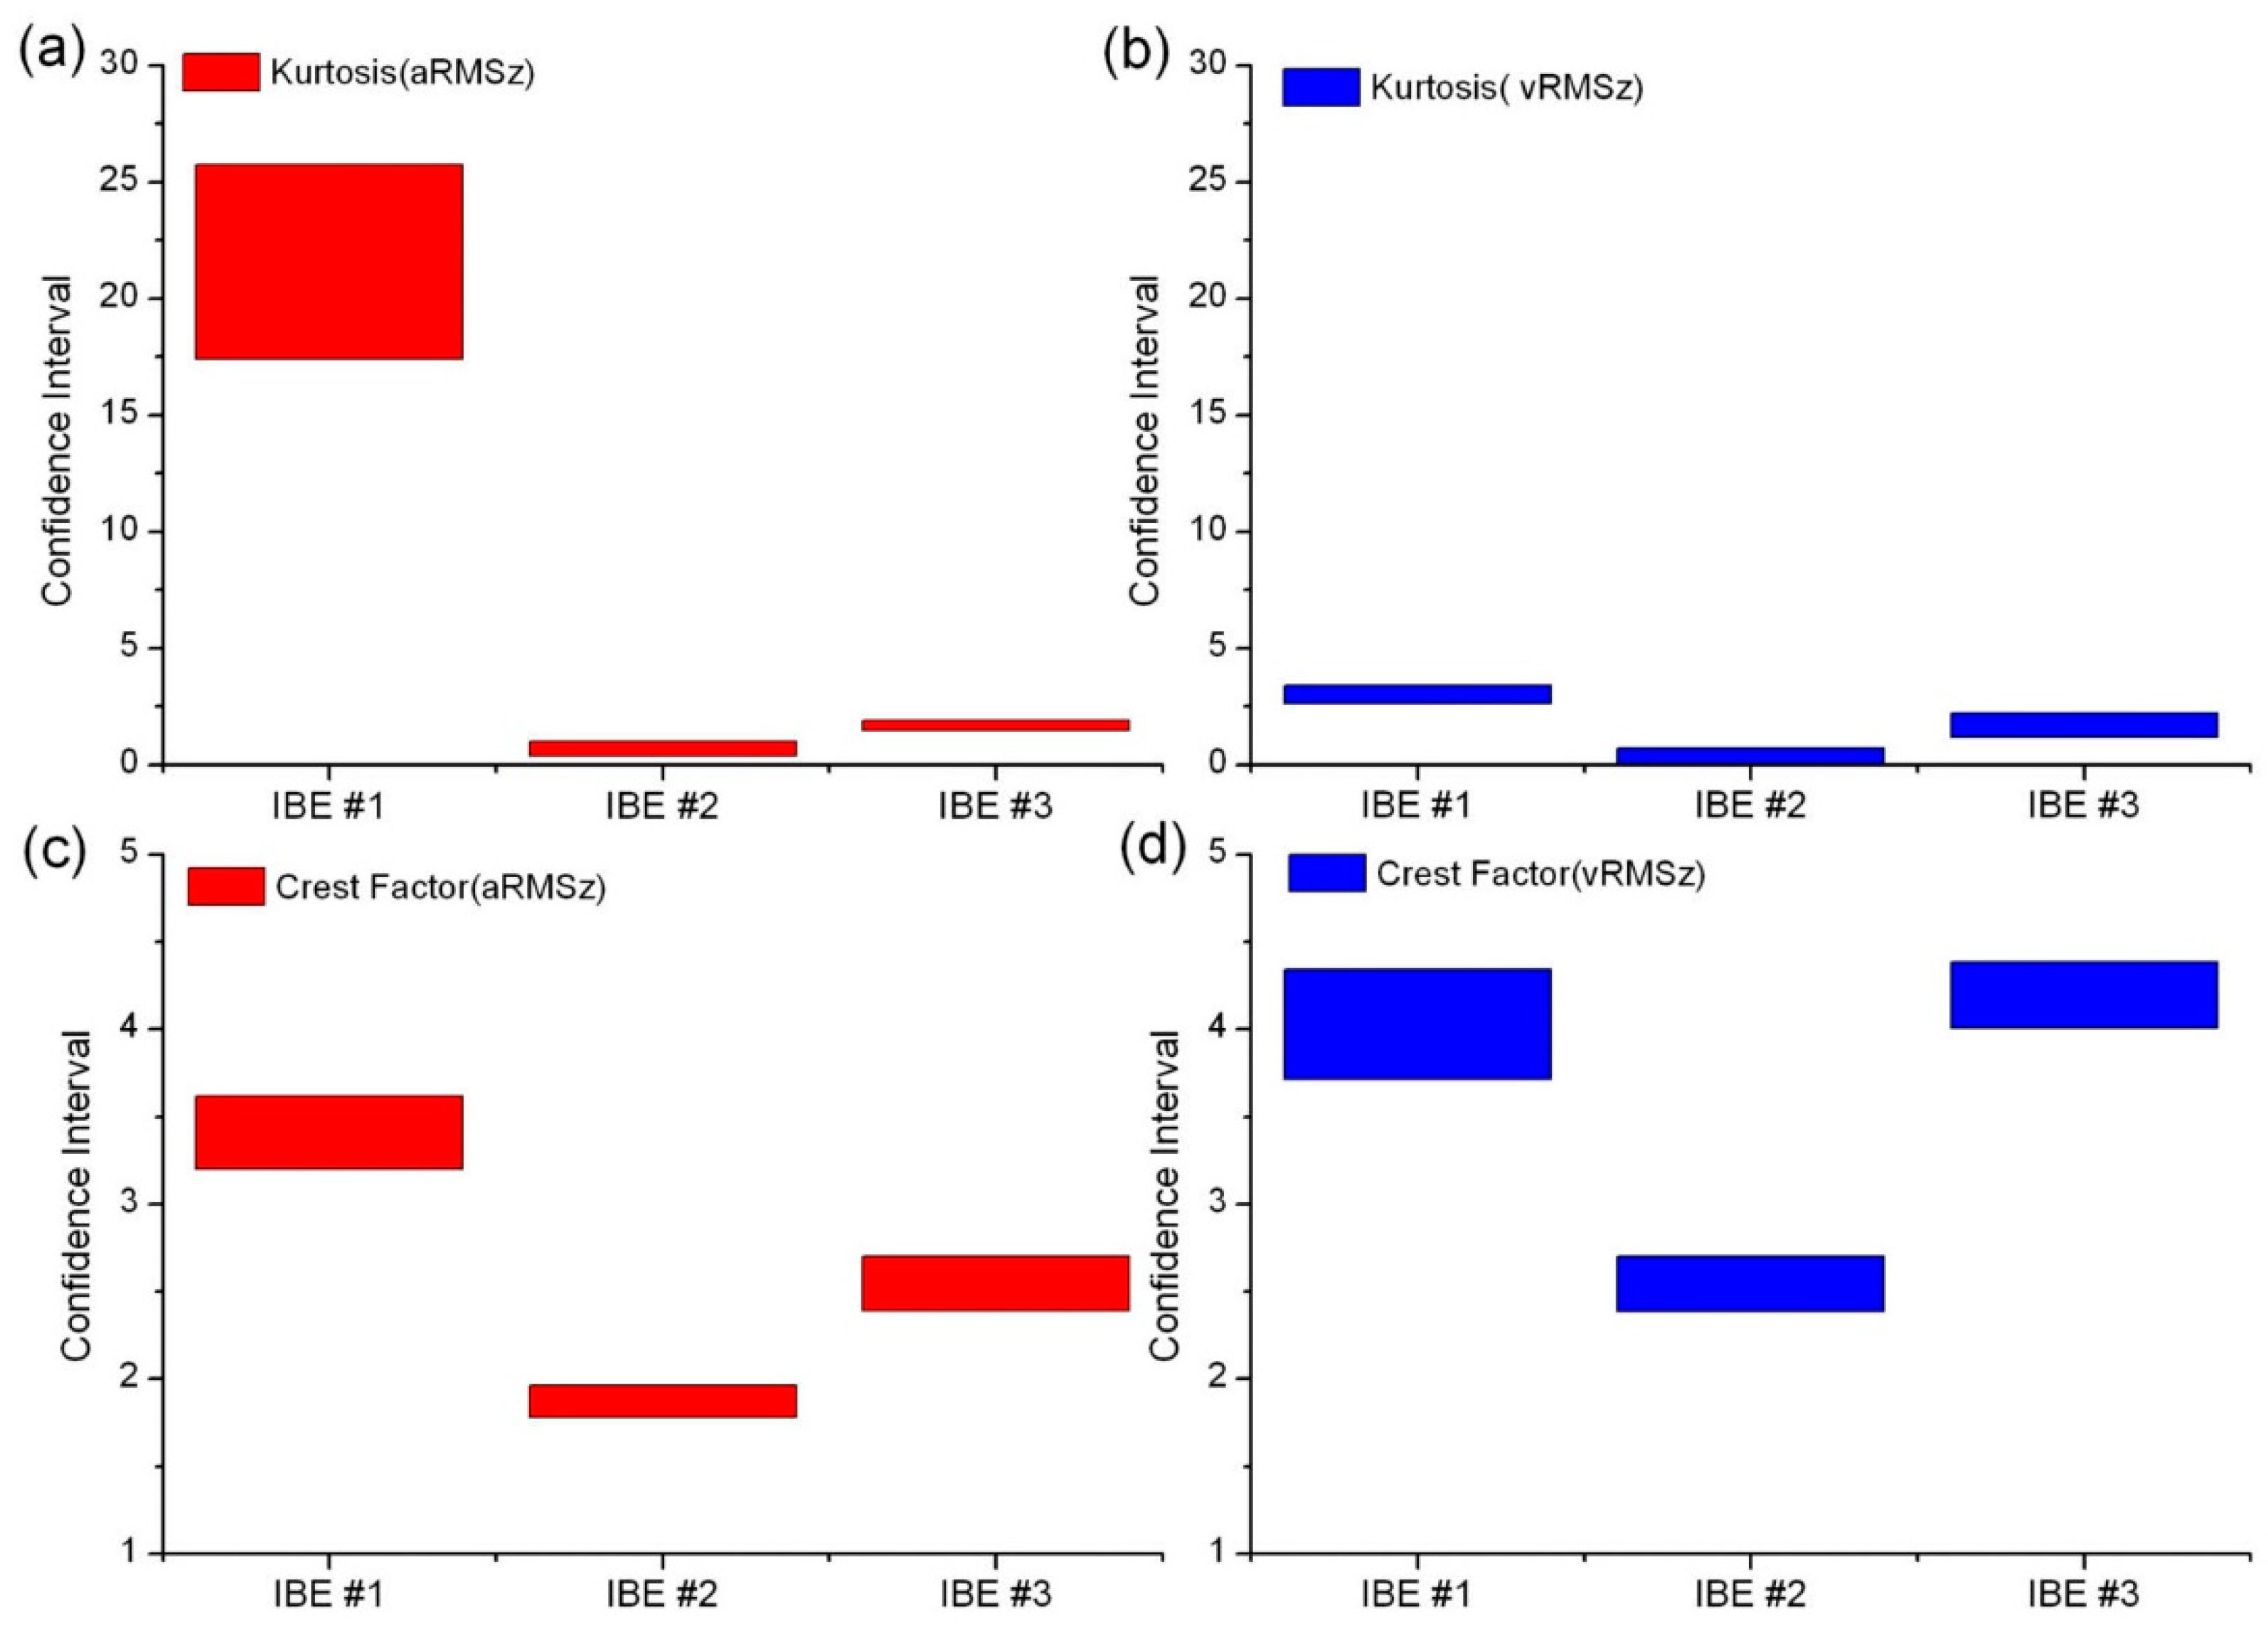
Examples of the confidence intervals of kurtosis and the crest factor are presented in
Figure 12. To better compare these interval estimations, the same scales are used on the
y axes for kurtosis and the crest factor.
The analysis showed, among other things, that the expanded uncertainties of the experimental assessment of kurtosis of vibration velocity are similar for each tested industrial bucket elevator.
The exception is IBE #1, where the expanded uncertainty of assessment of kurtosis is higher (the accuracy is lower) compared to IBE #2 and IBE #3. This confirms the suitability of kurtosis of vibration velocity as a diagnostic factor.
The expanded uncertainties of assessment of the crest factor are more diverse and relatively higher than those in the case of kurtosis. This confirms greater sensitivity to the influence of random disturbances and the lower usefulness of this diagnostic factor.
7.5. Summary of the Industrial Research Results
The objects of the diagnostic study were three large bucket elevators installed at a power plant. Based on analyses of signals measured on the housing of the bearing nodes of the drive shafts, the kurtosis of vibration velocity was determined and adopted as a diagnostic signal. What followed was a comparative analysis of the technical condition and the operational quality of the belt-buckets assemblies, and in this assessment, IBE#2 performed best. The assessment based on the kurtosis of vibration velocity was positively verified by comparing it with the amplitude spectrum of vibration velocity in the frequency band 0–50 Hz (this range includes all operating frequencies of the “belt-buckets” assemblies). The results further showed that the diagnostic signals of vibration velocity and acceleration are random variables with a non-Gaussian distribution that are skewed to the right and contain outliers. The results of outlier detection performed by two independent visualization methods, i.e., using boxplots and Q-Q plots, confirmed the results of the technical condition assessment of the studied IBE#1, IBE#2, and IBE#3, based on the value of kurtosis as a diagnostic indicator.
8. Conclusions
One of the crucial elements of the strategy for ensuring the operational reliability and maintenance of bucket elevators is the assessment and monitoring of the technical condition of their main working assemblies. This particularly applies to the belt-buckets assemblies, as these are crucial for the effective operation, optimal performance, and high reliability of these elevators. At the same time, these assemblies are particularly susceptible to the destructive effects of degradation processes, such as tribological wear, fatigue, material aging (especially in belts), and corrosion.
Given the above, this article presents the results of a study on the usefulness of selected diagnostic indicators for assessing the technical condition of the “belt-buckets” assemblies of bucket elevators, with a particular focus on the possibility of using these indicators in real industrial operating conditions.
The diagnostic evaluation of the technical condition and the operational quality of the “belt-buckets” working assemblies of bucket elevators was based on the study of vibration intensity measured at the bearing nodes of the drive shafts. Acceleration and vibration velocity were chosen as the quantities that characterize this intensity (the dynamic state of the device).
The following classic diagnostic indices (numerical estimates of vibration processes) were included in the analysis: coefficient of variation (CV), crest factor (CF), skewness, and excess kurtosis (K).
In analyzing the suitability of the indicators mentioned above, the following criteria were followed:
A diagnostic indicator should be insensitive to changes in the operating conditions of the “belt-bucket” assembly—for instance, to changes in operating speed—while the technical condition does not change,
A diagnostic indicator should be unequivocally correlated with the technical condition and the operational quality of the assembly, i.e., there should be an unambiguous cause-and-effect relationship between the technical condition and the numerical value of the indicator.
The first postulate mentioned above was verified in tests performed under laboratory conditions on an experimental bucket elevator. That research, among other things, showed the following:
The diagnostic indicators for vibration velocity, such as the coefficient of variation (CV), skewness, kurtosis, crest factor (CF), and the quantile peak factor (according to my recommendation), are characterized by sufficiently stable values during changes in the operating speed, in comparison to similar indicators for vibration acceleration,
The most sensitive diagnostic indicators are kurtosis, crest factor, and the quantile peak factor of vibration velocity and acceleration signals.
I proposed using the quantile peak factor as an alternative indicator to the crest factor because the QPF is based on the 0.99th or 0.95th quantile rather than on a single peak value and, thus, is more resistant to the influence of random disturbances.
The numerical values of the studied diagnostic indicators were determined in tests conducted under actual operating conditions on three large bucket elevators.
Based on the kurtosis values of vibration velocity, the overall technical condition of the “belt-buckets” working assemblies was compared in the tested industrial elevators IBE#1, IBE#2, and IBE#3. Similar assessment results were also obtained based on kurtosis of acceleration. It should be noted, however, that the vibration acceleration signals had more noise than the vibration velocity signals.
The results of this diagnostic evaluation based on kurtosis were positively verified by comparing them with the spectral analysis of vibration velocity signals.
Outlier detection carried out using two independent methods, i.e., boxplots and Q-Q plots, confirmed the results of condition assessment based on the kurtosis values of vibration signals.
The presented diagnostic method was verified on real objects, i.e., on three large-scale bucket elevators. Considering the recommendations of [
28], the tests were carried out at nominal operating speed and without loading the buckets with material.
A characteristic feature of this method is that it is non-invasive, as it does not require the installation of measuring sensors in the structure of the belt-buckets system.
This method can also be used under different bucket loading conditions, at different operating speeds, and with different materials (various bulk solids).
It is important to mention that it is possible to assess the technical condition of the entire “belt-buckets” assembly using only classic diagnostic indicators. However, it is generally impossible to conduct a detailed assessment and indicate which components are not working correctly and might require repair or replacement.
Nevertheless, classic diagnostic indicators can be useful in many cases, particularly for a preliminary assessment or comparative evaluation of the overall technical condition of the “belt-buckets” assemblies of two or more elevators.
Classic diagnostic indicators can also be useful for monitoring the current technical condition, provided that the threshold values of kurtosis are determined for the technical condition of a bucket elevator that is considered suitable for long-term operation. To fulfil this condition, however, more testing is required on a larger number of bucket elevators, so as to accumulate a relevant database.
The detection of outliers in diagnostic signals can be used as a complementary method of assessing the technical condition and the operational quality of belt-buckets working assemblies in bucket elevators.
The most important feature and advantage of the proposed method is its comprehensive approach to the assessment of the technical condition. This approach not only uses the classic diagnostic factors but also includes my proposed quantile peak factor and employs visualization techniques (based on boxplots and quantile–quantile plots) to detect outliers. To the best of my knowledge, such an approach is a novelty in the literature on this subject.
In my opinion, the directions of further activities should include, among other things, a larger number of research objects, so as to develop an appropriate database of diagnostic symptoms for determining the technical condition of the “belt-buckets” systems.


