Article

A Cooperative Adaptive VSG Control Strategy Based on Virtual Inertia and Damping for Photovoltaic Storage System

1
School of Automation and Information Engineering, Sichuan University of Science & Engineering, Yibin 644000, China
2
Key Laboratory of Higher Education of Sichuan Province for Enterprise Informationalization and Internet of Things, Yibin 644000, China
3
Zonergy Co., Ltd., Zigong 643000, China
4
Hydrogen Energy and Multi-Energy Complementary Microgrid Engineering Technology Research Center of Sichuan Province, Mianyang 621000, China
*
Author to whom correspondence should be addressed.
Energies 2025, 18(6), 1505; https://doi.org/10.3390/en18061505
Submission received: 17 February 2025 / Revised: 2 March 2025 / Accepted: 7 March 2025 / Published: 18 March 2025

Abstract

:
This research proposes a novel adaptive virtual synchronous generator (VSG) control strategy for a photovoltaic-energy storage (PV-storage) hybrid system. In comparison to the traditional VSG control approach, the adaptive control strategy presented in this research markedly diminishes the fluctuations in output power. This improvement is accomplished through the dynamic adjustment of virtual inertia (J) and damping coefficient (D), which enables real-time responsiveness to variations in light intensity, converter power, and load power factors that traditional VSG controls are unable to address promptly. Initially, a small signal model of VSG’s active power closed-loop system is established and analyzed for a grid-connected converter in a PV-storage hybrid system. The influence of these parameters on the response speed and stability of the PV-storage system is discussed by analyzing the step response and root locus corresponding to varying J and D conditions. Then, this study employs the power angle and frequency oscillation characteristics of synchronous generators (SGs) to formulate criteria for selecting the J and D. Based on the established criteria, a parameter-adaptive VSG control strategy is proposed. Ultimately, the efficacy of the proposed strategy is validated in MATLAB/Simulink under three distinct conditions: abrupt changes in light intensity, converter power, and load power. The results indicate that the strategy is capable of diminishing power oscillation amplitude, effectively mitigating instantaneous impulse current, and notably alleviating frequency overshoot.

1. Introduction

In response to the escalating concerns over climate change and its detrimental impacts on global ecosystems [1], photovoltaic-based distributed generation (DG) systems have emerged as a sustainable and effective complement to conventional centralized power generation architectures, gaining significant traction in modern power system integration strategies [2,3]. Power electronic converters serve as essential interfaces for the DG to interface with the power grid, particularly as the grid’s DG penetration rate continues to escalate [4]. However, these devices, especially grid-connected converters, cause traditional power systems to exhibit low inertia and weak damping characteristics, significantly compromising the power systems’ stability and reliability [5]. To provide the necessary inertia and damping support to the power system, the VSG technology is developed [6,7]. The VSG emulates the operational characteristics of the SGs, thereby endowing power electronic devices with virtual damping and inertia, which effectively enhances the stability and reliability of the power system [8,9,10,11,12,13]. However, the VSG active power loop (APL) is transformed from a first-order system into a characteristic second-order oscillatory system by incorporating virtual inertia and damping coefficients. This transformation results in transient oscillations and dynamic overshoots in the output power of the traditional VSG in response to changes in the given active power and grid frequency [14]. Meanwhile, resulting from the similar swing characteristic to SGs, the VSG-controlled system will inevitably encounter electromechanical time-scale dynamic stability issues [15]. In addition, the overshoot and the adjustment time of the system will increase, and the active power output of VSG may oscillate following grid disturbances [6,16].
To address the aforementioned problems, scholars have undertaken extensive research on the control methodologies of VSG [17,18]. In the context of power control, references [19,20] propose simulating SGs by modifying the droop control coefficient to provide J. However, this approach approximates the SGs’ inertia while neglecting its damping effects. Reference [21] developes a VSG control strategy with adaptive droop coefficients, which enhances transient stability and provides improved frequency support. However, the specific algorithm for determining the adaptive droop coefficient is not provided. Reference [22] establishes a generalized dynamic model for active power generation and compares traditional droop control with VSG-based control strategies, demonstrating that VSG can improve the dynamic response of the closed-loop system without compromising frequency accuracy. In [23], an optimal J control strategy is proposed to tackle the challenge of power and frequency dynamic oscillations arising in the VSG control system during power grid disturbances. This method utilizes a linear quadratic optimal control to optimize power dynamic response and effectively reduce power oscillation.
However, the aforementioned research method predominantly concentrates on fixed parameter control, thereby constraining the applicability of the VSG and inadequately addressing the dynamic adaptation challenges associated with inertia and damping requirements across various operational scenarios. This identified research has prompted the investigation of dynamic adjustments to the J and D parameters in the present study.
A bang-bang control strategy based on the intermittent alternation of virtual inertia is introduced in [24]. The maximum and minimum values of virtual inertia are alternately set based on the angular frequency deviation and its rate of change in this strategy. However, the intermittent selection of virtual inertia may undermine the stability of the system. In [25], a bang–bang control strategy grounded in continuous adaptive virtual inertia is proposed, mitigating the transient oscillation issue caused by the intermittent setting of virtual inertia. To resolve the conflict between system response speed and stability in VSG control, some virtual inertia parameter adaptive methods are designed [13,26,27], which contribute to improving dynamic frequency response. Nevertheless, the influence of the D on the system is omitted. Reference [28] establishes a small-signal model of the VSG and analyzes the system’s stability under varying D. An adaptive damping VSG control strategy is developed to suppress frequency overshoot oscillations, but the value of J is not analyzed. Reference [29] analyzes the effects of J and D on the stability of the VSG system and proposes an adaptive control strategy for virtual inertia and damping, which ensures system stability and swiftly rectifies angular velocity deviations.
Furthermore, in PV-storage systems, the stability and dynamic response characteristics under diverse disturbances are determined by the coordinated control strategies implemented between the photovoltaic control layer and the energy storage control layer. In [30], an energy management strategy for PV-storage system, based on VSG technology, is proposed. The integration of real-time data from PV output and energy storage systems into the VSG control framework facilitates dynamic adjustments to the droop characteristics of the VSG. This approach has enhanced the system’s safety margin and operational robustness, particularly under diverse disturbance conditions. The impact of light intensity fluctuations in the output power of the converter is analyzed in [31], which proposes a control strategy for a grid-connected PV-storage system based on VSG principles. In this strategy, the output power from the PV array is processed through a low-pass filter with a large time constant, which serves as the input power to the PV converter, thereby ensuring a smooth output. Reference [32] delineates a comprehensive and optimized value range for the VSG’s J and D. This optimization is particularly designed to address the inertia power requirements of the energy storage unit during system fluctuations, thereby improving the system’s dynamic performance. Within this optimized value range, the system’s frequency stability and the VSG’s dynamic response performance are prioritized, ensuring that the energy storage unit operates within its power output limits. Reference [33] proposes an adaptive VSG control strategy that incorporates the state of charge (SOC) constraints of the energy storage unit. Based on the rate and magnitude of system frequency changes, the adaptive control strategy dynamically adjusts the control parameters when frequency oscillations occur, enabling real-time adaptive tuning of the inertia and damping factors under varying disturbance conditions.
To address the adverse effects of load variations, active output power fluctuations in the power control and light intensity changes in the PV-storage system on the system’s dynamic performance, this study proposes a VSG control strategy for PV-storage systems based on the adaptive adjustment of J and D. Firstly, a small-signal model of active power control is developed, and the trade-off between virtual inertia J and damping D in enhancing system stability and stabilization time is elucidated through the analysis of root locus and step response. Secondly, the dynamic characteristics of the VSG rotor, including the rate of change in angular velocity and angular velocity deviation, are analyzed. Based on this analysis, a selection principle for J and D is proposed, and an adaptive control strategy is formulated. The effectiveness of the proposed control strategy is validated through MATLAB/Simulink simulations and comparative experiments conducted under scenarios of sudden load variations and light intensity changes.

2. Basic Structure of the PV-Storage System

The architecture of the grid-connected PV-storage power generation system, as depicted in Figure 1, comprises a DC power supply, converter, LCL filter, AC grid, and the grid-connected converter with VSG control. The DC power supply is composed of PV panels and energy storage devices, while Lf, Rf, and C denote the inductance, resistance, and capacitance of the LCL filter, respectively. Rg and Lg are the equivalent resistance and inductance on the AC grid side, respectively. The conventional VSG control strategy mainly consists of a VSG controller and a dual closed-loop control system for voltage and current. In the F-P and Q-V control [34], the VSG algorithm is predicated on the active power reference Pref and reactive power reference Qref established by the system, in conjunction with the measured voltage Uabc and current Iabc. The actual output active power P and reactive power Q are obtained through the power calculation, which subsequently determines the desired output voltage amplitude E and power angle δ. The modulation signal is generated through the voltage and current control loop, which is then processed through pulse-width modulation (PWM) to generate the switching driver signal, ultimately applied to the DC-AC converter.

3. VSG Control Strategy

3.1. Traditional VSG Control Strategy

VSG enhances the stability and controllability of the power system by emulating the dynamic characteristics of active and reactive power output from SGs. Utilizing the classic second-order model of SGs, the equivalent rotor motion equation for the VSG is derived [35], as presented in Equation (1). This equation describes the inherent relationship between SGs’ mechanical and electrical angular velocities, which is essential for emulating SGs dynamics in the VSG. Under the assumption that the number of pole pairs of the motor is one, the mechanical angular velocity becomes numerically equivalent to the electrical angular velocity [36].
J d ω d t = T m T e D ( ω ω 0 ) d δ d t = ω
where J represents the virtual inertia, D represents the virtual damping coefficient, ω0 represents the rated angular velocity, ω represents the angular velocity, Tm represents the mechanical torque, and Te represents the electromagnetic torque.
The correlation between Te and P is described in Equation (2):
T e = P ω
The relationship among the Tm, the prescribed mechanical torque Tref, and the frequency deviation feedback instruction ΔT is expressed in Equation (3):
T m = T r e f + Δ T
where
T r e f = P r e f ω
Δ T = K ω ( ω ω 0 )
Equation (5) designates Kω as the primary frequency regulation coefficient. Substituting Equations (1)–(5) yields Equation (6):
P r e f P = J ω 0 d ω d t + D ω 0 + K ω ( ω ω 0 )
Furthermore, based on the circuit configuration and power transmission principles illustrated in Figure 1, when the line impedance exhibits inductive characteristics, the VSG operates in conjunction with the grid, and the output power can be estimated as follows:
P = 3 E U g X s i n δ 3 E U g X δ = K P δ
where the X denotes equivalent impedance, and the Ug is grid phase voltage.
The X and Kp are shown in Equations (8) and (9):
X = ( ω 0 L g ) 2 + R g 2
K P = 3 E U g / X
The primary voltage regulation equation for VSG can be formulated in Equation (10):
E = E 0 + Δ E Q + Δ E U
where E0 represents the no-load potential, ΔEQ denotes the output of reactive power regulation, and ΔEU signifies the output of terminal voltage regulation.
The ΔEQ is shown in Equation (11):
Δ E Q = K q ( Q r e f Q )
where Kq is the coefficient associated with reactive power regulation.
The Q is shown in Equation (12):
Q = u a u b i c + u b u c i a + u c u a i b 3
Δ E U = K u U r e f U
where KU represents the voltage regulation coefficient, Uref and U are the grid-connected converter’s reference and measured voltage magnitude, respectively.
Figure 2 presents the schematic diagrams for active and reactive power control derived from Equations (6), (7), and (10).

3.2. Dynamic Power Characteristics and Existing Problems of the Traditional VSG

As illustrated in Figure 2a, the dynamics of the APL outputs, namely ω and P, are affected by variations in the control parameters and operating conditions. However, the dynamic responses of the APL outputs to variations in control parameters, specifically the J and D, are additionally affected by KP and Kω. In order to assess the impact of J and D on the dynamics of APL outputs, a small-signal model of the conventional VSG active power circuit has been developed. This model enables a comprehensive analysis of the influence of J and D on the APL outputs of the VSG. The transfer function of the small signal model can be derived as follows:
G P - P r e f s = K P J ω 0 s 2 + D ω 0 + K ω s + K P
From Equation (14), it is evident that the closed-loop transfer function characterizes a typical second-order system. Consequently, the undamped oscillation frequency ωn and damping ratio ξ can be determined as outlined in Equation (15):
ω n = K P J ω 0 ξ = D + K ω 2 1 J K P ω 0
Equation (14) serves as the foundation for deriving the closed-loop characteristic equation of the VSG active power transfer function, with the detailed derivation presented in Equation (16):
J ω 0 s 2 + ( D ω 0 + K ω ) s + K p = 0
Based on Equation (16), the influence of virtual inertia J and damping D on the system’s characteristic roots is illustrated in Figure 3. The values of J are set at 0.05, 0.2, 0.5, and 1, whereas D is incrementally adjusted from 0 to 30 in increments of 0.1.
The root locus of the closed-loop poles of the APL for the traditional VSG under various parameter selections is illustrated in Figure 3. Analysis of the system’s closed-loop pole distribution reveals that the APL closed-loop system exhibits a pair of conjugate poles. As the D is held constant, the initial positions of the conjugate poles, denoted as s1 and s2, tend to approach the imaginary axis with an increase in the inertia constant J. This results in a reduction of the system’s damping ratio, thereby compromising stability and decreasing the regulation rate of the VSG. Conversely, when J is held constant, an increase in D causes the conjugate poles s1 and s2 to gradually move towards two real-axis poles, as indicated by the arrows. This transition alters the system characteristics from an underdamped to an overdamped state, thereby reducing both the response rate and the accuracy of steady-state control. These observations are in alignment with the physical implications outlined in Equation (15).
Moreover, J primarily influences the oscillation frequency of VSG, while D exerts a minimal influence on it. Insufficient virtual inertia can hinder the VSG control’s capability to effectively mitigate frequency overshoot. Conversely, excessive virtual inertia demands substantial energy storage capacity and significantly reduces the system’s dynamic response speed.
Figure 4 depicts the frequency response characteristics derived from Equations (14) and (15) in relation to a unit-step response, emphasizing the influence of variations in the parameters J and D.
In practical engineering applications, a larger J is typically selected to provide sufficient inertia support for the power system. As illustrated in Figure 4a, with the D held constant, an increase in J results in a reduction of both the undamped natural frequency ωn and the damping ratio ξ. This alteration leads to an increase in the oscillation amplitude of the system’s response curve. Hence, a larger damping coefficient D is required to fulfill the system’s requirements for power oscillation suppression. Conversely, as illustrated in Figure 4b, when J is held constant, an increase in D leads to a constant undamped oscillation frequency ωn, while the damping ratio ξ increases accordingly. Increasing D significantly enhances the VSG control’s effectiveness in mitigating transient oscillations in the system’s active power, while also progressively alleviating the issue of power overshoot during grid frequency disturbances.
Figure 4 also indicates that, within the framework of the traditional VSG strategy, an augmentation of the virtual inertia J enhances the system’s inertial response and reduces the system’s adjustment time. However, it concurrently compromises the system’s stability, as indicated by the equilibrium between the system’s dynamic requirements and stability margins. Furthermore, an increase in D contributes to greater stability, albeit at the cost of prolonged adjustment time. It is important to note that there exists a trade-off in the selection of J as modifications to this parameter, along with others, impose reciprocal constraints that influence the optimization of the system’s dynamic characteristics. Hence, this paper proposes a cooperative adaptive control strategy for J and D to address this contradiction.

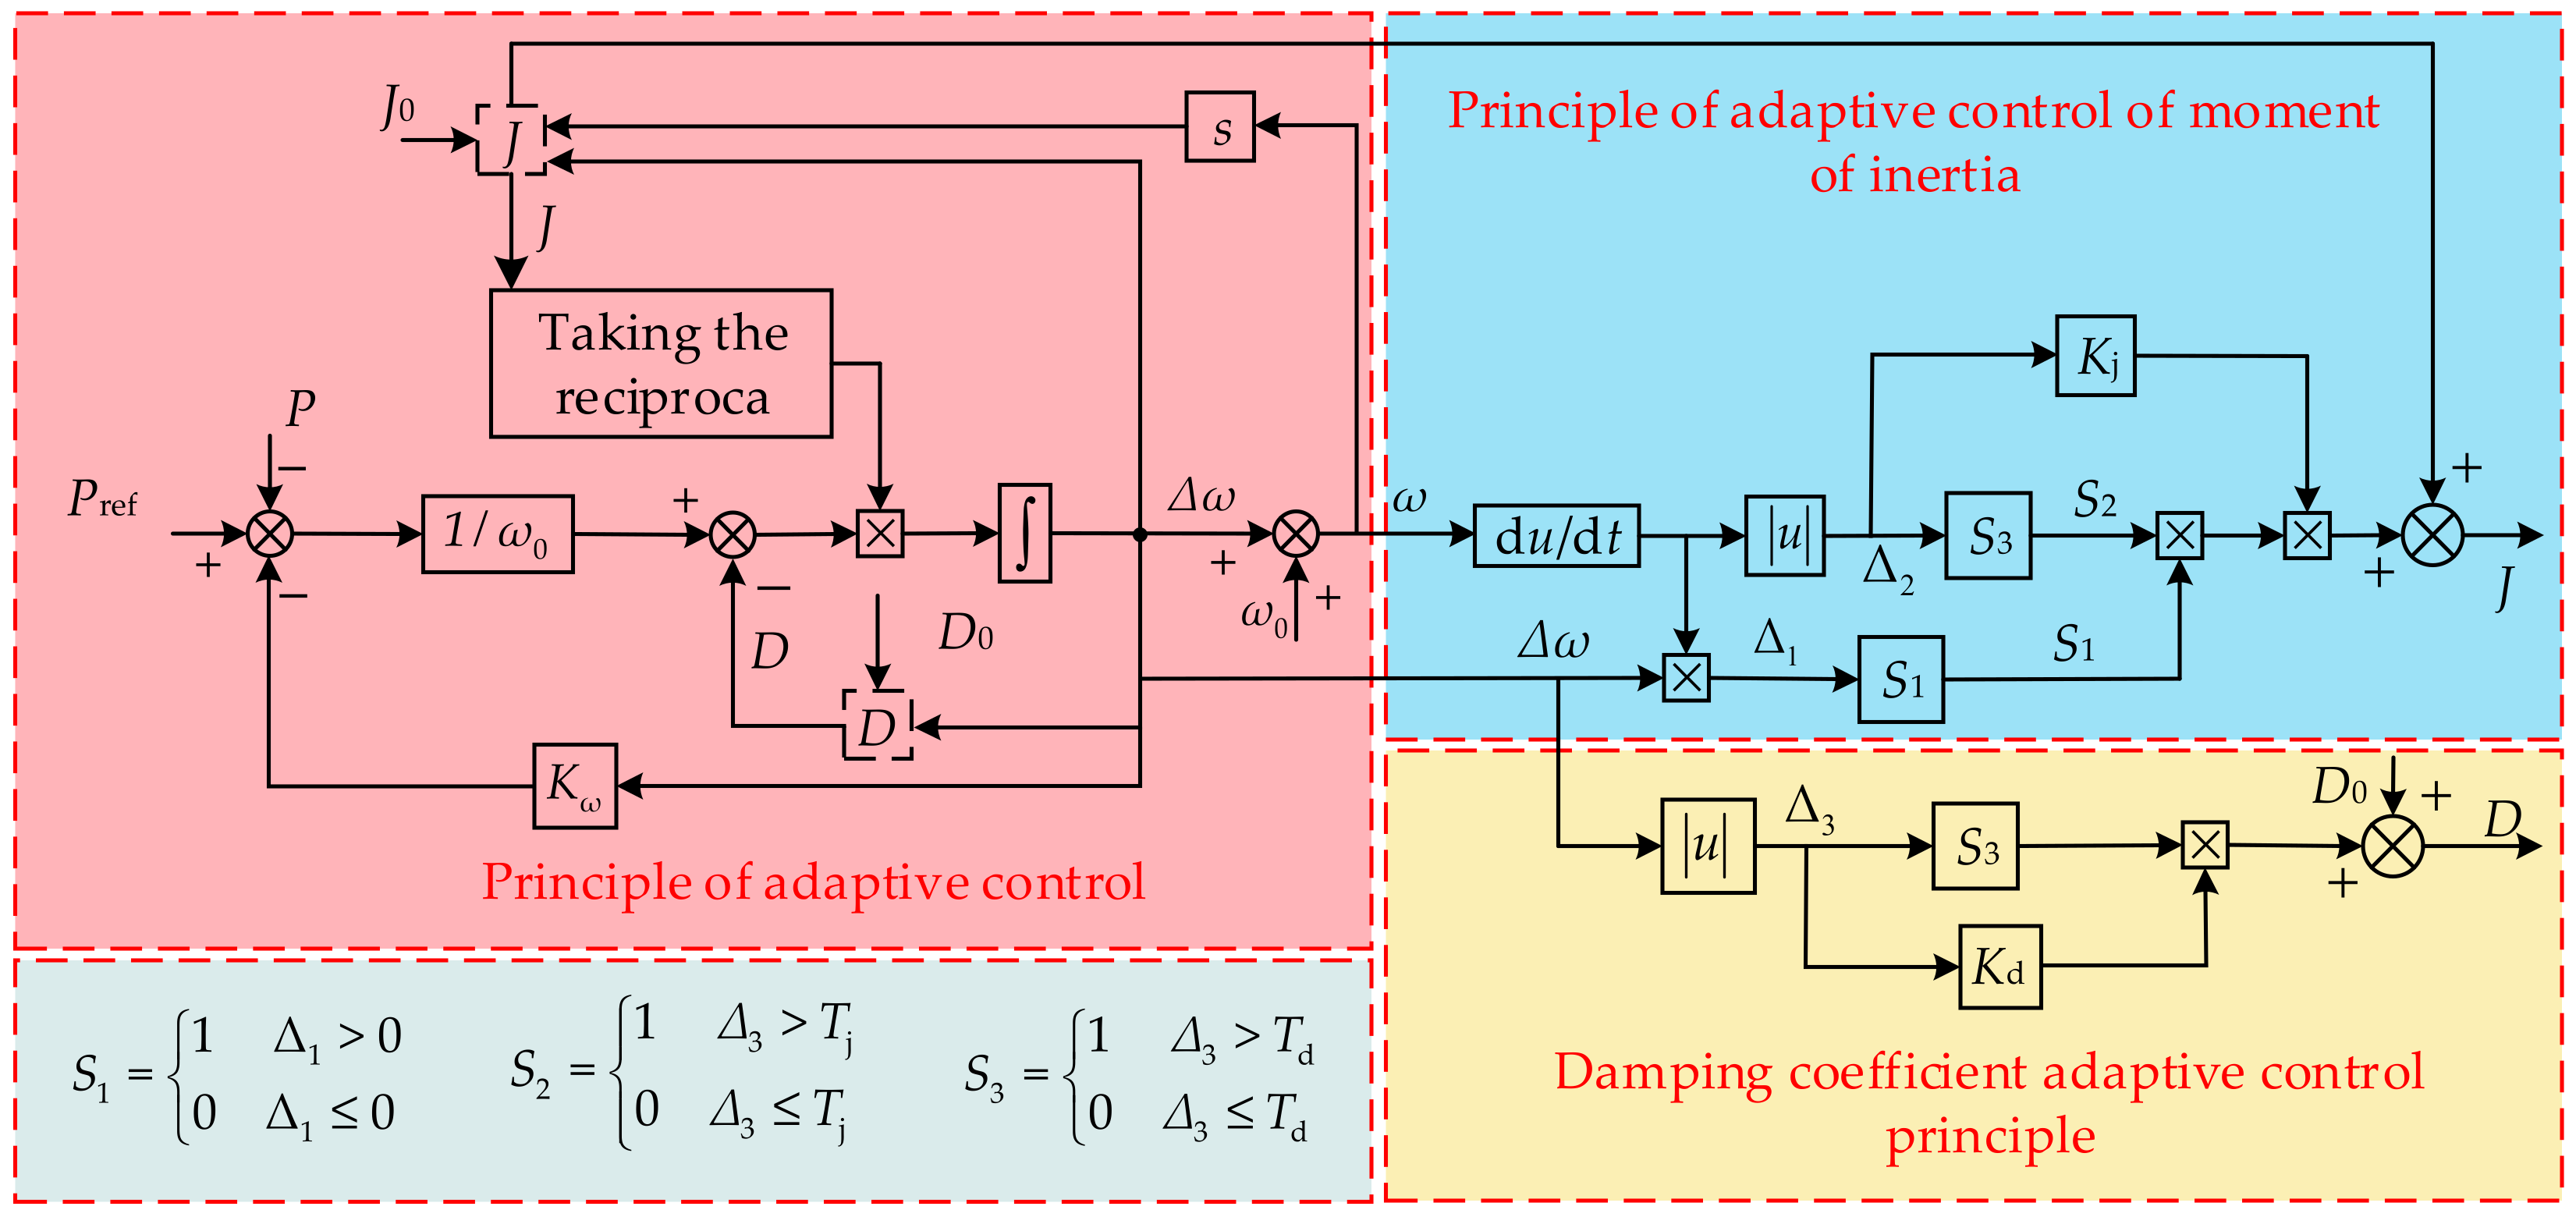
4. Virtual Inertia and Damping Adaptive Control Principle

Based on the analysis and interactions among key parameters in the traditional VSG framework, precise system control is attainable through the dynamic adjustment of virtual inertia J and damping coefficient D. In the complex operational environment of the actual power grid, exploring an adaptive control strategy with variable parameters is crucial for enhancing the rapidity of dynamic response and the frequency stability of the system. In this section, the selection criteria for virtual inertia J and damping D are determined by analyzing the power angle curve and frequency oscillation curve of the SGs, and the adaptive formula is formulated.

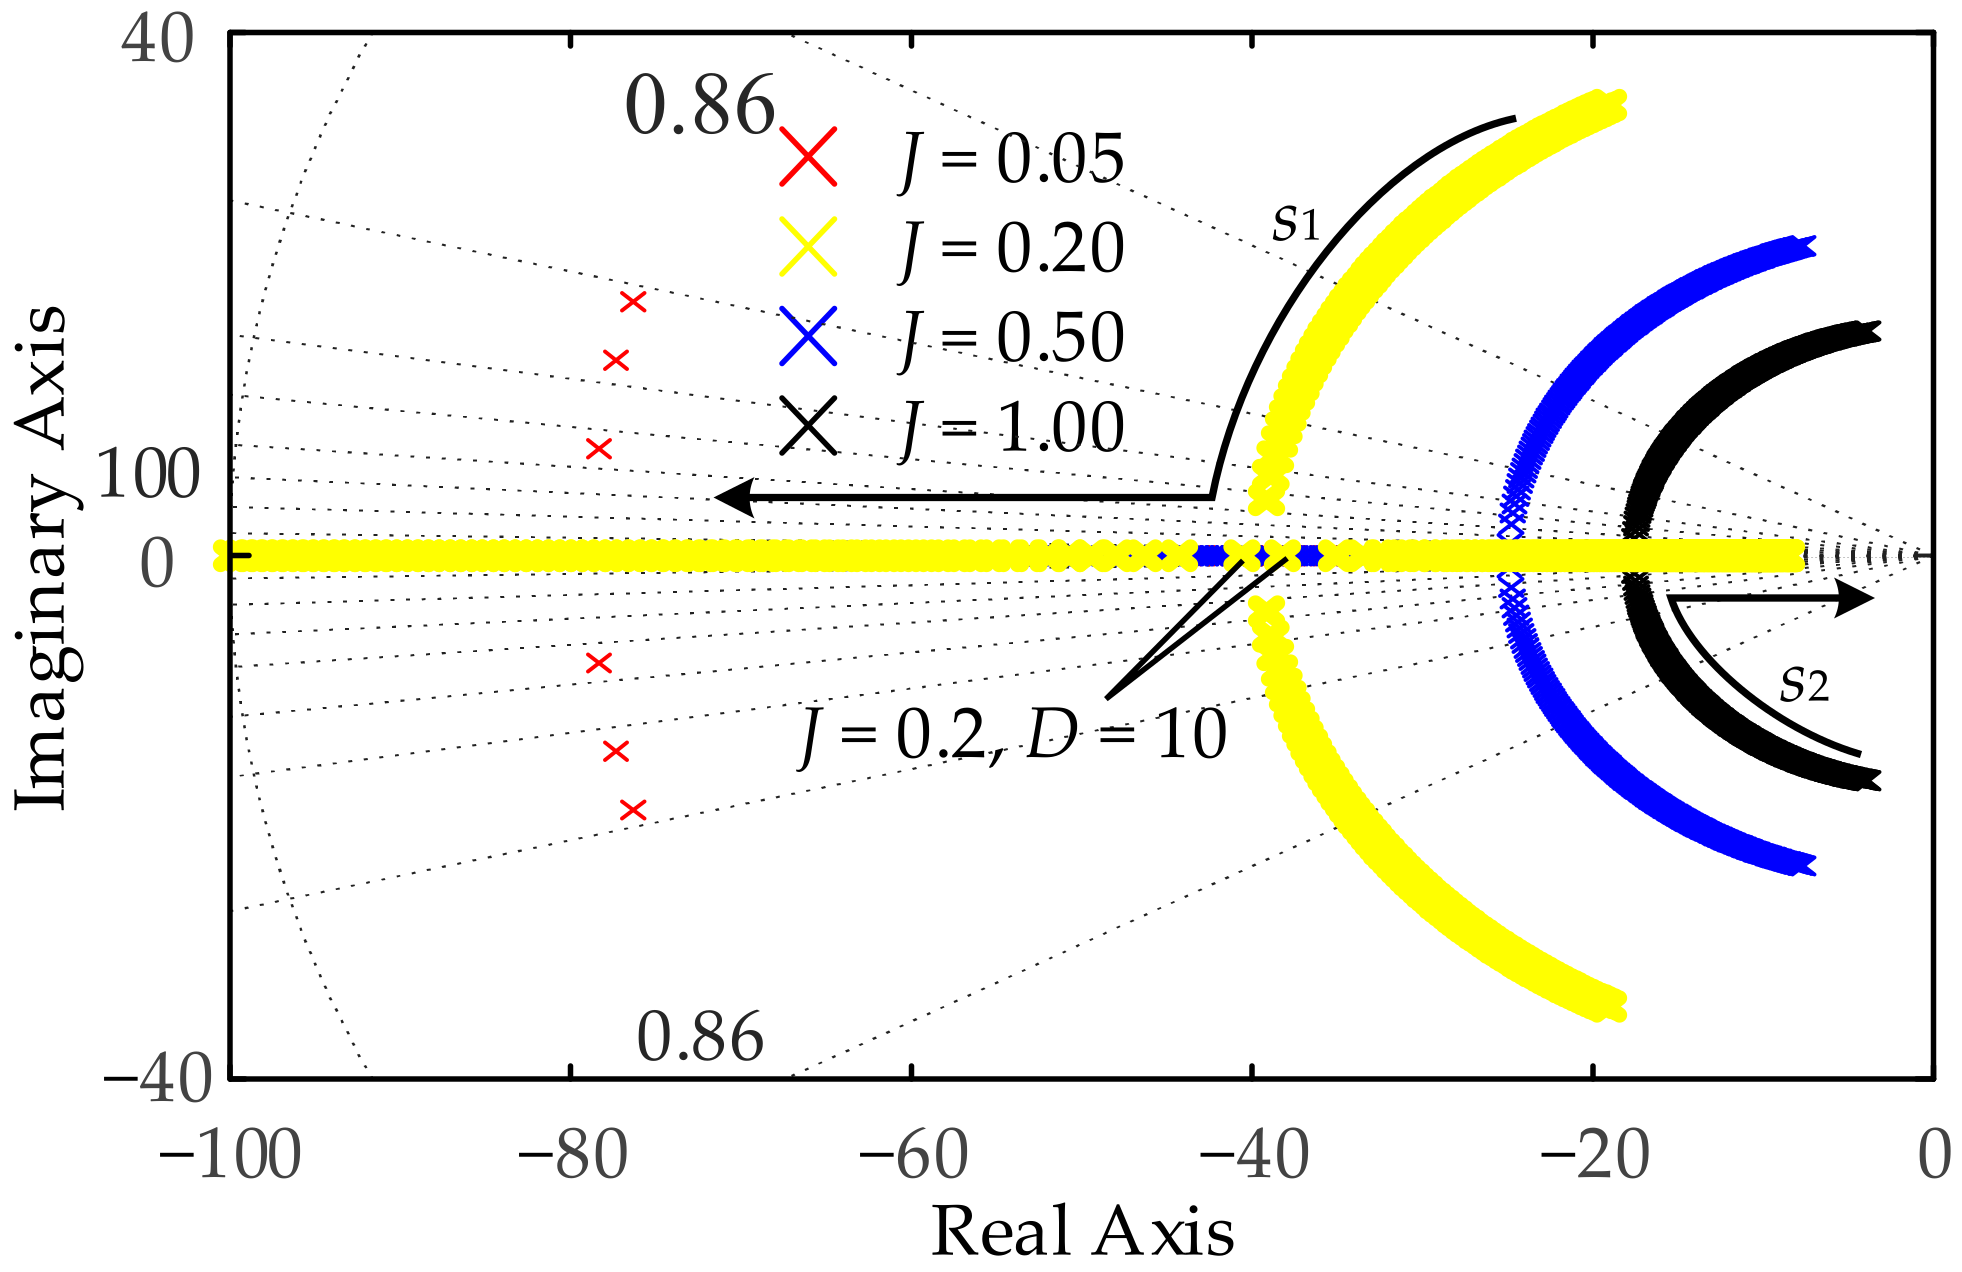
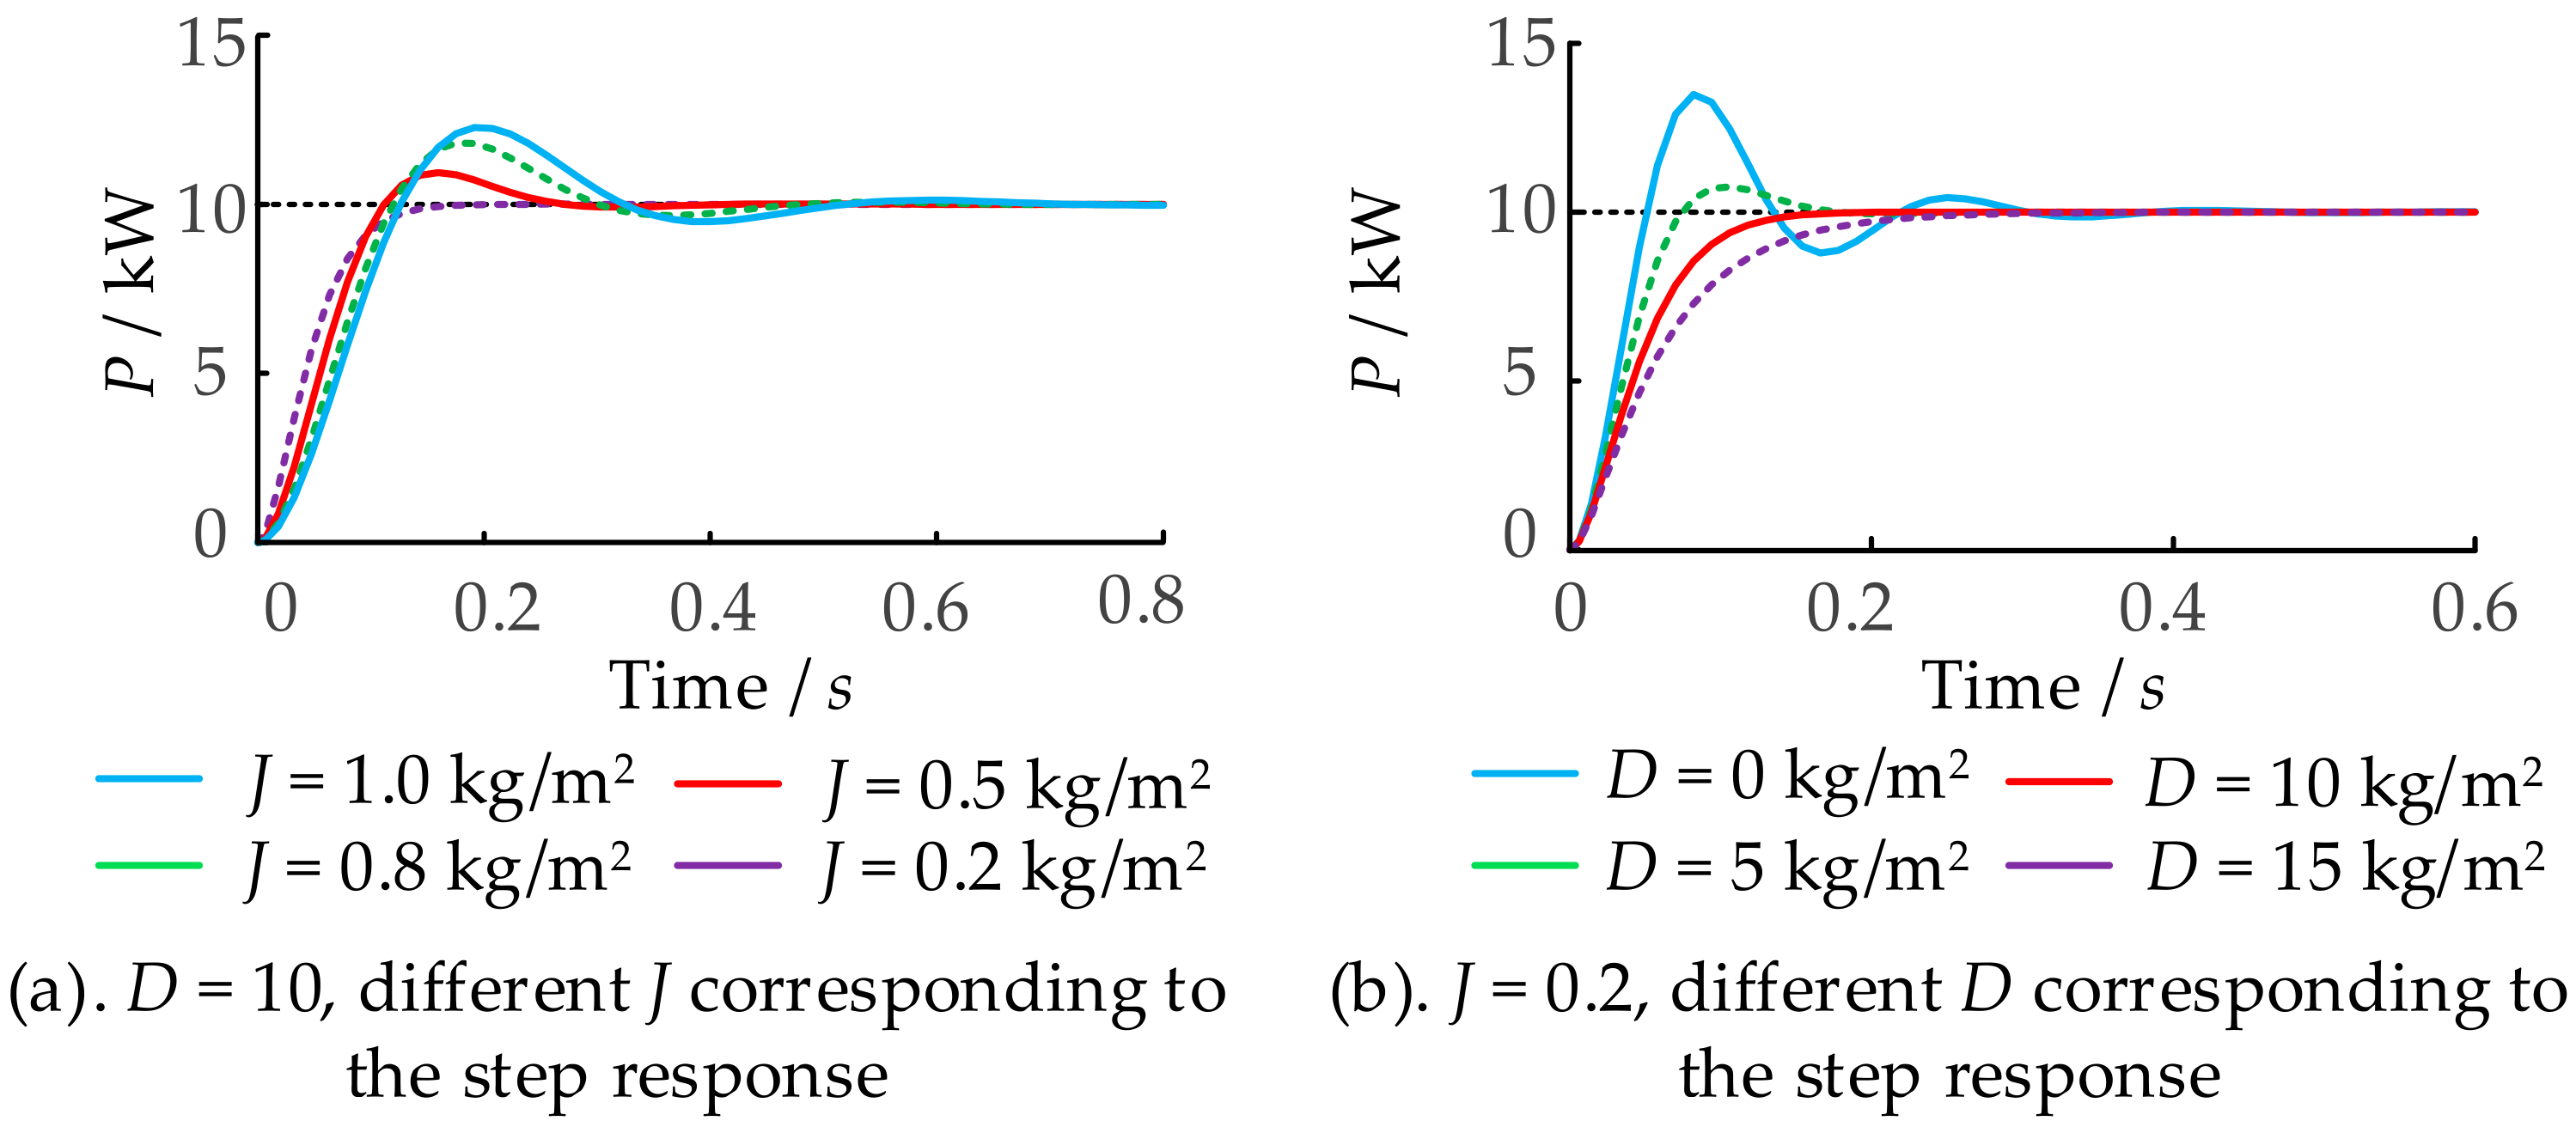
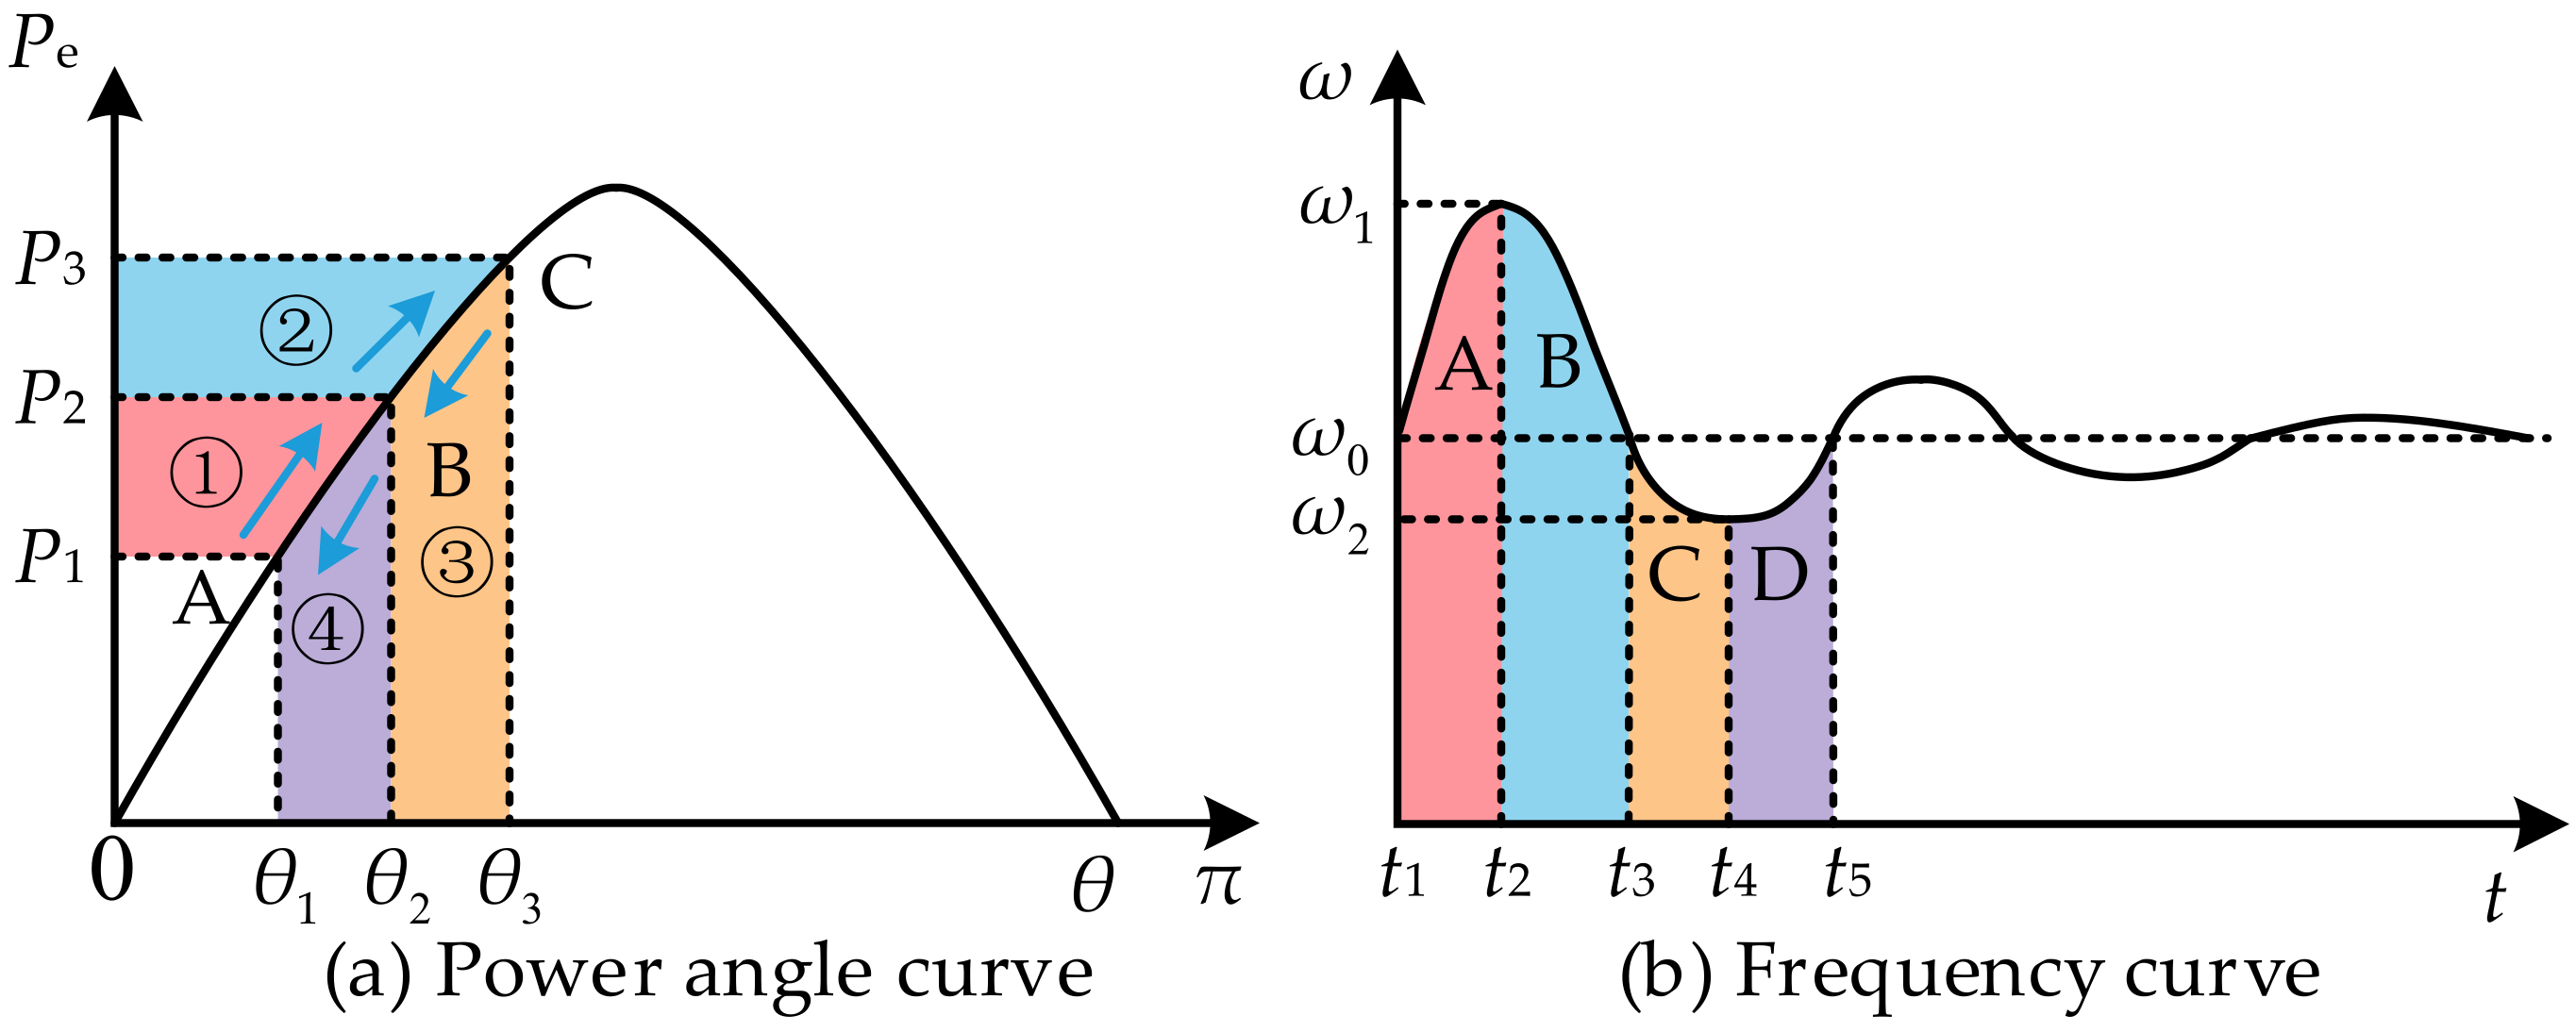
4.1. The Influence of Virtual Inertia and Damping Coefficients on Power

Based on Equation (6), the relationship between the change in angular frequency Δω and its rate of change (dω/dt) is demonstrated in Equation (17):
Δ ω = ω ω 0 = P r e f P J ω 0 d ω d t D ω 0 + K ω d ω d t = P r e f P D ω 0 + K ω ω ω 0 J ω 0
Equation (17) indicates that, when the D is held constant, the change in frequency Δω is directly proportional to the J. Conversely, with the J held constant, Δω is inversely proportional to D, while dω/dt is directly proportional to D. Consequently, the values of J and D can be adjusted through Δω and dω/dt. For this analysis, it is assumed that J and D remain constant to investigate how the values of J and D can be affected by Δω and dω/dt. The power angle and the frequency oscillation curve of the SGs are presented in Figure 5.
As illustrated in Figure 5, when the parameters J and D are held constant, a typical attenuation oscillation can be delineated into four intervals [13]: (1) t1-t2; (2) t2-t3; (4) t3-t4; (5) t4-t5. In the interval (1), when the system active power command increases from P1 to P2, the system transitions from the initial stable state A to the new stable state B. Due to the delayed change in electromagnetic power, the mechanical power surpasses the electromagnetic power, resulting in a frequency increase that exceeds the rated frequency, peaking at time t2. Throughout this process, the Δω increases from zero, reaches a peak, and subsequently returns to zero. During this phase, both Δω and dω/dt are observed to be positive. To mitigate the fluctuations in the rate of change in angular frequency, it is essential to enhance the virtual inertia J and incorporate additional damping D to avert excessive values of Δω and dω/dt.
In the interval (2), subsequent to the system attaining the new stable state B, it continues its progression towards state C due to the effects of inertia. Throughout this process, the input power remains constant, while the output electromagnetic power exhibits a gradual increase. The angular frequency exhibits a gradual decline from its peak at time t2 to the rated value at time t3, accompanied by a reduction in the Δω. The rate of change in the angular frequency is found to initially decrease and then increase from a value less than 0. At this stage, Δω is positive, while dω/dt is negative. It is considered appropriate to decrease the virtual inertia J to restore the angular frequency to its rated value quickly, and to appropriately increase the damping D to reduce the angular frequency deviation.
The analytical methods employed for the remaining intervals align with those previously outlined and will not restated. The aforementioned analysis demonstrates that the judicious selection of parameters J and D significantly improves system performance. The variation in J and D under varying conditions are detailed in Table 1:

4.2. Selection of Virtual Inertia and Damping

As illustrated in Table 1, J is determined by both the Δω and dω/dt, whereas D is solely influenced by Δω. Consequently, an adaptive control strategy can be formulated as demonstrated in Equations (18) and (19).
J = J 0       Δ ω × d ω d t 0 d ω d t T j J 0 + K j d ω d t       Δ ω × d ω d t > 0 & d ω d t > T j
D = D 0       Δ ω T d D 0 + K d Δ ω       Δ ω > T d
Where J0 and D0 represent the set values of J and D during VSG operation; Kj and Kd represent the adjustment coefficients for J and D; Tj and Td signify the change thresholds.
Figure 6 illustrates the schematic diagram of the adaptive control strategy for J and D, which is derived from Equations (18) and (19).

4.3. Parameter Tuning

4.3.1. Parameter Tuning for Kω, J0, D0

Kω serves as the primary frequency regulation coefficient, and based on its physical implications, this study adopts the following approach:
K ω = S r a t e 1 % ω 0
where Srate denotes the rated capacity of the VSG. While the Kω = 5.2 is determined through Equation (20).
As indicated in the analysis presented in Section 4.1, the inertia and damping constitute the primary control parameters in the VSG control loop. Based on the physical interpretation of the damping coefficient, the mathematical representation is formulated in Equation (21):
D = Δ T Δ ω = Δ P 2 π ω 0 Δ f
where ΔP denotes the variation in power and Δf denotes the variation in frequency.
In this study, the frequency deviation is 1 Hz, and the power variation is 20 kW. Through the calculations, it has been established that D0 =10 N∙m∙s∙rad−1.
The open-loop transfer of the APL, as derived from Equation (14), is expressed in Equation (22):
T P - P r e f ( s ) = K P J ω 0 s 2 + ( D ω 0 + K ω ) s
As stated in Equation (23), the characteristic equation of the open-loop active power control system satisfies the following condition at its cut-off frequency fcp:
T P - P r e f ( j 2 π f c p ) = K P 2 π f c p 1 ( J ω 0 2 π f c p ) 2 + ( D ω 0 + K ω ) 2 = 1
The representation of inertia can be derived from Equation (23) as demonstrated below:
J = D ω 0 + K ω 2 π ω 0 f c p K P 2 π f c p ( D ω 0 + K ω ) 2 1
To ensure the validity of Equation (24), it is imperative that the expression within the radical be greater than zero, thereby enabling the determination of the valid range for the parameter fcp:
f c p K P 2 π ( D ω 0 + K ω ) = f c p _ m a x
where fcp_max is the maximum value of cut-off frequency fcp.
When the fcp = fcp_max, it is evident from Equation (24) that J = 0. This indicates a transition of the system from its original first-order inertia link to a unit gain link, which fails to ensure the system’s stability and dynamic response performance. Consequently, the VSG control system necessitates the presence of a certain level of inertia link, necessitating the condition fcp < fcp_max i.e., J > 0.
Based on the control principle, to ensure system stability, the steady-state value of the virtual inertia J0 must satisfy the phase margin PM ∈ [30°, 60°]. In this study, the PM = 30° is adopted. Consequently, J0 must fulfill the requirements outlined in Equation (26):
J 0 D ω 0 + K ω 2 π ω 0 f c p cot 30 °
Based on Equations (24)–(26), the value range of J0 is calculated to be (0, 0.3234]. As illustrated in Figure 4, to mitigate the impact on the output voltage frequency J0 = 0.2 kg∙m2 in this paper.

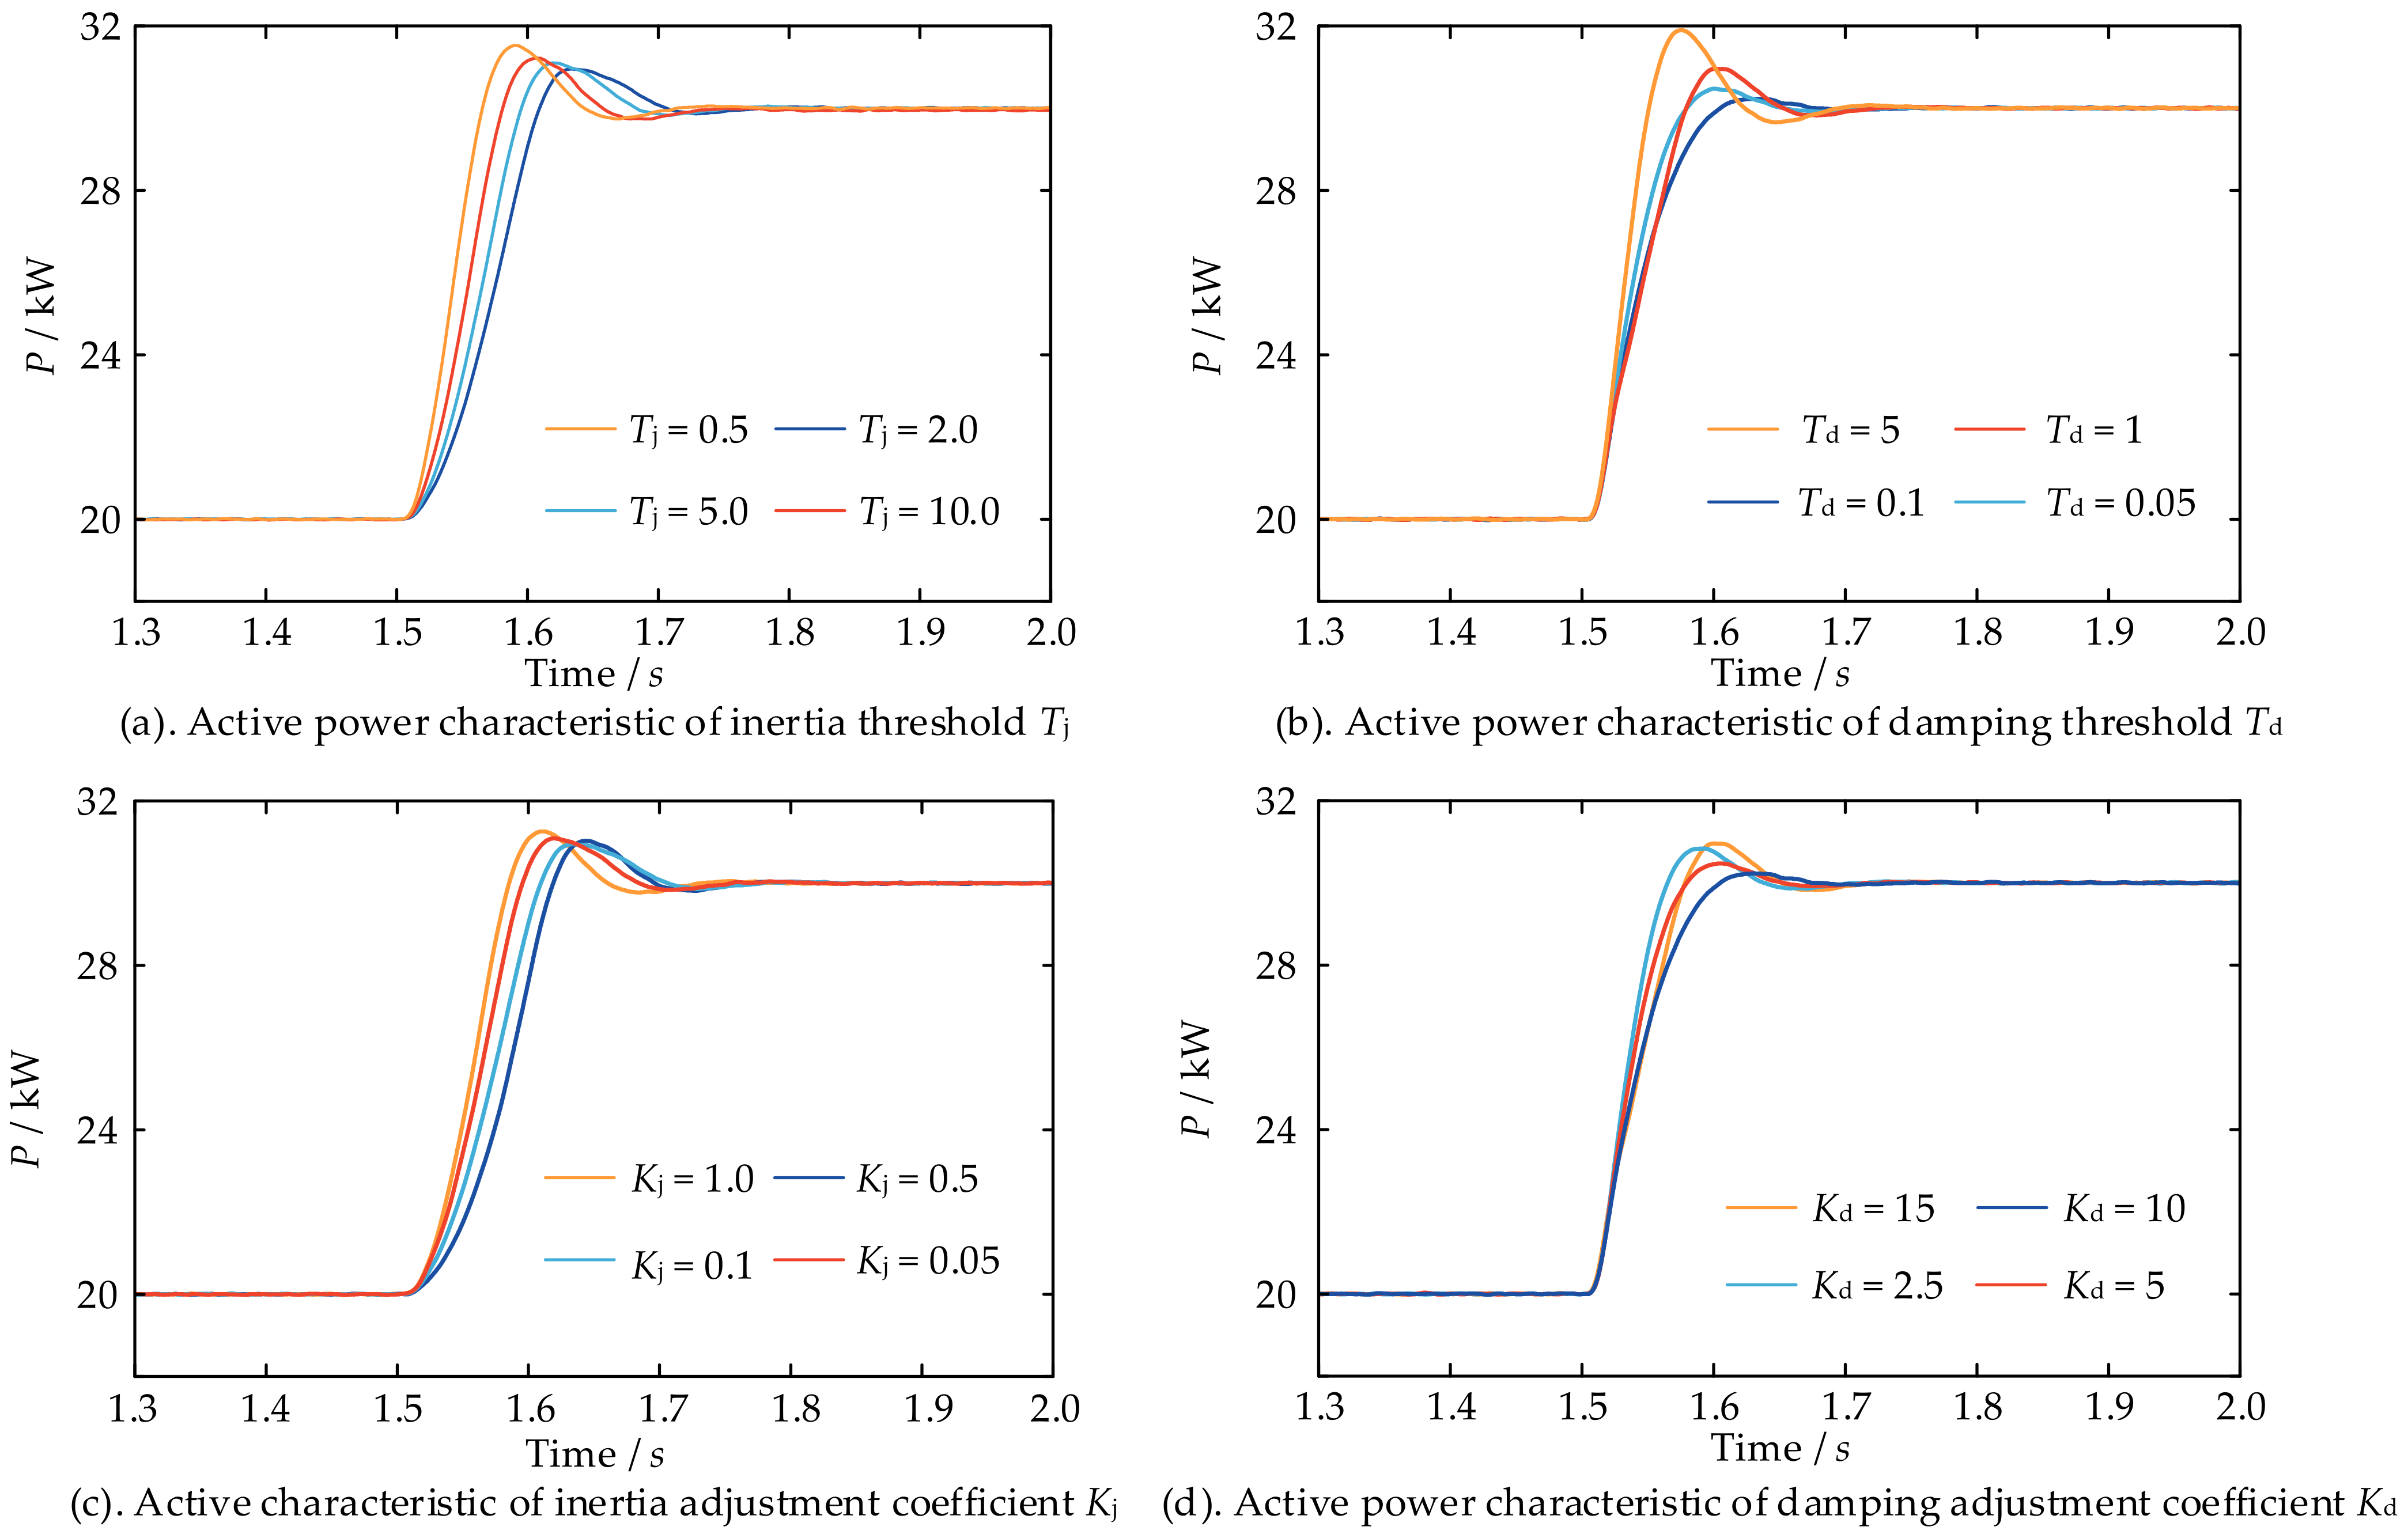
4.3.2. Parameter Tuning for Tj, Td, Kj and Kd

This study employs a systematic parameter optimization methodology based on the dynamic response characteristics of active power with respect to the control parameters Tj, Td, Kj and Kd. The influence of different Tj on active power disturbance as illustrated in Figure 7a, when Tj = 2.0 demonstrates superior overshoot suppression while maintaining satisfactory dynamic response characteristics, thus being selected as the design parameter. The effect of different Td on active power disturbances is depicted in Figure 7b, at Td = 0.1, the VSG control exhibits a significant reduction in the overshoot of the active response. Thus being selected as the design parameter. The influence of varying Kj on active power disturbances is presented in Figure 7c, where it is noted that, at Kj = 0.1, the overshoot of the active power response is markedly suppressed, thus Kj = 0.1 is chosen for this analysis. The effect of different Kd values on active power disturbances is shown in Figure 7d. It is determined that Kd = 10 provides the most substantial inhibitory effect on the overshoot of the active power response, resulting in the selection of Kd = 10 for this investigation.

5. Simulation Analysis

A PV power generation system model is constructed in MATLAB/Simulink to validate the proposed strategy’s effectiveness. The simulation parameters are presented in Table 2. Within this table, Udc denotes the DC bus voltage, and UN represents the AC rated voltage.

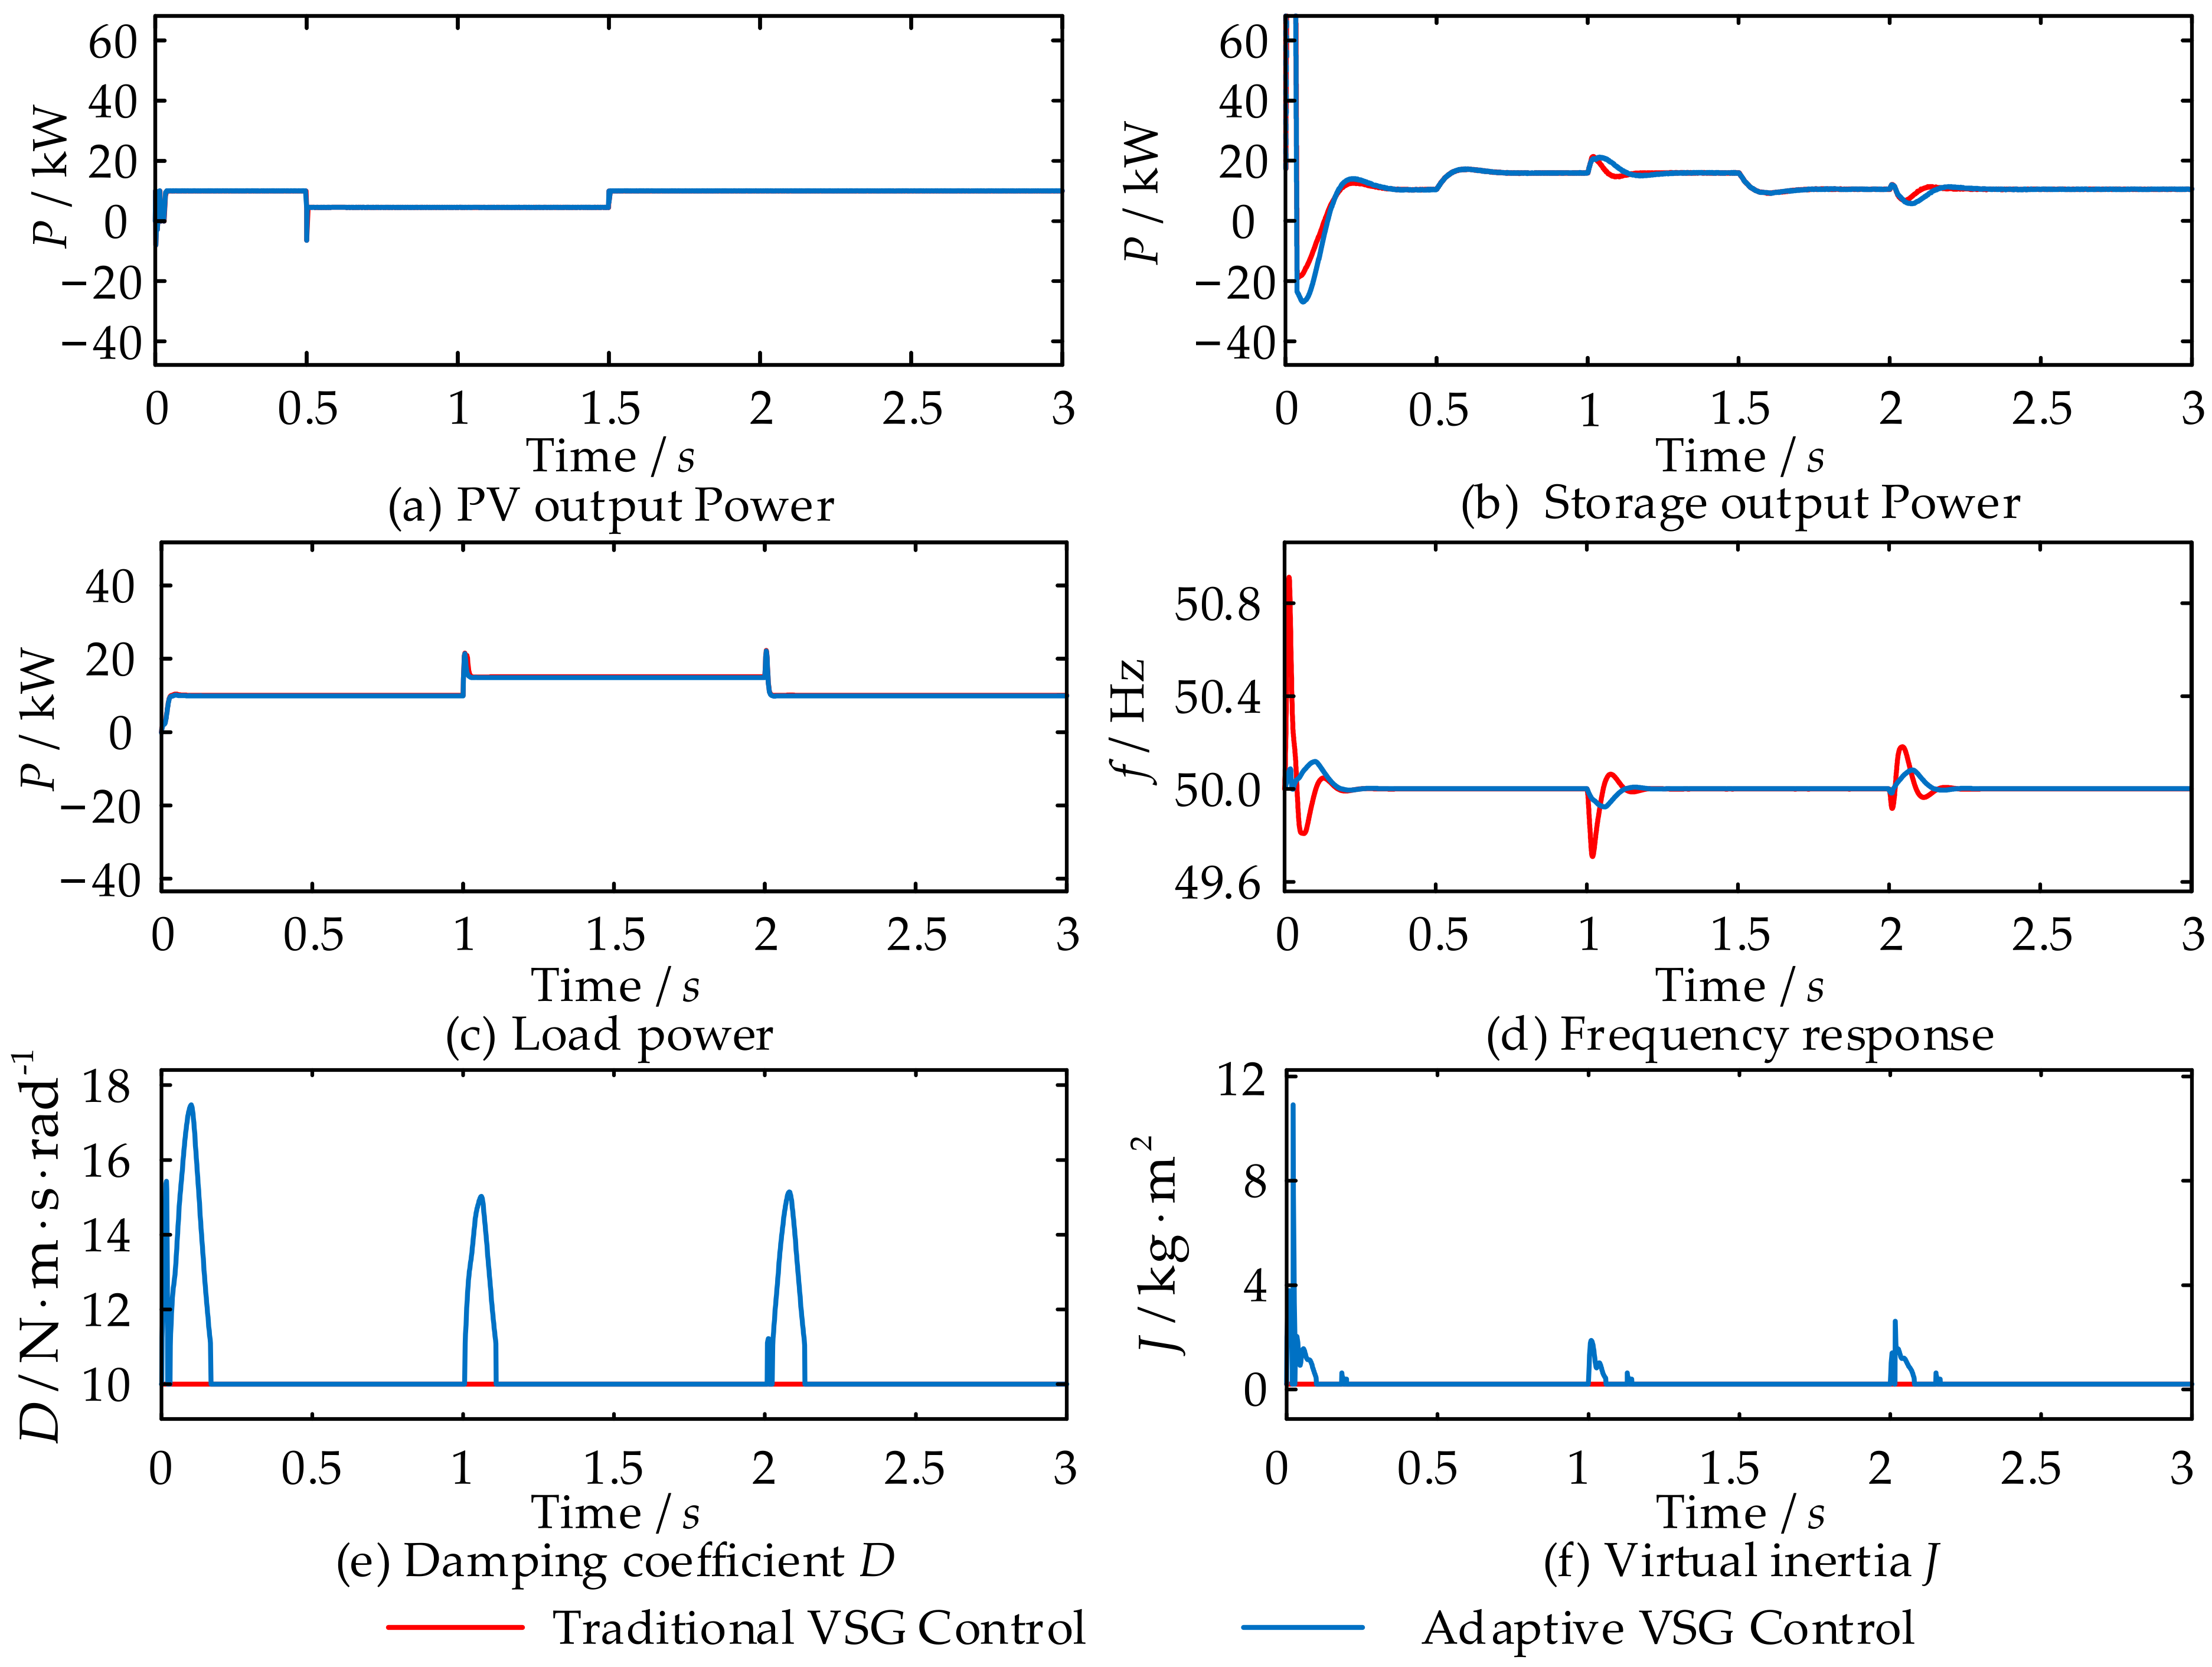
5.1. Active Power Output Variation Condition

Test condition: The simulation duration is set to 3 s, with initial parameters including average PV light intensity of 10 kW/m2, temperature at 25 °C, converter output power of 20 kW, and load power of 10 kW. At 0.5 s, the given active power output of the converter is set to 10 kW and held constant for 1 s. Subsequently, at 1.5 s, the given active power returns to 20 kW. The actual output power of the converter corresponding to different control strategies is presented in Figure 8.
As illustrated in Figure 8, at 0.5 s, the converter output power decreases, whereas the PV output power remains constant. To ensure a constant VSG output power, it is essential to correspondingly decrease the energy storage output power. The analysis of waveform variations at 1.5 s follows the same methodology outlined earlier. As illustrated in Figure 8c, when the active power changes at 1.5 s, the converter output power attains a peak active power oscillation value of 21.38 kW at 1.58 s under the traditional control strategy, with an adjustment time of 0.09 s. In contrast, the converter output power under adaptive control proposed in this paper reaches a peak active power oscillation value of 20.23 kW at 1.66 s. Compared to the fixed parameter control strategy, the adaptive control strategy proposed in this paper requires an additional 0.08 s to reach the peak power point, while the power oscillation value is reduced by 1.15 kW.
Figure 8d illustrates that, at 1.5 s, the active power change results in peak frequency deviations of 0.28 Hz and 0.13 Hz for the two control strategies, occurring at 1.52 s and 1.57 s, respectively. Compared to the fixed parameter control strategy, the adaptive control strategy proposed in this paper requires an additional 0.05 s to reach the frequency peak, while the frequency oscillation value is significantly lower.
The comparative analysis conducted above indicates that traditional VSG control exhibits significant overshoots in both power and frequency when the active power regulation command changes abruptly. In contrast, the proposed adaptive control significantly mitigates these overshoots, demonstrating a pronounced capability to dampen power oscillations.
Figure 9 illustrates the real-time variation curves of the D and J under different control strategies. At 0.5 s, a reduction in the output power of the VSG is observed. Under traditional VSG control, J and D remain constant, while D and J dynamically adjust under the adaptive VSG control strategy. It is evident that, in response to active power disturbances, the adaptive VSG control strategy employs the compensation of J and D to achieve primary frequency regulation and reduce the trends of dω/dt and Δω. This results in a significant reduction in frequency overshoot and a substantial decrease in system recovery time following disturbances. These outcomes reflect the control flexibility and responsiveness of VSG.
The simulation results illustrated in Figure 10 demonstrate that the grid-connected current exhibits a significant overshoot in response to active power disturbances under traditional control. This overshoot is primarily attributed to the limited damping and inertial response of traditional VSG control, which lacks sufficient adaptability to rapidly changing grid conditions. In contrast, the current waveform under the proposed adaptive control remains relatively stable during active power disturbances. This indicates that the instantaneous surge current induced by active power disturbances is effectively suppressed, thereby enhancing the stability of the power grid.

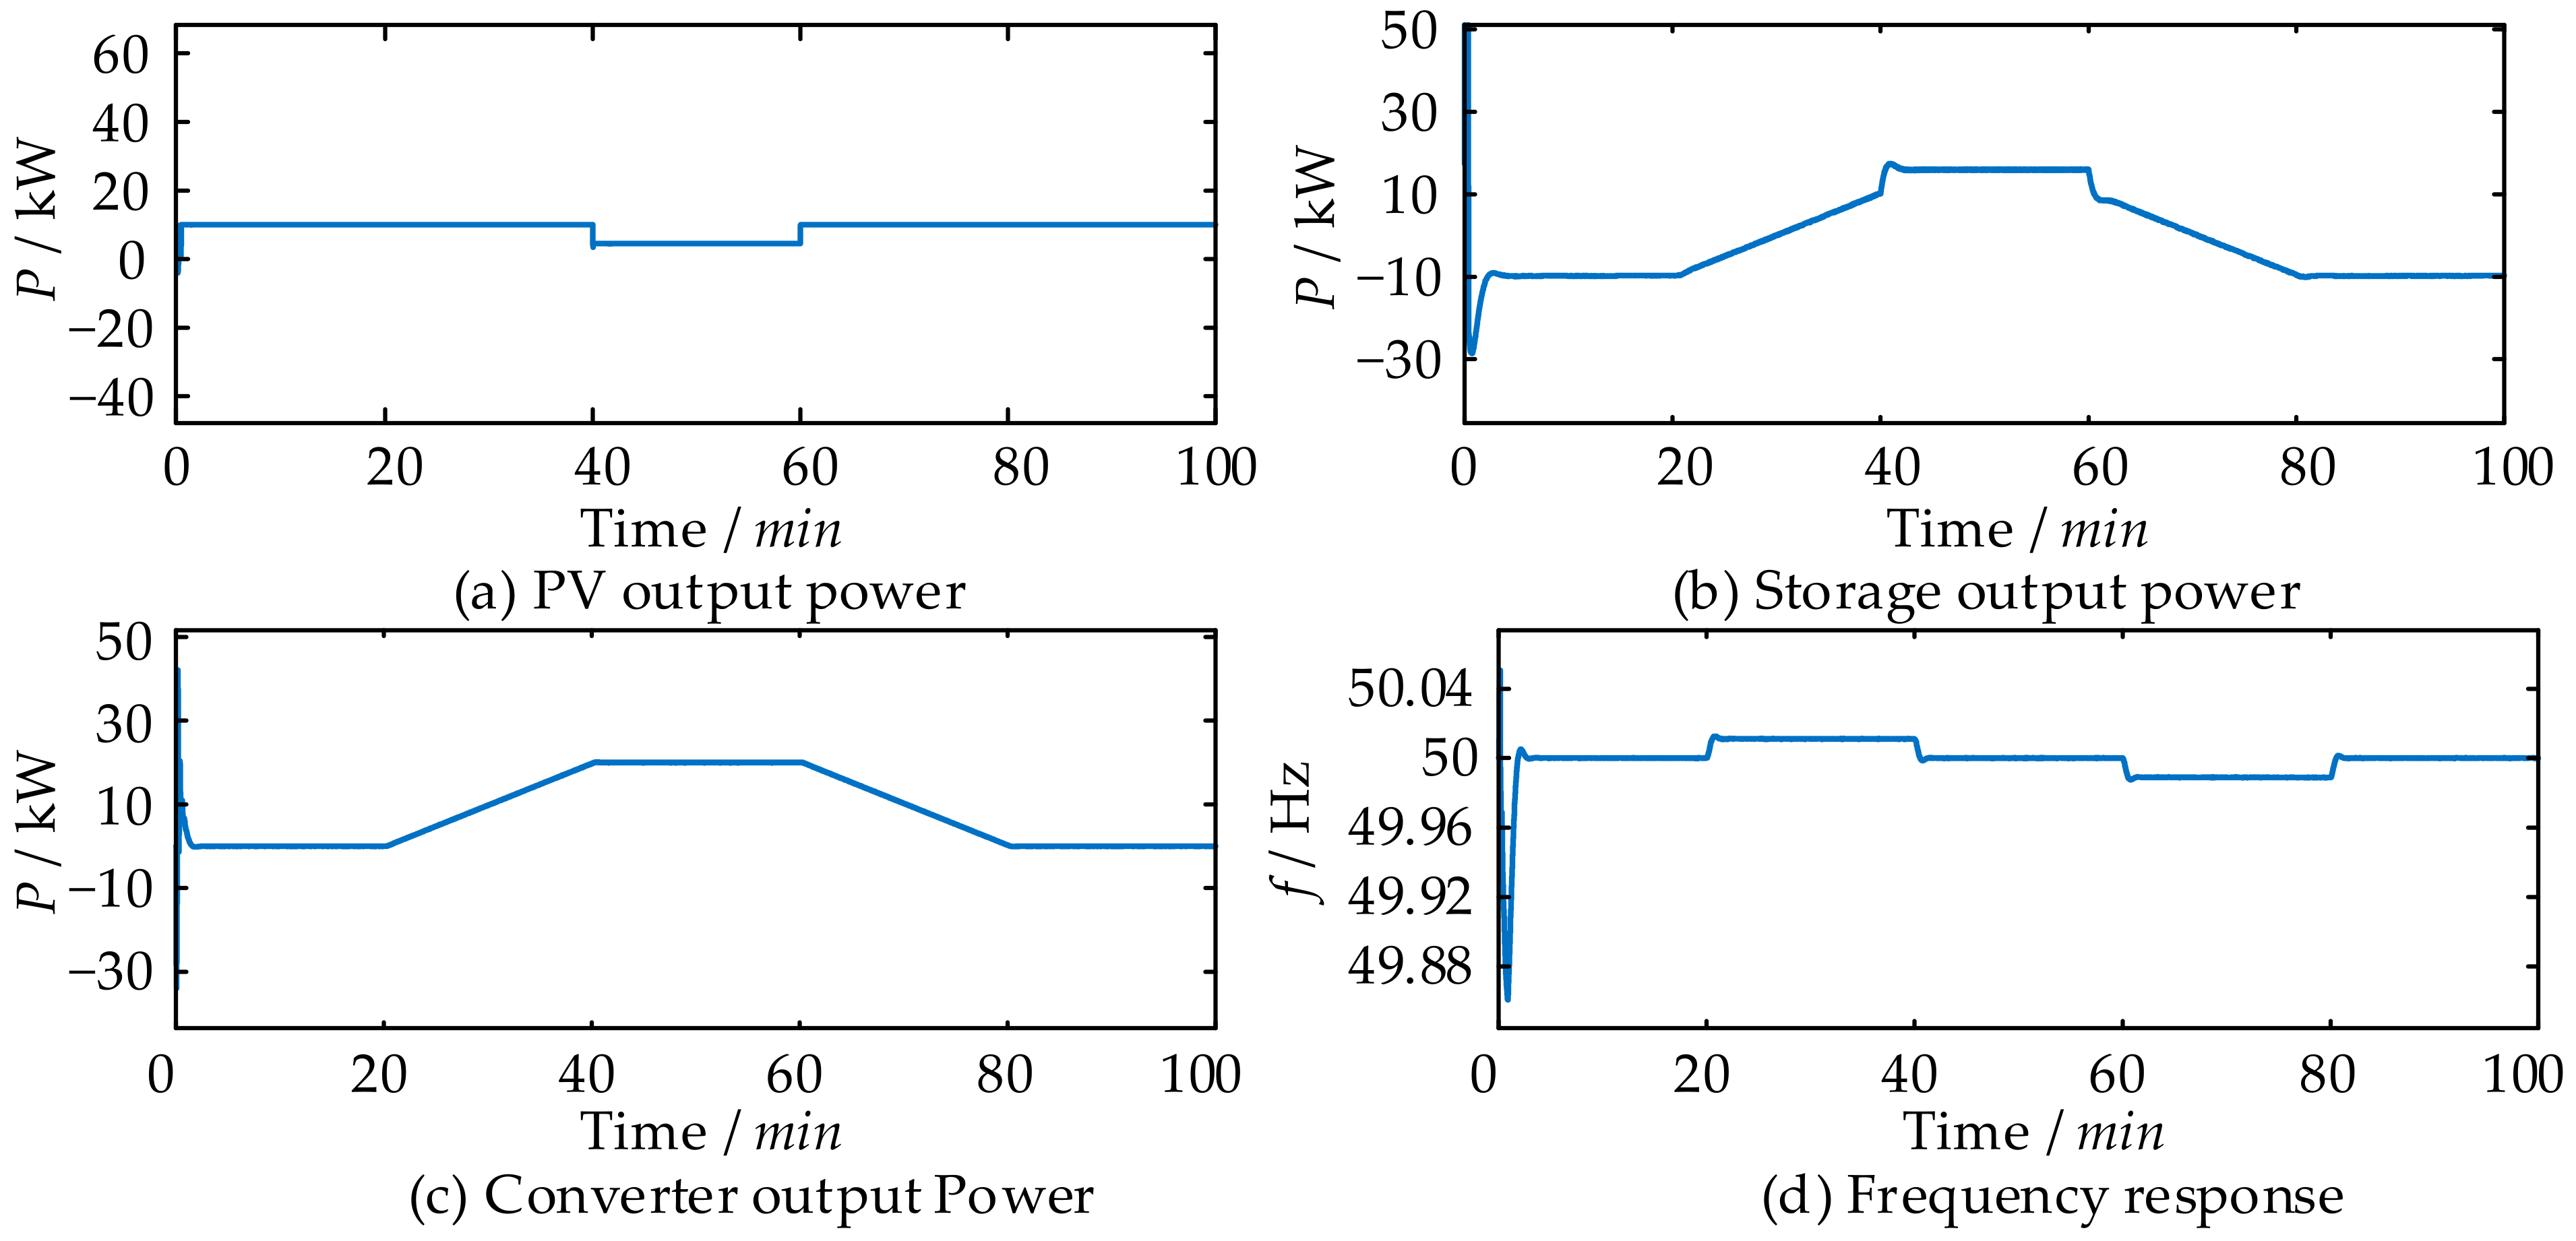
5.2. Load Power and Light Intensity Variation Condition

Test condition: The simulation duration is set to 3 s, with an average PV light intensity of 10 kW/m2, temperature of 25 °C, converter output power of 20 kW, and load demand of 10 kW. The light intensity decreases to 5 kW/m2 at 0.5 s, the load increases by 5 kW at 1 s, the light intensity returns to 10 kW/m2 at 1.5 s, and the load returns to 10 kW at 2 s.
Figure 11 depicts simulation results, demonstrating the effects of light and load disturbances under different control strategies. As illustrated in Figure 11a,b, at 0.5 s, the storage output power increases in response to a reduction in PV output power, maintaining the total output power constant. The waveform analysis for other disturbances follows the methodology outlined earlier. As illustrated in Figure 11d, when the load power changes at 2 s, the frequency attains an oscillation peak of 50.18 Hz at 2.04 s under the traditional control strategy. In contrast, the frequency under adaptive control proposed in this paper reaches a peak value of 50.08 Hz at 2.08 s. Compared to the fixed parameter control strategy, the adaptive control strategy proposed in this paper requires an additional 0.04 s to reach the maximum frequency point, while the frequency oscillation value is reduced by 0.1 Hz.
The comparative analysis conducted above demonstrates that traditional VSG control exhibits substantial frequency overshoot in response to light intensity and load disturbances. Conversely, the proposed adaptive control significantly mitigates this overshoot, with a pronounced effect on dampening power oscillations.
The VSG output power and the grid power under various control strategies are presented in Figure 12. In Figure 12a, when the load power changes at 1 s, the converter out power reaches a peak power oscillation value of 30.94 kW under the traditional control strategy, with an adjustment time of 0.08 s. In comparison, the converter out power under adaptive control proposed in this paper reaches a peak power oscillation value of 30.97 kW, with an adjustment time of 0.06 s. Compared to the fixed parameter control strategy, the adaptive control strategy proposed in this paper requires an oscillation value of power by 0.03 kW and reduces the adjustment time by 0.02 s.
As illustrated in Figure 12b, when the load power changes at 1 s, the grid power reaches a peak power oscillation value of 12.78 kW under the traditional control strategy, with an adjustment time of 0.18 s. In contrast, the grid power under adaptive control proposed in this paper reaches a peak power oscillation value of 12.99 kW, with an adjustment time of 0.15 s. Compared to the fixed parameter control strategy, the adaptive control strategy proposed in this paper requires an oscillation value of power of 0.21 kW and reduces the adjustment time by 0.03 s.
The comparative analysis presented above indicates that the adaptive VSG control strategy reduces power oscillation amplitude, reduces the system’s adjustment time, and enhances stability and safety.

5.3. The Light Intensity Changes During Normal Grid-Connected Shutdown

Test Condition: The simulation duration is 100 min, with an initial average light intensity of PV set to 10 kW/m2 and a temperature of 25 °C. The variation in converter output power and light intensity of PV is shown in Table 3.
The simulation results under adaptive control are illustrated in Figure 13. As depicted in Figure 13a–c, the PV output power maintains a constant value of 10 kW, whereas the converter output remains at 0 kW within the initial 20-minute period, signifying that the energy storage unit is actively engaged in a charging state during this timeframe. The subsequent waveform analysis consistently aligns with the trends identified in the previous analysis. In Figure 13d, at the 20-min mark, the maximum frequency oscillation reaches 50.01 Hz during the transition in the converter output power. The comprehensive analysis of results underscores the adaptive VSG’s capability to effectively dampen frequency oscillations, meeting the stringent requirements of maintaining active power change rate below 10% and 5% of the installed capacity per minute, respectively.

6. Conclusions

This paper proposes an adaptive PV-storage control strategy that integrates VSG control with the virtual inertia J and damping D, designed to mitigate the effects of active power output and load power variations on the system’s dynamic characteristics. The system maintains stability and efficiency by ensuring a swift and precise response to grid and load fluctuations. The following conclusions can be drawn:
(1)
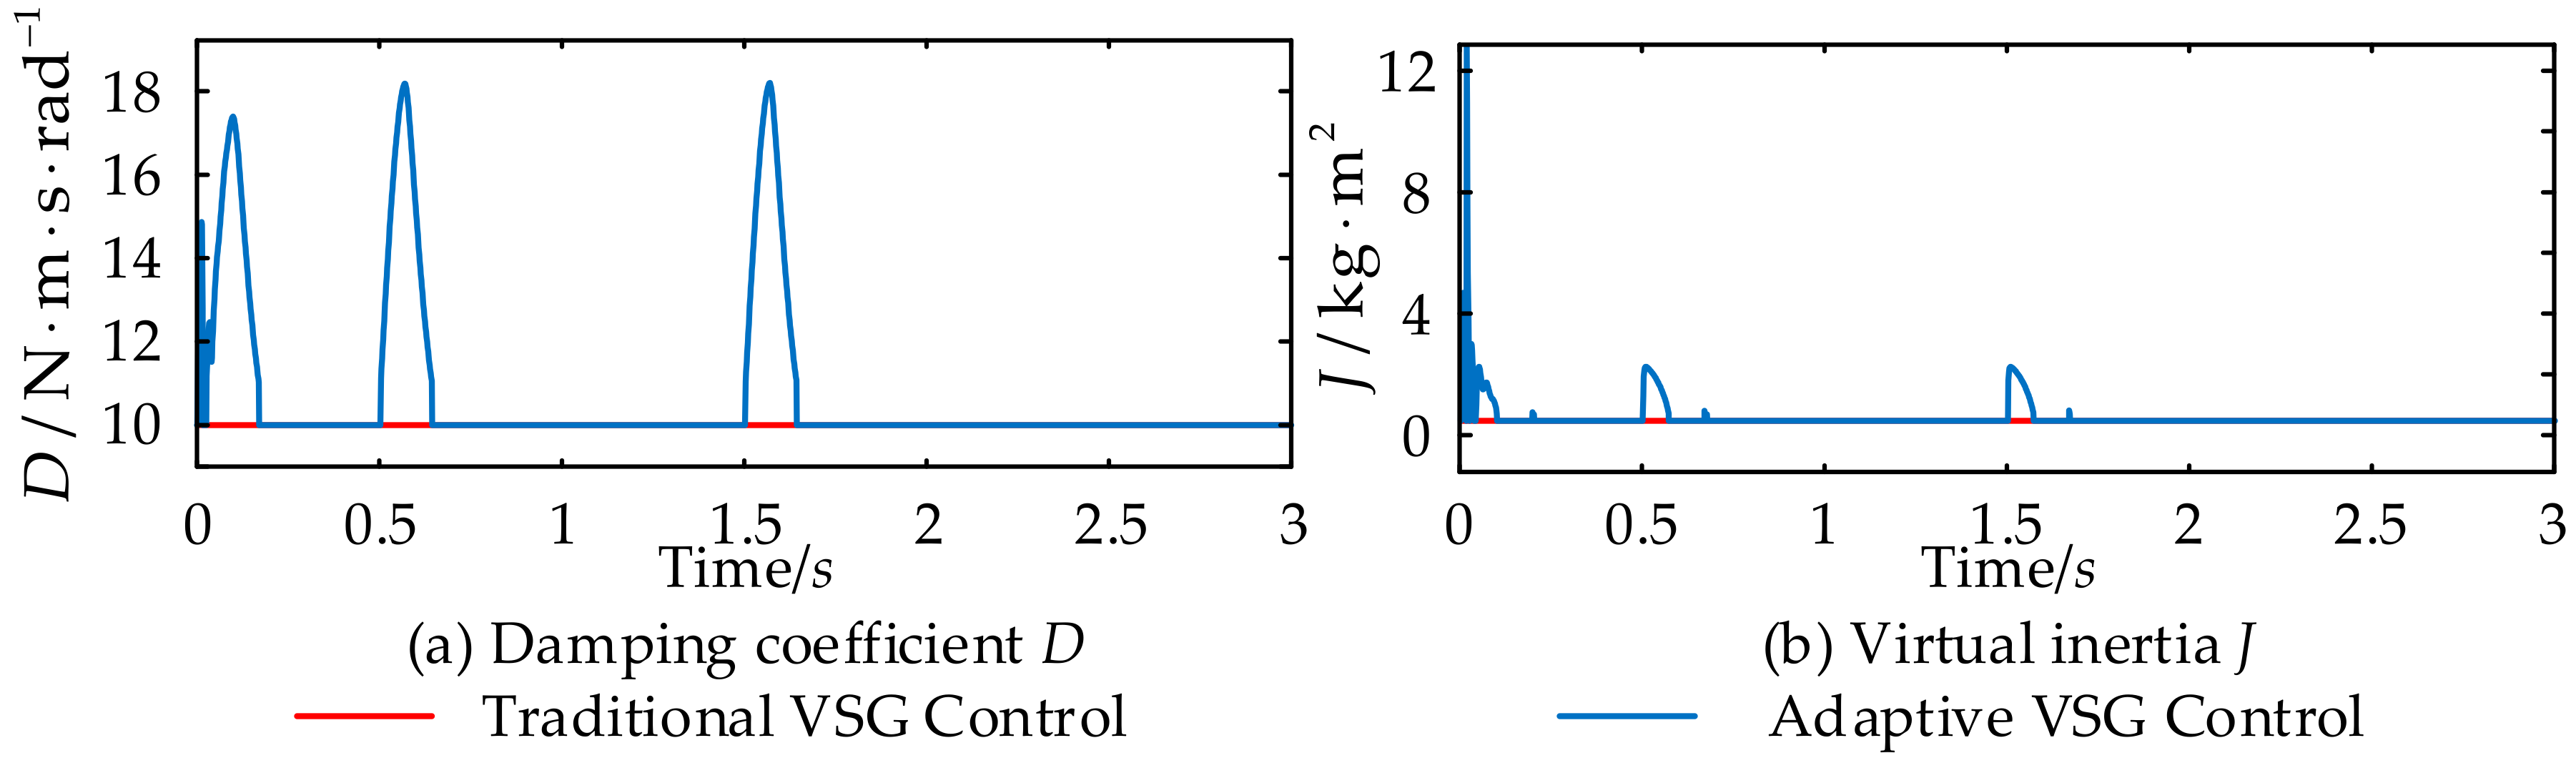
J effectively suppresses rapid frequency fluctuations and enhances the system’s dynamic response performance. However, excessively large J may destabilize the system. Conversely, D effectively mitigates system oscillations, improves system stability, and optimizes dynamic performance. Nonetheless, increasing D can impact the rapidity of the system. The values of the two parameters influence and restrict each other, leading to a contradiction.
(2)
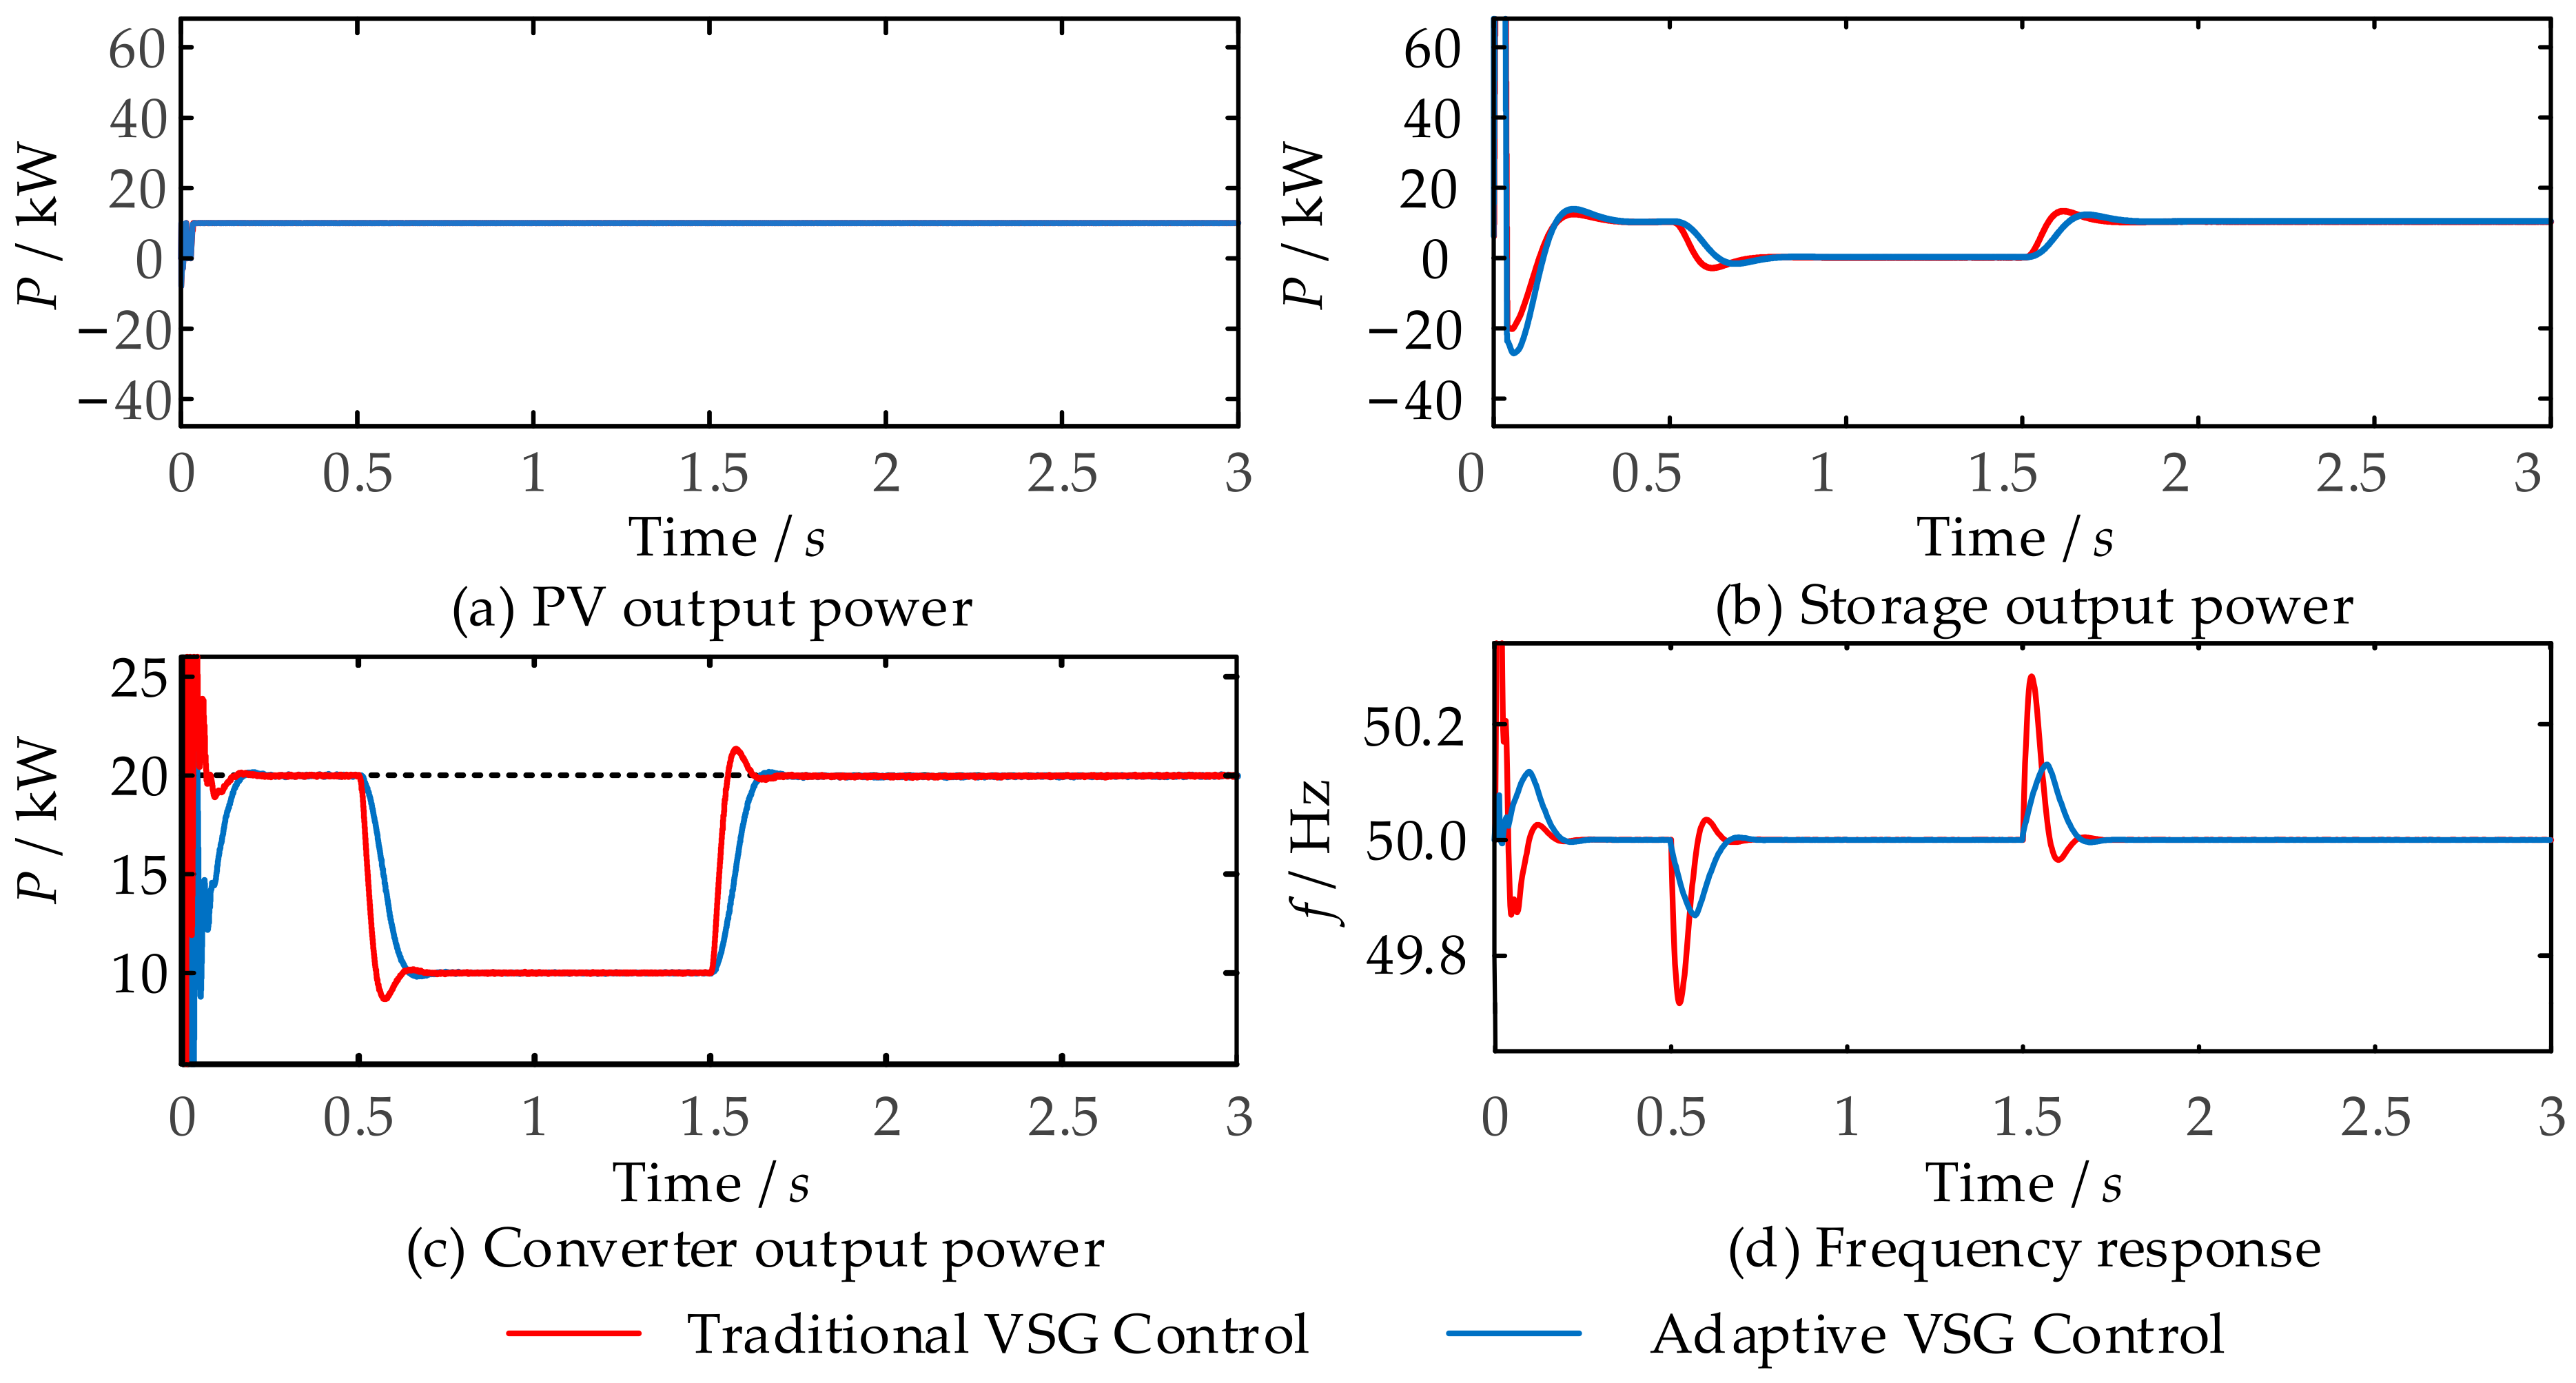
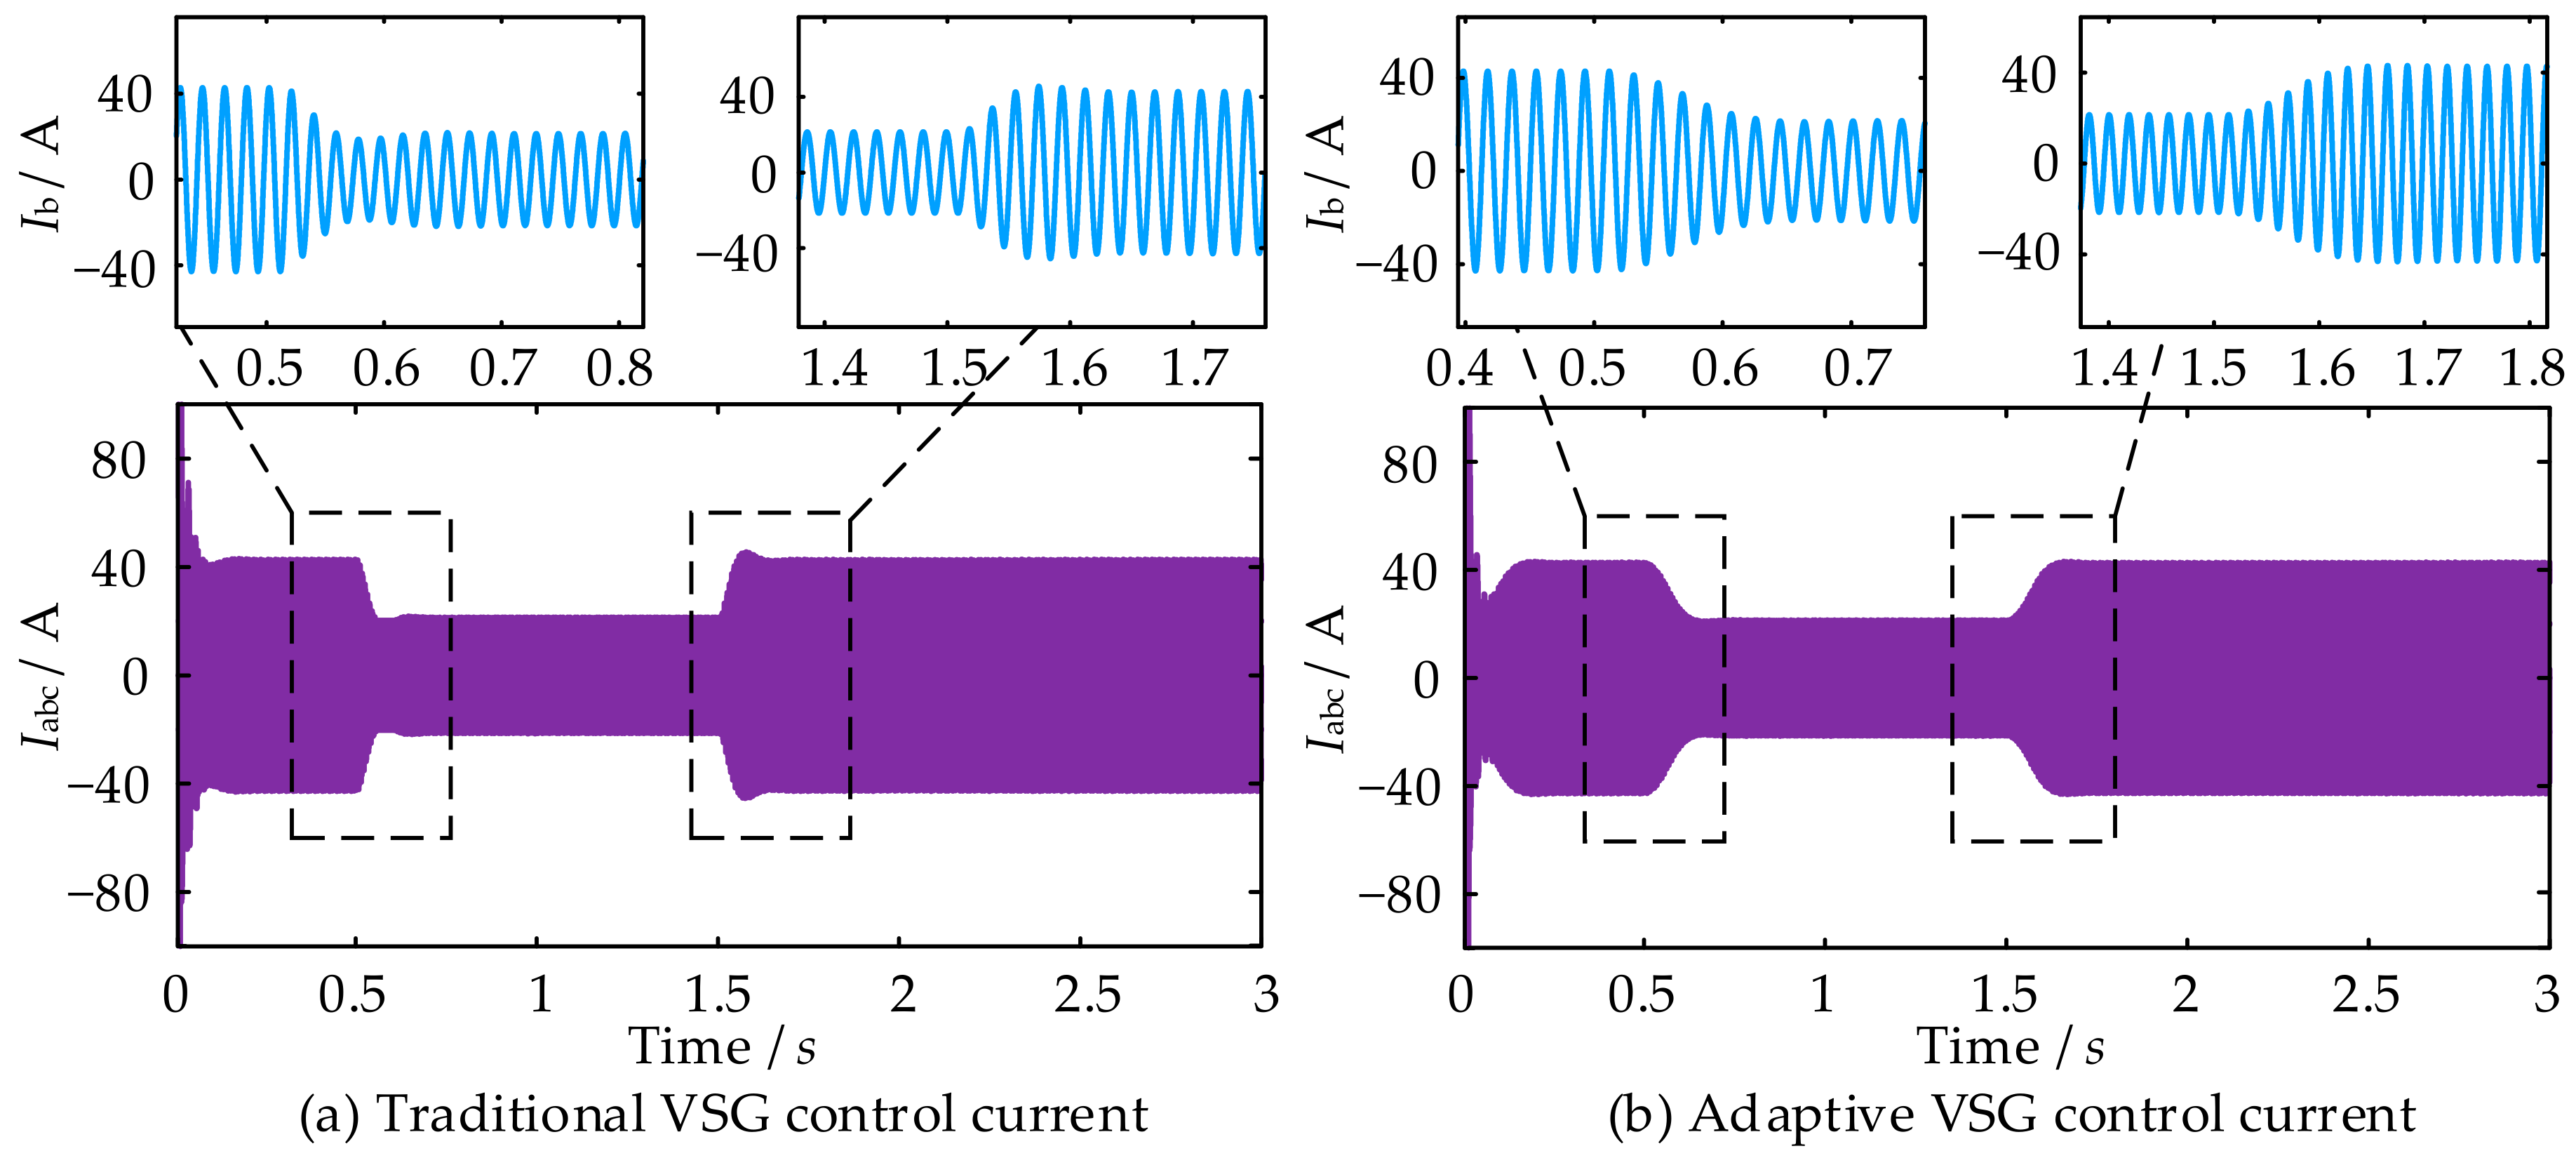
The adaptive control strategy presented in this study outperforms traditional VSG control by effectively mitigating the instantaneous impact current from active disturbances, thus ensuring seamless electrical energy interaction. It also significantly reduces dynamic power oscillations and frequency overshoots under load disturbances, enhancing the system’s safety and reliability.
(3)
The introduced adaptive control strategy effectively dampens fluctuations in PV output power and regulates converter output power. It ensures that the rate of change in active power output of the PV-storage system complies with the “GB/T 19964: Regulations for Photovoltaic Power Station Access to Power System”, exceeding the standard by achieving a rate of less than 5% of installed capacity per minute, rather than the maximum allowed 10%.
Subsequent research will focus on analyzing the performance of PV-storage system under adaptive VSG control within AC/DC hybrid distribution microgrid. It will also involve the stability analysis and design of adaptive VSG parameters for multiple SGs operating in parallel. Additionally, the research will encompass experimental validation of the proposed VSG control strategies by constructing a power-level rapid control prototyping system.

Author Contributions

Conceptualization, Y.X. and Y.W.; methodology, Y.X.; validation, Y.X., Y.W. and Y.C.; formal analysis, Y.X. and Y.W.; investigation, Y.X. and Y.W; resources, W.L., K.L. and Y.Y.; writing—original draft preparation, Y.W.; writing—review and editing, Y.X., J.S. and Y.Y.; supervision, J.S. and Y.Y.; project administration, Y.X., W.L., K.L. and Y.Y. All authors have read and agreed to the published version of the manuscript.

Funding

This research was funded by Hydrogen Energy and Multi-energy Complementary Microgrid Engineering Technology Research Center of Sichuan Province (2024DWNY006); Sichuan Science and Technology Program (2022SZYZF01); and Opening Fund of Key Laboratory of Higher Education of Sichuan Province for Enterprise Informationalization and Internet of Things (2023WYJ01).

Data Availability Statement

Contained within the text and cited references.

Acknowledgments

This work was supported by School of Automation and Information Engineering, Sichuan University of Science & Engineering.

Conflicts of Interest

Author Wei Li was employed by the company Zonergy Co., Ltd. The remaining authors declare that the research was conducted in the absence of any commercial or financial relationships that could be construed as a potential conflict of interest.

References

  1. Wang, Z.; Yu, Y.; Gao, W.; Davari, M.; Deng, C. Adaptive, optimal, virtual synchronous generator control of three-phase grid-connected inverters under different grid conditions—An adaptive dynamic programming approach. IEEE Trans. Ind. Informat. 2021, 18, 7388–7399. [Google Scholar] [CrossRef]
  2. Shahid, A. Performance evaluation of sinusoidal and Space Vector Pulse-Width-Modulation for power quality enhancement in distributed generation systems. In Proceedings of the 2015 IEEE 6th International Symposium on Power Electronics for Distributed Generation Systems (PEDG), Aachen, Germany, 22–25 June 2015. [Google Scholar]
  3. Chae, W.; Kim, J.; Cho, J.; Park, J. Optimal interconnection device for distributed energy resources of customer. In Proceedings of the 2012 3rd IEEE International Symposium on Power Electronics for Distributed Generation Systems (PEDG), Aalborg, Denmark, 25–28 June 2012. [Google Scholar]
  4. Iqbal, S.; Xin, A.; Jan, M.U.; Salman, S.; Zaki, A.U.M.; Rehman, H.U.; Shinwari, M.F.; Abdelbaky, M.A. V2G strategy for primary frequency control of an industrial microgrid considering the charging station operator. Electronics 2020, 9, 549. [Google Scholar] [CrossRef]
  5. Vasudevan, K.R.; Ramachandaramurthy, V.K.; Babu, T.S.; Pouryekta, A. Synchronverter: A comprehensive review of modifications, stability assessment, applications and future perspectives. IEEE Access 2020, 8, 131565–131589. [Google Scholar] [CrossRef]
  6. Hirase, Y.; Sugimoto, K.; Sakimoto, K.; Ise, T. Analysis of resonance in microgrids and effects of system frequency stabilization using a virtual synchronous generator. IEEE J. Emerg. Sel. Top. Power Electron. 2016, 4, 1287–1298. [Google Scholar] [CrossRef]
  7. Dhingra, K.; Singh, M. Frequency support in a micro-grid using virtual synchronous generator based charging station. IET Renew. Power Gener. 2018, 12, 1034–1044. [Google Scholar] [CrossRef]
  8. Daili, Y.; Harrag, A. New model of multi-parallel distributed generator units based on virtual synchronous generator control strategy. Energy Ecol. 2019, 4, 222–232. [Google Scholar] [CrossRef]
  9. Sundaramoorthy, K.; Thomas, V.; O’Donnell, T.; Ashok, S. Virtual synchronous machine-controlled grid-connected power electronic converter as a ROCOF control device for power system applications. Electr. Eng. 2019, 101, 983–993. [Google Scholar] [CrossRef]
  10. Pourmohammad, M.; Toulabi, M.; Ranjbar, A.M. Application of state feedback controller to ensure robust D-stable operation of virtual synchronous generators. IEEE Trans. Energy Convers 2020, 36, 602–610. [Google Scholar] [CrossRef]
  11. Bevrani, H.; Ise, T.; Miura, Y. Virtual synchronous generators: A survey and new perspectives. Int. J. Electr. Power Energy Syst. 2014, 54, 244–254. [Google Scholar] [CrossRef]
  12. Pan, D.; Wang, X.; Liu, F.; Shi, R. Transient stability of voltage-source converters with grid-forming control: A design-oriented study. IEEE J. Emerg. Sel. Topics Power Electron. 2019, 8, 1019–1033. [Google Scholar] [CrossRef]
  13. Blaabjerg, F.; Teodorescu, R.; Liserre, M.; Timbus, A.V. Overview of control and grid synchronization for distributed power generation systems. IEEE Trans. Ind. Electron. 2006, 53, 1398–1409. [Google Scholar] [CrossRef]
  14. Sun, P.; Yao, J.; Zhao, Y.; Fang, X.; Cao, J.Y. Stability Assessment and Damping Optimization Control of Multiple Grid-Connected Virtual Synchronous Generators. IEEE Trans. Energy Convers. 2021, 36, 3555–3567. [Google Scholar] [CrossRef]
  15. Liu, J.; Miura, Y.; Ise, T. Comparison of dynamic characteristics between virtual synchronous generator and droop control in inverter-based distributed generators. IEEE Trans. Power Electron. 2015, 31, 3600–3611. [Google Scholar] [CrossRef]
  16. Shintai, T.; Miura, Y.; Ise, T. Oscillation damping of a distributed generator using a virtual synchronous generator. IEEE Trans. Power Del. 2014, 29, 668–676. [Google Scholar] [CrossRef]
  17. Shi, R.L.; Zhang, X.; Hu, C.; Xu, H.Z.; Gu, J.; Cao, W. Self-tuning virtual synchronous generator control for improving frequency stability in autonomous photovoltaic-diesel microgrids. J. Mod. Power Syst. 2018, 6, 482–494. [Google Scholar] [CrossRef]
  18. Cao, W.; Liu, K.L.; Xu, S.; Kang, H.T.; Zhao, J.F. Stabilization control strategy for shore power system with surge loads based on virtual synchronous generator. J. Electr. Eng. 2019, 14, 1045–1054. [Google Scholar] [CrossRef]
  19. Soni, N.; Doolla, S.; Chandorkar, M.C. Improvement of transient response in microgrids using virtual inertia. IEEE Trans. Power Delivery 2013, 28, 1830–1838. [Google Scholar] [CrossRef]
  20. De Brabandere, K.; Bolsens, B.; Van den Keybus, J.; Woyte, A.; Driesen, J.; Belmans, R. A voltage and frequency droop control method for parallel inverters. IEEE Trans. Power Electron. 2007, 22, 1107–1115. [Google Scholar] [CrossRef]
  21. Liu, J.; Liu, X.; Liu, J.; Li, X.; Wang, J. Adaptive-Droop-Coefficient VSG Control for Cost-Efficient Grid Frequency Support. IEEE Trans. Power Syst. 2024, 39, 6768–6771. [Google Scholar] [CrossRef]
  22. Du, Y.; Guerrero, J.M.; Chang, L.C.; Su, J.H.; Mao, M.Q. Modeling, analysis, and design of a frequency-droop-based virtual synchronous generator for microgrid applications. In 2013 IEEE ECCE Asia; IEEE: New York, NY, USA, 2013; pp. 634–649. [Google Scholar]
  23. Zhang, X.; Mao, F.B.; Xu, H.Z.; Liu, F.; Li, M. An optimal coordination control strategy of micro-grid inverter and energy storage based on variable virtual inertia and damping of VSG. Chin. J. Electr. Eng. 2017, 3, 25–33. [Google Scholar]
  24. Alipoor, J.; Miura, Y.; Ise, T. Power system stabilization using virtual synchronous generator with alternating moment of inertia. IEEE J. Emerg. Sel. Top. Power Electron. 2014, 3, 451–458. [Google Scholar] [CrossRef]
  25. Thomas, V.; Kumaravel, S.; Ashok, S. Fuzzy Controller-Based Self-Adaptive Virtual Synchronous Machine for Microgrid Application. IEEE Trans. Energy Convers. 2021, 36, 2427–2437. [Google Scholar] [CrossRef]
  26. Hou, X.C.; Sun, Y.; Zhang, X.; Lu, J.H.; Wang, P.; Guerrero, J.M. Improvement of frequency regulation in VSG-based AC microgrid via adaptive virtual inertia. IEEE Trans. Power Electron. 2019, 35, 1589–1602. [Google Scholar] [CrossRef]
  27. Zhang, Y.; Sun, Q.; Zhou, J.; Li, L.; Wang, P.; Guerrero, J.M. Coordinated control of networked AC/DC microgrids with adaptive virtual inertia and governor-gain for stability enhancement. IEEE Trans. Energy Convers 2020, 36, 95–110. [Google Scholar] [CrossRef]
  28. Zhu, Z.B.; Huang, S.P.; Li, Z.X. Research on control strategy of micro-grid adaptive damping VSG. Control Eng. China 2020, 1, 33–39. [Google Scholar]
  29. Ding, J.W.; Zhang, J.B.; Ma, Z.H. VSG inertia and damping coefficient adaptive control. In Proceedings of the 2020 Asia Energy and Electrical Engineering Symposium (AEEES), Chengdu, China, 28–31 May 2020; pp. 431–435. [Google Scholar]
  30. Lin, Y.; Zhang, J.C.; Wang, N. A management control strategy of photovoltaic-storage system based on virtual synchronous generator. Mod. Electr. Power 2017, 34, 64–73. [Google Scholar]
  31. Zhang, X. Coordinated control strategy for a PV-storage grid-connected system based on a virtual synchronous generator. Global Energy Interconn. 2020, 3, 51–59. [Google Scholar] [CrossRef]
  32. Li, J.X.; Zhao, J.B.; Qu, K.; Li, F. Boundary analysis of operation parameters of microgrid VSG considering SOC characteristics. Power Syst. Technol. 2018, 42, 1451–1457. [Google Scholar]
  33. Han, L.J.; Feng, X.C.; Zhao, H. Adaptive VSG control strategy considering energy storage SOC constraints. Front. Energy Res. 2023, 11, 1278648. [Google Scholar]
  34. Rehman, H.U.; Yan, X.W.; Abdelbaky, M.A.; Jan, M.U.; Sayed, A.R.; Zaki, S.A.; Iqbal, S. Frequency regulation and optimization of microgrid system with multi PV-VSG using advanced droop controller. In Proceedings of the 2020 IEEE 4th Conference on Energy Internet and Energy System Integration (EI2), Wuhan, China, 30 October–1 November 2020. [Google Scholar]
  35. Chen, X.; Qian, Y.; Xu, Y.; Shu, B.; Sheng, G. A novel pulse-source-based method for measuring transfer impedance of high frequency current sensor. Electr. Power Autom. Equip. 2019, 39, 120–124, 131. [Google Scholar]
  36. Rosso, R.; Wang, X.; Liserre, M.; Lu, X.; Engelken, S. Grid-forming converters: Control approaches, grid-synchronization, and future trends—A review. IEEE Open J. Ind. Appl. 2021, 2, 93–109. [Google Scholar] [CrossRef]
Figure 1. Grid-connected PV-storage system.
Energies 18 01505 g001
Figure 2. Active and reactive power control schematic diagram: (a) VSG active power control schematic diagram; (b) VSG reactive power control schematic diagram.
Energies 18 01505 g002
Figure 3. Pole distribution of VSG active power system when J and D change.
Energies 18 01505 g003
Figure 4. Active power step response curves with different parameters: (a) D = 10, different J corresponding to the step response; (b) J = 0.2, different D corresponding to the step response.
Energies 18 01505 g004
Figure 5. Power angle and frequency curve of SGs: (a) Power angle curve; (b) Frequency curve.
Energies 18 01505 g005
Figure 6. Schematic diagram of adaptive control for J and D.
Energies 18 01505 g006
Figure 7. Active power characteristics of different parameters: (a). Active power characteristic of inertia threshold Tj. (b). Active power characteristic of damping threshold Td. (c). Active characteristic of inertia adjustment coefficient Kj. (d). Active power characteristic of damping adjustment coefficient Kd.
Energies 18 01505 g007
Figure 8. Power and frequency under different control strategies: (a) PV output power; (b) Storage output power; (c) Converter output power; (d) Frequency response.
Energies 18 01505 g008
Figure 9. Curves of D and J under different control strategies: (a) Damping coefficient D; (b) Virtual inertia J.
Energies 18 01505 g009
Figure 10. Current simulation curves under different control strategies: (a) Traditional VSG control current; (b) Adaptive VSG control current.
Energies 18 01505 g010
Figure 11. Simulation of light and load disturbance under different control strategies: (a) PV output power; (b) Storage output power; (c) Load power; (d) Frequency response; (e) Damping coefficient D; (f) Virtual inertia J.
Energies 18 01505 g011
Figure 12. VSG output power and grid power of different control strategies: (a) Converter output power; (b) Grid power.
Energies 18 01505 g012
Figure 13. Simulation results under adaptive control strategy: (a) PV output power; (b) Storage output power; (c) Converter output power; (d) Frequency response.
Energies 18 01505 g013
Table 1. The variation in J and D under different conditions.
SectionΔωdω/dtΔω×dω/dtThe Variation in JThe Variation in D
(1)>0>0>0IncreaseIncrease
(2)>0<0<0DecreaseIncrease
(3)<0<0>0IncreaseIncrease
(4)<0>0<0DecreaseIncrease
Table 2. Simulation parameter.
ParameterParameter Value
L/mH6
C/μF20
Udc/V700
UN/V380
J0/(kg∙m2)0.2
D0/(N∙m∙s∙rad−1)10
Kω5.2
Kj0.1
Tj2
Kd10
Td0.1
Table 3. The variation in converter output power and light intensity.
Time (min)Converter Output Power (kW)Light Intensity (kW/m2)
0~20010
20~400→2010
40~60205
60~8020→010
80~100010
Disclaimer/Publisher’s Note: The statements, opinions and data contained in all publications are solely those of the individual author(s) and contributor(s) and not of MDPI and/or the editor(s). MDPI and/or the editor(s) disclaim responsibility for any injury to people or property resulting from any ideas, methods, instructions or products referred to in the content.

