
Assessment of the Energy Efficiency and Cost of Low-Income Housing Based on BIM Considering Material Properties and Energy Modeling in a Tropical Climate

 , ,
, ,  , and
, and 
Abstract
1. Introduction
- What is the impact of the selection of building materials on LIH’s energy efficiency?
- How much is the reduction in the energy demand in terms of Energy Use Intensity and Energy Cost by implementing the standard ASHRAE 90.2?
- What are the dominant factors in the energy efficiency of LIH?
2. State of the Art
3. Methodology
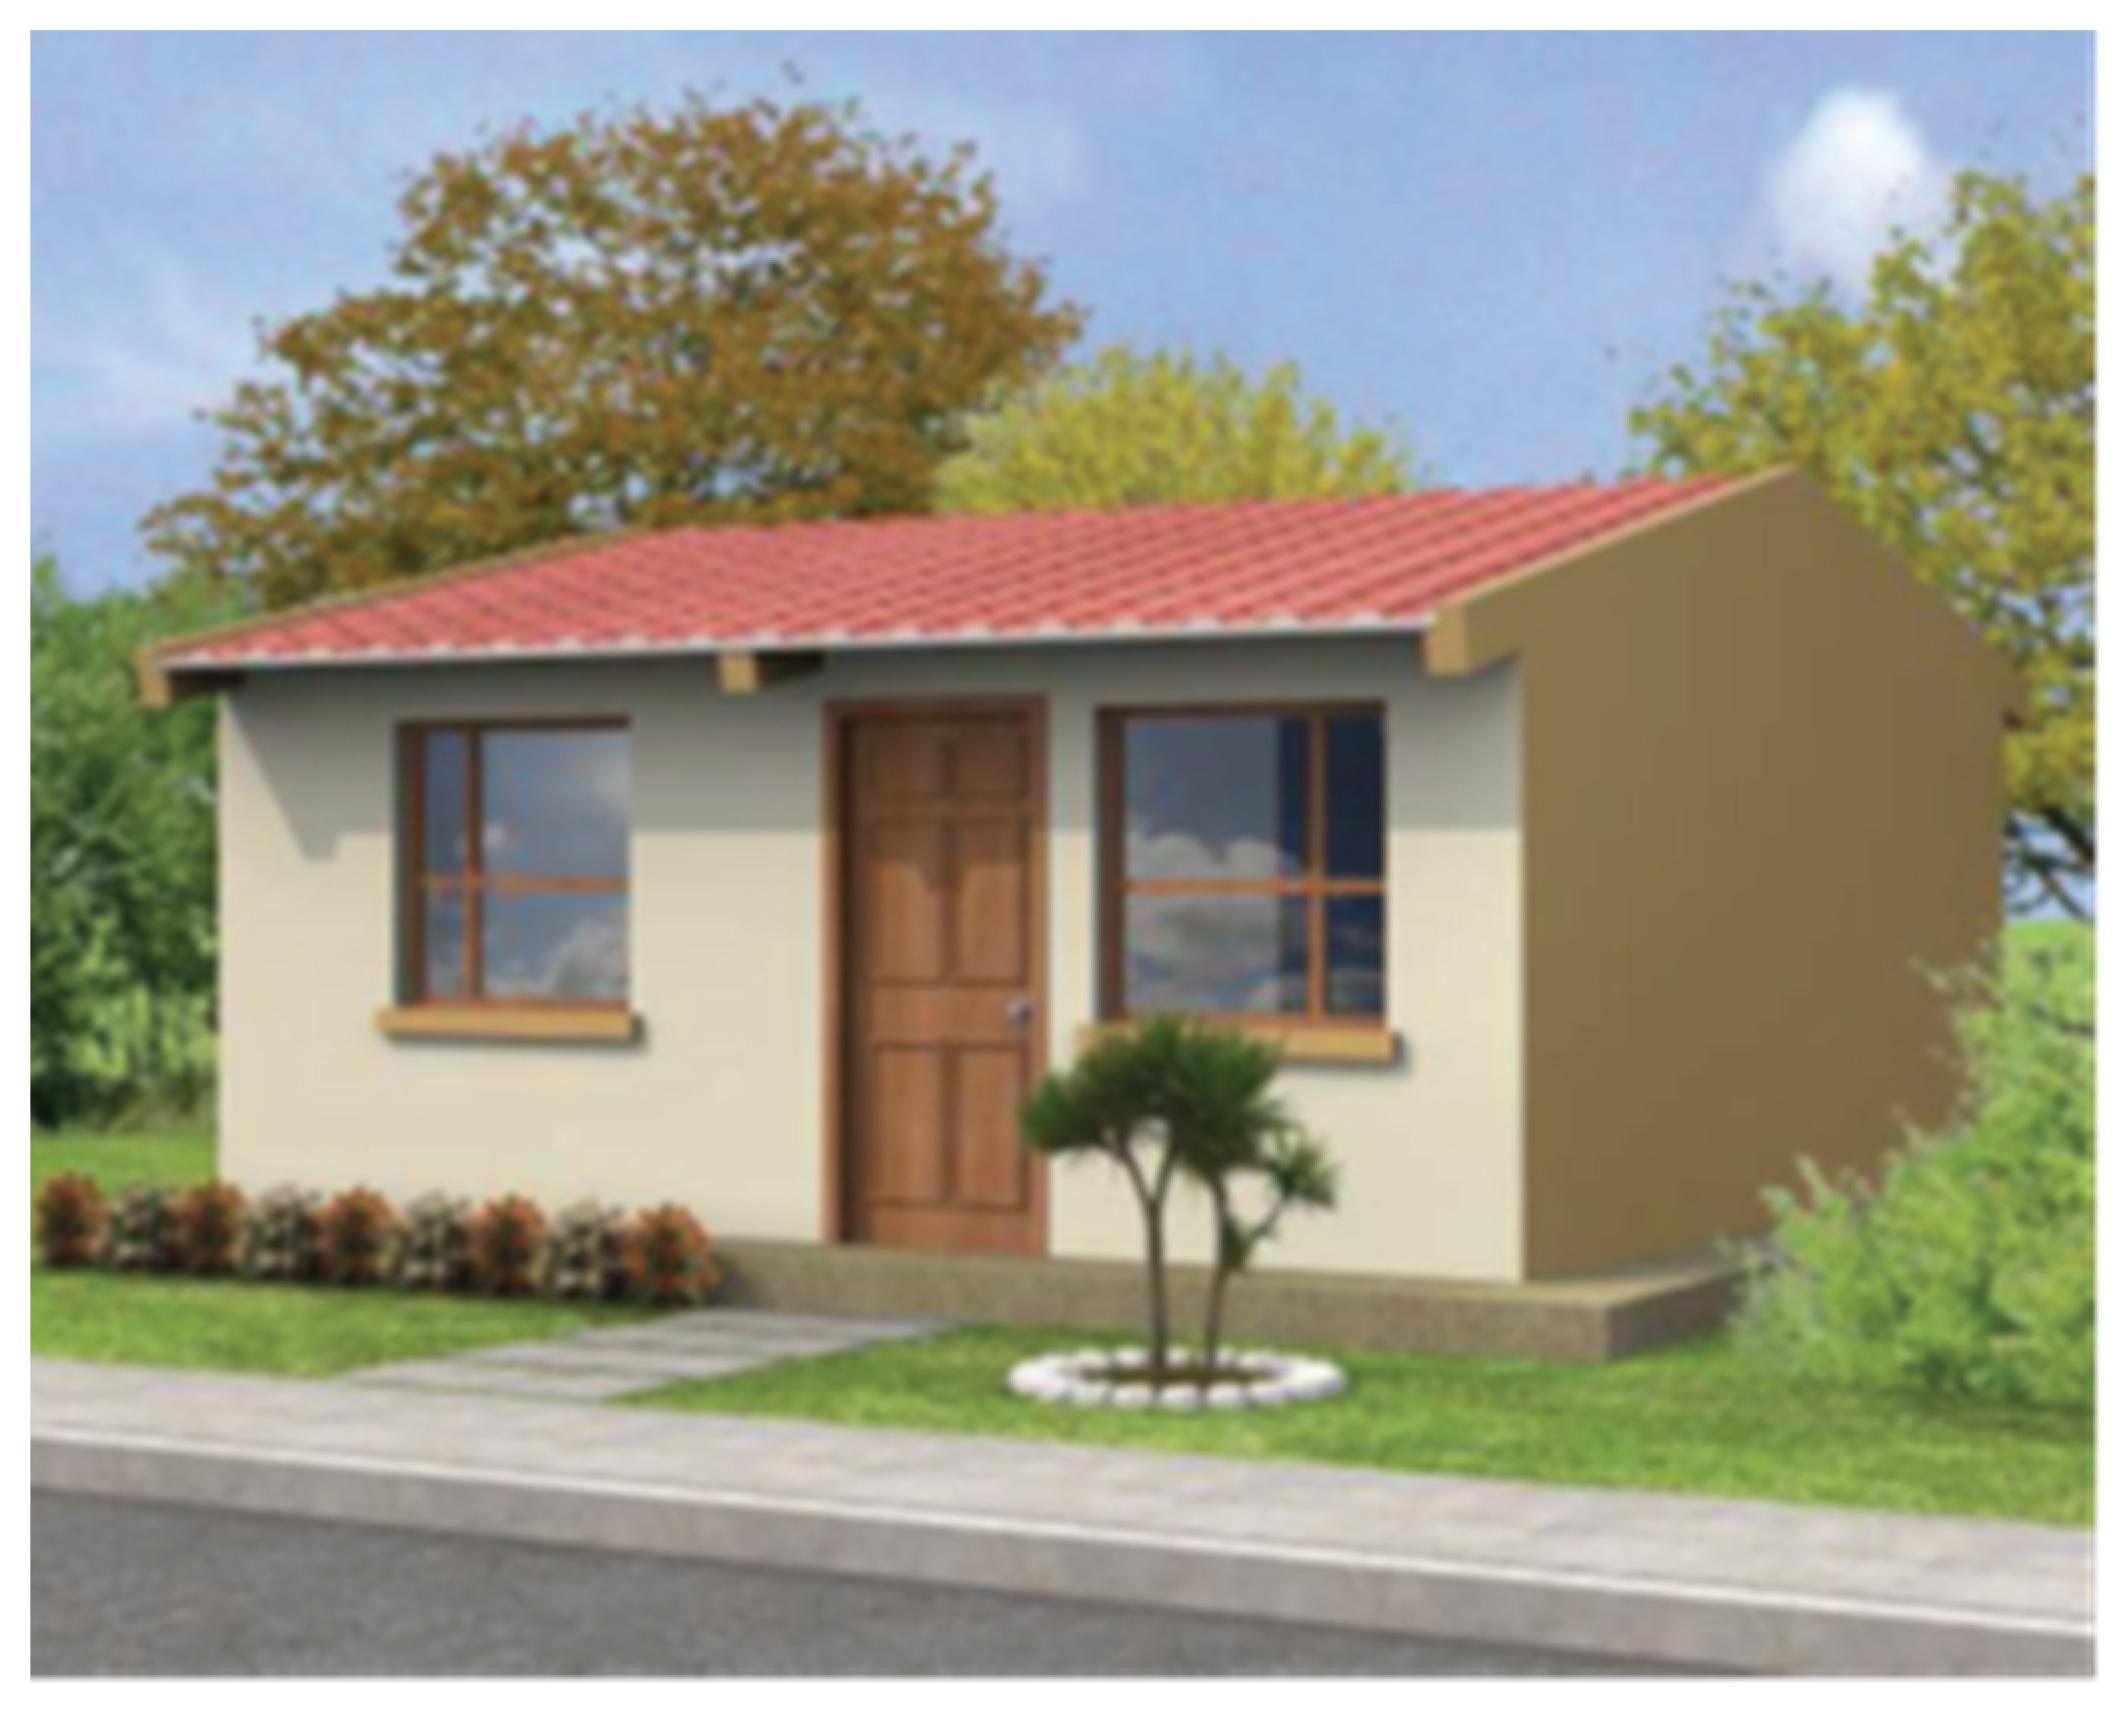
3.1. Architectural Model Analysis
3.2. Site Characterization
3.3. Material Selection
Definition of Material Parameters
3.4. Architectural and Energy Modeling
3.5. NEC Energy Baseline Model (BLM)
4. Results and Discussion
4.1. Active and Passive Factors Analysis
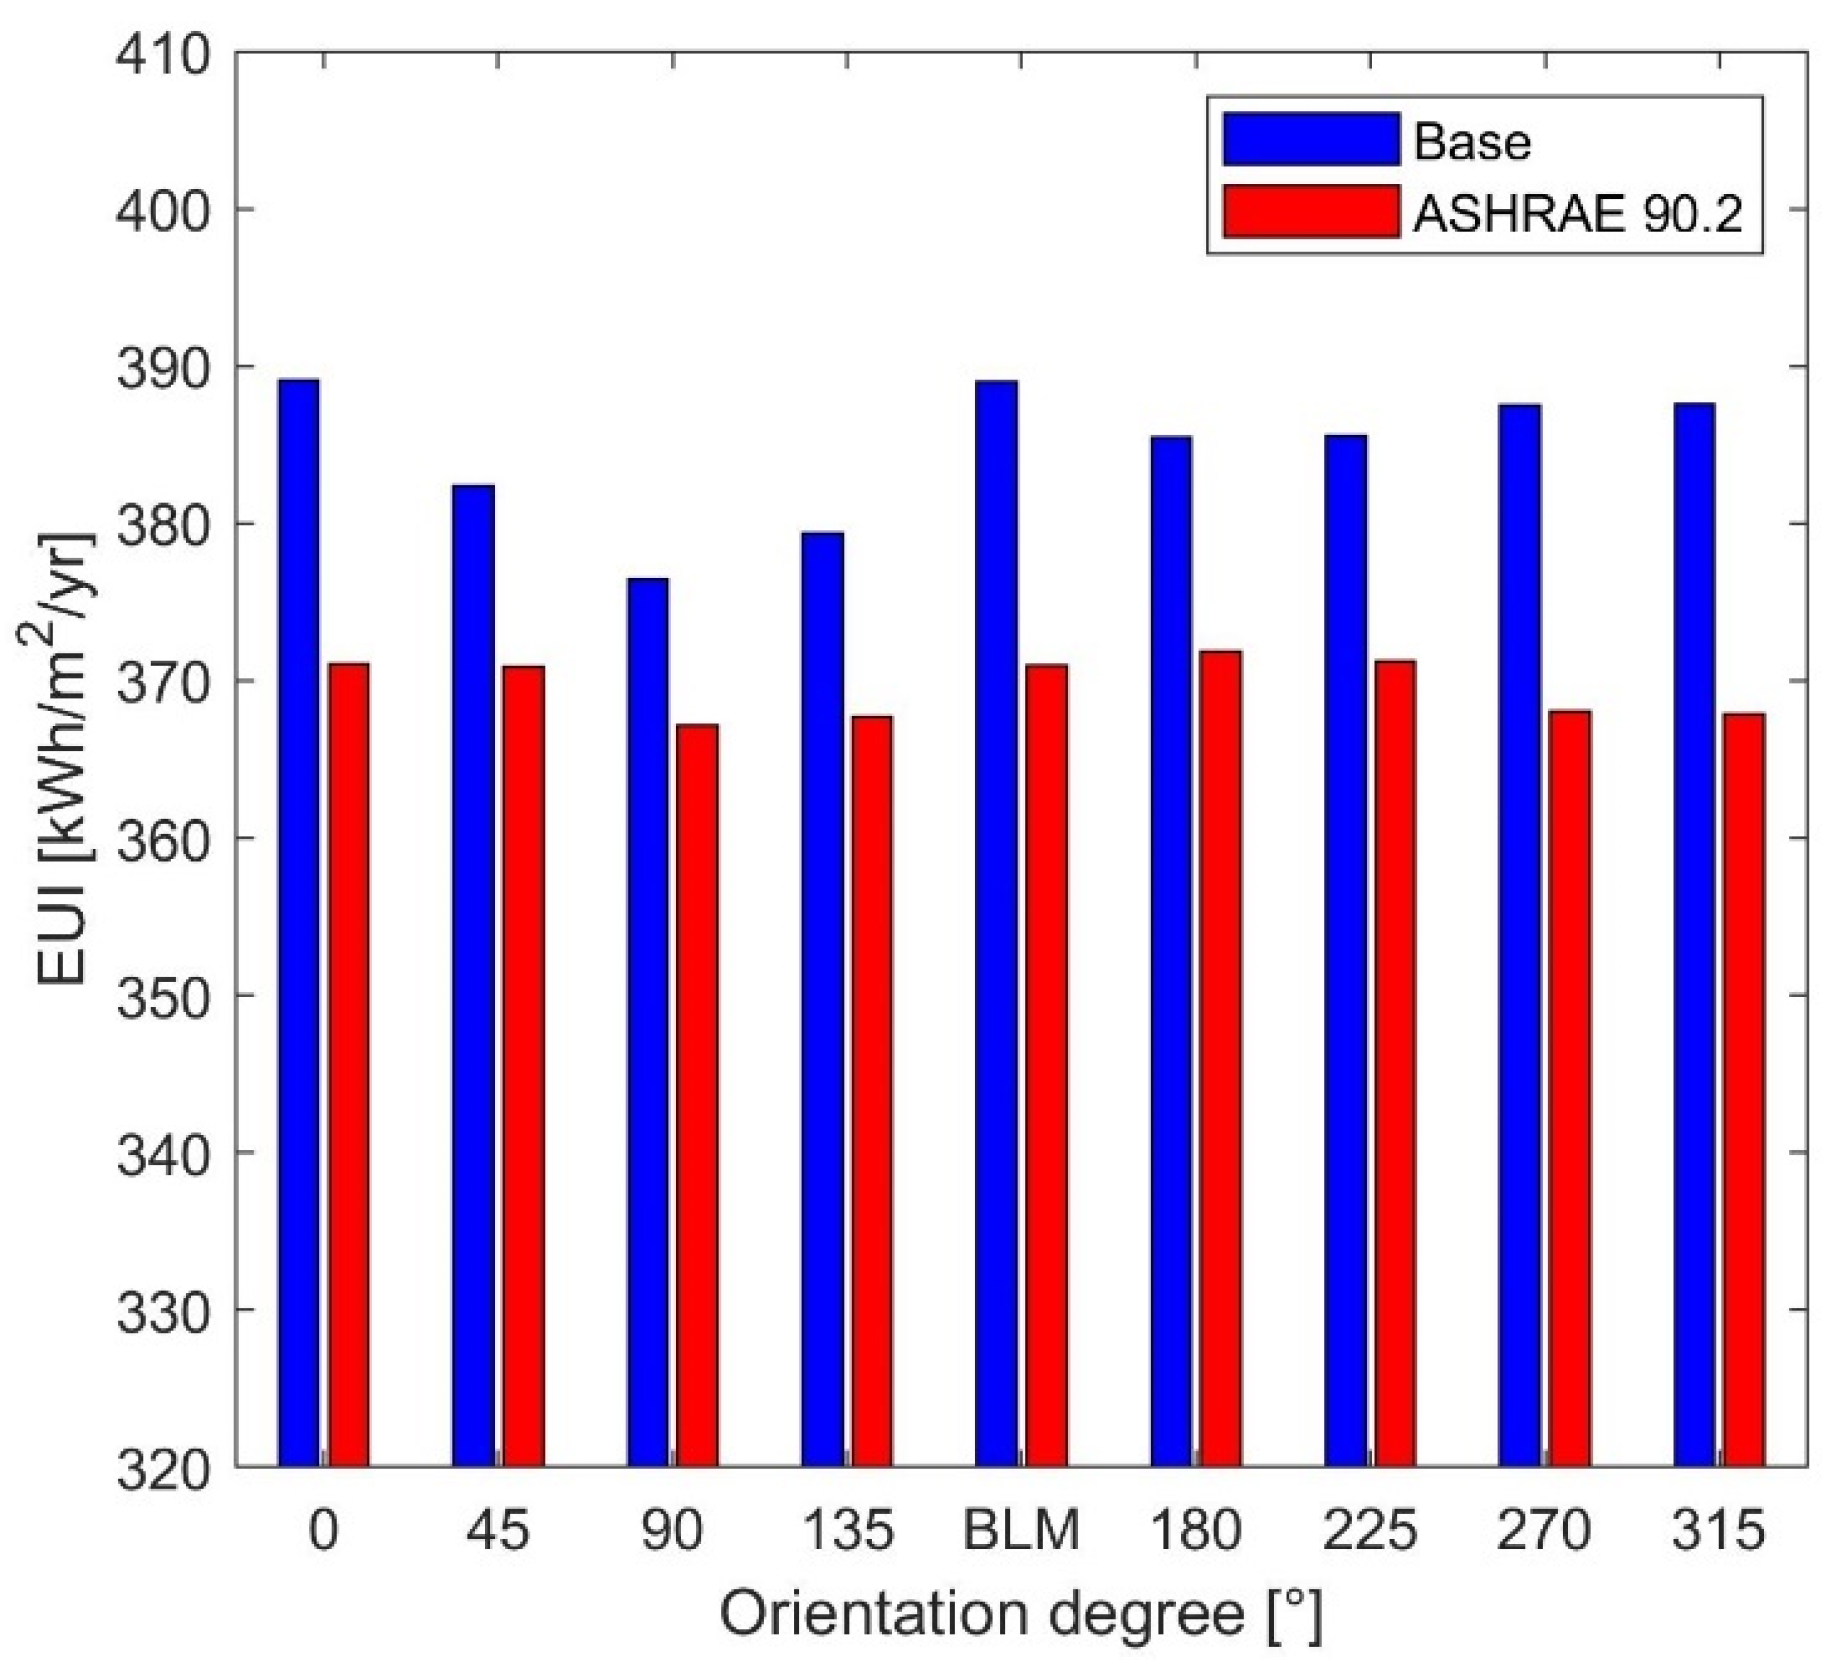
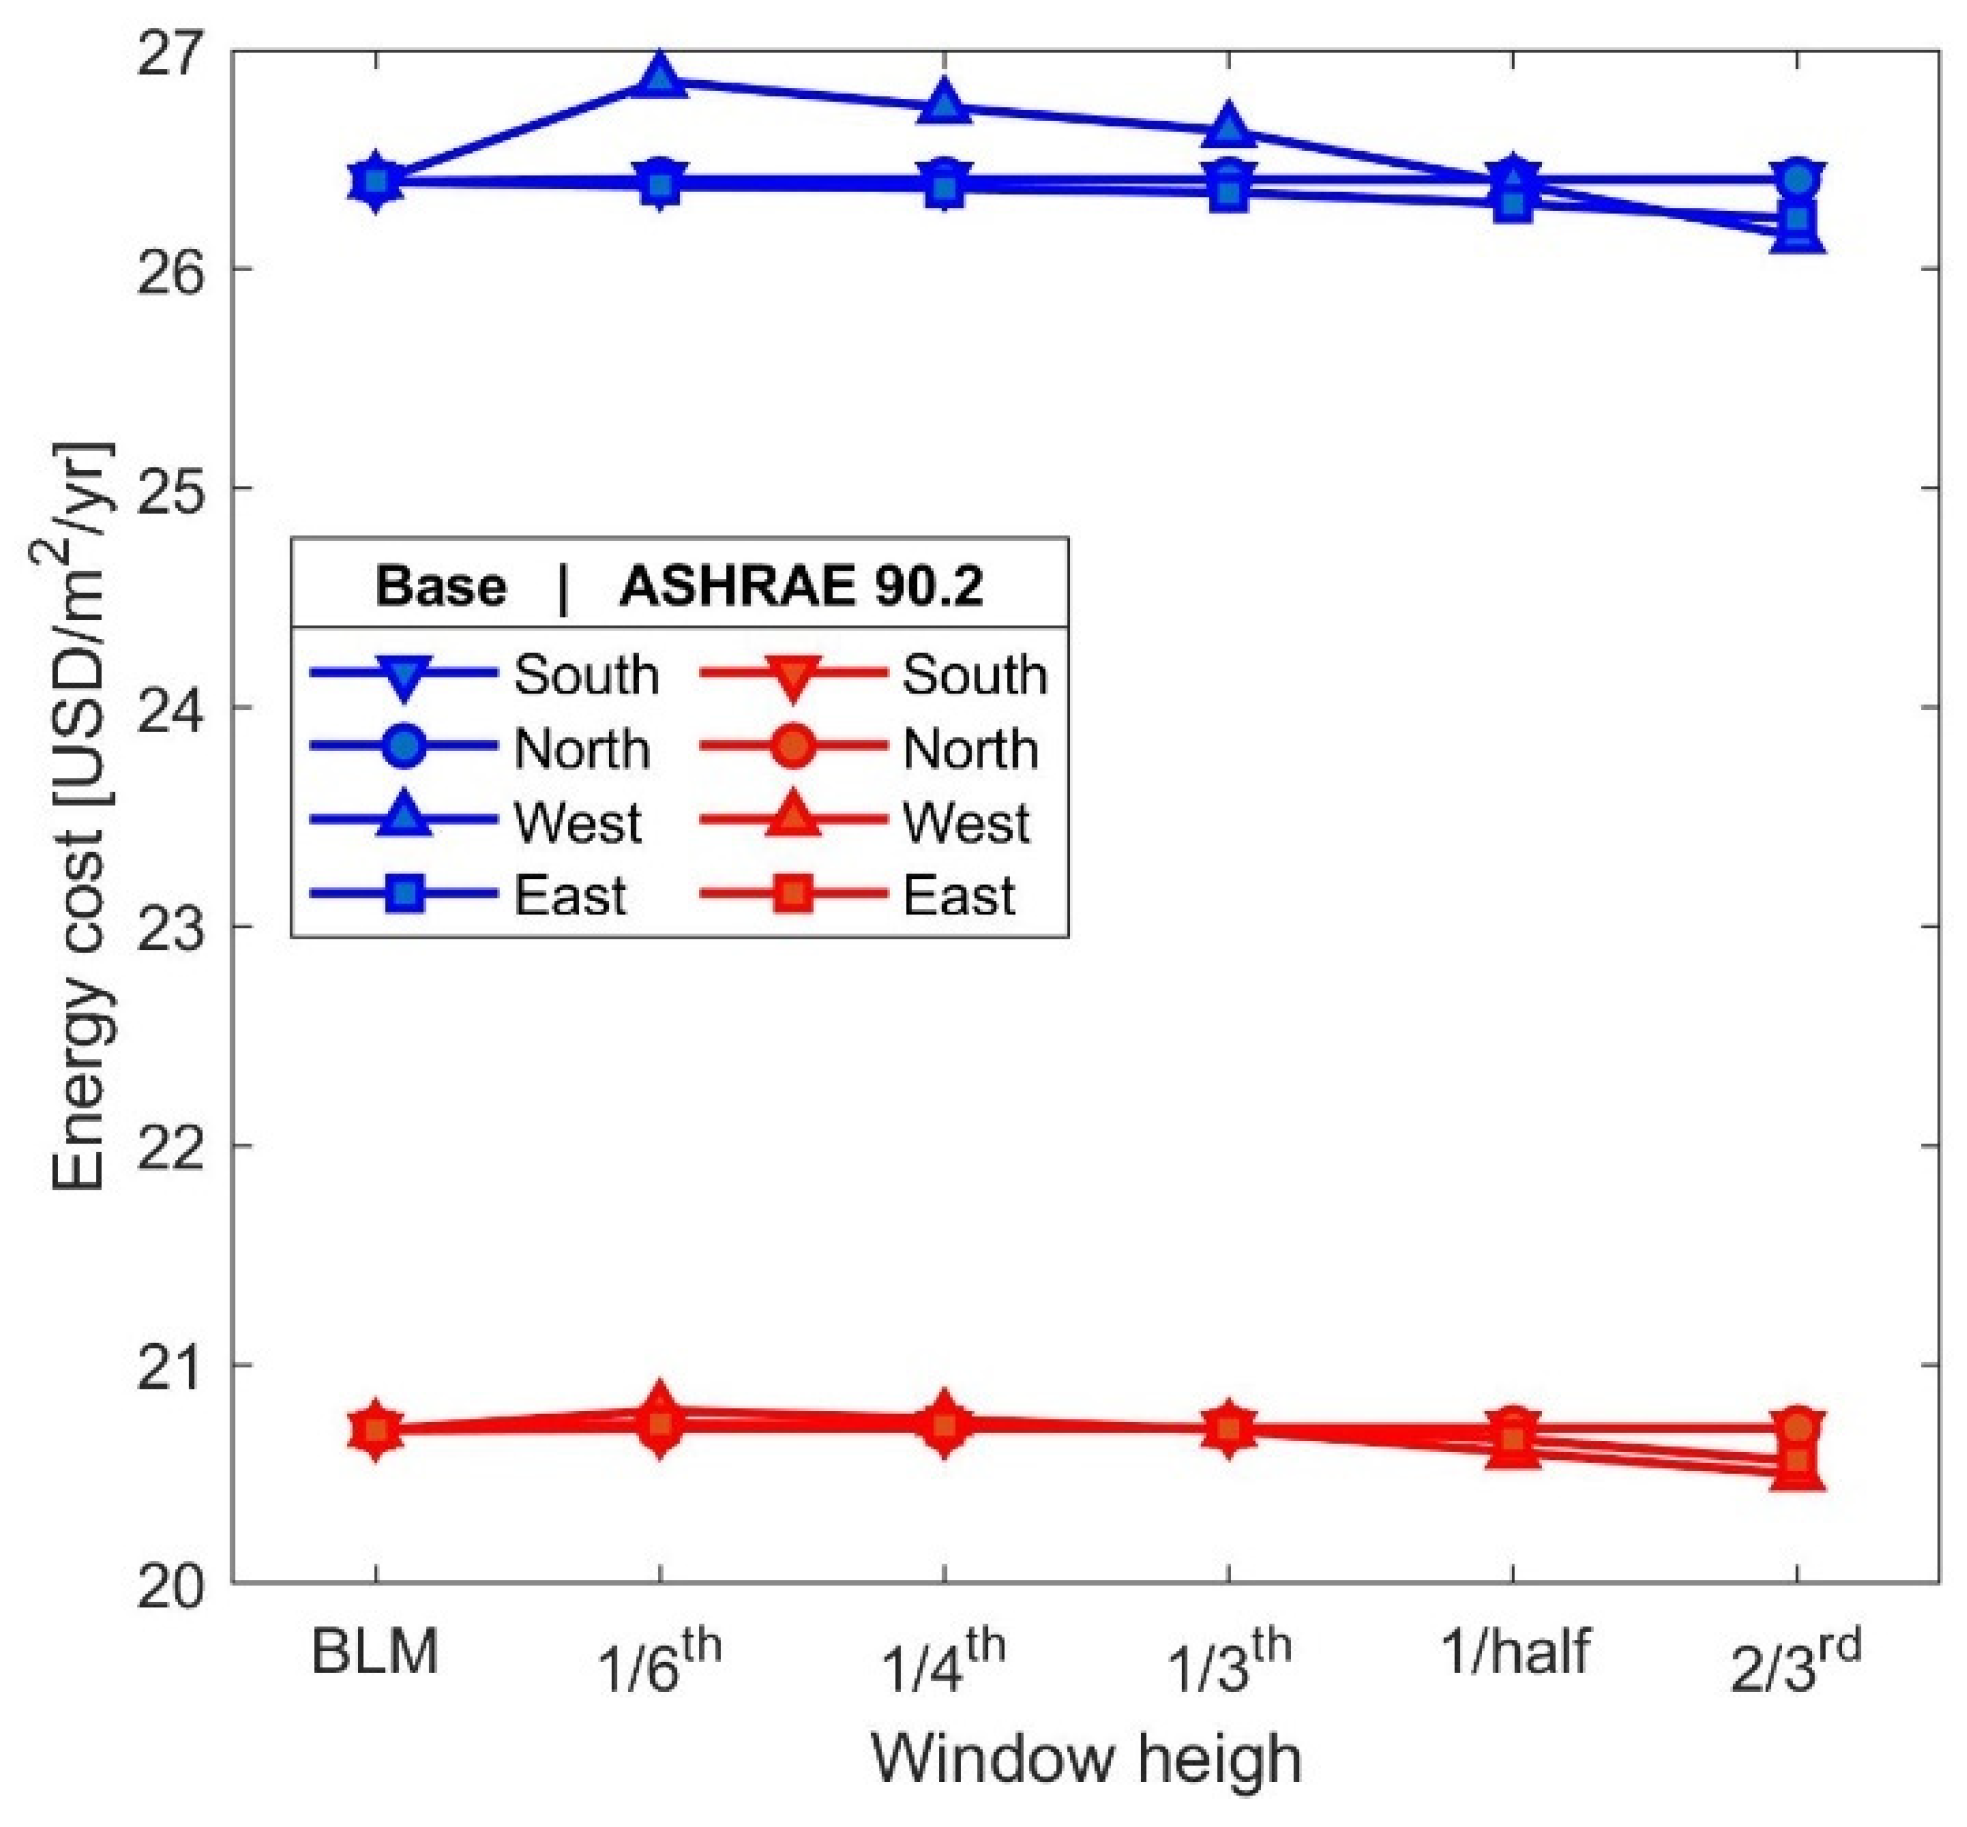
4.1.1. Building Orientation
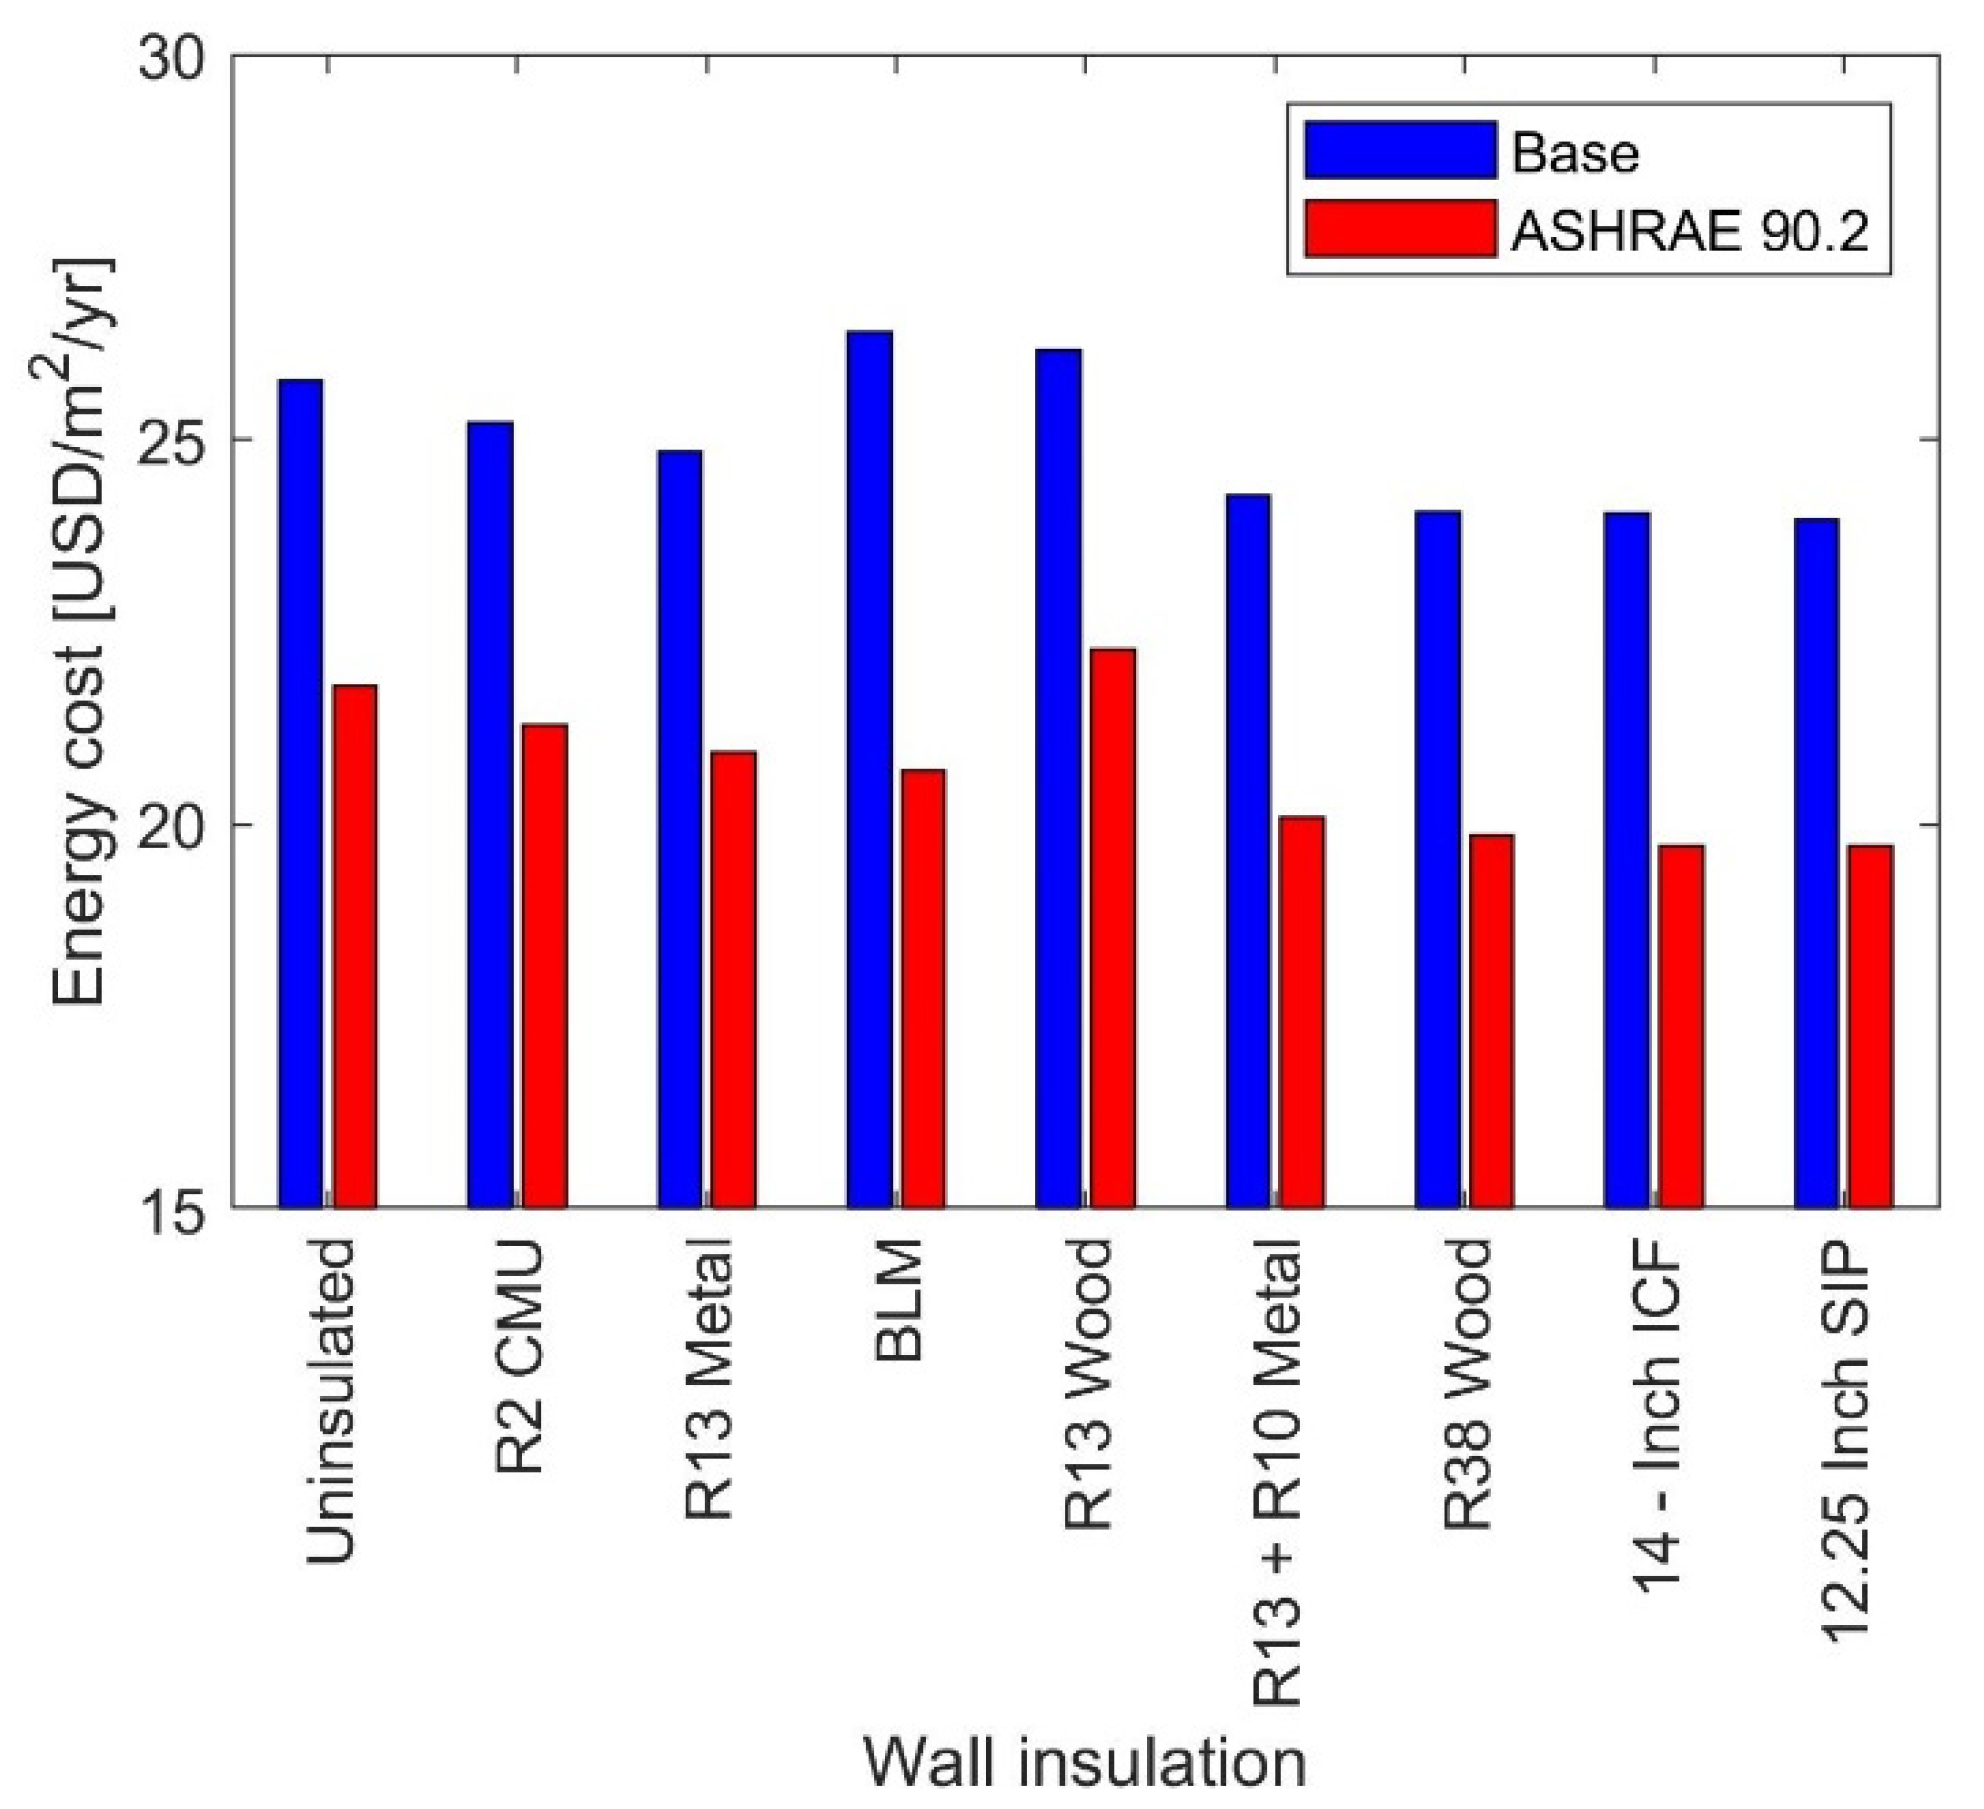
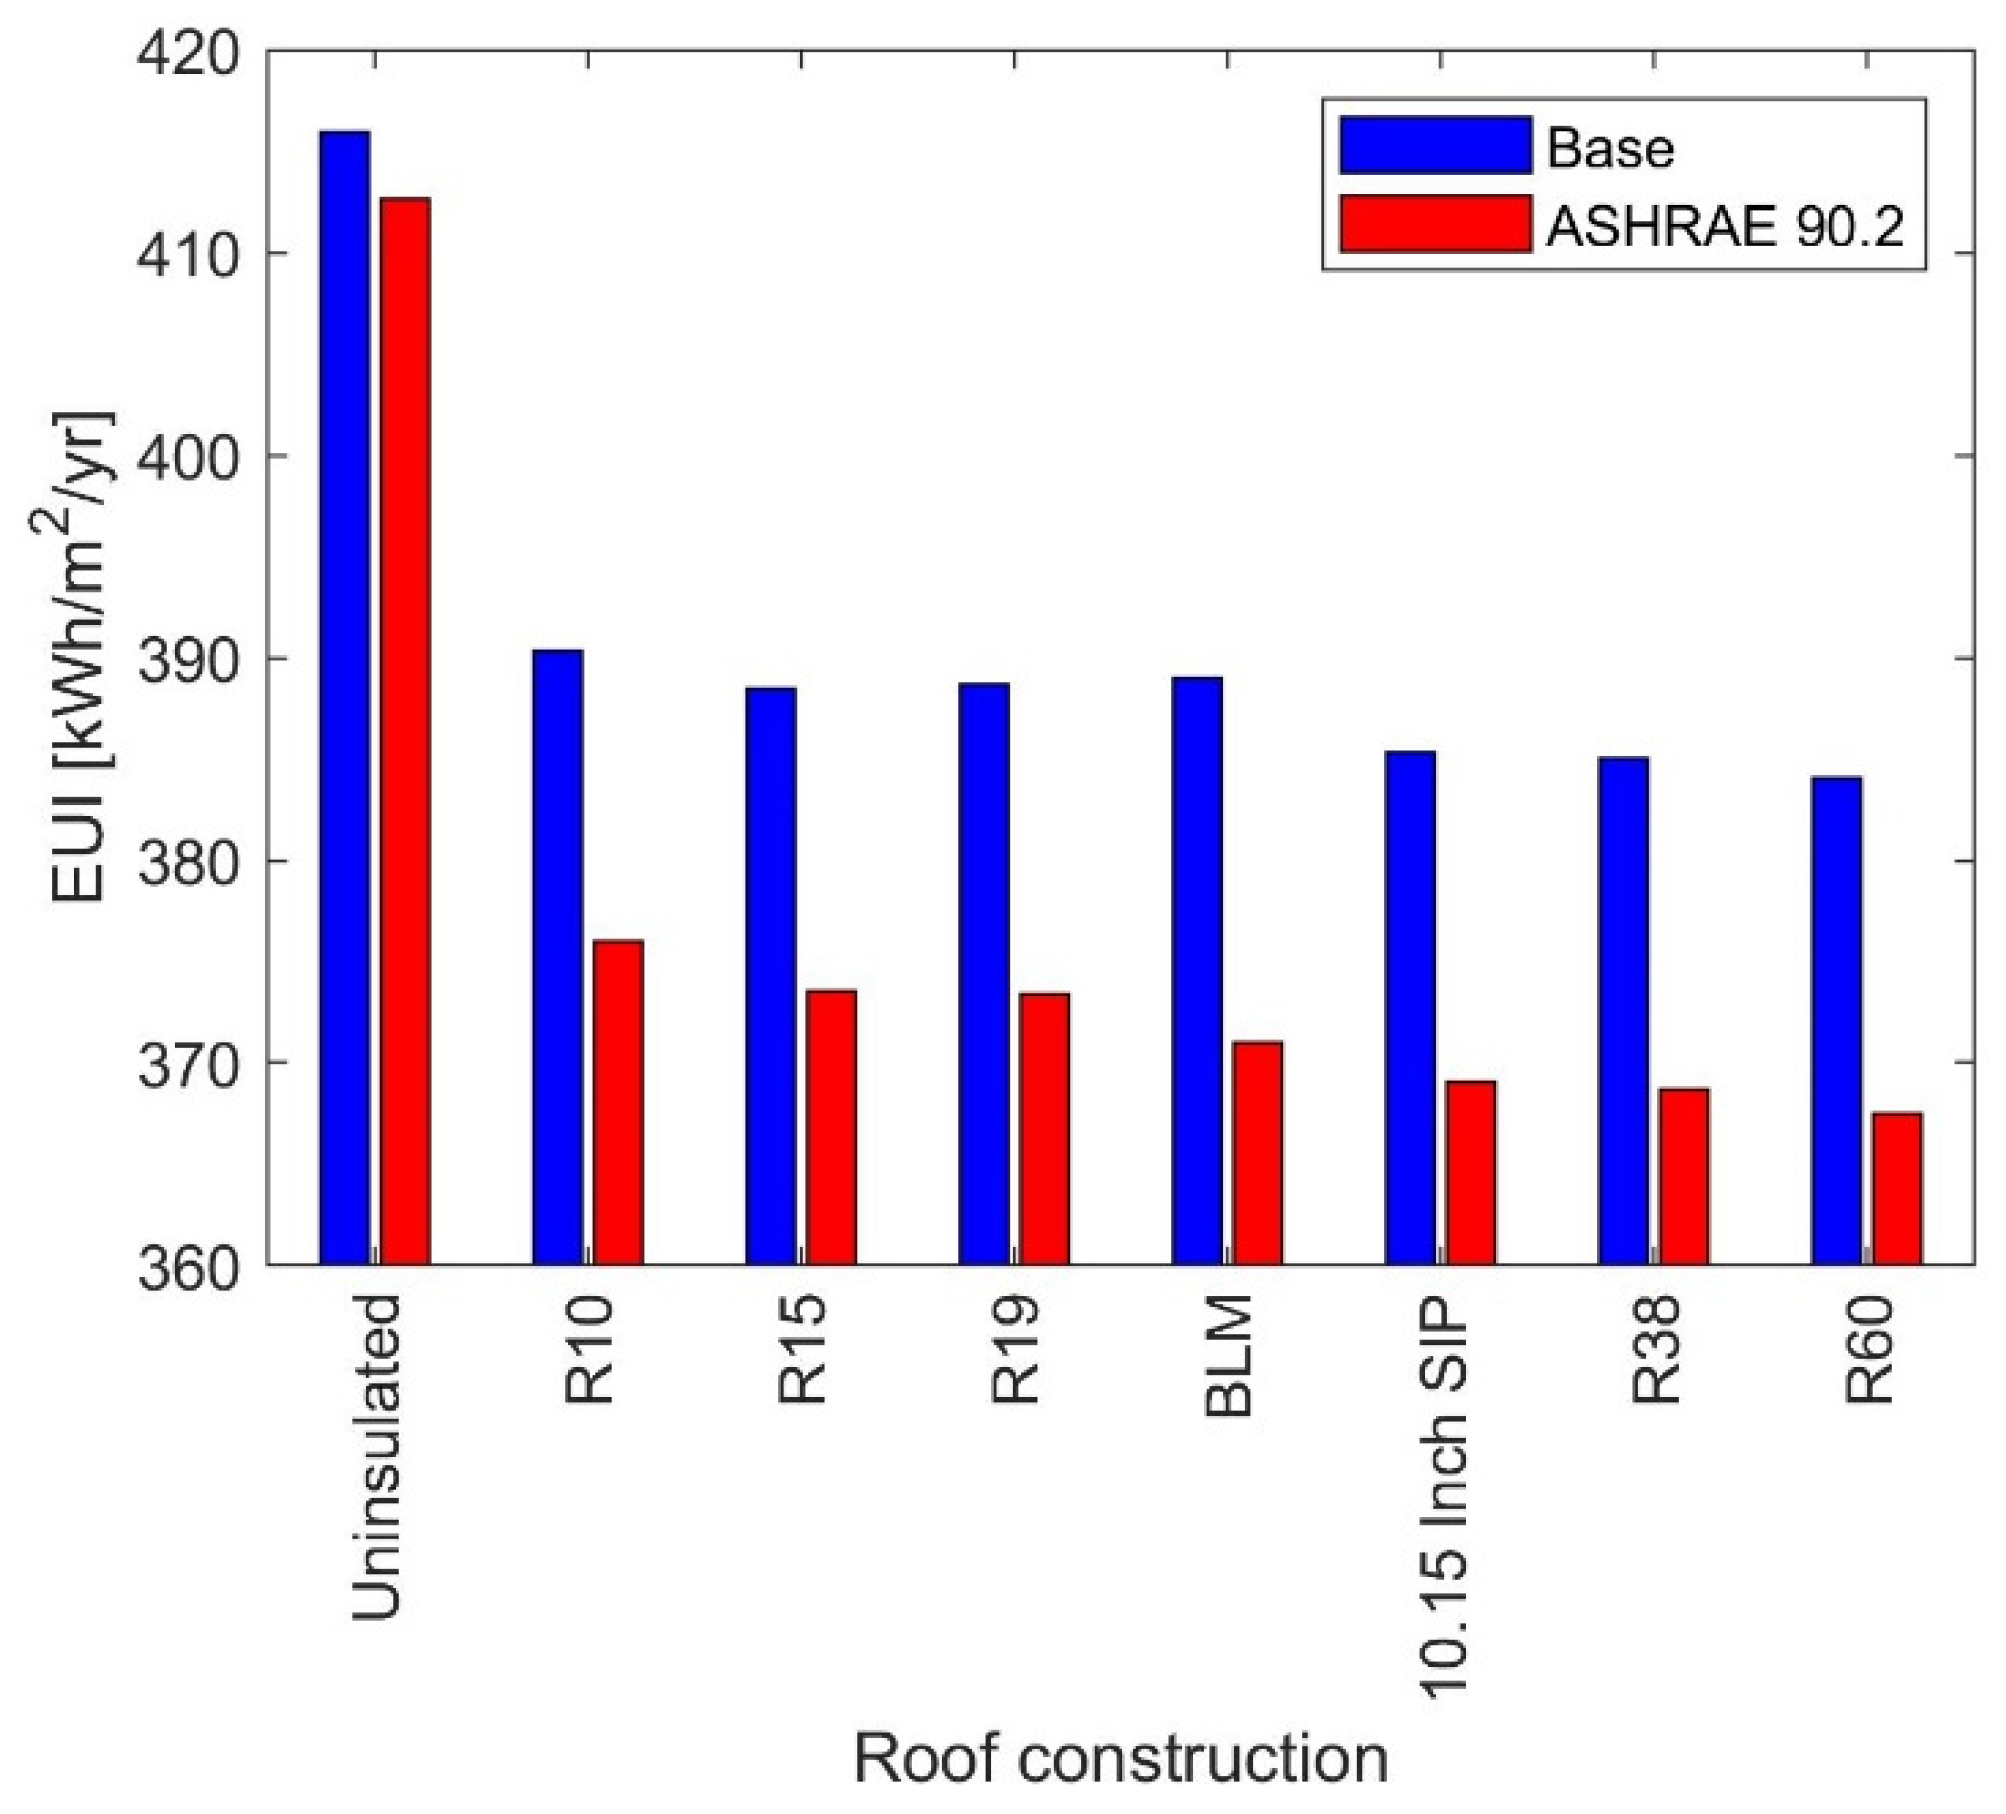
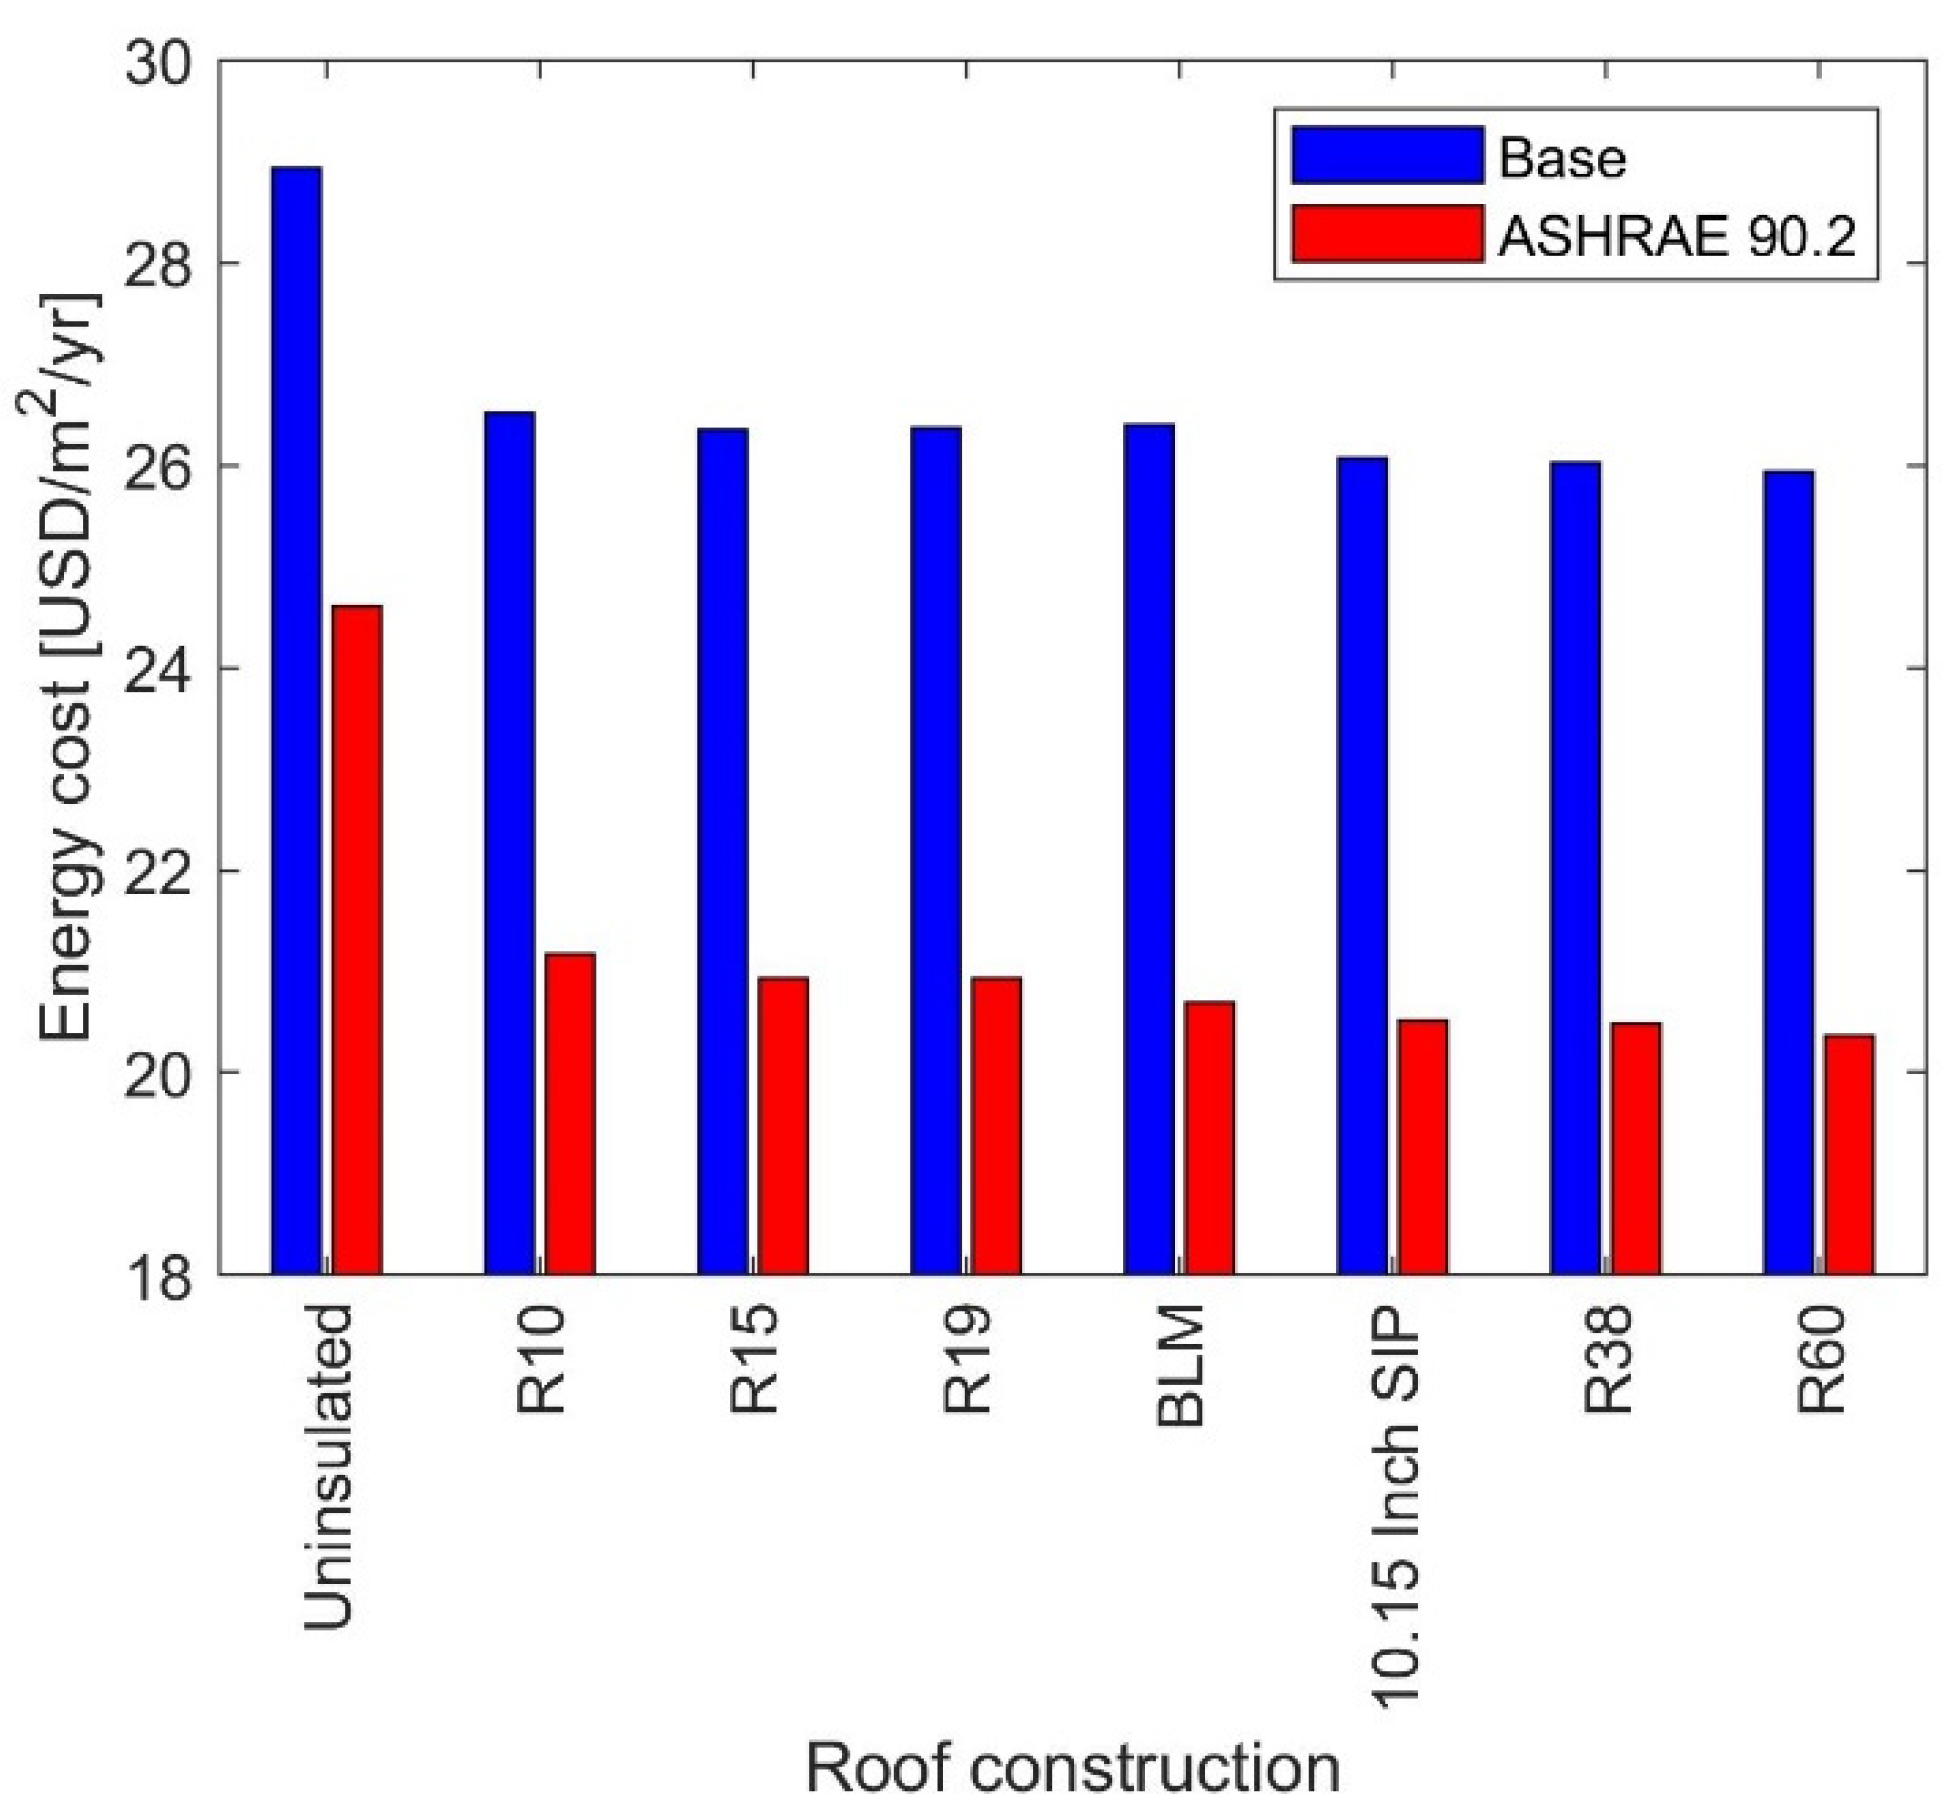
4.1.2. Building Envelope
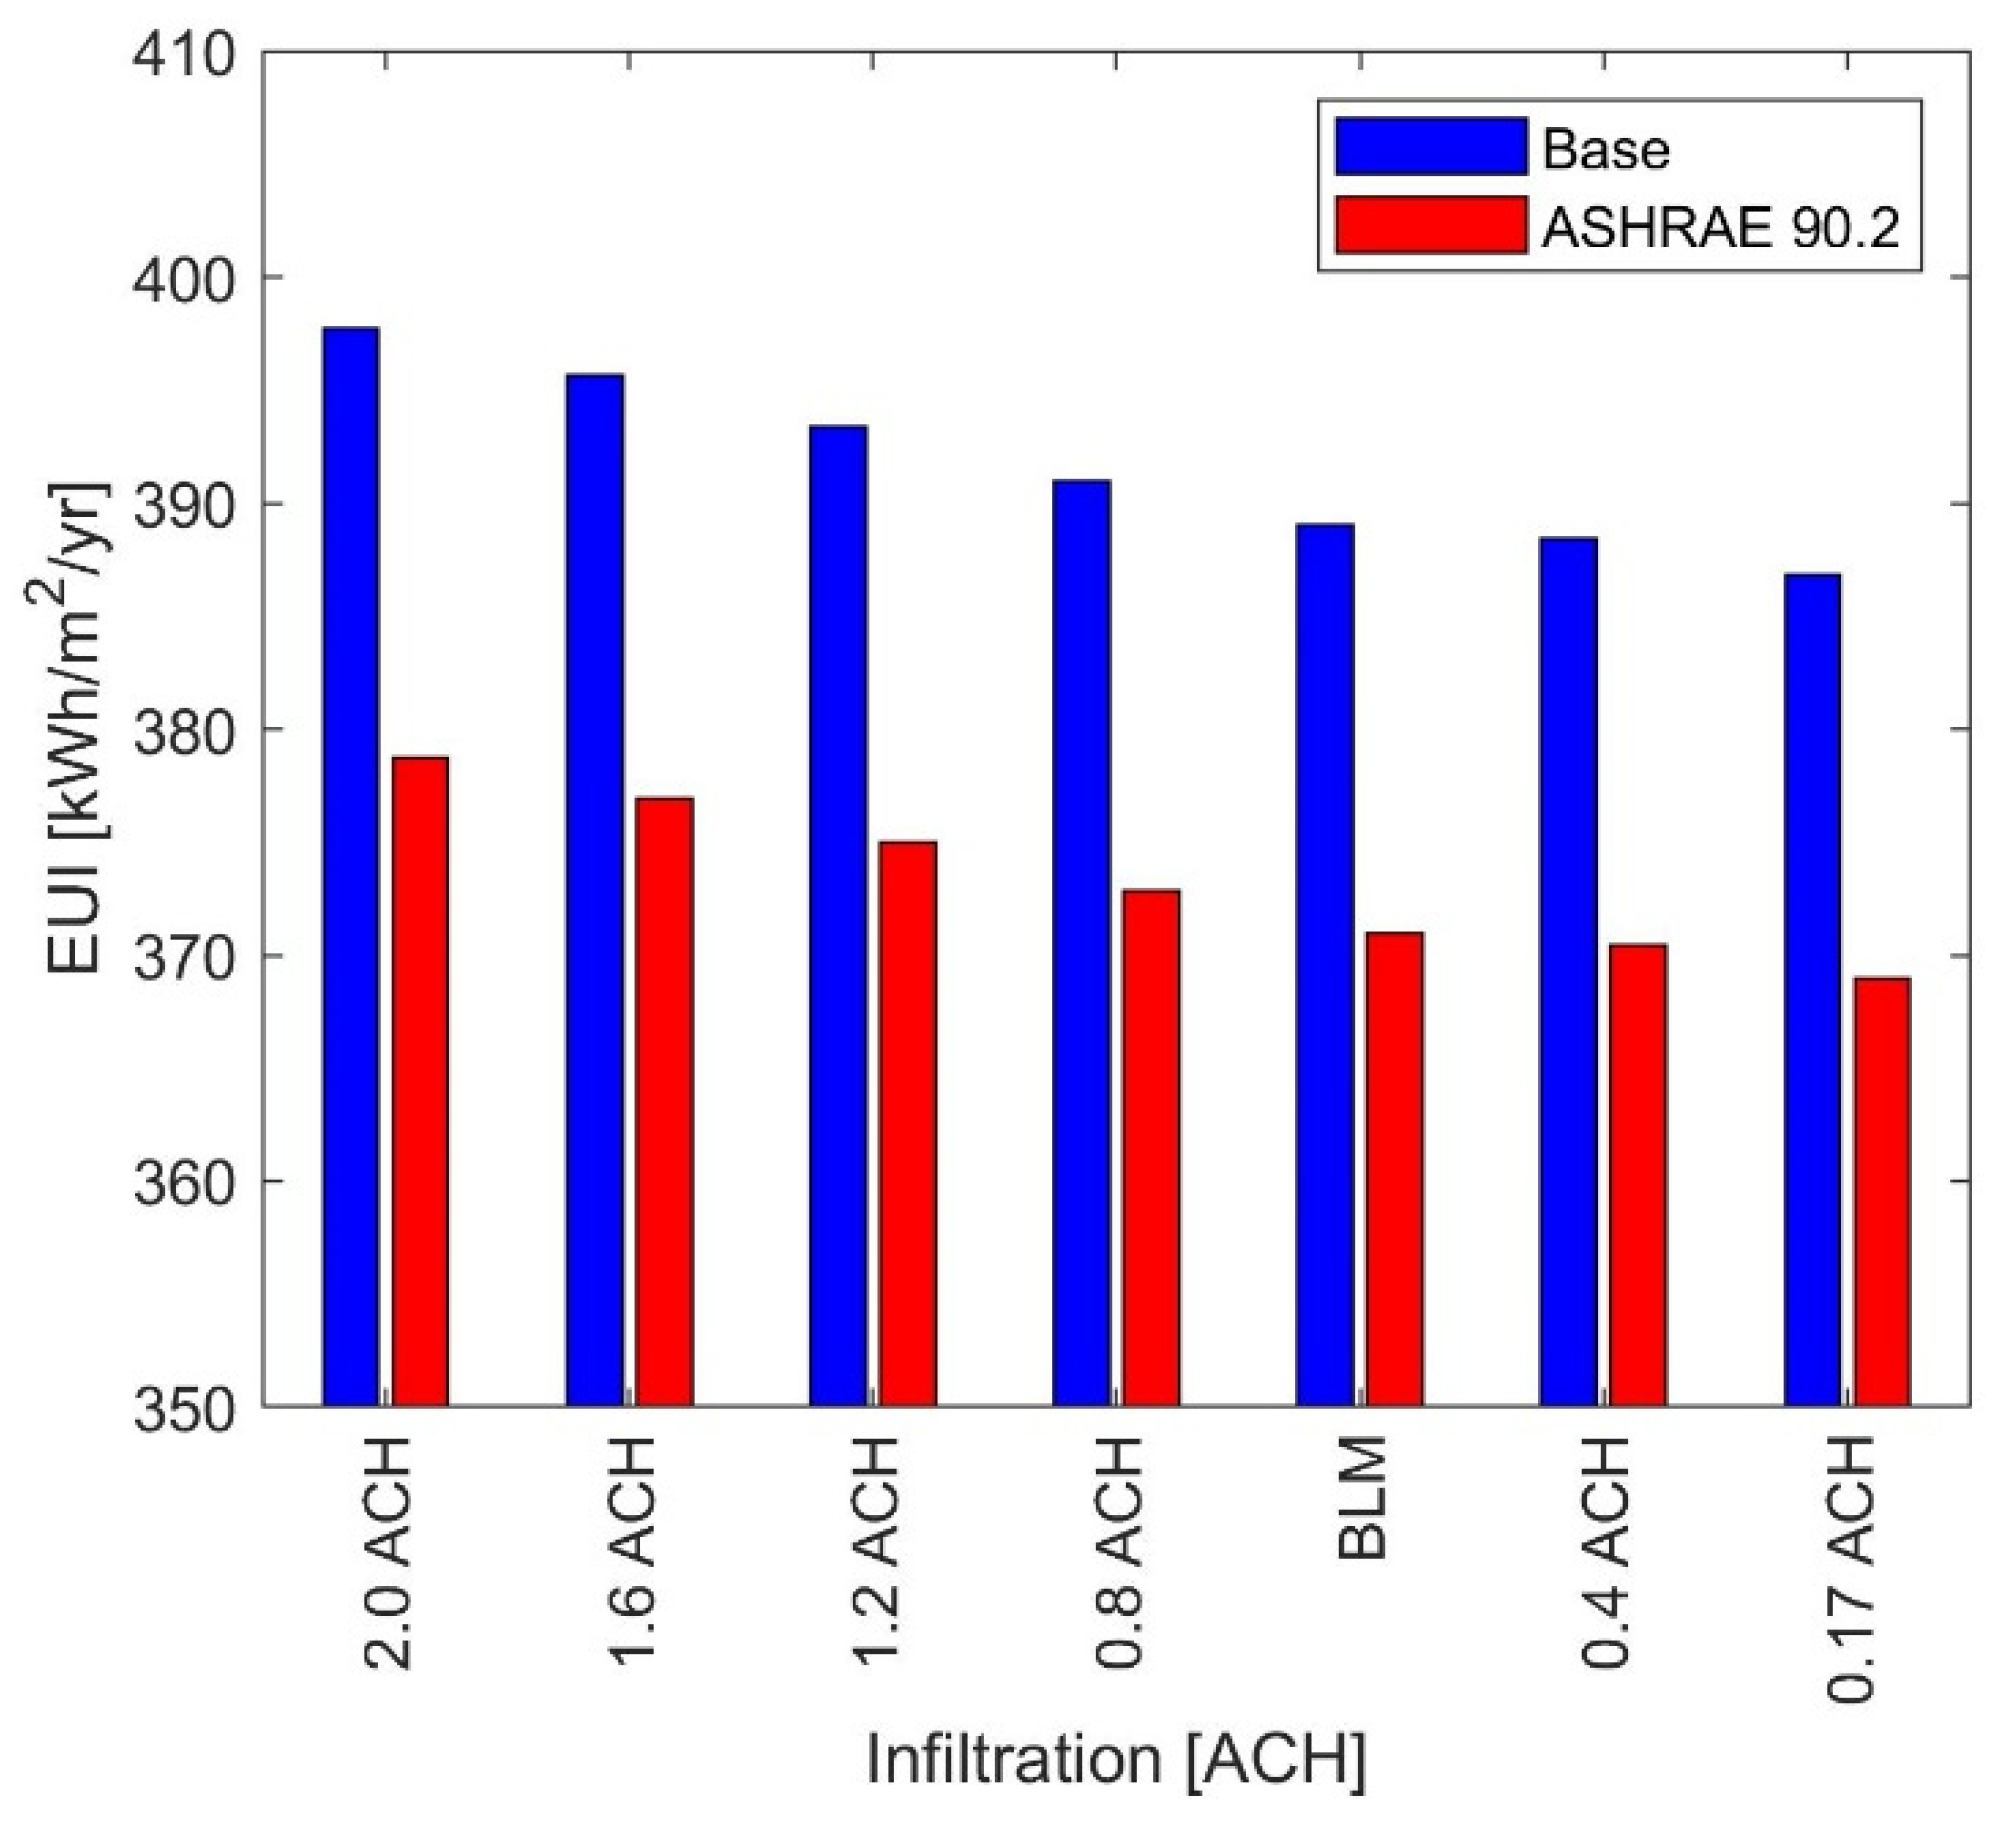
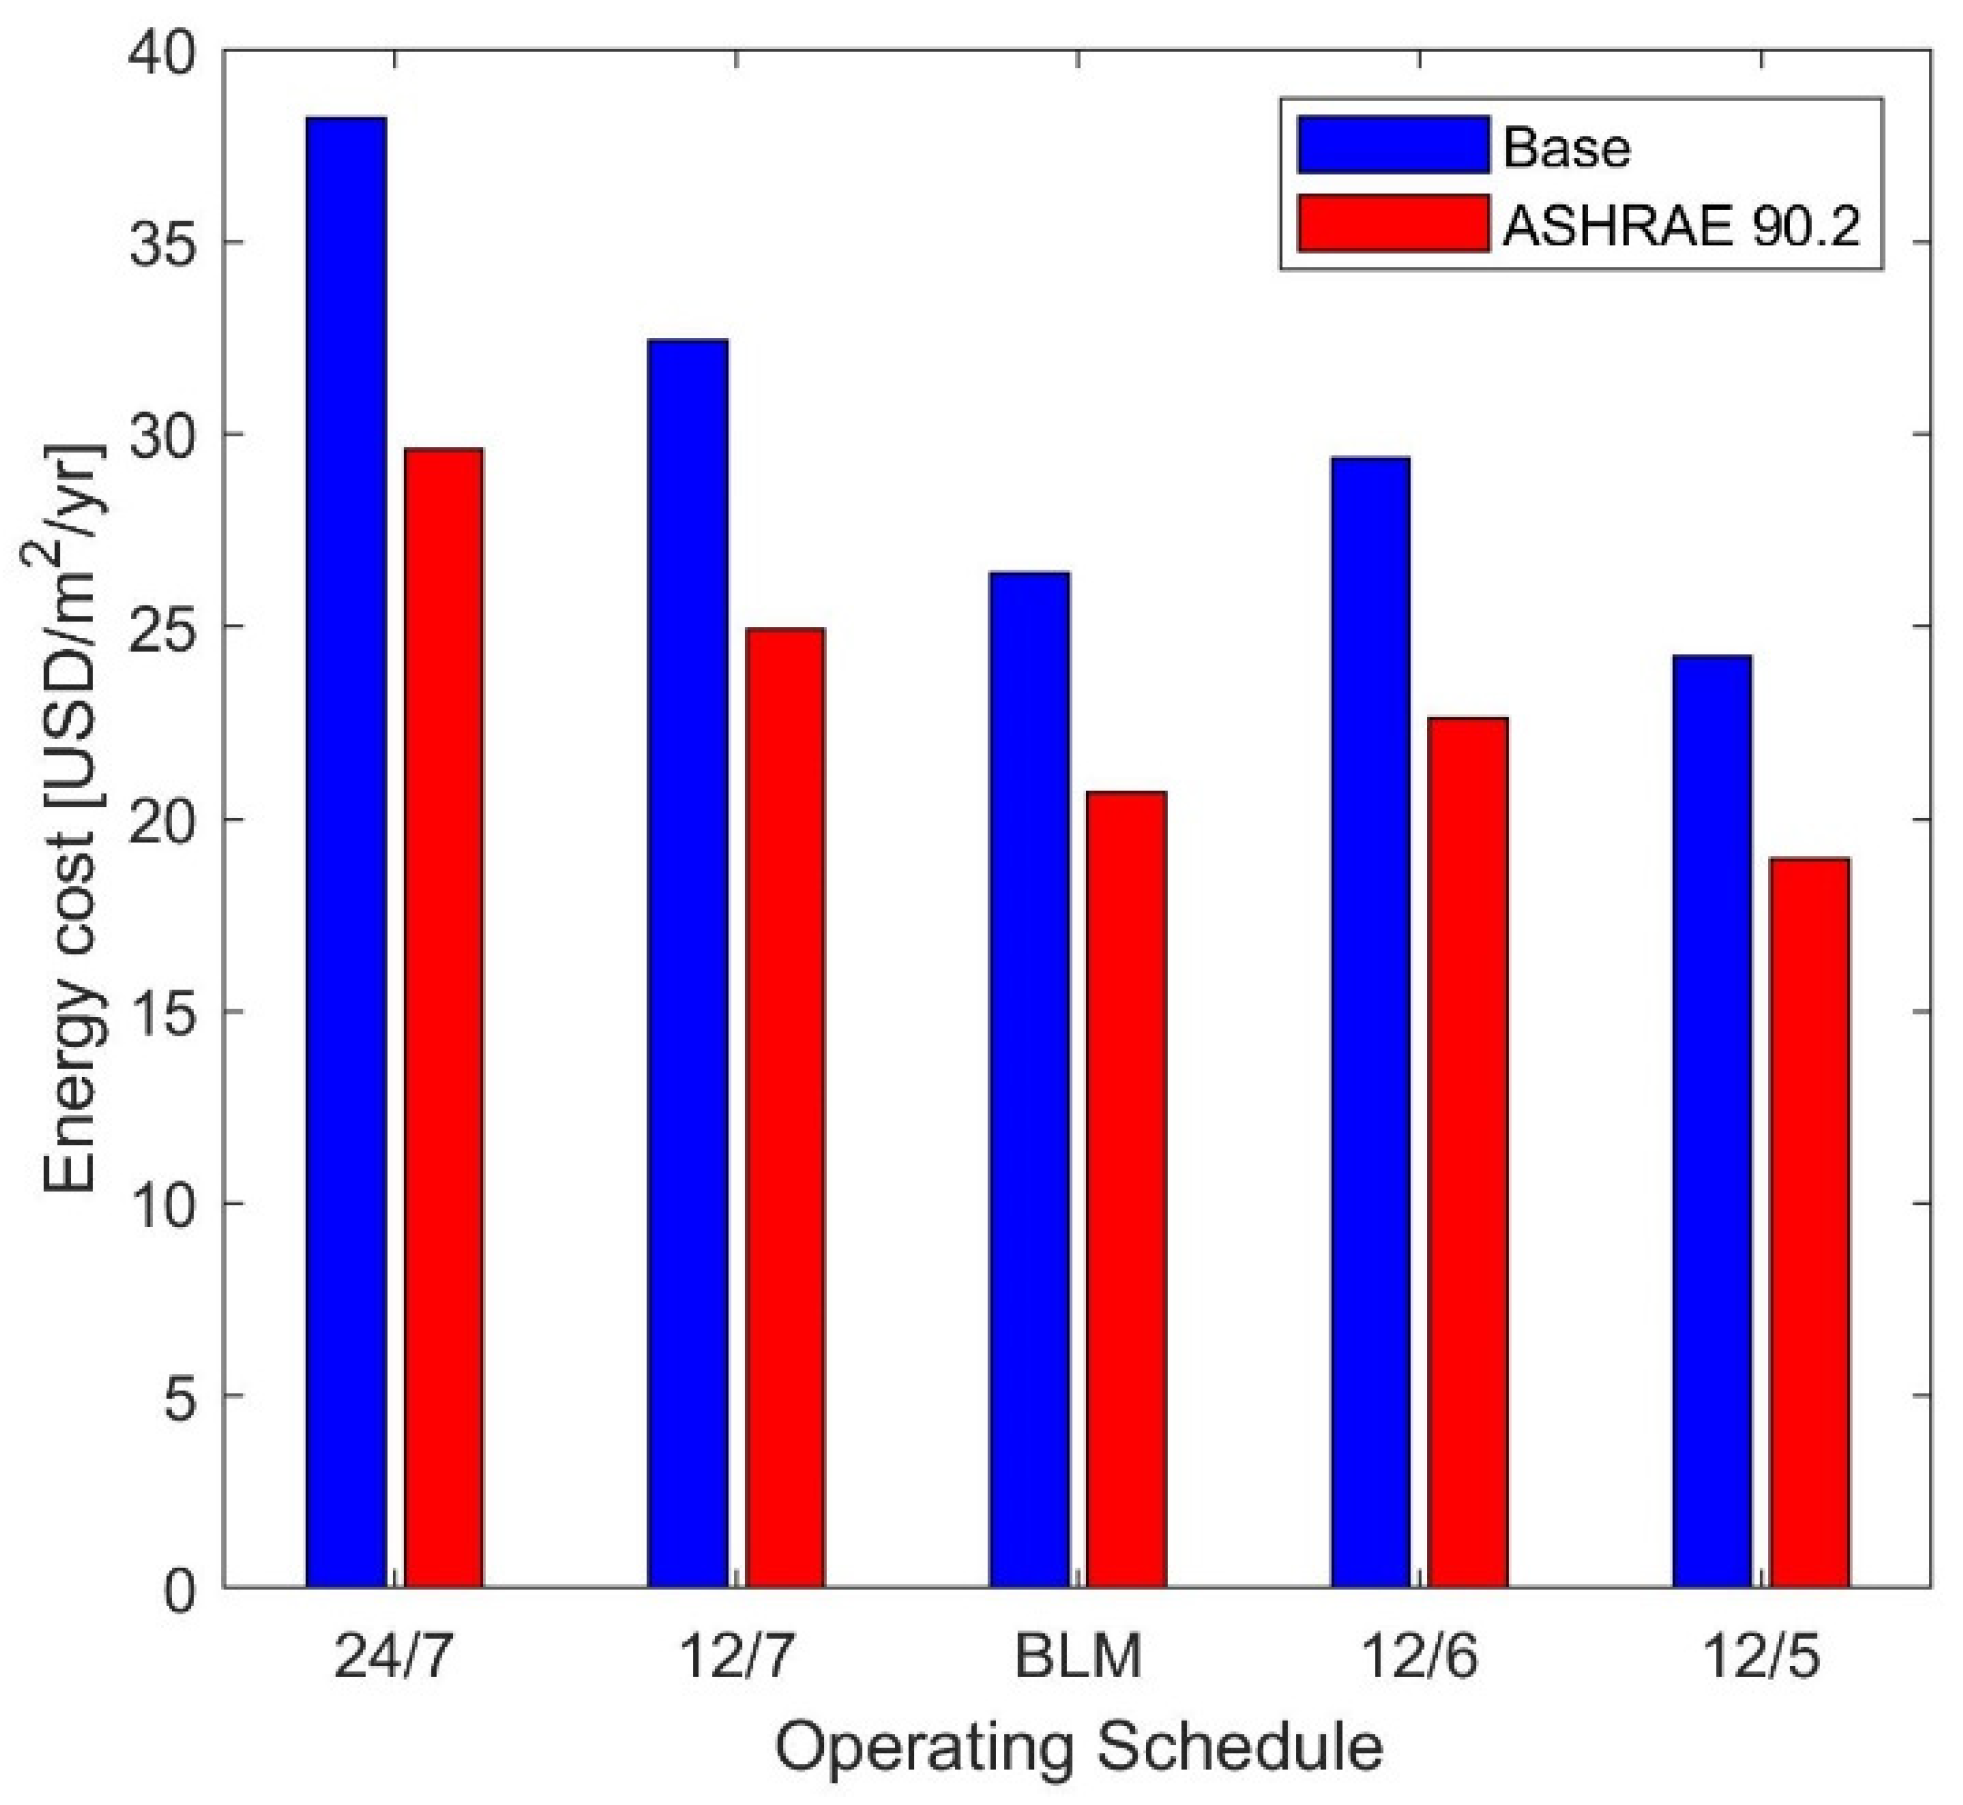
4.1.3. Operating Schedule
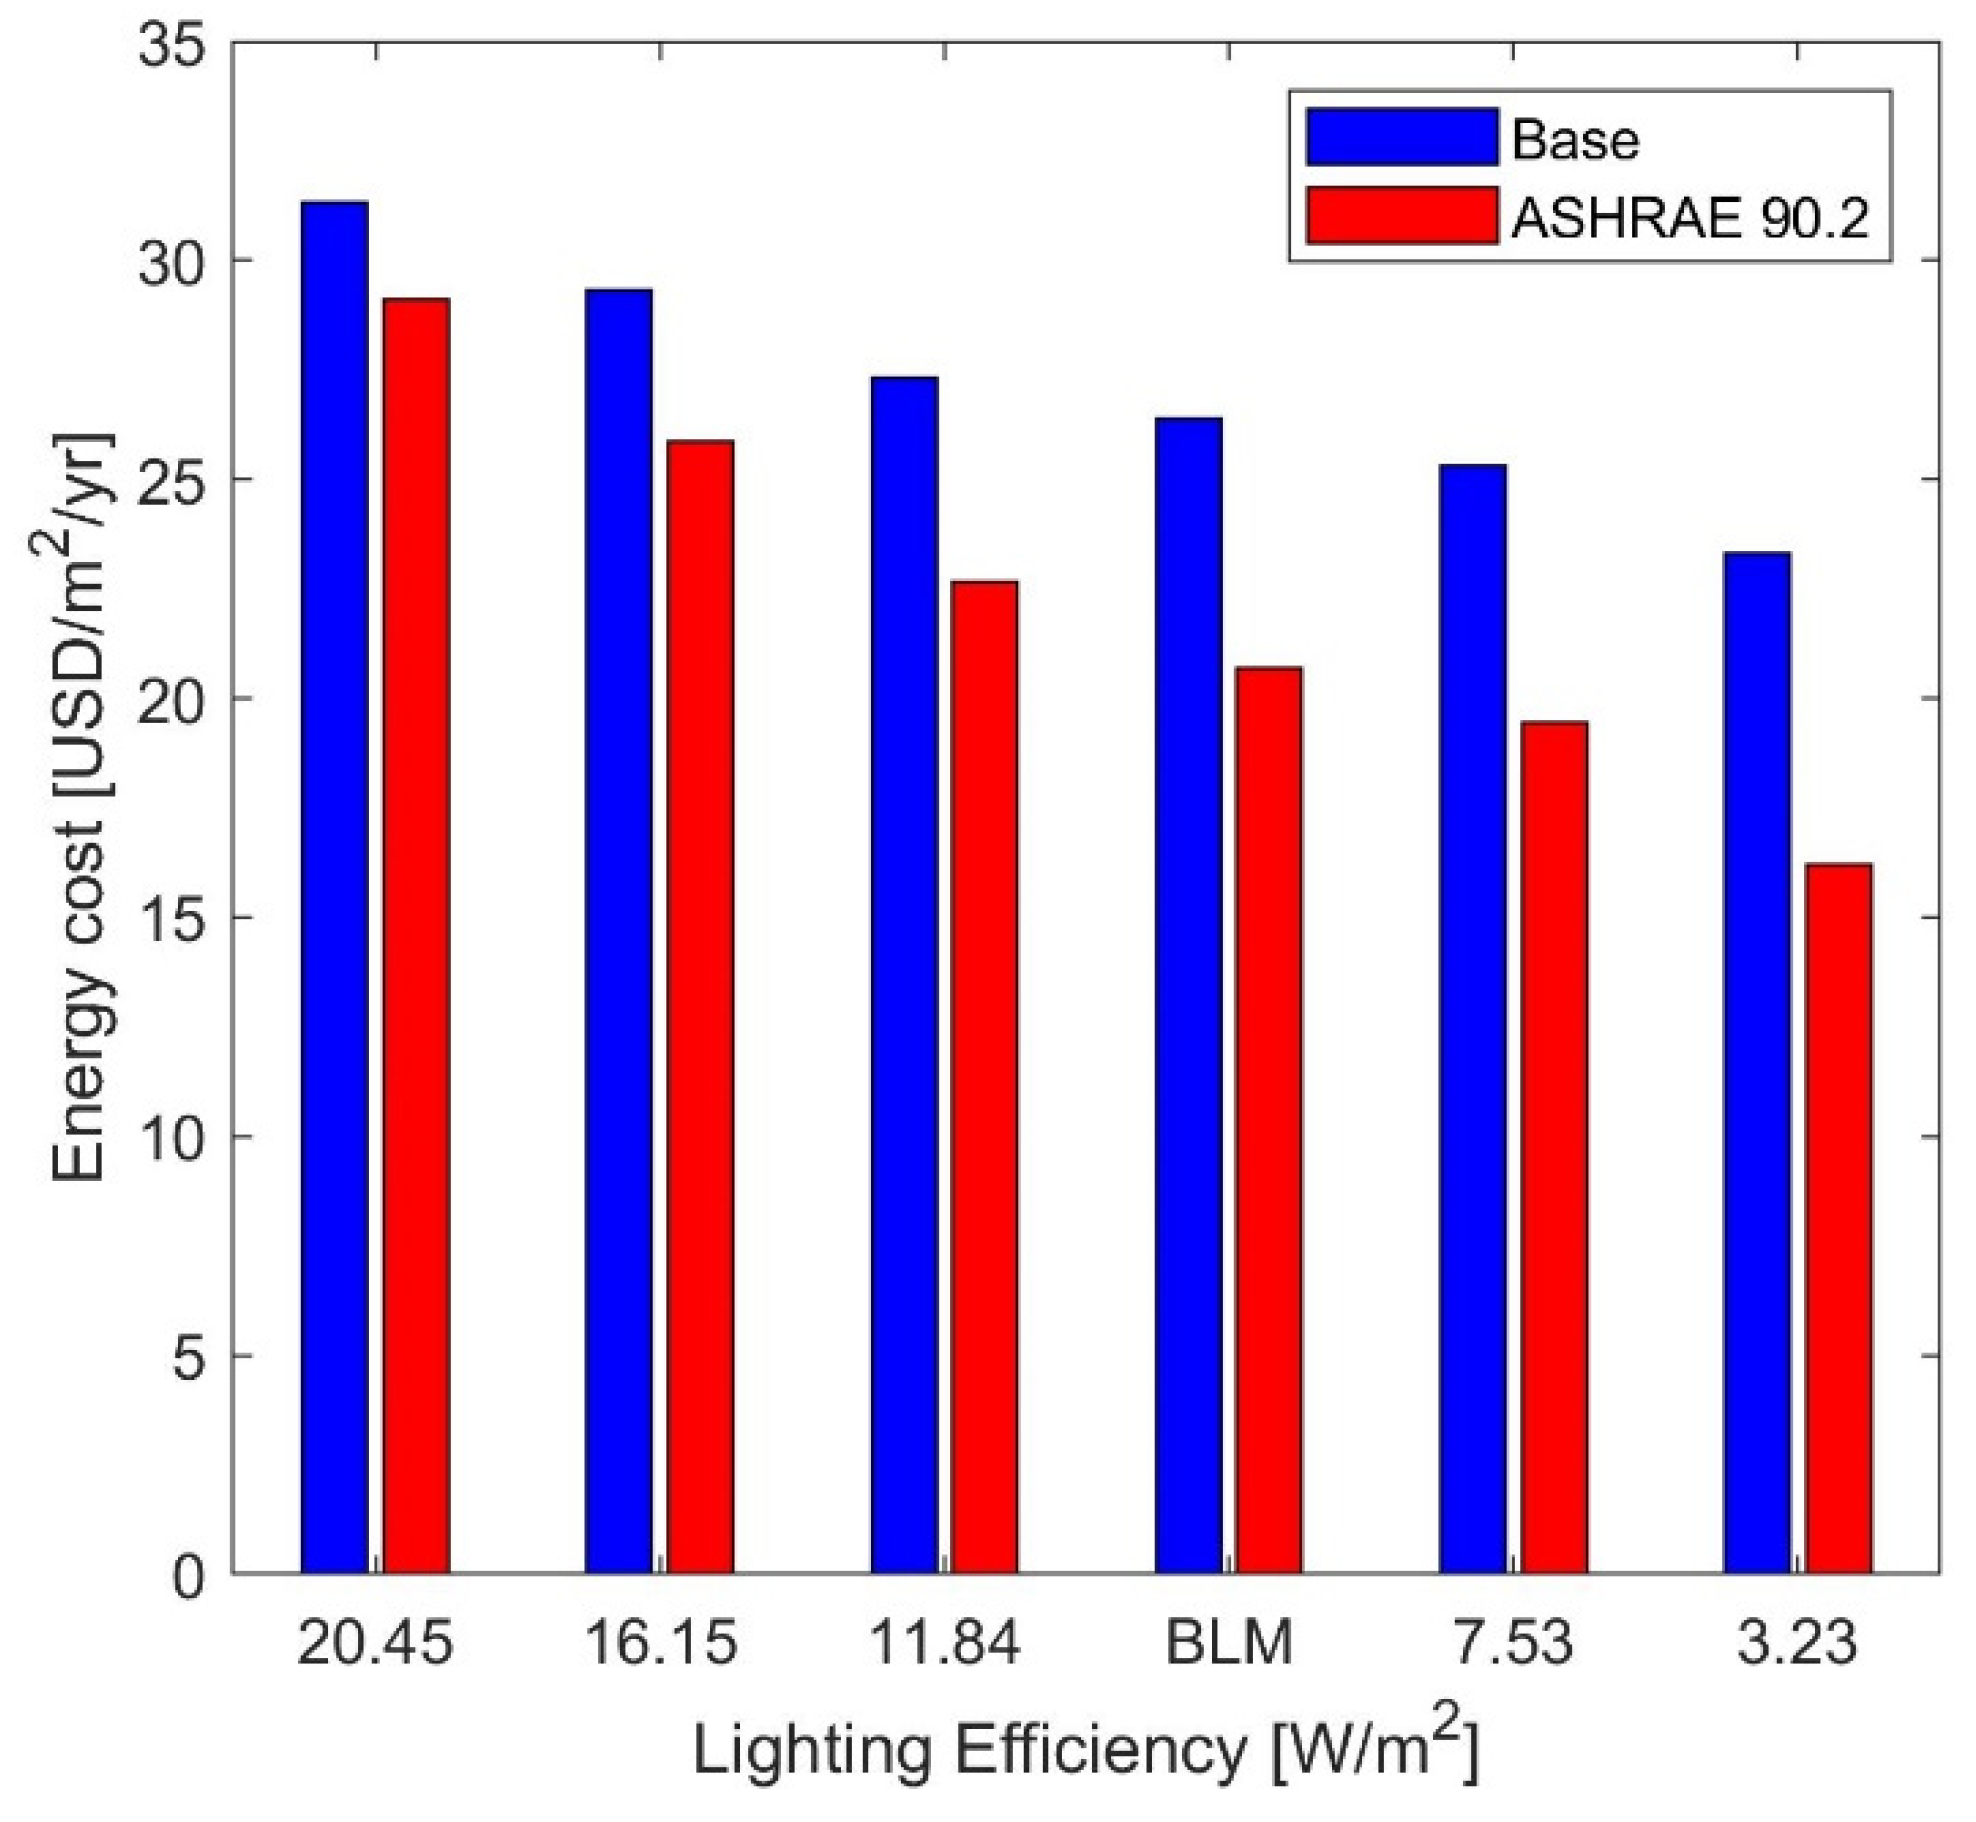
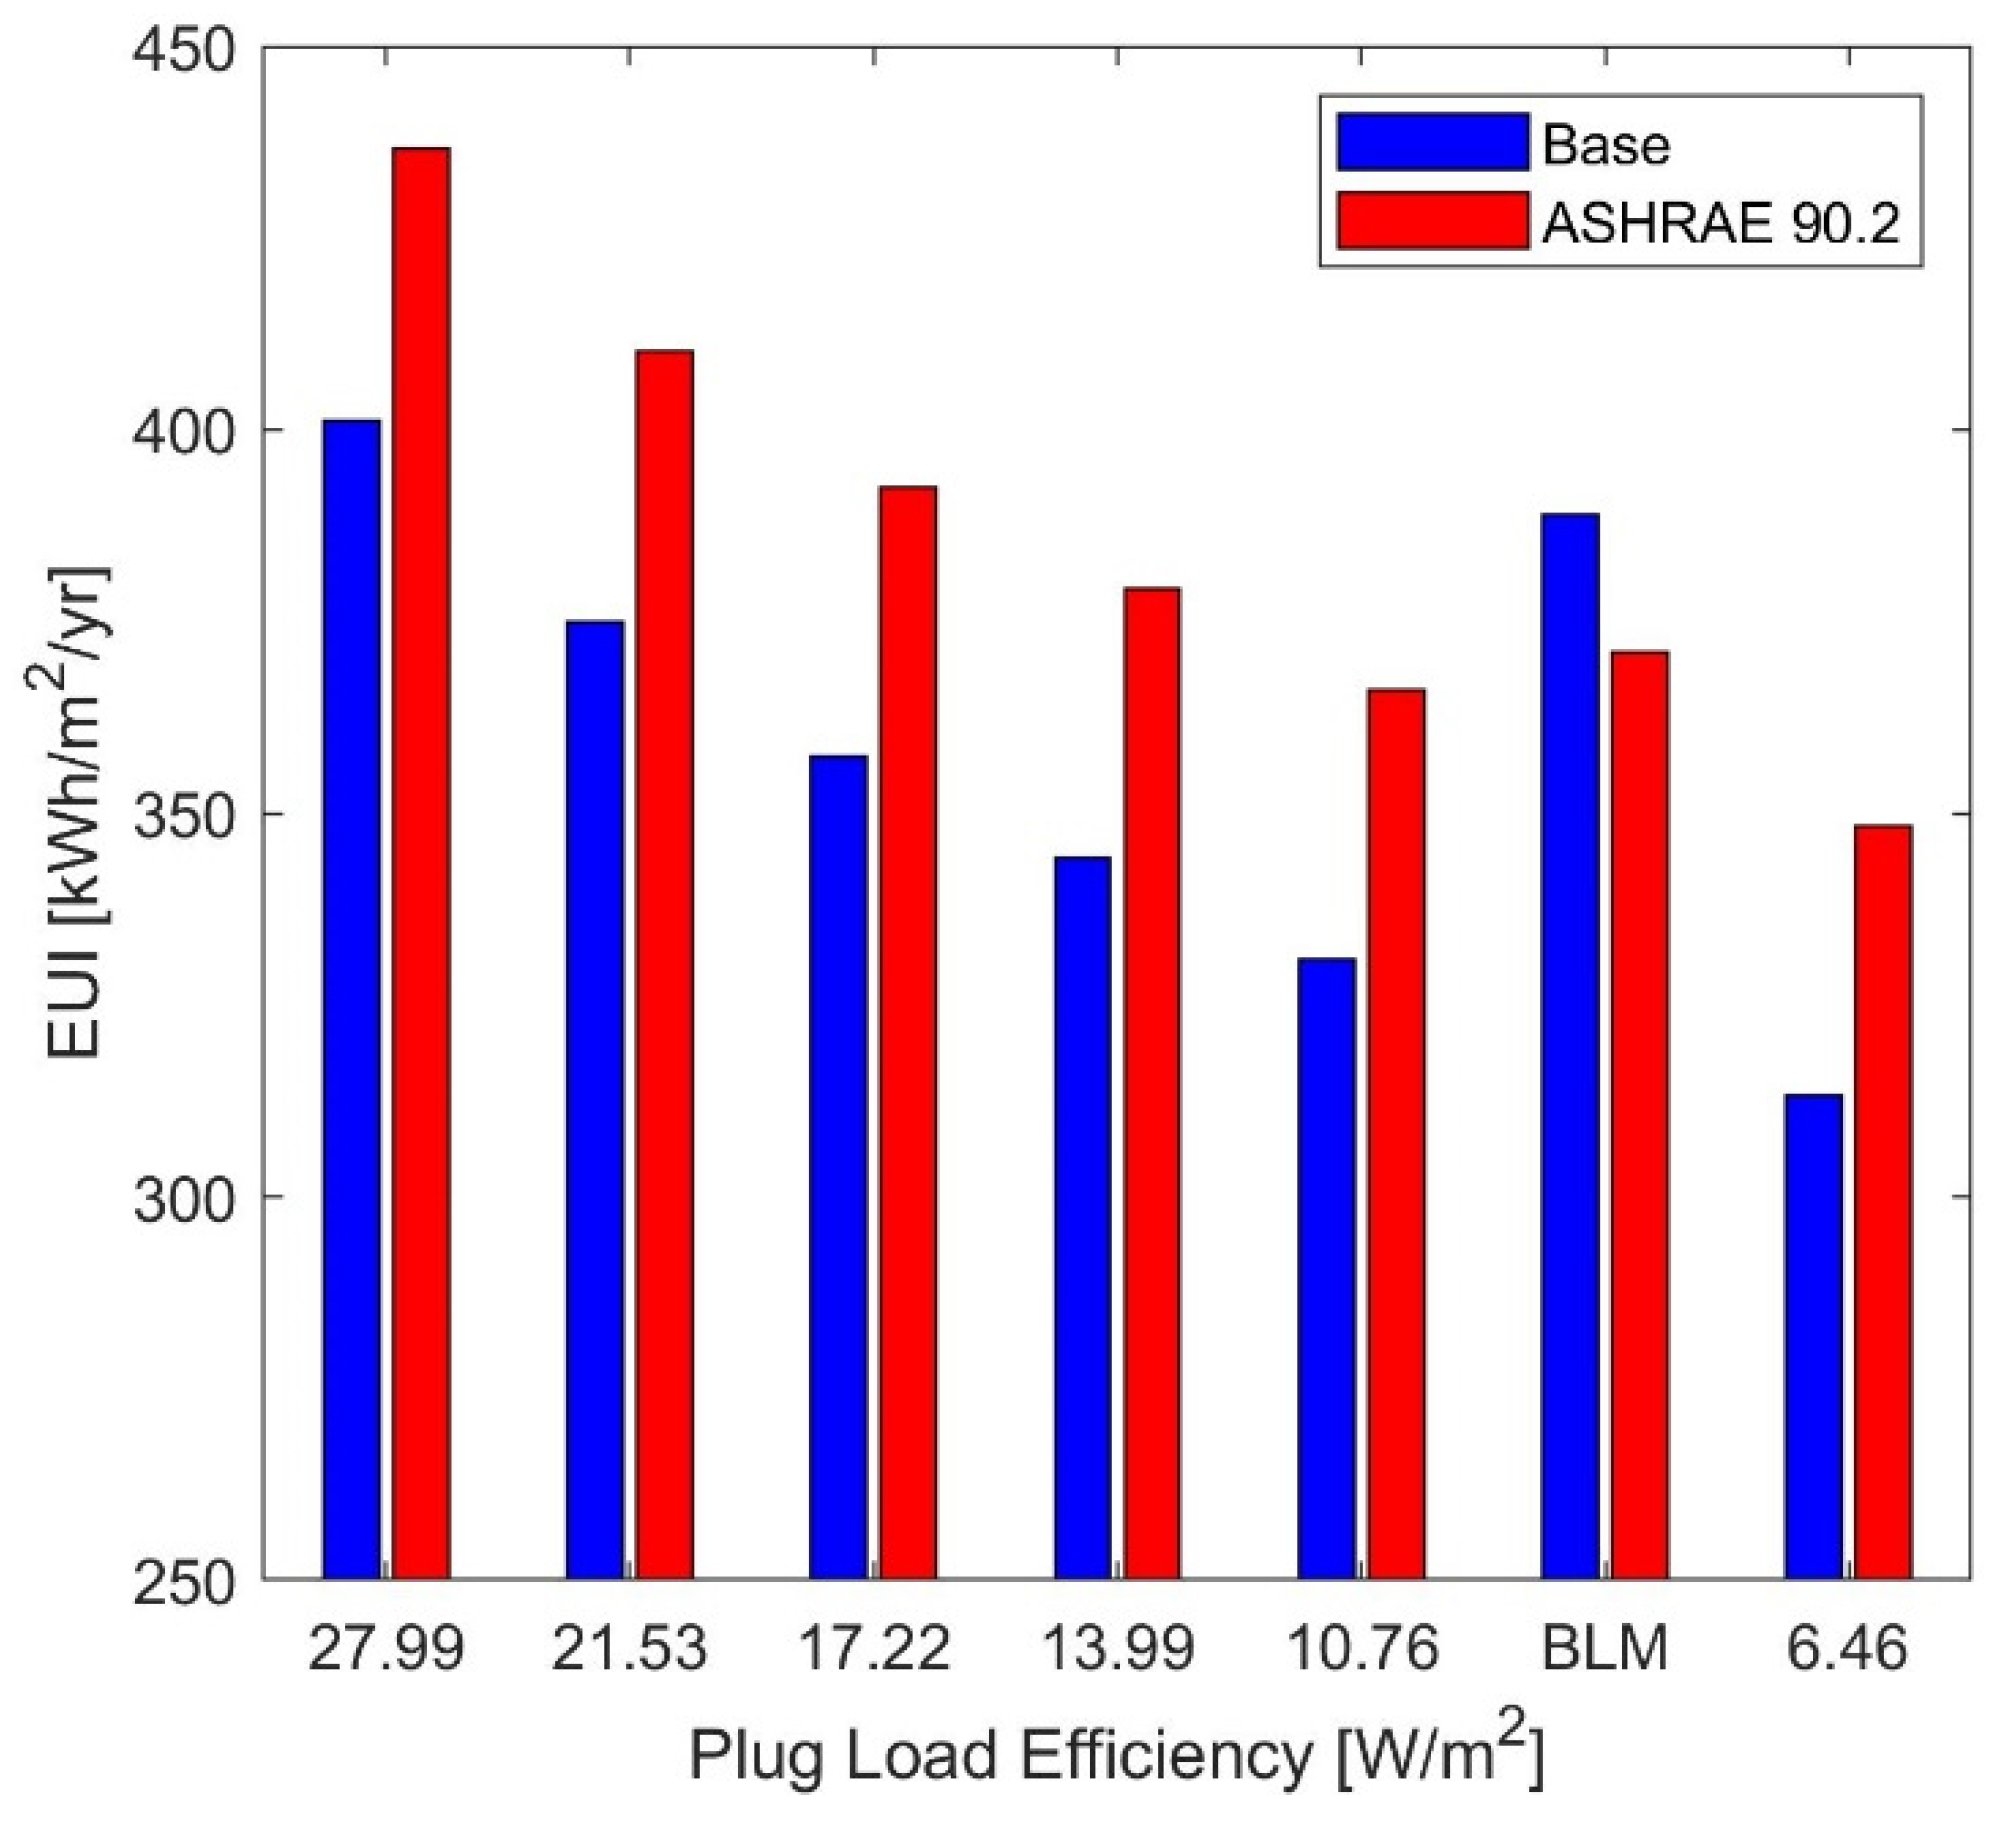
4.1.4. Lighting and Plug Load Efficiency
4.1.5. Renewable Energy
4.2. Dominant Factors Analysis
5. Conclusions
Supplementary Materials
Author Contributions
Funding
Data Availability Statement
Acknowledgments
Conflicts of Interest
Abbreviations
| ASHRAE | American Society of Heating, Refrigerating and Air-Conditioning Engineers |
| ASTM | American Society for Testing and Materials |
| BIM | Building Information Modelling |
| BLM | Baseline Model |
| Cp | Specific heat |
| d | Density |
| ENED | National Building Survey |
| EUI | Energy Use Intensity |
| EXA | Ecuadorian Civil Space Agency |
| f′c | Compressive Strength of Concrete |
| HVAC | Heating, Ventilation, and Air Conditioning |
| IIGE | Institute of Geological and Energy Research |
| INAMHI | National Institute of Meteorology and Hydrology |
| INER | Energy Efficiency and Renewable Energy |
| ISO | International Organization for Standardization |
| K | Conductivity |
| LABET | Laboratory of Thermal Tests and Energy Efficiency |
| LIH | Low-Income Housing |
| MIDUVI | Ministry of Urban Development and Housing |
| MPCIP | Ministry of Production, Foreign Trade, Investment and Fishing |
| NBE CT 79 | Basic Building Rules |
| NEC | Ecuadorian Construction Standard |
| NEC-HS | Ecuadorian Construction Standard, Habitability and Health Chapter |
| NEC-HS-EE | Ecuadorian Construction Standard, Habitability and Health Chapter. Energy Efficiency |
| NFRC | National Fenestration Rating Council |
| PLANEE | Energy Efficiency and a National Energy Efficiency Plan |
| PV Surface Coverage | Photovoltaic Surface Coverage |
| Rt | Thermal Resistance |
| SHGC | Solar Heat Gain Coefficient |
| U | Heat Transfer Coefficient |
References
- Bredenoord, J. Sustainable housing and building materials for low-income households. J. Archit. Eng. Technol. 2016, 5, 1–9. [Google Scholar]
- Haddad, S.; Paolini, R.; Synnefa, A.; De Torres, L.; Prasad, D.; Santamouris, M. Integrated assessment of the extreme climatic conditions, thermal performance, vulnerability, and well-being in low-income housing in the subtropical climate of Australia. Energy Build. 2022, 272, 112349. [Google Scholar] [CrossRef]
- Segura, G.; Guamán, J.; León, M.M.; Espinosa, V.M.; Monteses, J.B. Applied LSTM neural network time series to forecast household energy consumption. In Proceedings of the 19th LACCEI International Multi-Conference for Engineering, Education, and Technology, Buenos Aires, Argentina, 21–23 July 2021. [Google Scholar] [CrossRef]
- Charoenkit, S.; Kumar, S. Environmental sustainability assessment tools for low carbon and climate resilient low income housing settlements. Renew. Sustain. Energy Rev. 2014, 38, 509–525. [Google Scholar] [CrossRef]
- Bradshaw, J.L.; Bou-Zeid, E.; Harris, R.H. Greenhouse gas mitigation benefits and cost-effectiveness of weatherization treatments for low-income, American, urban housing stocks. Energy Build. 2016, 128, 911–920. [Google Scholar] [CrossRef]
- Eisenberg, J.F. Weatherization Assistance Program Technical Memorandum Background Data and Statistics on Low-Income Energy Use and Burdens; Oak Ridge National Lab. (ORNL): Oak Ridge, TN, USA, 2014. [Google Scholar]
- Suryadi, A.S.; Mohidin, H.H.B.; Ressang, A.M.; Aini, A.M.; Mahdzar, S.S.S.; Jusan, M.M. Integrated Space in Low-Income Housing in Kuala Lumpur. In Proceedings of the 2021 4th International Conference on Civil Engineering and Architecture, Zhuhai, China, 15–17 January 2021; Springer: Berlin/Heidelberg, Germany, 2022; pp. 425–432. [Google Scholar]
- Abu-Jdayil, B.; Mourad, A.-H.; Hittini, W.; Hassan, M.; Hameedi, S. Traditional, state-of-the-art and renewable thermal building insulation materials: An overview. Constr. Build. Mater. 2019, 214, 709–735. [Google Scholar] [CrossRef]
- Romero-Pérez, C.K.; Rodríguez-Muñoz, N.A.; Alpuche-Cruz, M.G.; Martín-Domínguez, I.R. Preliminary study of the condition of social housing in the city of Durango, México. Energy Procedia 2017, 134, 29–39. [Google Scholar] [CrossRef]
- Okonta, D.E. Investigating the impact of building materials on energy efficiency and indoor cooling in Nigerian homes. Heliyon 2023, 9, e20316. [Google Scholar] [CrossRef]
- Xu, L.; Dai, L.; Yin, L.; Sun, X.; Xu, W.; Yang, R.; Wang, X.; Zhang, Y. Research on the climate response of variable thermo-physical property building envelopes: A literature review. Energy Build. 2020, 226, 110398. [Google Scholar] [CrossRef]
- Lizana, J.; Chacartegui, R.; Barrios-Padura, A.; Valverde, J.M. Advances in thermal energy storage materials and their applications towards zero energy buildings: A critical review. Appl. Energy 2017, 203, 219–239. [Google Scholar] [CrossRef]
- Farzaneh, A.; Monfet, D.; Forgues, D. Review of using Building Information Modeling for building energy modeling during the design process. J. Build. Eng. 2019, 23, 127–135. [Google Scholar] [CrossRef]
- Kumar, N.; Aggarwal, S. Using Energy Simulation to Make Buildings Energy Efficient. In Affordable and Clean Energy; Filho, W.L., Azul, A.M., Brandli, L., Salvia, A.L., Wall, T., Eds.; Springer International Publishing: Cham, Switzerland, 2021; pp. 1286–1298. [Google Scholar] [CrossRef]
- ASHRAE Standard 90.2-2024; High-Performance Energy Design of Residential Buildings. ASHRAE: Peachtree Corners, GA, USA, 2024.
- Autodesk. Building Information Modeling. Available online: https://www.autodesk.com/solutions/aec/bim (accessed on 30 April 2024).
- Nunes, G.; Giglio, T. Effects of climate change in the thermal and energy performance of low-income housing in Brazil—Assessing design variable sensitivity over the 21st century. Renew. Sustain. Energy Rev. 2022, 168, 112885. [Google Scholar] [CrossRef]
- Cárdenas-Rangel, J.; Jaramillo-Ibarra, J.; Osma-Pinto, G. Estimation of the impact of energy efficiency measures recommended by Colombian legislation on the performance of low-and middle-income housing buildings. J. Build. Eng. 2022, 52, 104402. [Google Scholar] [CrossRef]
- Pereira, J.; Rivero, C.C.; Gomes, M.G.; Rodrigues, A.M.; Marrero, M. Energy, environmental and economic analysis of windows’ retrofit with solar control films: A case study in Mediterranean climate. Energy 2021, 233, 121083. [Google Scholar] [CrossRef]
- Kumar, N.; Bardhan, R. Optimizing Building Fenestration Design for Daylight and Energy Savings in Low-Income Housing: Case of Mumbai, India. In Urban Science and Engineering: Proceedings of ICUSE 2020; Springer: Berlin/Heidelberg, Germany, 2021; pp. 447–458. [Google Scholar]
- Bardhan, R.; Debnath, R. Building Energy Performance with Site-Based Airflow Characteristics in Naturally Ventilated Conditions in Low-Income Tenement Housing of Mumbai. In Advances in Energy Research, Vol. 1: Selected Papers from ICAER 2017; Springer: Berlin/Heidelberg, Germany, 2020; pp. 519–529. [Google Scholar]
- Fensterseifer, P.; Gabriel, E.; Tassi, R.; Piccilli, D.G.A.; Minetto, B. A year-assessment of the suitability of a green façade to improve thermal performance of an affordable housing. Ecol. Eng. 2022, 185, 106810. [Google Scholar] [CrossRef]
- Kamazani, M.A.; Dixit, M.K. Multi-objective optimization of embodied and operational energy and carbon emission of a building envelope. J. Clean. Prod. 2023, 428, 139510. [Google Scholar] [CrossRef]
- Deepak, B.; Arvinder, K. Initial or recurring embodied energy: Importance in Indian affordable housing. J. Build. Eng. 2022, 49, 104072. [Google Scholar] [CrossRef]
- Kovacic, I.; Reisinger, J.; Honic, M. Life Cycle Assessment of embodied and operational energy for a passive housing block in Austria. Renew. Sustain. Energy Rev. 2018, 82, 1774–1786. [Google Scholar] [CrossRef]
- Abey, S.T.; Anand, K.B. Embodied energy comparison of prefabricated and conventional building construction. J. Inst. Eng. Ser. A 2019, 100, 777–790. [Google Scholar] [CrossRef]
- Litardo, J.; Hidalgo-Leon, R.; Soriano, G. Energy performance and benchmarking for university classrooms in hot and humid climates. Energies 2021, 14, 7013. [Google Scholar] [CrossRef]
- Macias, J.; Iturburu, L.; Rodriguez, C.; Agdas, D.; Boero, A.; Soriano, G. Embodied and operational energy assessment of different construction methods employed on social interest dwellings in Ecuador. Energy Build. 2017, 151, 107–120. [Google Scholar] [CrossRef]
- Gallardo, A.; Palme, M.; Beltrán, R.D.; Lobato-Cordero, A.; Villacreses, G. Analysis and Optimization of the Thermal Performance of Social Housing Construction Materials in Ecuador. In Proceedings of the 32nd International Conference on Passive and Low Energy Architecture. Cities, Buildings, People: Towards Regenerative Environments, Los Angeles, CA, USA, 11–13 July 2016. [Google Scholar]
- Macas-Espinosa, V.; Vera-Rodríguez, L.; Barzola-Monteses, J. Analysis and Evaluation of Energy Efficiency in Buildings Based on Building Information Modeling. In Congress on Research, Development and Innovation in Renewable Energies: Selected Papers from CIDiER 2021; Springer: Berlin/Heidelberg, Germany, 2022; pp. 137–149. [Google Scholar]
- Sen, R.; Bhattacharya, S.P.; Chattopadhyay, S. Are low-income mass housing envelops energy efficient and comfortable? A multi-objective evaluation in warm-humid climate. Energy Build. 2021, 245, 111055. [Google Scholar] [CrossRef]
- Litardo, J.; Macías, J.; Hidalgo-León, R.; Cando, M.G.; Soriano, G. Measuring the Effect of Local Commercial Roofing Samples on the Thermal Behavior of a Social Interest Dwelling Located in Different Climates in Ecuador. In ASME International Mechanical Engineering Congress and Exposition; American Society of Mechanical Engineers: New York, NY, USA, 2019; p. V006T06A047. [Google Scholar]
- Flores-Larsen, S.; Filippín, C. Energy efficiency, thermal resilience, and health during extreme heat events in low-income housing in Argentina. Energy Build. 2021, 231, 110576. [Google Scholar] [CrossRef]
- Litardo, J.; Palme, M.; Hidalgo-León, R.; Amoroso, F.; Soriano, G. Energy Saving Strategies and On-Site Power Generation in a University Building from a Tropical Climate. Appl. Sci. 2021, 11, 542. [Google Scholar] [CrossRef]
- Synnefa, A.; Vasilakopoulou, K.; Kyriakodis, G.-E.; Lontorfos, V.; De Masi, R.; Mastrapostoli, E.; Karlessi, T.; Santamouris, M. Minimizing the energy consumption of low income multiple housing using a holistic approach. Energy Build. 2017, 154, 55–71. [Google Scholar] [CrossRef]
- Mousavi, S.; Gijón-Rivera, M.; Rivera-Solorio, C.I.; Rangel, C.G. Energy, comfort, and environmental assessment of passive techniques integrated into low-energy residential buildings in semi-arid climate. Energy Build. 2022, 263, 112053. [Google Scholar] [CrossRef]
- Robles, J.F.V.; Picó, E.C.; Hosseini, S.M.A. Environmental performance assessment: A comparison and improvement of three existing social housing projects. Clean. Environ. Syst. 2022, 5, 100077. [Google Scholar] [CrossRef]
- Lee, J.; Shepley, M.M. Benefits of solar photovoltaic systems for low-income families in social housing of Korea: Renewable energy applications as solutions to energy poverty. J. Build. Eng. 2020, 28, 101016. [Google Scholar] [CrossRef]
- Podgornik, A.; Sucic, B.; Bevk, P.; Stanicic, D. The impact of smart metering on energy efficiency in low-income housing in Mediterranean. In Climate-Smart Technologies: Integrating Renewable Energy and Energy Efficiency in Mitigation and Adaptation Responses; Springer: Berlin/Heidelberg, Germany, 2013; pp. 597–614. [Google Scholar]
- Average, C. Low income housing problems and low-income housing solutions: Opportunities and challenges in Bulawayo. J. Hous. Built Environ. 2019, 34, 927–938. [Google Scholar] [CrossRef]
- INEC. Encuesta Nacional de Edificaciones (ENED) 2020; Instituto Nacional de Estadísticas y Censos: Quito, Ecuador, 2021; Available online: https://www.ecuadorencifras.gob.ec/documentos/web-inec/Estadisticas_Economicas/Encuesta_Edificaciones/2020/2.%202020_ENED_Principales_resultados.pdf (accessed on 29 October 2024).
- Ministerio de Desarrollo Urbano y Vivienda (MIDUVI). NEC-SE-VIVIENDA: Viviendas de Hasta 2 Pisos con Luces de Hasta 5m Parte 4. 2014; pp. 121–122. Available online: https://www.habitatyvivienda.gob.ec/wp-content/uploads/2023/03/15.-NEC-SE-VIVIENDA-parte-4.pdf (accessed on 29 October 2024).
- Alcaldía de Guayaquil. Normas de Edificación. Servicio en Línea. Available online: https://tramites4.guayaquil.gob.ec/Edificaciones/SCE30006.aspx (accessed on 31 October 2021).
- Autodesk Revit. Specify the Location. Available online: https://help.autodesk.com/view/RVT/2023/ENU/?guid=GUID-85FA464E-D604-4242-9711-6183A5EF7F0A (accessed on 22 July 2024).
- Agencia Espacial Civil Ecuatoriana. Estación Climatológica Guayaquil: EXA-ISS-1. División de Ciencias Planetarias. Available online: http://gye.exa.ec/ (accessed on 1 November 2021).
- INOCAR. Frecuencias de Vientos Predominantes Guayaquil. Available online: https://www.inocar.mil.ec/graphs/src/inocar/index_vientos.php?est=5&tg=1 (accessed on 14 November 2021).
- Ministerio de Desarrollo Urbano y Vivienda (MIDUVI). Eficiencia Energética en Edificaciones Residenciales (EE). Ecuador. 2018. Available online: https://www.habitatyvivienda.gob.ec/wp-content/uploads/2023/03/4.-NEC-HS-Eficiencia-Energetica.pdf (accessed on 29 October 2024).
- Ministerio de Desarrollo Urbano y Vivienda (MIDUVI). NEC-SE-VIVIENDA: Viviendas de Hasta 2 Pisos con Luces de Hasta 5m Parte 2. 2014; Volume 2, p. 40. Available online: https://www.habitatyvivienda.gob.ec/wp-content/uploads/2023/03/13.-NEC-SE-VIVIENDA-parte-2.pdf (accessed on 29 October 2024).
- Ministerio de Desarrollo Urbano y Vivienda (MIDUVI). Lineamientos Mínimos Para Registro y Validación de Tipologías de Vivienda. 2018. Available online: https://www.habitatyvivienda.gob.ec/wp-content/uploads/downloads/2018/04/LINEAMIENTOS-MINIMOS-PARA-REGISTRO-Y-VALIDACION-DE-TIPOLOGIAS-DE-VIVIENDA.pdf (accessed on 10 September 2024).
- Ministerio de Desarrollo Urbano y Vivienda (MIDUVI). Especificaciones Técnicas Generales: Edificación Para Vivienda Rural Proyecto ‘Primero de Enero’. 2014. Available online: https://www.compraspublicas.gob.ec/ProcesoContratacion/compras/PC/bajarArchivo.cpe?Archivo=gLA1brvA7PhlLNMhBKvlFMIou3VwaiQi2RkX6HUtQ6Q (accessed on 24 October 2024).
- Andrew Leavitt. Energy Modeling with Revit and Insight. Available online: https://www.autodesk.com/autodesk-university/class/Energy-Modeling-Revit-and-Insight-2019 (accessed on 21 February 2025).
- Daniel Stine. Dynamic Energy Optimization with Revit and Insight 360. Available online: https://www.aia-mn.org/wp-content/uploads/39-Dynamic-Energy-Optimization-with-Revit-and-Insight-360.pdf?utm_source=chatgpt.com (accessed on 21 February 2025).
- Chen, S.Y. A green building information modelling approach: Building energy performance analysis and design optimization. MATEC Web Conf. 2018, 169, 01004. [Google Scholar] [CrossRef]
- Flores, M.S.M. Building Performance Evaluation Using Autodesk Revit for Optimising the Energy Consumption of an Educational Building on Subtropical Highland Climate: A Case of Study in Quito, Ecuador. Master’s Dissertation, Department of Architecture and Built Environment, University of Nottingham, Nottingham, UK, 2016. [Google Scholar] [CrossRef]
- Lee, E. Innovative Glazing Materials. In Handbook of Energy Efficiency in Buildings; Francesco, A., Desideri, U., Eds.; Elsevier Inc.: Berkeley, CA, USA, 2018; pp. 1–22. Available online: https://eta-publications.lbl.gov/sites/default/files/ch6.3-innovative_glazing_lbnl_2001193_eslee.pdf (accessed on 15 September 2024).
- Maurya, A.; Kumar, R.; Bharadwaj, U.; Rawat, P.; Kumar, M. Sustainable Building Design: Energy Analysis of a Residential Building using Autodesk Revit. In Proceedings of the 2021 2nd International Conference on Intelligent Engineering and Management, ICIEM 2021, London, UK, 28–30 April 2021; Institute of Electrical and Electronics Engineers Inc.: New York, NY, USA, 2021; pp. 441–446. [Google Scholar] [CrossRef]
- Khan, I.; Zedadra, O.; Guerrieri, A.; Spezzano, G. Occupancy Prediction in IoT-Enabled Smart Buildings: Technologies, Methods, and Future Directions. Sensors 2024, 24, 3276. [Google Scholar] [CrossRef]
- Mahiwal, S.G.; Bhoi, M.K.; Bhatt, N. Evaluation of energy use intensity (EUI) and energy cost of commercial building in India using BIM technology. Asian J. Civ. Eng. 2021, 22, 877–894. [Google Scholar] [CrossRef]
- Mirjalili, S.M.A.; Aslani, A.; Zahedi, R. Towards sustainable commercial-office buildings: Harnessing the power of solar panels, electric vehicles, and smart charging for enhanced energy efficiency and environmental responsibility. Case Stud. Therm. Eng. 2023, 52, 103696. [Google Scholar] [CrossRef]
- Crespo, M.B.; Gómez, J.M.; Macias, J. Caracterización Térmica y Mecánica de Bloque de Concreto. INNOVA Res. J. 2018, 3, 62–79. [Google Scholar] [CrossRef]
- Çengel, Y. Transferencia de Calor y Masa, 3rd ed.; McGraw-Hill: New York, NY, USA, 2007; Volume 18. [Google Scholar] [CrossRef]
- Jara, M.; Quintanilla, S.; Cecilia, A. Evaluación de la conductividad térmica y propiedades físico-mecánicas de bloques de concreto sustituyendo el confitillo por poliestireno expandido tipo perla; Universidad Andina del Cusco: Cusco, Peru, 2020. [Google Scholar]
- Medina, N.F.; Medina, D.F.; Hernández-Olivares, F.; Navacerrada, M.A. Mechanical and thermal properties of concrete incorporating rubber and fibres from tyre recycling. Constr. Build. Mater. 2017, 144, 563–573. [Google Scholar] [CrossRef]
- IRAM 11601; Aislamiento térmico de edificios. Métodos de cálculo. Propiedades térmicas de los componentes y elementos de construcción en régimen estacionario. Instituto Argentino de Normalización y Certificación (IRAM): Buenos Aires, Argentina, 2004.
- Norma Chilena 853; Acondicionamiento térmico—Envolvente térmica de edificios—Cálculo de resistencias y transmitancias térmicas. Instituto Nacional de Normalización (INN): Santiago, Chile, 2007.
- Vega, M. Estudio y análisis en la mejora de la eficiencia energética térmica de la envolvente en la escuela rural Bahía Mansa, Osorno. Bachelor’s Thesis, Universidad de Los Lagos, Osorno, Chile, 2009. [Google Scholar]
- Sarmiento, P. Energía solar en arquitectura y construcción; Editorial Reverté: Barcelona, Spain, 2007. [Google Scholar]
- Asociación de Normalización y Certificación A.C. ANCE. Tabla de emisividades de material. Available online: https://www.ance.org.mx/NormalizacionOnLine/DocsOnn/Documentos/DOC-01112021094806573.pdf (accessed on 15 September 2024).
- Miño, I.; Lobato, A.; Labus, J. Simulaciones energéticas como herramienta para evaluación térmica de las viviendas sociales del Ecuador: Caso Yachay. Master’s Thesis, Universidad Técnica del Norte, Ibarra, Ecuador, 2013. [Google Scholar]
- Vidrio Arquitectónico, Tablas de Datos de Desempeño. Available online: https://www.vitroglazings.com/es/informacion-tecnica/tablas-de-datos-de-desempeno/ (accessed on 15 September 2024).
- Norma Ecuatoriana de la Construcción (NEC), Vidrio, Ministerio de Desarrollo Urbano y Vivienda, Ecuador. 2015. Available online: https://www.habitatyvivienda.gob.ec/wp-content/uploads/2023/03/1.-NEC-HS-VD-Vidrio.pdf (accessed on 24 September 2024).
- de Gastines, M.; Pattini, A. Propiedades energéticas de tecnologías de ventanas en Argentina. Rev. Hábitat Sustent. 2019, 9, 45–58. [Google Scholar] [CrossRef]
- Hernández-Garfias, E.; Pérez-Sánchez, C.; Durán-Mendoza, T.; Guzmán-Ceferino, J.; González-Pérez, M. Caracterización térmica de vidrios con recubrimientos metálicos. Rev. Científica Eur. 2021, 5, 23–39. [Google Scholar] [CrossRef]
- AMEVEC. Eficiencia Energética En Ventanas Y Puertas; Asociación Mexicana de Ventanas y Cerramientos: Mexico City, Mexico, 2021; p. 6. [Google Scholar]
- Astudillo, F.; Chávez, L. Los materiales de construcción y su aporte al mejoramiento del confort térmico en viviendas periféricas de la ciudad de Loja. Bachelor’s Thesis, Universidad Nacional de Loja, Loja, Ecuador, 2009. [Google Scholar]
- Metales, C. Hierro Propiedades Térmicas. Available online: https://metals.comparenature.com/es/hierro-propiedades-termicas/model-7-7 (accessed on 20 September 2024).
- Cruz, D. Comportamiento térmico de las cubiertas en el clima de Quito. Master’s Thesis, Universidad Central del Ecuador, Quito, Ecuador, 2017. [Google Scholar]
- Cruz, D. La cubierta metálica en el clima cálido húmedo: Análisis del comportamiento térmico y efecto en el confort del techo de zinc de la vivienda vernácula dominicana. Ph.D. Dissertation, Universidad Nacional Pedro Henríquez Ureña, Santo Domingo, Dominican Republic, 2012. [Google Scholar]
- ACESCO. Fabricante de cubiertas metálicas, Bogotá, Colombia. 2021. Available online: https://www.acesco.com.co/atributos-de-materiales/#desempeno (accessed on 24 September 2024).
- Barrios, G.; Huelsz, G.; Rojas, J.; Elías, P. Selección de los Materiales de Muros y Techos para Mejorar el Confort Térmico en Edificaciones no Climatizadas; Universidad de La Habana: Havana, Cuba, 2010. [Google Scholar]
- Gaggino, R.; Jerónimo, K.; Filippín, C.; Paz, S.A.M.; Julián, G.L.; Peisino, L.E. Comportamiento térmico de sistema de cubierta para viviendas construido con materiales reciclados. Rev. Arquit. Sustent. 2016, 4, 30–42. [Google Scholar]


| Housing Parameters | Specifications |
|---|---|
| Type of housing | Low-income housing |
| Reference | MIDUVI-NEC 15 |
| Estimated location | km 16 Vía Daule, Villa Bonita, Guayaquil |
| Type of structure | Earthquake-resistant |
| Wall construction | Concrete block masonry |
| Life span | 30 to 40 years |
| Number of floors | 1 |
| Height | 3.10 m (without subfloor) |
| Floor area | 36 m2 |
| Living height | 3.30 m |
| N°. Bedrooms | 2 |
| N°. Bathrooms | 1 |
| N°. Kitchens | 1 |
| N°. Living rooms | 1 |
| Room | Area [m2] |
|---|---|
| Living and dining | 12.25 |
| Kitchen | 4.25 |
| Bedroom 1 | 7.85 |
| Bedroom 2 | 9.00 |
| Bathroom | 2.65 |
| Total | 36.00 |
| Element | Description | Density [kg/m3] | Conductivity [W/mK] | Heat Transmittance Coefficient [W/m2K] |
| Walls | Concrete mortar | 1666.19 | 0.62 | 3.74 |
| Plastered concrete blocks | ||||
| Floors | Conventional concrete | 2100 | 0.71 | 3.54 |
| Roof | Galvanized zinc | 7200 | 0.11 | 5.24 |
| Element | Description | Visual Light Transmittance | Thermal Resistance [kJ/m2K] | Solar Heat Increases Coefficient and Heat Transfer Coefficient [W/m2K] |
| Doors | Steel sheet | 0.17 | 5.70 | |
| Windows | 3 mm single glazing. Clear glass | 0.89 | 0.17 | 6.19 |
| N° | Factors | Type | Baseline Model (BLM) |
|---|---|---|---|
| 1 | Building Orientation | Passive | North 164° |
| 2 | Window Wall Ratio WWR | Passive | 0% N; 0% S; 30% W; 29% E |
| 3 | Wall Construction | Passive | Cement block and mortar |
| 4 | Window Shades | Passive | 0 N; 0 S; 0 W; 0 E |
| 5 | Roof Construction | Passive | Galvanized zinc |
| 6 | Window Glass | Passive | Single glass (Sgl) 5 mm |
| 7 | Infiltration | Passive | 0.19 ACH |
| 8 | Lighting Efficiency | Active | [3.23; 7.53] W/m2 |
| 9 | Daylighting and Occupancy Controls (DOC) | Active | Not apply |
| 10 | Plug Load Efficiency | Active | 10.76 W/m2 |
| 11 | HVAC | Active | Not apply |
| 12 | Operating Schedule | Active | 11/7 |
| 13 | PV—Surface Coverage | Active | 0% |
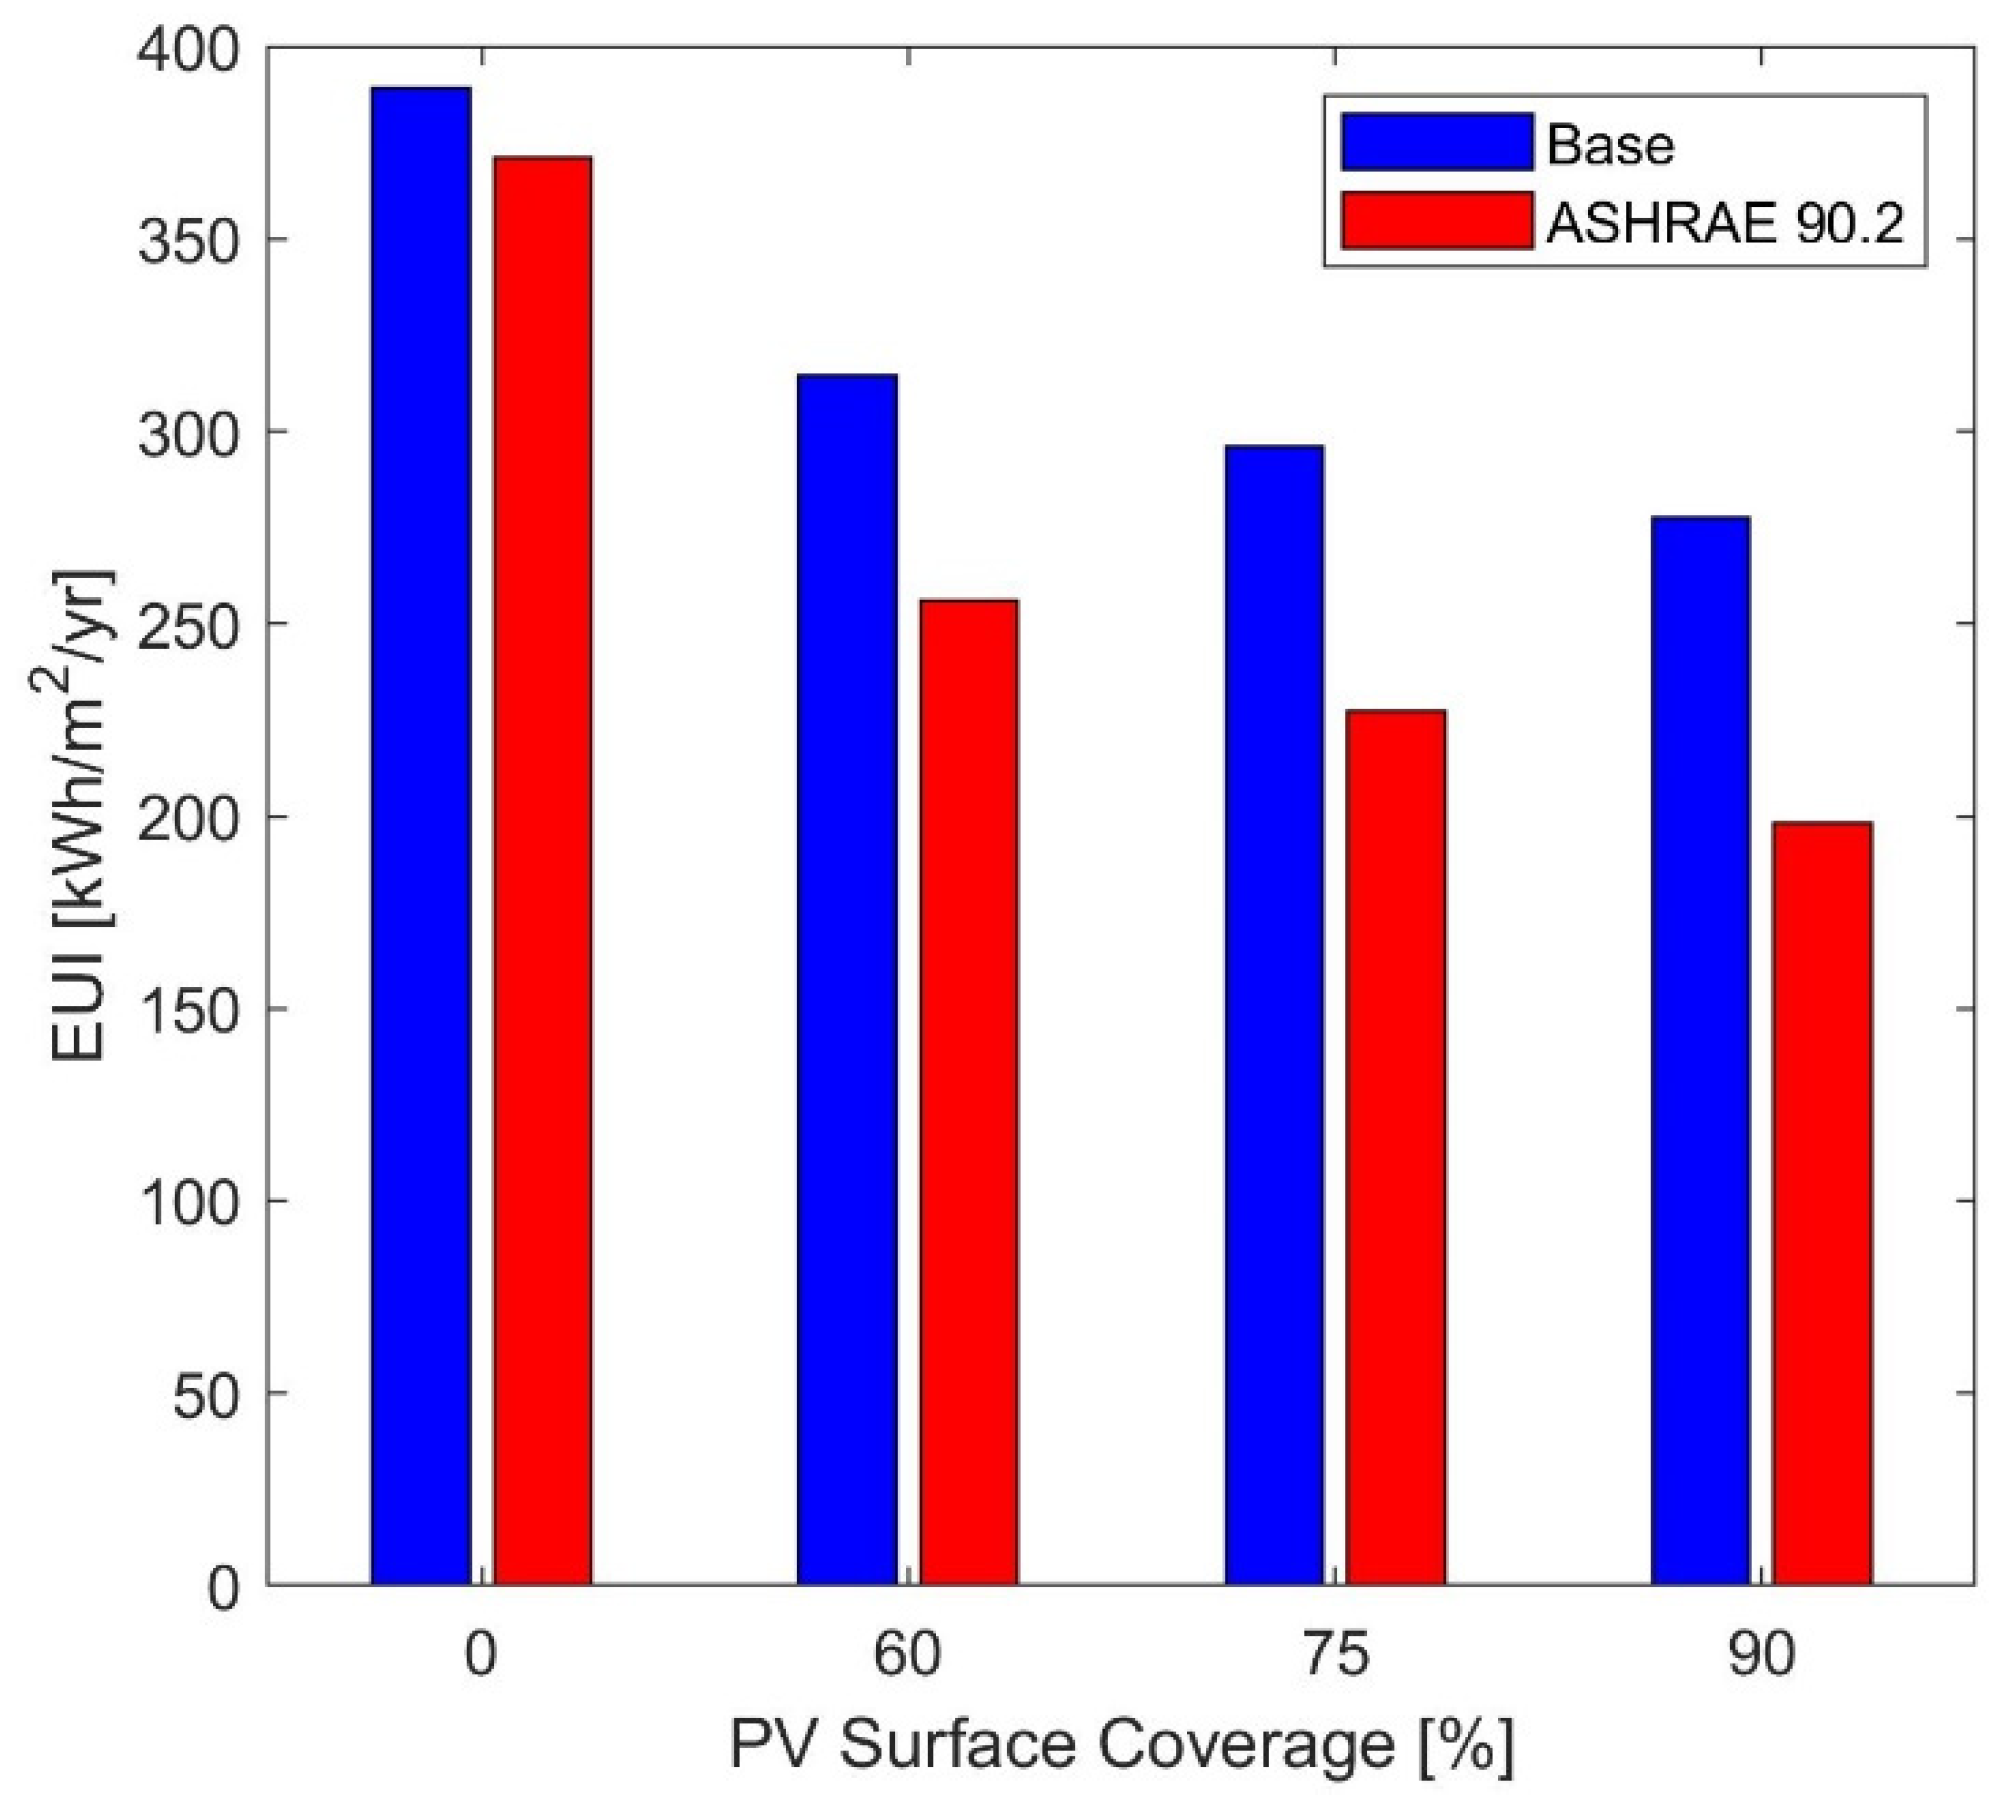
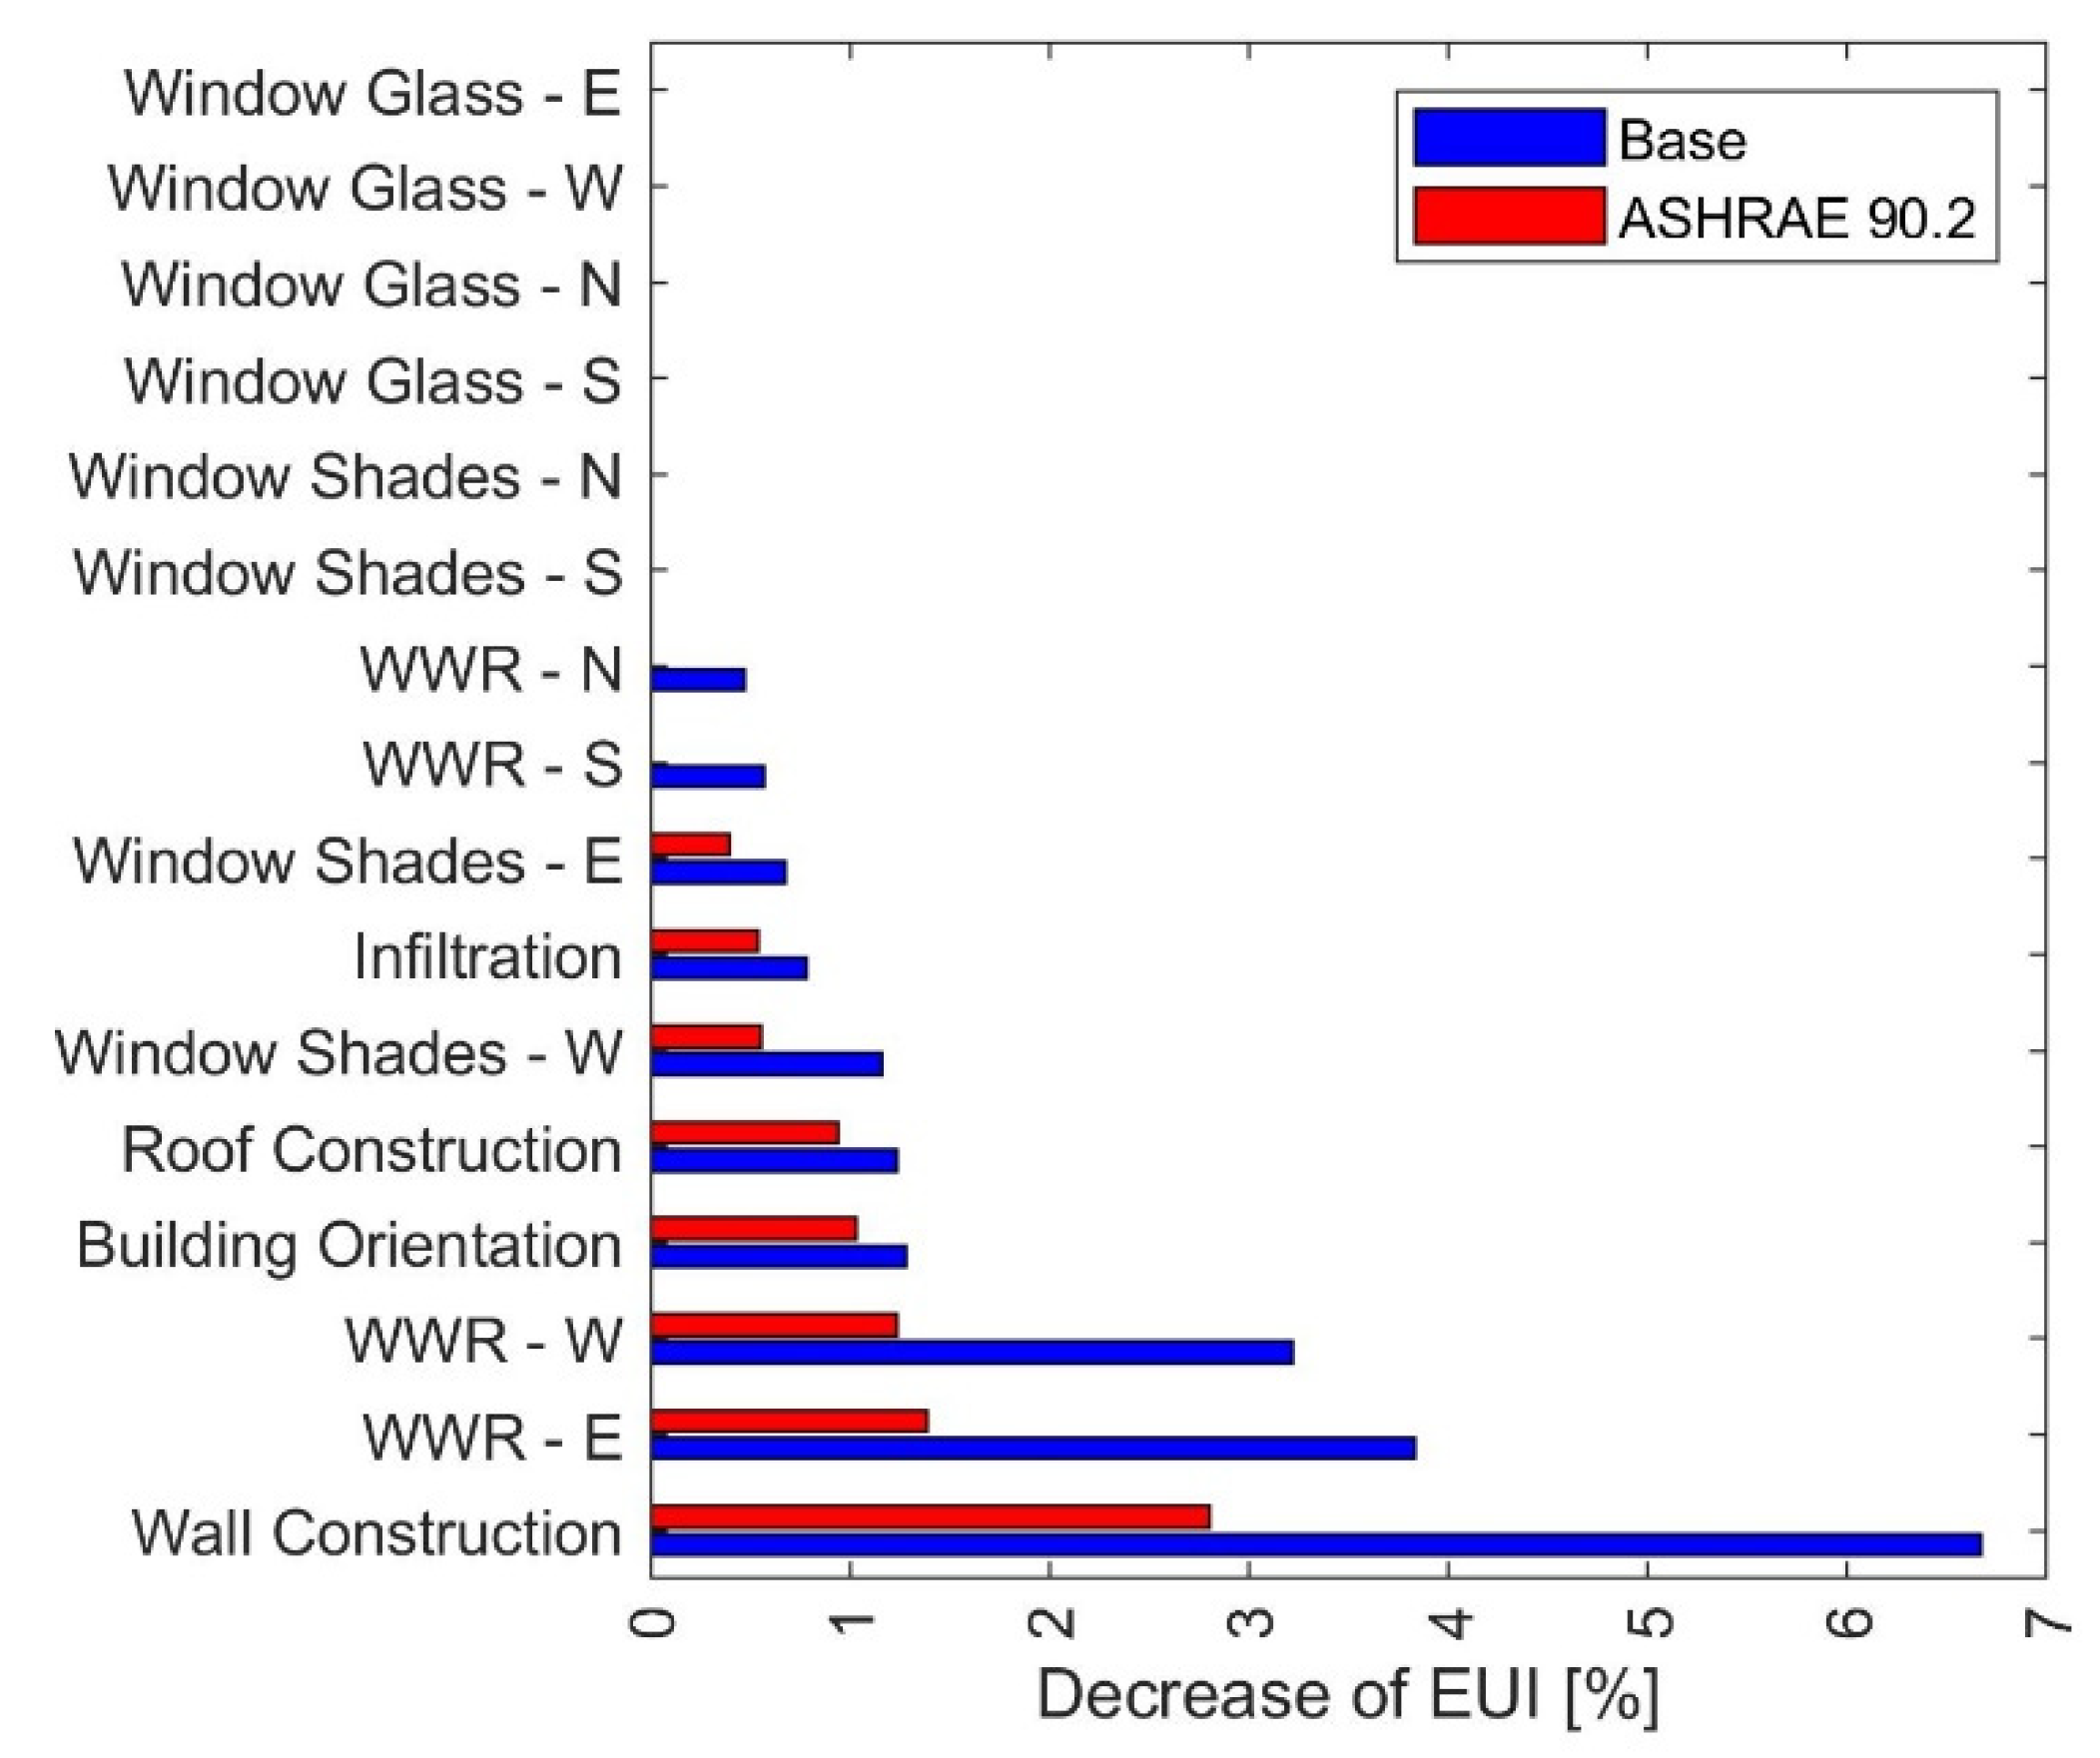
| Factors | Type | Increase Value EUI [kwh/m2/year] | Decrease Value EUI [kwh/m2/year] | Max EUI [kwh/m2/year] | Min EUI [kwh/m2/year] | Max EUI [%] | Min EUI [%] |
|---|---|---|---|---|---|---|---|
| Building Orientation | Passive | 0.07 | −12.53 | 389.07 | 376.47 | 0.02 | 3.22 |
| Window Wall Ratio—South | Passive | 3.81 | 0.00 | 392.81 | 389.00 | 0.98 | 0.00 |
| Window Wall Ratio—North | Passive | 19.04 | 0.00 | 408.04 | 389.00 | 4.89 | 0.00 |
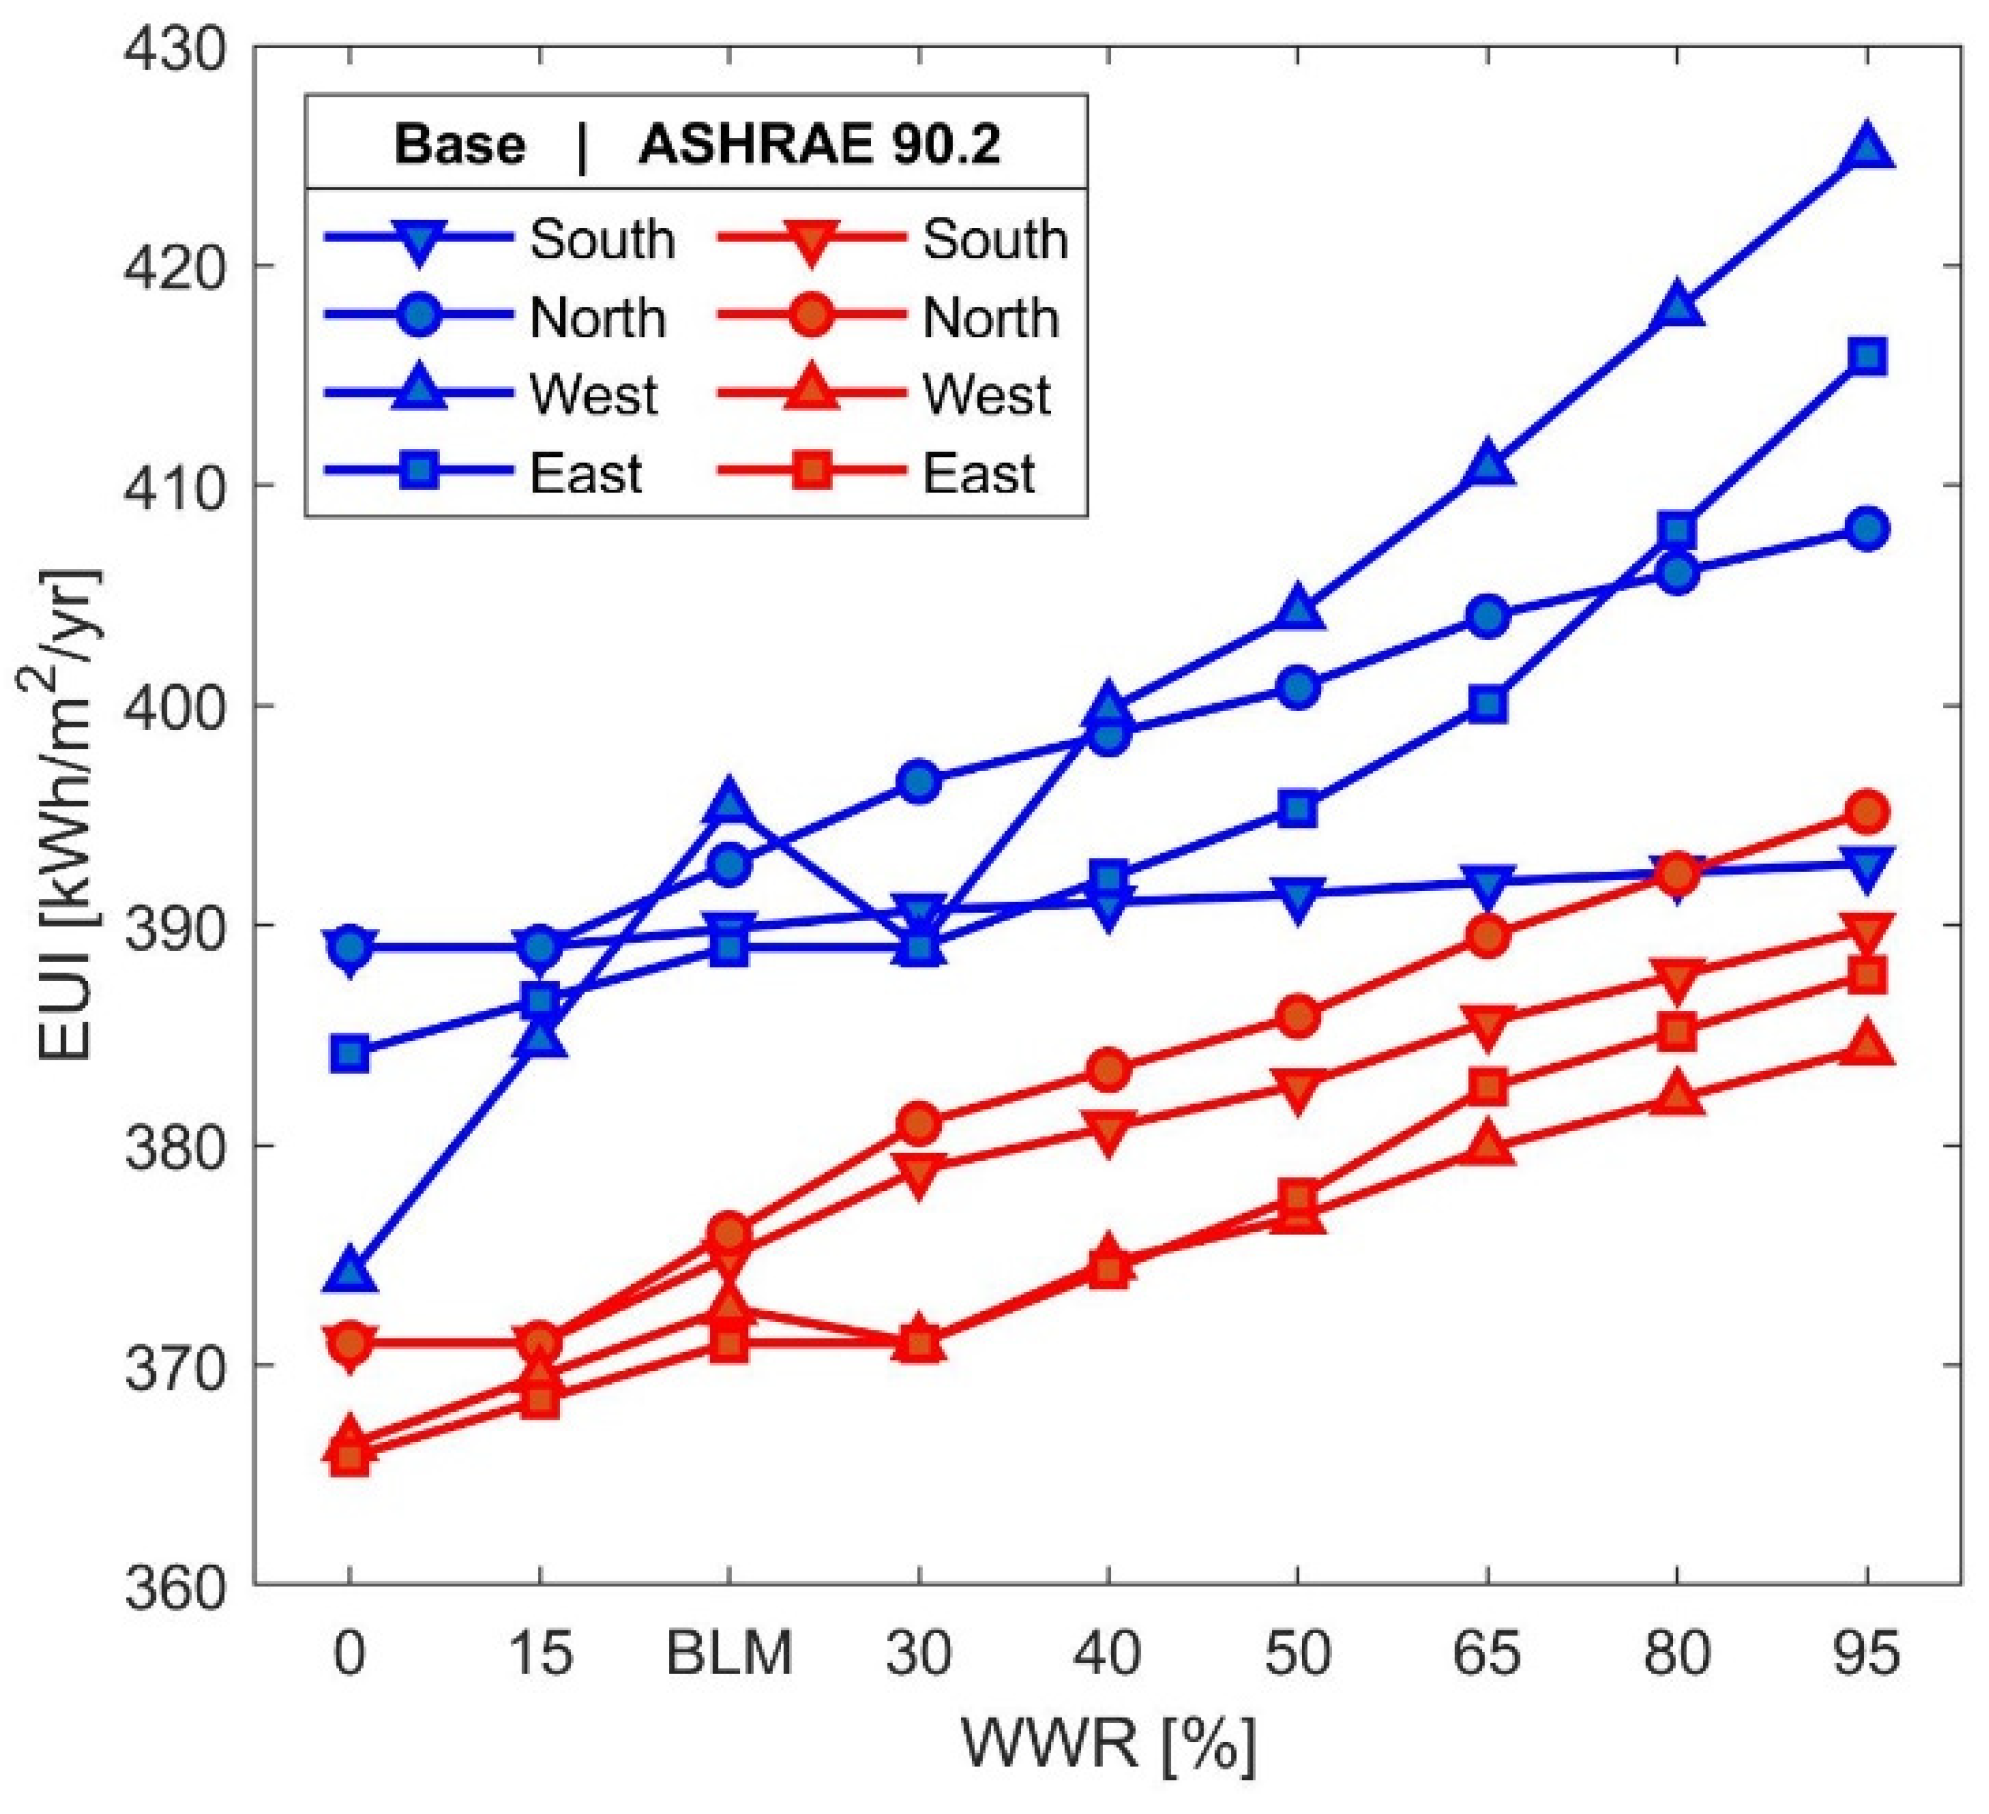
| Window Wall Ratio—West | Passive | 36.20 | −14.91 | 425.20 | 374.09 | 9.31 | 3.83 |
| Window Wall Ratio—East | Passive | 26.87 | −4.81 | 415.87 | 384.19 | 6.91 | 1.24 |
| Wall Construction | Passive | 0.00 | −25.94 | 389.00 | 363.06 | 0.00 | 6.67 |
| Window Shades—South | Passive | 0.07 | 0.00 | 389.07 | 389.00 | 0.02 | 0.00 |
| Window Shades—North | Passive | 0.07 | 0.00 | 389.07 | 389.00 | 0.02 | 0.00 |
| Window Shades—West | Passive | 4.87 | −2.63 | 393.87 | 386.37 | 1.25 | 0.68 |
| Window Shades—East | Passive | 0.00 | −1.83 | 389.00 | 387.17 | 0.00 | 0.47 |
| Roof Construction | Passive | 26.94 | −4.97 | 415.94 | 384.03 | 6.93 | 1.28 |
| Window Glass—South | Passive | 0.07 | 0.00 | 389.07 | 389.00 | 0.02 | 0.00 |
| Window Glass—North | Passive | 0.07 | 0.00 | 389.07 | 389.00 | 0.02 | 0.00 |
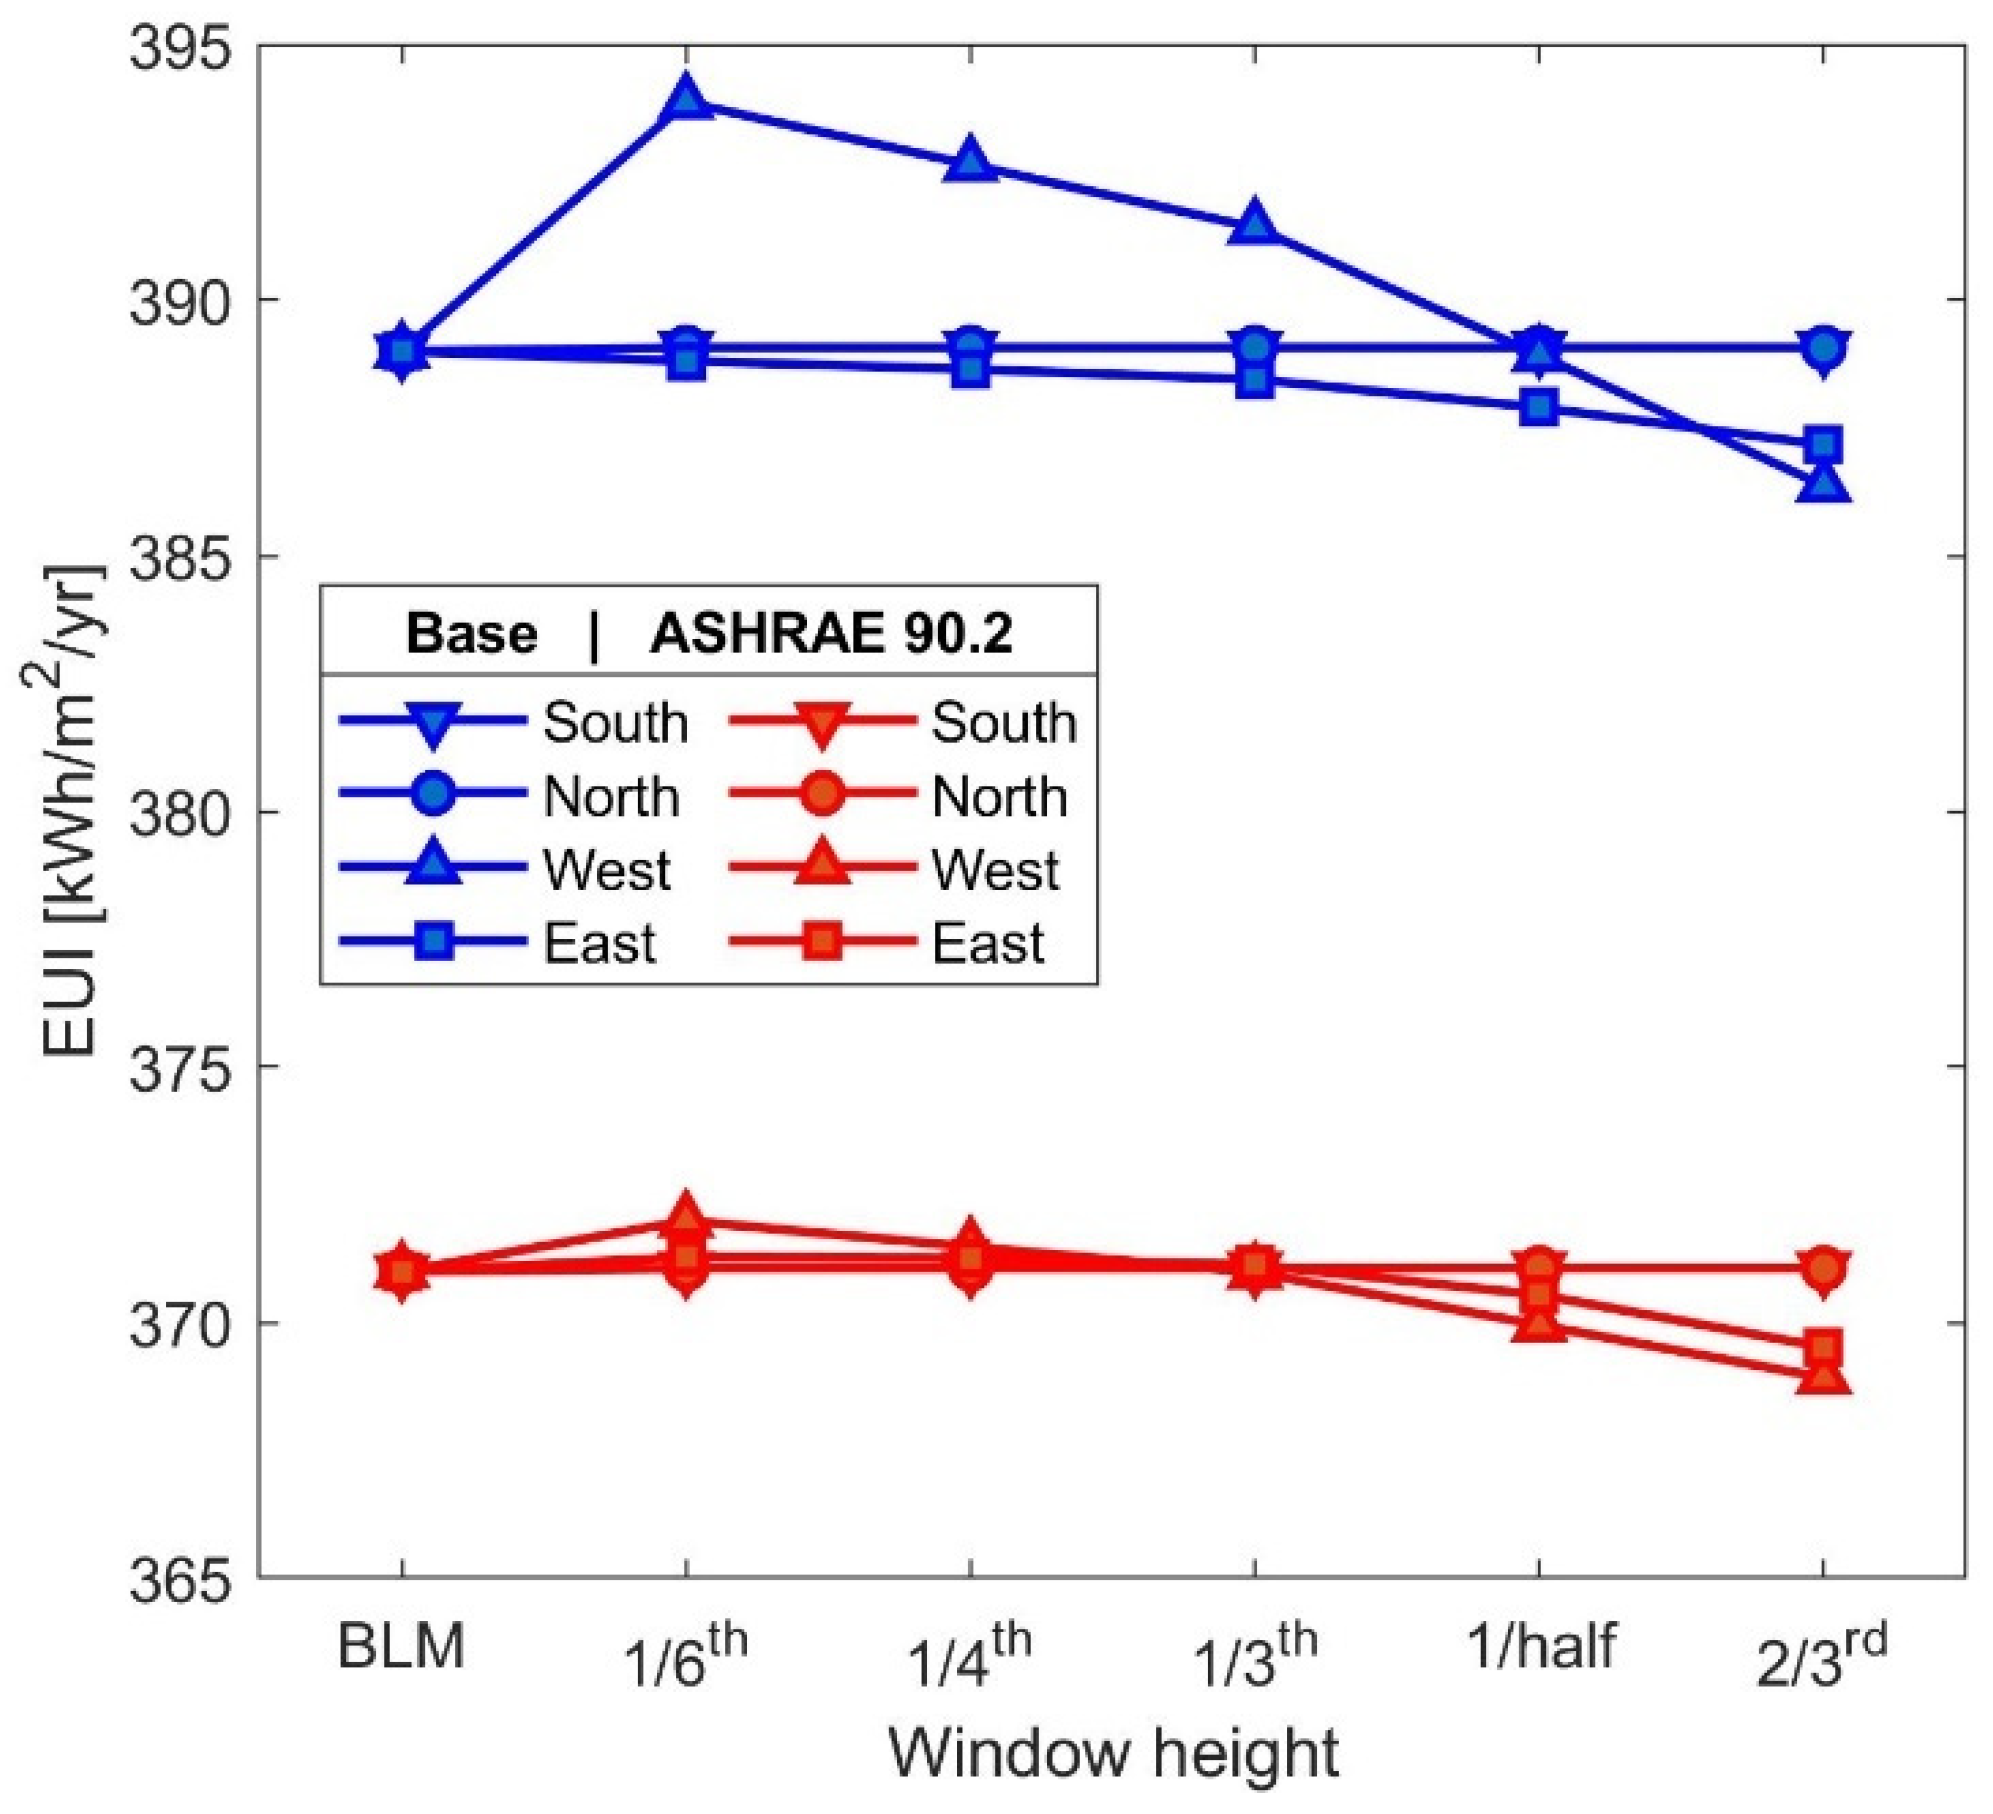
| Window Glass—West | Passive | 5.40 | −4.52 | 394.40 | 384.48 | 1.39 | 1.16 |
| Window Glass—East | Passive | 0.88 | −3.04 | 389.88 | 385.96 | 0.23 | 0.78 |
| Infiltration | Passive | 8.74 | −2.20 | 397.74 | 386.80 | 2.25 | 0.57 |
| Lighting Efficiency | Active | 52.55 | −33.00 | 441.55 | 356.00 | 13.51 | 8.48 |
| Plug Load Efficiency | Active | 12.22 | −75.82 | 401.22 | 313.18 | 3.14 | 19.49 |
| Operating Schedule | Active | 155.34 | −33.97 | 544.34 | 355.03 | 39.93 | 8.73 |
| PV—Surface Coverage | Active | 0.00 | −111.42 | 389.00 | 277.58 | 0.00 | 28.64 |
| Total | 8133.21 | 7448.41 |
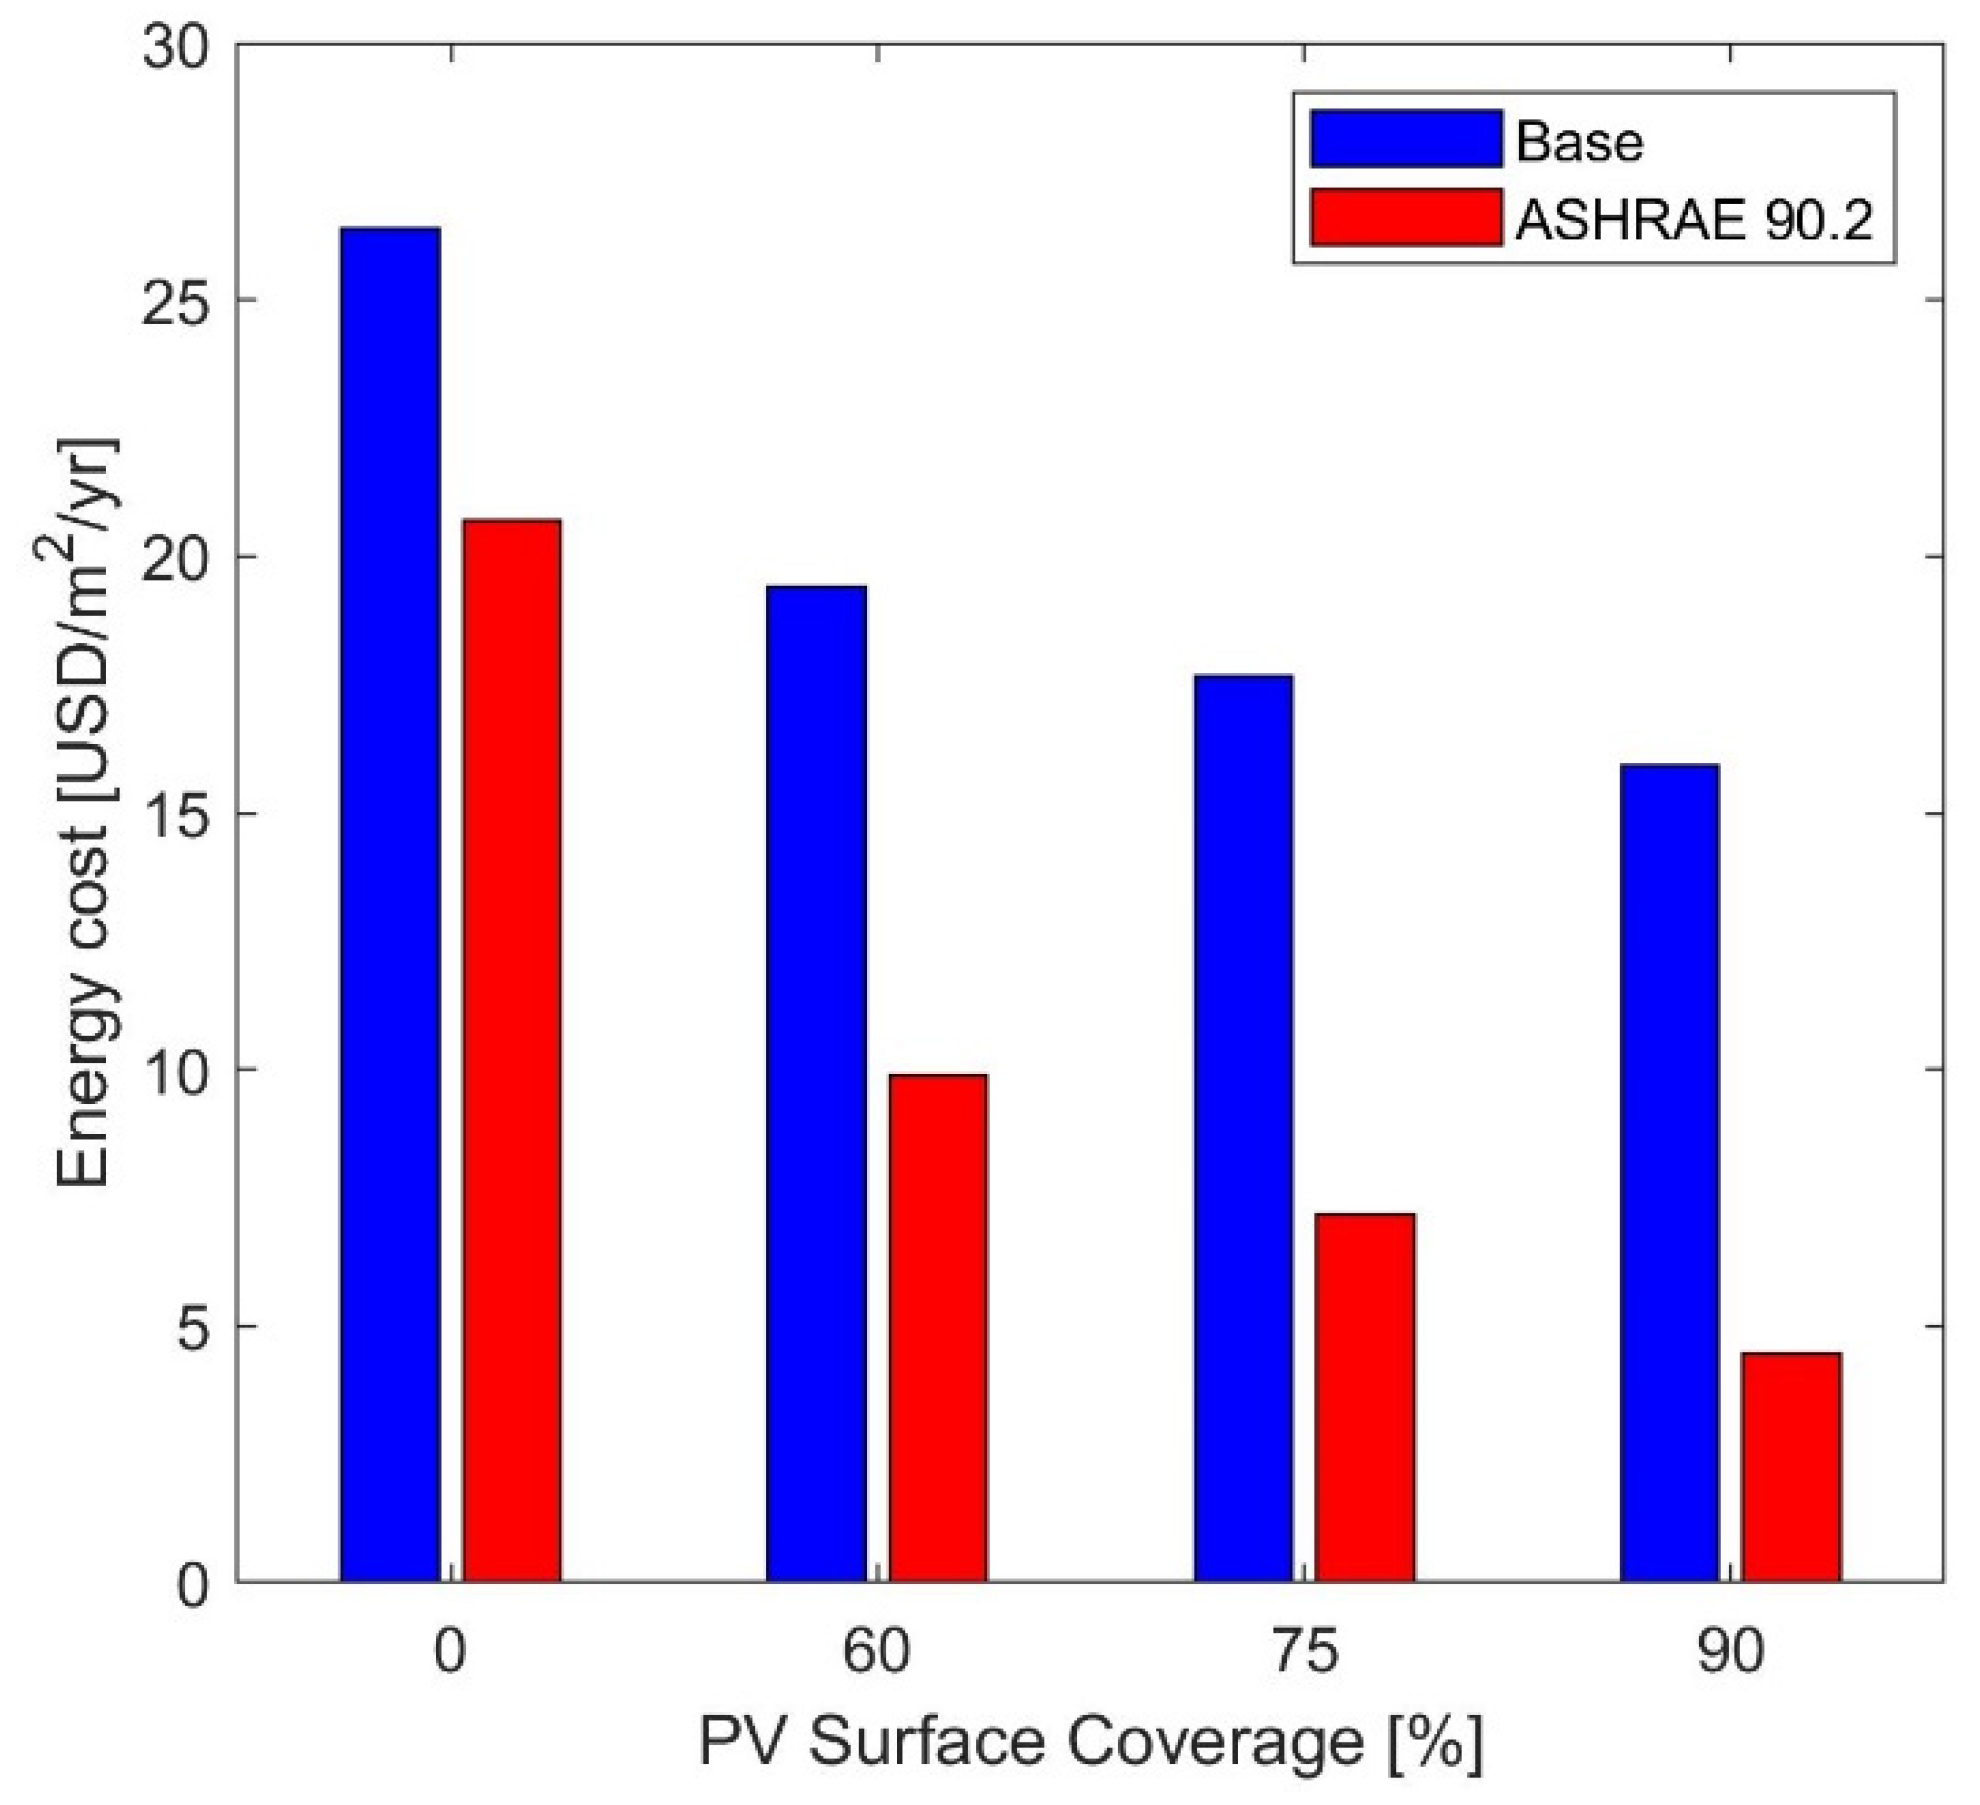
| Factors | Type | Increase Value EUI [USD/m2/year] | Decrease Value EUI [USD/m2/year] | Max Cost [USD/m2/year] | Min Cost [USD/m2/year] | Max [%] | Min [%] |
|---|---|---|---|---|---|---|---|
| Building Orientation | Passive | 0.01 | −1.18 | 26.41 | 25.22 | 0.04 | 4.47 |
| Window Wall Ratio—South | Passive | 0.36 | 0.00 | 26.76 | 26.40 | 1.36 | 0.00 |
| Window Wall Ratio—North | Passive | 1.79 | 0.00 | 28.19 | 26.40 | 6.78 | 0.00 |
| Window Wall Ratio—West | Passive | 3.40 | −1.14 | 29.80 | 25.26 | 2.88 | 4.32 |
| Window Wall Ratio—East | Passive | 2.53 | −0.45 | 28.93 | 25.95 | 9.58 | 1.70 |
| Wall Construction | Passive | 0.00 | −2.44 | 26.40 | 23.96 | 0.00 | 9.24 |
| Window Shades—South | Passive | 0.01 | 0.00 | 26.41 | 26.40 | 0.04 | 0.00 |
| Window Shades—North | Passive | 0.01 | 0.00 | 26.41 | 26.40 | 0.04 | 0.00 |
| Window Shades—West | Passive | 0.46 | −0.25 | 26.86 | 26.15 | 1.74 | 0.95 |
| Window Shades—East | Passive | 0.00 | −0.17 | 26.40 | 26.23 | 0.00 | 0.64 |
| Roof Construction | Passive | 2.53 | −0.47 | 28.93 | 25.93 | 9.58 | 1.78 |
| Window Glass—South | Passive | 362.67 | 362.60 | 26.41 | 26.40 | 0.04 | 0.00 |
| Window Glass—North | Passive | 362.67 | 362.60 | 26.41 | 26.40 | 0.04 | 0.00 |
| Window Glass—West | Passive | 368.00 | 358.08 | 26.91 | 25.98 | 1.93 | 1.59 |
| Window Glass—East | Passive | 363.48 | 359.56 | 26.48 | 26.11 | 0.30 | 1.10 |
| Infiltration | Passive | 0.82 | −0.21 | 27.22 | 26.19 | 3.11 | 0.80 |
| Lighting Efficiency | Active | 4.94 | −3.10 | 31.34 | 23.30 | 18.71 | 11.74 |
| Plug Load Efficiency | Active | 1.15 | −7.13 | 27.55 | 19.27 | 4.36 | 27.01 |
| Operating Schedule | Active | 11.82 | −2.19 | 38.22 | 24.21 | 44.77 | 8.30 |
| PV—Surface Coverage | Active | 0.00 | −10.47 | 26.40 | 15.93 | 0.00 | 39.66 |
| Total | 558.44 | 498.09 |
| Factors | Type | Increase Value EUI [kwh/m2/year] | Decrease Value EUI [kwh/m2/year] | Max EUI [kwh/m2/year] | Min EUI [kwh/m2/year] | Max EUI [%] | Min EUI [%] |
|---|---|---|---|---|---|---|---|
| Building Orientation | Passive | 0.86 | −3.81 | 371.86 | 367.19 | 0.23 | 1.03 |
| Window Wall Ratio—South | Passive | 18.82 | 0.00 | 389.82 | 371.00 | 5.07 | 0.00 |
| Window Wall Ratio—North | Passive | 24.16 | 0.00 | 395.16 | 371.00 | 6.51 | 0.00 |
| Window Wall Ratio—West | Passive | 13.42 | −4.59 | 384.42 | 366.41 | 3.62 | 1.24 |
| Window Wall Ratio—East | Passive | 16.73 | −5.17 | 387.73 | 365.83 | 4.51 | 1.39 |
| Wall Construction | Passive | 11.71 | −10.4 | 382.71 | 360.60 | 3.16 | 2.80 |
| Window Shades—South | Passive | 0.06 | 0.00 | 371.06 | 371.00 | 0.02 | 0.00 |
| Window Shades—North | Passive | 0.06 | 0.00 | 371.06 | 371.00 | 0.02 | 0.00 |
| Window Shades—West | Passive | 0.00 | −2.08 | 371.00 | 368.92 | 0.00 | 0.56 |
| Window Shades—East | Passive | 0.28 | −1.48 | 371.28 | 369.52 | 0.08 | 0.40 |
| Roof Construction | Passive | 41.65 | −3.50 | 412.65 | 367.50 | 11.23 | 0.94 |
| Window Glass—South | Passive | 0.06 | 0.00 | 371.06 | 371.00 | 0.02 | 0.00 |
| Window Glass—North | Passive | 0.06 | 0.00 | 371.06 | 371.00 | 0.02 | 0.00 |
| Window Glass—West | Passive | 22.78 | 0.00 | 393.78 | 371.00 | 6.14 | 0.00 |
| Window Glass—East | Passive | 17.14 | 0.00 | 388.14 | 371.00 | 4.62 | 0.00 |
| Infiltration | Passive | 7.72 | −2.02 | 378.72 | 368.98 | 2.08 | 0.54 |
| Lighting Efficiency | Active | 89.36 | −47.63 | 460.36 | 323.37 | 24.09 | 12.84 |
| Plug Load Efficiency | Active | 65.71 | −22.68 | 436.71 | 348.32 | 17.71 | 6.11 |
| Operating Schedule | Active | 123.05 | −30.06 | 494.05 | 340.94 | 33.17 | 8.10 |
| PV—Surface Coverage | Active | 0.00 | −172.64 | 371.00 | 198.36 | 0.00 | 46.53 |
| Total | 7873.63 | 7113.94 |
| Factors | Type | Increase Value EUI [USD/m2/year] | Decrease Value EUI [USD/m2/year] | Max Cost [USD/m2/year] | Min Cost [USD/m2/year] | Max [%] | Min [%] |
|---|---|---|---|---|---|---|---|
| Building Orientation | Passive | 0.02 | −0.36 | 20.72 | 20.34 | 0.10 | 1.74 |
| Window Wall Ratio—South | Passive | 1.77 | 0.00 | 22.47 | 20.70 | 8.55 | 0.00 |
| Window Wall Ratio—North | Passive | 2.27 | 0.00 | 22.97 | 20.70 | 10.97 | 0.00 |
| Window Wall Ratio—West | Passive | 1.26 | −0.43 | 21.96 | 20.27 | 6.09 | 2.08 |
| Window Wall Ratio—East | Passive | 1.57 | −0.49 | 22.27 | 20.21 | 7.58 | 2.37 |
| Wall Construction | Passive | 1.57 | −0.98 | 22.27 | 19.72 | 7.58 | 4.73 |
| Window Shades—South | Passive | 0.01 | 0.00 | 20.71 | 20.70 | 0.05 | 0.00 |
| Window Shades—North | Passive | 0.01 | 0.00 | 20.71 | 20.70 | 0.05 | 0.00 |
| Window Shades—West | Passive | 0.09 | −0.20 | 20.79 | 20.50 | 0.43 | 0.97 |
| Window Shades—East | Passive | 0.03 | −0.14 | 20.73 | 20.56 | 0.14 | 0.68 |
| Roof Construction | Passive | 3.91 | −0.33 | 24.61 | 20.37 | 18.89 | 1.59 |
| Window Glass—South | Passive | 368.37 | 368.30 | 20.71 | 20.70 | 0.05 | 0.00 |
| Window Glass—North | Passive | 368.37 | 368.30 | 20.71 | 20.70 | 0.05 | 0.00 |
| Window Glass—West | Passive | 373.70 | 363.78 | 22.84 | 20.70 | 10.34 | 0.00 |
| Window Glass—East | Passive | 369.18 | 365.26 | 22.31 | 20.70 | 7.78 | 0.00 |
| Infiltration | Passive | 0.73 | −0.19 | 21.43 | 20.51 | 3.53 | 0.92 |
| Lighting Efficiency | Active | −0.51 | −4.48 | 20.19 | 16.22 | 2.46 | 21.64 |
| Plug Load Efficiency | Active | 6.18 | −2.13 | 26.88 | 18.57 | 29.86 | 10.29 |
| Operating Schedule | Active | 8.90 | −1.74 | 29.60 | 18.96 | 43.00 | 8.41 |
| PV—Surface Coverage | Active | 0.00 | −16.23 | 20.70 | 4.47 | 0.00 | 78.41 |
| Total | 445.58 | 386.30 |
Disclaimer/Publisher’s Note: The statements, opinions and data contained in all publications are solely those of the individual author(s) and contributor(s) and not of MDPI and/or the editor(s). MDPI and/or the editor(s) disclaim responsibility for any injury to people or property resulting from any ideas, methods, instructions or products referred to in the content. |
© 2025 by the authors. Licensee MDPI, Basel, Switzerland. This article is an open access article distributed under the terms and conditions of the Creative Commons Attribution (CC BY) license (https://creativecommons.org/licenses/by/4.0/).
Share and Cite
Macas-Espinosa, V.; Portilla-Sanchez, I.; Gomez, D.; Hidalgo-Leon, R.; Barzola-Monteses, J.; Soriano, G. Assessment of the Energy Efficiency and Cost of Low-Income Housing Based on BIM Considering Material Properties and Energy Modeling in a Tropical Climate. Energies 2025, 18, 1500. https://doi.org/10.3390/en18061500
Macas-Espinosa V, Portilla-Sanchez I, Gomez D, Hidalgo-Leon R, Barzola-Monteses J, Soriano G. Assessment of the Energy Efficiency and Cost of Low-Income Housing Based on BIM Considering Material Properties and Energy Modeling in a Tropical Climate. Energies. 2025; 18(6):1500. https://doi.org/10.3390/en18061500
Chicago/Turabian StyleMacas-Espinosa, Vicente, Israel Portilla-Sanchez, David Gomez, Ruben Hidalgo-Leon, Julio Barzola-Monteses, and Guillermo Soriano. 2025. "Assessment of the Energy Efficiency and Cost of Low-Income Housing Based on BIM Considering Material Properties and Energy Modeling in a Tropical Climate" Energies 18, no. 6: 1500. https://doi.org/10.3390/en18061500
APA StyleMacas-Espinosa, V., Portilla-Sanchez, I., Gomez, D., Hidalgo-Leon, R., Barzola-Monteses, J., & Soriano, G. (2025). Assessment of the Energy Efficiency and Cost of Low-Income Housing Based on BIM Considering Material Properties and Energy Modeling in a Tropical Climate. Energies, 18(6), 1500. https://doi.org/10.3390/en18061500