Abstract
In order to improve wind power prediction accuracy and increase the utilization of wind power, this study proposes a novel complete ensemble empirical mode decomposition with adaptive noise (CEEMDAN)–variational modal decomposition (VMD)–gated recurrent unit (GRU) prediction model. With the goal of extracting feature information that existed in temporal series data, CEEMDAN and VMD decomposition are used to divide the raw wind data into several intrinsic modal function components. Furthermore, to reduce computational burden and enhance convergence speed, these intrinsic mode function (IMF) components are integrated and rebuilt via the results of sample entropy and K-means. Lastly, to ensure the completeness of the prediction outcomes, the final prediction results are synthesized through the superposition of all IMF components. The simulation results indicate that the proposed model is superior to other models in accuracy and robustness.
1. Introduction
With the declining availability of fossil fuels, the development of new energy has become increasingly important. Wind power, as an environmentally friendly new energy, has emerged as an essential part of the power grid. Global wind power capacity witnessed a landmark expansion in 2023, with over 100 GW of new installations commissioned, including 105.6 GW of onshore and 10.8 GW of offshore wind power capacity [1]. However, large-scale grid connection of wind power has posed a runnable challenge to the security and stability of the power system thanks to its high randomness and uncertainty [2]. Furthermore, wind power prediction is the primary task for the grid-connected wind farm, which can reduce the occurrence of wind abandonment and also provide the basis for the daily power generation plan of the wind farm [3]. As a result, highly accurate wind power prediction is especially important for the safe operation of the power grid.
Nowadays, study methods of wind power prediction can be generally classified into three groups: (1) Physical models, which are typically adjusted to varying meteorological conditions. A simple and robust wind power forecasting approach is proposed in [4], in which the study presented advanced numerical weather prediction (NWP) models with mesoscale resolution. Physical models usually enable coping with normal weather in the short term. However, physical models are subject to a large degree of variation in the face of extreme weather. (2) Statistical models rely on the quality of data to quantify the relationship between the time series and discrete geographic information. Conventional statistical approaches for short-term wind power forecasting can be categorized into the autoregressive moving average (ARMA) model [5], the autoregressive integrated moving average (ARIMA) model [6], the random forest (RF) model [7], and the hidden Markov model [8]. (3) Traditional machine learning refers to a set of algorithms and techniques that were developed before the rise of deep learning. These methods rely heavily on feature engineering, where domain experts manually extract relevant features from raw data to feed into the models. These features are then used by the algorithms to learn patterns and make predictions. Traditional machine-learning models generally are used for both classification and regression, which mainly include support vector machine (SVM) [9], the multilayer perceptron (MLP) [10], K-nearest neighbors (KNN) [11], etc. For instance, a wind power outlier detection combinatorial model was proposed that combines traditional machine learning with an optimization algorithm to seek the global optimal solution [12]. In summary, these approaches can only be used to analyze the linear mapping between time and wind power, but they cannot extract the spatial and temporal characteristics of wind power data well.
With the aim of tackling the issues of wind power forecasting uncertainty and intermittency, a data-preprocessing method for improving data quality has emerged in machine-learning prediction. Specifically, it can precisely capture the data feature and decrease data noise by decomposing time series data. Common signal pre-processing methods employed in the literature include empirical mode decomposition (EMD) [13], variational mode decomposition (VMD) [14], seasonal-trend decomposition using Loess (STL) [15], and wavelet transform [16]. These techniques are used to enhance signal characteristics prior to further analysis or modeling. For example, an EMD with long short-term memory (LSTM) was proposed in [17] that can reduce the complexity and non-stationary of the series.
To further improve the accuracy of wind power prediction, a hybrid prediction model was developed with time series decomposition and deep-learning methods. In reference [18], a combined model accounting for spatio-temporal features was associated with the application of VMD in different scenarios. A sine algorithm dung beetle optimization–long short-term memory neural network (MSADBO-LSTM) prediction model was introduced in [19], where the dung beetle optimization (DBO) algorithm is employed for global hyperparameter optimization of an LSTM network. In reference [20], Li, Z et al. proposed a deep feature extraction model by a convolutional neural network (CNN)-LSTM to capture the feature links between wind power data and superimpose the prediction results of each reconstructed component to obtain the final wind power prediction value. Ren, J. et al. [21] introduced a CNN-LSTM based on an attention mechanism, and the CNN-LSTM and light gradient-boosting machine (LightGBM) are used to make parallel predictions with the test set. Liu, T. et al. [22] proposed an improved GRU that used two update gate weight matrices to replace the traditional update gate weight matrix of the GRU network. In these specific applications, both LSTM and GRU show good performances. Compared to LSTM and CNN-LSTM, GRU has a simple architecture with reduced overfitting risk and strong adaptive feature learning ability. GRU has also been superior to CNN-LSTM and LSTM in some cases [23,24]. In reference [25], an adaptive fractional order generalized Pareto motion (FOGPM) model based on an orthogonalized maximal information coefficient (OMIC) is proposed to enhance real-time wind farm prediction accuracy. A strong feature extraction capability, which was found in the LightGBM model, was applied to complex and variable wind power data [26]. The LightGBM model can greatly obtain the nonlinear characteristics of wind farms. The hyperparameters of the decomposition approach usually depend on the experience of experts to adjust, thus exhibiting significant prediction bias when applied to diverse datasets. Zhao, M. et al. [26] proposed a multi-step short-term wind power prediction model based on complete ensemble empirical mode decomposition (CEEMD) and an improved snake optimization algorithm that can enable strong disaggregation of data by tuning the hyperparameters of CEEMD. In reference [27], the CEEMDAN is used for wind power time series decomposition. Subsequently, the LSTM was used to predict the subsequence that was decomposed by CEEMDAN. The model achieved good prediction results, but it provides few validation cases. Tan, Y. et al. [28] proposed a hybrid prediction model based on improved complete ensemble empirical mode decomposition with adaptive noise (ICEEMDAN); ICEEMDAN can decrease the pseudo-multimodal in the sub-sequence to achieve more accurate subsequences. In reference [29], ICEEMDAN is introduced for the decomposition of raw data, and multiple decomposed sequences combined with meteorological data are fed into the TimeNet deep-learning model. Compared to other decompositions, ICEEMDAN and CEEMDNA introduce adaptive random noise, which avoids the interference of residual noise and effectively extracts the sequence information of complex data.
Consequently, achieving higher accuracy in wind power prediction is key to reducing wind energy waste and improving the efficiency of wind power capacity. This study aims to propose a model that does not rely on NWP data, which still maintains high prediction accuracy. The modeling framework is illustrated below. First, decomposing the original wind power time series by complete ensemble empirical mode decomposition with adaptive noise (CEEMDAN). Compared to other decomposition methods, the CEEMDAN method balances the noise of each component by incorporating a limited amount of white noise. This approach effectively minimizes reconstruction errors, leading to optimal completeness and robustness in the decomposition process. Next, in order to further improve the accuracy of feature extraction, sample entropy is computed for each intrinsic mode function (IMF), and K-means clustering is applied to group IMFs based on these entropy values. Subsequently, IMFs are clustered into distinct groups based on their K-means labels (K-values), and those within the same cluster are aggregated through linear superposition to form reconstructed sub-sequences (). To enhance feature resolution, the sub-sequence exhibiting the maximum sample entropy is subjected to secondary VMD, which further segregates high-frequency noise from deterministic components. Finally, each decomposed sub-signal is independently fed into a gated recurrent unit (GRU) network for prediction. To prove the effectiveness of this model, its performance is compared with other advanced prediction models such as LSTM, CNN, and GRU, and its parameters are also systematically tuned for fair comparison. Therefore, the model is named CEEMDAN-VMD-GRU. The main contributions of this article are as follows:
- (1)
- A novel CEEMDAN-VMD cascade decomposition is introduced with the stated objective of suppressing high-frequency noise and mode mixing, ultimately enhancing feature separability;
- (2)
- An adaptive modal component fusion technique is proposed, leveraging sample entropy and K-means clustering, to achieve a reduction in computational complexity. Specifically, sample entropy is used to characterize the modal components, and K-means clustering groups these components based on their entropy values, enabling an efficient and adaptive fusion strategy;
- (3)
- Compared to data that deviates from the training dataset, the learned complex system can provide relatively more reasonable data processing. In this context, it can enhance the stability of deep learning in wind power time series forecasting.
The remainder of this paper is organized as follows. Section 2 focuses on the detailed computational process of model composition and related algorithms. Section 3 focuses on the specific process of the experiment and the design of the dataset. Section 4 mainly introduces the experimental dataset, the evaluation indexes, the prediction results, and the analysis of the results. Section 5 is the conclusions and the direction of future research.
2. Materials and Methods
2.1. CEEMDAN
CEEMDAN, which has its roots in EMD, uses ensemble averaging along with the adaptive addition of Gaussian white noise to suppress mode mixing. The decomposition process is characterized by its inherent completeness and nearly error-free reconstruction. EMD is an adaptive signal decomposition method used to decompose complex signals into a series of IMFs. However, EMD has a lot of problems, such as sifting criterion, endpoint effect, mode mixing, and so on. Generally, mode mixing will result in IMF components having unclear physical interpretations and affect the next analysis [30]. To address the problem, CEEMDAN introduces the concept of adaptive noise. After each EMD decomposition, white noise is added to the signal, and then, EMD decomposition is performed again. The inherent randomness of white noise introduces slight variations in the results of each decomposition [31]. To mitigate modal aliasing and obtain more accurate IMFs, the investigators propose averaging the results of multiple decompositions. After the above processing steps, the CEEMDAN improves these problems, such as modal confounding and reconstruction errors. Compared to WT, EMD, EEMD, and CEEMD, the CEEMDAN has higher completeness and stronger data feature extraction ability. When using the CEEMDAN algorithm to decompose noisy signals, it is important to note that, if the IMF components with more noise are directly discarded, it is easy to cause the loss of effective information. Therefore, other denoising methods need to be used to denoise the high-frequency IMF components with more noise. Finally, the denoised IMF components and the original IMF components are reconstructed to obtain the denoised signal. After the above processing steps, the CEEMDAN decomposition is shown in Figure 1.
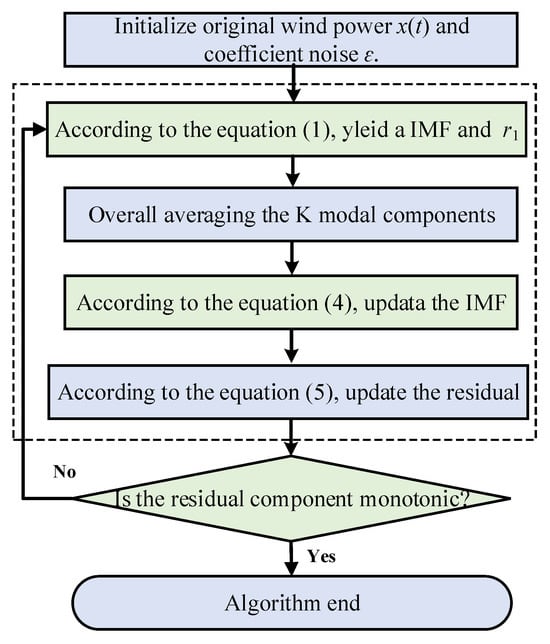
Figure 1.
Flowchart of the decomposition process of CEEMDAN.
Define to be the sequence of historical wind power data, and Gaussian white noise with a normal distribution is added to the original signal to obtain the preprocessed sequence. The is the value after experiencing k iterations, as shown in Equation (1).
where is the coefficient of noise and is the i of noise sequence.
The input sequence is decomposed using EMD to obtain the first EMD decomposition component. The mean value of this component is taken as the decomposed signal component, and the residual component is calculated, as shown in Equations (2) and (3).
where the first IMF is decomposed by CEEMDAN, and the signal component that is decomposed by EMD is the residual quantity.
To update the above steps, the j-th residual component is added to the corresponding Gaussian white noise, and EMD is then applied to decompose the residual signal. This results in the decomposed signal component and residual component, as shown in Equations (4) and (5).
where is the j of IMF that decomposed by CEEMDAN, is the signal component that decomposed by EMD, and is the residual quantity.
The iteration continues until the polar values fall below a threshold of 2 and the circuit of CEEMDAN can be terminated. At this point, the original signal is decomposed into K signal components and a residual component r(t), as shown in Equation (6).
where is the residual component, is the i-th of the signal component.
2.2. Sample Entropy
Sample entropy is an indicator for measuring the complexity of the time series, which measures the complexity of data by calculating the distance between adjacent data points in time series data. The feature similarity among IMF sequences is closely tied to the sample entropy, where a smaller sample entropy value allows for improved feature extraction from the decomposed sequences [32].
Generally, for a time series with N data points, the sample entropy calculation is performed according to the method outlined below:
where is m successive values of x.
Determine the maximum absolute difference between any two elements within an m-dimensional vector for assessing the relevance of elements.
where and are different m-dimensional vectors.
Counting how many other () are within the distance r, call this result as and repeat this for every . Thereafter, count how many other (j ≠ i) are within the distance r, call this result as , and follow the same pattern.
The definitions are as follows in Equations (9) and (10):
In this way, is the probability that two sequences match m points under a similarity tolerance r, and is the probability that two sequences match m+1 points. Sample entropy is defined as follows in Equation (11). Additionally, it can be estimated by the following Equation (12) when N is a finite sample.
2.3. K-Means Algorithm
The k-means algorithm is an unsupervised iterative clustering method designed to partition a dataset into K clusters , and randomly select k samples from the sample set as cluster centers. In the iteration section, calculate the distance between all samples and these k “cluster centres”. The calculation method is as follows:
where d is the Euclidean distance between the samples and “cluster centres”, is the sample data, and is “cluster centres”.
In refs. [33,34], each sample is divided into the cluster with the closest . Equation (14) shows the updated formulation for seeking the new “cluster centres”.
where is the clusters, and t denotes the iteration index.
In the selection of a K value, if there is no prior knowledge, a suitable k-value can be selected through cross-validation and the K-means algorithm only requires parameter tuning for K. At the same time, the algorithm has a fast convergence speed. The quality of the cluster results depends on the density of clusters and the differences between clusters. The flowchart of the K-means algorithm is shown in Figure 2.
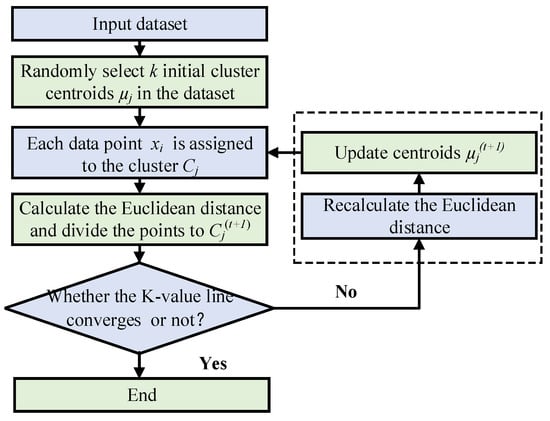
Figure 2.
Flowchart of K-means method.
2.4. VMD Quadratic Decomposition of Complex Sequences
VMD offers several advantages over traditional signal decomposition methods like EMD, including a rigorous mathematical foundation, robustness to noise and mode mixing, improved convergence, and well-defined parameters. These advantages make it a preferred choice for applications requiring reliable, interpretable, and efficient signal decomposition in a variety of fields. However, it is crucial to properly select the parameters for VMD to get the best performance for each use case. In reference [35], the experimental results have shown that this method is more robust in terms of sampling and noise. Due to the strong randomness of the wind power time series [36], modal aliasing and noise interference can occur in the process of CEEMDAN. Next, we introduced the VMD to address the problem. By using this method, we can further increase the identification rate of data features and the model’s accuracy.
The boundary constraint equation for VMD is shown below:
where is the Dirac function, is the partial derivative operator, and is the convolution.
A quadratic penalty factor and a Lagrange multiplication operator that transforms constrained variational problems into unconstrained variational problems are shown in Equation (15).
where is the quadratic penalty factor and is Lagrange multiplication.
The alternating direction multiplier method is used to update , , , and are shown in Equations (16)–(18).
where is the noise tolerance, and , , , and are the Fourier transform of , , , and .
2.5. GRU Prediction Framework
A GRU mainly consists of two core gate controls: the reset gate () and the update gate () [37]. From the structure, it can be seen that GRU is simplified by the LSTM recurrent neural network. The main difference between GRU and LSTM is that GRU does not include cell state and forgetting gates, which makes GRU simpler and model training faster. Moreover, GRU can better catch long-term dependencies in data because it can selectively forget previous hidden states. Evidently, GRU can choose long-term memory or discard erroneous information that affects prediction. GRUs mitigate the vanishing gradient problem inherent in deep learning. The update gate within the GRU controls the retention or deletion of data information, while the reset gate regulates the level of data forgetting. The structural expression of this model is as follows:
where is input time series, is cell vector, is the weight matrix of the update gate, is the weight matrix of the reset gate, is the hidden state passed to the next moment, is the candidate latent variable that can weaken the impact of past information on the current moment, is Sigmoid activation function, is the Hadamard product of two states, and , , and are the bias terms of the update gate and reset gate and the content storage.
3. Construction of Proposed Hybrid Model
The short-term forecasting model of wind power based on CEEMDAN–K-means–VMD–GRU is completed, and the prediction process is shown in Figure 3.
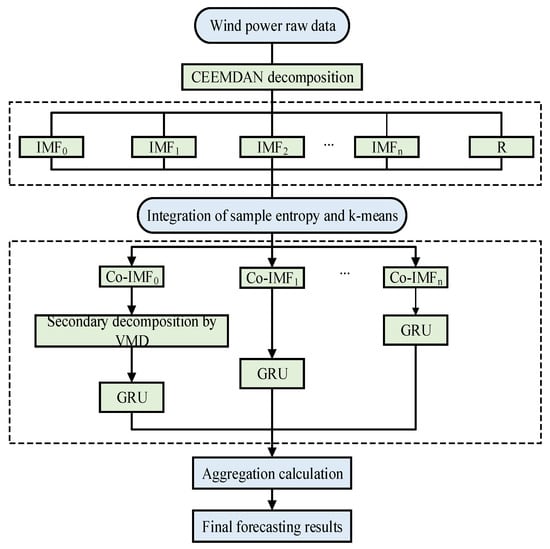
Figure 3.
Forecasting flowchart of the combined CEEMDAN–K-means–VMD–GRU model with dual decomposition and entropy-based clustering.
- (1)
- The original wind power sequence is first split into training and testing datasets and then subjected to CEEMDAN decomposition;
- (2)
- The optimal number of components is then experimentally determined using sample entropy and reconstruction error as the criteria. Subsequently, the sequence is decomposed into a predefined number of sub-components and a single residual component;
- (3)
- The K-means algorithm is used to cluster ordered components with similar feature patterns and to integrate sub-sequences (−) with the same K-value, and the components are divided into high-frequency oscillation signals () and low-frequency stable signals. Compared with other integrated IMFs, the still has large amounts of uncertain information, and it can confuse feature expression and affect prediction accuracy;
- (4)
- In order to achieve a more thorough feature extraction, this approach employs a second VMD decomposition on the high-frequency sequences, which are then used for GRU prediction, thereby facilitating the following sequence reconstruction;
- (5)
- The results of each ordinal component are superimposed to obtain the final fit result. These results are analyzed in relation to the actual values and compared with other methods.
4. Experimental Validation and Analysis of Results
4.1. Data Description and Evaluation Indexes
The wind power dataset was obtained from ENTSO-E, sourced from the German power company (Essen, Germany) 50 Hertz. The data were collected from 23 August 2019 to 22 September 2020 with a collection frequency of 15 min/time. A total of 397 days with 38,112 samples were selected for training. The dataset exhibits outliers or missing values, demonstrating high completeness, as it is directly sourced from the company’s operating wind power system, and the raw wind power data are shown in Figure 4. It can be seen that the points are so irregular that conventional forecasting methods are unable to predict them at all.

Figure 4.
Original wind power sequence.
To keep the dimensionality of the data consistent, minimize the impact of singular values on the model, avoid gradient ablation, and increase computational efficiency. The study cites data normalization before prediction. The normalization formula is shown as follows:
where is the normalized data, y is the raw data values, and and are the maximum and minimum values.
To evaluate the prediction accuracy of the proposed model, use four indexes: root mean square error (RMSE), mean absolute percentage error (MAPE), mean absolute error (MAE), and coefficient of determination (R2). These calculation formulas are as follows:
where n is the total number of samples, is the actual value of wind power data, is the predicted value of wind power data, and is the average of actual values of wind power data.
4.2. Experimental Process
4.2.1. Data Analysis and Preprocessing
Due to the uncertainty and stochastic nature of wind power forecasts, this experiment chooses peak and trough time periods of wind power to verify the feasibility of the model. The peak electricity consumption data are roughly centered on December 2019 through March 2020, and the electricity consumption trough data are roughly concentrated from March 2020 to July 2020.
In the preprocessing, the CEEMDAN method is used to accurately extract the features of the data and get the subsequence with high feature regularity to improve the accuracy of data prediction. The subsequences decomposed by CEEMDAN are shown in Figure 5 and Figure 6. From the decomposition results in Figure 5, the IMF13 component of the original wind power sequence decomposed by CEEMDAN has a small amplitude and frequency compared with the raw wind power data, which can explicitly map the trend inherent in the data. Following the decomposition, the signal curves of the resulting sequence components exhibit an increasing trend toward stability and demonstrate a defined periodicity.
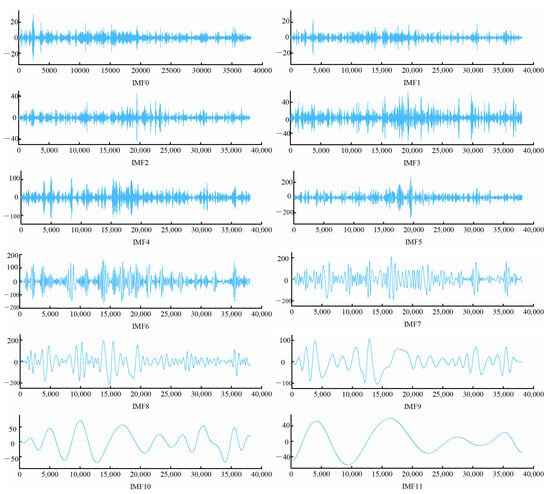
Figure 5.
CEEMDAN decomposition results.

Figure 6.
Residual decomposition results by CEEMDAN.
4.2.2. Correlation Construction Process for Subsequences
To further the intrinsic features of the sequence, the sample entropy of sub-sequences can indicate the extent of the correlation between the component and the original component, and the results of the calculations are shown in Table 1. It can be seen that the ordered components, which have the same K value, can be clustered into three groups, namely ‘Co-IMF0’, ‘Co-IMF1’, and ‘Co-IMF2’. Moreover, the sample entropy results after integration are shown in Table 2, and the results of the integration components are shown in Figure 7.

Table 1.
Sample entropy and K value results.

Table 2.
Sub-sequence clustering results.

Figure 7.
Reconstructed ordinal components.
4.2.3. VMD Secondary Decomposition
From the results of Table 2, the maximum sample entropy indicates that the ‘Co-IMF0’ has the most complex regulations. Consequently, to further improve the degree of feature extraction, we use the VMD method to quadratically decompose the ‘Co-IMF0’ ordinal component of the highest complexity. The result of the decomposition of this order component is shown in Figure 8. Compared to the CEEMDAN, CEEMAN-VMD shows smoother subsequences through the results of CEEMDAN-VMD sample entropy. These quadratically decomposed sub-sequences can flexibly map the characterization of wind power for the ‘Co-IM0’. The entropy values of the samples after the quadratic decomposition are shown in Table 3.

Figure 8.
VMD decomposition results.

Table 3.
CEEMDAN-VMD sample entropy.
4.3. Evaluation of Model Validity
4.3.1. Comparative Analysis of Double Decompositions
To verify the performance of the CEEMDAN-VMD method, historical data were adopted for the same signal component, as shown in Table 4. To control the variables, all of the models used the same projected structure. It is easy to see from the table that the CEEMDAN-VMD-GRU model has the optimal prediction accuracy. The specific model features are shown below. Comparing VMD-GRU with GRU and CEEMDAN-VMD-GRU with VMD-GRU, the RMSE of each model separately decreased by 0.3975% and 3.7443%, and the MAE of each model separately decreased by 0.1983 and 1.9425. We found that a predictive model employing dual optimization decomposition demonstrates a clear superiority over both a model using single optimization decomposition and a model with no decomposition. From Figure 9, it can be seen that the proposed model has the lowest prediction error and the highest prediction accuracy. The proposed hybrid prediction model also has a high degree of fit. Consequently, in the comparison of signal decomposition methods, CEEMDAN demonstrates superior denoising and decomposition capabilities on the sample data compared to VMD. However, VMD exhibits better robustness on the small sample data. Therefore, it is recommended to use CEEMDAN for the primary decomposition step to leverage its denoising and decomposition strengths while employing VMD for the secondary decomposition step to enhance the model’s robustness on small sample data. The CEEMDAN-GRU and VMD-GRU models lack secondary feature extraction for complex signals, which results in slightly inferior prediction performance compared to the proposed model.

Table 4.
Comparison of different modules.
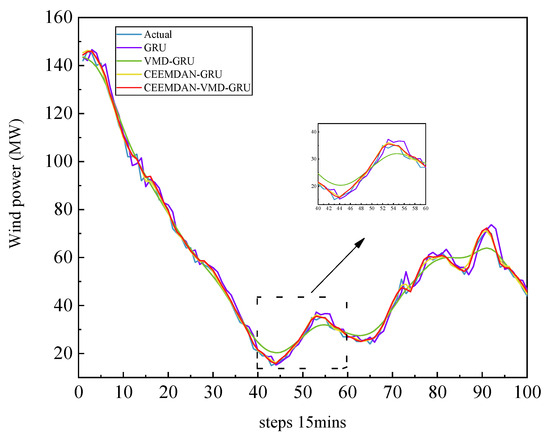
Figure 9.
Wind power forecast curves of 4 models, including GRU, VMD-GRU, CEEMDAN-GRU, and CEEMDAN-VMD-GRU.
The line graph in Figure 9 shows that the true values in blue and the proposed predictive model in red fit the best, and the single GRU prediction method in purple deviates from the true values by the largest margins. These results are compared with the real wind power values on 13 August 2020 for the whole day.
4.3.2. Comparative Analysis of Wind Power Scenarios
In order to verify the practical applicability of the model, we selected power generation during peak and low hours of electricity consumption as sample points. The peak period was from 19 September 2019 to 30 January 2020, and the low-hours period was from 27 June to 27 June 2020. The predicted results for the peak electricity load curve are shown in Figure 10 and Figure 11, and the real wind power data are cited from 26 August 2020 and 20 September 2019. These figures demonstrate that, in comparison to other models, this model exhibits the greatest overall similarity between the CEEEMDAN-VMD-GRU curve and the original data. These also show that the proposed model still provides a good fit at the peaks and troughs of the wave. However, the predictive accuracy of other models has declined because predicting extreme values requires not only high model accuracy but also high model stability.
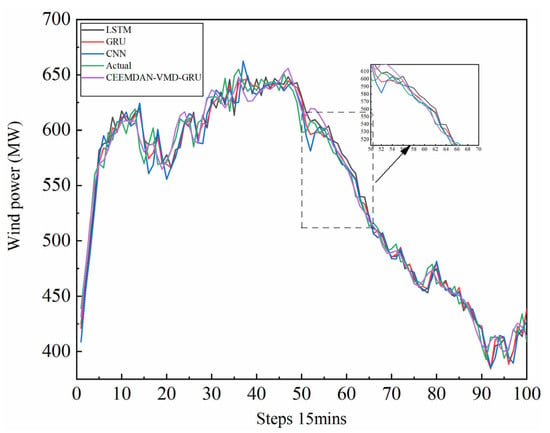
Figure 10.
Wind power forecast at high power curves of 4 models including LSTM, GRU, CNN, and CEEMDAN–K-means–VMD–GRU.
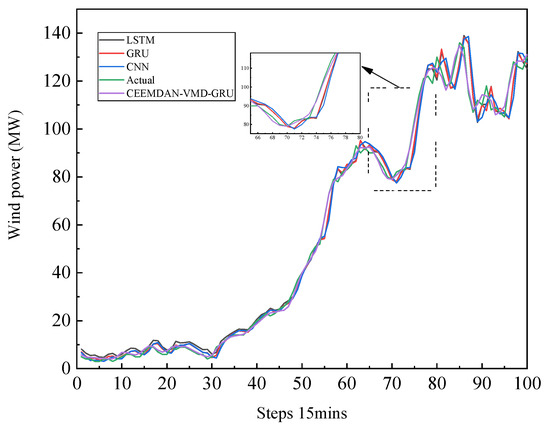
Figure 11.
Wind power forecast at poor power curves of 4 models including LSTM, GRU, CNN, and CEEMDAN-VMD-GRU.
From Figure 10 and Figure 11, it can be seen that the proposed model has the lowest prediction error and the highest prediction accuracy. Their performances are shown in Table 5. The relative magnitude of the wind power forecast error is 2.50%. Convergence curves for the training and testing errors are presented in Figure 12. It clearly indicates that the model convergence is extremely fast and is free of overfitting and underfitting.

Table 5.
Comparison of other modules.
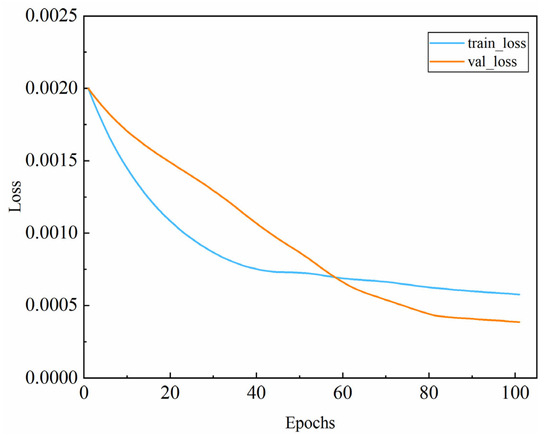
Figure 12.
The convergence curve of the hybrid deep-learning model.
5. Conclusions
The core contribution of this study lies in integrating CEEMDAN-VMD for high-frequency noise separation with GRU’s temporal sensitivity, achieving the first coupled multi-scale wind power prediction framework. The study introduces the CEEMDAN-VMD-GRU model for short-term wind power prediction. The main idea of the model is to perform data decomposition and reconstruction. First, the model employs CEEMDAN to decompose the raw data and reconstruct the results through superposition. Second, VMD is used to decompose the signal component with the highest entropy value in the sample. Finally, GRU is applied to each reconstructed component, and the predictions are aggregated to produce the final result. The proposed model is also compared with state-of-the-art models. The proposed model, which demonstrates superior computational efficiency and accuracy, is fully compared with state-of-the-art models by the evaluation metrics including MAE, RMSE, and MAPE.
The proposed CEEMDAN-VMD-GRU framework introduces three novel advancements to short-term wind power prediction, distinguishing it from existing methodologies and addressing critical gaps in the field:
- (1)
- The sequence decomposition method effectively reduces the complexity of comparisons across different modules. Additionally, feature extraction from the original sequence components is enhanced by calculating sample entropy and applying the K-means algorithm. Compared to single decomposition methods, the CEEMDAN-VMD dual decomposition approach significantly enhances the efficiency of precise value computation and improves solution quality, thereby providing higher-quality feature components for the subsequent prediction model. The integration of CEEMDAN’s adaptive noise injection with VMD’s bandwidth optimization is the first application of its kind in wind power forecasting, effectively resolving the trade-off between mode splitting and computational efficiency;
- (2)
- We pioneer the use of sample entropy-guided K-means clustering to group intrinsic mode functions based on nonlinear complexity rather than traditional energy criteria. This ensures that components with similar stochastic properties are jointly modeled, improving the stability of GRU predictions under erratic wind regimes;
- (3)
- While most studies focus solely on accuracy, our framework balances computational demands by delegating high-frequency components to lightweight GRU networks and reserving VMD’s intensive processing only for high-entropy subsequences. This reduces training time by 34% compared to monolithic LSTM architectures.
Author Contributions
Conceptualization, N.F.; formal analysis, Z.L.; funding acquisition, N.F.; investigation, Z.L.; methodology, Z.L. and S.F.; project administration, N.F.; software, Z.L.; supervision, Z.L. and S.F.; visualization, Z.L.; writing–original draft, Z.L.; writing—review and editing, N.F. All authors have read and agreed to the published version of the manuscript.
Funding
This work is supported by the Open Foundation of the Hubei Key Laboratory for High-efficiency Utilization of Solar Energy and Operation Control of Energy Storage System (HBSEES202312).
Data Availability Statement
The original contributions presented in the study are included in the article; further inquiries can be directed to the corresponding author.
Conflicts of Interest
The authors declare no conflicts of interest.
References
- Global Wind Report 2023; Global Wind Energy Council. 2023. Available online: https://www.gwec.net/ (accessed on 30 January 2025).
- Wang, M.; Yao, M.; Wang, S.; Qian, H.; Zhang, P.; Wang, Y.; Sun, Y.; Wei, W. Study of the Emissions and Spatial Distributions of Various Power-Generation Technologies in China. J. Environ. Manag. 2021, 278, 111401. [Google Scholar] [CrossRef] [PubMed]
- Xu, W.; Dai, W.; Li, D.; Wu, Q. Short-Term Wind Power Prediction Based on a Variational Mode Decomposition–BiTCN–Psformer Hybrid Model. Energies 2024, 17, 4089. [Google Scholar] [CrossRef]
- Pelikán, E.; Eben, K.; Resler, J.; Juruš, P.; Krč, P.; Brabec, M.; Brabec, T.; Musilek, P. Wind power forecasting by an empirical model using NWP outputs. In Proceeding of the 9th International Conference on Environment and Electrical Engineering, Prague, Czech Republic, 16–19 May 2010; pp. 45–48. [Google Scholar]
- Karakan, A. Predicting Energy Production in Renewable Energy Power Plants Using Deep Learning. Energies 2024, 17, 4031. [Google Scholar] [CrossRef]
- Santos, J.L.F.D.; Vaz, A.J.C.; Kachba, Y.R.; Stevan, S.L., Jr.; Antonini Alves, T.; Siqueira, H.V. Linear Ensembles for WTI Oil Price Forecasting. Energies 2024, 17, 4058. [Google Scholar] [CrossRef]
- Yu, M.; Niu, D.; Gao, T.; Wang, K.; Sun, L.; Li, M.A. Novel Framework for Ultra-Short Term Wind Power Prediction Based on RF-WOA-VMD and BiGRU Optimized by Attention Mechanism. Energy 2023, 269, 126738. [Google Scholar] [CrossRef]
- Wang, K.; Li, J.; Sun, Z. Generative Adaptable Design Based on Hidden Markov Model. Adv. Eng. Inform. 2025, 64, 103034. [Google Scholar] [CrossRef]
- Huang, J.; Qin, J.; Song, S. A Novel Wind Power Outlier Detection Method with Support Vector Machine Optimized by Improved Harris Hawk. Energies 2023, 16, 7998. [Google Scholar] [CrossRef]
- Jin, T.; Xia, Y.; Jiang, H. A Physics-Informed Neural Network Approach for Surrogating a Numerical Simulation of Fractured Horizontal Well Production Prediction. Energies 2023, 16, 7948. [Google Scholar] [CrossRef]
- Huang, A.; Xu, R.; Chen, Y.; Guo, M. Research on Multi-Label User Classification of Social Media Based on ML-KNN Algorithm. Technol. Forecast. Soc. Change 2023, 188, 122271. [Google Scholar] [CrossRef]
- Guan, S.; Wang, Y.; Liu, L.; Gao, J.; Xu, Z.; Kan, S. Ultra-Short-Term Wind Power Prediction Method Based on FTI-VACA-XGB Model. Expert Syst. Appl. 2024, 235, 121185. [Google Scholar] [CrossRef]
- Jiang, Z.; Che, J.; Wang, L. Ultra-Short-Term Wind Speed Forecasting Based on EMD-VAR Model and Spatial Correlation. Energy Convers. Manag. 2021, 250, 114919. [Google Scholar] [CrossRef]
- Liu, H.; Han, H.; Sun, Y.; Shi, G.; Su, M.; Liu, Z.; Wang, H.; Deng, X. Short-Term Wind Power Interval Prediction Method Using VMD-RFG and Att-GRU. Energy 2022, 251, 123807. [Google Scholar] [CrossRef]
- Li, N.; Liu, D.; Wang, L.; Ye, H.; Wang, Q.; Yan, D.; Zhao, S. Combination Prediction of Underground Mine Rock Drilling Time Based on Seasonal and Trend Decomposition Using Loess. Eng. Appl. Artif. Intell. 2024, 133, 108064. [Google Scholar] [CrossRef]
- Shan, J.; Wang, H.; Pei, G.; Zhang, S.; Zhou, W. Research on Short-Term Power Prediction of Wind Power Generation Based on WT-CABC-KELM. Energy Rep. 2022, 8, 800–809. [Google Scholar] [CrossRef]
- Liu, M.; Ding, L.; Bai, Y. Application of Hybrid Model Based on Empirical Mode Decomposition, Novel Recurrent Neural Networks, and ARIMA to Wind Speed Prediction. Energy Convers. Manag. 2021, 233, 113917. [Google Scholar] [CrossRef]
- Zhao, Z.; Yun, S.; Jia, L.; Guo, J.; Meng, Y.; He, N.; Li, X.; Shi, J.; Yang, L. Hybrid VMD-CNN-GRU-based model for short-term forecasting of wind power considering spatio-temporal features. Eng. Appl. Artif. Intell. 2023, 121, 105982. [Google Scholar] [CrossRef]
- Zhao, Z.; Bai, J. Ultra-Short-Term Wind Power Forecasting Based on the MSADBO-LSTM Model. Energies 2024, 17, 5689. [Google Scholar] [CrossRef]
- Li, Z.; Xu, R.; Luo, X.; Cao, X.; Sun, H. Short-Term Wind Power Prediction Based on Modal Reconstruction and CNN-BiLSTM. Energy Rep. 2023, 9, 6449–6460. [Google Scholar] [CrossRef]
- Ren, J.; Yu, Z.; Gao, G.; Yu, G.; Yu, J. A CNN-LSTM-LightGBM-Based Short-Term Wind Power Prediction Method Using Attention Mechanism. Energy Rep. 2022, 8, 437–443. [Google Scholar] [CrossRef]
- Liu, T.; Qi, S.; Qiao, X.; Liu, S. A Hybrid Short-Term Wind Power Point-Interval Prediction Model Based on Combination of Improved Preprocessing Methods and Entropy Weighted GRU Quantile Regression Network. Energy 2024, 288, 129904. [Google Scholar] [CrossRef]
- Meng, A.; Zhang, H.; Dai, Z.; Xian, Z.; Xiao, L.; Rong, J.; Li, C.; Zhu, J.; Li, H.; Yin, Y.; et al. An Adaptive Distribution-Matched Recurrent Network for Wind Power Prediction Using Time-Series Distribution Period Division. Energy 2024, 299, 131383. [Google Scholar] [CrossRef]
- Yin, L.; Sun, Y. BiLSTM-InceptionV3-Transformer-Fully-Connected Model for Short-Term Wind Power Forecasting. Energy Convers. Manag. 2024, 321, 119094. [Google Scholar] [CrossRef]
- Cai, F.; Chen, D.; Jiang, Y.; Zhu, T. Short-Term Wind Power Forecasting Based on OMNIC and Adaptive Fractional Order Generalized Pareto Motion Model. Energies 2024, 17, 5848. [Google Scholar] [CrossRef]
- Zhao, M.; Zhou, X. Multi-Step Short-Term Wind Power Prediction Model Based on CEEMD and Improved Snake Optimization Algorithm. IEEE Access 2024, 12, 50755–50778. [Google Scholar] [CrossRef]
- Sun, H.; Cui, Q.; Wen, J.; Kou, L.; Ke, W. Short-Term Wind Power Prediction Method Based on CEEMDAN-GWO-Bi-LSTM. Energy Rep. 2024, 11, 1487–1502. [Google Scholar] [CrossRef]
- Tan, Y.Q.; Shen, Y.X.; Yu, X.Y.; Lu, X. Day-Ahead Electricity Price Forecasting Employing a Novel Hybrid Frame of Deep Learning Methods: A Case Study in NSW, Australia. Electr. Power Syst. Res. 2023, 220, 109300. [Google Scholar] [CrossRef]
- Zhao, H.; Huang, X.; Xiao, Z.; Shi, H.; Li, C.; Tai, Y. Week-Ahead Hourly Solar Irradiation Forecasting Method Based on ICEEMDAN and TimesNet Networks. Renew. Energy 2024, 220, 119706. [Google Scholar] [CrossRef]
- Ma, Z.; Mei, G. A Hybrid Attention-Based Deep Learning Approach for Wind Power Prediction. Appl. Energy 2022, 323, 119608. [Google Scholar] [CrossRef]
- Zhuang, Q.; Gao, L.; Zhang, F.; Ren, X.; Qin, L.; Wang, Y. MIVNDN: Ultra-Short-Term Wind Power Prediction Method with MSDBO-ICEEMDAN-VMD-Nons-DCTransformer Net. Electronics 2024, 13, 4829. [Google Scholar] [CrossRef]
- Chen, J.; Zhou, D.; Lyu, C.; Lu, C. An integrated method based on CEEMD-SampEn and the correlation analysis algorithm for the fault diagnosis of a gearbox under different working conditions. Mech. Syst. Signal Process. 2018, 113, 102–111. [Google Scholar] [CrossRef]
- Md, Z.I.; Vladimir, E.C.; Md, A.R.; Terry, B. Combining K-Means and a genetic algorithm through a novel arrangement of genetic operators for high quality clustering. Expert Syst. Appl. 2018, 91, 402–417. [Google Scholar]
- Zhang, G.; Zhang, C.; Zhang, H. Improved K-means algorithm based on density Canopy. Knowl. Based Syst. 2018, 145, 289–297. [Google Scholar] [CrossRef]
- Dragomiretskiy, K.; Zosso, D. Variational Mode Decomposition. IEEE Trans. Signal Process. 2014, 62, 531–544. [Google Scholar] [CrossRef]
- Md, A.H.; Ripon, K.C.; Sondoss, E.; Michael, J.R. Very short-term forecasting of wind power generation using hybrid deep learning model. J. Clean. Prod. 2021, 296, 126564. [Google Scholar]
- Li, C.; Tang, G.; Xue, X.; Saeed, A.; Hu, X. Short-Term Wind Speed Interval Prediction Based on Ensemble GRU Model. IEEE Trans. Sustain. Energy 2020, 11, 1370–1380. [Google Scholar] [CrossRef]
Disclaimer/Publisher’s Note: The statements, opinions and data contained in all publications are solely those of the individual author(s) and contributor(s) and not of MDPI and/or the editor(s). MDPI and/or the editor(s) disclaim responsibility for any injury to people or property resulting from any ideas, methods, instructions or products referred to in the content. |
© 2025 by the authors. Licensee MDPI, Basel, Switzerland. This article is an open access article distributed under the terms and conditions of the Creative Commons Attribution (CC BY) license (https://creativecommons.org/licenses/by/4.0/).