Article

A Hybrid ARIMA-LSTM-XGBoost Model with Linear Regression Stacking for Transformer Oil Temperature Prediction

1
China Southern Power Grid Extra-High Voltage Transmission Company, Guangzhou Bureau, Guangzhou 510663, China
2
School of Electrical and Information Engineering, Hunan University, Changsha 410082, China
*
Author to whom correspondence should be addressed.
Energies 2025, 18(6), 1432; https://doi.org/10.3390/en18061432
Submission received: 21 February 2025 / Revised: 6 March 2025 / Accepted: 12 March 2025 / Published: 13 March 2025
(This article belongs to the Section A1: Smart Grids and Microgrids)

Abstract

:
Transformers are essential for voltage regulation and power distribution in electrical systems, and monitoring their top-oil temperature is crucial for detecting potential faults. High oil temperatures are directly linked to insulation degradation, a primary cause of transformer failures. Therefore, accurate oil temperature prediction is important for proactive maintenance and preventing failures. This paper proposes a hybrid time series forecasting model combining ARIMA, LSTM, and XGBoost to predict transformer oil temperature. ARIMA captures linear components of the data, while LSTM models complex nonlinear dependencies. XGBoost is used to predict the overall oil temperature by learning from the complete dataset, effectively handling complex patterns. The predictions of these three models are combined through a linear-regression stacking approach, improving accuracy and simplifying the model structure. This hybrid method outperforms traditional models, offering superior performance in predicting transformer oil temperature, which enhances fault detection and transformer reliability. Experimental results demonstrate the hybrid model’s superiority: In 5000-data-point prediction, it achieves an MSE = 0.9908 and MAPE = 1.9824%, outperforming standalone XGBoost (MSE = 3.2001) by 69.03% in error reduction and ARIMA-LSTM (MSE = 1.1268) by 12.08%, while surpassing naïve methods 1–2 (MSE = 1.7370–1.6716) by 42.94–40.74%. For 500-data-point scenarios, the hybrid model (MSE = 1.9174) maintains 22.40–35.53% lower errors than XGBoost (2.4710) and ARIMA-LSTM (3.6481) and outperforms naïve methods 1–2 (2.8611–2.9741) by 32.97–35.53%. These results validate the approach’s effectiveness across data scales. The proposed method contributes to more effective predictive maintenance and improved safety, ensuring the long-term performance of transformer equipment.

1. Introduction

Transformer top-oil temperature plays a critical role in detecting transformer faults, as it serves as a key indicator of the internal thermal conditions of a transformer [1]. Since transformer oil performs essential functions such as cooling and insulation, monitoring its temperature is crucial for ensuring the safe operation and longevity of the equipment. Elevated oil temperatures are directly linked to the degradation of the insulation system, a primary cause of transformer failures [2,3].
Research has shown that high oil temperatures lead to chemical breakdowns in insulation materials, which accelerate failure processes. Studies [4,5,6] indicate that abnormally high oil temperatures are often associated with insulation degradation, which compromises the transformer’s performance and shortens its lifespan. Moreover, by combining oil temperature data with operational load factors, it is possible to more accurately predict transformer failures, as these factors together influence the rate of insulation degradation [7].
The importance of oil temperature in fault detection is further emphasized by studies [8,9], which highlight that temperatures exceeding 100 °C significantly accelerate insulation degradation, increasing the likelihood of transformer failure. Additionally, fluctuations in oil temperature can adversely affect transformer health, with sustained high temperatures leading to the rapid deterioration of both the transformer oil and the solid insulating materials [10]. Research [11] has also shown that temperatures above 80 °C notably increase the failure rate of transformers.
In conclusion, transformer oil temperature is a vital parameter for early fault detection, as it provides critical insights into the operational health of the transformer. Monitoring and managing oil temperature effectively can prevent transformer failures and enhance the overall reliability and safety of the power system.
Transformer oil temperature has a direct impact on the operational health and longevity of a transformer. Table 1 outlines specific temperature ranges and the associated effects, each supported by empirical studies. Within the normal operating temperature (max. ~60 °C), transformers typically exhibit stable performance with minimal aging acceleration. Field measurements indicate that under normal loads, top-oil temperatures often remain below about 60 °C [12]. At these temperatures, both insulation and oil remain chemically stable, and no significant deterioration takes place during normal operational timespans [13]. Operation in the moderately high-temperature (~60–90 °C) range indicates increased loads or other external stress factors [12,14]. Research shows that sustained running within 60–90 °C accelerates oil oxidation and gradually degrades the paper insulation. Although this does not yet occur at a severe rate, operators should monitor it closely, because such modest rises in oil temperature can foreshadow further thermal stress and more pronounced insulation wear if the load remains high [12,14,15]. At high temperatures close to the design limit (~90–110 °C), the oil temperature accelerates the aging process considerably. Accelerated life tests demonstrate that insulation paper deteriorates much faster in this interval [15,16]. In particular, some studies note that operating near 110 °C can reduce the expected lifespan of the insulation significantly, sometimes by half compared to normal running temperatures. This zone is often considered the upper boundary for routine operation; each degree above about 100 °C can lead to a notable increase in the aging rate [17]. Extreme overheating conditions (>~120 °C) can cause rapid and severe damage to oil–paper systems [18]. Laboratory data suggest that when the hotspot surpasses 120 °C or 130 °C, just a few hours of operation can equate to days of normal aging at 90–100 °C [16,18]. The risks in these extreme conditions include rapid insulation breakdown, abrupt gas formation within the oil, and a heightened likelihood of catastrophic failures such as transformer fires. Consequently, it is critical to avoid sustained operation above ~120 °C.
As smart grid technologies advance, the integration of oil temperature monitoring with sophisticated diagnostic systems has garnered increasing attention. By combining oil temperature data at the transformer’s rated load with the temperature rise calculation model outlined in IEEE Std C57.91-2011 [19], it becomes possible to predict the hotspot temperature rise curve of the transformer under various load conditions [20]. While traditional forecasting techniques like ARIMA and Support Vector Machines (SVMs) excel at capturing linear trends, they often struggle with more complex fluctuations, such as changes in ambient temperature and load variations [21,22]. To address these challenges, an enhanced version of the SVM has been developed, utilizing Particle Swarm Optimization (PSO) to improve accuracy [23].
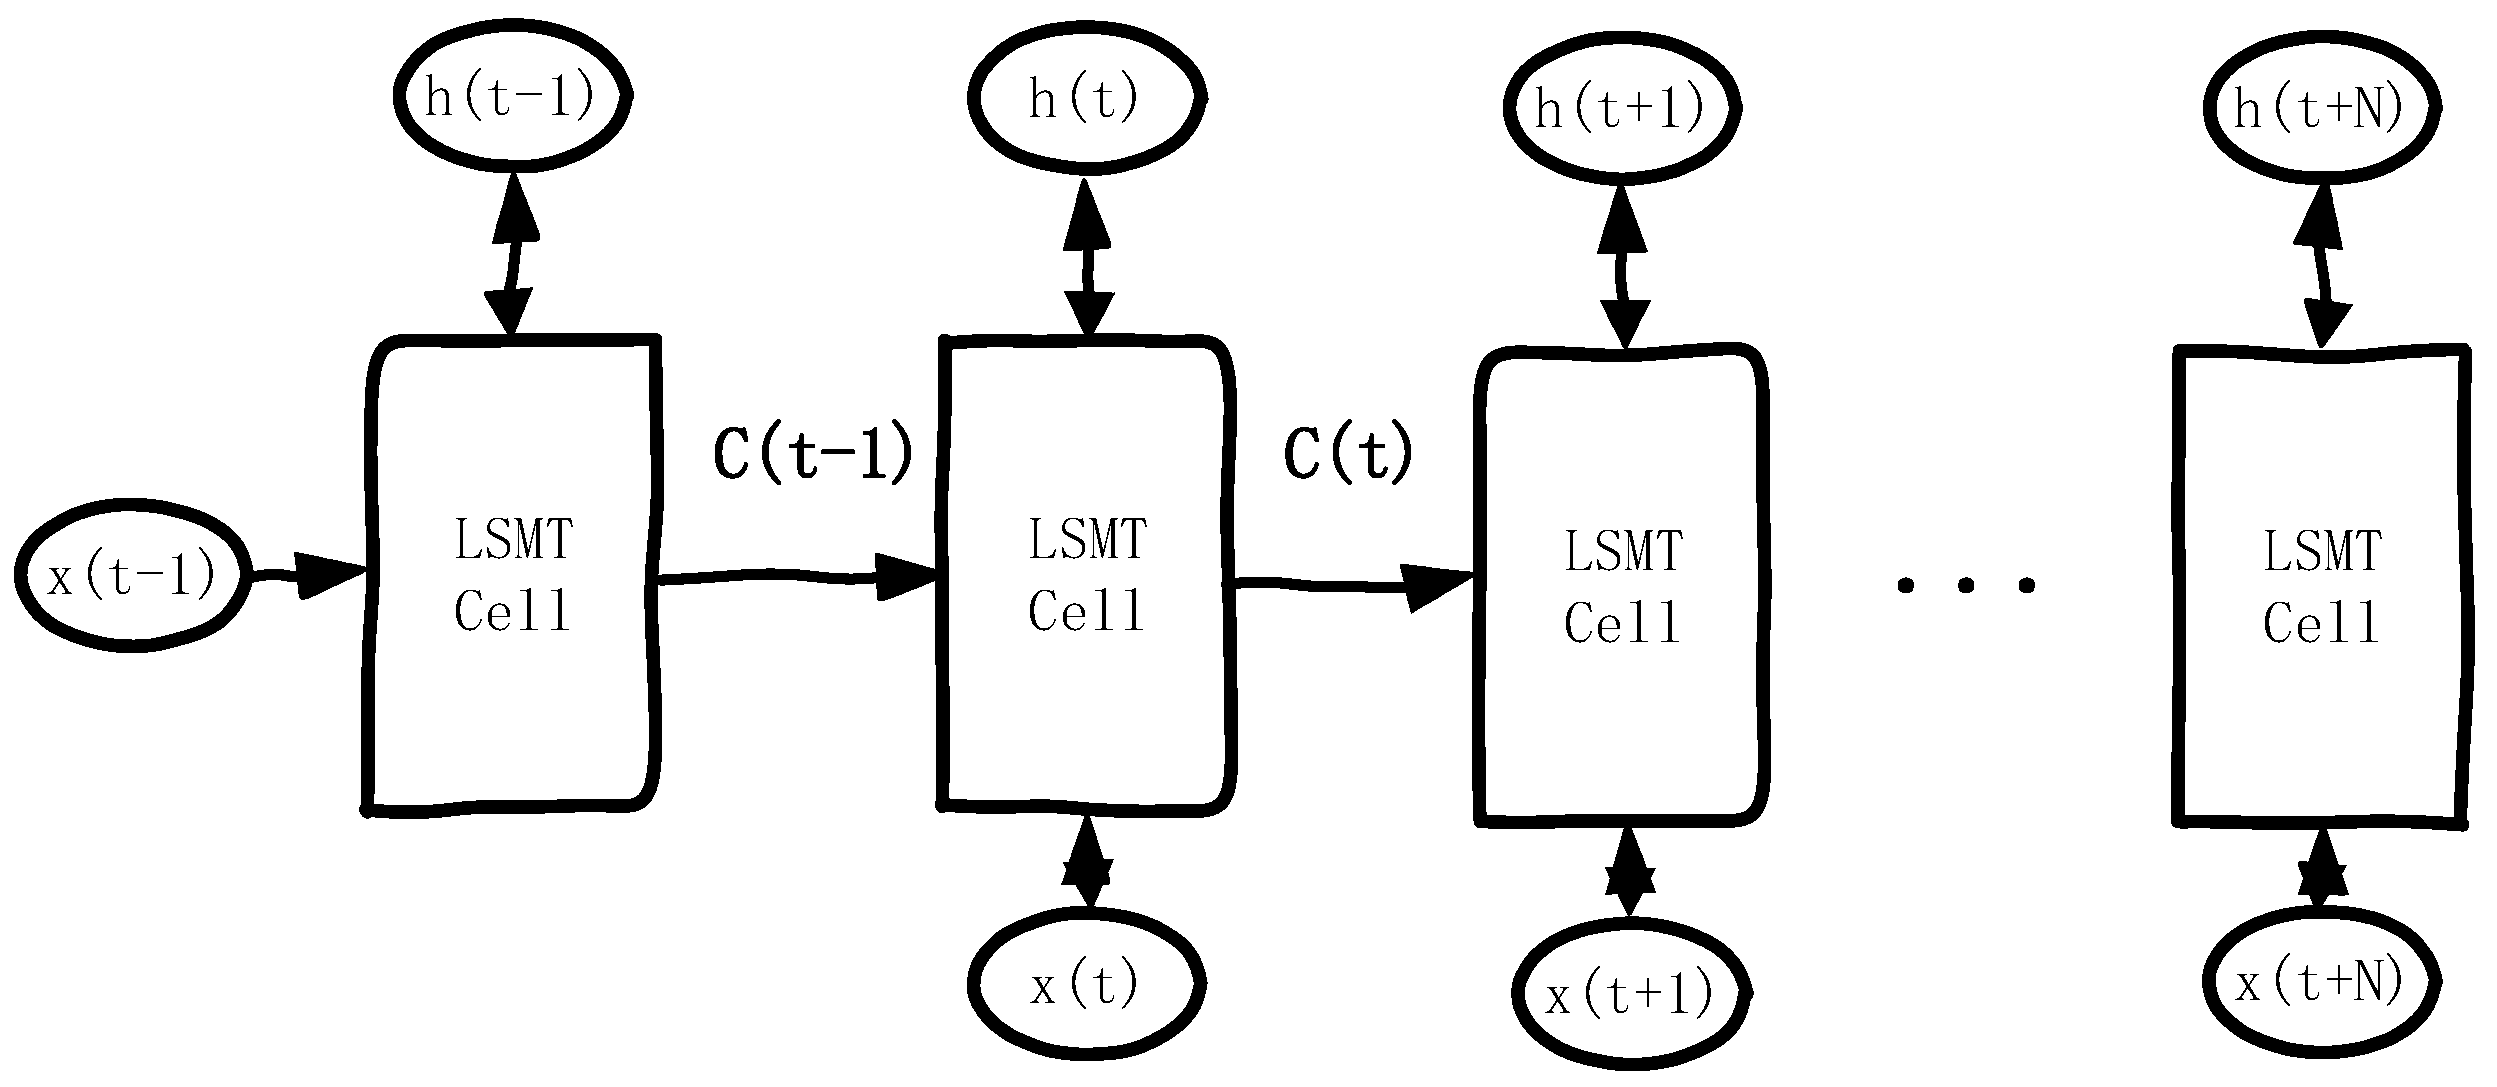
On the other hand, deep learning methods, particularly Long Short-Term Memory (LSTM) networks, have shown great promise in managing nonlinear time series data. However, they typically fail to simultaneously capture both linear and nonlinear features, limiting their overall performance [24]. To mitigate this, hybrid models have been proposed to predict dissolved gas concentrations in transformer top oil, which aids in fault detection [16,25,26].
In machine learning, Extreme Gradient Boosting (XGBoost) algorithms are widely favored for their efficiency and flexibility, with excellent prediction accuracy, which can quickly and accurately solve various problems in data science [27]. Combined prediction methods improve the accuracy and stability of prediction by combining the advantages of multiple models and overcoming the limitations of a single model, and this effect has been verified by a wide range of scholars [28].
This paper introduces an advanced ARIMA-LSTM-XGBoost hybrid model for predicting transformer top-oil temperature changes. The predictions from ARIMA, LSTM, and XGBoost are combined using a linear regression model, which effectively weights and integrates the results. This approach, through linear regression stacking, offers a more efficient and accurate prediction method compared to simpler models like stacking or weighted averaging. The proposed model outperforms the standalone LSTM model in terms of both prediction accuracy and error reduction, making it a robust solution for transformer fault detection.

2. Principles of ARIMA-LSTM-XGBoost

2.1. Principles of ARIMA

The Autoregressive Integrated Moving Average (ARIMA) model is a classical statistical approach widely used for time series forecasting, particularly effective in capturing linear patterns [29,30]. Formally, an ARIMA(p,d,q) model integrates three key components:
p: the order of the autoregressive (AR) part;
d: the degree of differencing to achieve stationarity;
q: the order of the moving average (MA) part.
By differencing the original series d times, ARIMA ensures that the resulting sequence remains stationary [29]. The backshift operator B is commonly used to represent the differencing operation ( 1 B ) d . A general ARIMA(p,d,q) model can be written as shown in Equation (1):
1 ϕ 1 B ϕ p B p 1 B d Y t = c + 1 + θ 1 B + + θ q B q ε t
where Y t is the time series value at the time t ; ϕ i and θ i are the AR and MA coefficients, respectively; c is a constant; and ε t is white noise. Fitting an ARIMA model typically involves the Box–Jenkins methodology: identifying plausible p, d, and q using Autocorrelation Function (ACF) and Partial Autocorrelation Function (PACF) plots, followed by parameter estimation via techniques such as the maximum likelihood [30,31]. Information criteria (AIC/BIC) can then assist in selecting the optimal model structure. Recent studies have shown ARIMA’s continued reliability for linear trend forecasting in various domains (e.g., load prediction, weather-related data), thanks to its strong theoretical foundation and interpretability [31].
In this study, the ARIMA model was used to predict the low-frequency portion of the transformer oil temperature data. Since ARIMA can only deal with linear relationships, it was also necessary to combine LSTM and XGBoost models to deal with the nonlinear part of the data in order to improve the overall prediction accuracy. The advantage of ARIMA lies in its high efficiency in dealing with linear trending data, while the other models (e.g., LSTM and XGBoost) further improve prediction performance in complex nonlinear dynamics.

2.2. Principles of LSTM

Long Short-Term Memory (LSTM) networks are a specialized type of recurrent neural network (RNN) designed to mitigate the vanishing gradient problem and capture long-term dependencies [32]. Unlike conventional RNNs, an LSTM cell contains three gating mechanisms—the oblivion gate, input gate, and output gate—as well as an internal cell state, c(t). These gates modulate the flow of information to preserve long-range context while discarding irrelevant past states [33].
As depicted in Figure 1, LSTM cells process input data in each time step. Information is stored and propagated through the cell state c(t) and the hidden state h(t). The input for each time step, such as x(t − 1) for the time step t − 1 and x(t) for the time step t, is fed into the corresponding LSTM cell. The hidden state h(t) serves as both the output of the current time step and the input for the next time step and is updated in each step via gating mechanisms.
LSTM operates based on three key gates: the input gate, which regulates the addition of new information; the oblivion gate, which controls how much of the previous information is discarded; and the output gate, which governs the output of the memory cell. The internal structure of the memory cell is illustrated in Figure 2.
In this case, the operating principle of the oblivion gate is shown in Equation (2).
f t = σ W f · h t 1 , x t + b f
W f is the weight matrix of the oblivion gate, b f is the bias of the oblivion gate, σ is the Sigmoid activation function, and the output range is [0, 1]. The oblivion gate splices the hidden state of the previous time step and the input of the current time step to form a vector, linearly transforms the spliced input through the weight matrix W f and the bias b f , and uses the sigmoid activation function σ to map the result of the linear transformation to the range of [0, 1]. The output of the oblivion gate, f t , is a vector, and the oblivion gate can control which past information needs to be retained in the cell state in the current time step and which information needs to be forgotten.
The input gate works as shown in Equation (3):
i t = σ W i · h t 1 , x t + b i
where i t is the output of the input gate, which takes the value range [0, 1]; W i is the weight matrix of the input gate, which is used to linearly transform the spliced input h t 1 , x t ; and b i is the bias vector of the input gate, which is used to adjust the calculation result.
The formula for candidate cell states is shown in Equation (4), which is used to generate new information candidates indicating what can be added to the cell states.
C ~ t = t a n h ( W c · h t 1 , x t + b c )
C ~ t is a candidate cell state; the range of values is [−1, 1]; t a n h is a hyperbolic tangent activation function that maps the results of linear calculations to [−1, 1], which facilitates the expression of strong and weak information; W c is the weight matrix of candidate states; and b c is the bias vector of the candidate state.
The input gate determines which parts of the new information (candidate states) need to be added to the cell state, and the candidate states provide the specific information content that needs to be added to the cell state.
The cell state update is then performed by combining the outputs of the oblivion and input gates as well as the candidate cell state, as shown in Equation (5).
C t = f t C t 1 + i t C t ~
where f t C t 1 is the old information portion controlled by the oblivion gate and i t C t ~ is the new information portion controlled by the input gate. So, the current cell state C t is the result of the combined effect of the previous cell state C t 1 and the current input data.
Finally, the output gate and hidden state are used to control how the current cell state affects the output, which is calculated as shown in Equations (6) and (7).
o t = σ W o · h t 1 , x t + b o
h t = o t t a n h ( C t )
where o t is the output of the output gate, and each element represents the output proportion of the corresponding information in the current cell state; W o is the weight matrix of the output gate; b o is the bias vector of the output gate; t a n h C t is the value of the cell state after being processed by the activation function; and the hidden state h t is the final output of the current LSTM cell, which is passed to the next time step.
The output gate is the final step of the LSTM, responsible for filtering and outputting the most useful information for the current time step from the cell states, and the hidden state serves as both the output of the LSTM and the input for the next time step, containing the essence of the information extracted through the gating mechanism.
Through these gate operations, LSTM selectively retains essential long-term information while controlling short-term updates. This architecture excels at modeling nonlinear temporal dynamics in applications such as fault diagnosis, load forecasting, and real-time control. Because LSTM can handle complex, non-stationary data, numerous recent works confirm its high predictive accuracy for time series with both short- and long-range dependencies [34].

2.3. Principles of XGBoost Algorithm

Extreme Gradient Boosting (XGBoost) is an ensemble learning algorithm based on gradient-boosted decision trees, designed to deliver high accuracy and computational efficiency [35]. In the boosting framework, each new weak learner (decision tree) is built to correct the errors of the previously combined learners. Let [ x i , y i ] i = 1 N be the training dataset and F x be the final model, composed of T additive trees:
F ( x ) = t = 1 T f t ( x ) .
Each tree, f t ( x ) , is trained to fit the pseudo-residuals from the prior ensemble. The objective function, minimized in each step, includes both a loss term and a regularization term:
L = i = 1 N l ( y i , F t 1 ( x i ) + f t ( x i ) ) + Ω ( f t )
where l ( · ) is a differentiable loss (e.g., mean squared error), and Ω · is a complexity penalty on the tree structure to avoid overfitting [36]. Techniques such as shrinkage (learning rate), column subsampling, and early stopping further enhance model generalization. Owing to its capability of capturing nonlinear relationships and handling large volumes of data, XGBoost has recently been adopted in fields ranging from financial forecasting to power system health monitoring [35,36]. In the context of transformer oil temperature prediction, XGBoost can utilize a comprehensive set of engineered features to model intricate patterns in the data, complementing the linear emphasis of ARIMA and the sequence-learning capabilities of LSTM.
By constructing a series of decision trees, XGBoost gradually adjusts the structure and weights of each tree to reduce the bias and variance of the model and finally obtains an integrated model which is able to predict the target variable more accurately.
Unlike ARIMA and LSTM, XGBoost captures the complex nonlinear features in the oil temperature data by processing the entire dataset. By constructing feature data through a sliding window approach, XGBoost successfully learns the variation patterns of oil temperature and performs efficient prediction on the test set. Despite the powerful nonlinear modeling capability of XGBoost, it may not perform as accurately as the LSTM model when dealing with long-sequence-dependent data. Therefore, in this study, XGBoost was used in combination with ARIMA and LSTM to improve the overall prediction accuracy.

2.4. Combined ARIMA-LSTM-XGBoost Method Based on Stacked Models

In order to improve the accuracy of transformer oil temperature prediction, a hybrid prediction model based on ARIMA, LSTM, and XGBoost is proposed in this study. As shown in Figure 3, in this method, the transformer oil temperature time series are firstly modeled and predicted using the ARIMA model, LSTM neural network, and XGBoost algorithm, respectively, and finally the prediction results of the three are integrated by the linear regression model to generate the final prediction value.
First, the ARIMA model was used to deal with the linear part of the transformer oil temperature data. The ARIMA model captured the long-term linear trend of the oil temperature data through an autoregressive and moving-average process. During the model training phase, the ARIMA model fitted the oil temperature data and predicted the low-frequency portion based on historical data. These predictions were passed on to the next step of the process as predictions from the ARIMA model. At the same time, the residuals of the ARIMA model were extracted and used as inputs to the subsequent LSTM neural network for modeling nonlinear features in the data.
LSTM was used to learn the nonlinear patterns in the residuals of the ARIMA model. Due to the ability of LSTM to capture long-term dependencies and complex nonlinear dynamics when working with time series data, LSTM neural networks were trained to predict changes in the ARIMA residuals. By inputting a sequence of residuals into the ARIMA model, the LSTM model was able to identify nonlinear features in the residual data and generate residual-based predictive values. These predicted values represented the fluctuations in the high-frequency portion of the data and were eventually merged with the predicted values from the ARIMA model.
The XGBoost algorithm, as the third base learner, was used to predict the overall trend of the transformer oil temperature data, and in this study, the XGBoost model used the raw oil temperature data as the input for time series prediction. Unlike ARIMA and LSTM, XGBoost did not rely on residual data but directly predicted the entire time series, capturing complex patterns and trends in oil temperature changes.
After the predictions from all three base learners (ARIMA, LSTM, and XGBoost) were generated, they were weighted and combined using a linear regression model. The linear regression model combined the predictions of each model by assigning different weights to the predictions of the three models to obtain the final oil temperature prediction. This method optimized the prediction results through weighted portfolios, and the linear regression model was able to integrate the outputs of the underlying models more efficiently than the traditional simple weighted-average or stacking methods.
The final prediction results were generated from the output of this linear regression model as a prediction of future transformer oil temperature changes. This weighted combination method based on multiple models was able to combine the advantages of each model and overcome the limitations of a single model, thus improving the accuracy and robustness of the prediction.

3. Introduction to Naïve Methods and Their Comparative Significance

In time series forecasting, naïve methods are simple baseline prediction techniques that rely on straightforward assumptions about the data. The basic idea behind these methods is to use historical observations directly to predict future values without engaging in complex parameter estimation or feature extraction. For instance, one common naïve method is to set the predicted value at the current time equal to the actual observation from the previous time step; another approach involves using the mean of several past observations (i.e., a moving average) as the prediction. Despite their simplicity, these methods often serve as valuable benchmarks against which more sophisticated models can be evaluated.
Naïve methods have been widely adopted in both academic research and practical applications for several reasons:
First is the baseline performance evaluation. Naïve methods establish a simple performance baseline for forecasting tasks. Advanced models—such as ARIMA, LSTM, XGBoost, or hybrid combinations like ARIMA-LSTM-XGBoost—are expected to significantly outperform these basic approaches. If a complex model does not substantially exceed the accuracy of a naïve method, it may indicate that the model is not effectively capturing the underlying dynamics and nonlinearities in the data [30].
And then, there is computational efficiency and real-time capability. Due to their reliance on simple operations (e.g., shifting or calculating a rolling mean), naïve methods are computationally inexpensive and straightforward to implement in real-time environments. While sophisticated models can capture more intricate data features, they often require longer training times and more computational resources [37].
And then, there is aid in data characteristic analysis. Because naïve methods do not involve complex parameter tuning, they provide an intuitive means of analyzing the characteristics of a dataset. By comparing the prediction errors of naïve methods with those of advanced models, one can gain initial insights into the presence of trends, seasonal patterns, and noise. In datasets exhibiting strong autocorrelation, even simple lag-based forecasts can capture a significant portion of the underlying information, suggesting that the incremental benefits of complex models may sometimes be limited [38].
And finally, there is a basis for model selection and optimization. In practical applications, balancing prediction accuracy with computational cost is critical. Naïve methods offer a low-cost alternative for real-time predictions and serve as a reference point for determining when the use of more advanced models is justified. Only when complex models demonstrate a clear performance advantage over these simple benchmarks should additional resources be allocated for their deployment and optimization.
Overall, naïve methods not only provide an intuitive, cost-effective baseline for time series forecasting but also play a vital role in model evaluation, data characteristic analysis, and system monitoring. By comparing advanced forecasting models with naïve approaches, this study aims to highlight the superior ability of the hybrid ARIMA-LSTM-XGBoost model in capturing complex temporal dynamics and delivering higher prediction accuracy, especially under varying data availability scenarios.
In our study, two naïve forecasting methods were implemented to serve as baseline models. These methods provide simple yet effective ways to gauge minimum expected performance and to highlight the benefits of more complex models. The implementation details of these methods are as follows.
Naïve method 1 is lagged-value prediction. In this approach, the prediction for the current time step is simply set to the observed value from a previous time step. The idea is that in some time series, especially those with strong autocorrelation, the most recent past value can be a reasonable predictor of the near future. In our code, this was implemented by shifting the original time series data.
Naïve method 2 is moving-average prediction. The second naïve method is based on the idea of a rolling (or moving) average. Here, the predicted value is calculated as the mean of a fixed number of previous observations. This approach helps to smooth out short-term fluctuations and can better capture the underlying trend of the data. In our implementation, the rolling window size was set to 20, and the resulting average was shifted by 5 time steps to avoid look-ahead bias.
We established a benchmark performance metric by comparing predictions with actual observations in our test set. Comparisons with more complex models clearly demonstrated the advantages of complex models in capturing the temporal characteristics and nonlinear relationships of the data.

4. Analysis of the Predicted Result of Oil Temperature at the Top of the Transformer

The power transformer dataset (ETDataset) used in this paper is derived from real measurement data collected between July 2016 and July 2018 by Beijing State Grid Fuda Technology Development Company and the related research team. The dataset was organized, pre-processed, and publicly released in a previous work [39] and contains real-time oil temperature (OT) and multiple load information for power transformers. During the actual deployment, the team monitored transformer loads from substations in different regions over a long period of time, resulting in a time series covering a two-year time span. For the convenience of academic research, the dataset is subdivided into ETT-small, ETT-large, and ETT-full versions, where ETT-small contains core load and oil temperature monitoring data from multiple (e.g., 2) substations, while ETT-large and ETT-full are more enriched in terms of the number of substations and characterization dimensions, but at the same time, they are also larger.
All visualizations in this paper (e.g., graphs of oil temperature trends, load comparison over time, training sample distribution, etc.) are based on the ETT-small dataset (two years long, with recording intervals of either minutes or hours).
The raw dataset is stored as a csv and each record contains a date and time stamp and the following seven characteristics:
HUFL (High UseFul Load): Effective load data under high-load conditions. They indicate the actual effective use of electricity in high-load scenarios, which is an important reference for evaluating the transformer load status during peak hours.
HULL (High UseLess Load): Invalid load data under high-load conditions. As opposed to HUFL, HULL reflects the wasteful or reactive load during the same high-load period, which is equally important for power dispatch and energy saving and emission reduction analysis.
MUFL (Middle UseFul Load): effective load data under medium-load conditions, used to identify demand during periods of smoother daily electricity use.
MULL (Middle UseLess Load): ineffective load data in medium-load conditions to assist in evaluating load efficiency during off-peak periods.
LUFL (Low UseFul Load): Effective load data under low-load conditions. These reflect the characteristics of the actual active load changes during low-load hours such as late at night.
LULL (Low UseLess Load): Invalid load data under low-load conditions. They are useful for adjusting the operation of power grid equipment during low-load hours and improving the utilization rate.
OT (Oil Temperature): Target variable. As an important index to measure the health condition and load pressure of a power transformer, oil temperature has strong physical meaning, which can effectively reflect the operating condition of the transformer and is very crucial to predict its ultimate load capacity.
In this study, we considered OT as the primary forecasting target and introduced the six load characteristics, “HUFL, HULL, MUFL, MULL, LUFL, and LULL”, and temporal information into the forecasting model to construct a more comprehensive input feature space. This captured both the short-term peak-to-valley fluctuations in electricity consumption and the potential correlation between oil temperature and various loads.
We selected 5000 sets of the above measurements as test data, which are shown and offset in Figure 4, where OT is the original top-oil temperature data, and LULL, LUFL, MULL, MUFL, HULL, and HUFL are the different characterization data.
In this study, for the transformer oil temperature prediction task, the ARIMA-LSTM model, the XGBoost algorithm, and a hybrid model combining ARIMA-LSTM and XGBoost were used for prediction, respectively. In order to evaluate the prediction effectiveness of each model, four common error metrics were used in this paper: the mean square error (MSE), root mean square error (RMSE), mean absolute error (MAE), and mean absolute percentage error (MAPE). These error metrics helped us quantify the difference between predicted and actual values and compare model performance.
The mean square error (MSE) is one of the most commonly used metrics for evaluating regression problems, which measures the error of a model by calculating the square of the difference between the predicted and actual values and averaging it. The formula is shown in Equation (10):
M S E = 1 n i = 1 n y i y ^ i 2
where n is the total number of samples; y i is the actual value of the ith sample; and y ^ i is the predicted value of the ith sample. The smaller the calculated MSE is, the closer the predicted value is to the actual value and the better the model works.
The RMSE is the square root of the MSE, which has the same magnitude as the data unit and is easy to interpret in practical applications. A larger RMSE indicates that the model has a larger error in prediction. The formula is shown in Equation (11):
R M S E = 1 n i = 1 n y i y ^ i 2
The MAE is the average of the absolute errors between the predicted and actual values. Unlike the MSE, the MAE is less sensitive to outliers and therefore gives a “fairer” assessment of the error. The formula is shown in Equation (12):
M A E = 1 n i = 1 n y i y ^ i
The MAPE, on the other hand, is the average of the absolute value of the prediction error relative to the percentage of the actual value, which is used to assess the proportion of error of the predicted value relative to the actual value and is suitable for analyzing the percentage of error. The calculation method is shown in Equation (13).
M A P E = 1 n i = 1 n y i y ^ i y i × 100
The meaning of the variables in the equation is the same as in the above equation: n is the total number of samples; y i is the actual value of the ith sample; and y ^ i is the predicted value of the ith sample. The MAPE expresses the magnitude of the error as a percentage, which is applicable to the scenario where the actual value is non-zero, and handles the absolute value of the error, ignoring the positive and negative directions.
In this paper, the auto_arima function of the pmdarima library was used to automatically select the parameters (p, d, q) of the ARIMA model. The function scored and compared the possible parameter combinations by stepwise searching (stepwise = True) and information criteria (e.g., AIC, BIC, etc.) and finally selected the optimal set of lag and difference orders (minimizing the value of the information criteria) automatically. During the experiments, we also kept the trace = True option to see intermediate results of the search process, so as to ensure that the chosen order and number of differences were optimal in terms of the information criterion and that the model fit was good. The final output was the best model: ARIMA (1,1,2).
For the selection of the LSTM model structure and hyperparameters, we used a two-layer LSTM: the first layer contained 100 neurons (units = 100) and the second layer contained 50 neurons (units = 50). For preliminary experiments, we examined single-layer, two-layer, and more-layer (e.g., three- or four-layer) network structures, as well as different numbers of neurons (e.g., 64, 128, etc.). After comparing the training speed, model accuracy, and risk of overfitting, we finally chose this structure to avoid excessive computational overhead while providing better accuracy. The input window size was set to 10, which means that the data of the first 10 time points were used to predict the next time point. This setting was mainly based on the preliminary analysis of the autocorrelation characteristics of the sequence (e.g., period, season, etc.), and in the experiments, we tested the effect of different window lengths, such as 5, 10, 15, 20, etc., and found that time_step = 10 could better balance the prediction accuracy and the efficiency of network training. Meanwhile, Dropout (0.2) was added after each layer of LSTM to suppress overfitting, and the value of 0.2 was chosen after trying several combinations of 0.1, 0.2, 0.3, etc., on the validation set. In addition, the model was trained for a maximum of 300 epochs, but EarlyStopping (patience = 20) was enabled to stop training early and return to the optimal weights when the loss on the validation set did not decrease significantly within 20 epochs. This mechanism effectively prevented the model from overfitting in a later stage and reduced ineffective iterations. LSTM training was performed using the Adam optimizer (optimizer = ‘adam’) with a default learning rate (approximately 0.001). We also tried other optimizers such as SGD and RMSProp and different learning rate settings, but from the performance of the validation set, Adam’s default parameters provided a good balance between convergence speed and stability.
For the part with XGBoost, we performed preliminary tuning, such as setting n_estimators = 100, learning_rate = 0.1, max_depth = 6, etc. These parameters were mainly filtered by grid searching or multiple experimental comparisons (e.g., from 50 to 200 for n_estimators, 0.01 to 0.2 for learning_rate, 3 to 8 for max_depth, etc.). Of course, more refined hyper-parameter optimization methods (e.g., Bayesian optimization, stochastic search, etc.) can be used to improve the model performance in practical applications or more complex datasets.
Finally, we used linear regression as a meta-model to linearly combine the predictions of the previous models (ARIMA + LSTM and XGBoost). The hyperparameters of linear regression were relatively simple, it was mainly used for the process of training the weights, and there were no additional layers or neurons to set. If there was subsequently higher demand for the stacking method, we could consider replacing the meta-model with a more flexible regression algorithm (e.g., XGBoost, MLP, etc.) and further tuning its parameters.
To ensure repeatability and comparability, this paper completed all model training and prediction experiments in a local environment with the following hardware and software configurations:
The hardware configuration was as follows. Processor: Intel (R) Core (TM) i5-14600K @ 3.50 GHz. Memory: 32 GB RAM. OS: Windows 10 Professional Workstation Edition (64-bit, version 22H2). GPU: Integrated Graphics Intel (R) UHD Graphics 770 (training and prediction were mainly performed on the CPU in this study). Python version 3.9.18 (Anaconda distribution). The main third-party libraries used the following: numpy = 1.26.4, pandas = 2.2.3, matplotlib = 3.9.2, scikit-learn = 1.6.1, xgboost = 2.1.3, tensorflow = 2.10.0 (accelerated with MKL), pmdarima = 2.0.4, etc.
Other development tools used were the Integrated Development Environment (IDE) PyCharm 2024 and Anaconda version 24.11.3 for managing the Python environment and dependent packages.
With the above configuration, we completed all experiments including data preprocessing, model construction, training, and evaluation in a single CPU environment. Higher memory and modern CPU frequency ensured good computational efficiency. If readers need GPU acceleration, they can also install the CUDA toolkit (NVIDIA Corporation, Santa Clara, CA, USA) on top of this environment and adjust the TensorFlow/PyTorch version accordingly to achieve faster training speed.
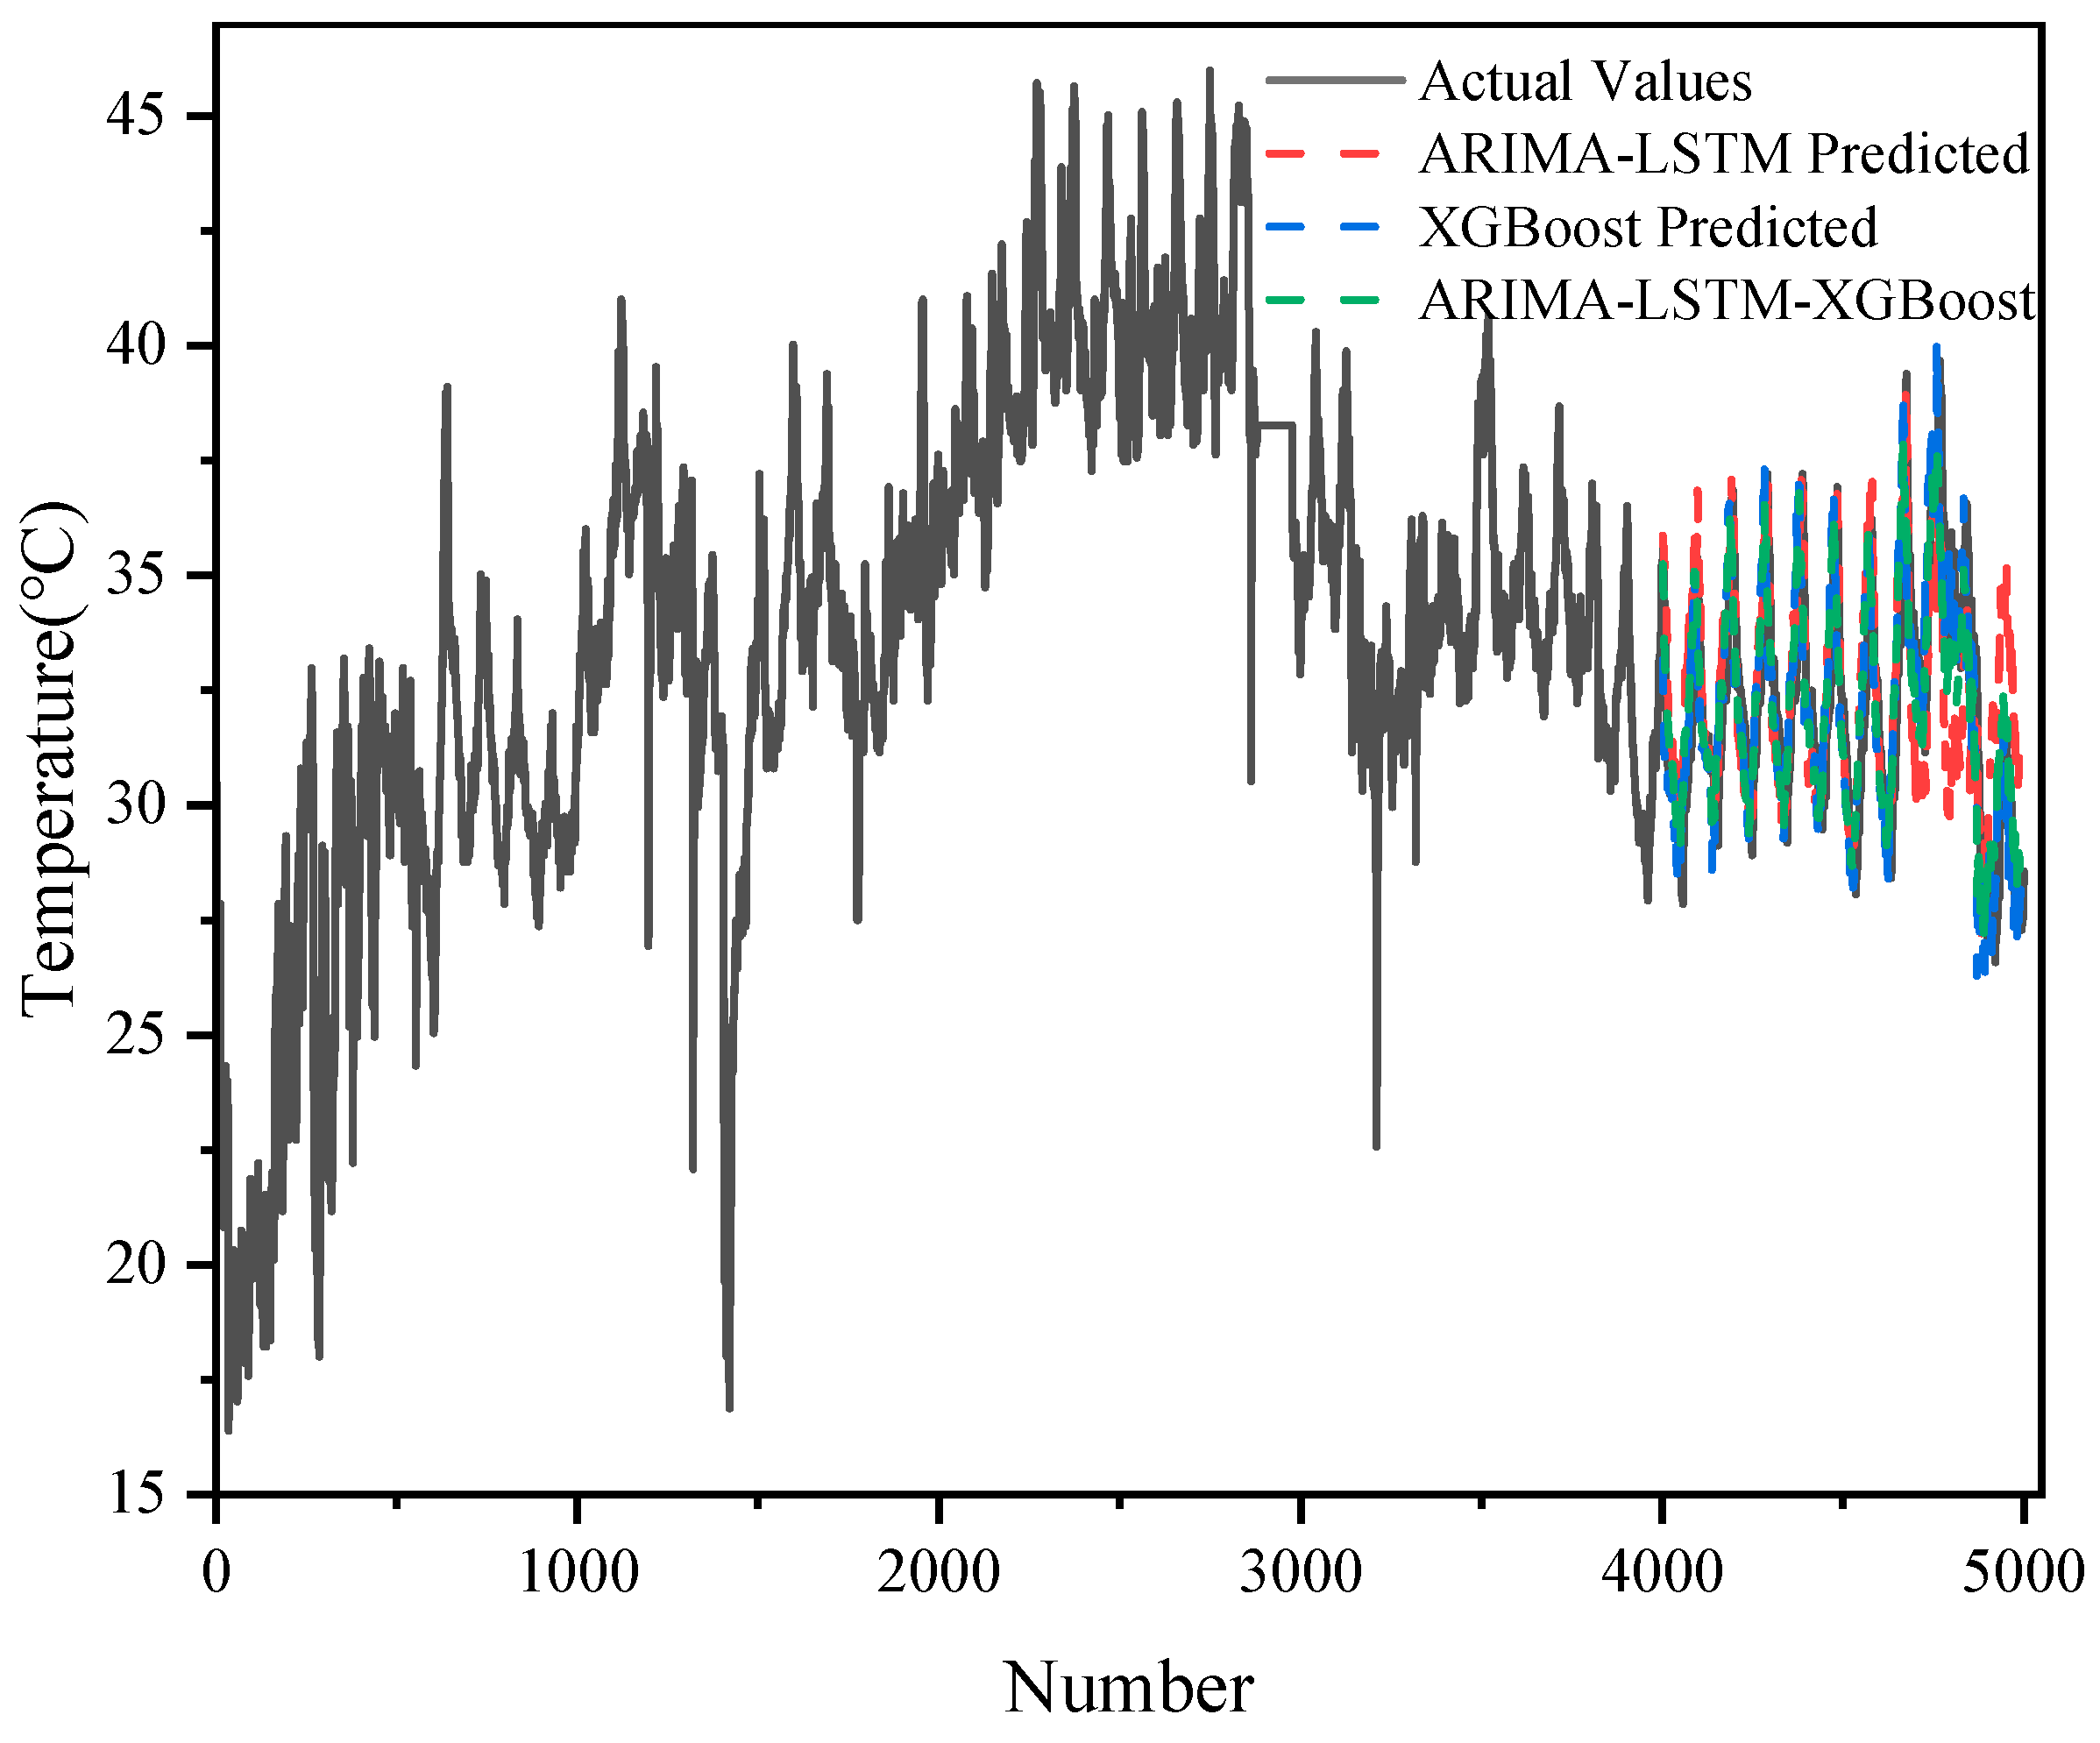
As shown in Figure 5 and Figure 6, the results of the prediction of 5000 sets of transformer oil temperature data by the three models (ARIMA-LSTM, XGBoost, and ARIMA-LSTM-XGBoost hybrid model) are demonstrated and compared with the actual oil temperature data (actual values). The graphs show the trend of the actual values with respect to the predicted values of each model.
Although ARIMA-LSTM captured some of the trends in oil temperature changes, there was a certain degree of bias in its prediction results, especially in the region where the data fluctuated a lot, and there was a large difference between the predicted and actual values.
XGBoost was able to capture some nonlinear patterns in the oil temperature data well, but there was a large error in the capture of the overall trend.
The ARIMA-LSTM-XGBoost hybrid model performed best. It combined the linear trend capturing ability of ARIMA, the nonlinear modeling ability of LSTM, and the ability of XGBoost to capture complex patterns and was able to give prediction results closest to the actual values in all samples, with the lowest error, especially in the regions with large data fluctuations.
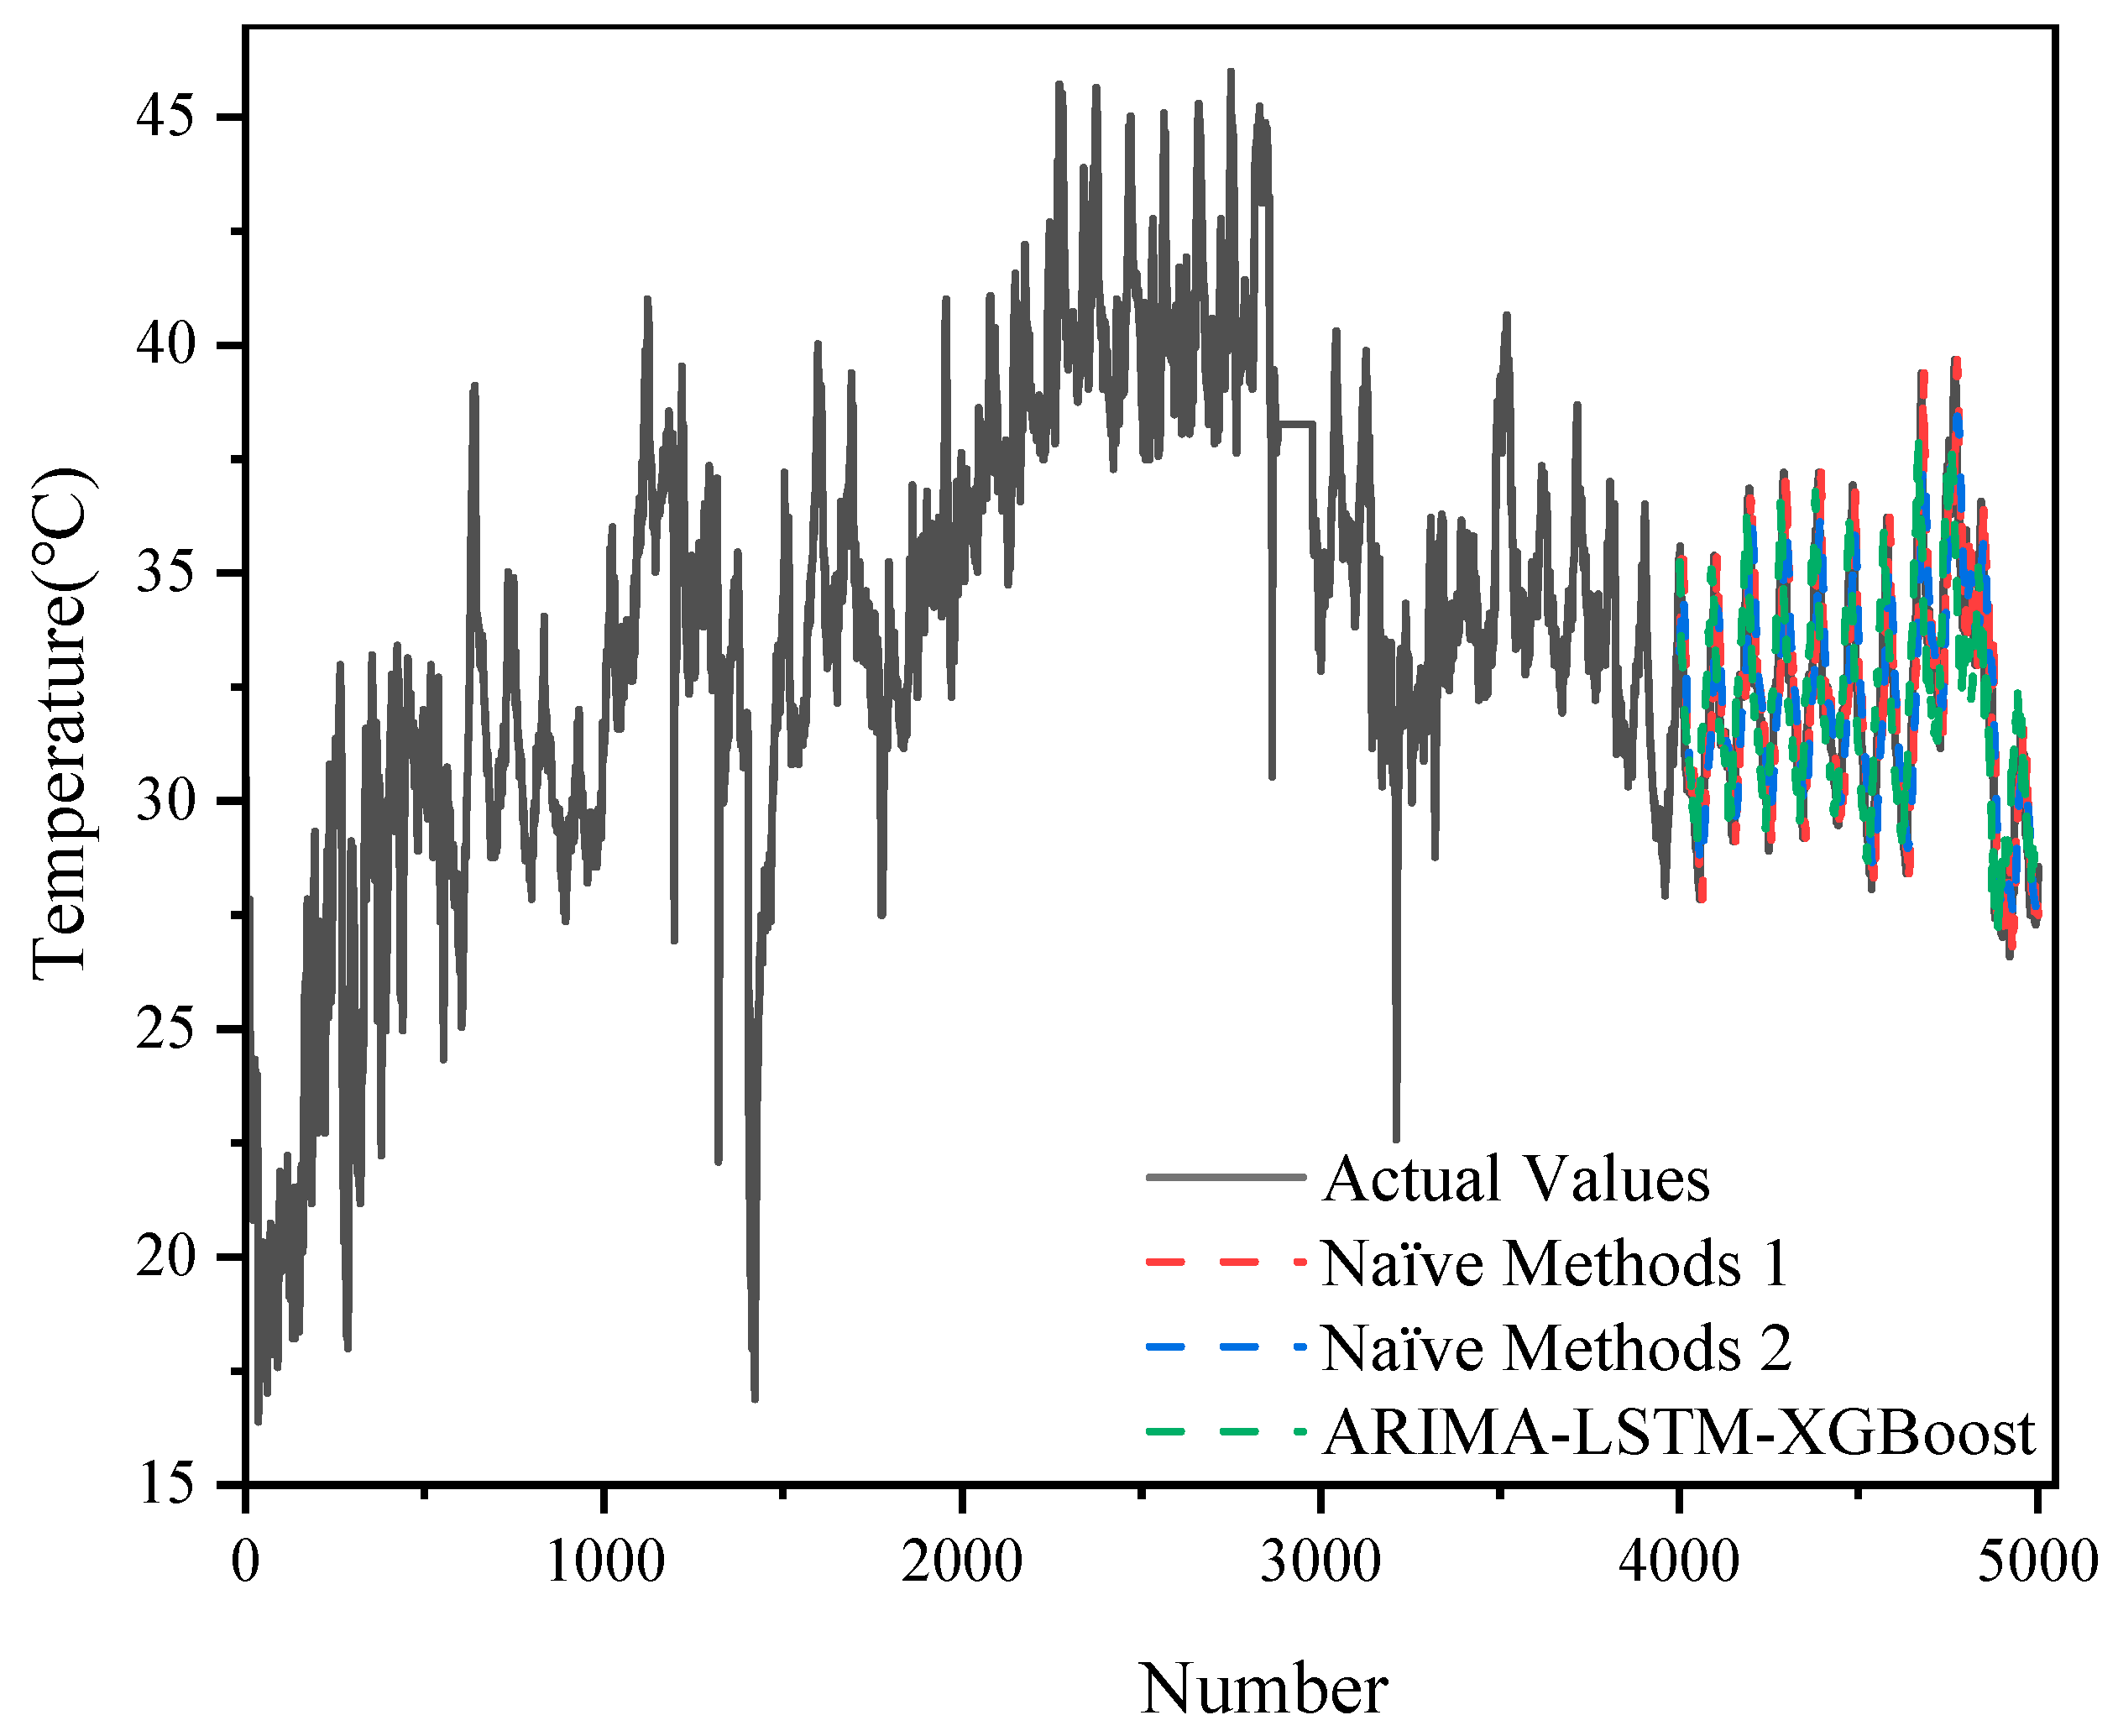
In addition, with the 5000 datasets, we also compared the hybrid model with two naive methods, as shown in Figure 7 and Figure 8.
The ARIMA-LSTM model exhibited lower errors (MSE = 1.1268; RMSE = 1.0615; MAE = 0.8883; MAPE = 2.22%), outperforming the XGBoost and naïve methods used alone.
The relatively high error of the XGBoost model (e.g., MSE = 3.2001; RMSE = 1.7889) may be related to its limitations in capturing the temporal and trend nature of the time series. The performance of the two naïve methods was relatively close (MSE around 1.67–1.74, RMSE around 1.29–1.32), and although they were very computationally inexpensive, they fell short when it came to capturing the complex dynamic features of the data.
The ARIMA-LSTM-XGBoost hybrid model further reduced the various error metrics (MSE = 0.9908; RMSE = 0.9954; MAE = 0.7984; MAPE = 1.98%), showing significant performance improvement. This suggests that the hybrid model was able to take full advantage of ARIMA-LSTM’s modeling of temporal features and XGBoost’s ability to capture nonlinear relationships, thus outperforming the single model and simple naïve method in terms of overall prediction accuracy.
The error metrics for the five models are shown in Table 2.
Based on the comparison of the four error metrics (MSE, RMSE, MAE, and MAPE) mentioned above, the ARIMA-LSTM-XGBoost hybrid model performed the best in all the evaluated metrics, which indicates that the model was able to better capture the changing patterns of the transformer oil temperature data and provide more accurate predictions. The model combined the linear trend capturing ability of the ARIMA model, the nonlinear modeling ability of the LSTM network, and the complex pattern recognition ability of the XGBoost algorithm, resulting in significantly improved prediction accuracy.
In contrast, the XGBoost model performed poorly in all error metrics, and although it was able to capture nonlinear features in the oil temperature data, it was inferior to the ARIMA-LSTM and ARIMA-LSTM-XGBoost combination models in terms of overall prediction accuracy.
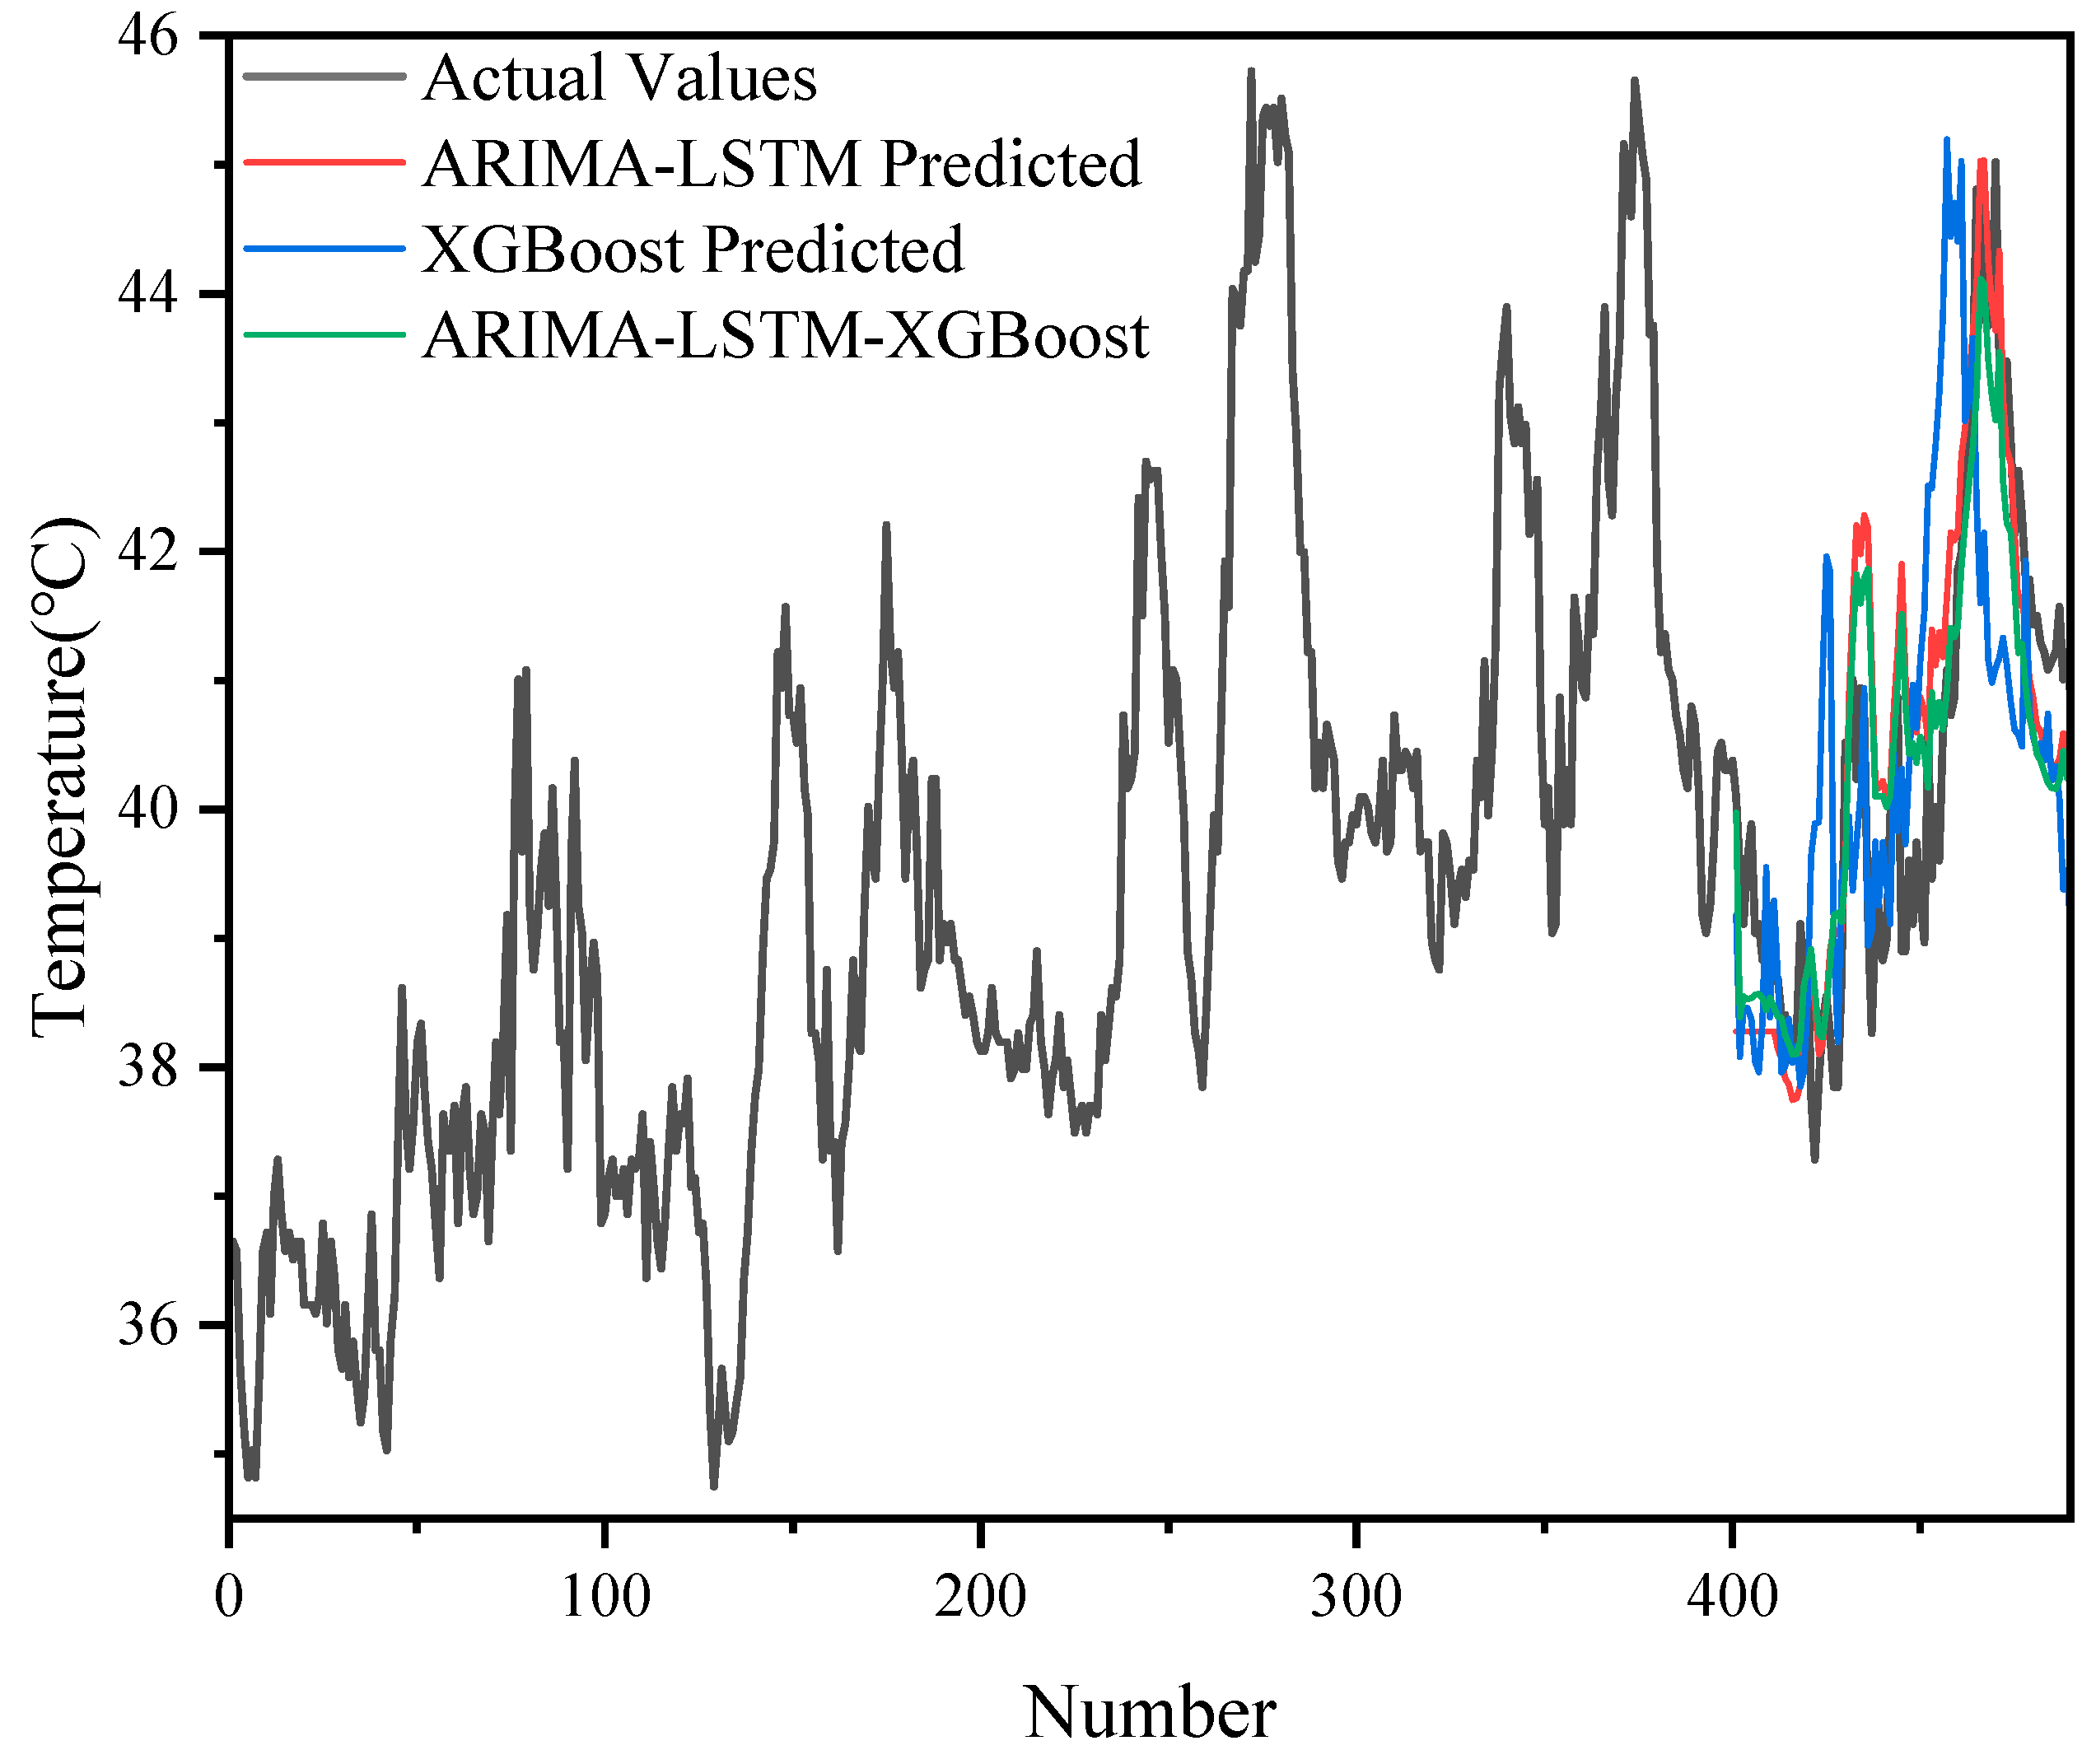
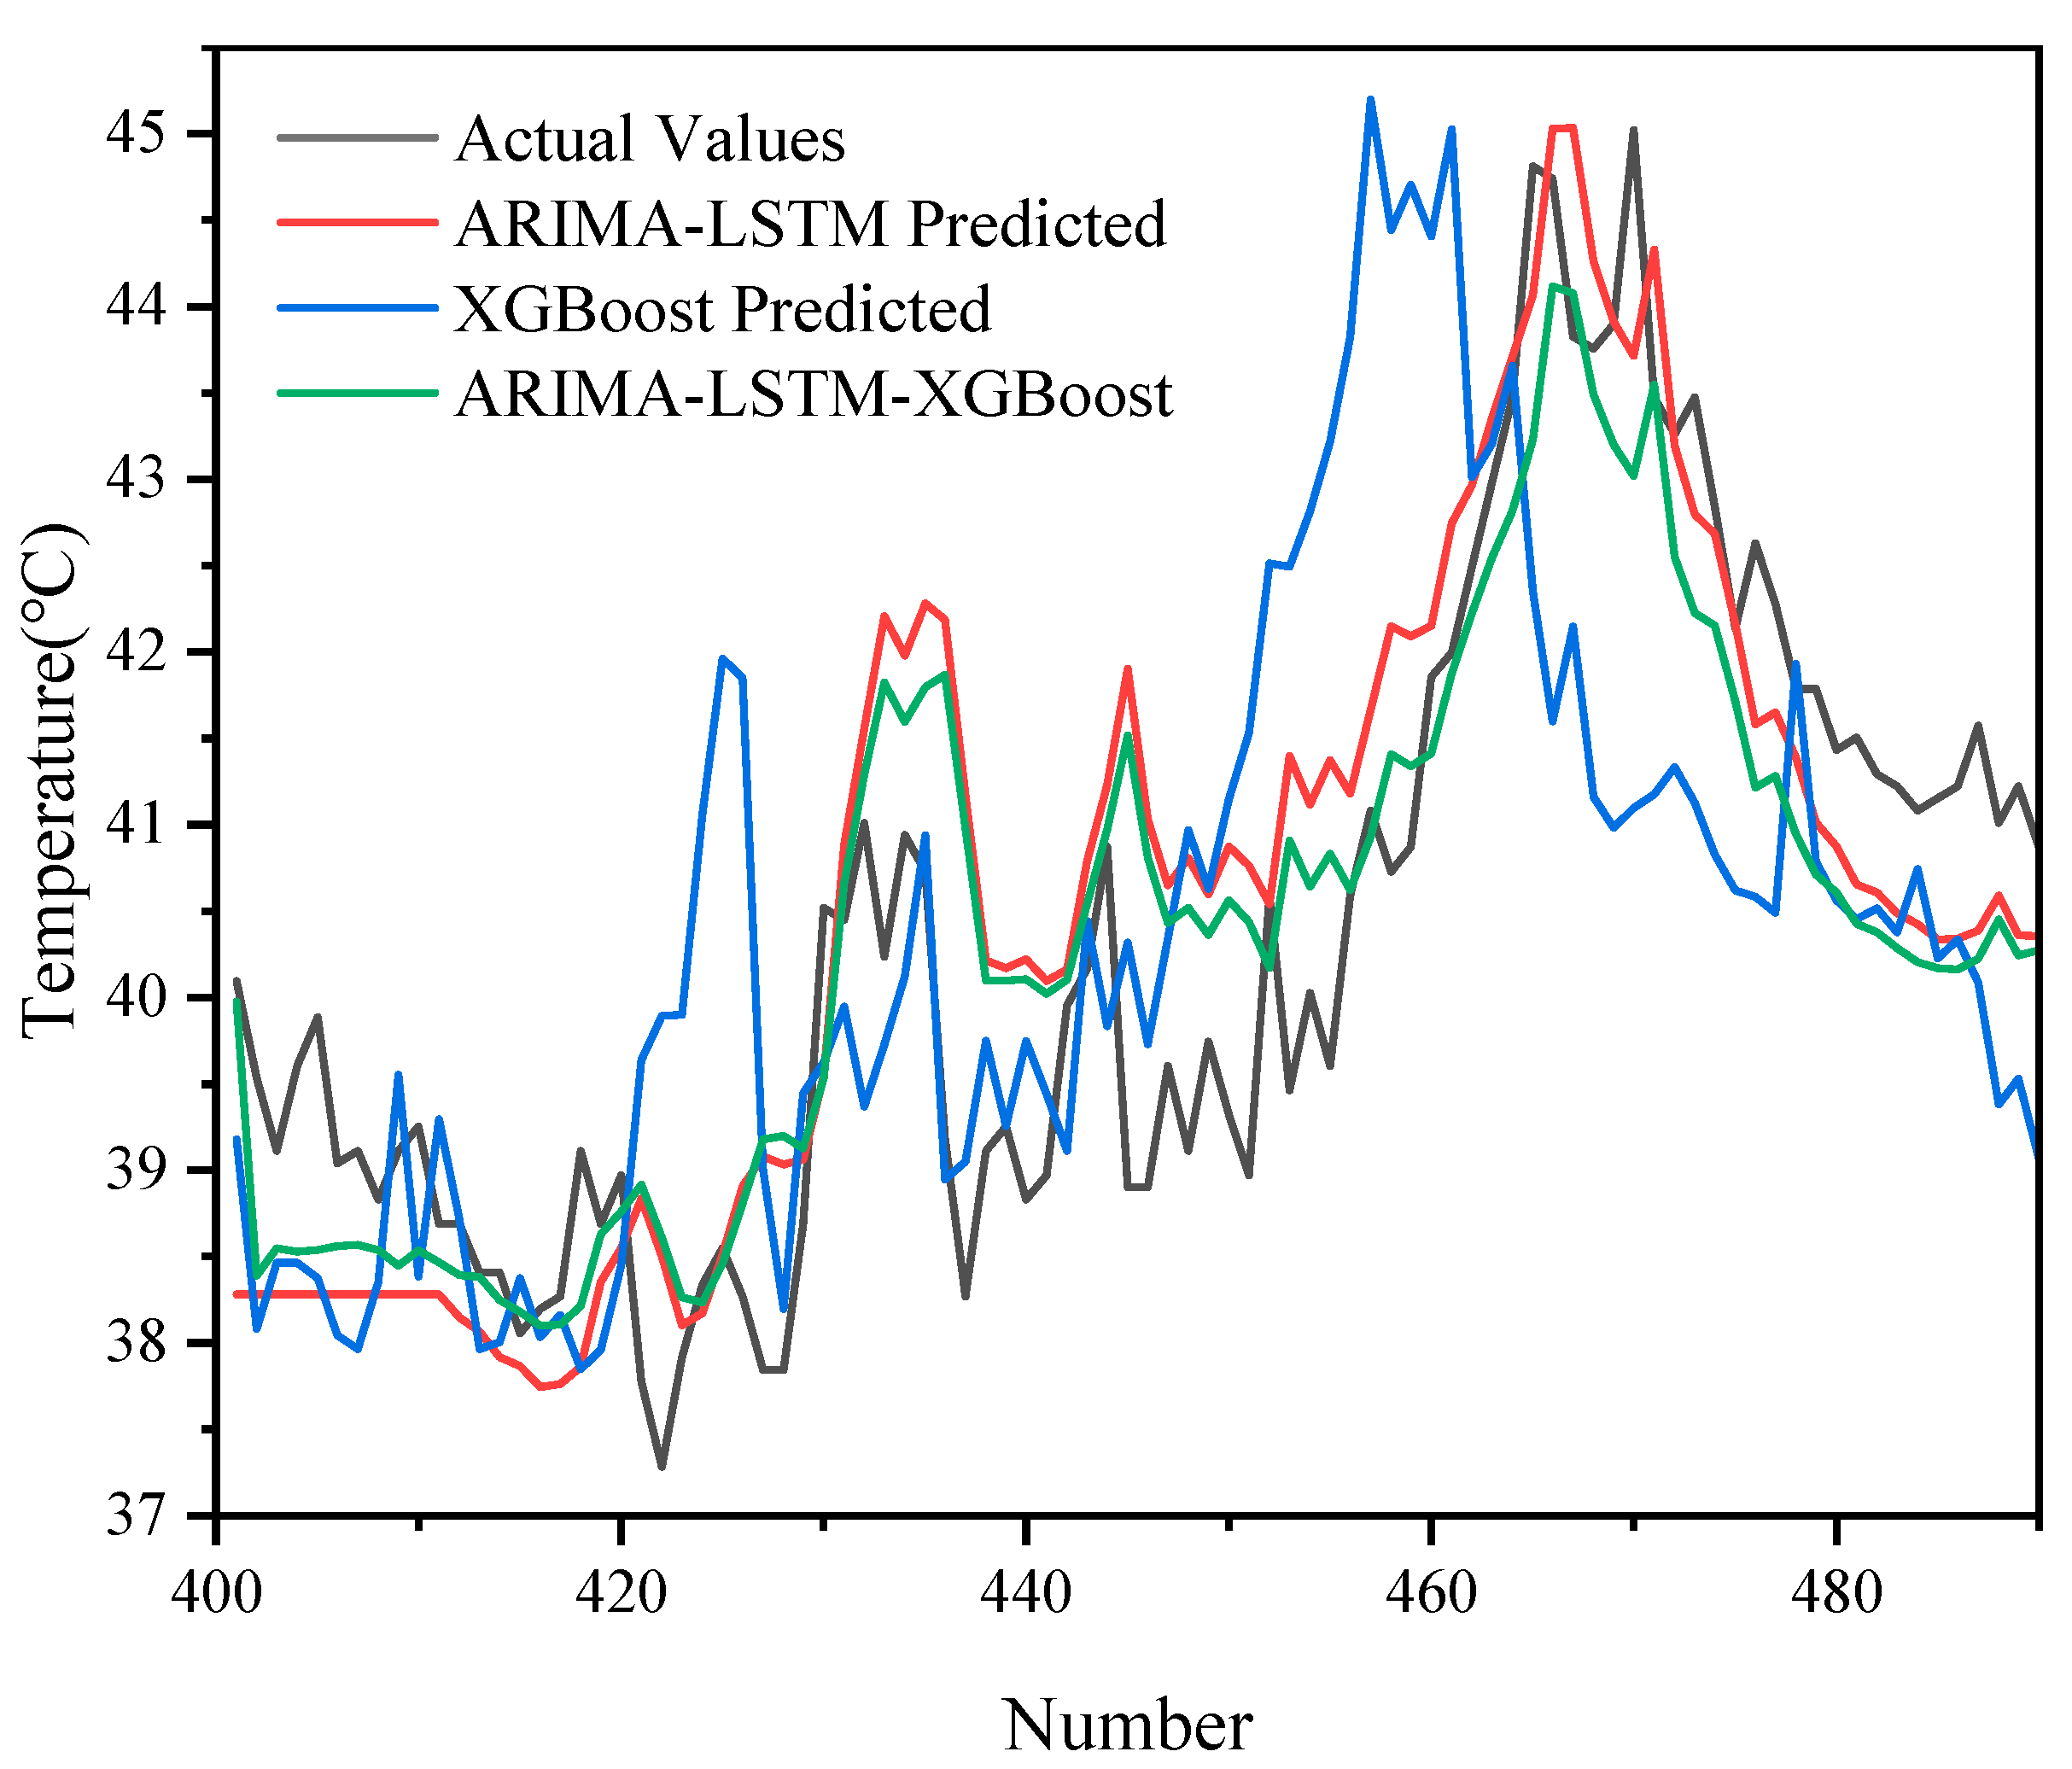
The prediction results of different models (ARIMA-LSTM, XGBoost, ARIMA-LSTM-XGBoost) on 500 sets of data are demonstrated in Figure 9 and Figure 10, and it can be seen that the ARIMA-LSTM model captured the overall trend of the oil temperature better, but there was still some prediction bias in some periods, especially in the period of large fluctuations in the model. The prediction error of XGBoost was still more obvious in some periods with large fluctuations, and it could not follow the changes in the actual values accurately. The ARIMA-LSTM-XGBoost hybrid model had the highest prediction accuracy at all time points and could most accurately simulate the fluctuation in oil temperature data.
Similarly, we also compared the naive approaches with the hybrid model in the case of 500 sets of data, and the results are shown in Figure 11 and Figure 12.
Overall, the error metrics for each model increased compared to those for the 5000 datasets, reflecting the significant impact of data volume on model training and prediction effectiveness.
Although the performance of the ARIMA-LSTM model decreased significantly with reduced data volume (MSE = 3.6481; RMSE = 1.9100), the hybrid model ARIMA-LSTM-XGBoost was still able to maintain low errors (MSE = 1.9174; RMSE = 1.3847; MAPE = 3.63%), which demonstrates that it was more robust when data were scarce.
Compared with XGBoost (MSE = 2.4710; RMSE = 1.5719) and the naïve methods (MSE about 2.86–2.97), the hybrid model still achieved better prediction results with limited data volume, which further validates its advantages.
Table 3 shows the results of the comparison of the error metrics (MSE, RMSE, MAE, and MAPE) of the five models on 500 sets of data.
Through the above comparison, we can see that although the naïve methods have obvious computational advantages and can provide reasonable predictions in some simple cases, its shortcomings are the following: it is weak in modeling nonlinear and complex dynamic relationships, and it makes it easy to ignore the potential characteristics of the data.
Complex models, especially hybrid models, on the other hand, by integrating the strengths of statistical and machine learning methods, not only improve prediction accuracy but also show better adaptability when facing datasets of different sizes. Although the computational burden of hybrid models is higher than that of naïve methods, the experimental results show that the improvement in prediction accuracy is enough to make up for this disadvantage, especially in scenarios where prediction accuracy is required to be high in practical applications; complex models are more capable of meeting these practical needs.
The XGBoost model outperformed the ARIMA-LSTM, especially in the MSE and RMSE metrics, where it showed lower prediction errors. The ARIMA-LSTM-XGBoost hybrid model performed the best in all the error metrics, especially in the MSE, RMSE, and MAE, where it showed the smallest errors, proving that the hybrid model had an obvious advantage.
The XGBoost model did not perform as well as ARIMA-LSTM in the prediction results on 5000 sets of data. The reason for this phenomenon may be that although the XGBoost model is able to capture complex nonlinear features when dealing with large-scale data, it is weak in recognizing global patterns in data, which leads to a shortfall in capturing the overall trend. ARIMA-LSTM, on the other hand, is able to capture linear trends through the AR and MA processes, which, combined with the nonlinear modeling of LSTM, can better accommodate patterns in large-scale data.
However, the XGBoost model outperformed ARIMA-LSTM in the prediction with 500 sets of data. This may be due to the fact that the 500 sets of data were simpler, and XGBoost was able to deal better with the nonlinear features and fluctuating trends in them, whereas ARIMA-LSTM failed to take full advantage of its strengths. In this case, XGBoost was able to quickly capture the nonlinear changes in the data through the gradient boosting algorithm, thus improving the prediction accuracy.
From the above analysis, it can be seen that the ARIMA-LSTM-XGBoost hybrid model performed well on datasets of different sizes, especially in capturing complex patterns and high-volatility components. By combining the linear trend of ARIMA, the nonlinear modeling capability of LSTM, and the powerful pattern recognition capability of XGBoost, the hybrid model effectively compensated for the shortcomings of a single model and significantly improved the prediction accuracy. The combined model was able to provide the most accurate prediction results for both large-scale data (5000 sets of data) and small-scale data (500 sets of data) prediction tasks, proving its effectiveness and superiority in transformer oil temperature prediction tasks.

5. Conclusions

In this paper, a hybrid model based on ARIMA, LSTM, and XGBoost is proposed with the aim of improving the accuracy of transformer oil temperature prediction, and the performances of ARIMA-LSTM, XGBoost, and ARIMA-LSTM-XGBoost hybrid models in predicting transformer oil temperature are compared. XGBoost, while more effective for smaller datasets, faces challenges when dealing with larger datasets because of its difficulty in capturing long-term linear trends. In contrast, ARIMA-LSTM performs better in handling linear growth and short-term fluctuations and is therefore more effective in predicting transformer oil temperatures over longer periods of time. The ARIMA-LSTM-XGBoost hybrid model combines the strengths of these three methods to significantly improve prediction accuracy. The model combines ARIMA’s ability to capture linear trends, LSTM’s ability to simulate nonlinear fluctuations, and XGBoost’s ability to detect complex patterns, thus providing a more robust method for oil temperature prediction. The results of the error analysis show that the ARIMA-LSTM-XGBoost hybrid model outperformed the other two models in all key error metrics. The MSE and MAPE of the hybrid model were significantly lower than those of the ARIMA-LSTM and XGBoost models alone. The MSE of the hybrid model was approximately 40% lower compared to that of the XGBoost model and 45% lower compared to that of the ARIMA-LSTM model, demonstrating the superior ability of the hybrid model to reduce prediction error and improve overall accuracy. In summary, the ARIMA-LSTM-XGBoost hybrid model proposed in this study performs well on datasets of different sizes, effectively compensates for the shortcomings of a single model, and significantly improves the prediction accuracy. The combined model is able to provide the most accurate prediction results in both large-scale data and small-scale data prediction tasks, proving its effectiveness and superiority in transformer top-oil temperature prediction.
In addition, the experimental results incorporating the two naïve methods further emphasize the advantages of the hybrid model. For the 5000-data-point dataset, naïve method 1 and naïve method 2 yielded MSE values of 1.7370 and 1.6716, respectively, values that, while competitive in terms of computational efficiency, still fall short of the hybrid model’s MSE of 0.9908. Similarly, for the 500-data-point dataset, the naïve methods produced MSEs of 2.8611 and 2.9741, respectively, compared to 1.9174 for the hybrid model. These findings indicate that although naïve methods offer a valuable baseline by virtue of their simplicity and low computational burden, they lack the capability to fully capture the complex, dynamic behavior of transformer oil temperatures. By effectively integrating ARIMA’s linear trend modeling, LSTM’s nonlinear fluctuation simulation, and XGBoost’s strength in detecting intricate patterns, the ARIMA-LSTM-XGBoost hybrid model achieves significantly lower error metrics across various data scales, thereby establishing itself as a superior forecasting tool in both large-scale and small-scale prediction tasks.
Moving forward, future work can incorporate additional features (e.g., weather variables, load profiles) to enrich model inputs and enhance real-world applicability [1]. More sophisticated deep learning frameworks—such as CNN-LSTM or attention-based architectures—could further capture multi-scale temporal dependencies [16,26], and evolutionary optimization or intelligent search methods may be employed to refine hyperparameters automatically. There is also considerable potential in coupling data-driven models with physical knowledge (e.g., thermal modeling or digital twins) to improve both interpretability and predictive accuracy under extreme operating conditions [11,40]. Finally, deploying a lightweight version of the hybrid model for real-time or edge applications can strengthen preventive maintenance strategies by enabling rapid anomaly detection and resource-efficient interventions, thereby reducing operational risks, lowering costs, and prolonging transformer life [5,6,9,17].

Author Contributions

Conceptualization, X.H. and X.Z.; methodology, X.H. and F.T.; software, X.H.; validation, X.H., Z.N. and F.T.; formal analysis, X.H.; investigation, X.H.; resources, X.Z.; data curation, Y.C., Q.Z. and C.Y.; writing—original draft preparation, X.H. and F.T.; writing—review and editing, X.Z., Z.N., Y.C., Q.Z. and C.Y.; visualization, Z.N. and X.Z.; supervision, X.H.; project administration, Y.C., Q.Z. and C.Y.; funding acquisition, X.H. All authors have read and agreed to the published version of the manuscript.

Funding

This work was supported by the Science Project of China Southern Power Grid Company Limited Research on the Performance Evaluation of Key Equipment and Intelligent Operation and Maintenance Strategies for Converter Stations under the Conditions of Interleaved Direct and Harmonic Superposition. The project number is CGYKJXM20220321.

Data Availability Statement

The data presented in this study are available upon request from the corresponding author due to ethical and legal reasons.

Conflicts of Interest

Authors X.H., X.Z., F.T. and Z.N. were employed by the company Guangzhou Bureau of China Southern Power Grid Co., Ltd., Ultra High Voltage Transmission Company. The remaining authors declare that the research was conducted in the absence of any commercial or financial relationships that could be construed as a potential conflict of interest.

References

  1. Guo, Y.; Chang, Y.; Lu, B. A review of temperature prediction methods for oil-immersed transformers. Measurement 2025, 239, 115383. [Google Scholar] [CrossRef]
  2. Singh, J.; Singh, S.; Singh, A. Distribution transformer failure modes, effects and criticality analysis (FMECA). Eng. Fail. Anal. 2019, 99, 180–191. [Google Scholar] [CrossRef]
  3. Sun, Y.; Hua, Y.; Wang, E.; Li, N.; Ma, S.; Zhang, L.; Hu, Y. A temperature-based fault pre-warning method for the dry-type transformer in the offshore oil platform. Int. J. Electr. Power Energy Syst. 2020, 123, 106218. [Google Scholar] [CrossRef]
  4. Thiviyanathan, V.A.; Ker, P.J.; Leong, Y.S.; Abdullah, F.; Ismail, A.; Zaini Jamaludin, M. Power transformer insulation system: A review on the reactions, fault detection, challenges and future prospects. Alex. Eng. J. 2022, 61, 7697–7713. [Google Scholar] [CrossRef]
  5. Zhao, Z.; Xu, J.; Zang, Y.; Hu, R. Adaptive Abnormal Oil Temperature Diagnosis Method of Transformer Based on Concept Drift. Appl. Sci. 2021, 11, 6322. [Google Scholar] [CrossRef]
  6. Fauzi, N.A.; Ali, N.H.N.; Ker, P.J.; Thiviyanathan, V.A.; Leong, Y.S.; Sabry, A.H.; Jamaludin, M.Z.B.; Lo, C.K.; Mun, L.H. Fault Prediction for Power Transformer Using Optical Spectrum of Transformer Oil and Data Mining Analysis. IEEE Access 2020, 8, 136374–136381. [Google Scholar] [CrossRef]
  7. Beheshti Asl, M.; Fofana, I.; Meghnefi, F. Review of Various Sensor Technologies in Monitoring the Condition of Power Transformers. Energies 2024, 17, 3533. [Google Scholar] [CrossRef]
  8. Zheng, H.; Li, X.; Feng, Y.; Yang, H.; Lv, W. Investigation on micro-mechanism of palm oil as natural ester insulating oil for overheating thermal fault analysis of transformers. High Volt. 2022, 7, 812–824. [Google Scholar] [CrossRef]
  9. Vatsa, A.; Hati, A.S.; Rathore, A.K. Enhancing Transformer Health Monitoring with AI-Driven Prognostic Diagnosis Trends: Overcoming Traditional Methodology’s Computational Limitations. IEEE Ind. Electron. Mag. 2024, 18, 30–44. [Google Scholar] [CrossRef]
  10. Meshkatoddini, M.R. Aging Study and Lifetime Estimation of Transformer Mineral Oil. Am. J. Eng. Appl. Sci. 2008, 1, 384–388. [Google Scholar] [CrossRef]
  11. Yang, L.; Chen, L.; Zhang, F.; Ma, S.; Zhang, Y.; Yang, S. A Transformer Oil Temperature Prediction Method Based on Data-Driven and Multi-Model Fusion. Processes 2025, 13, 302. [Google Scholar] [CrossRef]
  12. Zhu, J.; Xu, Y.; Peng, C.; Zhao, S. Fault analysis of oil-immersed transformer based on digital twin technology. J. Comput. Electron. Inf. Manag. 2024, 14, 9–15. [Google Scholar] [CrossRef]
  13. Zhang, P.; Zhang, Q.; Hu, H.; Hu, H.; Peng, R.; Liu, J. Research on Transformer Temperature Early Warning Method Based on Adaptive Sliding Window and Stacking. Electronics 2025, 14, 373. [Google Scholar] [CrossRef]
  14. Boujamza, A.; Lissane Elhaq, S. Predicting Oil Temperature in Electrical Transformers Using Neural Hierarchical Interpolation. J. Eng. 2025, 2025, 9714104. [Google Scholar] [CrossRef]
  15. Liang, Z.; Fang, Y.; Cheng, H.; Sun, Y.; Li, B.; Li, K.; Zhao, W.; Sun, Z.; Zhang, Y. Innovative Transformer Life Assessment Considering Moisture and Oil Circulation. Energies 2024, 17, 429. [Google Scholar] [CrossRef]
  16. Zou, D.; Xu, H.; Quan, H.; Yin, J.; Peng, Q.; Wang, S.; Dai, W.; Hong, Z. Top-Oil Temperature Prediction of Power Transformer Based on Long Short-Term Memory Neural Network with Self-Attention Mechanism Optimized by Improved Whale Optimization Algorithm. Symmetry 2024, 16, 1382. [Google Scholar] [CrossRef]
  17. Huang, W.; Shao, C.; Hu, B.; Li, W.; Sun, Y.; Xie, K.; Zio, E.; Li, W. A restoration-clustering-decomposition learning framework for aging-related failure rate estimation of distribution transformers. Reliab. Eng. Syst. Saf. 2023, 232, 109043. [Google Scholar] [CrossRef]
  18. Dehghanian, P.; Overbye, T.J. Temperature-Triggered Failure Hazard Mitigation of Transformers Subject to Geomagnetic Disturbances. In Proceedings of the 2021 IEEE Texas Power and Energy Conference (TPEC), College Station, TX, USA, 2–5 February 2021; pp. 1–6. [Google Scholar]
  19. IEEE Std C57.91-2011 (Revision of IEEE Std C57.91-1995); IEEE Guide for Loading Mineral-Oil-Immersed Transformers and Step-Voltage Regulators. IEEE: New York, NY, USA, 2012; pp. 1–123.
  20. Hippert, H.S.; Pedreira, C.E.; Souza, R.C. Neural networks for short-term load forecasting: A review and evaluation. IEEE Trans. Power Syst. 2001, 16, 44–55. [Google Scholar] [CrossRef]
  21. Xi, Y.; Lin, D.; Yu, L.; Chen, B.; Jiang, W.; Chen, G. Oil temperature prediction of power transformers based on modified support vector regression machine. Int. J. Emerg. Electr. Power Syst. 2023, 24, 367–375. [Google Scholar] [CrossRef]
  22. Huang, S.-J.; Shih, K.-R. Short-term load forecasting via ARMA model identification including non-Gaussian process considerations. IEEE Trans. Power Syst. 2003, 18, 673–679. [Google Scholar]
  23. Smyl, S. A hybrid method of exponential smoothing and recurrent neural networks for time series forecasting. Int. J. Forecast. 2020, 36, 75–85. [Google Scholar] [CrossRef]
  24. Deng, W.; Yang, J.; Liu, Y.; Wu, C.; Zhao, Y.; Liu, X.; You, J. A Novel EEMD-LSTM Combined Model for Transformer Top-Oil Temperature Prediction. In Proceedings of the 2021 8th International Forum on Electrical Engineering and Automation (IFEEA), Xi’an, China, 3–5 September 2021; pp. 52–56. [Google Scholar]
  25. Sui, J.; Ling, X.; Xiang, X.; Zhang, G.; Zhang, X. Transformer Oil Temperature Prediction Based on Long and Short-term Memory Networks. In Proceedings of the 2021 IEEE International Conference on Big Data (Big Data), Orlando, FL, USA, 15–18 December 2021; pp. 6029–6031. [Google Scholar]
  26. Chen, T.; Guo, S.; Zhang, Z.; Yuan, Y.; Gao, J. A Method for Predicting Transformer Oil-Dissolved Gas Concentration Based on Multi-Window Stepwise Decomposition with HP-SSA-VMD-LSTM. Electronics 2024, 13, 2881. [Google Scholar] [CrossRef]
  27. Nishio, M.; Nishizawa, M.; Sugiyama, O.; Kojima, R.; Yakami, M.; Kuroda, T.; Togashi, K. Computer-aided diagnosis of lung nodule using gradient tree boosting and Bayesian optimization. PLoS ONE 2018, 13, e0195875. [Google Scholar] [CrossRef]
  28. Alizamir, M.; Wang, M.; Ikram, R.M.A.; Gholampour, A.; Ahmed, K.O.; Heddam, S.; Kim, S. An interpretable XGBoost-SHAP machine learning model for reliable prediction of mechanical properties in waste foundry sand-based eco-friendly concrete. Results Eng. 2025, 25, 104307. [Google Scholar] [CrossRef]
  29. Box, G.E.P.; Jenkins, G.M.; Reinsel, G.C.; Ljung, G.M. Time Series Analysis: Forecasting and Control. Statistician 1978, 27, 265. [Google Scholar]
  30. Hyndman, R.J.; Athanasopoulos, G. Forecasting: Principles and Practice; OTexts: Melbourne, Australia, 2013. [Google Scholar]
  31. Adhikari, R.; Agrawal, R.K. An Introductory Study on Time Series Modeling and Forecasting. arXiv 2013, arXiv:1302.6613. [Google Scholar]
  32. Hochreiter, S.; Schmidhuber, J. Long Short-Term Memory. Neural Comput. 1997, 9, 1735–1780. [Google Scholar] [CrossRef]
  33. Lindemann, B.; Müller, T.; Vietz, H.; Jazdi, N.; Weyrich, M. A survey on long short-term memory networks for time series prediction. Procedia CIRP 2021, 99, 650–655. [Google Scholar] [CrossRef]
  34. Devi, S.L.R.P.S.; Krishna, C. Forecasting the future: LSTM-based load prediction for smart solar microgrids. In AIP Conference Proceedings; AIP Publishing: Long Island, NY, USA, 2025; Volume 3280. [Google Scholar]
  35. Chen, T.; Guestrin, C. XGBoost: A Scalable Tree Boosting System. In Proceedings of the 22nd ACM SIGKDD International Conference on Knowledge Discovery and Data Mining, San Francisco, CA, USA, 13–17 August 2016. [Google Scholar]
  36. Cui, J.; Kuang, W.; Geng, K.; Bi, A.; Bi, F.; Zheng, X.; Lin, C. Advanced Short-Term Load Forecasting with XGBoost-RF Feature Selection and CNN-GRU. Processes 2024, 12, 2466. [Google Scholar] [CrossRef]
  37. Chatfield, C. Time-Series Forecasting. Significance 2005, 2, 131–133. [Google Scholar] [CrossRef]
  38. Briggs, W.M. Forecasting: Methods and Applications. J. Am. Stat. Assoc. 1999, 94, 345–346. [Google Scholar] [CrossRef]
  39. Zhou, H.; Zhang, S.; Peng, J.; Zhang, S.; Li, J.; Xiong, H.; Zhang, W. Informer: Beyond Efficient Transformer for Long Sequence Time-Series Forecasting. arXiv 2020, arXiv:2012.07436. [Google Scholar] [CrossRef]
  40. Pengfei, T.; Zhonghao, Z.; Jie, T.; Tianhang, L.; Can, H.; Zihao, Q. Predicting transformer temperature field based on physics-informed neural networks. High Volt. 2024, 9, 839–852. [Google Scholar]
Figure 1. LSTM network structure.
Energies 18 01432 g001
Figure 2. LSTM cell structure.
Energies 18 01432 g002
Figure 3. ARIMA-LSTM-XGBoost technical framework.
Energies 18 01432 g003
Figure 4. Transformer top-oil temperature data offset plot.
Energies 18 01432 g004
Figure 5. The predictive effect of each model in the case of 5000 datasets.
Energies 18 01432 g005
Figure 6. A scaled-up view of the predictive effect of each model for 5000 datasets.
Energies 18 01432 g006
Figure 7. A comparison of prediction results between the naïve methods and the hybrid model with 5000 sets of data.
Energies 18 01432 g007
Figure 8. An enlarged view of the comparison between the naïve methods and the hybrid model with 5000 datasets.
Energies 18 01432 g008
Figure 9. The predictive effect of each model in the case of 500 datasets.
Energies 18 01432 g009
Figure 10. A scaled-up view of the predictive effect of each model for 500 datasets.
Energies 18 01432 g010
Figure 11. A comparison of prediction results between the naïve methods and the hybrid model with 500 sets of data.
Energies 18 01432 g011
Figure 12. An enlarged view of the comparison between the naïve method and the hybrid model with 500 datasets.
Energies 18 01432 g012
Table 1. Relationship between oil temperature and transformer failure.
Transformer Top-Oil Temperature (°C)Transformer ConditionPossible IssuesDegree of Risk
30~39OptimalNo issuesNo issues
40~59Mildly Elevated OilInitial agingSlight wear and tear
60~79Elevated Oil TemperatureInsulation breakdownModerate failure probability
80~99High Oil TemperatureIncreased risk of oil failureHigh likelihood of failure
100 or moreCritical Oil TemperatureOil degradation, insulation collapseImminent transformer breakdown
Table 2. The error of each model in the case of 5000 datasets.
MODLEMSERMSEMAEMAPE
ARIMA-LSTM1.12681.06150.88832.2160%
XGBoost3.20011.78891.43713.5322%
naïve method 11.73701.31791.07073.29%
naïve method 21.67161.29291.09183.36%
ARIMA-LSTM-XGBoost0.99080.99540.79841.9824%
Table 3. Errors of each model in the case of 500 datasets.
MODLEMSERMSEMAEMAPE
ARIMA-LSTM3.64811.91001.54184.8500%
XGBoost2.47101.57191.29333.9710%
naïve methods 12.86111.69151.32673.23%
naïve methods 22.97411.72451.40243.41%
ARIMA-LSTM-XGBoost1.91741.38471.17313.6291%
Disclaimer/Publisher’s Note: The statements, opinions and data contained in all publications are solely those of the individual author(s) and contributor(s) and not of MDPI and/or the editor(s). MDPI and/or the editor(s) disclaim responsibility for any injury to people or property resulting from any ideas, methods, instructions or products referred to in the content.

