Abstract
The implementation of a system for the acquisition, transferring and processing of data essential for marine engine diagnostics is the basis of condition maintenance. Determining the most influential operating parameters, and conducting monitoring, analysis and taking action based on expert knowledge prevents downtime due to possible malfunctions. Timely corrections and replacements of worn parts based on condition diagnostics enable maintenance planning, which reduces the frequency of maintenance and the accumulation of unnecessary spare parts in warehouses. For research purposes, a system for remote data collection from electronically controlled marine engines was developed and applied. The system was installed on a four-stroke high-speed propulsion engine from a ferry, and the operating parameters of the engine were monitored during regular sailing in order to detect irregularities and possible failures at an early stage. The measurement system monitored the parameters obtained through the electronic engine control module via the J1939 protocol, and in this paper, the following relevant engine parameters were analyzed: engine speed, boost pressure, fuel consumption and engine load at the current speed. The analysis included the creation of trend diagrams to present the distribution of the minimum, median and maximum values of each parameter of all the measurements performed. This study also examined the simulation of the faults of the high-speed four-stroke marine engine model. By utilizing sensor data from critical system components, this research investigated different scenarios. The analysis aimed to elucidate the impact of these faults on engine performance. Based on the analyses of the relevant operating parameters of the engine, diagnostics were carried out.
1. Introduction
Maintenance costs can be reduced if measures are taken in good time before critical devices fail. The Intelligent Predictive Decision Support System (IPDSS), applied to condition-based maintenance, improves the reliability and efficiency of energy systems on ships. Equipment failures can be reduced by the early indication of failure, and based on condition diagnostics, repairs should be made and maintenance planned. The timely replacement of worn parts or systems on which possible malfunctions have been detected enables the planning of service activities with the necessary replacement parts and reduces the accumulation of unnecessary parts in warehouses [1,2]. The diesel engine can be monitored and controlled via the Internet of Things (IoT) platform. Physical presence is no longer required for the operation of diesel generators. The data collection system, based on technology that facilitates communication between devices and the cloud, as well as between the devices themselves, aims to increase the flexibility and optimization of the system [3]. The remote monitoring of energy systems in real-time can avoid system breakdowns and downtime. To identify system problems and malfunctions, expert diagnostic systems are developed based on heuristics and priorities in decision making. Data from marine energy systems are sent via the Internet to experts on land without disrupting maritime operations. Data access must be enabled through a secure remote connection. By introducing automation, failures caused by human factors were avoided. A well-designed expert system for remote diagnostics and optimization ensures the reliability of the ship’s energy systems and extends their service life. Remote monitoring systems already exist, and their technical development is being promoted to diagnose and optimize existing and new ship systems. The aim is to make it easier for the crew on board to monitor the parameters so that specialists on land can see the condition of the ship’s systems via the Internet and, in communication with the crew, can easily take remedial action if necessary. This has the effect of reducing costs and improving crew efficiency by freeing up crew time for other work on the ship and can potentially lead to a reduction in the number of staff on board because of the drive towards autonomous ships. The role of the shore-based experts would be to monitor the parameters and correct the maintenance time according to the condition of the system’s elements, identifying potential problems and fixing them in communication with the crew through providing suggestions and equipment optimization in an appropriate manner [4].
The example of a remote diagnostic system described in [5] has improved the level of ship monitoring and the working ability of engineers and has increased the level of regulation of maritime companies. This remote diagnosis system for an engine room was developed by comprehensively utilizing the SQL server database, neural networks, Inmarsat system, etc., and included data acquisition, data storage, interface and data transmission. The application results show that the system is helpful for the engineer to know the condition of the observed devices in the engine room, and is a good solution for companies to improve efficiency and enable good service.
The further development of remote diagnostics included monitoring the engine condition using tribological information, such as faults due to the wearing of diesel engine components [6]. The system proposed in this work consisted of an online signal acquisition and a diagnosis model in the service center. Nine wear features were extracted to detect engine faults. To select the feature which was relatively the best for online fault detection, the method based on interaction information was used to determine the appropriate indicator. The diagnosis results showed that the proposed system provided a satisfactory online fault diagnosis capability. A remote diagnosis technology was developed that used online laboratory analysis for tribological systems [7]. A two-stage fault diagnosis model based on an organizing map was created with the oil data from the remote oil monitoring system and the laboratory data [8]. The system was improved by using the latest generation wireless communication system to connect the ship and the test laboratory. Force Control monitoring software, combined with a smart PLC system, collected pressure, temperature and speed data and analyzed them to control the opening or closing of various valves and motors [9]. The system could realize the video monitoring of devices in the machinery room. A distributed, networked expert system for fault prediction and diagnosis [10] could be applied to various types of prime movers, including diesel engines and gas turbines. The system consisted of on-site data acquisition, condition monitoring, communication and remote expert assistance. The system worked with artificial neural networks to perform real-time fault prediction. A new type of remote monitoring and fault diagnosis system (CMFD) for detecting combustion engine faults was presented [11]. The signal of the instantaneous angular velocity (IAS) of the engine was transmitted from the ship to a data center on land. The detection of combustion faults was achieved by a time–frequency spectrum analysis of the decompressed IAS data. The main advantage of the described CMFD remote monitoring system was that the IAS data were sampled at a low speed by compressed sensing, which significantly reduced the computational requirements of data transmission. An advanced remote monitoring and fleet management system was presented as a technology platform that continuously collected data from remotely operating vessels [12]. All operational data about the ship and its onboard machinery could be uploaded to this shore-based system. The collected data could be categorized into different groups, e.g., GPS-related ship movements and their position, direction and speed; and engine operating data: speed, lubricating oil pressure, fuel oil pressure, scavenge air pressure, engine cylinder temperature and pressure, engine speed and exhaust gas temperature. These operating and status data were transmitted in real-time to the fleet monitoring server system and then distributed to the logged-in users. A networked live laboratory system was presented that provided a well-defined interface for data access and distributed the live data stream and operational history to researchers around the world conducting research in the field of marine propulsion condition monitoring. To optimize the remote monitoring methods and to diagnose early faults, a multi-kernel extreme learning machine algorithm was proposed [13]. The system could accurately and reliably detect potential failures. To improve the current inadequate application of inherent testability for the remote control and monitoring systems (RCMSs) of the main engines of ships, a method for developing RCMSs based on microcomputer control and controller area network (CAN) technology was proposed, considering the perspective of inherent testability [14]. The object-oriented hierarchy structure of the framework was introduced, and three relatively interdependent subsystems were included: the remote control subsystem (RCS), the safety protection subsystem (SPS) and the monitoring and alarm subsystem (MAS). For each subsystem, a division of functional units and a module design was carried out, i.e., the Line Replace Unit (LRU) and Shop Replace Unit (SRU) designs were performed. A fault detection and diagnosis method combining marine engine expertise and advanced data analysis techniques was proposed [15]. The regression models and dynamic thresholds determined irregularity in engine behavior.
A further improvement of real-time monitoring includes the methods for the remote detection of faults in piston rings [16]. Support Vector Machine, along with other methods, were tested, and it was concluded that they were a good indication of the degradation of the system. A particular area of remote monitoring is the monitoring of emission reduction. A newly proposed system was developed that could calculate an engine’s efficiency and power, and a vessel’s engine speed, fuel consumption and carbon dioxide emissions based on receiving simple key data such as GPS, speed and fuel flow, thus avoiding obtaining the condition of the vessel with detailed data [17]. The system transmitted the data via a communication network. The latest research is moving in the direction of simulating failures and developing diagnostic expert systems [18]. The model described representative engine behavior and was used for studies on engine failure simulations. The presented engine model can be used for optimization and diagnostic purposes.
By studying the existing literature in the field of remote sensing and diagnostics, the need was identified for a comprehensive system that would enable the collection of all relevant data from the ship’s energy system, the processing of data, the sending of data to expert centers for further analysis, diagnostics of the ship’s condition, the drawing of conclusions for preventive action and the optimization of the operation of the observed system. In this study, an online monitoring system for the diagnosis of the propulsion engine with the possibility of failure prediction was developed. The most important operating parameters of the engine were determined and a system for monitoring the trends of the relevant engine parameters was implemented. An innovative algorithm for detecting possible failures based on a remote monitoring system was proposed. The results obtained by applying the proposed diagnostic system on an operating vessel are presented.
2. Experimental Method and Setup
For the experimental research, an expert system with the possibility for remote monitoring (Figure 1) has been developed and implemented on a ferry with four-stroke marine diesel engines during its voyage. The system provides online access to key ship parameters. The sensors on board are connected to the monitoring system. The sensors are either wired or wireless and monitor various systems (e.g., engine, battery charge level, fuel tank level, engine room temperatures, battery temperatures and more). An Internet connection with secure and encrypted communication is used for sending data to a server located in a laboratory for heat engines. An expert system installed on a server analyses the received data in order to, for example, predict engine component failures or provide insights into other features of the ship’s navigation and exploitation. Engine and ship data are available to the experts with a secure user account accessible via smartphone or computer. The user can grant access to third parties such as maintenance companies to facilitate cooperation with their service providers.
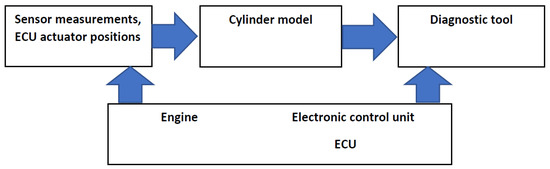
Figure 1.
Engine simulation in the expert system for remote engine monitoring and diagnostics.
Sensor information, ECU actuator locations, cylinder models, diagnostic tools, the engine and the ECU (electronic control unit) are all interdependent in modern engine management and diagnostics. The ECU receives real-time data from sensors that measure critical parameters including temperature, pressure, airflow and RPM. The ECU evaluates these data using pre-programmed algorithms and adjusts the actuator locations, such as throttle valves, fuel injectors and turbocharger vanes, to optimize engine performance, efficiency and emissions.
The advantages and disadvantages of remote monitoring were established during this research, with the advantages being as follows:
- Using the remote monitoring system, the expert monitors the operation and operating parameters of the propulsion system and eliminates the possibility of problems.
- Knowing the location and cause of the fault, the service personnel who come to repair the fault bring the necessary materials and equipment with them, which reduces the costs and time required for the repair.
- By giving recommendations for plant optimization, the expert can reduce plant operating costs.
- The expert plans maintenance based on the current state of the equipment.
- The ship owner has insight into the cause of the failure and receives information and expert recommendations that can be implemented on other ships in the fleet.
- Registration companies, insurance companies and inspectors have an insight into how the maintenance was carried out, which enables the assessment of maintenance quality.
- It is possible to monitor exhaust gas emissions, and based on this, possible emission reduction solutions can be drawn.
The disadvantages of remote monitoring are as follows:
- The diversity of ship systems makes it difficult to apply a universal monitoring system.
- The complex implementation of the determination, filtering and presentation of in-formation.
The purpose of monitoring (Figure 2) is based on gaining insight into the current state of the engine, the performance and efficiency of the system, the workload, preventive and corrective maintenance, the reduction in the time for detecting and resolving faults and having protection when parameters change significantly. This enables a timely reaction due to the observed changes in parameters, which prevents the occurrence of malfunctions. Performing diagnostics ensures the technical correctness of the engine and its system. By continuously recording certain important parameters, it is possible to adjust the correct operation of the ship’s propulsion system and determine the optimal timing to perform the appropriate type and scope of maintenance.
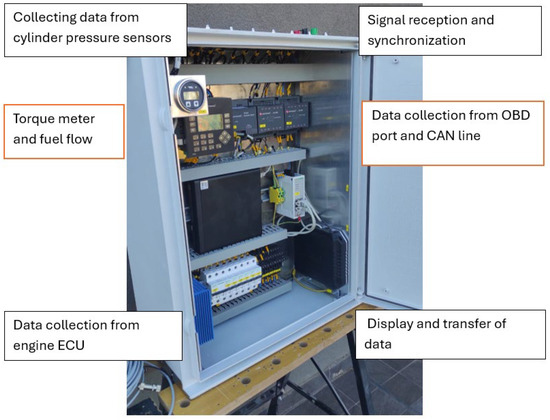
Figure 2.
Engine remote monitoring system (the system’s capabilities are highlighted).
The engine manufacturer determines the most important engine parameters that must be constantly monitored. The standard for collecting the mentioned parameters from the engine’s electronic control unit is CAN J1939 (the SAE J1939 network protocol describes communication on a CAN bus in an observed object for the transmission of diagnostic data and control information) [19].
The main monitored parameters are as follows:
- Atmospheric pressure;
- Mean indicated pressure;
- Exhaust gas pressure;
- Scavenging air pressure;
- Back pressure of exhaust gases;
- Inlet air filter pressure difference;
- Engine rpm;
- Power;
- Exhaust gas temperature;
- Charge air temperature;
- Air temperature before the turbocharger;
- Cooling water temperature before and after the intercooler;
- Turbocharger speed.
These parameters are monitored using the CAN protocol with the industrial standard J1939 for data transfer. The sensors are for pressure, temperature and flow. There are also important speed/timing sensors, which are so important that there are two: primary and secondary. All sensors send the measured signal to the engine control unit (ECU). The boost pressure sensor is on the intake manifold. The fuel pressure sensor is positioned along the fuel rail or line. The coolant temperature sensor is located near the thermostat housing or in the engine block. The oil pressure sensor is positioned on the engine block or near the oil filter housing. The exhaust gas temperature sensor is placed in the exhaust manifold or pipe.
3. Analyses of the Propulsion Engine Parameters
By processing the collected engine operation data, state diagnostics are performed. An example of diesel propulsion system diagnostics has been implemented on a ferry sailing on the daily Split–Supetar route (distance of 9 nautical miles).
Jupyterlab (vers. 4.3.4.) is used for data processing and model development because it is an open-source software and has many libraries available for data processing and research. Also, some third-party services are used, as propulsion machinery is engaged and it is necessary to filter the data related to sailing. In this paper, the data are divided into groups that correspond to one-way ferry sailing on a given route between the mainland and the island. Only the filtered data are analyzed using the Python Data Analysis Library (Phyton vers. 3.12.8.; pandas vers. 2.2.3.; numphy vers. 2.0.2.; matplotlib vers. 3.10.0.; scipy vers. 1.51.1.). Each individual measurement is read as a pandas Data Frame from a database for data processing, searching and filtering upon data import. The data are checked for continuity in timestamps and out-of-range values. A ferry that sails on the same route is analyzed. The measurements themselves refer to more than 40 different parameters from various sensors, but some values are calculated upon data import, like the distance traveled from the available GPS coordinates, the brake power from the load percentage and also the brake-specific fuel consumption. Each measurement is then stored in a faster search format or in an SQL database, For the purposes of the test, we use SQLite (vers 3.48.0.) for simplicity and for compatibility with SQL. The following data are selected: engine speed, boost pressure, volumetric fuel consumption and the percentage of load at the current speed.
The analysis includes the creation of trend diagrams to present the distribution of the minimum, median and maximum values of each parameter of all the measurements. Also, the measurement data are compared with data obtained during the sea trial test (load according to propeller curve). Boost pressure as a function of engine speed is shown in Figure 3.
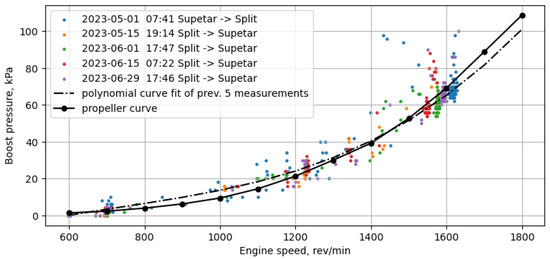
Figure 3.
Dependency of boost pressure on engine speed.
Boost pressure is important for maximizing the economy. By compressing intake air, boost pressure raises air density, which allows for more fuel combustion and produces more power. In high-speed marine engines, boost pressure is carefully regulated, guaranteeing peak performance under various loads and speeds. In non-steady conditions, measurements are more scattered because other parameters can also affect the boost pressure. In near-steady conditions, when cruising speed is achieved and with good conditions at sea, boost pressure should depend primarily on engine speed, as in the manufacturer data for the propeller curve.
From the diagrams in Figure 3 and Figure 4, it can be seen that during the maneuver in the port and the acceleration of the ship, the engine works with a slight overload, while during the voyage under full load, the engine works with a load according to the propeller curve.
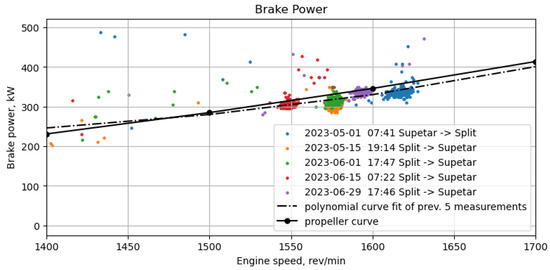
Figure 4.
Dependency of brake power on engine speed. The dash-dotted curve represents the fitted curve of the measurements combined. The solid line is the fitted curve of the engine test data on the propeller curve.
Figure 4 shows the dependency of the brake power on the engine speed. The data points in different colors represent a different set of measurements. Each trip has a characteristic speed that is maintained during navigation, which probably depends to a significant extent on the weather conditions.
Figure 5 shows the dependency of the brake-specific fuel consumption (BSFC) on the engine speed. The BSFC is higher than recommended by the propeller curve, which indicates that it has the potential to optimize the engine performance and reduce fuel consumption.
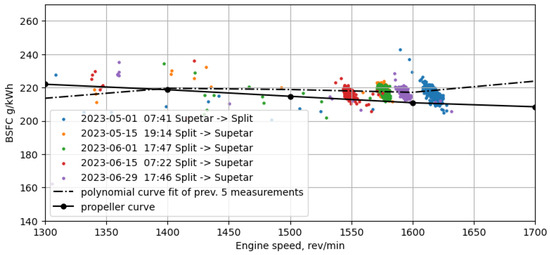
Figure 5.
Dependency of brake-specific fuel consumption on engine speed.
Because the ship operates at maximum efficiency, the specific fuel consumption is lower at cruising speed under normal sailing conditions. The engine minimizes fuel consumption per distance driven by operating within its ideal power range. At this speed, the propeller and hull are made to minimize resistance and increase efficiency, enabling smooth sailing with little drag. Fuel consumption is further decreased by steady-state operation at a constant speed, which minimizes rapid acceleration or deceleration.
The gray curve represents the current engine speed, the black curve represents the BSFC for the engine driven at the propeller curve and the red curve represents the actual measured BSFC.
Figure 6 shows the brake-specific consumption during ferry navigation. The Savitz-ky–Golay filter is applied to the measurement data points to better visualize trends. The curve shows constant changes in consumption because the engine does not work with a continuous load. The load on the engine is constantly changing in order to maintain the direction of the ferry, especially in rough seas and bad weather conditions.
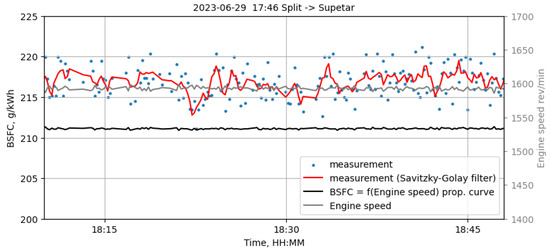
Figure 6.
Brake-specific fuel consumption on ferry route in one direction (Example 1).
There is another measurement presented in Figure 7 in which the engine speed is different. The data points are more scattered than in the previous measurement, and the engine speed is lower. Larger changes in fuel consumption are caused by changes in engine load due to bad weather conditions and rough seas.
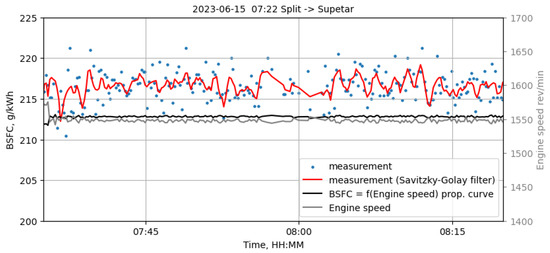
Figure 7.
Brake-specific fuel consumption on ferry route in one direction (Example 2).
Figure 8 shows the dependence of fuel consumption on engine speed for all speed ranges where brake power is produced. From the diagram of specific fuel consumption, it can be seen that the engine works without load and the specific consumption is lower under standard sailing conditions at cruising speed.
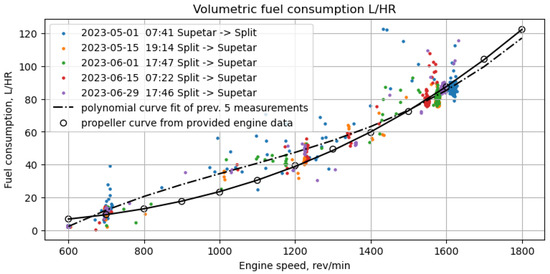
Figure 8.
Dependence of fuel consumption on engine speed.
For the same engine speed, but for different conditions on sea, specific fuel consumption may vary, because there can be different navigation velocities that influence resistance. Also, specific consumption should be analyzed in the context of distance if the total per-trip fuel consumption is considered.
On the diagrams in Figure 9, it can be seen that the increase in ship speed is accompanied by the current fuel consumption curve. This indicates that sudden changes in direction and an increase in the number of revolutions of the engine significantly affect the economical driving of the boat.
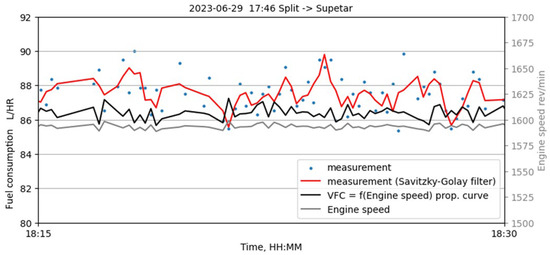
Figure 9.
Volumetric fuel consumption on a ferry route in one direction.
4. Fault Simulation
During the research, models are developed and failures are simulated on a marine engine. The simulation of faults in the air and exhaust gas systems of the four-stroke marine engine model is examined. By utilizing sensor data from critical system components, the research investigates airflow resistance and leakage scenarios. The results demonstrate characteristic changes in pressure and temperature under varying fault conditions, providing a foundation for fault detection and diagnostics. Modern electronically controlled marine engines are equipped with advanced sensors to monitor key operational parameters. This study focuses on simulating two primary fault types: blockage in air filters and air coolers and leakages in the air and exhaust systems. The analysis aims to elucidate the impact of these faults on engine performance.
4.1. Simulation of Air Filter and Cooler Blockages
4.1.1. Methodology
Blockages were simulated by increasing the frictional resistance multiplier in air filter and cooler components, leading to pressure drops, as defined by the equation:
where
- pressure drop;
- friction factor (function of Reynolds number);
- L pipe length;
- pipe diameter;
- air density;
- kinematic viscosity.
4.1.2. Results
Figure 10 illustrates the intake manifold air pressure drop as a function of severe clogging. The red curve represents the air filter blockage, with values ranging from a clean filter (factor 0) to a fully blocked filter (factor 1000). The blue curve shows the pressure drop due to air cooler blockage. It is clear that when simulating air filter contamination, the pressure in the intake manifold drops drastically because the factor through which we simulate contamination is directly related to the air flow through the filter towards the intake manifold. This is determined according to Equations (1)–(3).
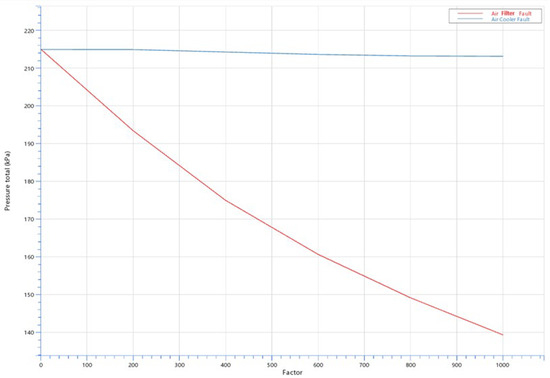
Figure 10.
Influence of pollution factors on the pressure drop measured at the intake manifold.
Figure 11 shows the air temperature values measured at the intake manifold within the engine model. The red line shows the air temperature value depending on the degree of air filter clogging, where 0 represents a simulated completely clean filter, while 1000 represents a simulated completely dirty filter. The blue line shows the air temperature value at the intake manifold in the case of simulated air cooler contamination.
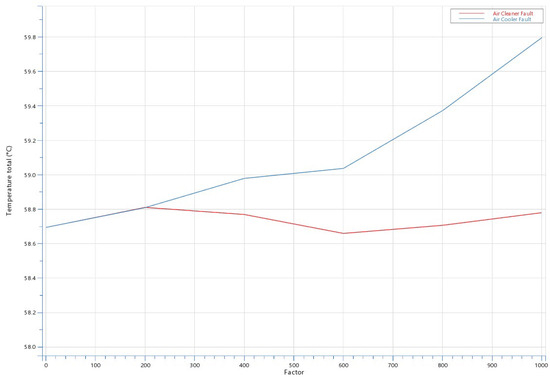
Figure 11.
Influence of pollution factors on the temperature measured at the intake manifold.
It is clear that in the case of simulating air filter contamination, the temperature at the intake manifold remains approximately the same, while in the case of simulating air cooler contamination, a change in air temperature at the intake manifold is noticeable.
4.2. Simulation of Air and Exhaust System Leakages
4.2.1. Methodology
In order to determine the location of the media leak, a simulation is performed in the AVL Cruise M software R2024 by introducing restrictions into the high-speed four-stroke engine model (Figure 12). The restriction represents a narrowed section of the pipe, determined by the cross-sectional area. The leakage factor ranges from 0 (no leakage) to 1 (maximum leakage). The restrictions are set in the following places (red circles in Figure 12): Leak_AF: air filter; Leak_Com: compressor; Leak_IM: intake manifold; Leak_EM: exhaust manifold and Leakage_TU: turbine.
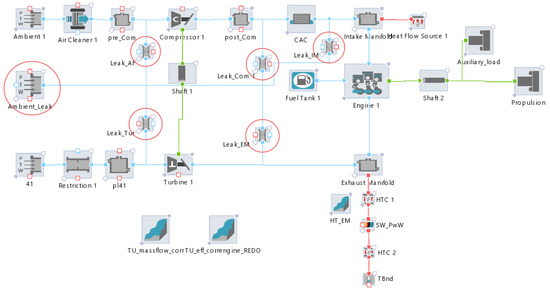
Figure 12.
Adding restrictions through which fluid leakages are simulated.
4.2.2. Results
Figure 13, Figure 14, Figure 15 and Figure 16 display the effects of leakages on pressure and temperature at various points. For instance, Figure 13 shows the overlapping pressure values for the compressor and intake manifold leakages, while Figure 14 highlights temperature deviations. Figure 15 and Figure 16 display the influence of leakage on the pressure and temperature measured at the turbine outlet
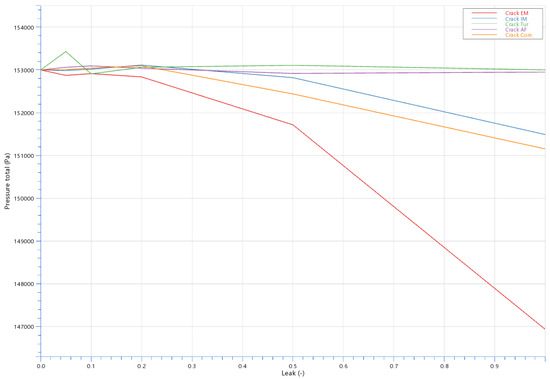
Figure 13.
Effect of leakage on the pressure measured at the exhaust manifold.
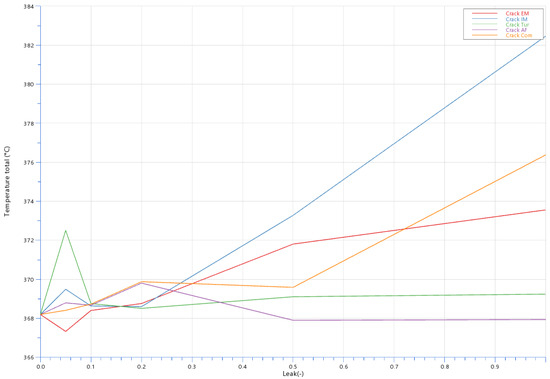
Figure 14.
The influence of leakage on the temperature measured at the exhaust manifold.
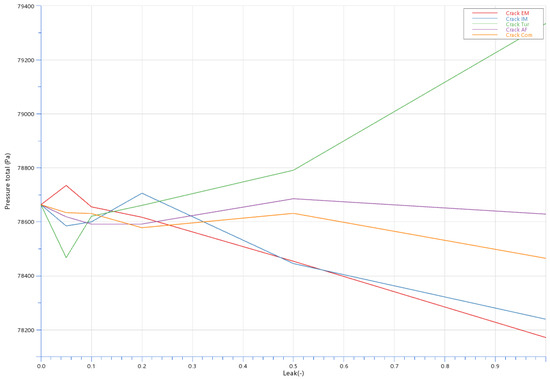
Figure 15.
The influence of leakage on the pressure measured at the turbine outlet.
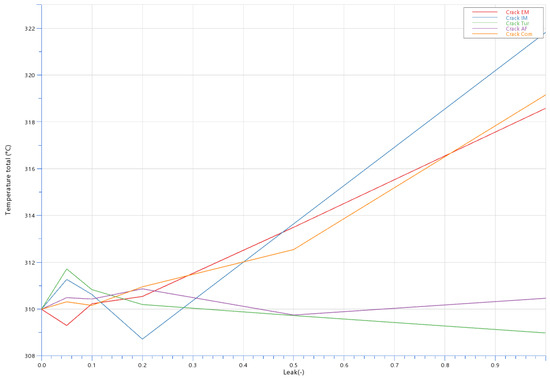
Figure 16.
The influence of leakage on the temperature measured at the turbine outlet.
5. Diagnostic Matrix
Table 1 presents an example of the diagnostic matrix, detailing the parameter intervals for the maximum and minimum leakage factors. The green highlights indicate compliance with interval thresholds, while the red indicate non-compliance. The diagnostic matrix helps to diagnose specific faults by matching sensor patterns to characteristic sequences. Each sensor takes on characteristic values that depend on the type of fault, and the greater the number of different sensors, as well as the greater the number of measurement points, the more accurate the description of each fault. In this way, a diagnostic matrix can be created, where each fault describes characteristic values.

Table 1.
Diagnostic matrix.
The results underscore the importance of diverse sensors and measurement points in accurately describing faults. By correlating fault progression with sensor data, the diagnostic matrix facilitates the rapid identification of leakage locations.
6. Discussion
From the analysis of the remotely monitored parameters of the electronically controlled marine engine in operation, there is room for improvement in diagnostics, efficiency and reduction in fuel consumption and emissions. The ferry tested has a flat bottom to be able to dock in a port with shallow seas and needs to maintain its direction in rough seas and bad weather. The only way to improve this is to install a system for the continuous remote monitoring of key engine parameters in real-time while the vessel is in operation. It is necessary to diagnose the condition of the engine in time, determine the parameters that need to be corrected and react quickly to optimize the operation of the engine for these operating conditions. To achieve this, appropriate measuring equipment (to obtain relevant data) and expertise are required. The whole problem is further complicated by the fact that on smaller ferries (such as the one studied), it is mostly four-stroke engines that are installed, for which we have fewer measurement parameters (compared to large two-stroke engines, where the pressures in the cylinders are necessarily indicated and the exhaust emissions of the individual cylinders are measured), and conclusions must be drawn on the basis of the available measurement parameters.
The primary objective of this research is to establish an expert system capable of continuously monitoring marine engines to detect irregularities at an early stage which might lead to engine failure. This article presents a comprehensive study on the implementation of a remote monitoring system for marine engines. This research aims to enhance engine diagnostics by collecting, processing and analyzing engine and ferry operational parameters in real-time. By enabling real-time analysis and early fault detection, the system improves operational efficiency, reduces maintenance costs and enhances the reliability of marine engines. There is no similar system on the market that is able to monitor all the parameters monitored in this research. This article evaluates various engine and vessel parameters, including engine speed, boost pressure, fuel consumption, engine load at different operational stages, GPS coordinates, etc. By integrating the collected data, this research aims to improve diagnostics and optimize engine performance, ensuring timely maintenance interventions to prevent failures.
The experimental setup consists of an expert system capable of remote monitoring, developed and installed on a ferry. The sensors collect real-time data on key engine parameters, transmitting them securely to a server located on land for further analysis. This system allows experts to access operational data via a secure connection on a computer or smartphone without having to be present on the ship.
This study also includes a fault simulation aspect, investigating the impact of specific failures on engine performance. Simulated faults, such as blockages in air filters and coolers, as well as leakages in the air and exhaust systems, are analyzed. The findings indicate that these faults cause characteristic pressure and temperature deviations, which can be used for diagnostics. The fault simulations demonstrate how sensor data can be utilized for early fault detection. By mapping pressure and temperature variations, this study provides a foundation for implementing predictive maintenance strategies.
Despite the advantages of the proposed system, there are challenges and problems that have to be managed. The diversity of ship systems makes it difficult to implement a universal remote monitoring solution. Also, the integration of meteorological data and sea conditions is necessary to refine ship propulsion plant performance evaluations. In this research, a self-developed measurement system is used for data acquisition, processing and transmission. The next phase of our research is to install additional measurement instruments on the observed energy system itself to gain a better insight into the current state, to create a digital twin of the observed propulsion system and to include meteorological data and sea conditions in the analyses.
7. Conclusions
A remote data acquisition system was implemented for the diagnosis of marine propulsion engines on a ferry during normal voyages. When analyzing the data obtained with the system for the remote monitoring of the ship’s energy, an algorithm was developed that enabled the monitoring of the most influential parameters and indicated the possibility of malfunctions. Operating modes, data transmission protocols and technical data were presented. Based on the monitoring of the relevant engine operating parameters and a comparison with the reference values obtained from the manufacturer, diagnostics were carried out and possible causes of deviations were indicated. In case of an irregularity, warnings and recommendations for eliminating the cause of the fault were issued. During the research carried out on the ferry, which operated regularly on the same route over a period of two months, fluctuations in loading and fuel consumption were detected, indicating the significant influence of weather conditions on engine performance. Analysis of the data collected also showed that more frequent load changes occurred on some trips, caused by a sudden change in engine speed. This observed phenomenon led to an increase in fuel consumption and its cause is to be investigated as part of further research. An example of fault simulation on a model of a marine engine and an example of a diagnostic matrix were also given. The research presented in this paper will serve as a basis for future research, which will focus on the implementation of an expert system for the diagnosis and optimization of the marine hybrid propulsion system.
Author Contributions
Conceptualization, O.B., V.P., T.M., G.R., T.V., N.R., M.J., B.L. and K.B.; methodology, V.P., T.M., G.R., N.R., M.J. and B.L.; software, O.B., G.R. and T.V.; validation, O.B., V.P., T.M., G.R., T.V., N.R., M.J., B.L. and K.B.; formal analysis, O.B., V.P., T.M., G.R., T.V., N.R., M.J., B.L. and K.B.; investigation, O.B., V.P., T.M., G.R., T.V., N.R., M.J., B.L. and K.B.; resources, O.B., V.P., T.M., G.R., N.R., B.L. and K.B.; data curation, V.P., T.M., G.R., T.V., N.R., M.J., B.L. and K.B.; writing—original draft preparation, O.B., V.P., T.M., G.R. and T.V.; writing—review and editing, V.P., T.M., G.R., N.R., M.J. and B.L.; project administration, G.R., N.R. and T.V.; funding acquisition, G.R. All authors have read and agreed to the published version of the manuscript.
Funding
This work has been fully supported by the Croatian Science Foundation under the project: HRZZ IP-2020-02-6249.
Data Availability Statement
The raw data supporting the conclusions of this article will be made available by the authors on request.
Conflicts of Interest
The authors declare no conflicts of interest.
References
- Yam, R.C.M.; Tse, P.W.; Li, L.; Tu, P. Intelligent Predictive Decision Support System for Condition-Based Maintenance. Int. J. Adv. Manuf. Technol. 2001, 17, 383–391. [Google Scholar] [CrossRef]
- Maulidevi, N.U.; Khodra, M.L.; Susanto, H.; Jadid, F. Smart online monitoring system for large scale diesel engine. In Proceedings of the 2014 International Conference on Information Technology Systems and Innovation (ICITSI), Bandung, Indonesia, 24–27 November 2014; IEEE: Piscataway, NJ, USA, 2014. [Google Scholar]
- Chandra, A.A.; Jannif, N.I.; Prakash, S.; Padiachy, V. Cloud Based Real-Time Monitoring and Control of Diesel Generator Using IoT Technology. In Proceedings of the 20th International Conference on Electrical Machines and Systems (ICEMS), Sydney, NSW, Australia, 11–14 August 2017. [Google Scholar]
- Jurić, Z.; Kutija, R.; Vidović, T.; Radica, G. Parameter Variation Study of Two-Stroke Low-Speed Diesel Engine Using Multi-Zone Combustion Model. Energies 2022, 15, 5685. [Google Scholar] [CrossRef]
- Song, X.; Ma, A.; Ma, Q.; Zhang, Y. The design of remote fault diagnosis system in engine room, advanced building materials and sustainable architecture. Appl. Mech. Mater. 2012, 174–177, 1971–1976. [Google Scholar] [CrossRef]
- Yan, X.; Li, Z.; Yuan, C.; Guo, Z.; Tian, Z.; Sheng, C. On-line Condition Monitoring and Remote Fault Diagnosis for Marine Diesel Engines Using Tribological Information. Chem. Eng. Trans. 2013, 33, 805–810. [Google Scholar] [CrossRef]
- Xu, X.; Yan, X.; Zhao, J.; Sheng, C.; Yuan, C.; Ma, D. Remote Fault Diagnostic Model for Tribological Systems in Marine Diesel Engine with Two-level Self-organizing Map Network. In Proceedings of the 2014 Prognostics and System Health Management Conference (PHM-2014 Hunan), Zhangjiajie, China, 24–27 August 2014; pp. 261–265. [Google Scholar]
- Yan, X.; Sheng, C.; Zhao, J.; Yang, K. Study of on-line condition monitoring and fault feature extraction for marine diesel engines based on tribological information. Proc. Inst. Mech. Eng. Part O J. Risk Reliab. 2015, 229, 291–300. [Google Scholar] [CrossRef]
- Chen, J.; Liu, S.J.; Li, Q.; Ning, X.B. Design of Monitoring System to Marine Diesel Engine Supply Units Based on Forcecontrol Monitoring Software. Appl. Mech. Mater. 2014, 556–562, 3277–3280. [Google Scholar] [CrossRef]
- Zhao, N.; Li, S.; Cao, Y.; Meng, H. Remote Intelligent Expert System for Operation State of Marine Gas Turbine Engine. In Proceedings of the 11th World Congress on Intelligent Control and Automation (WCICA), Shenyang, China, 29 June–4 July 2014; pp. 3210–3215. [Google Scholar]
- Li, Z.X.; Yan, X.P.; Sheng, C. A novel remote condition monitoring and fault diagnosis system for marine diesel engines based on the compressive sensing technology. J. Vibroeng. 2014, 16, 879–890. [Google Scholar]
- Zhao, J.B.; Yan, X.P.; Sheng, C.X. Networked Live Lab for Marine Machinery. In Proceedings of the 2014 Prognostics and System Health Management Conference (PHM-2014 Hunan), Zhangjiajie, China, 24–27 August 2014; pp. 364–367. [Google Scholar]
- Yuan, Y.P.; Yan, X.P.; Wang, K.; Yuan, C.Q. A new remote intelligent diagnosis system for marine diesel engines based on an improved multi-kernel algorithm. Proc. Inst. Mech. Eng. J. Risk Reliab. 2015, 229, 604–611. [Google Scholar] [CrossRef]
- Wen, X.; He, G.; Li, J. A Design Method Based on Inherent Testability of Remote Control and Monitoring System for Marine Main Engine. Adv. Eng. Res. 2015, 38, 773–777. [Google Scholar]
- Kang, Y.J.; Noh, Y.; Jang, M.S.; Park, S.; Kim, J.T. Hierarchical level fault detection and diagnosis of ship engine systems. Expert Syst. Appl. 2022, 213, 118814. [Google Scholar] [CrossRef]
- Asimakopoulos, I.; Avendaño-Valencia, L.D.; Lützen, M.; Rytter, N.G.M. Data-driven condition monitoring of two-stroke marine diesel engine piston rings with machine learning. Ships Offshore Struct. 2024, 19, 1241–1253. [Google Scholar] [CrossRef]
- Kim, S.; Kim, H.; Jeon, H. Development of a Simplified Performance Monitoring System for Small and Medium Sized Ships. J. Mar. Sci. Eng. 2023, 11, 1734. [Google Scholar] [CrossRef]
- Matulić, N.; Radica, G.; Nižetić, S. Engine model for onboard marine engine failure simulation. J. Therm. Anal. Calorim. 2020, 141, 119–130. [Google Scholar] [CrossRef]
- J1939 Standards Collection. Available online: https://www.sae.org/standards/development/ground-vehicle/sae-j1939-standards-collection-on-the-web (accessed on 9 March 2025).
Disclaimer/Publisher’s Note: The statements, opinions and data contained in all publications are solely those of the individual author(s) and contributor(s) and not of MDPI and/or the editor(s). MDPI and/or the editor(s) disclaim responsibility for any injury to people or property resulting from any ideas, methods, instructions or products referred to in the content. |
© 2025 by the authors. Licensee MDPI, Basel, Switzerland. This article is an open access article distributed under the terms and conditions of the Creative Commons Attribution (CC BY) license (https://creativecommons.org/licenses/by/4.0/).