Abstract
This paper presents placement optimization for battery energy storage system installation using a fuzzy expert system. Nowadays, the Bangkok Metropolitan Administration (BMA) has installed CCTV cameras for surveillance, deterrence, and to record events as evidence for legal proceedings. However, in some areas, there is no BESS, so when the power goes out, recording cannot continue. This article uses a Fuzzy Logic Expert System to assess critical areas for the consideration of future BESS installation in Bangkok. The key factors include (1) the number of CCTV image requests from the Bangkok Metropolitan Administration, (2) the duration of power outages from the BMA, and (3) the total power consumption of the CCTV in each subdistrict. The study results show that the fuzzy expert system can effectively handle ambiguous data and improve decision-making. The Latkrabang and Lamphlatiew subdistricts have the most critical points where investment in BESS installation is most appropriate. The size of the BESS was determined based on the maximum recorded power outage duration of 57 min, with the backup power design for the BESS set at 1 h. The DIgSILENT program was used to determine the size of the BESS at each critical point, which was calculated to be 160.2 Wh.
1. Introduction
The BMA has installed a lot of CCTV cameras and has a policy to reassure the public of the stability of CCTV usage. A BESS is a device that can effectively provide backup power for support in the case of a power outage. However, if a BESS is installed at every point, it would require a significant investment budget. This article, therefore, focuses on finding the critical positions for CCTV to reduce the budget for BESS installation. Security is a big issue in today’s world to make the country safe for the people investors and tourists [1]. Closed-circuit television (CCTV) cameras are another device commonly used to monitor and deter crimes in important areas, government offices, and public places such as shopping centers and pedestrianized streets [2]. They can also be used to assess drainage pipe defects [3,4]. The specific features of CCTV, in addition to detecting important events, can also be applied in conjunction with other types of detection such as PM 2.5 dust detection, 3D analysis for legal evidence, reservoir water level assessment, heat anomaly detection, etc. [5,6,7,8,9,10,11,12,13]. For accidents, or even in private residences, Bangkok has installed many closed-circuit television (CCTV) cameras in many areas, such as roads, to monitor traffic violations and track down offenders fleeing the streets, as well as at pumping stations to check the water level in order to be able to manage water in a canal or manage rainwater that is causing flooding in a timely manner. Closed-circuit television (CCTV) cameras can be installed in a park to monitor crime or even to monitor traffic conditions. Images from closed-circuit television (CCTV) cameras are recorded. Citizens or security agencies can write requests for images of theft, accidents, or other incidents. Images from closed-circuit television (CCTV) cameras can be required as evidence, but their actual use reveals many problems related to the electrical system. This affects the efficiency and continuity of the camera’s operation. The most common problems include a power outage, which causes the camera to suddenly stop working if there is no backup power system such as a UPS or battery backup; in addition, the voltage can become unstable or the power can fluctuate. This may damage the electronic equipment inside the camera. Therefore, in order to be able to work continuously, even in the event of a power outage, battery energy storage systems (BESSs) are especially important for the electrical grid [14]. BESSs can be used to reduce frequency to improve power quality [15], as well as to evaluate used EV car batteries for the storage of both solar cell and wind energy [16,17] or for battery energy storage systems combined with solar power generation [18,19]. The size of a BESS can be found using the DIgSILENT PowerFactory 2024 program for use in closed-circuit television cameras in different areas. In addition, the DIgSILENT PowerFactory 2024 program can work with Python 3.11 to analyze wind energy [20]. Solid-state transformers have been compared with controlled power transformers (CPTs) [21] to assist in designing hybrid microgrids [22] that can be used to estimate distance relays [23]. In this way, the suitability of an area for installing a battery energy storage system can be evaluated. This is necessary to consider in order to choose locations for CCTV cameras where events and problems occur. It is important that they are positioned where disruptions caused by electrical problems have been resolved. Three important factors are considered, arranged in order of importance: (1) The number of CCTV image requests [24] is the number of CCTV image requests that occur in each district. (2) Accumulated duration of power outages (backup duration) [25] is the number of cumulative power outage hours in each district. (3) Total power output of CCTV in the area of each district (load) is the electrical power demand for CCTV cameras and related equipment, obtained using fuzzy logic, which is a technique that can effectively manage uncertain and complex data. Fuzzy logic can also be utilized to locate CCTV cameras, determine transportation distances, detect COVID-19 patients, evaluate natural fabric dyes, manage energy in homes, etc. [26,27,28,29,30]. Furthermore, it can be used to evaluate food packaging materials, including the production and emissions of greenhouse gases [31], to precisely create barcodes for halal food [32], to reliably help design low-energy buildings [33], and to predict the seam strength of regular cotton and canvas fabrics [34]. The fuzzy logic system is more suitable for handling uncertain and ambiguous data than NN or GA.
The developed fuzzy logic system consists of defining appropriate membership functions, creating 27 rules, and carrying out data processing to evaluate the suitability of the area (area suitability). The results are grouped into five levels, which consist of not suitable for investment, slightly unsuitable for investment, moderately suitable for investment, quite suitable for investment, and highly suitable for investment.
2. Methodology
2.1. Data Collection and Raw Data Transformation
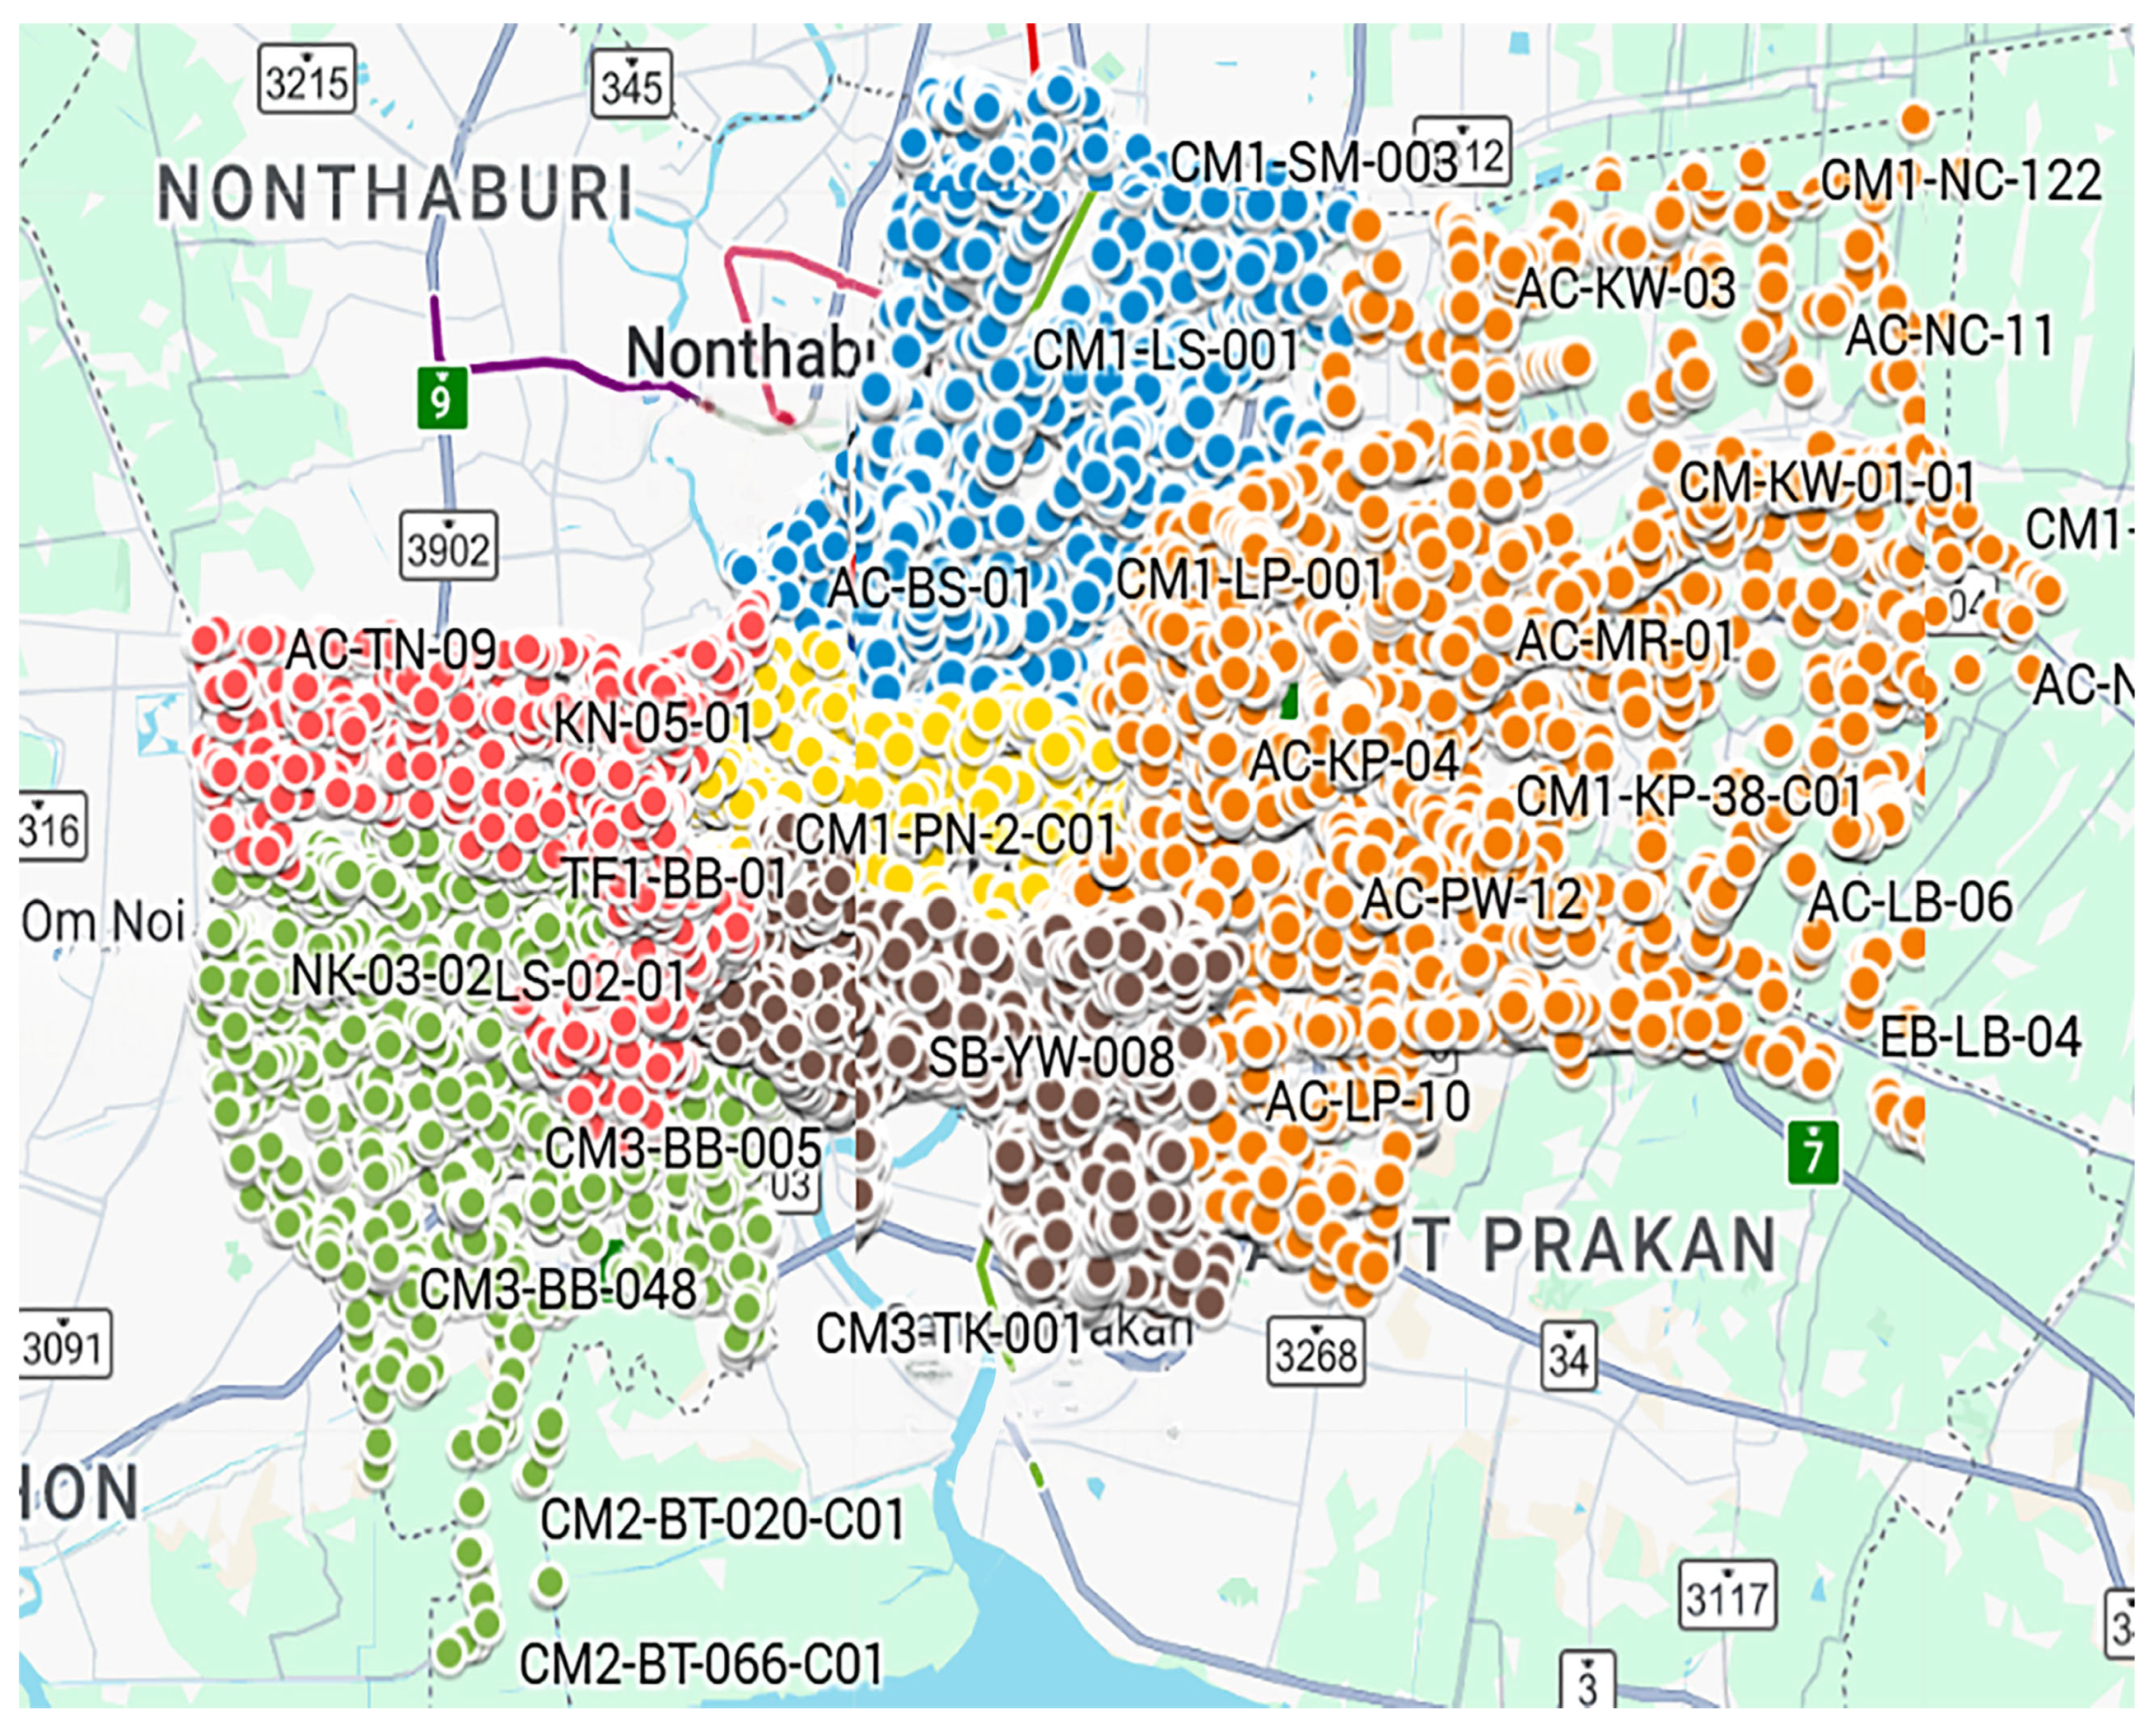
Bangkok will separate CCTV management into 6 zones. Blue is designated as North Bangkok. Orange is designated as eastern Bangkok. Yellow is designated as central Bangkok. Brown is designated as South Bangkok. Red is designated as North Krung Thonburi. Green is designated as Southern Krung Thonburi. This is shown in Figure 1.
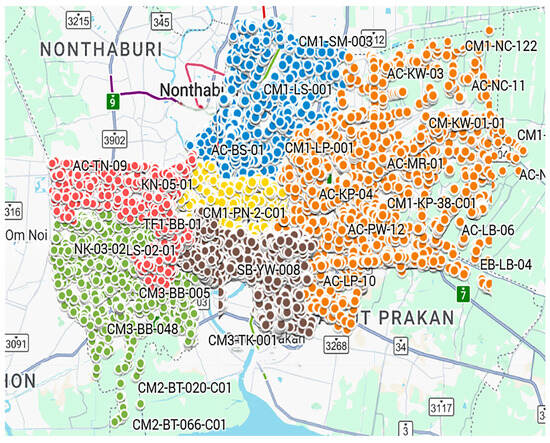
Figure 1.
CCTV installation locations in Bangkok.
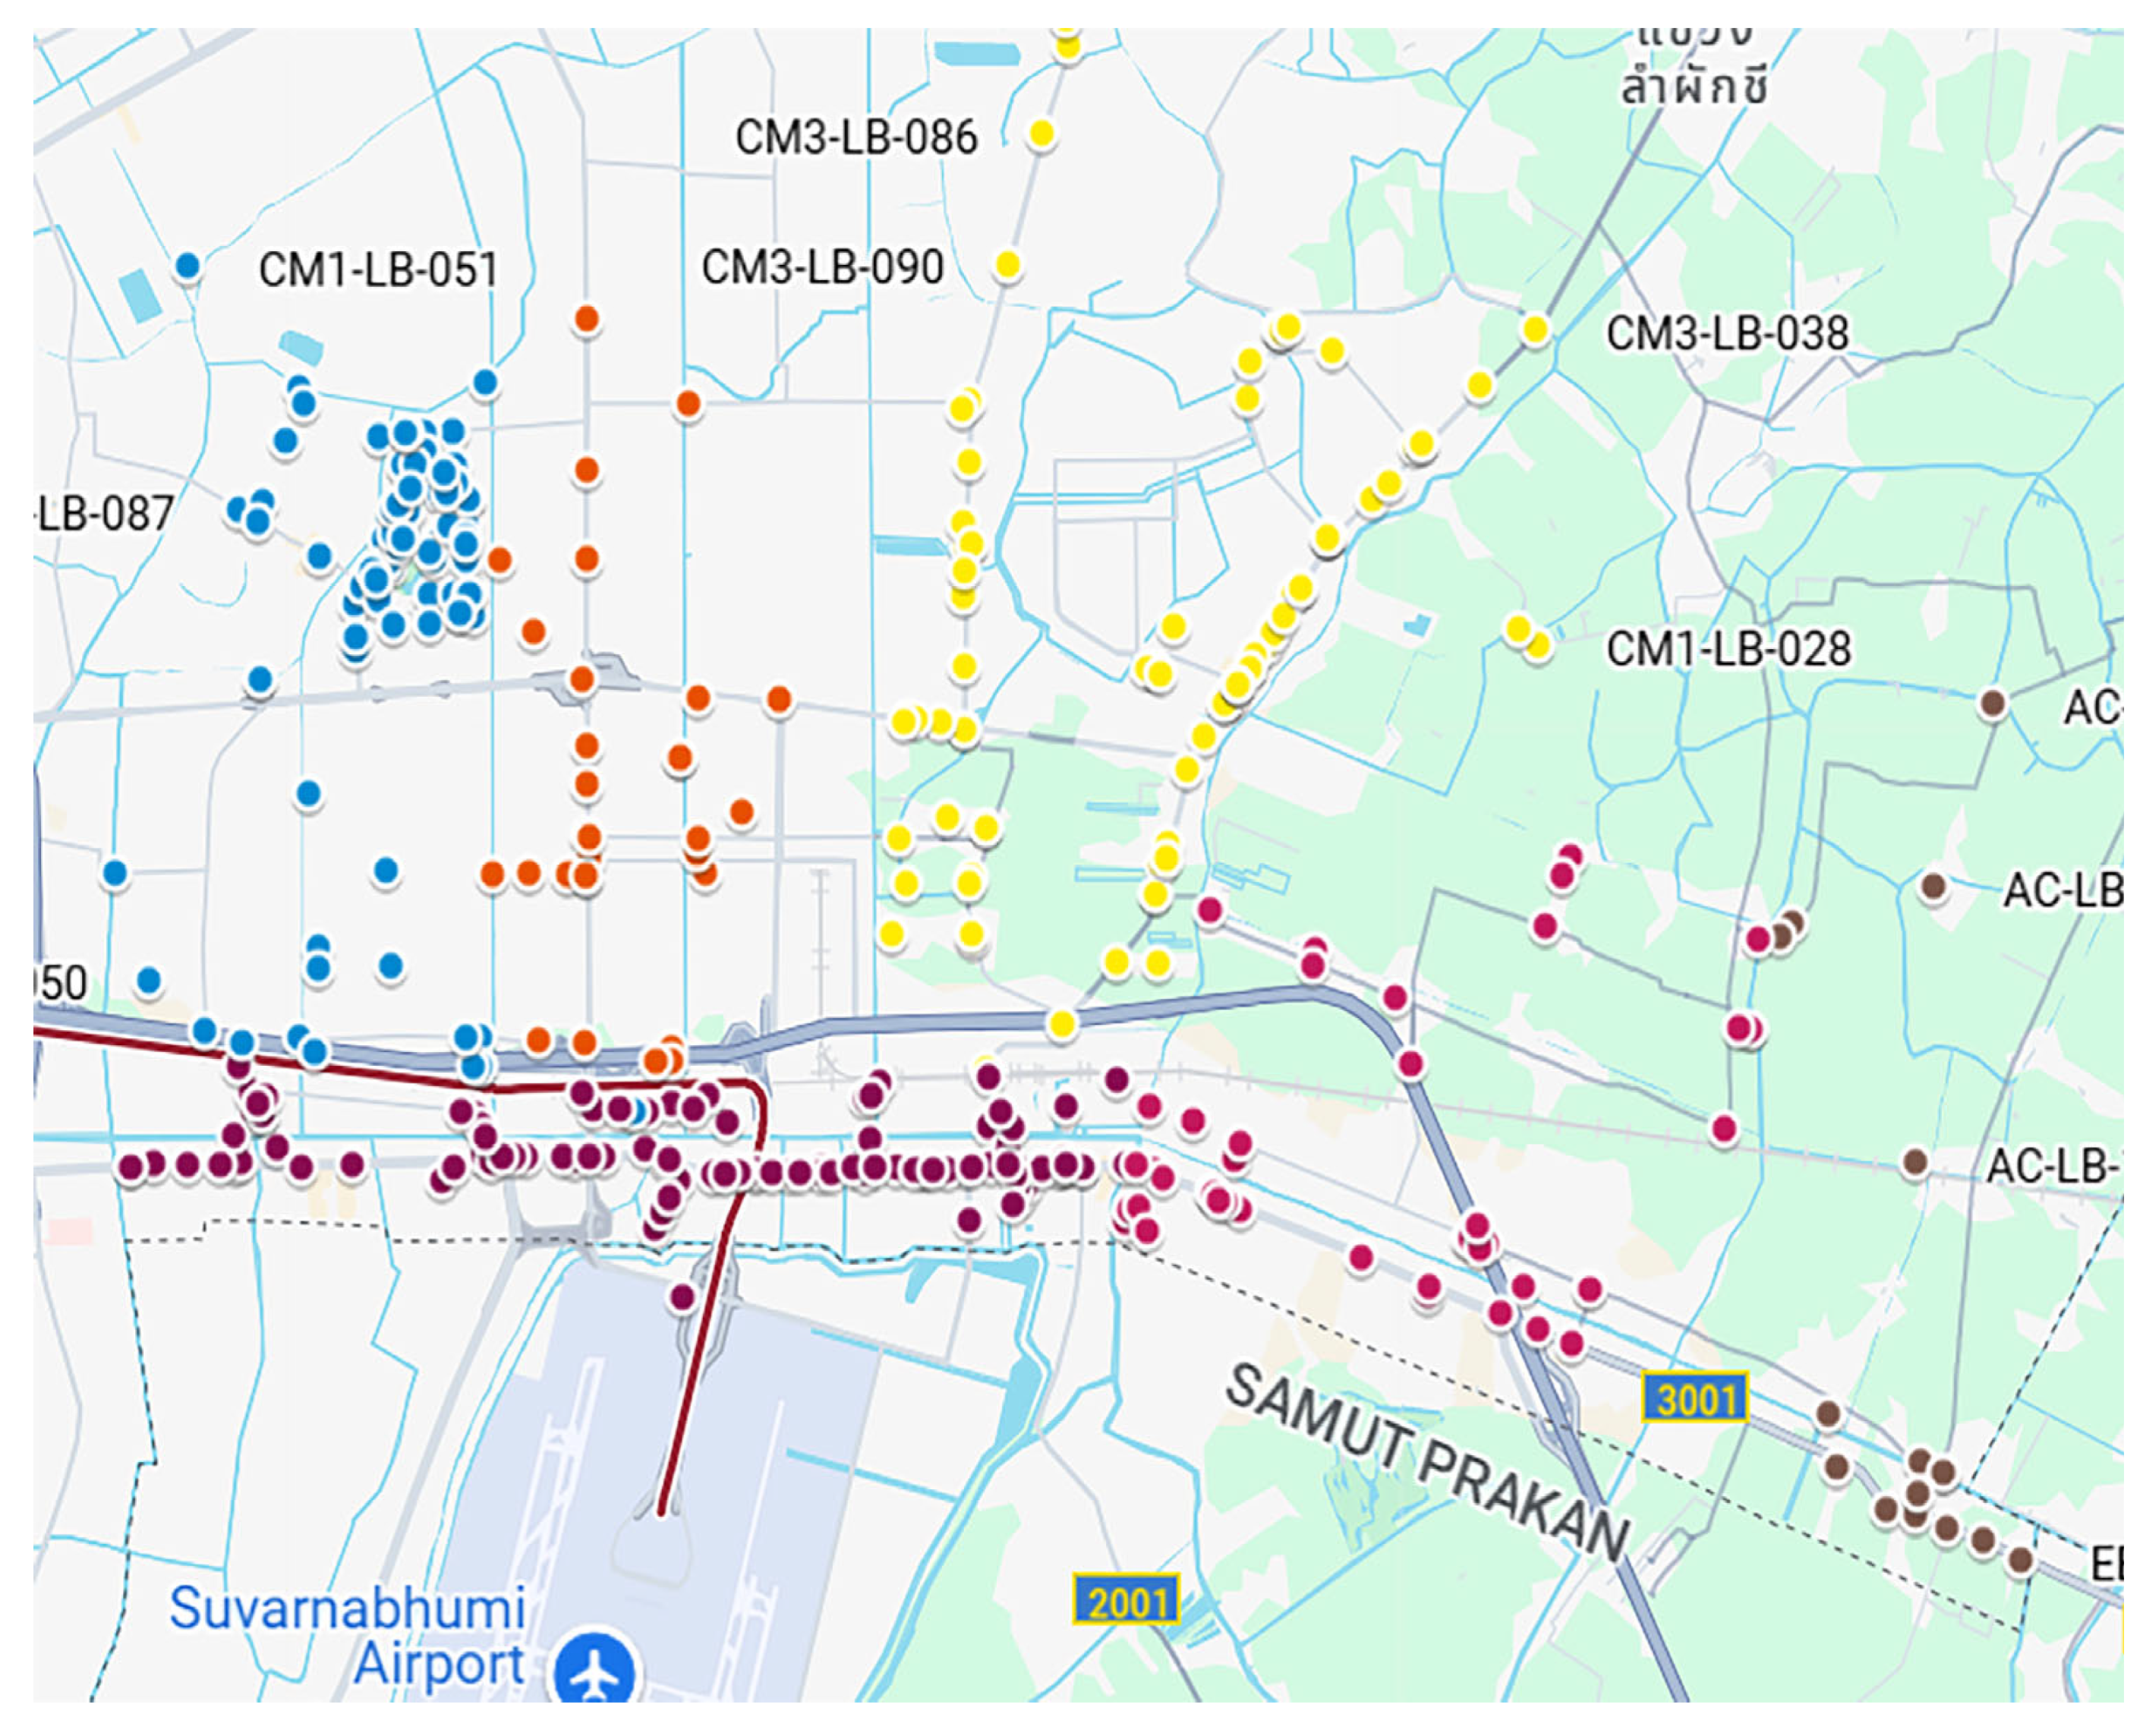
Our analysis was carried out separately according to 6 subdistricts in Latkrabang District. Bangkok includes the Latkrabang subdistrict, Thapyao subdistrict, Lampla Tiew subdistrict, Khumthong subdistrict, Khlongsam Prawet subdistrict, and Khlongsong Ton Nun subdistrict, which is an area in the eastern Bangkok zone. We used separate colors to denote the different installation points according to the subdistrict. Blue is designated as the Khlongsong Ton Nun subdistrict. Orange is designated as the Khlongsam Prawet subdistrict. Yellow is designated as the Lampla Tiew subdistrict. Purple is designated as the Latkrabang subdistrict. Red is designated as the Thapyao subdistrict. Brown is designated as the Khumthong subdistrict, as shown in Figure 2. The number of CCTV cameras installed in each subdistrict is shown in Table 1.
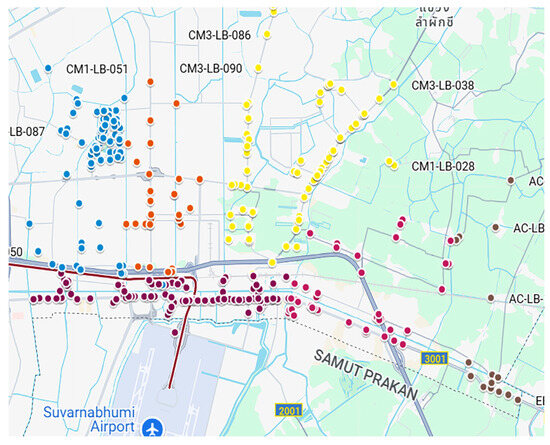
Figure 2.
CCTV installation location, Latkrabang District.

Table 1.
Number of CCTV cameras, separated by each subdistrict.
The data used in this research were collected separately from six subdistricts in Latkrabang District, Bangkok, which are Latkrabang, Thapyao, Lamphla Tiew, Khumthong, Khlongsam Prawet, and Khlongsong Ton Nun. The data were gathered based on three main factors: (1) the number of CCTV image requests, (2) the accumulated duration of power outages (backup duration), and (3) the total electrical load of CCTV systems in each subdistrict.
The process of detecting and handling anomalies was carried out using value range restrictions to filter out unreasonable data before normalization, as shown in Equation (1).
In the application of value range restrictions, the data value boundaries were defined according to logical criteria and real system requirements, using key data variables, such as those shown in Table 2.
Table 2.
The scope of data values according to logical criteria and real system requirements.
Since the raw data collected may have varying ranges, they underwent a normalization process to scale them to a standard range of 0–100 before being input into the fuzzy logic, genetic algorithm, and neural network model using Equation (2).
The normalization process involves data on the number of image requests from CCTV by the public and various agencies, used as legal evidence in investigations related to criminal activities, accidents, or traffic condition monitoring, as shown in Table 3.
Table 3.
Number of requests from CCTV, separated by each subdistrict.
Data on power outages from the Metropolitan Electricity Authority (MEA) are also considered, which can occur due to several main causes, including animals (e.g., squirrels, rats, snakes) that may come into contact with electrical wires or equipment, leading to system faults; accidents such as vehicles hitting utility poles or trees falling onto power lines, causing damage to equipment and the power grid; and other technical problems or unforeseen events that affect the operation of the power supply system. These data are compiled in the form of accumulated outage duration, as shown in Table 4.
Table 4.
Backup duration data, separated by each subdistrict.
Additionally, the electricity consumption of CCTV cameras at each point was calculated by summing the power usage of all related equipment, which included 4 CCTV cameras, 1 digital video recorder (DVR), and other necessary components such as status lights and adapters for the CCTV system. The electricity usage data were gathered, and an overall total for each subdistrict was calculated, as shown in Table 5.
Table 5.
Total electrical power consumption of CCTV cameras, separated by each subdistrict.
We collected data on the number of requests for images from CCTV in each subdistrict, data on the cumulative duration of power outages (backup duration) in each subdistrict, and data on the total power supply for CCTV in the area of each subdistrict. When going through the process of normalization, all data were imported as variables and input into the fuzzy logic system.
2.2. Genetic Algorithm
The genetic algorithm analyzed the suitability of investing in battery energy storage systems for each subdistrict, as shown in the flowchart of the fuzzy logic algorithm in Figure 3.
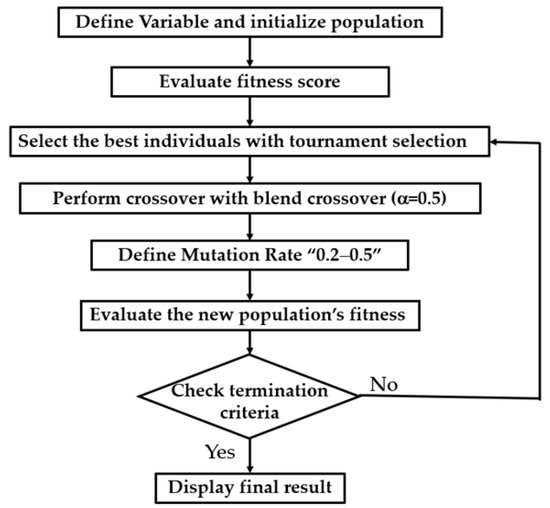
Figure 3.
Flowchart of the genetic algorithm.
2.3. Neural Network
The neural network analyzed the suitability of investing in battery energy storage systems for each subdistrict, as shown in the flowchart of the fuzzy logic algorithm in Figure 4.
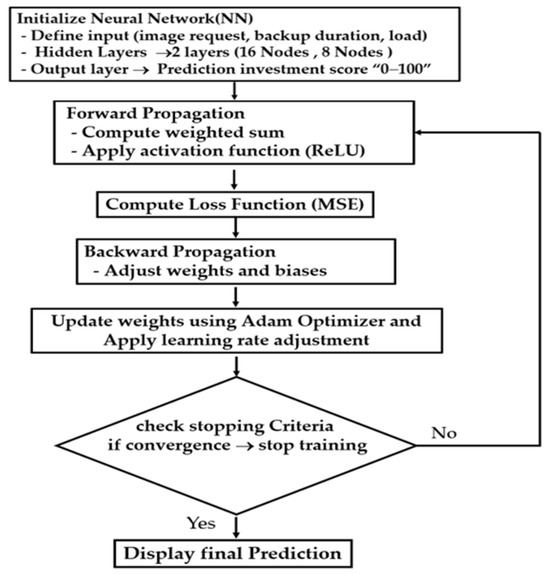
Figure 4.
Flowchart of the neural network algorithm.
2.4. Fuzzy Logic System
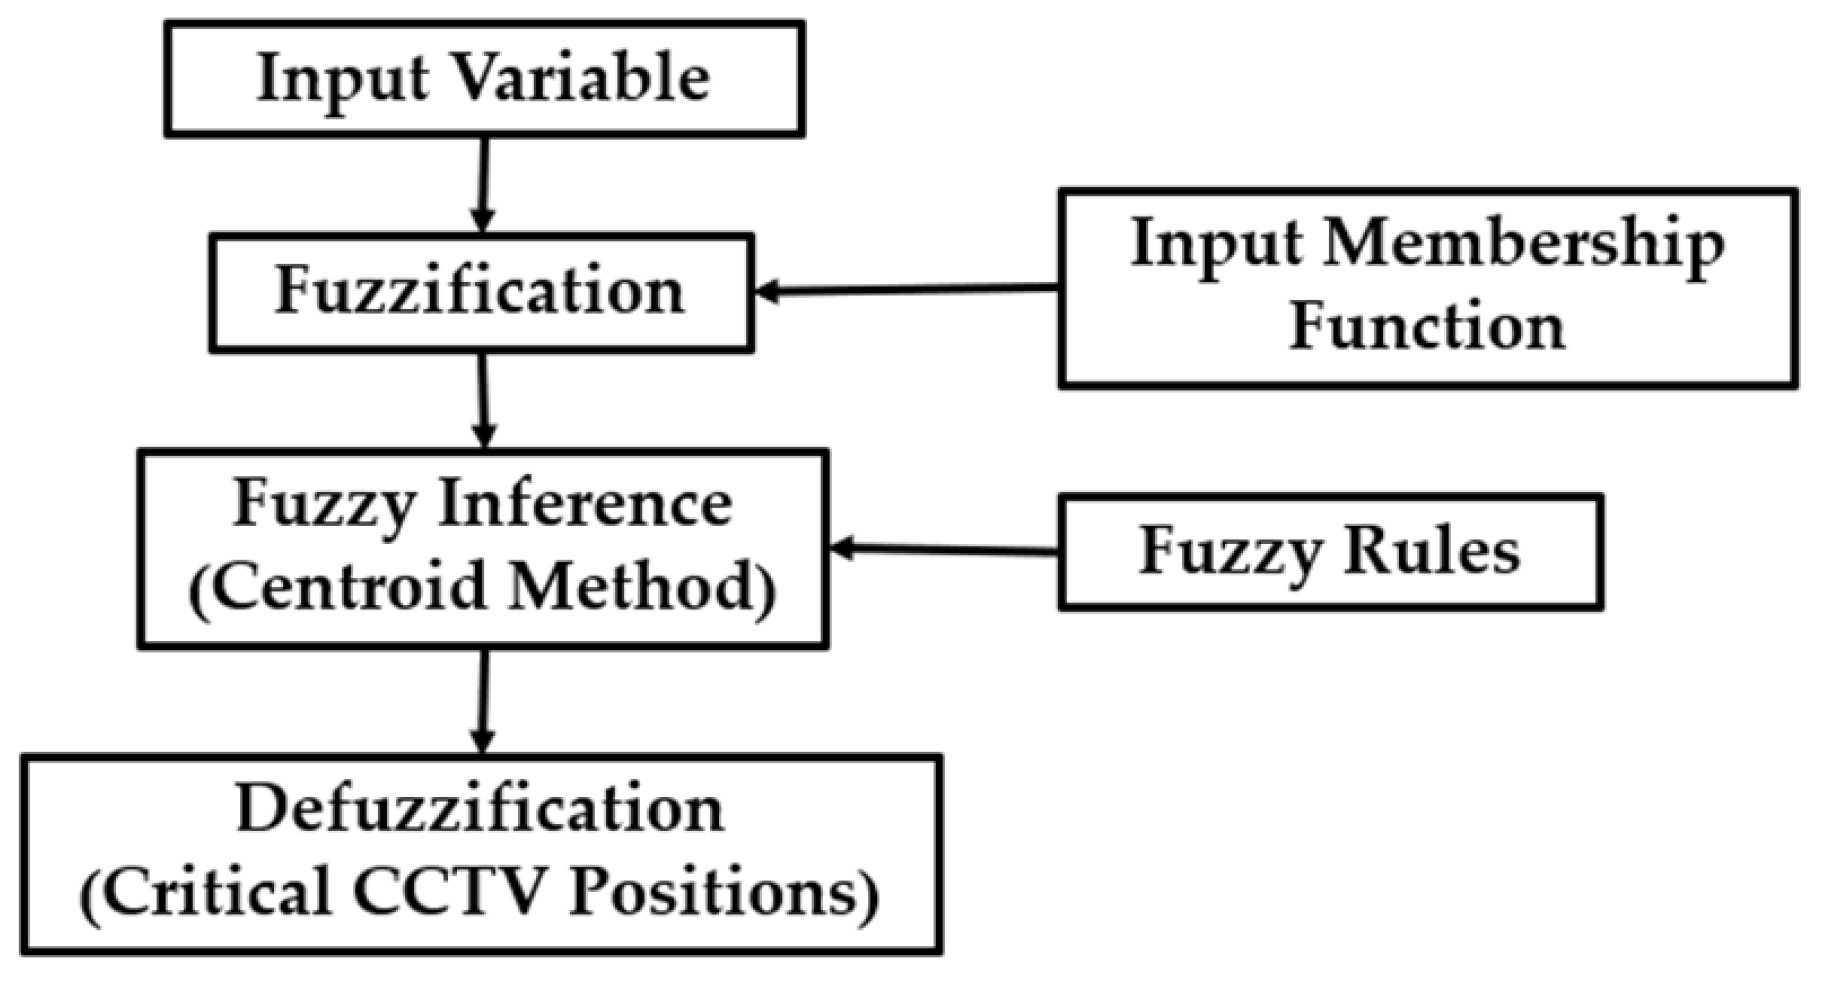
The fuzzy logic system analyzed the suitability of investing in battery energy storage systems for each subdistrict, as shown in the flowchart of the fuzzy logic algorithm in Figure 5.
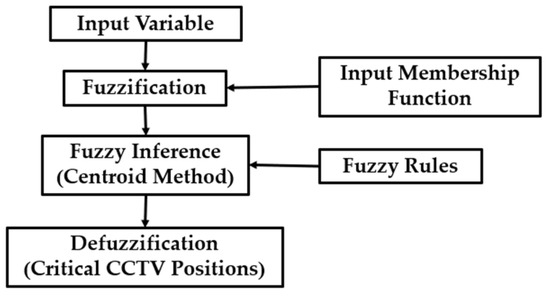
Figure 5.
Flowchart of the fuzzy logic algorithm.
2.5. Comparison of Algorithms
From a comparison of various techniques, namely the genetic algorithm, the neural network, and fuzzy logic, it was found that fuzzy logic is the most suitable method, as shown in Table 6, followed by the neural network and genetic algorithm, respectively. The analysis shows that fuzzy logic is appropriate for data with uncertainty and non-fixed values, with the accuracy of the results depending on the predefined rules. On the other hand, the neural network has the potential to learn and predict data trends well, but it requires a large amount of data to train the model to achieve maximum accuracy. The genetic algorithm has the ability to find optimal values in complex problems, but it has limitations in terms of computation time and may provide inconsistent results in some cases.
Table 6.
Algorithm comparison at each location.
2.6. Fuzzy Logic System Design
The fuzzy logic system is structured as follows:
2.6.1. Input Variables
The input variables include the number of image requests from CCTV (image requests) [0–100], as shown in Table 7, the cumulative duration of power outages (backup duration) [0–100], as shown in Table 8, and the total electrical power of CCTV in the area. The area of each district (load) [0–100], as shown in Table 9, was divided into 3 levels.
Table 7.
Image requests.
Table 8.
Backup duration.
Table 9.
Load.
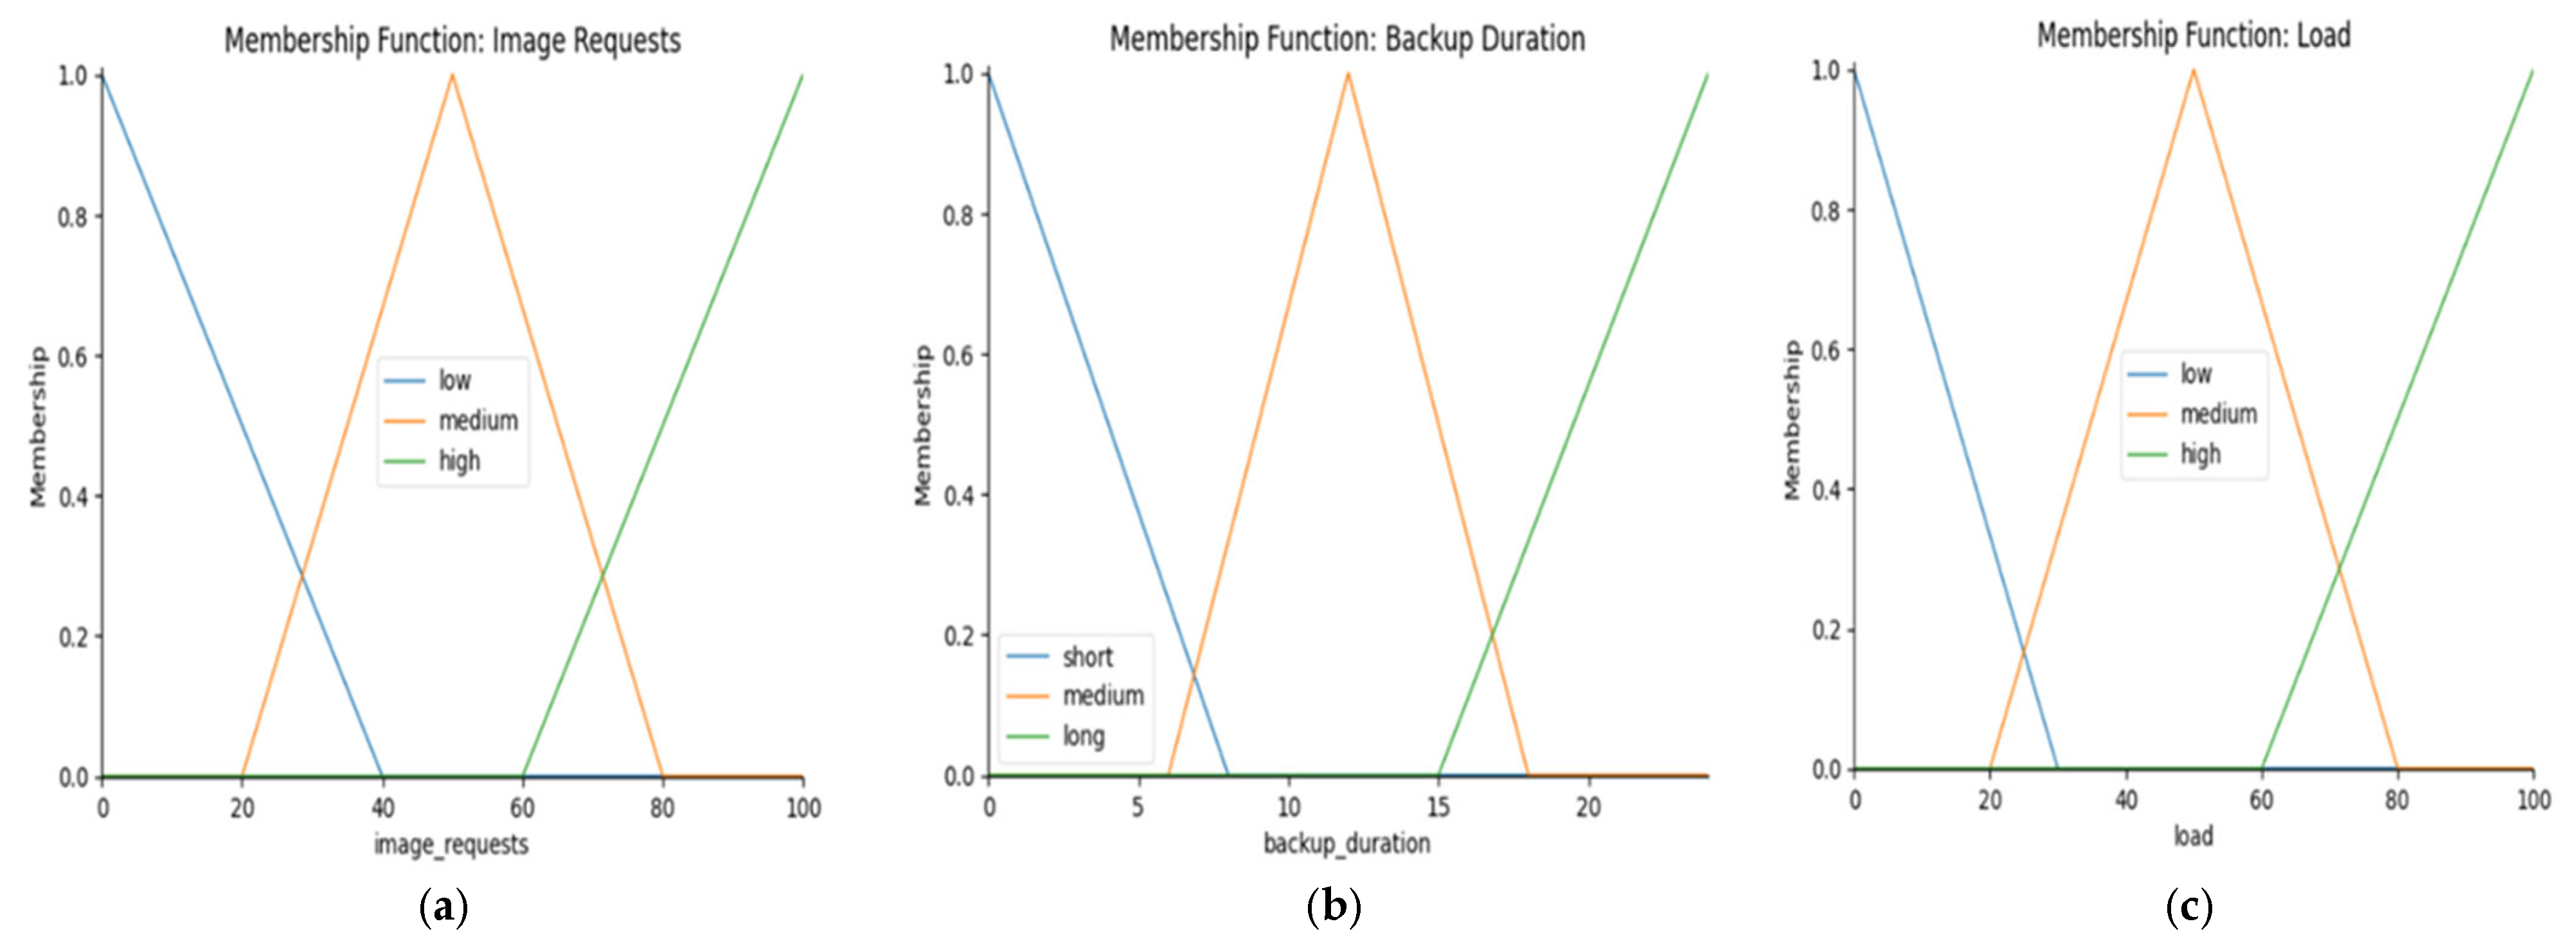
The membership functions of the variable image requests [0–100], as shown in Figure 6a; the backup duration [0–100], as shown in Figure 6b; and the total electrical power of CCTV in the area of each subdistrict (load) [0–100], as shown in Figure 6c, were divided into three levels: the blue line is the low level, the orange line is the medium level, and the green line is the high level.
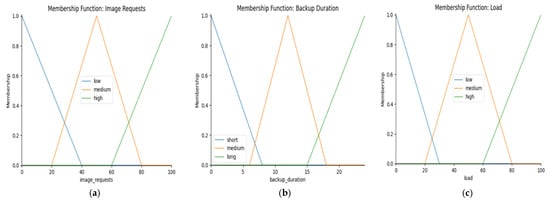
Figure 6.
(a) Membership functions for image requests; (b) membership functions for backup duration; and (c) membership functions for load.
2.6.2. Output Variable
The output variable is the suitability of the investment (area suitability) in the range [0–100], as shown in Table 10, divided into 3 levels—low, medium, and high.
Table 10.
Output variable.
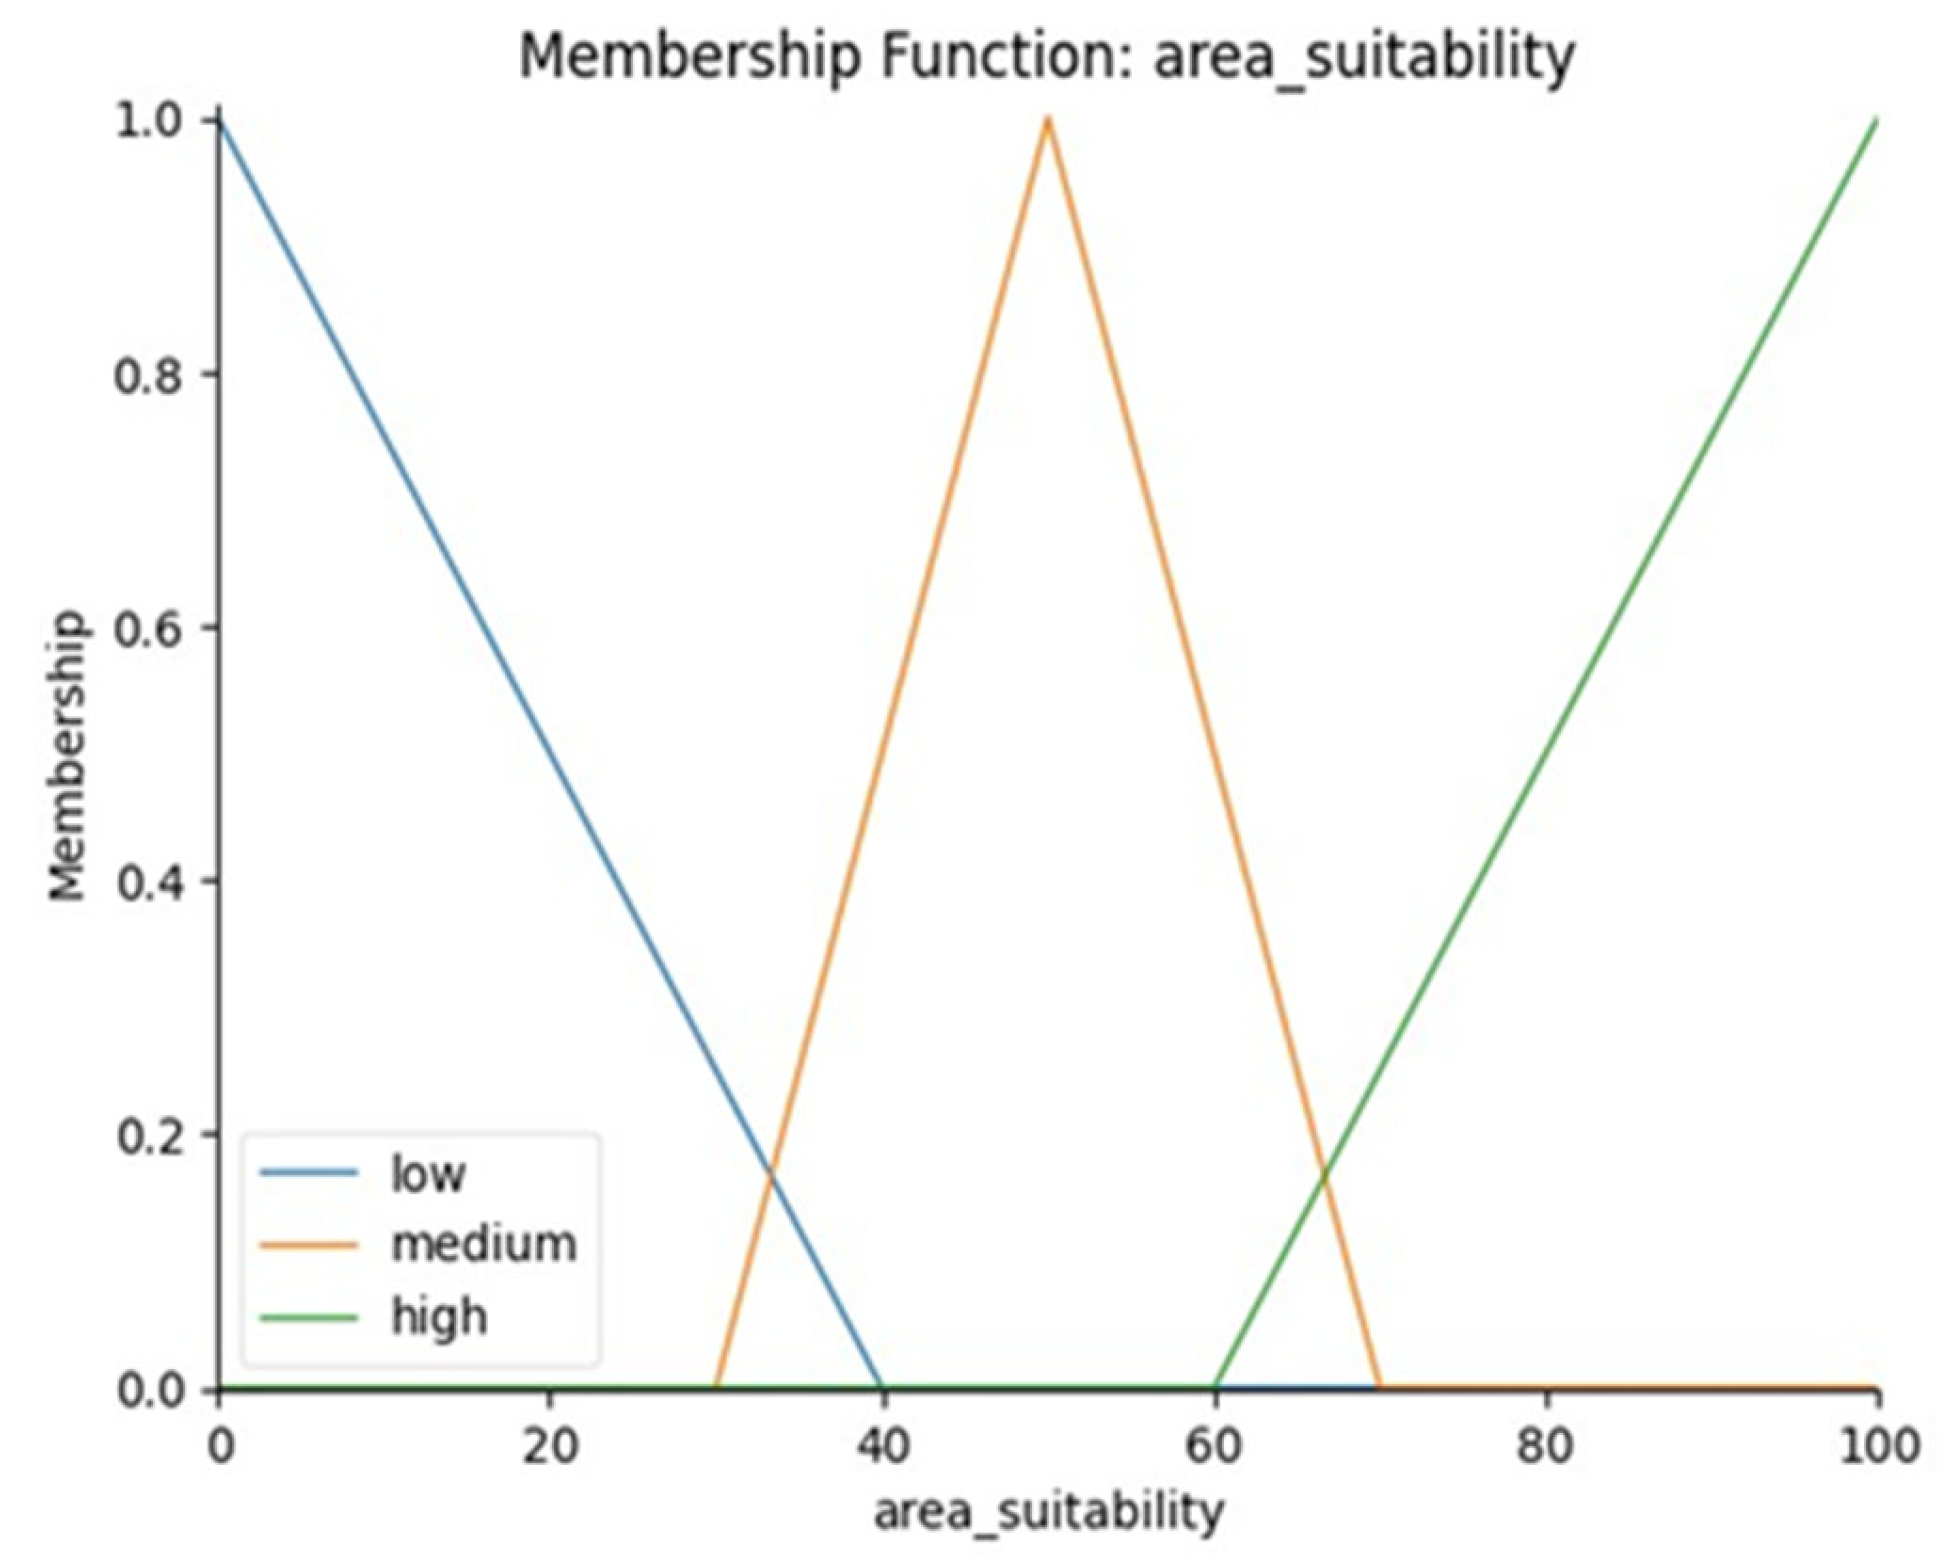
Membership functions of the area suitability variable in the range [0–100], as shown in Figure 7, were divided into 3 levels as follows: the blue line is the low level, the orange line is the medium level, and the green line is the high level.
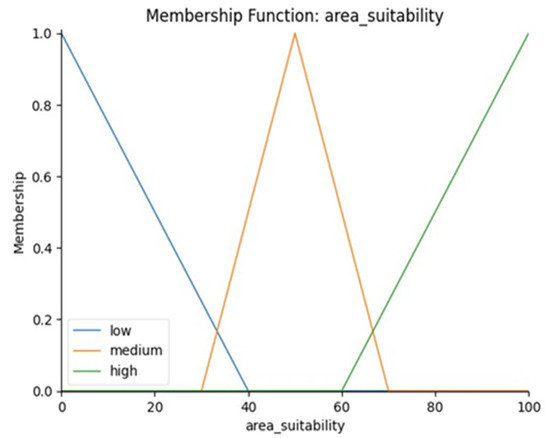
Figure 7.
Membership functions for area suitability.
2.6.3. Rules of Fuzzy Logic
A set of 27 rules was established to cover all possible cases of input variable combinations.
rules = [
ctrl.Rule(image_requests[‘’low”] & backup_duration[“short”] & load[“low”], area_suitability[“low”]),
ctrl.Rule(image_requests[“low”] & backup_duration[“short”] & load[“medium”], area_suitability[“low”]),
ctrl.Rule(image_requests[“low”] & backup_duration[“short”] & load[“high”], area_suitability[“low”]),
ctrl.Rule(image_requests[“low”] & backup_duration[“medium”] & load[“low”], area_suitability[“low”]),
ctrl.Rule(image_requests[“low”] & backup_duration[“medium”] & load[“medium”], area_suitability[“low”]),
ctrl.Rule(image_requests[“low”] & backup_duration[“medium”] & load[“high”], area_suitability[“low”]),
ctrl.Rule(image_requests[“low”] & backup_duration[“long”] & load[“low”], area_suitability[“low”]),
ctrl.Rule(image_requests[“low”] & backup_duration[“long”] & load[“medium”], area_suitability[“medium”]),
ctrl.Rule(image_requests[“low”] & backup_duration[“long”] & load[“high”], area_suitability[“medium”]),
ctrl.Rule(image_requests[“medium”] & backup_duration[“short”] & load[“low”], area_suitability[“low”]),
ctrl.Rule(image_requests[“medium”] & backup_duration[“short”] & load[“medium”], area_suitability[“medium”]),
ctrl.Rule(image_requests[“medium”] & backup_duration[“short”] & load[“high”], area_suitability[“medium”]),
ctrl.Rule(image_requests[“medium”] & backup_duration[“medium”] & load[“low”], area_suitability[“medium”]),
ctrl.Rule(image_requests[“medium”] & backup_duration[“medium”] & load[“medium”], area_suitability[“medium”]),
ctrl.Rule(image_requests[“medium”] & backup_duration[“medium”] & load[“high”], area_suitability[“high”]),
ctrl.Rule(image_requests[“medium’’] & backup_duration[‘’long’’] & load[‘’low’’], area_suitability[‘’medium’’]),
ctrl.Rule(image_requests[‘’medium’’] & backup_duration[‘’long’’] & load[‘‘medium’’], area_suitability[‘’high’’]),
ctrl.Rule(image_requests[‘’medium’’] & backup_duration[‘‘long’’] & load[‘’high’’], area_suitability[‘’high’’]),
ctrl.Rule(image_requests[‘‘high’’] & backup_duration[‘’short’’] & load[‘‘low’’], area_suitability[‘’medium’’]),
ctrl.Rule(image_requests[‘’high’’] & backup_duration[‘’short’’] & load[‘‘medium’’], area_suitability[‘’medium’’]),
ctrl.Rule(image_requests[‘’high’’] & backup_duration[‘‘short’’] & load[‘‘high’’], area_suitability[‘‘high’’]),
ctrl.Rule(image_requests[‘’high’’] & backup_duration[‘‘medium’’] & load[‘’low’’], area_suitability[‘’high’’]),
ctrl.Rule(image_requests[‘’high’’] & backup_duration[‘‘medium’’] & load[‘’medium’’], area_suitability[‘‘high’’]),
ctrl.Rule(image_requests[‘’high’’] & backup_duration[‘‘medium’’] & load[‘‘high’’], area_suitability[‘‘high’’]),
ctrl.Rule(image_requests[‘’high’’] & backup_duration[‘‘long’’] & load[‘‘low’’], area_suitability[‘’high’’]),
ctrl.Rule(image_requests[‘’high’’] & backup duration[‘‘long’’] & load[‘‘medium’’], area_suitability[‘‘high’’]),
ctrl.Rule(image_requests[‘’high’’] & backup_duration[‘‘long’’] & load[‘‘high’’], area_suitability[‘‘high’’]),]
2.6.4. Processing in a Fuzzy Logic System
The analysis of suitability values for an area in a fuzzy logic system follows these steps:
- Fuzzification:
Convert the normalized data into membership values (low, medium, high) according to the membership functions.
- Rule Evaluation:
Evaluate the truth value of each rule using logical operators (AND/OR).
- Aggregation:
Combine the results from all the rules to construct the output variable’s membership function.
- Defuzzification
Convert the fuzzy values into a precise numerical value (Crisp Value) using the centroid method.
2.6.5. Grouping of Evaluation Results
The final result of the suitability value (area suitability) obtained from the fuzzy logic system was grouped into the following value ranges:
1–20: not suitable for investment.
21–40: slightly unsuitable for investment.
41–60: moderately suitable for investment.
61–80: quite suitable for investment.
81–100: highly suitable for investment.
3. Results
The collected data were normalized, consisting of the number of image requests from CCTV (image requests), the cumulative duration of power outages (backup duration), and the total electrical power used for CCTV (load) in the area according to Table 1, Table 2 and Table 3. The normalized data were entered into the fuzzy logic model, as shown for each subdistrict as follows.
3.1. Latkrabang Subdistrict
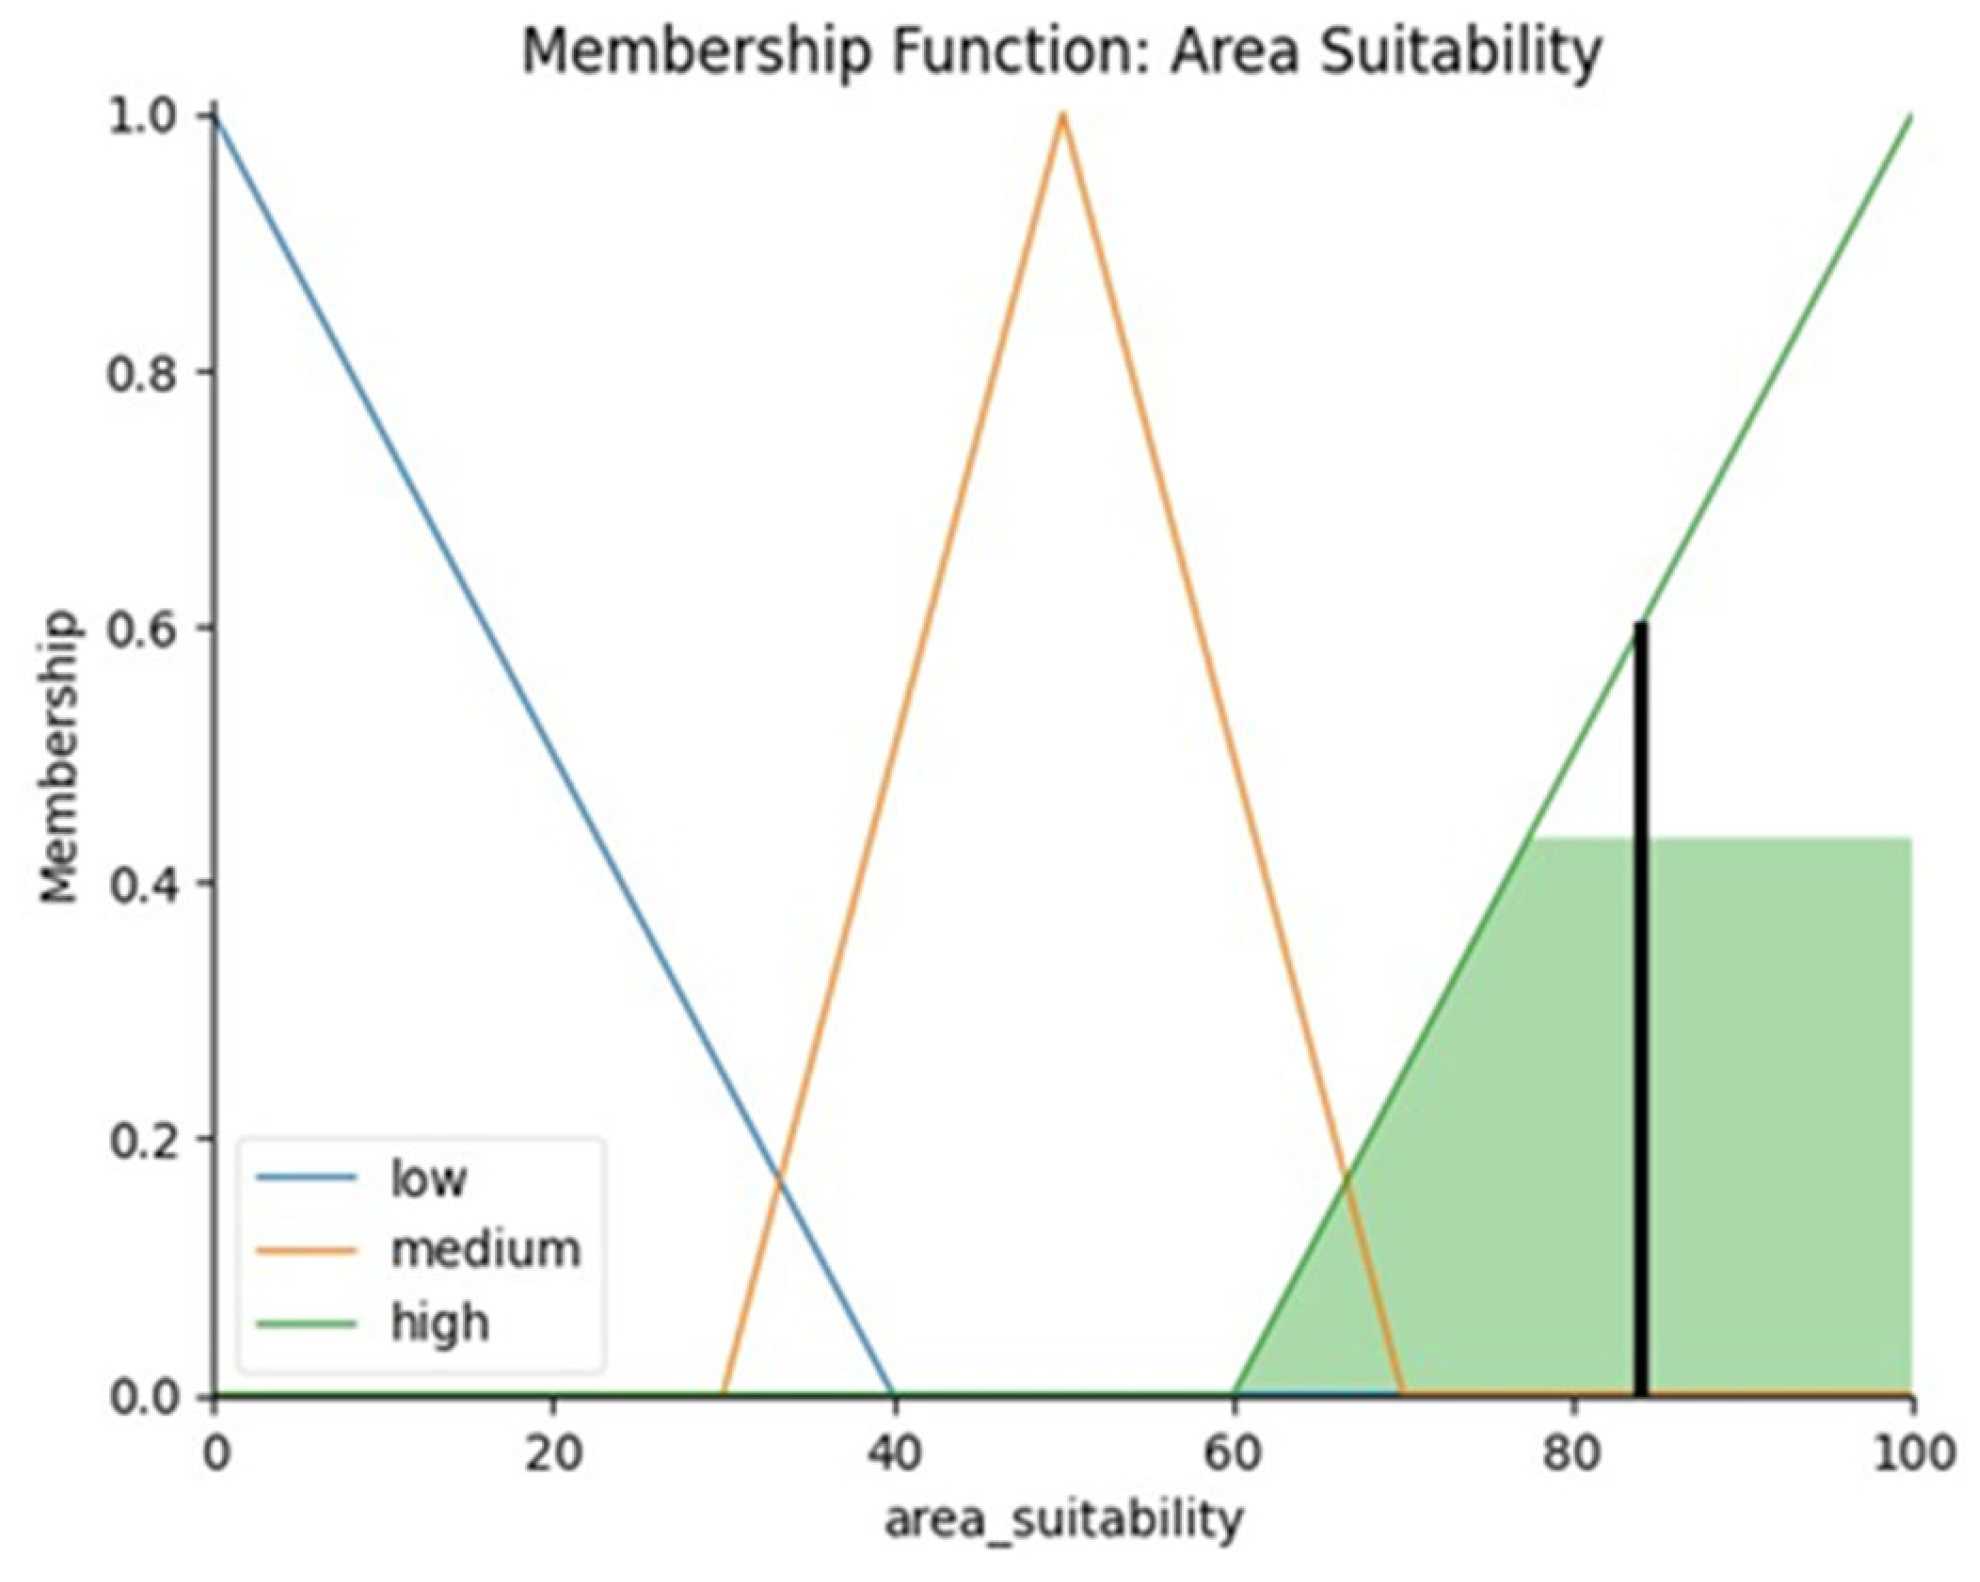
The normalized data for the Latkrabang subdistrict, consisting of image requests, backup duration, and load, were 100, 100, and 100, respectively. The normalization process was completed, and the information was entered into the fuzzy logic model, revealing that the Latkrabang subdistrict has an area suitability of 86.67% in the evaluation group. This indicates high potential for investment, as shown in Figure 8.
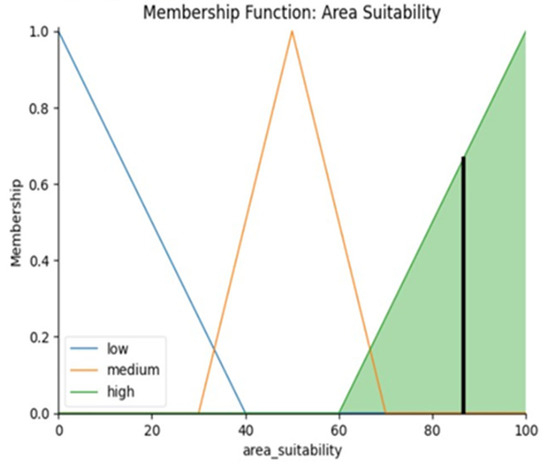
Figure 8.
Latkrabang subdistrict’s area suitability: 86.67% according black line (highly suitable for investment according green part).
3.2. Thapyao Subdistrict
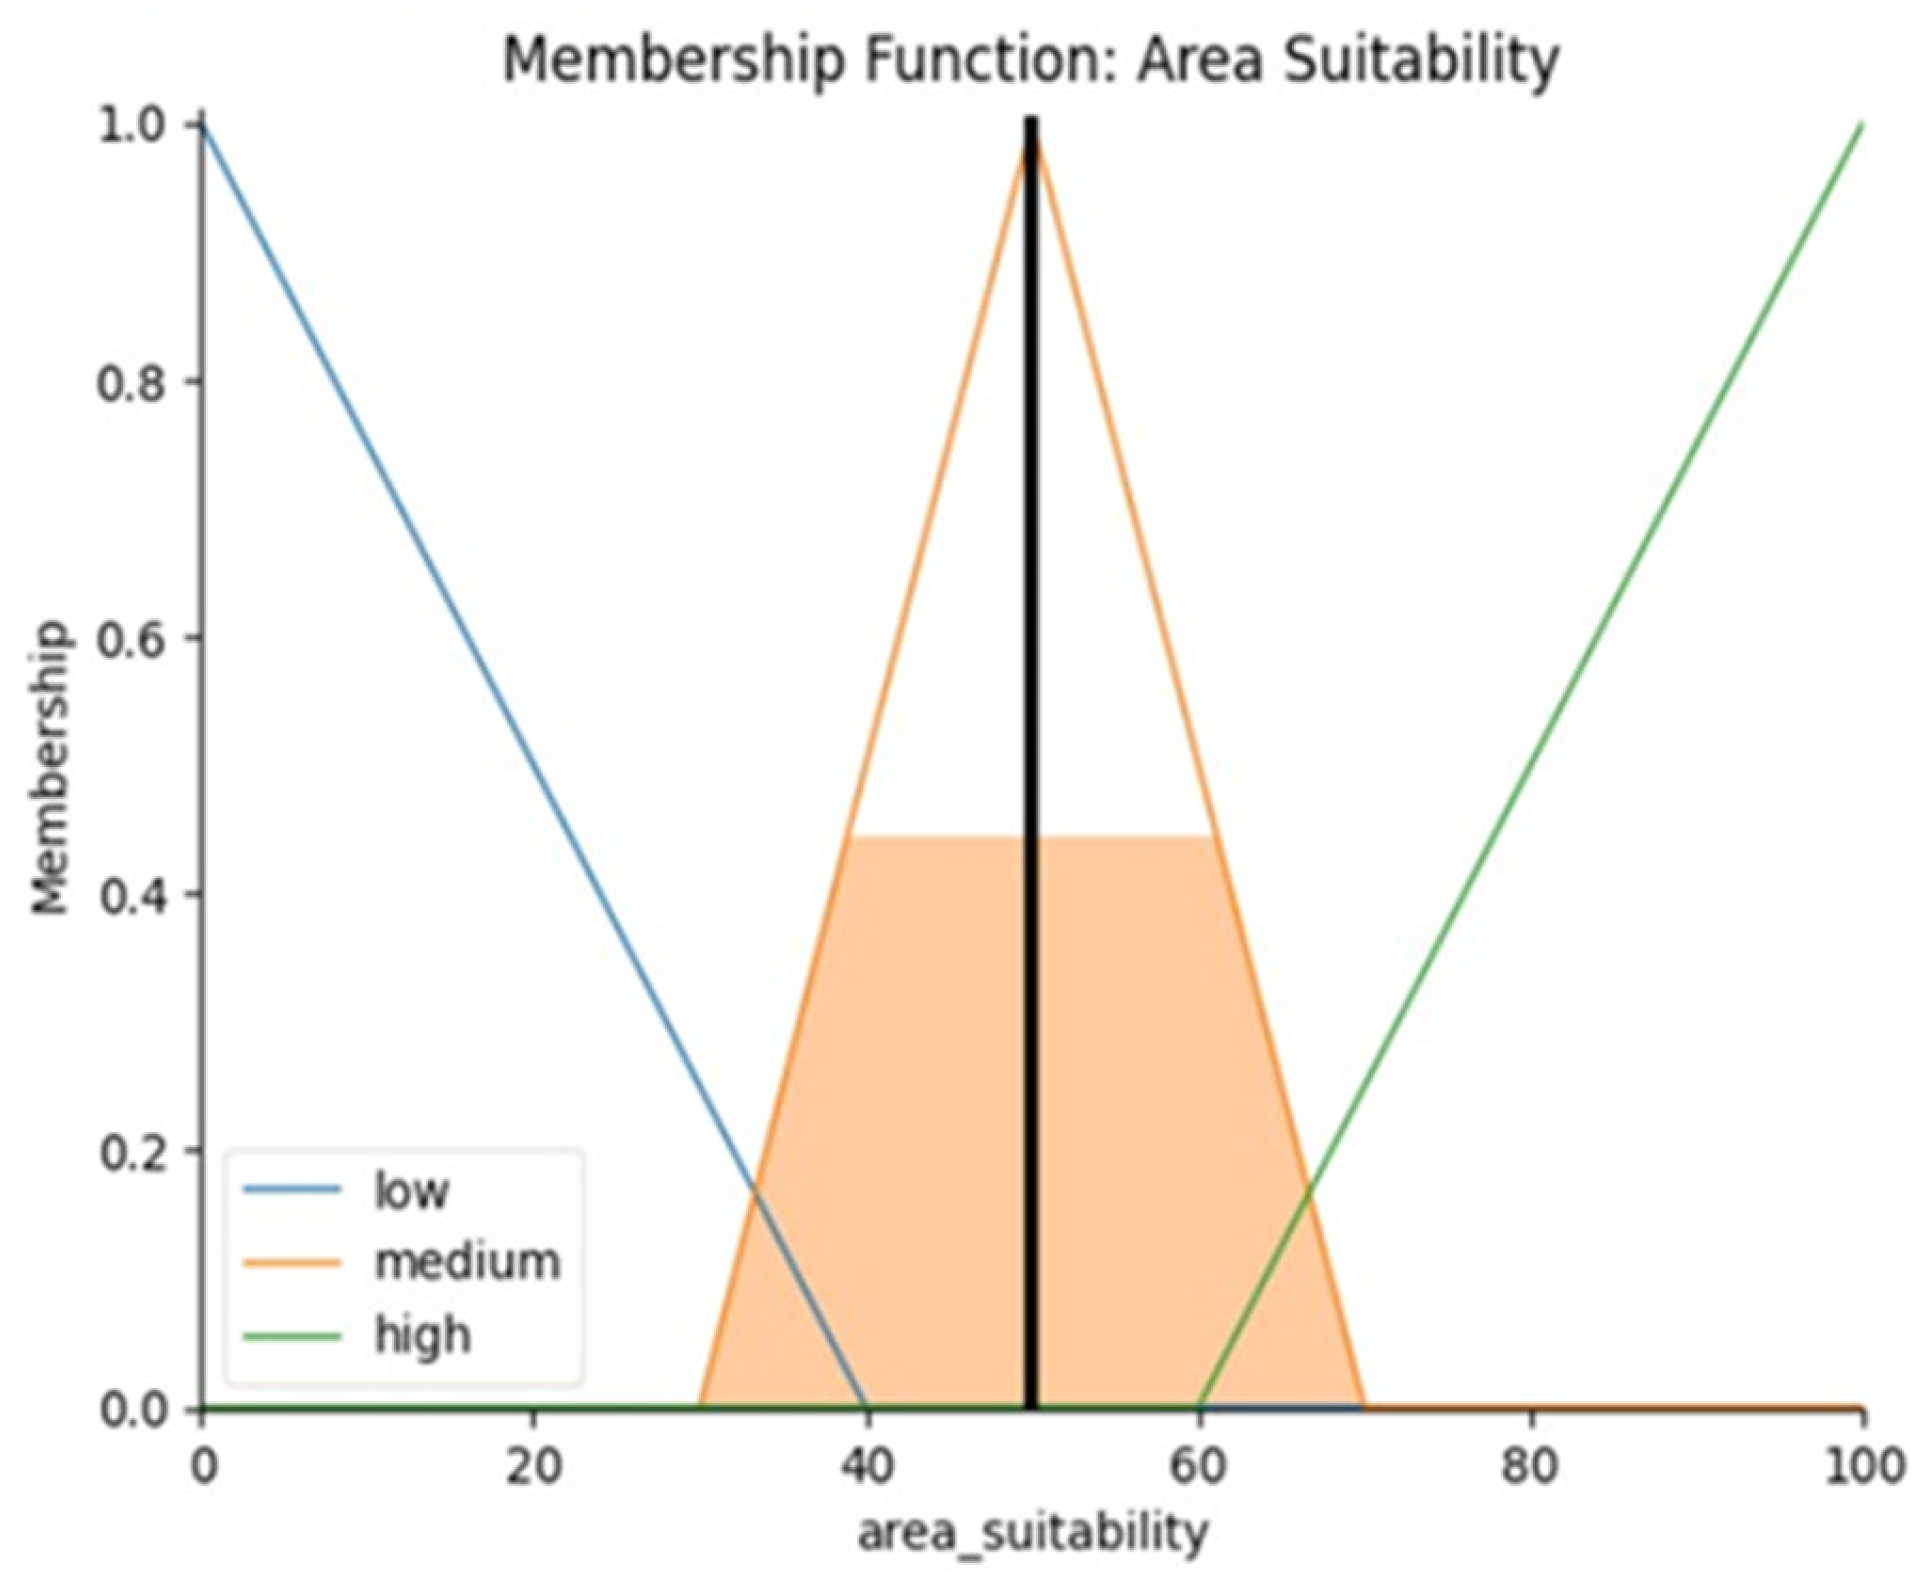
The normalized data for the Thapyao subdistrict, consisting of image requests, backup duration, and load, were 41, 2.41, and 33.33, respectively. The normalization process was completed, and the information was entered into the fuzzy logic model, revealing that the Thapyao subdistrict has an area suitability of 50.00% in the evaluation group. This indicates a moderate level of investment suitability, as shown in Figure 9.

Figure 9.
Thapyao subdistrict’s area suitability: 50.00% according black line (moderately suitable for investment according orange part).
3.3. Lamphla Tiew Subdistrict
The normalized data for the Lamphla Tiew subdistrict, consisting of image requests, backup duration, and load, were 45, 98.68, and 77.38, respectively. The normalization process was completed, and the information was entered into the fuzzy logic model, revealing that the Lamphla Tiew subdistrict has an area suitability of 83.94% in the evaluation group. This indicates very high potential for investment, as shown in Figure 10.
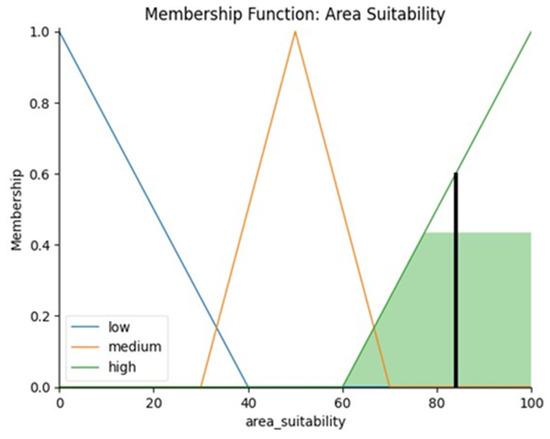
Figure 10.
Lamphla Tiew subdistrict’s area suitability: 83.94% according black line (highly suitable for investment according green part).
3.4. Khumthong Subdistrict
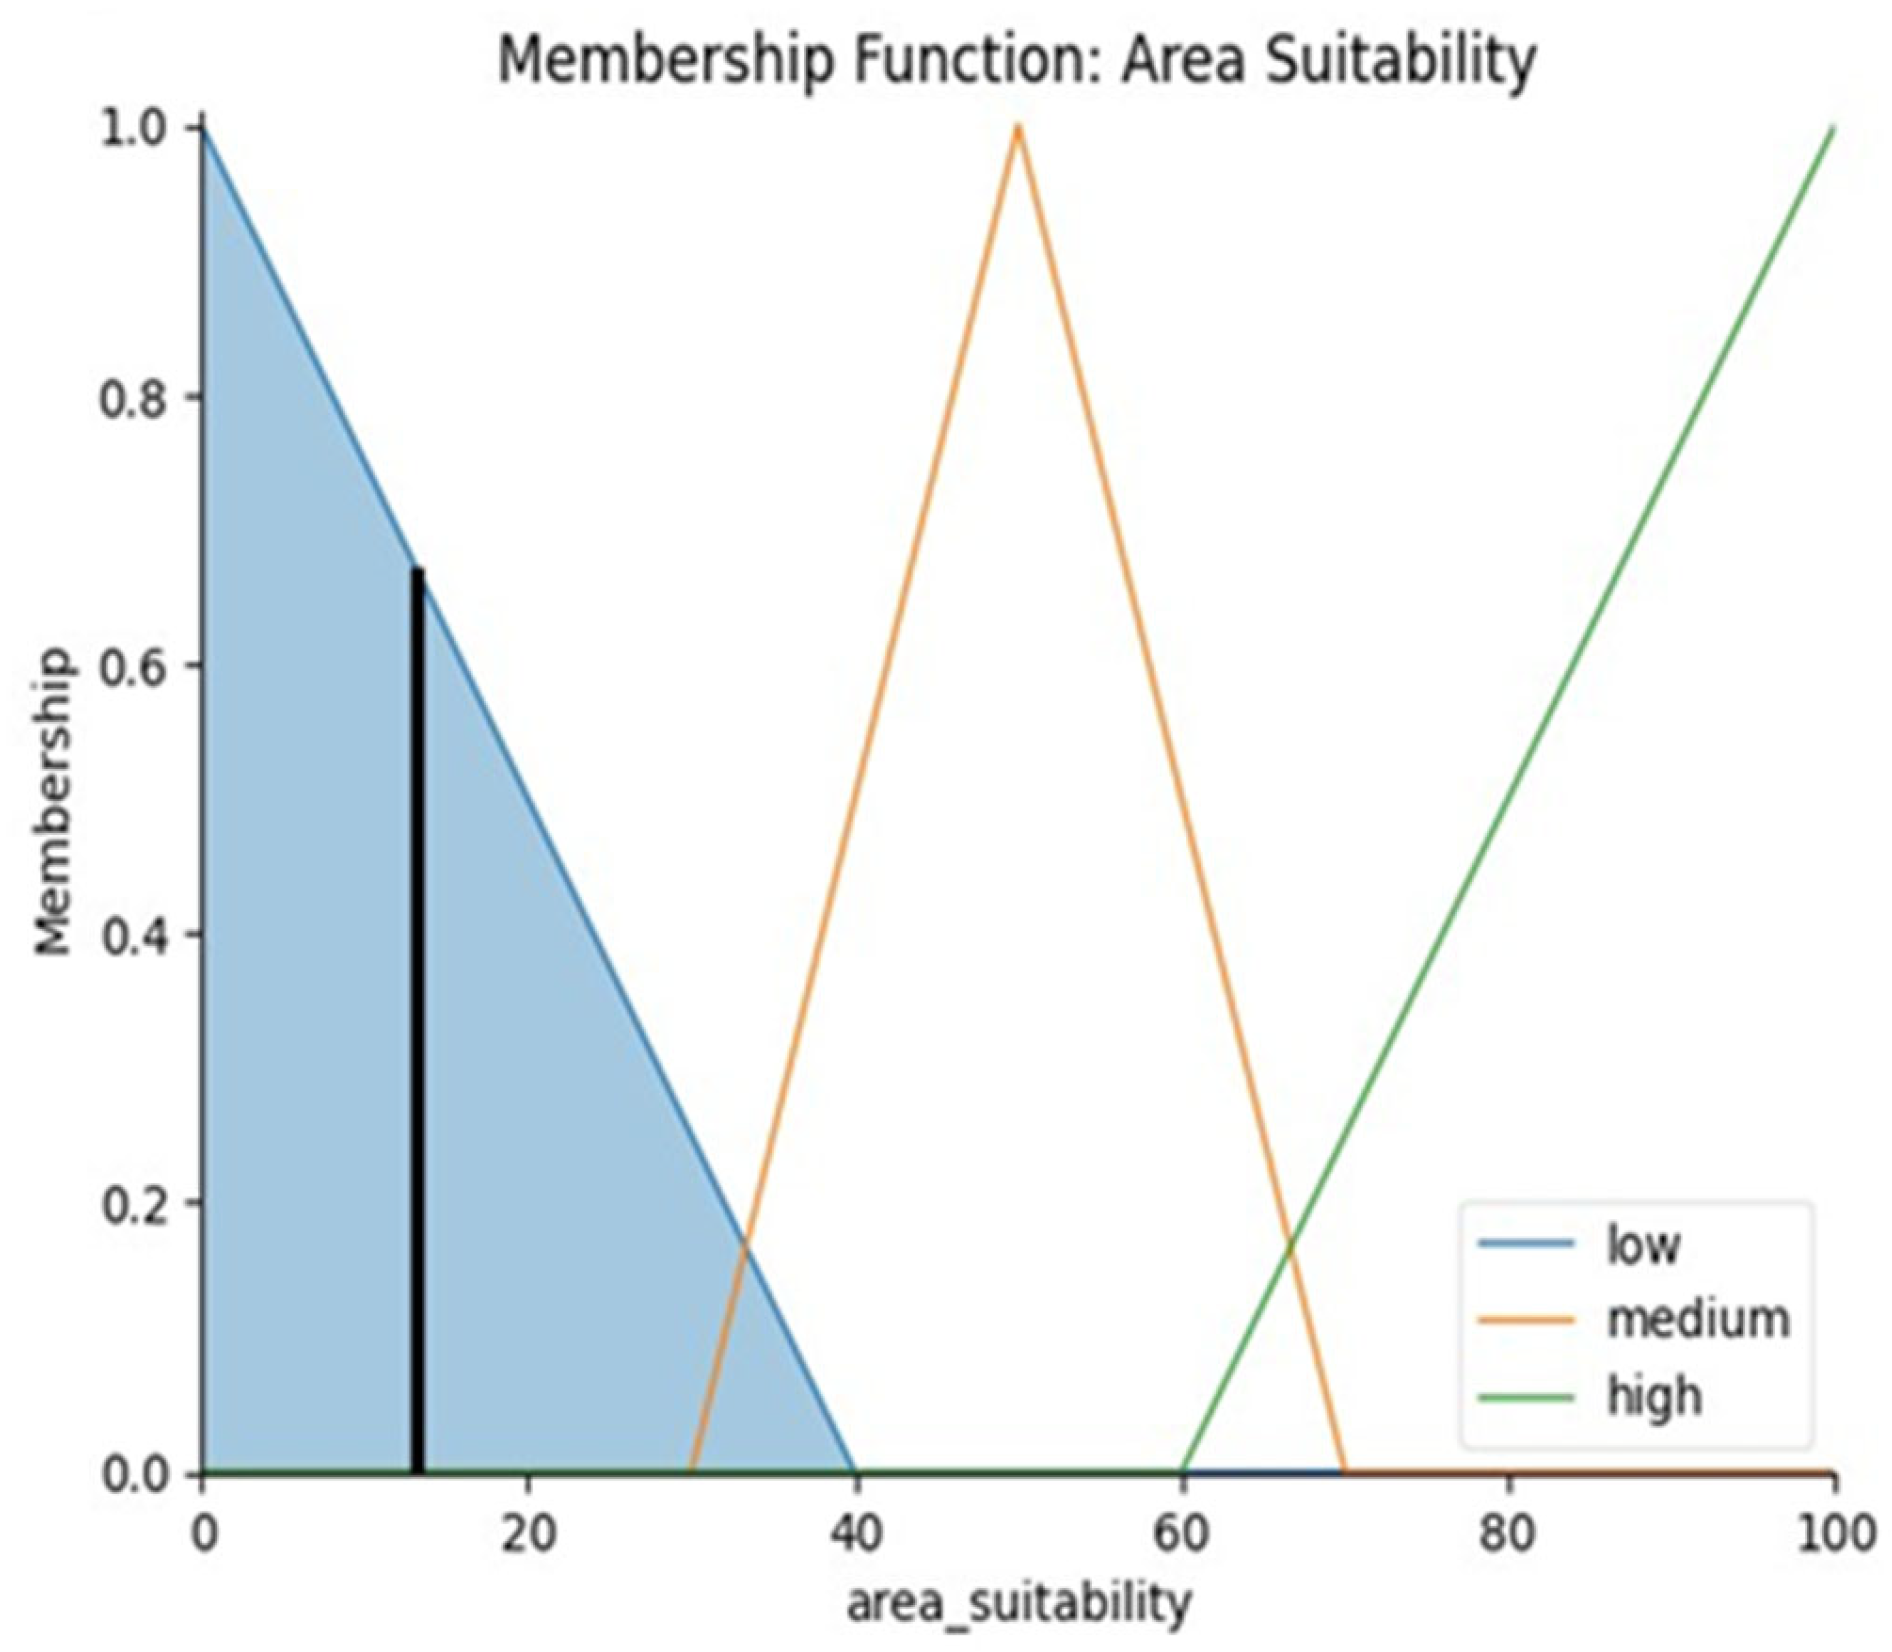
The normalized data for the Khumthong subdistrict, consisting of image requests, backup duration, and load, were 0, 0, and 0, respectively. The normalization process was completed, and the information was entered into the fuzzy logic model, revealing that the Khumthong subdistrict has an area suitability of 13.33% in the evaluation group, indicating that it is not worth investing in, as shown in Figure 11.

Figure 11.
Khamthong subdistrict’s area suitability: 13.33% according black line (not suitable for investment according blue part).
3.5. Khlongsam Prawet Subdistrict
The normalized data for the Khlongsam Prawet subdistrict, consisting of image requests, backup duration, and load, were 28.5, 77.19, and 15.48, respectively. The normalization process was completed, and the information was entered into the fuzzy logic model, revealing that the Khlongsam Prawet subdistrict has an area suitability of 33.50% in the evaluation group. This indicates that it is quite inappropriate for investment, as shown in Figure 12.
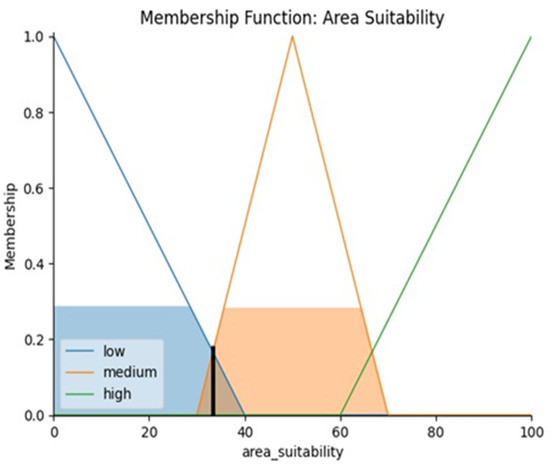
Figure 12.
Khlongsam Pravet subdistrict’s area suitability: 33.50% according black line (slightly unsuitable for investment according orange part).
3.6. Khlongsong Ton Nun Subdistrict
The normalized data for the Khlongsong Ton Nun subdistrict, consisting of image requests, backup duration, and load, were 58.50, 4.82, and 90.48, respectively. The normalization process was completed, and the information was entered into the fuzzy logic model, revealing that the Khlongsong Ton Nun subdistrict has an area suitability of 50.00% in the evaluation group, indicating that it is not worth investing in, as shown in Figure 13.
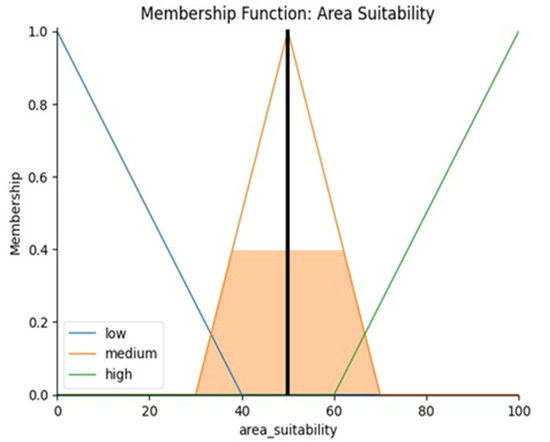
Figure 13.
Khlongsong Ton Nun subdistrict’s area suitability: 50.00% according black line (moderately suitable for investment according orange part).
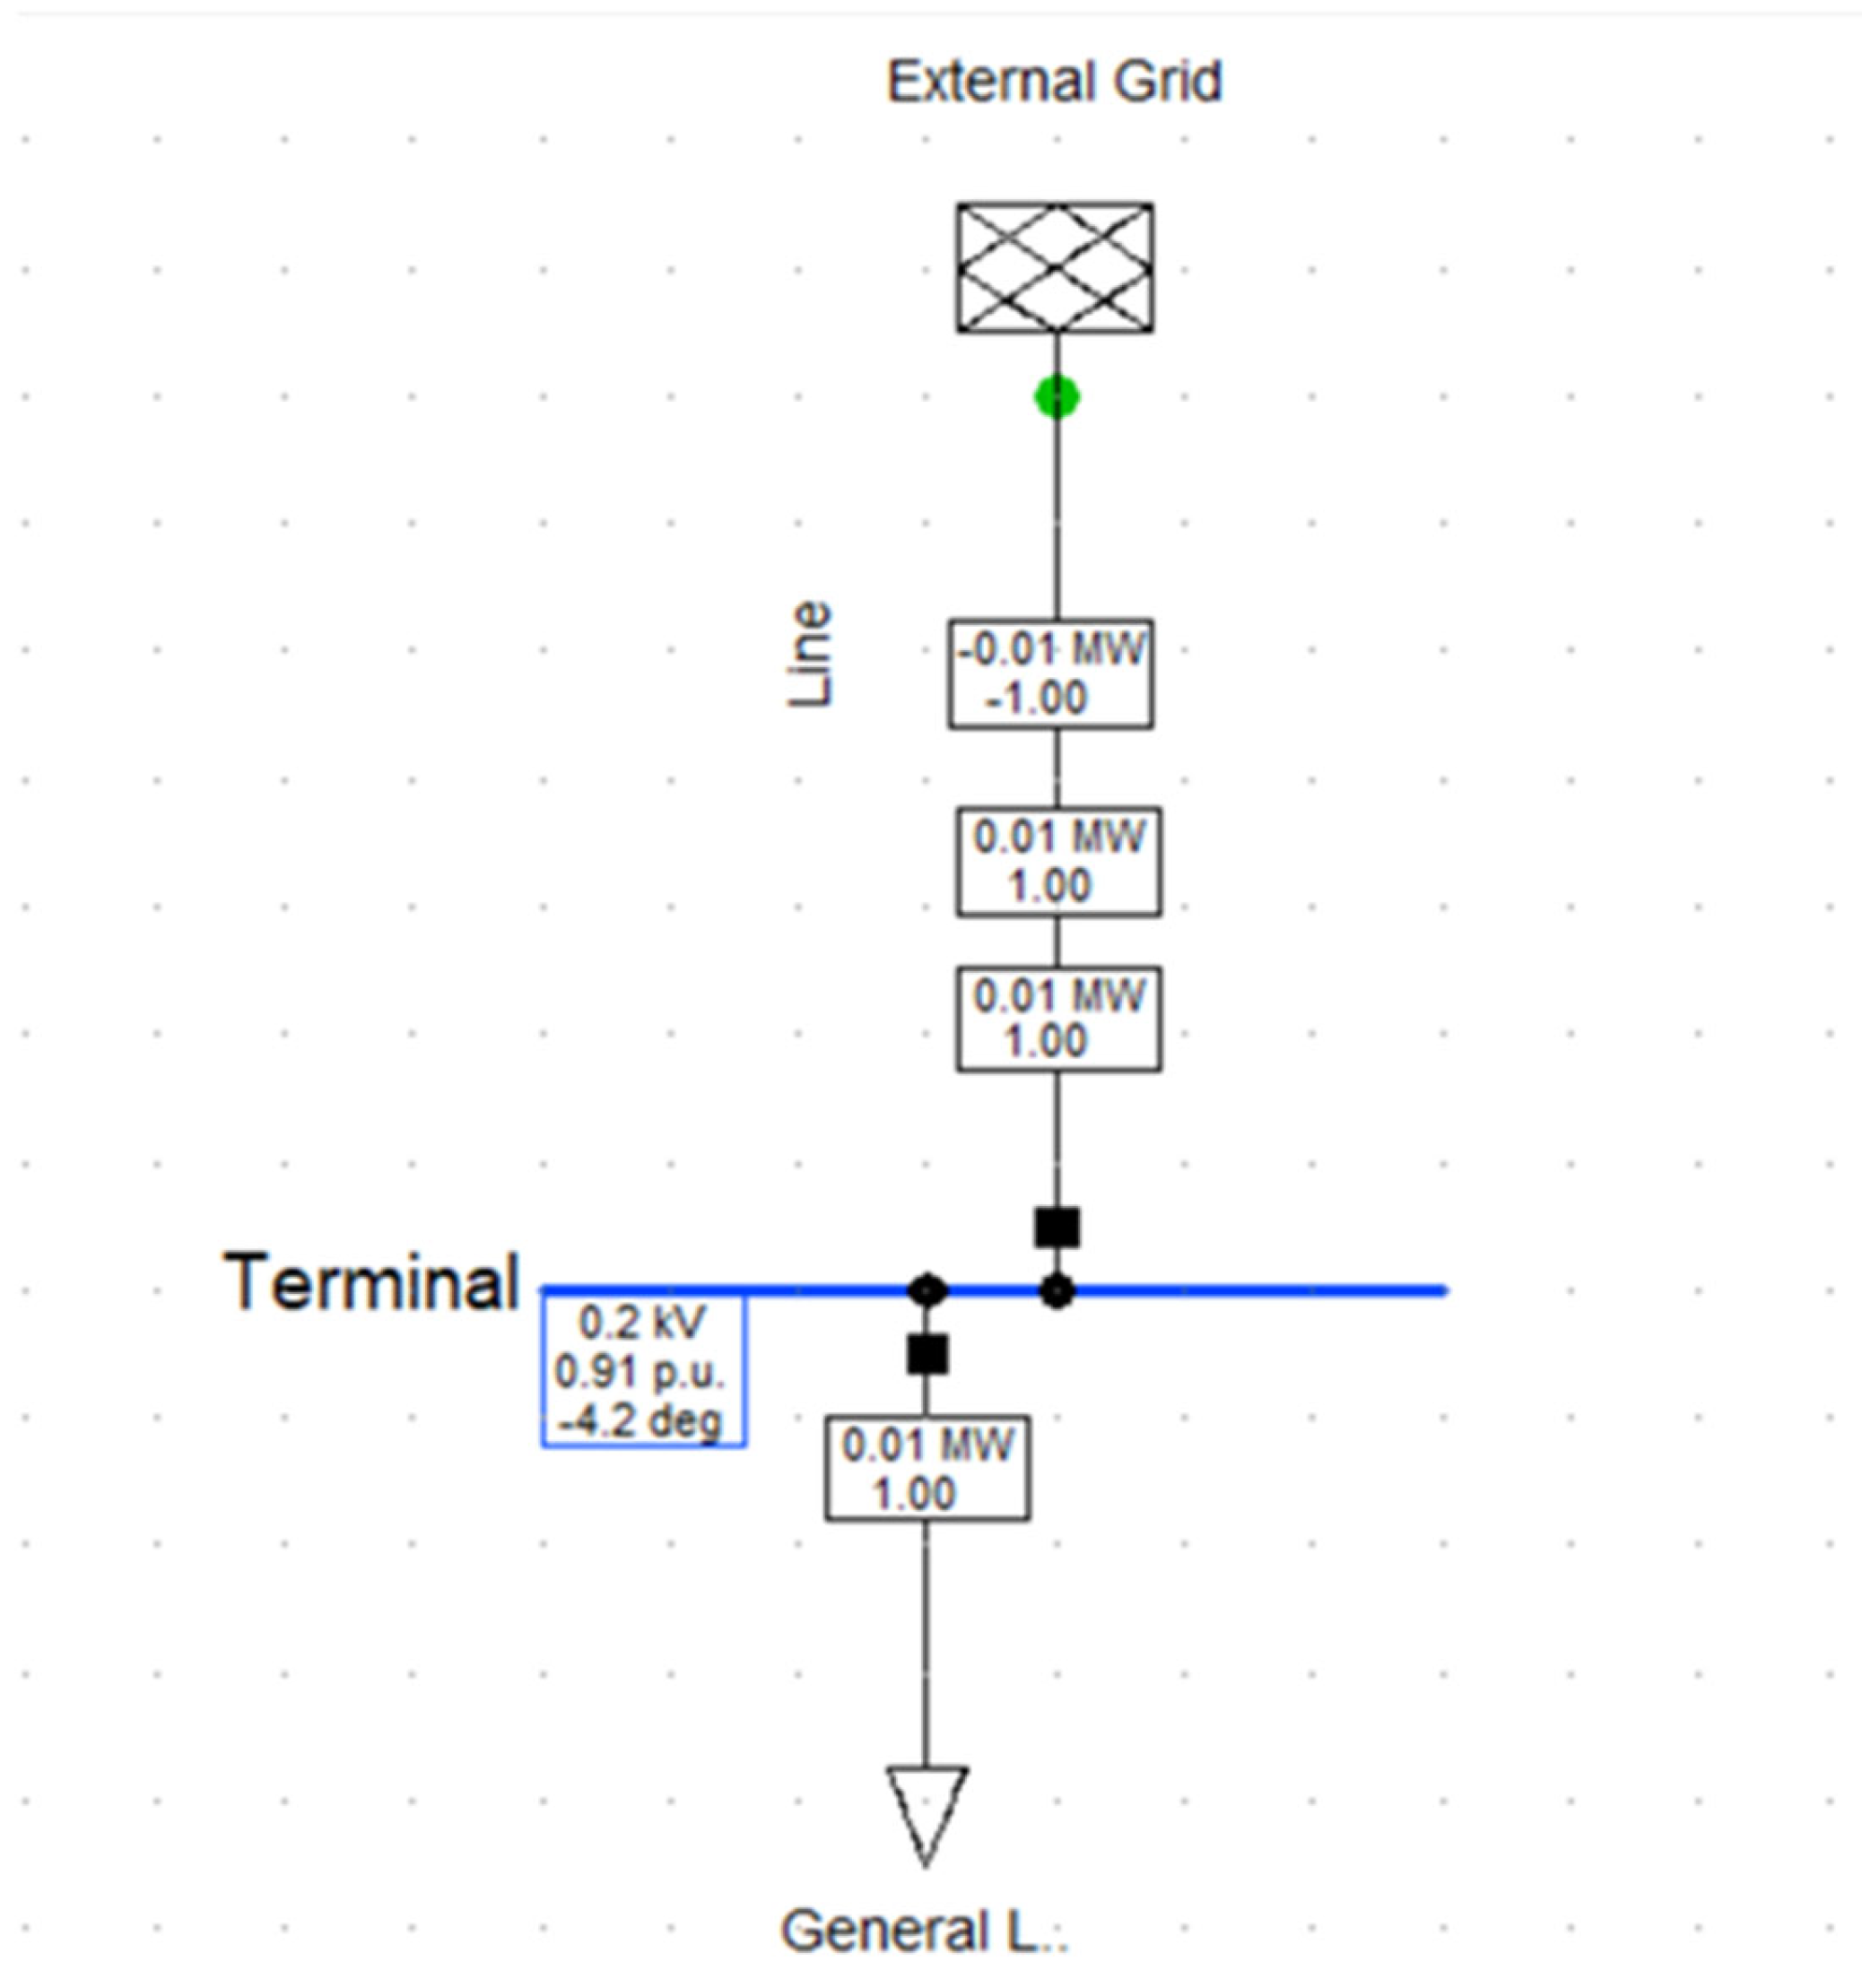
From the evaluation of critical areas using the fuzzy logic model, it was found that two subdistricts, Latkrabang and Lampla Tiew, are highly suitable for investment, as shown in Table 11. Subsequently, the load profiles of electricity usage by CCTV at each point were input into the DIgSILENT program to determine the BESS size for each CCTV point within the subdistricts deemed highly suitable for investment. The BESS size for each point was calculated to be 160.2 Wh, as shown in Figure 14.
Table 11.
Summary of area evaluation results.
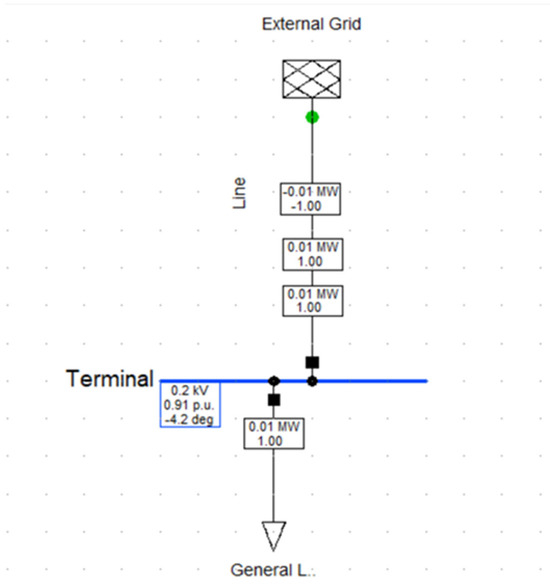
Figure 14.
The model for determining the BESS size using the DIgSILENT program.
4. Conclusions
The analysis of the data showed that fuzzy logic is the most suitable method for uncertain and unstable data. Next are neural networks and genetic algorithms, which have limitations in terms of computation time and inconsistent results. The evaluation of critical areas using the fuzzy expert system was highly effective in assessing the installation of BESSs for CCTV in the Latkrabang District of Bangkok, which consists of six subdistricts: Latkrabang, Khlongsong Ton Nun, Khlongsam Prawet, Lampla Tiew, Thapyao, and Khumthong. It was found that the Latkrabang subdistrict was the most suitable for investment, with a suitability of 86.67%, followed by the Lampla Tiew subdistrict at 83.94%. However, the number of CCTV installations in each district cannot indicate critical locations for installing BESSs. These areas were identified as the most critical for BESS installation at existing CCTV points. Meanwhile, if additional installations are planned, BESSs should be incorporated.
The BESS size was determined based on the maximum recorded power outage duration of 57 min, leading to a designed backup duration of 1 h. Using the DIgSILENT program, the BESS size at each critical point was calculated to be 160.2 Wh. This demonstrates that the fuzzy expert system can efficiently manage ambiguous data and support decision-making, ultimately reducing costs by avoiding the installation of BESSs in unsuitable areas.
Author Contributions
Methodology, S.P.; Software, E.S.; Validation, K.S.; Formal analysis, C.P.; Supervision, P.U. All authors have read and agreed to the published version of the manuscript.
Funding
This research received no external funding.
Data Availability Statement
The data presented in this study can be obtained from the corresponding author due to privacy concerns.
Conflicts of Interest
The authors declare no conflict of interest.
References
- Bhatti, M.T.; Khan, M.G.; Aslam, M.; Fiaz, M.J. Weapon Detection in Real-Time CCTV Videos Using Deep Learning. IEEE Access 2021, 9, 34366–34382. [Google Scholar] [CrossRef]
- Singh, V.; Singh, S.; Gupta, P. Real-Time Anomaly Recognition Through CCTV Using Neural Networks. Procedia Comput. Sci. 2020, 173, 254–263. [Google Scholar] [CrossRef]
- Yin, X.; Ma, T.; Bouferguene, A.; Al-Hussein, M. Automation for sewer pipe assessment: CCTV video interpretation algorithm and sewer pipe video assessment (SPVA) system. Autom. Constr. 2021, 125, 103622. [Google Scholar] [CrossRef]
- Wang, M.; Kumar, S.S.; Cheng, J.C. Automated sewer pipe defect tracking in CCTV videos based on defectdetection and metric learning. Autom. Constr. 2021, 121, 103438. [Google Scholar] [CrossRef]
- Choi, W.; Sung, H.; Chong, K. AI-Driven Particulate Matter Estimation Using Urban CCTV: A Comparative Analysis Under Various Experimental Conditions. Appl. Sci. 2024, 14, 9629. [Google Scholar] [CrossRef]
- Maksymowicz, K.; Kuzan, A.; Szleszkowski, L.; Tunikowski, W. Anthropological Comparative Analysis of CCTV Footage in a 3D Virtual Environment. Appl. Sci. 2023, 13, 11879. [Google Scholar] [CrossRef]
- Lim, S.; Kwon, S.H.; Shin, G.; Lee, S. Deep Learning for Automated Water Segmentation through CCTV Images in Agricultural Reservoirs. Eng. Proc. 2024, 69, 140. [Google Scholar] [CrossRef]
- Choi, W.; Jang, B.; Jung, I.; Sung, H.; Jang, Y. Evaluation of Preferences for a Thermal-Camera- Based Abnormal Situation Detection Service via the Integrated Fuzzy AHP/TOPSIS Model. Appl. Sci. 2023, 13, 11591. [Google Scholar] [CrossRef]
- Seong, N.; Kim, J.; Lim, S. Graph-Based Anomaly Detection of Ship Movements Using CCTV Videos. J. Mar. Sci. Eng. 2023, 11, 1956. [Google Scholar] [CrossRef]
- Song, J.; Nang, J. Pedestrian Abnormal Behavior Detection System Using Edge–Server Architecture for Large–Scale CCTV Environments. Appl. Sci. 2024, 14, 4615. [Google Scholar] [CrossRef]
- Ahn, Y.; Choi, H.; Kim, B.S. Development of early fire detection model for buildings using computer vision-based CCTV. J. Build. Eng. 2023, 65, 105647. [Google Scholar] [CrossRef]
- Wang, G.; Ding, H.; Duan, M.; Pu, Y.; Yang, Z.; Li, H. Fighting against terrorism: Areal-time CCTV autonomous weapons detection based on improved YOLO v4. Digit. Signal Process. 2023, 132, 103790. [Google Scholar] [CrossRef]
- González, J.L.; Zaccaro, C.; Álvarez-García, J.A.; Morillo, L.M.; Caparrini, F.S. Real-time gun detection in CCTV: An open problem. Neural Netw. 2020, 132, 297–308. [Google Scholar]
- Elaadouli, N.; Lajouad, R.; El Magri, A.; Mansouri, A.; Elmezdi, K. Adaptive control strategy for energy management in a grid-connected Battery Energy Storage System using a bidirectional Vienna rectifier. J. Energy Storage 2024, 104, 114382. [Google Scholar] [CrossRef]
- Okafor, C.E.; Folly, K.A. Design and implementation of a control system for multifunctional applications of a Battery Energy Storage System (BESS) in a power system network. Clener Energy Syst. 2024, 9, 100153. [Google Scholar] [CrossRef]
- Chauhan, R.; Santran, R.; Obrecht, M.; Singh, R. Energy storage potential of used electric vehicle batteries for supporting renewable energy generation in India. Energy Sustain. Dev. 2024, 81, 101513. [Google Scholar] [CrossRef]
- Serat, Z. Optimizing renewable energy systems for 100% clean energy target: A comparative study of solar, hydro, pumped hydro, and battery storage technologies. J. Energy Storage 2024, 104, 114441. [Google Scholar] [CrossRef]
- Saleem, M.I.; Saha, S.; Izhar, U.; Ang, L. A stochastic MPC-based energy management system for integrating solar PV, battery storage, and EV charging in residential complexes. Energy Build. 2024, 325, 114993. [Google Scholar] [CrossRef]
- Vega-Garita, V.; Alpizar–Gutierrez, V.; Calderon-Obaldia, F.; Núñez–Mata, O.; Arguello, A.; Immonen, E. Iterative sizing methodology for photovoltaic plants coupled with battery energy storage systems to ensure smooth power output and power availability. Energy Convers. Manag. X 2024, 24, 100716. [Google Scholar] [CrossRef]
- Jiménez-Ruiz, J.; Honrubia-Escribano, A.; Gómez-Lázaro, E. Combined Use of Python and DIgSILENT PowerFactory to Analyse Power Systems with Large Amounts of Variable Renewable Generation. Electronics 2024, 13, 2134. [Google Scholar] [CrossRef]
- Dyussembekova, N.; Schütt, R.; Leiße, I.; Ralfs, B. Decision Process for Identifying Appropriate Devices for Power Transfer between Voltage Levels in Distribution Grids. Energies 2024, 17, 2158. [Google Scholar] [CrossRef]
- Ishraque, M.F.; Rahman, A.; Shezan, S.A.; Shafiullah, G.M.; Alenezi, A.H.; Hossen, M.D.; Bintu, N.E.N. Design Optimization of a Grid-Tied Hybrid System for a Department at a University with a Dispatch Strategy-Based Assessment. Sustainability 2024, 16, 2642. [Google Scholar] [CrossRef]
- Garibello-Narváez, D.R.; Gómez-Luna, E.; Vasquez, J.C. Performance Evaluation of Distance Relay Operation in Distribution Systems with Integrated Distributed Energy Resources. Energies 2024, 17, 4735. [Google Scholar] [CrossRef]
- Traffic and Transportation Department, Bangkok Metropolitan Administration, CCTV Image Report. 2023.
- Metropolitan Electricity Authority, Formal Outage Feeder Report. 2023.
- Kumar, A.; Kashyap, H.; Malhotra, H.; Rawat, K.; Kumar, G.; Soni, U. Preferential Selection of Locations for Installing CCTV using Fuzzy TOPSIS approach: A case study for North Delhi. In Proceedings of the 2019 Twelfth International Conference on Contemporary Computing (IC3), Noida, India, 8–10 August 2019. [Google Scholar]
- Medvediev, I.; Muzylyov, D.; Montewka, J. A model for agribusiness supply chain risk management using fuzzy logic. Case study: Grain route from Ukraine to Poland. Transp. Res. 2024, 190, 103691. [Google Scholar] [CrossRef]
- Rathour, L.; Singh, V.; Sharma, M.K.; Dhiman, N.; Mishra, V.N. A review of fuzzy logic analysis in COVID-19 pandemic and a new technique through extended hexagonal intuitionistic fuzzy number in analysis of COVID-19. Results Control. Optim. 2024, 17, 100498. [Google Scholar] [CrossRef]
- Hassan, M.N.; Fariha, F.T.; Zayee, Z.; Hasan, M. Analyzing different functional and dyeing performance of natural blended fabric utilizing natural dyes and quality prediction by fuzzy logic. Heliyon 2024, 10, e40399. [Google Scholar] [CrossRef]
- Usman, H.M.; ElShatshat, R.; El-Hag, A.H. Energy management for smart residential homes: A real-time fuzzy logic approach. Electr. Power Syst. Res. 2025, 238, 111057. [Google Scholar] [CrossRef]
- Dey, A.; Ashok, S.D. Fuzzy logic based qualitative indicators for promoting extended producer responsibility and sustainable food packaging waste management. Environ. Sustain. Indic. 2024, 24, 100534. [Google Scholar] [CrossRef]
- Mavani, N.R.; Ismail, M.A.; Abd Rahman, N.; Ali, J.M. Fuzzy logic-based barcode scanning system for food products halal identification. Food Control 2025, 168, 110926. [Google Scholar] [CrossRef]
- Arun, M.; Efremov, C.; Barik, D.; Sharma, P.; Bora, B.J.; Kowalski, J.; Le, H.C.; Truong, T.H.; Cao, D.N. Fuzzy logic-supported building design for low-energy consumption in urban environments. Case Stud. Therm. Eng. 2024, 64, 105384. [Google Scholar] [CrossRef]
- Khalil, E.; Akter, M. Prediction of seam strength of cotton canvas fabric using fuzzy logic. Results Control. Optim. 2024, 17, 100502. [Google Scholar] [CrossRef]


Disclaimer/Publisher’s Note: The statements, opinions and data contained in all publications are solely those of the individual author(s) and contributor(s) and not of MDPI and/or the editor(s). MDPI and/or the editor(s) disclaim responsibility for any injury to people or property resulting from any ideas, methods, instructions or products referred to in the content. |
© 2025 by the authors. Licensee MDPI, Basel, Switzerland. This article is an open access article distributed under the terms and conditions of the Creative Commons Attribution (CC BY) license (https://creativecommons.org/licenses/by/4.0/).