Article

Optimized Real-Time Energy Management and Neural Network-Based Control for Photovoltaic-Integrated Hybrid Uninterruptible Power Supply Systems

Institute of Physics and Electrical Engineering, University of Miskolc, 3515 Miskolc, Hungary
*
Author to whom correspondence should be addressed.
Energies 2025, 18(6), 1321; https://doi.org/10.3390/en18061321
Submission received: 20 February 2025 / Revised: 27 February 2025 / Accepted: 6 March 2025 / Published: 7 March 2025
(This article belongs to the Section A2: Solar Energy and Photovoltaic Systems)

Abstract

:
The increasing penetration of photovoltaic (PV) systems and the need for reliable backup power solutions have led to the development of hybrid uninterruptible power supply (UPS) systems. These systems integrate PV energy storage with battery backup and grid power to optimize real-time energy management. This paper proposes an advanced energy management strategy and an artificial neural network (ANN)-based control method for PV-integrated hybrid UPS systems. The proposed strategy dynamically determines the optimal power-sharing ratio between battery storage and the grid based on real-time economic parameters, load demand, and battery state of charge (SoC). A centralized ANN-based controller ensures precise control of the LLC converter and rectifier, achieving stable and efficient power distribution. Additionally, a genetic algorithm is implemented to optimize the power sharing ratio, minimizing the LCOE under varying load and electricity pricing conditions. The proposed approach is validated through simulations, demonstrating significant improvements in cost-effectiveness, system stability, and dynamic adaptability compared to conventional control methods. These findings suggest that integrating ANN-based control with optimized energy management can enhance the efficiency and sustainability of hybrid UPS systems, particularly in fluctuating energy markets.

1. Introduction

The global community is facing considerable challenges due to the increasing growth in energy consumption and the need to reduce carbon emissions. In order to achieve sustainability, electric power systems must adapt to new technologies and evolving patterns of energy consumption. While the widespread adoption of solar panels over the past decade has led to substantial advancements, their integration into the electricity grid poses significant challenges, both technological and economic. Ensuring system stability, maintaining a balance between production and consumption, and managing decentralized generation require particular attention [1,2].
In this context, uninterruptible power supplies, especially hybrid solutions integrating solar panels, play a key role. These systems not only provide a continuous power supply but also offer the possibility to optimize energy management. With energy management, hybrid UPS systems can be operated more economically by allowing the electricity generated by the solar panels to be consumed locally instead of being fed into the grid. This provides a significant advantage, especially in changing market conditions.
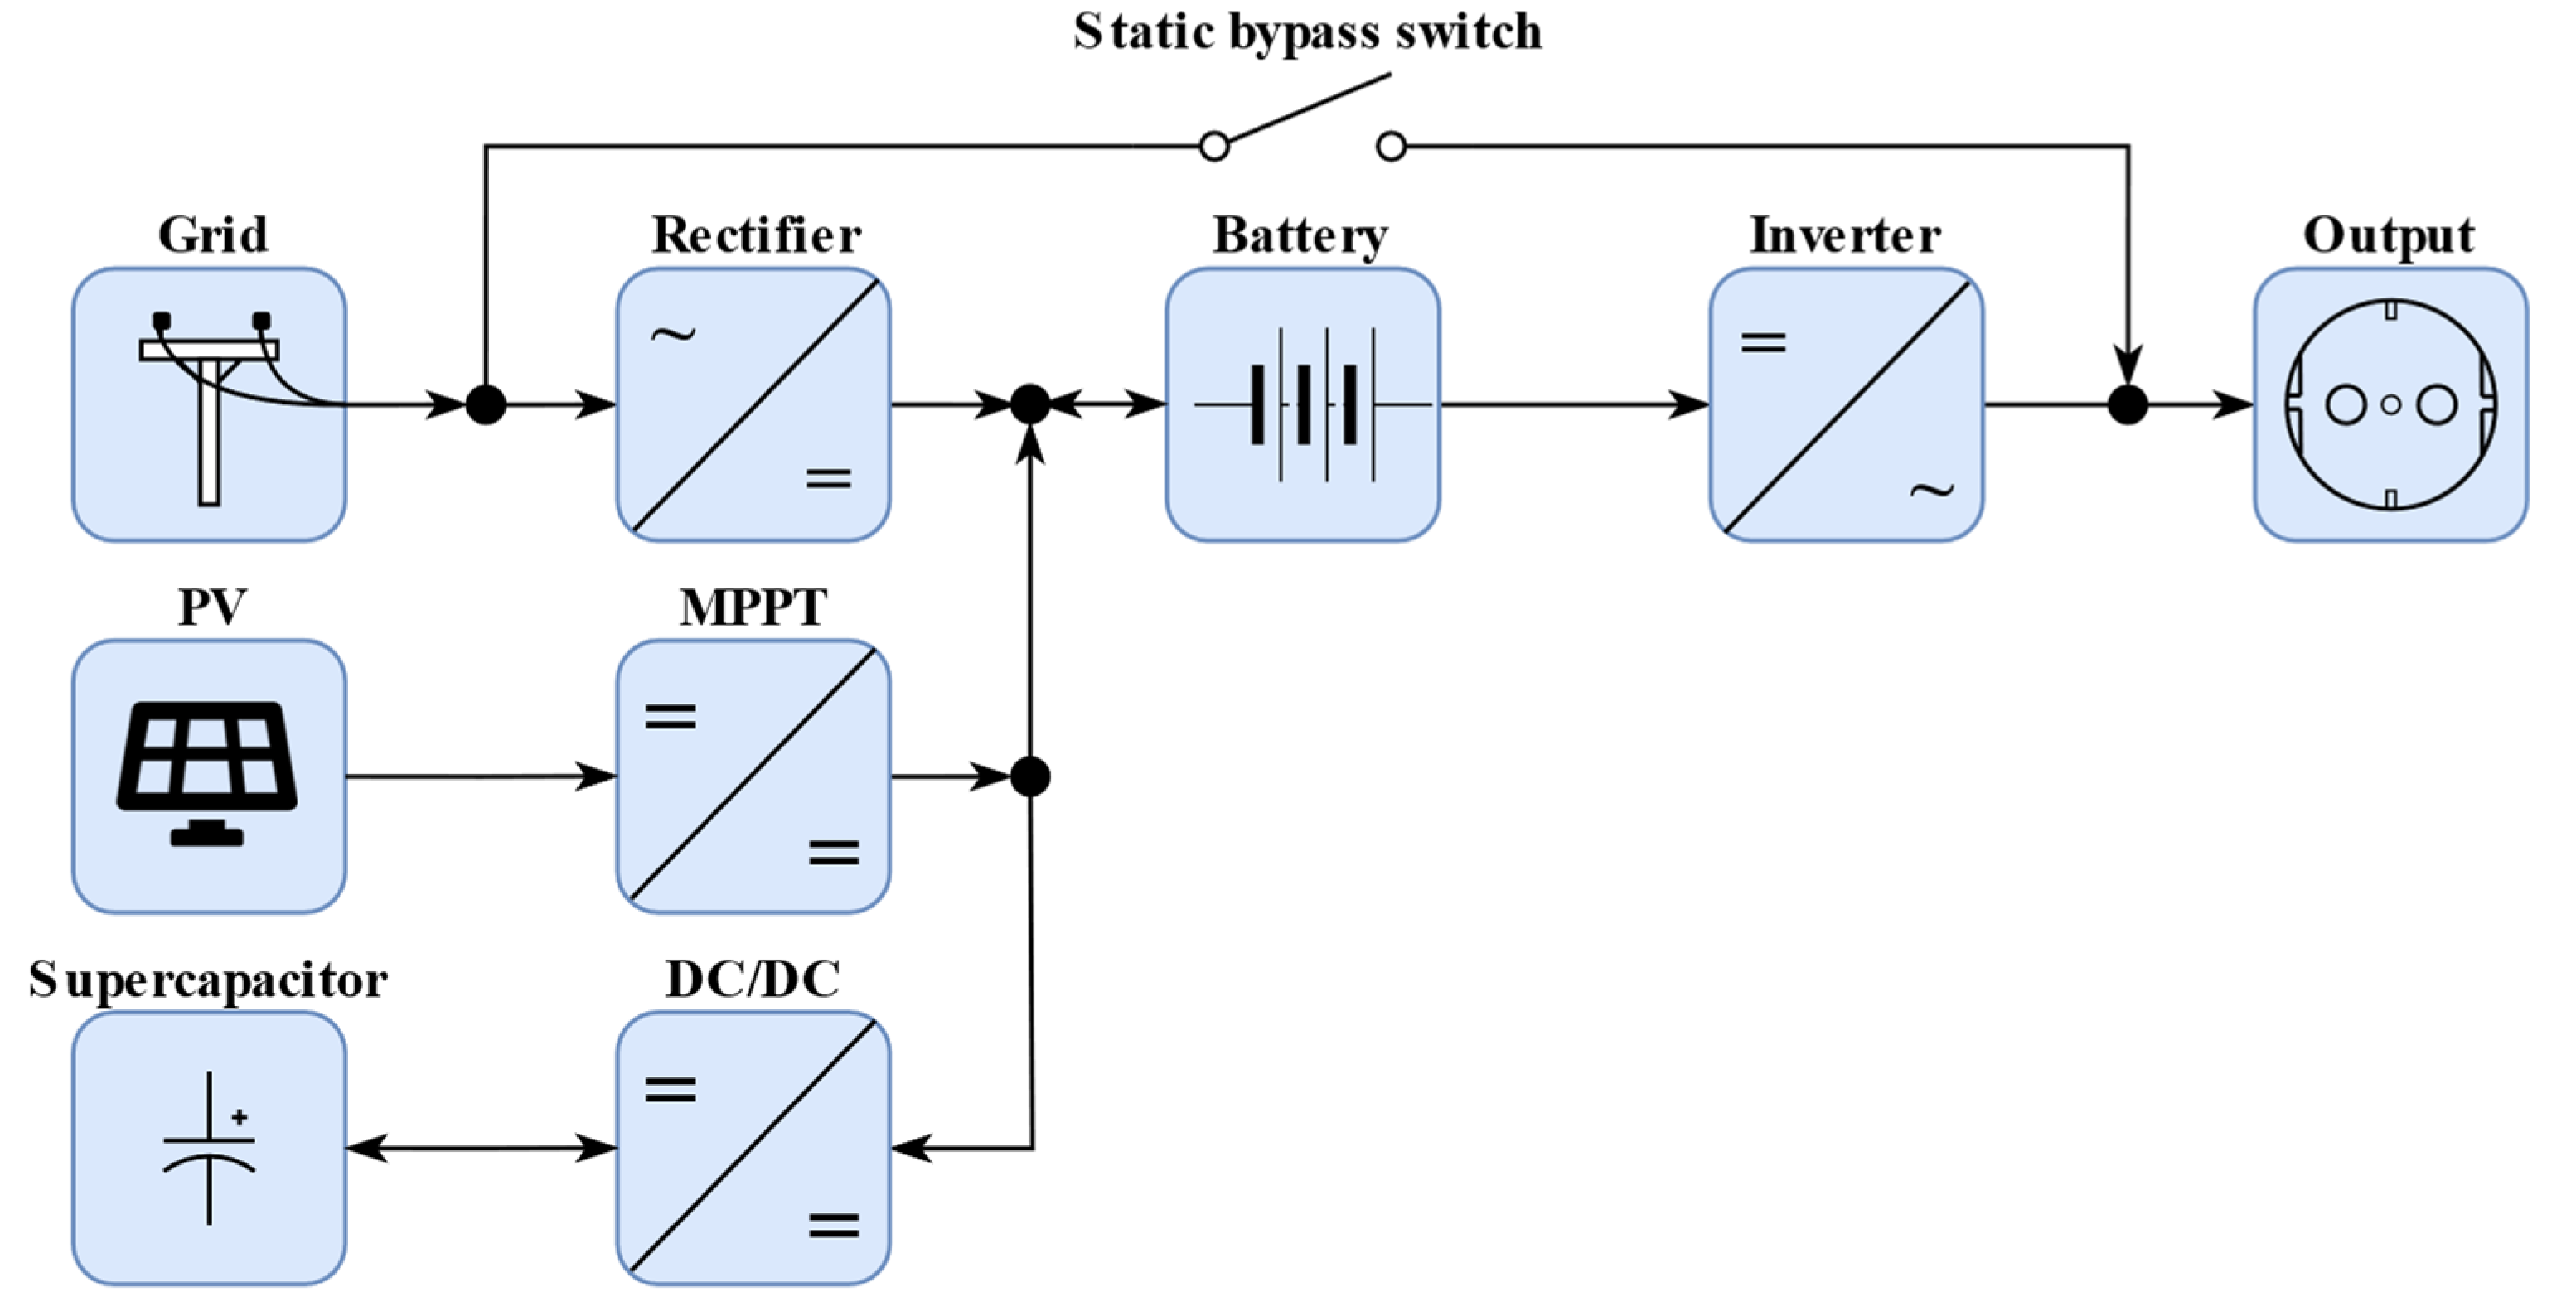
With the increasing prevalence of renewable energy sources, there has been a growing focus on decentralized energy supply systems, such as microgrids and nanogrids, which seek to optimize local energy utilization and enhance independence from the grid. Hybrid UPS systems and microgrid or nanogrid systems exhibit numerous similarities; however, for smaller systems, hybrid UPS systems are often the preferred option due to their cost-effectiveness and ease of control, attributable to their more straightforward design. Microgrid and nanogrid systems offer greater flexibility and more complex control options but come at a higher investment cost due to advanced control and integration of multiple power sources. Hybrid UPS systems are ideal where meeting local power demand, ensuring continuous power supply, and simple implementation are key considerations, especially for smaller-scale systems. These systems are more efficient when the aim is to use the energy generated by the solar panels locally, while providing cost-effectiveness and easy controllability. Generally, the architecture of a hybrid UPS system includes solar panels, battery storage, and an inverter system. Solar panels are used to convert sunlight into electricity that may be directly utilized for feeding the connected loads or stored in batteries for later use [3]. Optionally, the system can also include supercapacitors and fuel cells. Figure 1 shows an example of an intelligent hybrid UPS system [4,5].
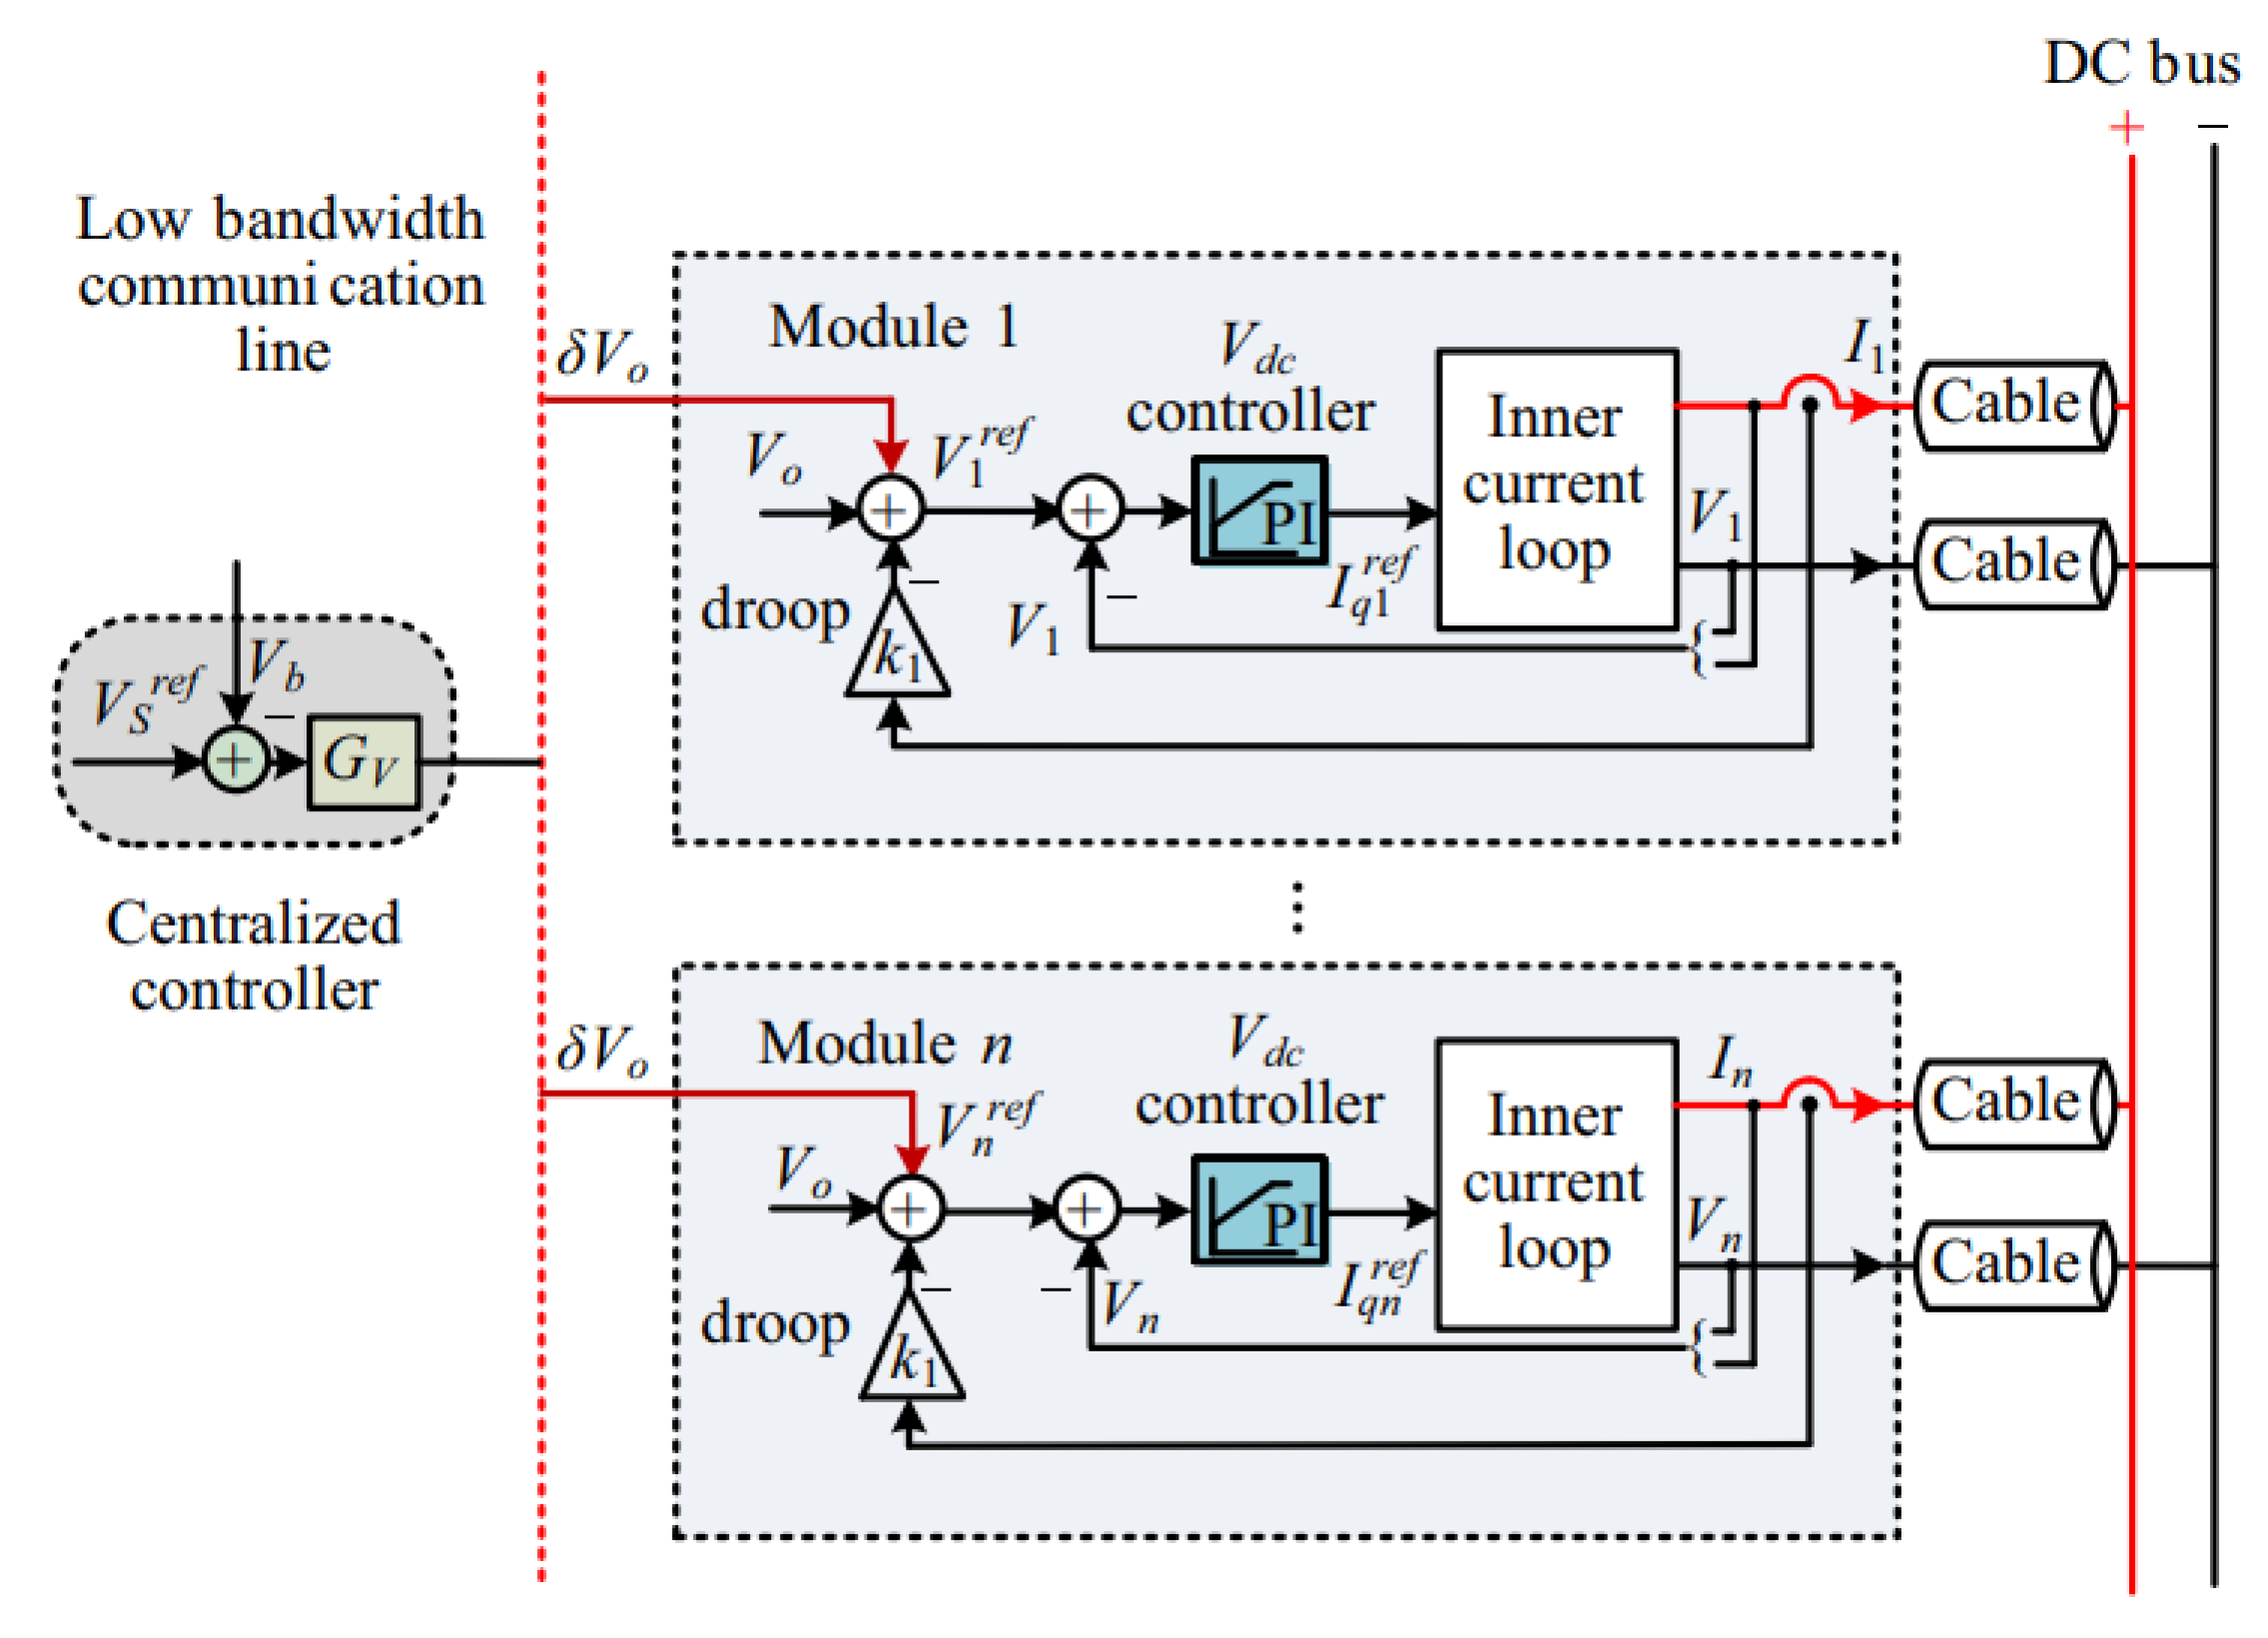
In hybrid UPS systems, centralized leader–follower control strategies are essential to manage distributed energy resources and ensure stable operation. This control architecture includes a leader unit that oversees the operation of multiple follower units and coordinates their actions to maintain voltage levels, efficiently share power, and respond to changes in load demand. Yang et al. say that for centralized DC microgrid systems, leader–follower control can be implemented, where the leader controls voltage and the followers control current [6]. Gao et al. also argue, symbolized in Figure 2, for a centralized leader–follower control strategy [7]. The figure shows that the control unit generates a voltage error signal from the voltage base signal and the feedback signal and sends it to the various modules, electronic converters, on the communication line. Each module has a droop controller, a voltage PI controller, and an internal control circuit. The output of each electronic converter is connected in parallel to the common DC circuit.
There are currently several scientific problems with hybrid UPS, microgrid, and nanogrid systems. One of the biggest problems is the primary and secondary control of parallel connected generators (e.g., grid, solar, battery) when they supply different proportions of consumers. The control is performed by a droop controller which, in addition to load sharing, also tries to stabilize the voltage. Traditional droop control methods can lead to issues such as voltage deviations and poor load sharing when the sources have different characteristics or when there are variations in line impedances [8,9,10]. Variability in renewable generation can lead to rapid fluctuations in power output, which traditional droop control methods may struggle to accommodate. This variability can result in significant voltage deviations and challenges in maintaining system stability [8,11]. In addition to these technical challenges, the communication requirements of hybrid UPS systems can also pose problems. While droop control is advantageous due to its decentralized nature, the lack of communication can lead to difficulties in achieving coordinated control among multiple sources [12]. Furthermore, the design of droop control parameters is crucial for ensuring optimal performance in hybrid UPS systems. The selection of appropriate droop coefficients is essential for achieving accurate power sharing and voltage control, according to Bunker et al. [13].
Artificial neural networks have emerged as a promising alternative to traditional PID controllers in managing power sharing within hybrid UPS systems. This assertion is supported by various studies that highlight the advantages of ANN-based control strategies, particularly in terms of adaptability, efficiency, and performance under varying operational conditions. One of the primary advantages of ANN controllers is their ability to learn and adapt in real time, which is crucial for hybrid UPS systems that often face dynamic load conditions. For instance, Alatshan et al. emphasize that ANN controllers can learn from historical data and make informed decisions without requiring a precise mathematical model of the system, thus providing a fast dynamic response [14]. This capability allows ANNs to effectively manage the complexities associated with power sharing in hybrid systems, particularly when compared to the static nature of PID controllers, which rely on fixed parameters that may not adequately respond to changing conditions [15]. Moreover, the robustness of ANN controllers in handling nonlinear and time-varying systems is well documented. Amer et al. note that ANNs can model nonlinear, multiple-input multiple-output (MIMO) systems, making them particularly suitable for the intricate dynamics of hybrid UPS systems [16]. This adaptability is further enhanced by the ability of ANNs to optimize control strategies in real time, as demonstrated in various applications ranging from microgrid energy management to voltage stability improvement in power systems [17]. In contrast, PID controllers often struggle with nonlinearity and require extensive tuning to achieve optimal performance, which can be time-consuming and inefficient [18]. Yang et al. highlight that ANN-based controllers significantly enhance the performance of electrified pressure-swing distillation by dynamically adapting to process variations and nonlinear system behaviors. Unlike traditional control methods, ANN controllers can learn complex relationships within the system, enabling precise composition control and reducing energy consumption. This adaptability improves robustness against disturbances and ensures a more stable and efficient separation process [19].
Battery selection also plays a significant role in the operating environment of UPS systems. For example, in data centers and hospitals, where reliability is paramount, factors such as temperature stability, cycle life, and maintenance requirements should be considered when selecting battery technology, according to Ciancetta et al. [
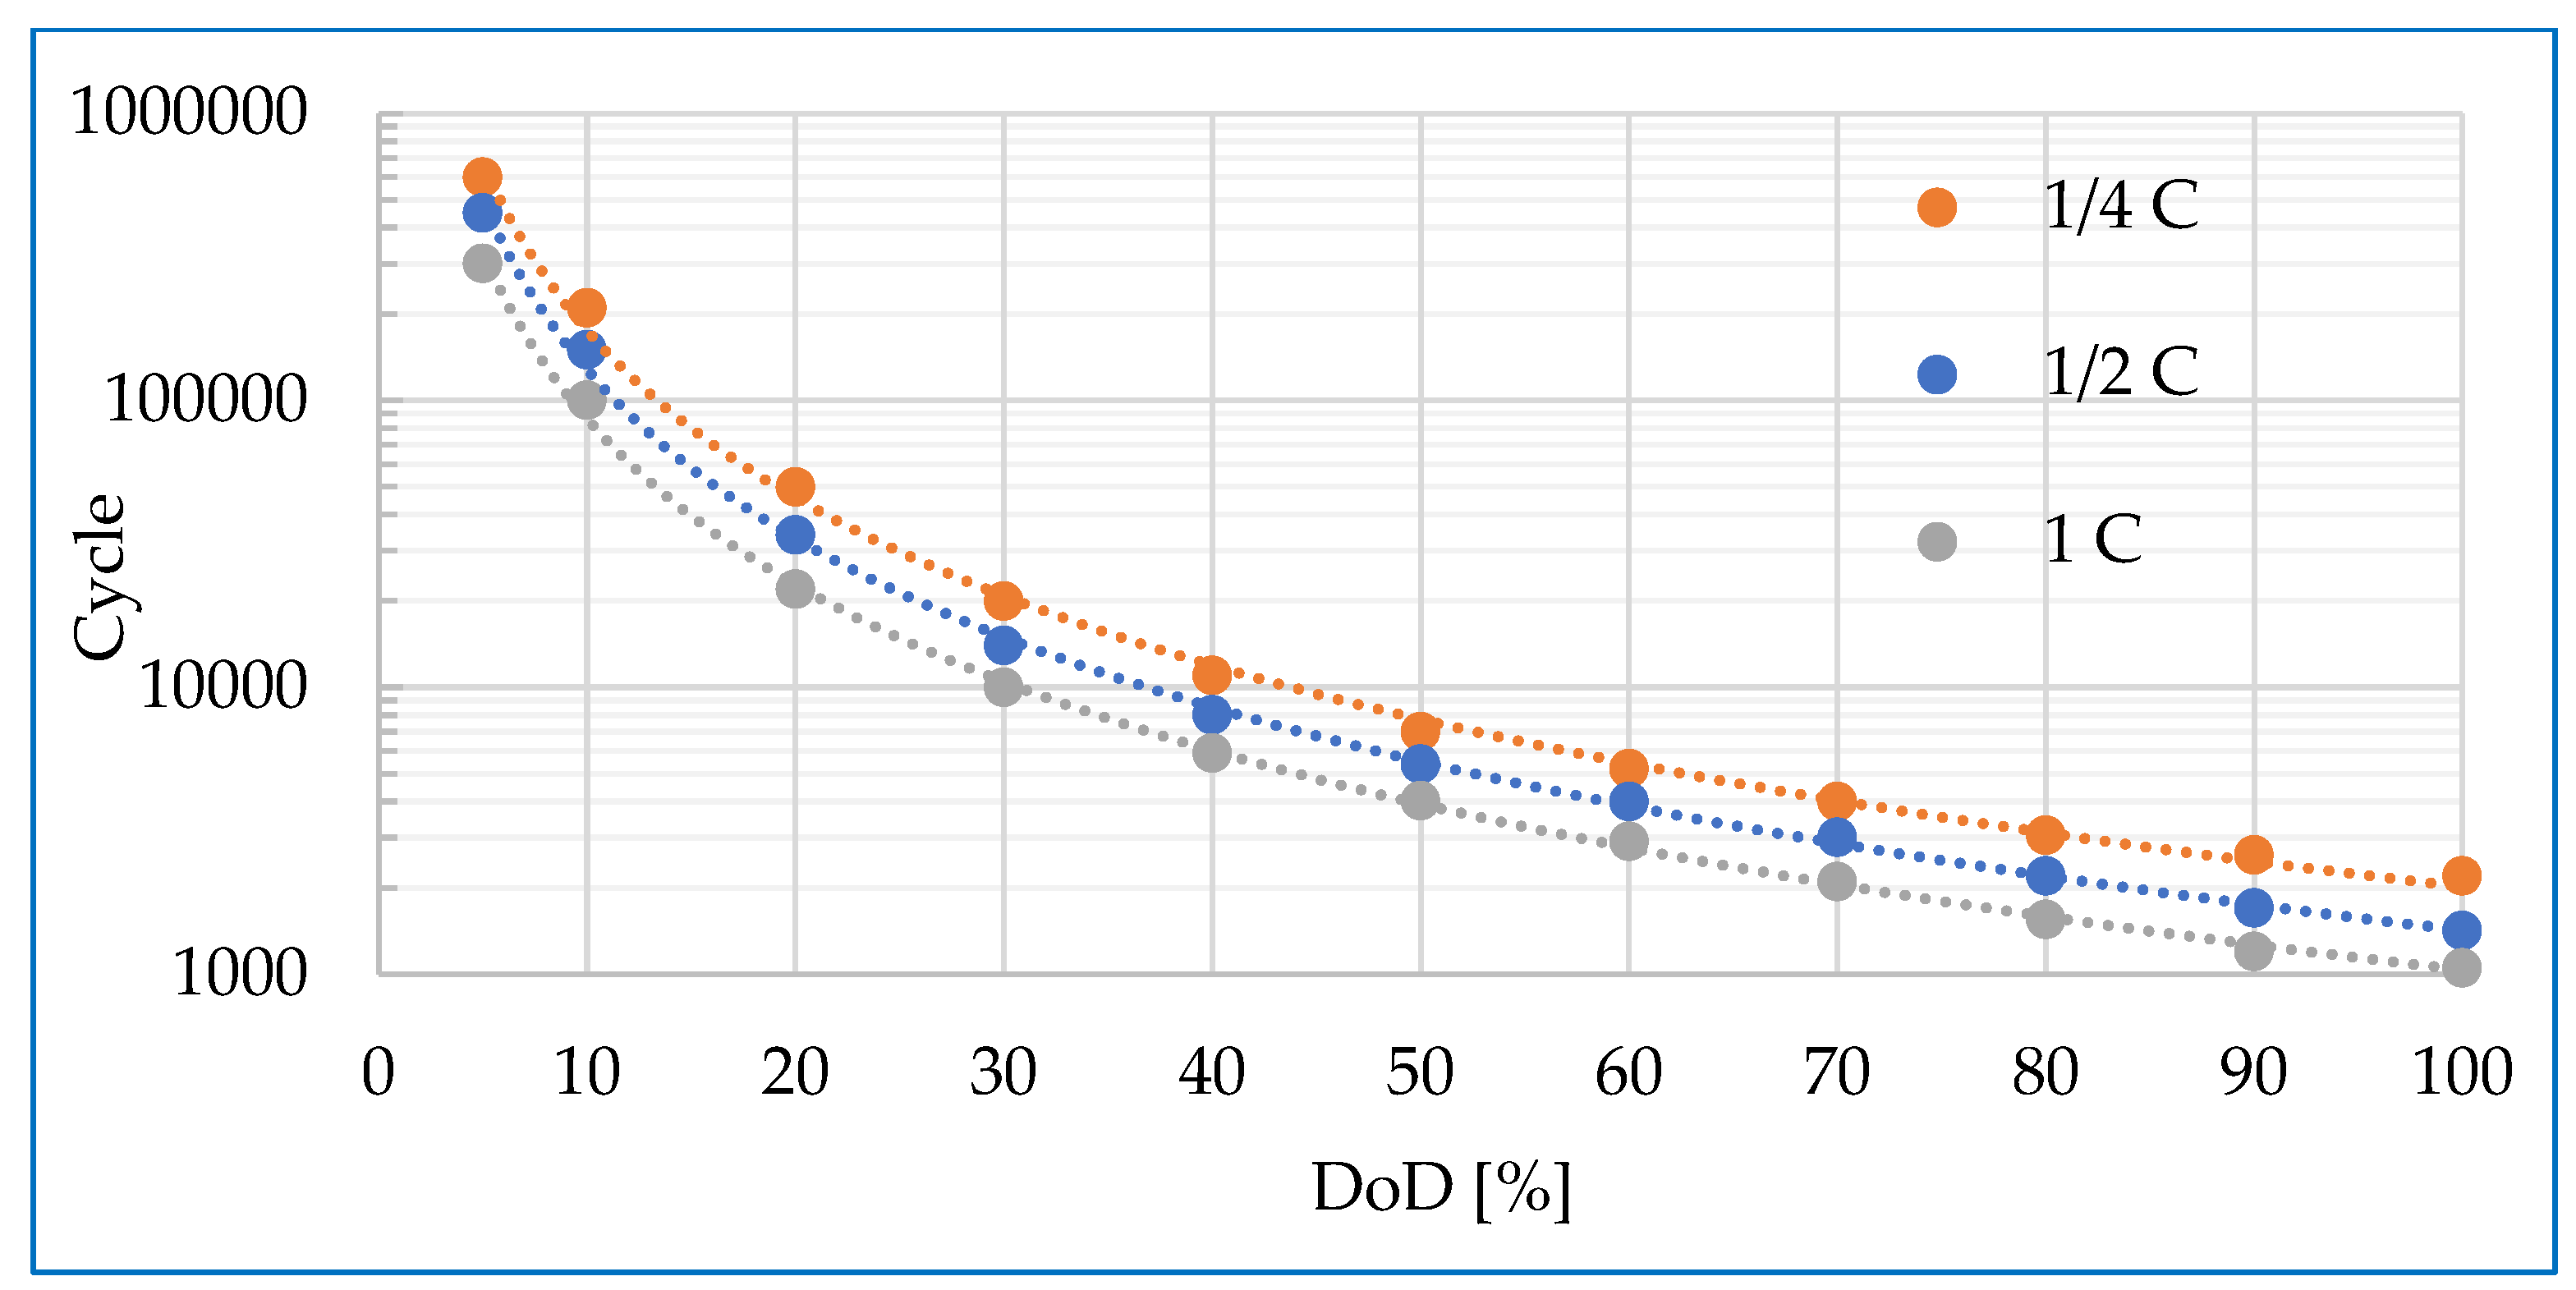
20]. In these critical applications, the use of lithium-ion batteries may be justified despite their higher cost due to their improved performance and lower overall cost in the long term. Understanding the factors that affect battery performance, such as the depth of discharge (DoD), load current, and degradation mechanisms, is essential to optimize battery life and efficiency. The results of several studies shed light on the complex dynamics of the Li-ion battery life cycle, focusing on the interaction between DoD, load current, and degradation processes. The lifetime of Li-ion batteries is significantly affected by the depth of discharge. DoD is the percentage of the battery’s capacity relative to its total capacity. Research shows that deeper discharges generally lead to increased degradation rates as they can cause structural changes in the battery’s electrodes and electrolyte system. For example, deep discharges can lead to the formation of solid electrolyte interphase layers that consume active lithium and contribute to a decrease in capacity over time, according to several research groups [21,22,23].
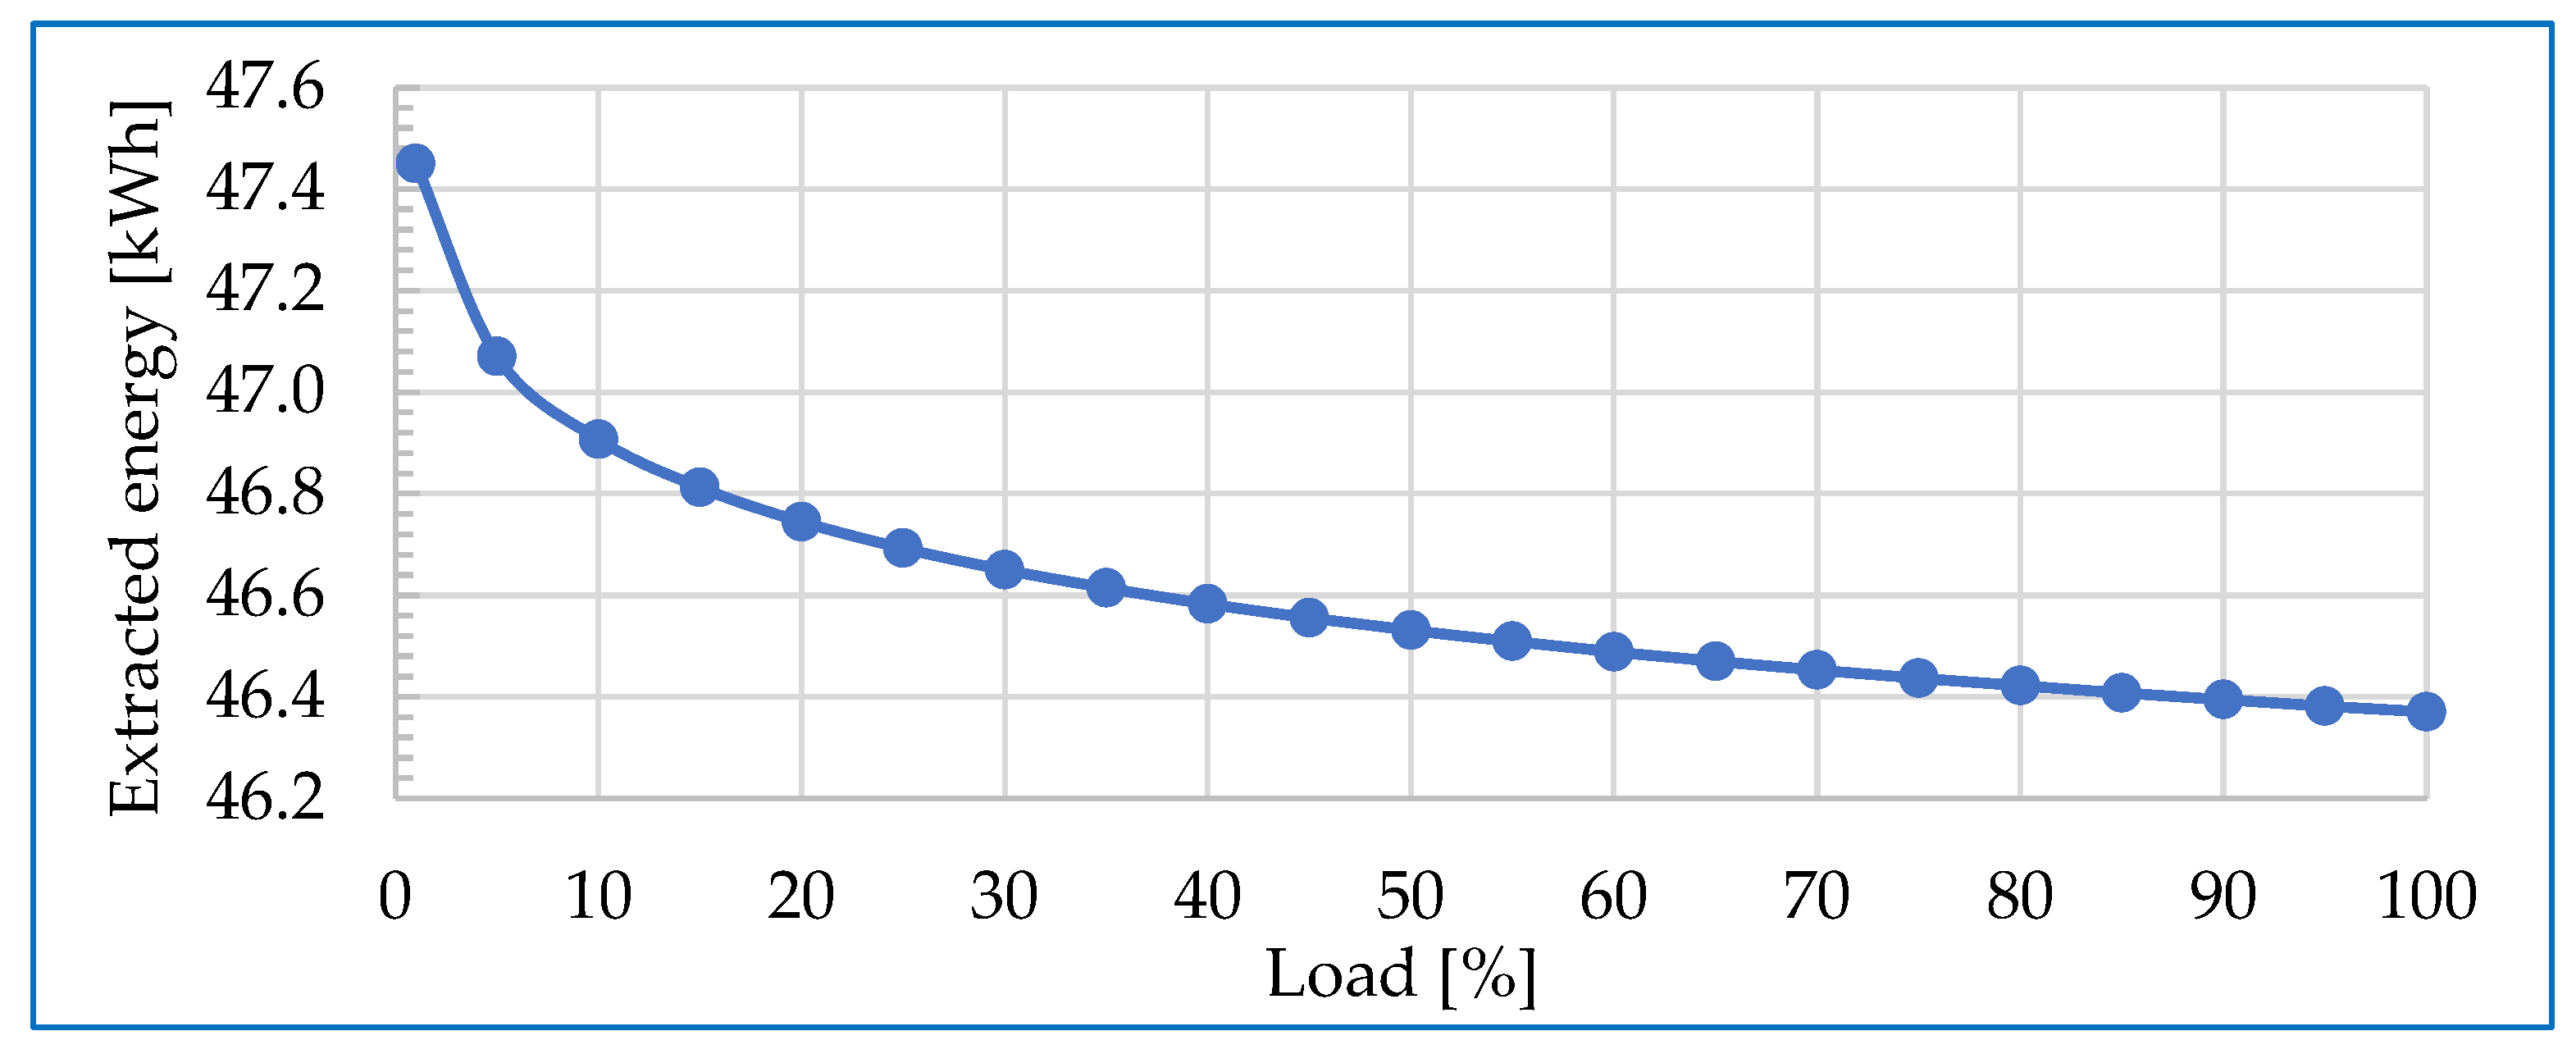
In addition, studies have shown that operating at high DoD can increase internal resistance and reduce overall battery cycle time [21,22,24]. Increased internal resistance causes greater internal heating and reduces the amount of energy that can be extracted, but also accelerates chemical reactions [25,26]. In contrast, lower load currents tend to increase battery life by minimizing thermal stress and allowing more efficient lithium-ion intercalation and deintercalation processes, according to several research groups [27,28,29]. This underlines the importance of optimizing DoD and load current to increase the operational efficiency and lifetime of Li-ion batteries, as these affect degradation mechanisms.
Another major challenge for hybrid UPS systems is the control of multiple power sources by an EMS. The use of energy management in hybrid UPS systems is key to increasing system efficiency and economy. Energy management algorithms allow the system to draw energy from the batteries and the grid in optimal proportions, considering the current production of solar panels, grid energy prices, and changing consumption patterns. These algorithms not only improve the stability and reliability of the system but also result in significant cost savings over long-term operation. Dynamic energy management allows the system to adapt to changing loads and energy sources in real time, while minimizing the cost of energy use. This is particularly important in changing market conditions, where grid energy prices often fluctuate, and solar power generation is also dependent on weather conditions. Long et al. highlight that the integration of different power sources requires sophisticated control systems to manage the fluctuations in power output effectively [30]. Moreover, the management of energy flow within hybrid systems is often hindered by the bidirectional nature of energy transfer. As noted by Zhang et al., the increasing penetration of renewable resources introduces challenges related to randomness in power generation and the need for effective demand response mechanisms [31]. This bidirectionality necessitates advanced EMS capable of real-time monitoring and control to optimize energy distribution and minimize losses [32]. Another significant issue is the optimization of energy management strategies to minimize operational costs while maximizing efficiency.
The economic model for hybrid UPS systems is fundamentally based on the optimization of energy sources and storage solutions. The study by Saidi et al. claims that integrating PV systems with battery storage can significantly reduce energy costs by leveraging renewable energy during peak generation periods while utilizing stored energy during high-demand periods [33]. The Levelized Cost of Energy (LCOE) is a critical metric in EMSs, particularly regarding the economic viability of various energy generation technologies [34]. LCOE represents the per-unit cost (typically in terms of currency per kilowatt-hour) of building and operating a power plant over an assumed financial life and duty cycle. This metric is essential for comparing the cost-effectiveness of different energy sources, including renewables like solar and wind. The integration of LCOE into EMSs allows for a more informed decision-making process regarding energy investments and operational strategies.
It is necessary to be prepared for the possibility that some utilities in the EU will switch from 15 min settlement to minute or even more dynamic billing systems in the future, which will create additional opportunities to optimize energy use. In this case, the ability to consume simultaneously from the grid and from batteries, with the optimal ratio being determined in real time based on an economic model, will become increasingly important. This not only helps to reduce costs, but also increases the flexibility of the system.
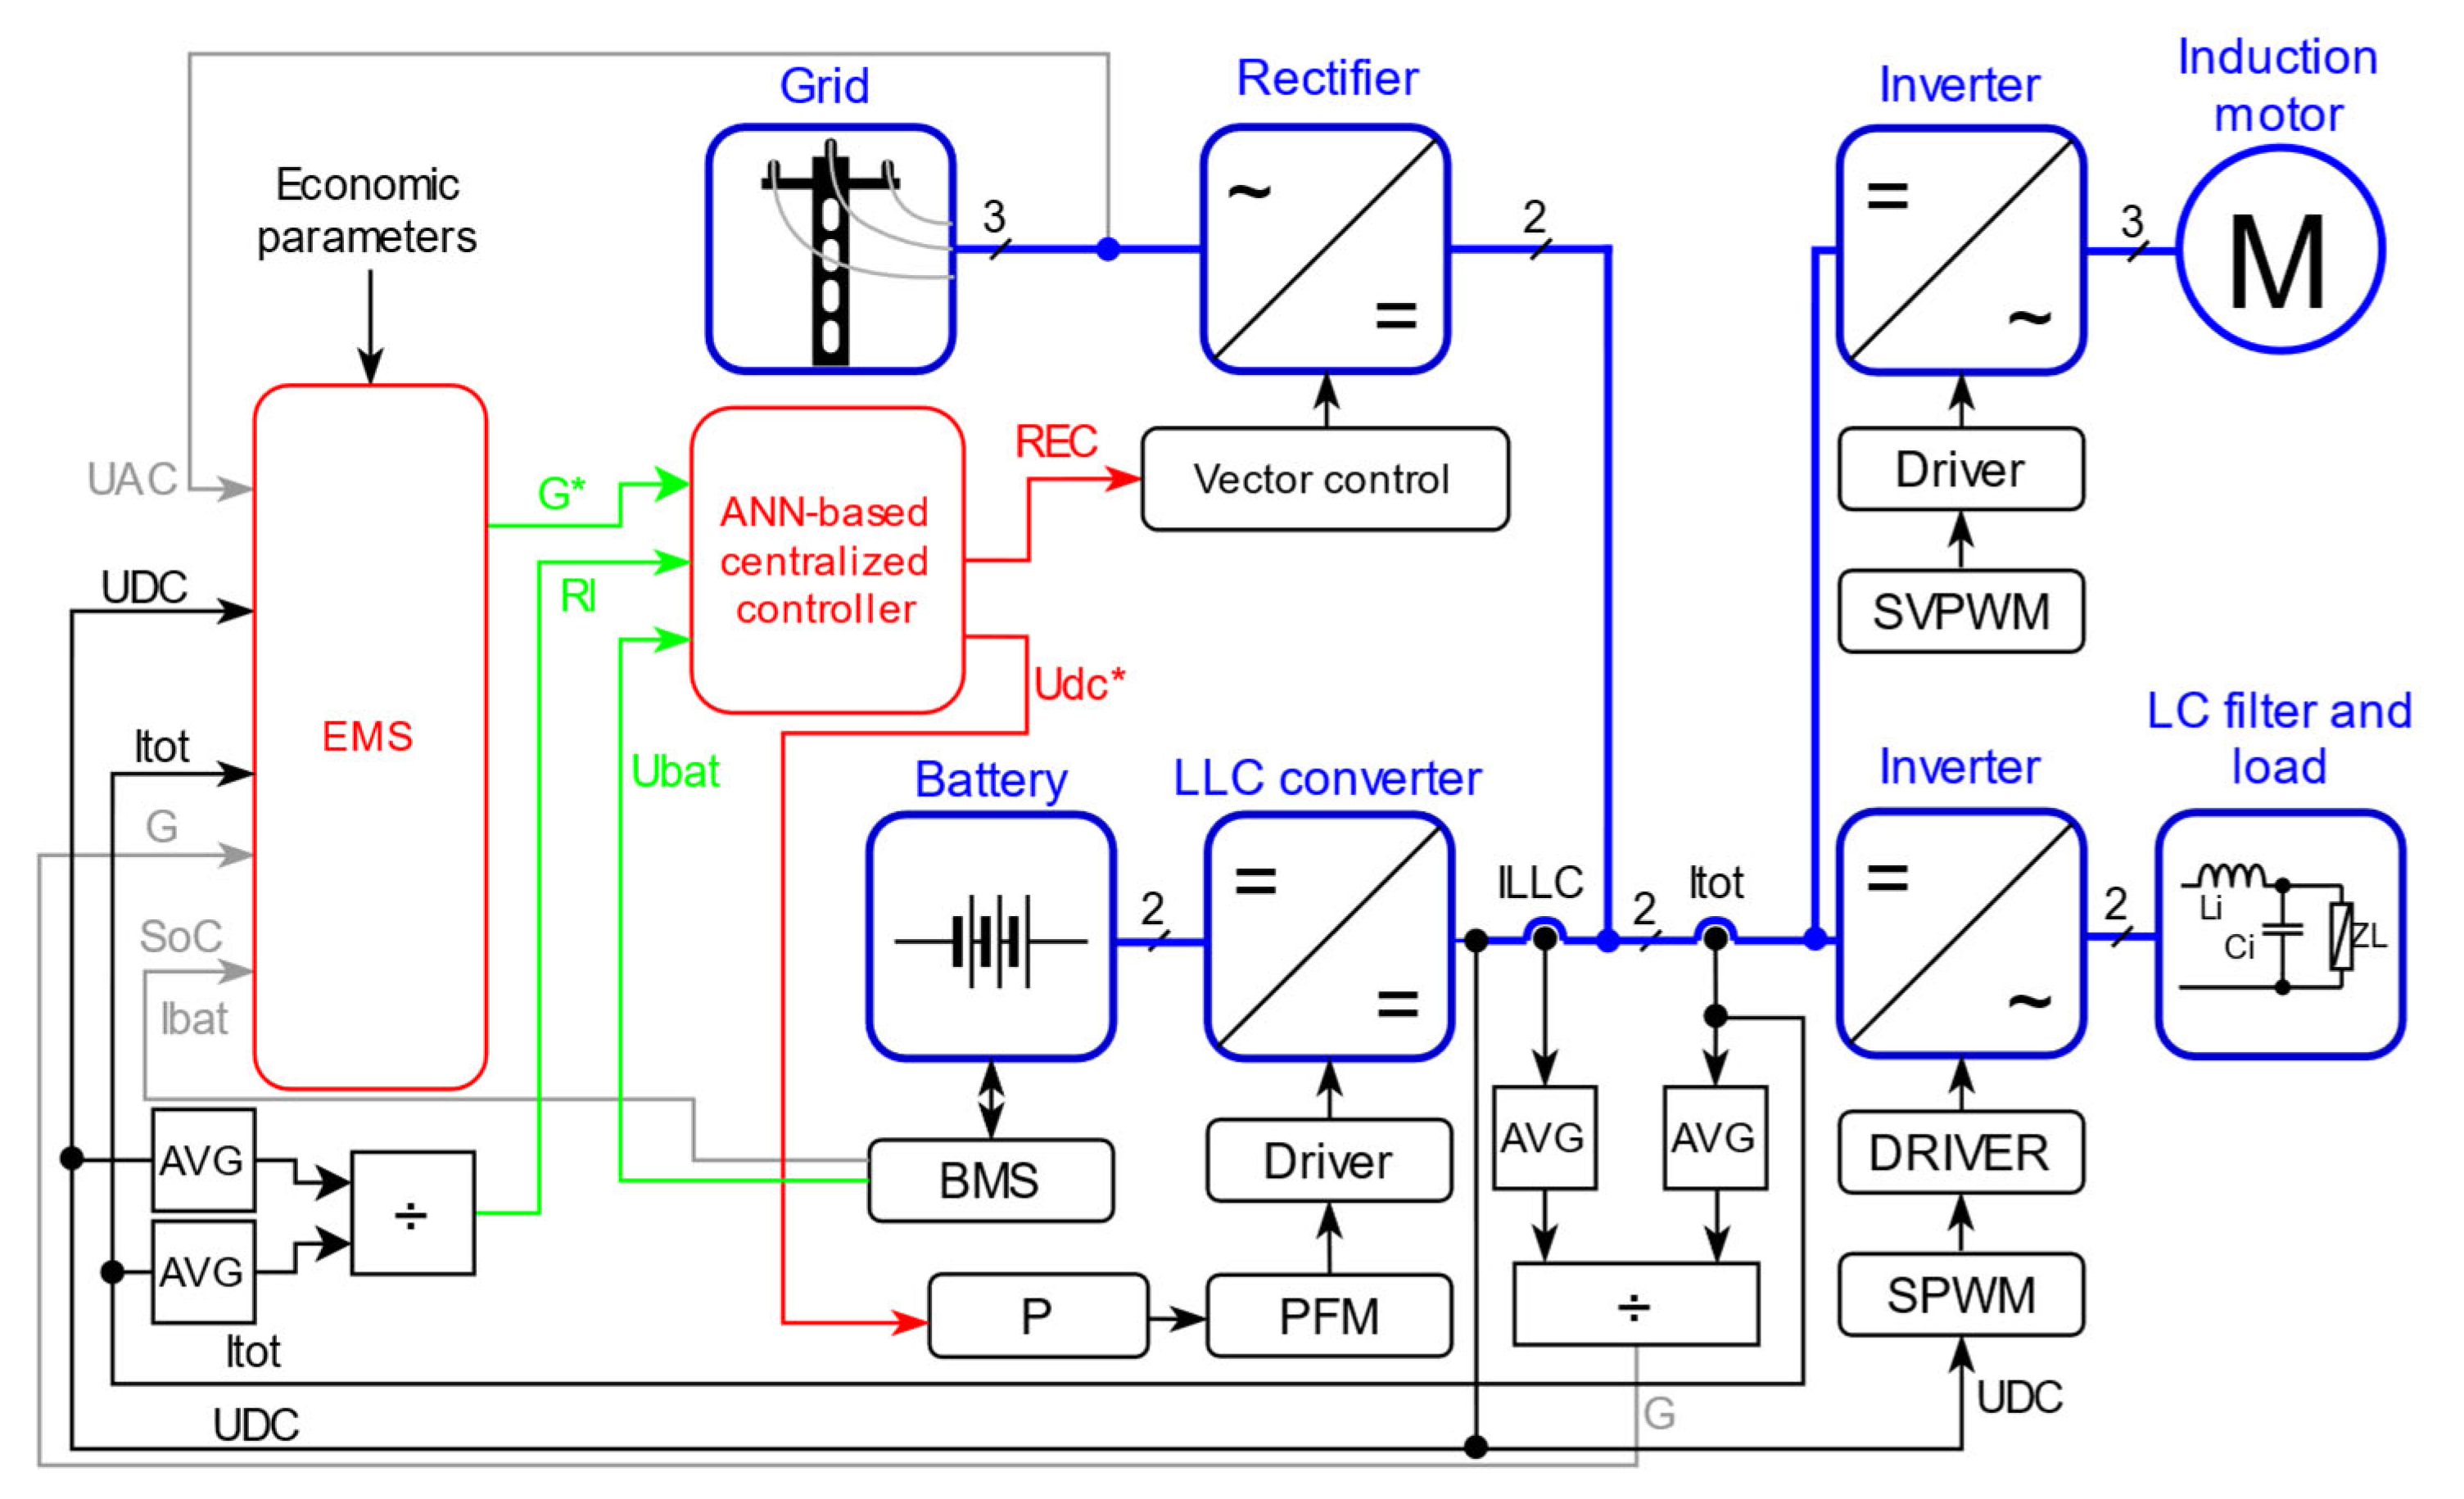
This study proposes an optimized real-time energy management and control strategy for PV-integrated hybrid UPS systems. The EMS determines the optimal power-sharing ratio between battery storage and the grid, considering real-time economic parameters, load demand, and the SoC of the battery. The ANN-based centralized control system ensures the LLC converter and rectifier accurately execute these setpoints, maintaining system stability and efficiency.
Additionally, a dynamic power management scheme is introduced, designed for bypass-free, solar online hybrid UPS systems. This system enhances flexibility by allowing real-time adjustments based on electricity tariffs, renewable generation, and load variations. It ensures a continuous and cost-effective power supply even during grid outages, addressing the limitations of existing EMSs, which often rely on slow and coarse control. By integrating ANN-based control with dynamic power management, this approach enables a more responsive and efficient operation, reducing costs and improving sustainability. Future developments in electricity pricing, such as shorter billing intervals, further emphasize the necessity of advanced energy management strategies.
The remainder of this paper is structured as follows. Section 2 describes the materials and methods, including the ANN-based centralized control strategy, real-time energy management, optimization methodology, and validation methods. 
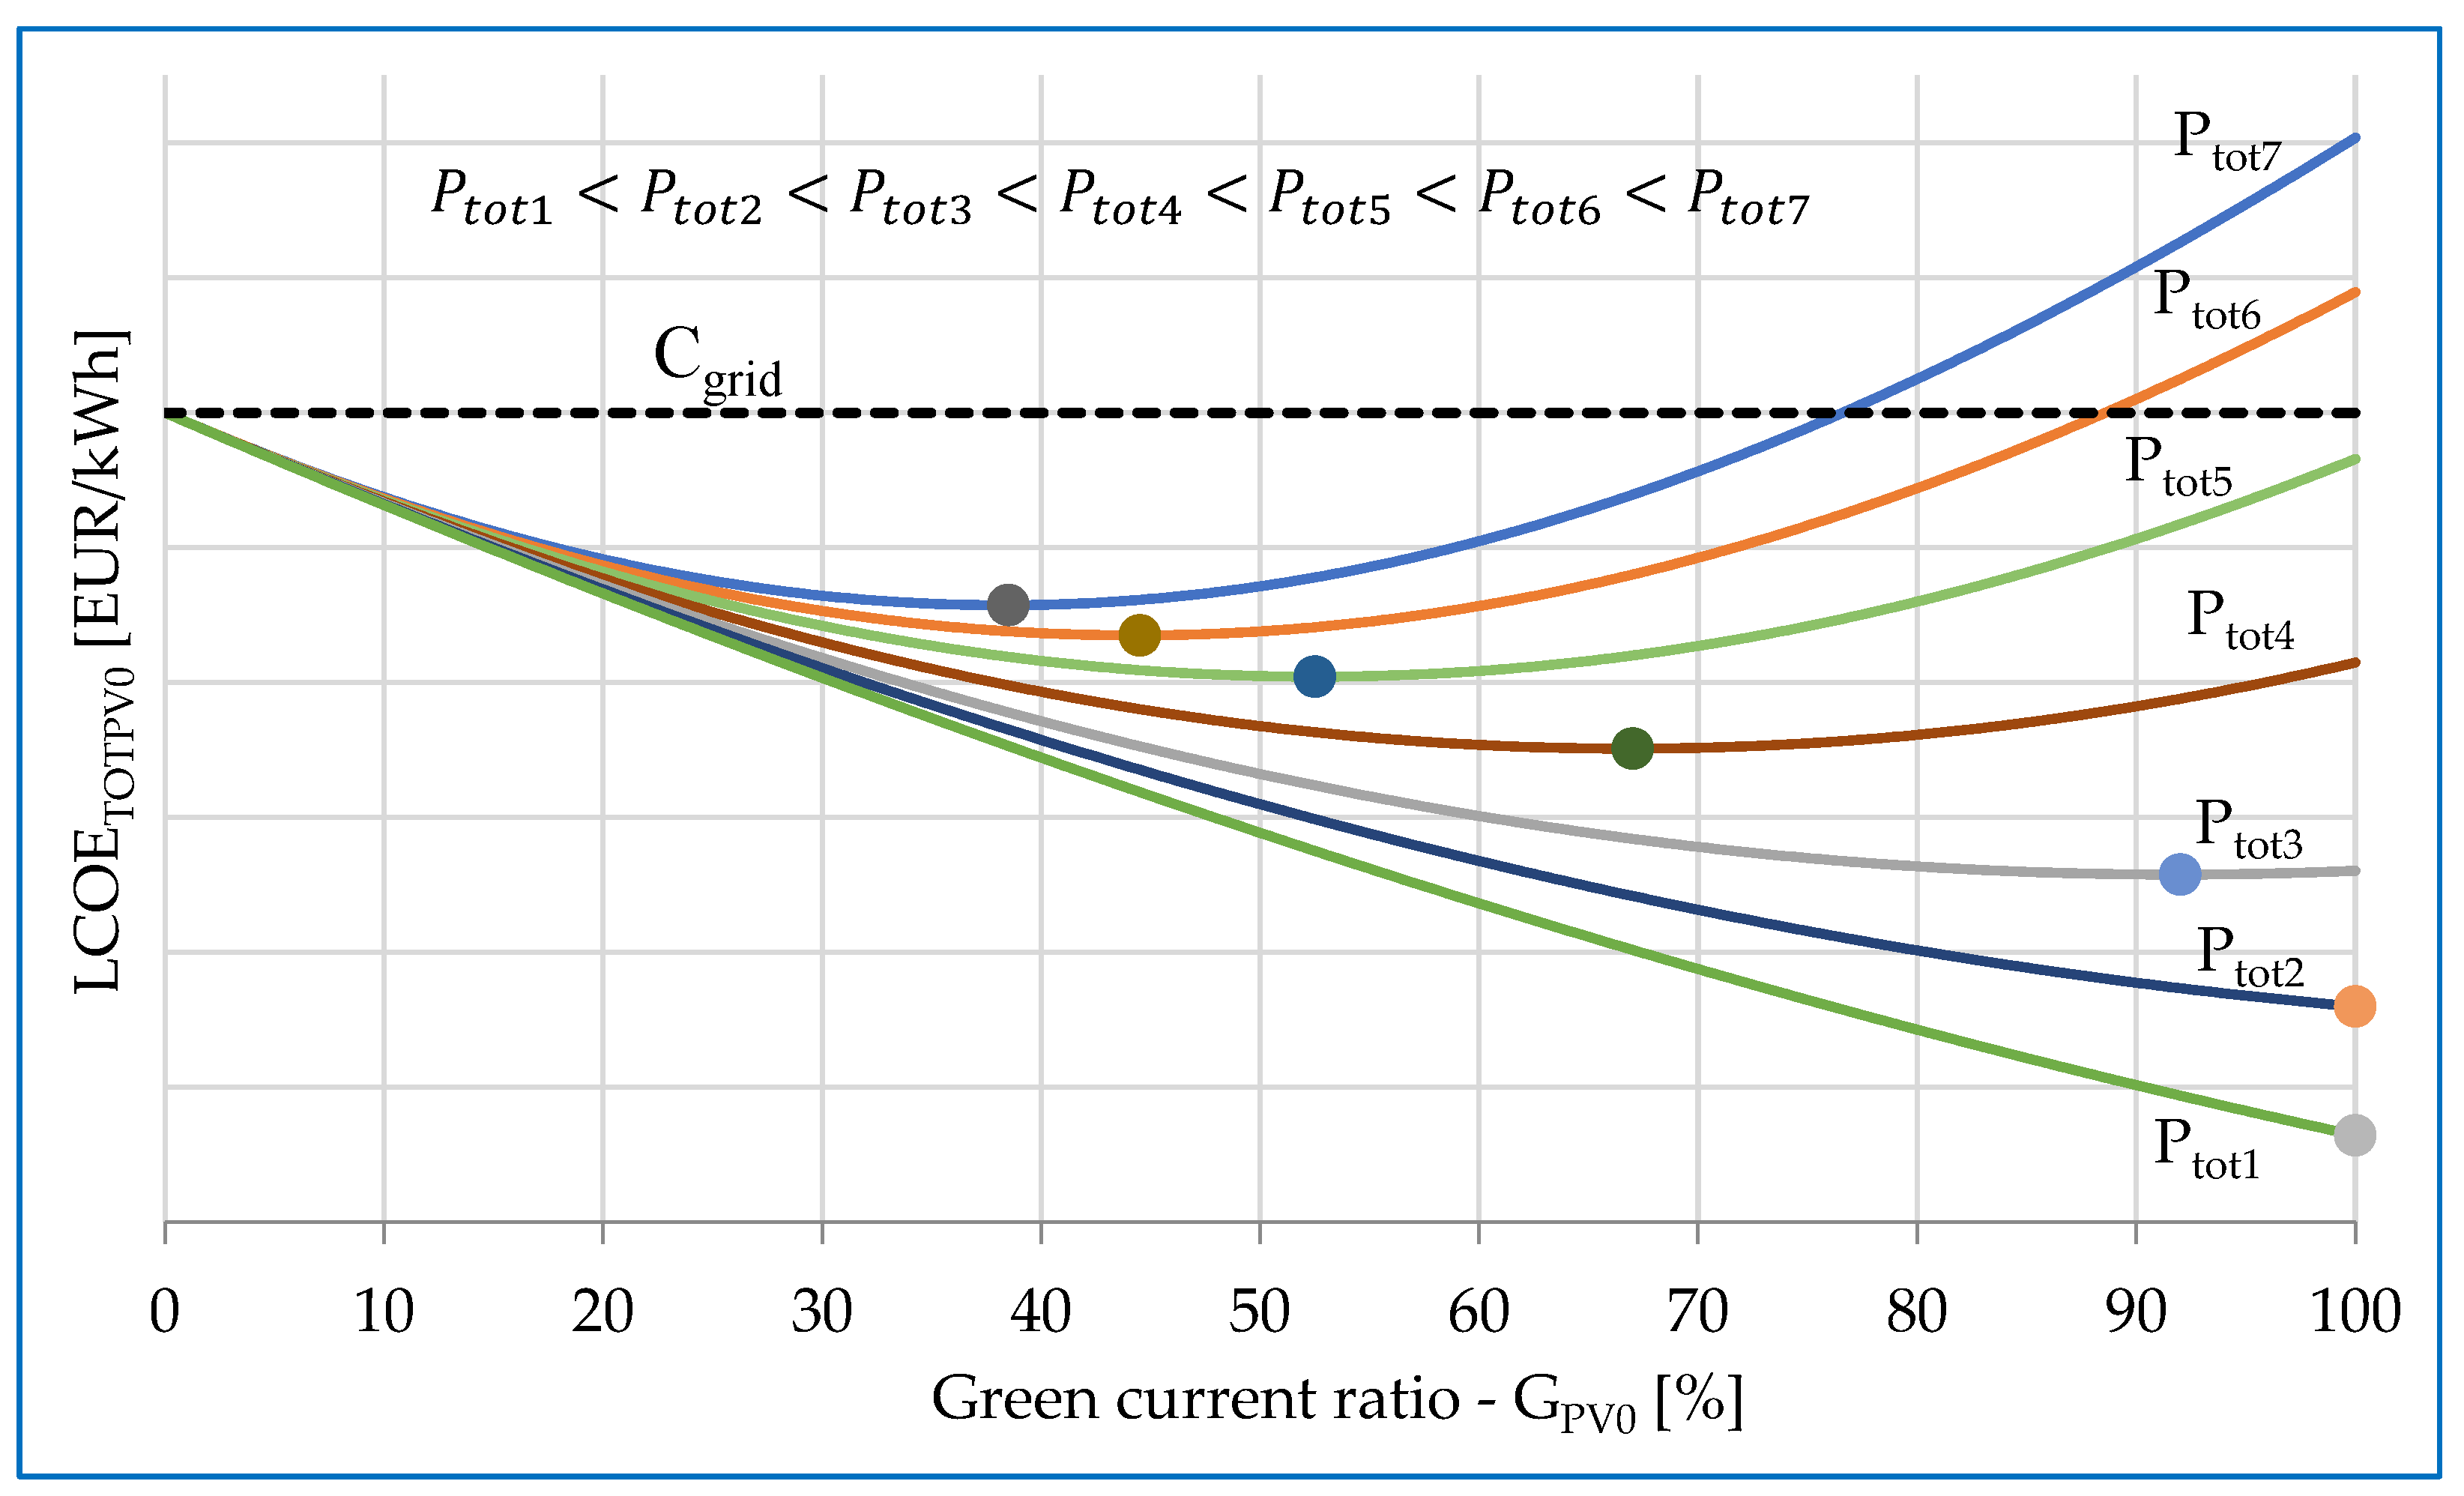
Section 3 presents the results, including simulations of the ANN-based controller, analysis of optimized energy management, and validation of the identification algorithm. It is also shown that the green current ratio (power sharing) should be controlled in real time. Section 4 concludes the paper, summarizing the key findings and outlining potential future research directions.

2. Materials and Methods

This research discusses the ANN-based centralized control, real-time energy management, optimization methodology, and related validation results for the online UPS system shown in Figure 3.
In the system, a grid-connected rectifier and an LLC resonant converter simultaneously feed the DC bus. The LLC converter is a DC/DC voltage boost converter that achieves voltage boosting with excellent efficiency through soft switching. By simultaneously controlling the two converters, the ratio of electricity drawn from the battery and solar panel and from the grid can be adjusted. In this study, this ratio is referred to as the green current ratio. The DC bus feeds the inverter that supplies the loads. The DC bus can also be connected to an inverter designed for motor drives, which acts as a frequency converter. The battery is charged exclusively by the solar panel in the tested arrangement, which makes the system more cost-effective. The LLC converter is not capable of bidirectional power flow but provides galvanic isolation between the grid and the battery.

2.1. Intelligent Dynamical Power Sharing

2.1.1. ANN-Based Centralized Control Strategy

The following subsection describes the control strategy and system topology developed. It presents an automatic system identification algorithm that allows efficient training of an artificial neural network for the control of nonlinear electronic converters. It also discusses simulation methods and layouts for validation. The control strategy can be applied to hybrid UPS systems where the DC bus is fed by SCR rectifiers or active rectifiers with Park vector control in parallel with LLC converters.
The hybrid UPS system and the associated smart control strategy are shown in Figure 4. The main circuit consists of the grid, rectifier, battery, LLC converter, and inverters. In the main circuit, the rectifier and the LLC converter need to be controlled in order to share the power and to stabilize the DC bus voltage. These converters are controlled by an ANN-based unit with inputs of green current base signal (G*), load resistance (Rl) and battery voltage (Ubat). The figure shows an active rectifier, but a thyristor rectifier can also be used, so a firing circuit is required instead of a Park vector controller. In this case, it is not advisable to incorporate a PID controller in the firing circuit, thus simplifying the control strategy. For vector-based control, 4 PI controllers are required.
The G* green current ratio setpoint is generated by an intelligent EMS considering operational (technical) parameters and economic aspects. The operating parameters are the grid voltage (UAC), the DC bus voltage (UDC), the total inverter current (Itot), the actual green current ratio (G), the battery state of charge (SoC), and the battery current (Ibat). Economic parameters include the current tariff (weighted average price) of grid electricity, the LCOE of energy extracted from batteries, and the LCOE of energy extracted from solar panels. The solar panel and the MPPT charge controller (DC/DC converter) are not shown in the figure as they are not part of the control strategy. The battery monitoring management system (BMS) provides feedback on the charging and discharging current (Ibat) of the battery, so there is no need to control and monitor the MPPT charge controller separately. The BMS is also able to provide feedback on the battery state of charge (SoC) and the battery voltage (Ubat). The battery voltage and the charging current can therefore be used to determine the power of the solar panel.
The availability of a sufficient amount and quality of data is a prerequisite for the efficient operation of a neural network. The amount of data required for learning depends on several factors, the most important of which are the complexity of the network, the nature of the learning task, and the variety and redundancy of the data. In general, the performance and accuracy of the network is highly correlated with the size and quality of the data set used for learning. To achieve adequate performance, the data set must reflect the diversity of patterns in the system.
As shown in Figure 4, the neural network performing the control has three inputs and two outputs. For the neural network to set the desired magnitude of the green current ratio and DC bus voltage in the hybrid UPS system, it needs to know the setpoint signals of the local controllers (rectifier and LLC converter controllers) associated with the given battery voltage, DC bus voltage, and load. These setpoint signals are indicated in the figure by the parameter REC for the rectifier and Udc* for the LLC converter.
The data set for training is generated by the algorithm shown in Figure 5. When the algorithm is started, it obtains the desired green current ratio setpoint signal and measures the battery voltage, the green current ratio magnitude, and the load magnitude. It then compares the voltage of the DC bus with the desired value (e.g., 340 V). If not equal, it also tests for equality. If the Udc voltage is greater than 340 V and the green current ratio is greater than the desired value, then we increase the firing angle for a thyristor rectifier. If G is greater than the desired value (G*), then the setpoint signal of the LLC converter is reduced, and so on. The process runs until DC bus voltage and the green current ratio reach the desired value. When this happens, the algorithm saves the setpoints of the converters, the battery voltage, and the load magnitude. The algorithm should be run for multiple battery voltage, load, and green current ratio setpoints to cover all possible values in the system and to include extreme values in the data set.
For an active (vector-controlled) rectifier, minimal modification to the algorithm is required. If Udc < 340 V and G > G*, then an REC parameter increment is required. If Udc > 340 V and G < G*, then an REC parameter decrement is required. The increment and decrement speeds can be set using a ramping method.

2.1.2. Validating the Identification Algorithm with Simulations

The following subsection presents simulation methods for a hybrid UPS system controlled by a neural network. The simulations are designed to monitor how the ANN-based system can keep the power sharing and DC bus voltage stable while dynamically varying the battery voltage, load, and desired green current ratio.
In the identifier operation, the loads are represented by resistors in the circuit, with several resistors and circuit breakers connected in parallel to vary the load. The identifier block varies the setpoints of the rectifier and LLC converter until the desired G and Udc values are established in the system. A system with a thyristor rectifier is shown in Figure 6.
The LLC converter has been extensively analyzed in previous studies [35,36,37]; therefore, it will not be elaborated further in this section. However, its key parameters are presented in Table 1.
The rectifier used in the simulation is a half-controlled thyristor-based design, with its main parameters presented in Table 2 and its internal structure illustrated in Figure 7.
Both the three-phase and single-phase inverters constitute IGBT switching elements, controlled by the SPWM algorithm. The inverters do not include any internal control circuits. Their parameters are presented in Table 3.
A squirrel-cage induction motor is connected to the output of the three-phase inverter, with its parameters listed in Table 4. During the simulation, the motor is subjected to a constant torque load.
An RL load is connected to the output of the one-phase inverter, with a resistance of 230 Ω and an inductance of 4 mH.

2.1.3. Validating the ANN-Based Control Strategy

The training of the neural network can be performed using the results of the system identification. The results obtained must be saved in an Excel spreadsheet. This spreadsheet is imported by MATLAB R2024a during the neural network training process. The optimal number of neurons and the selection of the training method should be determined experimentally through testing on a validation data set. The main power circuit of the system controlled by the neural network trained on the data set generated by the identifier is shown in Figure 8.
Simulink calculates the value of the load resistance using Ohm’s law, based on the linear average of the DC bus voltage and current. The linear average is referenced to 50 Hz. The system also manages power outages, as shown on the left side of the figure. The three-phase circuit breaker can be manually switched off, causing a power outage, leaving the rectifier without supply. Within the rectifier block, a voltage monitor detects the presence of mains voltage. If no mains voltage is detected, the Voltage_on variable returns a value of 0. In this case, the reference signal sent to the local controller of the LLC converter jumps to 359 V, overriding the value received from the neural network.
It should be noted that the LLC converter internal controller only includes a proportional controller, resulting in a significant steady-state error. Therefore, an approximately 359 V reference signal is required to maintain a voltage of around 340 V at rated power.
The results of the identification and simulations are presented in the Results Section, where the ANN training is also described in detail.

2.2. Optimized Real-Time Energy Management

The optimized real-time energy management strategy ensures that loads are powered solely by the battery and solar panels during a grid outage. When grid electricity is available, the system switches to optimization mode and defines the green current ratio setpoint for the control circuit. This study does not focus on the control system, which can be implemented using a conventional PID controller or an intelligent approach based on neural networks and artificial intelligence.
The following sections present the developed methodology and economic model, which facilitate the reduction in LCOE under dynamically changing loads, grid electricity prices, and solar energy generation. The economic model considers the time-invariant input parameters listed in Table 5, which are essential for implementing optimization. This study does not examine the costs of the grid-connected rectifier, as its LCOE has a negligible impact on the overall LCOE.

2.2.1. Battery Life Cycle

To parameterize the model, the life cycle of the battery pack must first be analyzed or approximated by regression based on the manufacturer’s data. As a function of the percentage value of the DoDat different loads, the cycle number (lifetime) of the battery can be calculated. The cycle number is the reduction in the initial capacity to 80% and is a function of the DoD and the load (C). C is the ratio of the discharge current of the battery to its rated capacity. The functions can be approximated by n polynomials for n load curves, described by Equation (1) [38]. In the equation, a and b denote coefficients.
C y c l e n C n , D o D = a n · D o D b n
If the cycle numbers for each load current are known, the capacity reduction per cycle can be determined. The equation gives, for an arbitrary cycle curve, the amount of capacity loss in the battery caused by one cycle of immersion (Equation (2)).
C b a t = 20 C y c l e x %
The actual capacity of the battery depends on the size of the load. The Peukert equation can be used to determine how much actual energy can be drawn from the battery at a given current. The discharge time can be calculated using Equation (3). tdis is the discharge time, Cbat is the battery capacity, Ibat is the discharge current, and k is the Peukert exponent; k is about 1.15 for lead–acid batteries and close to 1 for LiFePO4 batteries.
t d i s = C b a t I b a t k   h
The real capacitance (Creal) is the product of the discharge time and the current drawn:
C r e a l = t d i s · I b a t = C b a t I b a t k · I b a t   Ah
From the real capacity and the nominal voltage of the battery pack (Ubatnom), the energy that can be extracted from the battery in kWh can be determined using Equation (5).
E r e a l = U b a t n o m ·   C r e a l 1000   kWh
It is also necessary to determine the capacity per cycle (Creal/kWh), based on Equation (6).
C r e a l k W h = E r e a l · D o D 100   kWh
The real capacity loss per cycle is the ratio of the previously defined capacity loss per cycle to the capacity per cycle (Equation (7)).
C r e a l = C b a t C r e a l k W h   % kWh
The specific battery life cycle cost of energy (LCOE) (80% capacity reduction), which gives the cost per kWh of energy, can be determined from Equation (8) below.
L C O E b a t = C r e a l 20   · C i n b a t EUR kWh
The previous Equations (2)–(8) can be combined to form Equation (9).
L C O E b a t = 10 5 C y c l e x U b a t n o m · C b a t I b a t k · I b a t · D o D · C i n b a t   EUR kWh
LCOE values calculated for different DoD levels and load currents can be represented graphically as data points, and a polynomial can be fitted to these points. This approach provides a continuous function that allows the estimation of battery LCOE for any given load current at a specific depth of discharge. Based on the relationship between load current and DoD, a bivariate approximation function can be formulated, which determines the battery LCOE for any current level and depth of discharge. In the case of a fourth-degree polynomial, its general form is expressed by the following equation, where c0 to c14 are the coefficients (Equation (10)):
L C O E b a t r e g I b a t , D o D = c 0 + c 1 · I b a t + c 2 · D o D + c 3 · I b a t 2 + c 4 · D o D 2 + c 5 · I b a t · D o D + c 6 · I b a t 3 + c 7 · D o D 3 + c 8 · I b a t 2 · D o D + c 9 · I b a t · D o D 2 + c 10 · I b a t 4 + c 11 · D o D 4 + c 12 · I b a t 3 · D o D + c 13 · I b a t · D o D 3 + c 14 · I b a t 2 · D o D 2   EUR kWh

2.2.2. Battery LCOE, Considering Efficiencies

If the parameters of LCOEbatreg are known, the LCOE can be determined for different loads (Ptot) and green current ratios (GPV0), while the grid electricity tariff (Cgrid) also varies. In the scenario where the solar panel connected to the battery does not generate power (PPV0 = 0), the battery LCOE is given by the following equation, which applies only to the battery.
  L C O E b a t P V 0 = G P V 0 100 · L C O E b a t r e g r e a l P V 0 I b a t r e a l P V 0 , D o D + 1 G P V 0 100 · C g r i d EUR kWh
The LCOEbatregrealPV0 regression must be performed using the previously calculated coefficients c0 to c14. The IbatrealPV0 parameter represents the actual discharge current. Since the efficiency of the LLC converter is not ideal, achieving the desired green current ratio requires more current from the battery than in an ideal scenario. The actual current, IbatrealPV0, is determined by the following equation, where Ubat represents the instantaneous voltage of the battery and Ptot denotes the total power of the DC bus.
I b a t r e a l P V 0 = P t o t · 1000 U b a t · G P V 0 η L L C   A
The efficiency of the LLC converter can be described by an approximate polynomial in the ratio of the load, which has a different shape depending on the converter. Equation (13) shows an example equation describing the efficiency, where f and g are the coefficients:
η L L C = f · 1 e g · P t o t P L · 100   %

2.2.3. Total LCOE, When PPV = 0

So far, LCOEbatPV0 has only been applied to the battery, assuming that charging comes at no cost. However, the battery is charged by the solar panel, which also has its own LCOE that must be considered. Additionally, the DC bus is powered by the LLC converter, which has its own LCOE and operates with non-ideal efficiency.
In order to determine the LCOE of a solar panel, it is necessary to know the annual energy production associated with its geographical location, for a solar panel of 1 kWp. In Hungary, this usually varies within E1year = 1100–1300 kWh, provided that the orientation and tilt angle are ideal, and the solar panel is not contaminated or damaged. The lifetime of a solar panel is given as 25 years. Meanwhile, the efficiency of the solar panel decreases, based on the so-called degradation rate. On average, this value is around 0.5% per year. The amount of electricity delivered over 25 years (E25year) can be determined as described in Equation (14) [39].
E 25 y e a r = y e a r = 0 24 E 1 y e a r · P P V i · 1 d y e a r   kWh
where PPVi is the initial rated capacity of the solar panel in kWp, d is the degradation rate, and E1year is the annual energy production. After 25 years, the solar panel can only deliver 87.5% of its rated output if d = 0.5%. In this context, the amount of electricity controlled by the LLC converter is equivalent to the energy produced by the solar panel.
Thus, the LCOE of the PV system can be calculated according to Equation (15), where ηcharge is the efficiency of the battery charge, which includes the efficiency of the MPPT controller (charge controller):
L C O E P V = C i n P V E 25 y e a r · η c h a r g e   EUR kWh
The LCOE of an LLC converter can be simplified as follows (Equation (16)). The ratio of the investment cost to the amount of electricity delivered during its life cycle gives the LCOE, where the total energy delivered is the product of the lifetime (TLLC) in years and the rated power (PLLC).
L C O E L L C = C i n L L C 365 · 24 · T L L C · P L L C C i n L L C E 25 y e a r   EUR kWh
With the LCOE of the battery, PV system, and LLC converter known, the total LCOE can be calculated for the scenario in which the solar panel output is zero. Thus, Equation (17) provides the cost of the electrical energy extracted from the previously solar-charged battery via the LLC converter.
L C O E t o t P V 0 = G P V 0 100 · L C O E P V + L C O E L L C + L C O E b a t r e g r e a l P V 0 + 1 G P V 0 100 · C g r i d   EUR kWh

2.2.4. Method for Finding the Optimal Green Current Ratio with Genetic Algorithm

It can be observed that LCOEtotPV0 varies significantly as a function of the green current ratio (GPV0). Meanwhile, the value of LCOEbatregrealPV0 is highly dependent on both the load magnitude and the green current ratio. Finding the optimal green current ratio is crucial, as it helps minimize the LCOE of consumed electricity. The LCOE minimum corresponding to each grid electricity cost can be determined using iterative or graphical methods. For different loads, LCOE should be plotted while varying the green current ratio between 0% and 100%. The results are illustrated in Figure 9, which provides an example. The minimum points (global optima) of the curves are also visible in the figure, while the values of Cgrid and DoD remain constant. The dashed line represents the actual grid electricity cost (Cgrid).
The green current ratios corresponding to the lowest LCOE must be identified as a function of load and approximated using a polynomial. Based on this, the optimal green current ratio can be determined for any given load. In some cases, the fitted polynomial exhibits an R2 determination coefficient close to 1, but for different electricity tariffs and DoD values, R2 varies over a wide range. The graphical representation reveals that the polynomial exhibits oscillatory behavior, causing the selected optimal GOPTPV0 green current ratios to deviate from the ideal values. Additionally, significant approximation errors occur at the breakpoints of the computed values. Therefore, an optimization approach is required to address the variability arising from different grid tariffs and DoD values. Since conventional algorithms often fail to find the global optimum in these cases, and approximation errors lead to significant distortions, a more effective and flexible method is necessary.
The genetic algorithm was chosen because it efficiently solves optimization problems where the search space is large, complex, and contains multiple local optima. Conventional algorithms, such as gradient-based methods, tend to become stuck in local optima, whereas the genetic algorithm, with its population-based approach and stochastic elements, can explore a broader search space and identify the global optimum.
As a metaheuristic algorithm, the genetic algorithm does not require an exact mathematical formulation of the problem but instead provides a general solution strategy. This flexibility is particularly valuable for nonlinear, discrete, and multidimensional problems. Furthermore, the genetic algorithm processes multiple solutions (a population) in parallel, enabling faster convergence toward the optimal solution.
Another advantage of using the genetic algorithm is its speed, as it does not require evaluating all possible solutions. Instead, it generates candidate solutions (individuals) randomly and refines them over multiple generations. Consequently, rather than exhaustively computing every possibility, the genetic algorithm rapidly converges toward the optimal solution through selection, crossover, and mutation.

2.2.5. Total LCOE, When PPV > 0

So far, the calculation of LCOEs has assumed that the solar panel is not currently producing electricity (PPV = 0). Given the current power of the solar panel, the optimal green current ratio is expressed implicitly as follows (Equation (18)):
G P V = 100   · P P V + P b a t P V 0 P t o t ,   i f   G P V 100 100 ,     i f   G P V > 100   %
The GPV optimal green current ratio already considers the current power of the solar panel. The ratio depends on the GPV0 optimized value previously determined by the genetic algorithm. The PbatPV0 is the battery power without solar generation (PPV = 0), expressed by Equation (19).
P b a t P V 0 = P t o t P g r i d P V 0   kW
PgridPV0 is the grid power if the solar panel is not producing energy (PPV = 0). Then, the grid power without instantaneous PV production can be written up using Equation (20).
P g r i d P V 0 = P t o t G P V 0 100 · P t o t   kW
The battery performance without a solar panel based on the optimized green current ratio is as follows (Equation (21)):
P b a t P V 0 = P t o t · G P V 0 100   kW
If the solar panel is also producing electricity PPV > 0, then the cost calculated by LCOEbatreg regression should be applied to the current IbatrealPV instead of IbatrealPV0, where IbatrealPV is the actual current drawn from the battery when the solar panel is also producing electricity (Equation (22)).
I b a t r e a l P V = 100   · I r e q u i r e d η L L C ,   i f   I r e a l P V 0 I r e q u i r e d ,             i f   I r e a l P V < 0   A
Based on the already-known approximate polynomial, the efficiency of the LLC converter is given by Equation (23), where the power factor is the product of the load relative to the rated power and the optimal green current ratio.
η L L C = f · 1 e g · P t o t P L · G P V   %
The battery current required by the optimization can therefore be written according to Equation (24).
I r e q u i r e d = 1000   ·   P b a t P V U b a t   A
The power output of the battery is the difference between the total load and the power drawn from the grid and the current output of the solar panel (Equation (25)).
P b a t P V = P t o t P g r i d P P V   k W
The amount of power drawn from the grid in this case (Equation (26)):
P g r i d = 0 , i f   P P V P g r i d P V 0 P t o t P P V P b a t P V 0 , i f   P P V < P g r i d P V 0   kW
The total LCOE, if the solar panel is also producing energy (PPV > 0), can be expressed in the form of Equation (27).
L C O E t o t P V = G P V 100 · L C O E P V + L C O E L L C + L C O E b a t r e g r e a l P V + 100 G P V 100 · C g r i d   EUR kWh
If the solar panel is charging the battery, IrealPV is negative; then, the LCOE is as follows (Equation (28)):
L C O E t o t P V = L C O E P V + L C O E L L C   EUR kWh ,     i f   I b a t r e a l P V < 0
If no load is switched on, the LCOE is zero (Equation (29)).
L C O E t o t P V = 0   EUR kWh ,     i f   P t o t = 0
There may be several occasions in a day when the grid energy tariff is negative. The energy supplier then pays consumers to buy electricity from the grid. In such a case, it is not practical to extract electricity from the battery, so the following condition must be true (Equation (30)).
G P V = 0 , i f   C g r i d 0 100   · P P V + P b a t P V 0 P t o t , i f   C g r i d > 0   %

3. Results

3.1. ANN-Based Centralized Controller Simulations

The following section presents the results of the identification process, neural network training, and parametric sensitivity analyses.

3.1.1. System Identification and Generating Training Data

The first simulation performs the identification of the hybrid UPS system. The input parameters used in the simulation were the following values:
  • Loads (RL): 290 Ω, 467 Ω, 645 Ω, 1000 Ω;
  • Battery voltages (Ubat): 25 V, 30 V, 36 V, 40 V;
  • Green current ratios (G*): 5%, 10%, 20%, 30%, 40%, 50%, 60%, 70%, 80%, 90%, 95%.
When the battery voltage was set to 30 V, only one identification cycle was run with a 290 Ω load at a 50% green current ratio setpoint. Furthermore, at 467 Ω load and 40 V battery voltage, the values corresponding to 5% and 10% green current ratio were missing because the green current ratio was not feasible. Similarly, for a 290 Ω load at 40 V battery voltage, the values for 5% green current ratio are missing.
Thus, a total of 129 cycles were generated. The result of a cycle contains the setpoint signal values (REC, UDC*) for load, battery voltage, and green current ratio, i.e., the output values. If the desired green current ratio is less than 5%, the LLC converter must be switched off. However, above a setpoint of 95% green current ratio, the rectifier should be switched off, thus reducing losses and providing more accurate control.
The result of the identification is illustrated in Figure 10, where the required setpoints for the LLC converter are plotted for different green current ratios, loads, and battery voltages.
The resulting rectifier firing angles are shown in Figure 11. The simulation shows that the change in battery voltage has a negligible effect on the required firing angle. Therefore, the results of all 129 cycles are not plotted as in the case of the LLC converter.

3.1.2. Neural Network Training

The feed-forward neural network was trained based on the results of identification simulation using the Levenberg–Marquardt method. For training, the number of training cycles (epochs), the desired performance (minimum allowed error), and the maximum number of validation errors during training are declared. These values are shown in Table 6. Also, default values can be observed: gradient and Mu adaptive values. After training is completed, the values obtained can also be observed in the table (final values).
Figure 12 shows the MSE, gradient, Mu, and validation failure during the training epochs. The results show that the neural network shows good convergence. The performance can be further improved by increasing the number of hidden neurons, but then over-learning occurs. The optimal number of hidden neurons is nine for 129 identification cycles with three input layers and two output layers.

3.1.3. Green Current Ratio Ramping

The result of the second simulation is shown in Figure 13. The aim is to show how the ramping of the green current ratio (0–100%) affects the actual green current ratio and the voltage of the DC bus, while keeping the load and battery voltage constant. By ramping the green current ratio setpoint, the actual value follows the setpoint with minimal error, while the DC bus voltage also changes minimally. The resulting errors in voltage and green current ratio occur because both the identification and the training contain errors.

3.1.4. Dynamic Change in Battery Voltage

The third simulation aims to show how a dynamic change in battery voltage causes perturbations in the actual green current ratio and the DC bus voltage while the load is constant. The result is shown in Figure 14. It can be seen that the dynamic variation in the battery voltage disturbs the DC bus voltage and the green current ratio negligibly.

3.1.5. Dynamic Change in Load and Battery Voltage

The next simulation aims to show how the actual green current ratio and DC bus voltage change as the load and battery voltage are varied. Figure 15 shows the fourth simulation result where both load and battery voltage are dynamically changed. As the load is increased, it can be seen that the resistance value decreases with a finite slope; this is due to the linear averaging algorithm which averages over 50 Hz. The use of this is key, as it reduces oscillations during controlling, but causes a short-term overshoot in the actual value of the green current ratio. It also causes an error in controller P of the LLC converter.

3.1.6. Dynamic Change in Green Current Ratio Setpoint

The fifth simulation investigates the effect of dynamic (non-ramped) green current ratio changes on the system, and the effect of simultaneous changes in all input parameters on the voltage variation in the DC bus. The aim of the study is to detect the disturbances generated as each input parameter is varied. As shown in Figure 16, negligible DC bus voltage variation is observed.

3.1.7. Power Outage and Recovery

The sixth simulation shows how the voltage and current of the DC bus and the mechanical power of the motor change when the power is interrupted and the grid is restored, while the load and battery voltage remain constant. The results are shown in Figure 17. It can be noticed that the most critical operating conditions occur during power failure and grid recovery. When a blackout occurs, the green current ratio consequently takes on a value of 100% because only the LLC converter supplies the consumers. The DC bus voltage then rises slightly and, when the grid voltage is restored, returns to its original stable state. During these two events, there is minimal disturbance in the voltage of the DC bus and hence in the current. There is no change in the mechanical performance of the motor.

3.2. Optimized Real-Time Energy Management

The following section presents the validation of the optimization, along with the generated reports and results, which demonstrate that adjusting the green energy ratio significantly reduces the LCOE of the energy consumed.

3.2.1. Implementing a Genetic Algorithm

The optimization using a genetic algorithm was implemented in MATLAB. In the developed economic model, the fitness function is represented by Equation (17), which serves as the essential objective function for the genetic algorithm. A software tool was created that simultaneously varies three parameters: grid electricity price (Cgrid), optimal green energy ratio when solar generation is zero (GPV0), and total load (Ptot). The software also incorporates the equations from the economic model, allowing it to calculate values such as the actual battery current while accounting for efficiency factors.
Initially, the software calculates the battery’s LCOE based on its parameters, considering depth of discharge and load current. This serves as an input for the genetic algorithm. The battery’s LCOE can be approximated using regression, with the regression coefficients also computed by the software.
The genetic algorithm does not run only once in the program. By iterating over different values of total load (from 0 to PL) and grid electricity cost (from 0 to 0.5 EUR/kWh), the software determines the optimal green energy ratio for each parameter set and stores the results in a matrix. Simultaneously, another matrix stores the corresponding minimized total LCOE for each green energy ratio. The results of the optimization process are saved in an Excel file.
It can be observed that setting excessively small step sizes for total consumption and grid electricity cost significantly increases the program’s execution time. The remaining parts of the software perform interpolation based on the matrices and generate graphical reports. The parameters of the genetic algorithm were set as follows, as summarized in Table 7.
Increasing the population size indefinitely does not improve the optimization result. Therefore, it makes sense to increase the population size until the results do not change, and this will allow the optimization to be performed faster as new input parameters change. The selection methods were also executed, including roulette wheel, ranking, stochastic universal sampling, and tournament selection. The resulting matrices showed no significant differences; however, the execution time of the program varied, particularly when the population size was larger.

3.2.2. Demonstrations with Example Hybrid UPS System

The following subsection describes optimization and demonstration for an example hybrid UPS system. The parameters of the static system are given in Table 8. The values aim to reflect reality and are presented in the table based on market research and the average of prices observed in various catalogs.
The lifetime of a LiFePO4 battery is known as a function of DoD and load current, as shown in Figure 18. Polynomials fitted to known data points are also observed in the figure.
Knowing the Peukert exponent of the battery, the actual energy that can be extracted depends on the load, as shown in Figure 19.
The LCOE of the battery can then be calculated based on the immersion depth and the load, as illustrated in Figure 20.
The known LCOEs can only be determined for three loads, as the battery life is characterized by three curves. Knowing these curves is the result of long measurements, so it is not practical to include many curves, nor do manufacturers guarantee a large amount of data. From the known unit cost data, the LCOE can be determined by regression for any given load flow at different DoD (Figure 21).
A bivariate approximation function can be fitted to these curves to determine the LCOE of the battery as a function of immersion depth and current. The result is shown in Figure 22.
It is necessary to know the efficiency of the LLC converter as a function of load. The known efficiency curve is illustrated in Figure 23. The curve can be approximated by the previously presented polynomial (based on Equation (23)), which in this case has coefficients f = 92.2935 and g = 0.0581.
It is then possible to run the genetic algorithm. All the parameters are known, where the dynamic variables Ptot and Cgrid are in addition to the static coefficients f and g; battery nominal voltage (Ubat), solar cell LCOE (LCOEPV), LLC converter LCOE (LCOELLC), DoD, and system nominal load power (PL) are also defined. It is important that the DoD is fixed at the time of optimization.
Initially, the genetic algorithm was run at a DoD of 70%, where the grid electricity tariff energy and load varied. The results obtained (Figure 24) are the optimal current ratios (GPV0) when the solar panel is not generating electricity.
The minimum cost matrix is illustrated in Figure 25, which shows the minimum cost as a function of load and grid electricity tariff (DoD = 70%).
The values of the optimal green current ratio matrix are shown in Figure 26 (DoD = 70%).
See Figure 27 for further data reports where the grid electricity tariff and DoD also vary. The total system LCOE (a), (c), (e), (g), and the optimal green current ratio (b), (d), (f), (h) for different PV generations can be observed as well. It can be concluded that a lower electricity tariff makes it more economical to draw less power from the battery. Additionally, higher solar generation reduces the LCOE of electricity consumed.
Figure 28 illustrates the running of the genetic algorithm on some data. The figures on the left show both the optima found by the GA and the global optima. And on the right, the fitness value that varies over generations is shown. The results show that GA shows good convergence and finds the global optimum for each input.

4. Discussion and Conclusions

Overall, the simulation results confirm that the intelligence of the neural network can effectively implement dynamic power sharing in the hybrid solar UPS system. At the same time, it ensures a constant voltage in the DC bus, enabling uninterrupted operation of the consumers regardless of changes in input parameters. The neural network functions reliably even with unknown input values, further validating the correctness of the training method and the identifier’s operation. The centralized control topology implemented with the neural network enables robust regulation among distributed power sources, eliminating the need for complex tuning procedures during system deployment. The identification process runs automatically, leaving the engineer responsible only for training the neural network based on the available data.
It is crucial to tune the local P controller of the LLC converter before running the identification algorithm so that, at 100% green energy ratio, it can stably supply the consumers under varying input conditions, such as different battery voltage levels and load magnitudes. Once identification begins, further tuning of the controller is not possible. The nominal power of the LLC converter must be designed to ensure that, even at 100% green energy ratio, it can supply the total power demand of the consumers connected to the DC bus.
Regulating the green energy ratio at low loads presents a challenge. For this reason, both identification and neural network training were conducted up to a 1 kΩ load. The accuracy of current sensors and measurement noise are particularly critical factors, as the signal-to-noise ratio (SNR) deteriorates at low currents, potentially leading to instability in the control algorithm. Additionally, from an economic perspective, operating both converters simultaneously at low loads is not beneficial, as demonstrated in the next chapter. The system examined in the simulations includes a small squirrel-cage induction motor and a low-power single-phase load. In practical applications, control is typically required for consumers with significantly higher power ratings.
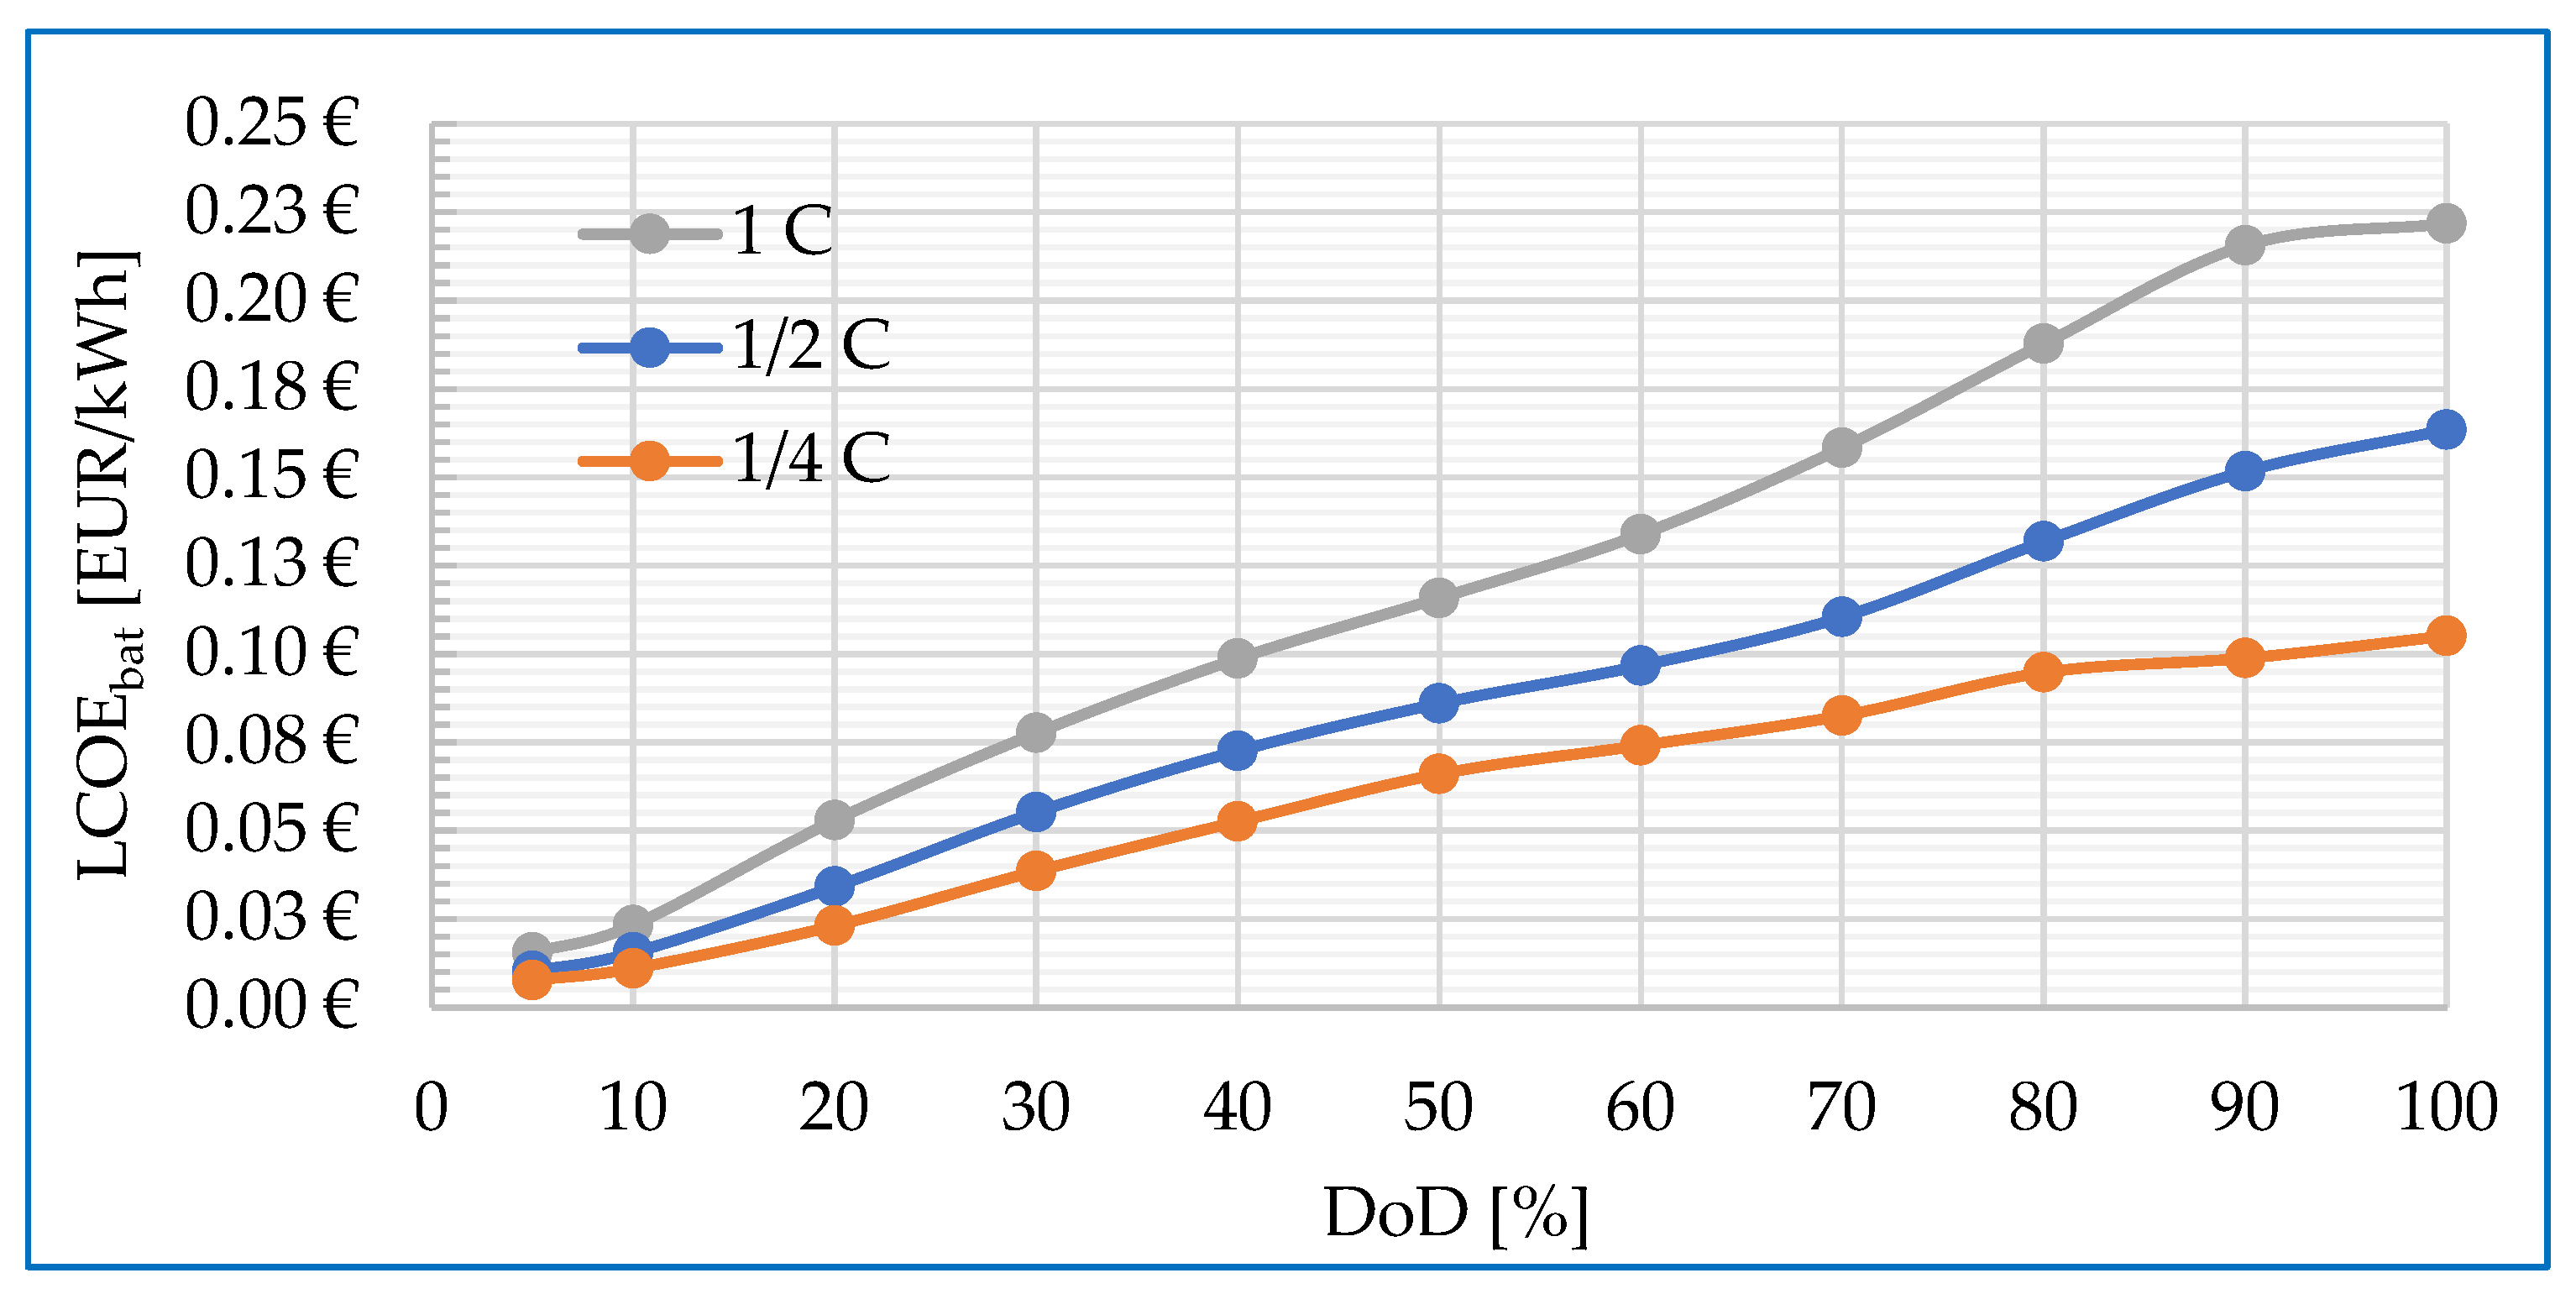
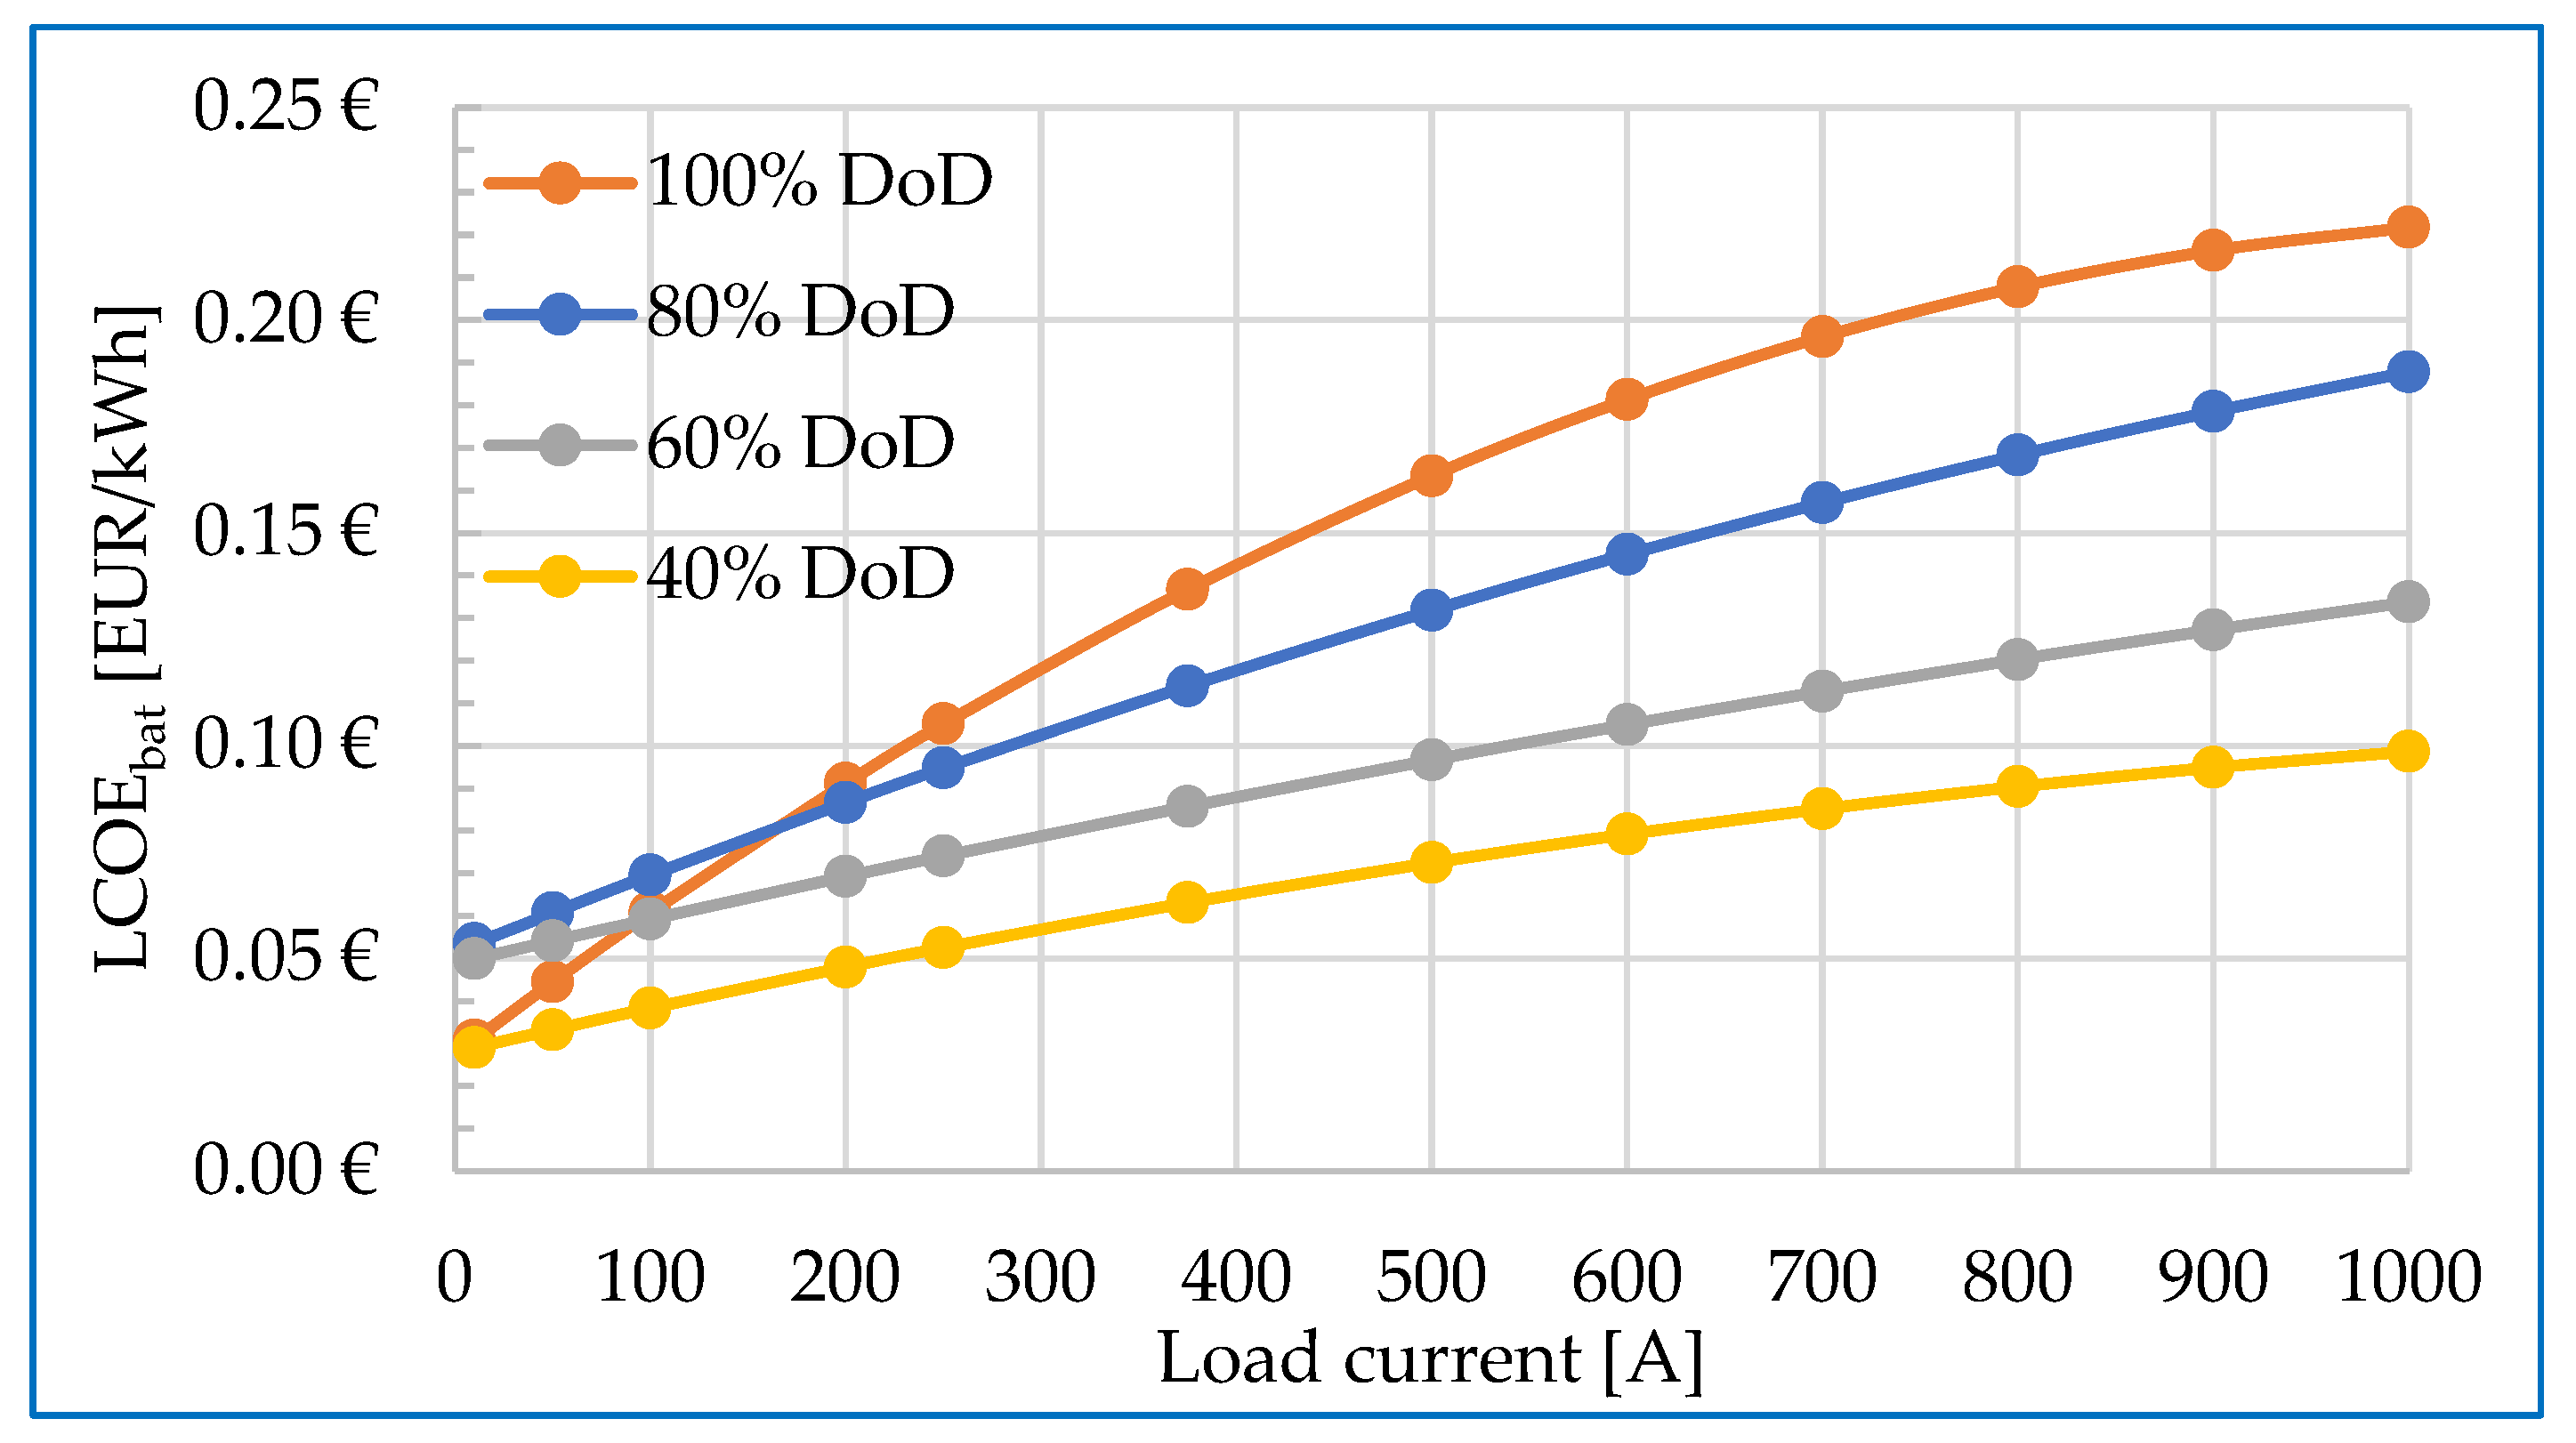
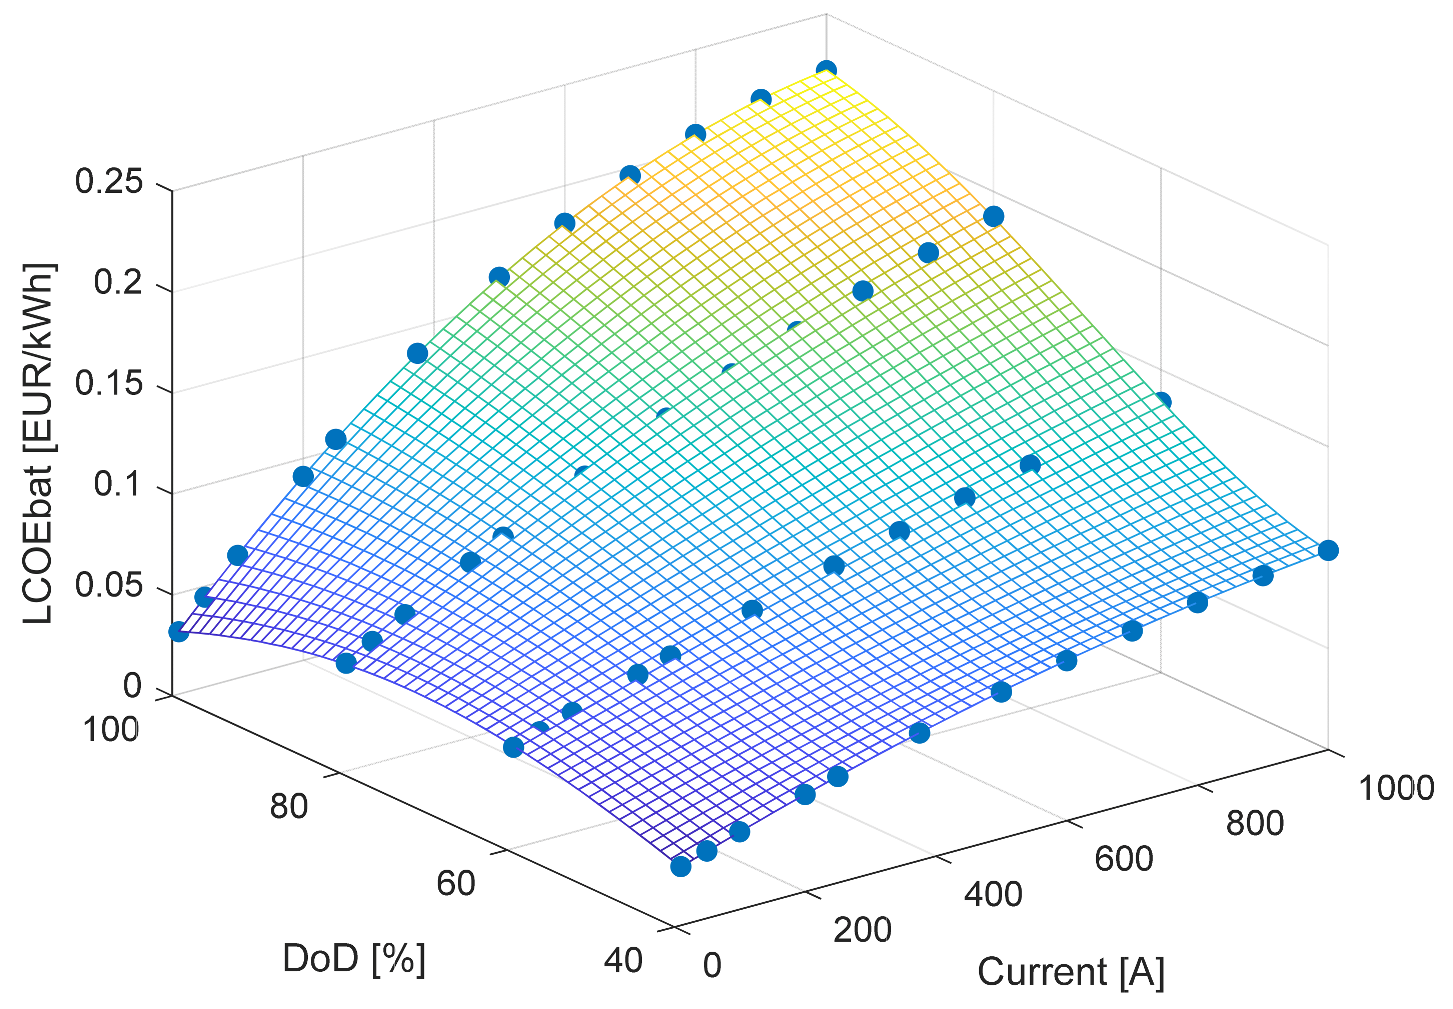
Furthermore, the data reports also validate the assumption that real-time intervention in the power sharing of the two distributed power sources is beneficial. It is evident that addressing the LCOE of system components is essential, as this unique metric provides a comprehensive overview of how cost-effective a given system element or technology is over its entire life cycle. The LCOE of the battery is particularly crucial, as energy storage fundamentally influences system operating costs, the degree of green energy utilization, and the level of energy independence.
The LCOE of the battery considers not only the initial investment costs but also the total energy extracted over its lifetime, which is significantly affected by several factors such as depth of discharge (DoD), load current, and efficiency levels. By leveraging LCOE, it is possible to determine which operational strategies lead to the lowest LCOE, thereby enabling the economic optimization of the system.
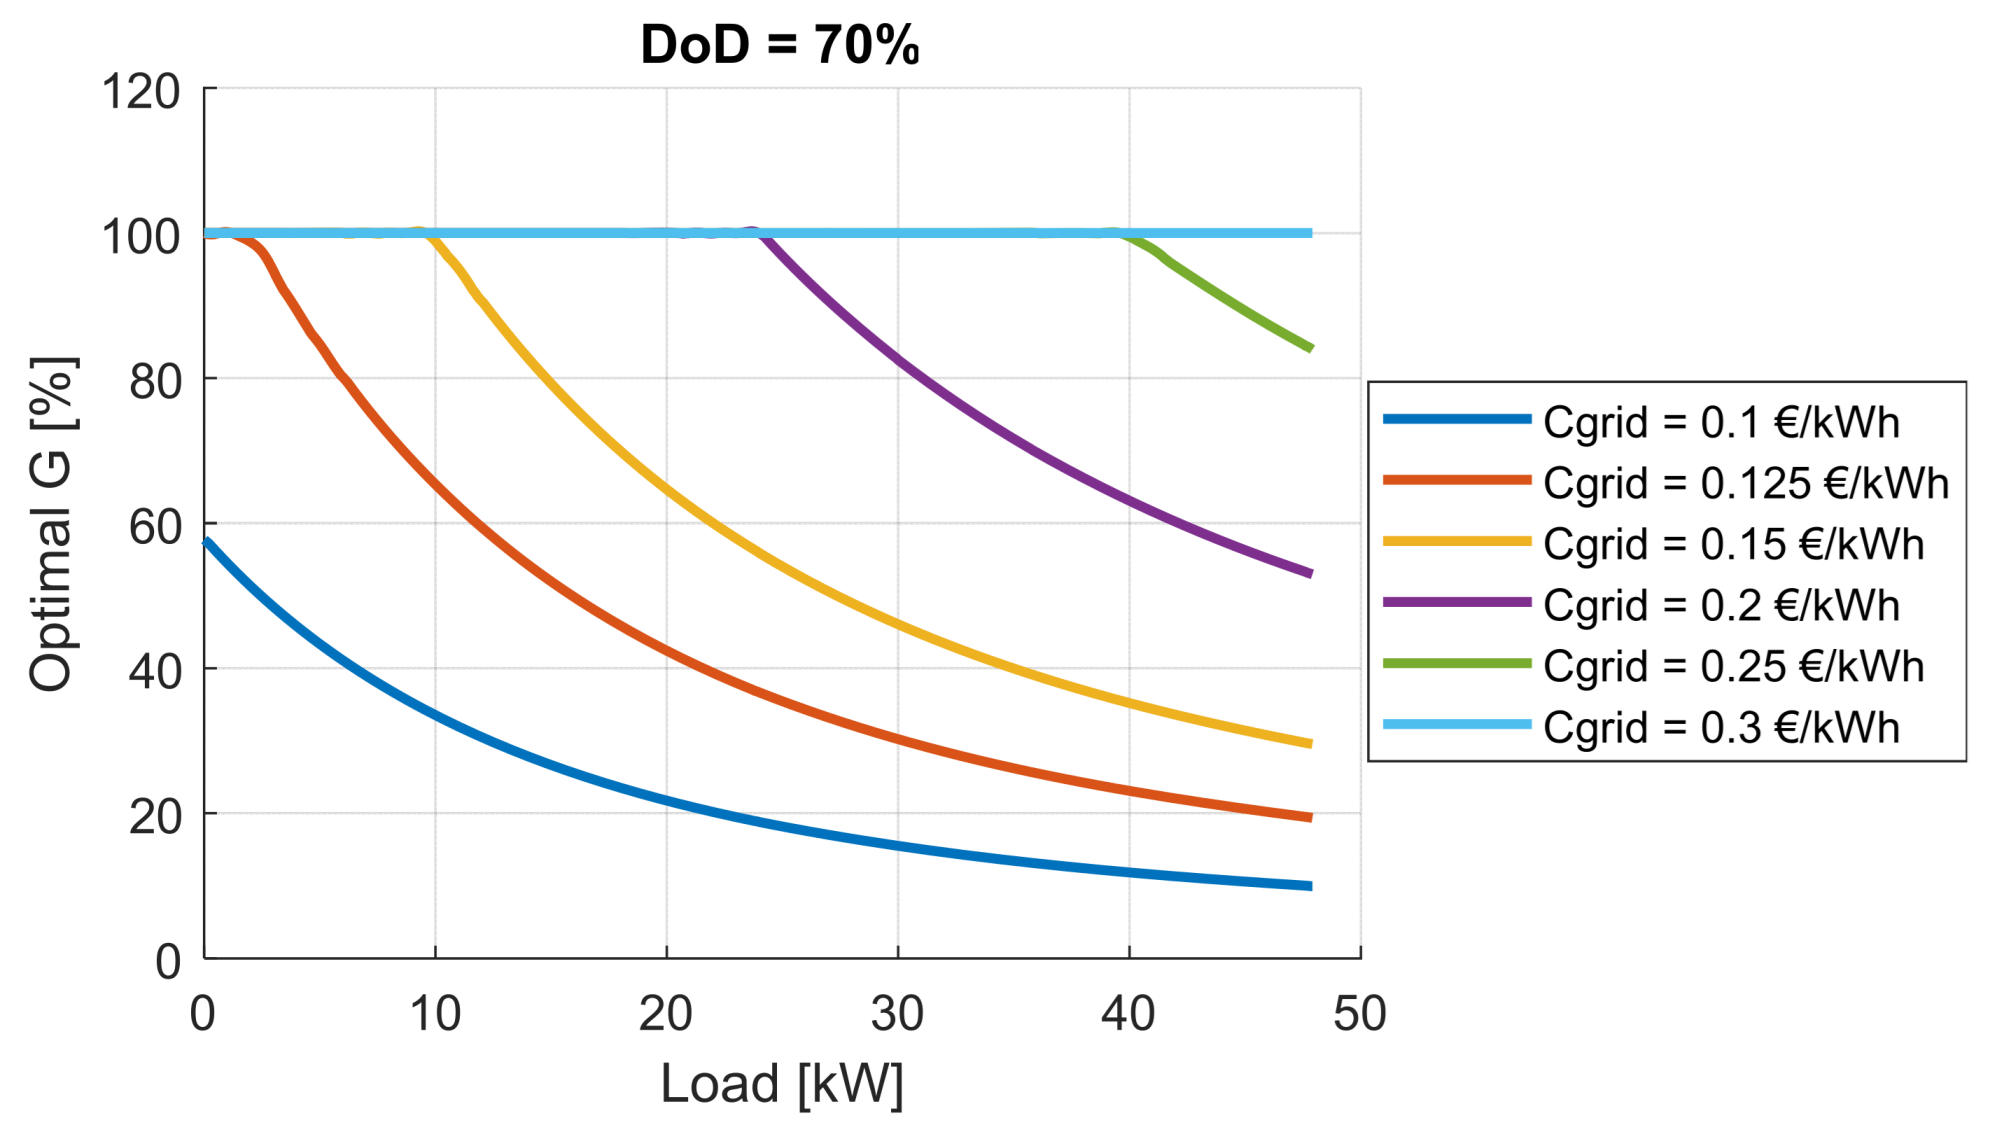
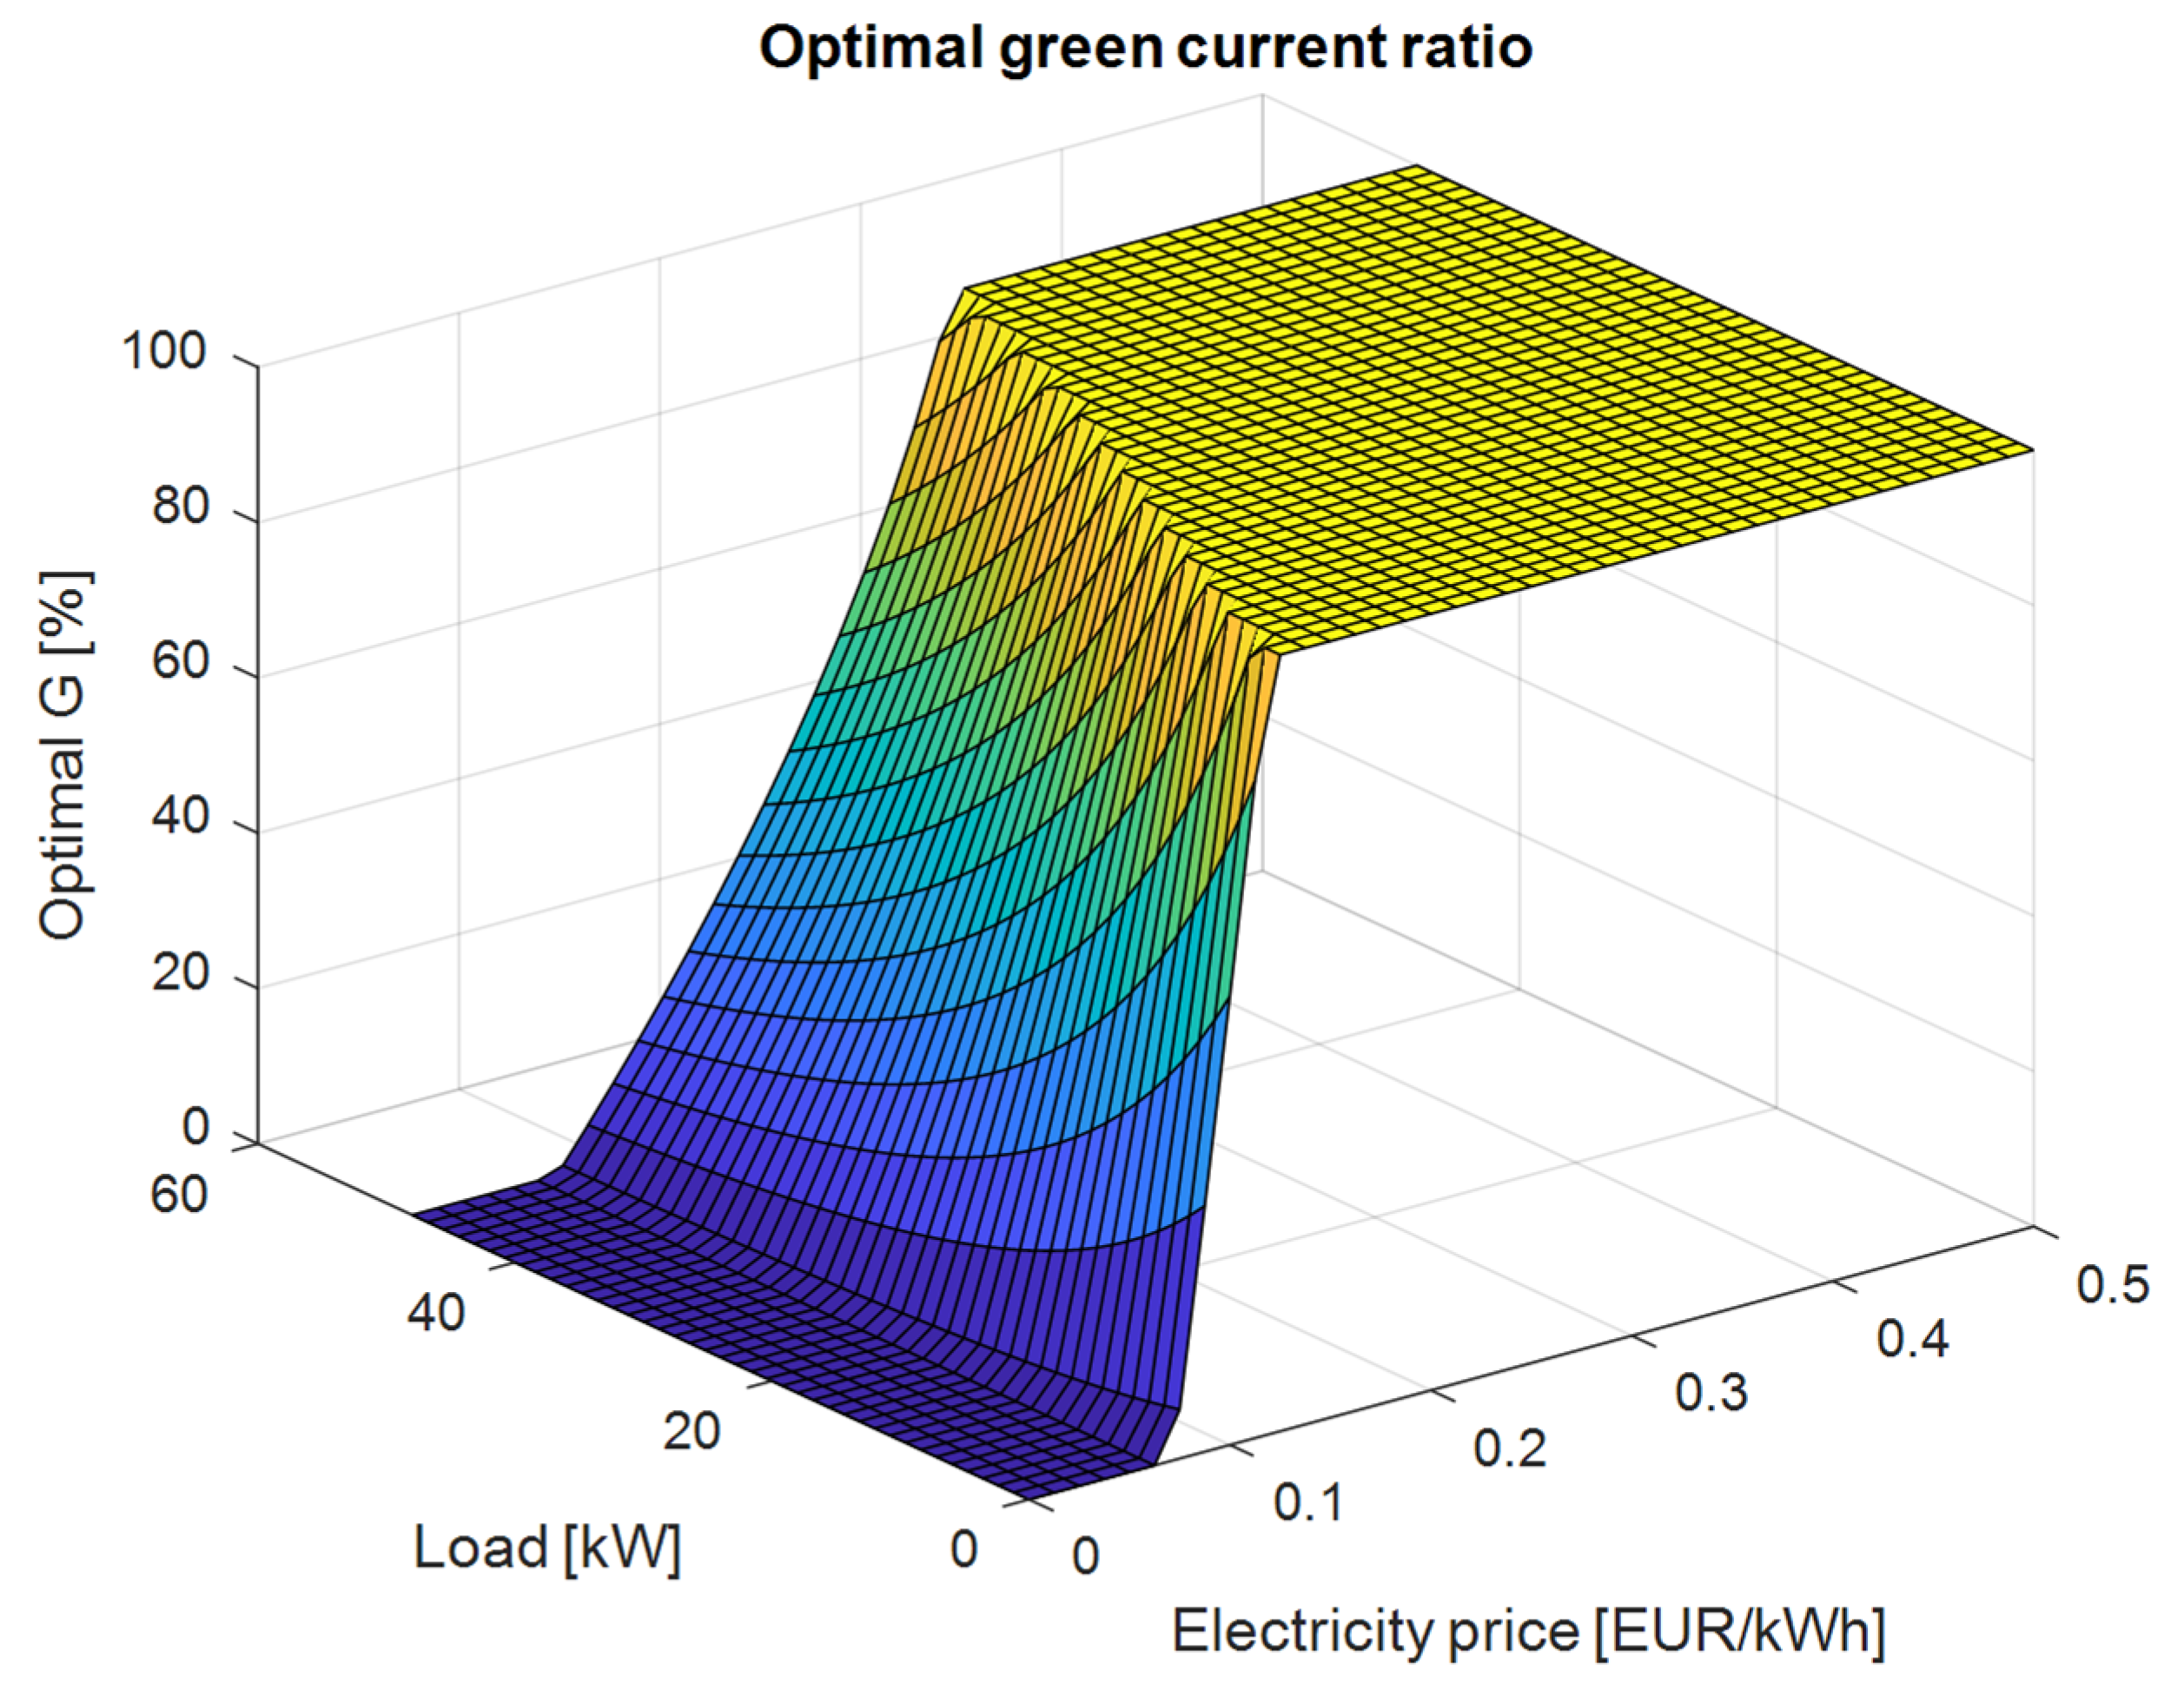
Optimizing the battery’s LCOE is critical because it is directly linked to the dynamic regulation of the green energy ratio. During real-time intervention, the EMS can account for the current state and cost parameters of the battery, ensuring that increasing the green energy share is not only environmentally friendly but also economically sustainable. This is especially important in cases where poorly chosen operational strategies could significantly shorten the battery lifespan, leading to drastically increased costs in the long run.
Additionally, focusing on LCOE provides the opportunity to compare the economic efficiency metrics of different technologies and system components. As a result, system operators can make informed decisions about which energy sources or devices should be prioritized under given operating conditions. Understanding the LCOE of the battery, the LLC converter, and the solar panels enables the implementation of an optimal energy management strategy that achieves the lowest overall cost throughout the system’s entire life cycle.
The system does not necessarily require an LLC converter as a step-up DC/DC converter; other DC choppers can also be utilized. It is also possible to integrate battery packs with different voltage levels, but incorporating a DC chopper circuit is essential for the system, as the EMS must be adaptable to two distributed power converters. Currently, DC/DC converters and rectifiers are capable of regulating power levels in the hundreds of kilowatts, making it feasible to implement a higher-power system in practical applications.
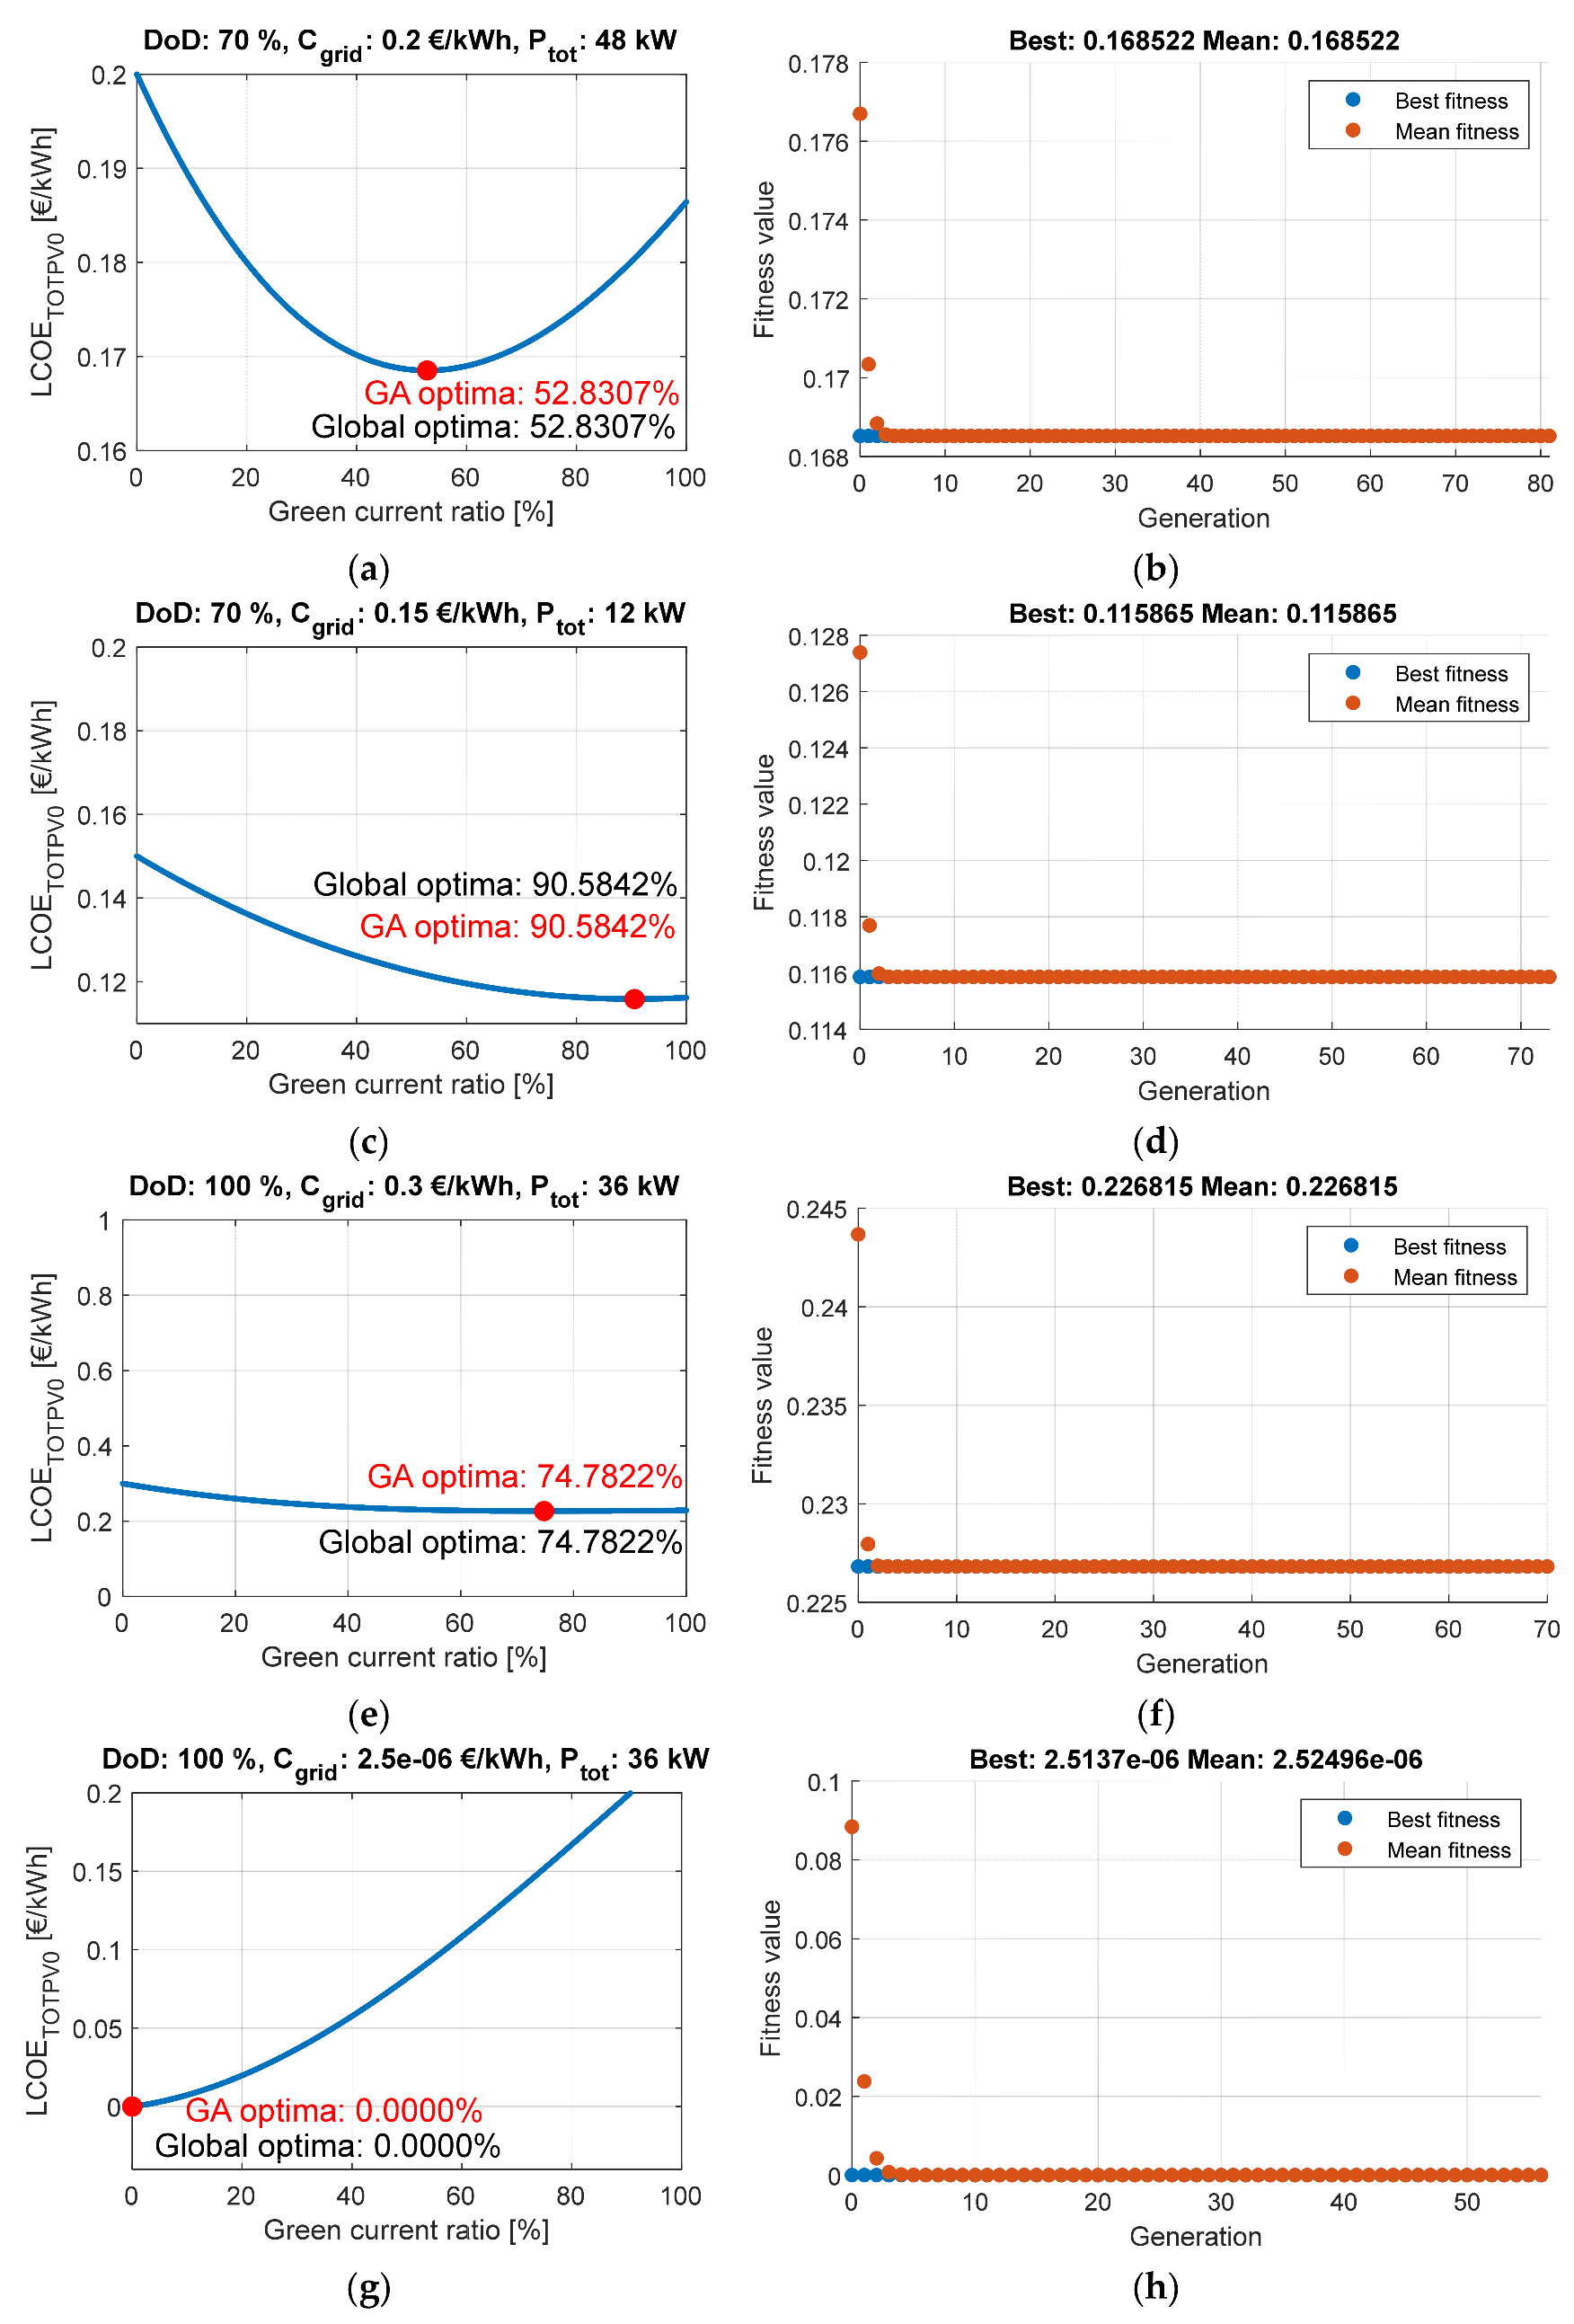
The economic calculations and reports were performed on discrete values in an Excel spreadsheet using both analytical and numerical methods, initially without optimization and later with a genetic algorithm. The obtained results were nearly identical: in the reports, the estimated total LCOE values differed by only about 0.015 EUR/kWh. Similarly, the optimal green energy ratios (GPV) showed negligible differences. Based on the presented results, it is evident that the requirements for the green current ratio controller are not stringent. The actual percentage value of the green current ratio does not need to be controlled with decimal precision; integer values are sufficient for system operation. However, the controller must ensure the voltage of the DC bus as accurately as possible.
In the future, numerous research opportunities remain in the field of intelligent, solar-powered hybrid UPS systems. Further studies are required to fine-tune the energy management algorithm, particularly in the areas of real-time decision-making and predictive control. The EMS could incorporate factors such as expected weather conditions, anticipated electricity prices, consumption patterns, load forecast, communication intermittencies, and planned shutdowns [40,41].
The identification algorithm of the intelligent control system could be further developed to accommodate three or more distributed generators. In this case, it would also be worthwhile to compare its effectiveness with droop control. In the coming years, as renewable energy sources continue to gain prominence, similar systems are expected to become increasingly intelligent and efficient, further enhancing the practical significance of these developments.

Author Contributions

Conceptualization—R.R.B. and I.B.; software—R.R.B.; validation—R.R.B.; formal analysis—R.R.B.; investigation—R.R.B.; resources—R.R.B. and M.J.; data curation—R.R.B.; writing: original draft preparation—R.R.B.; writing: review and editing—R.R.B. and M.J.; visualization—R.R.B.; supervision—I.B. and M.J; project administration—I.B. All authors have read and agreed to the published version of the manuscript.

Funding

This research received no external funding.

Data Availability Statement

The original contributions presented in this study are included in the article. Further inquiries can be directed to the corresponding author.

Acknowledgments

Supported by the university research scholarship program of the ministry for culture and innovation from the source of the national research, development, and innovation fund.

Conflicts of Interest

The authors declare no conflicts of interest.

Abbreviations

The following abbreviations are used in this manuscript:
ANNartificial neural network
BMSbattery management system
DCdirect current
DoDdepth of discharge
EMSenergy management system
IGBTinsulated-gate bipolar transistor
LCOElevelized cost of energy
LLCinductance–inductance–capacitor
MSEmean square error
PIDproportional–integral–derivative
PVphotovoltaic
SCRsilicon controlled rectifier
SoCstate of charge
UPSuninterruptible power supply

References

  1. Liutak, O.; Baula, O.; Kutsenko, V.; Ivantsov, S. Energy Transformation in the Global Paradigm of Sustainable Development. Actual Probl. Econ. 2023, 264, 69–76. [Google Scholar] [CrossRef]
  2. Bogdanov, D.; Ram, M.; Aghahosseini, A.; Gulagi, A.; Oyewo, A.; Child, M.; Caldera, U.; Sadovskaia, K.; Farfán, J.; Barbosa, L.D.S.N.S.; et al. Low-Cost Renewable Electricity as the Key Driver of the Global Energy Transition towards Sustainability. Energy 2021, 227, 120467. [Google Scholar] [CrossRef]
  3. del Pozo, F.E., Jr.; Bawagan, A.V.O.; Ceruma, D.R.J. Development of Power Back-Up System Using Motor Control for Large Equipment. Int. J. Adv. Eng. Res. Sci. 2022, 9, 316–324. [Google Scholar] [CrossRef]
  4. Oh, J.H.; Lee, J.H.; Ryu, J.C.; Lee, H.W.; Chae, H.M.; Kim, J.E. Operation Method for Hybrid UPS with Energy Storage System Function. J. Electr. Eng. Technol. 2019, 14, 1871–1880. [Google Scholar] [CrossRef]
  5. Ko, J.H.; Choi, T.S.; Ryu, J.C.; Lee, H.W.; Lee, J.H.; Chae, H.M.; Jeon, S.G.; Kim, J.E. A Novel Design of UPS with Useful Customer Load Management Function. J. Electr. Eng. Technol. 2019, 14, 569–579. [Google Scholar] [CrossRef]
  6. Yang, J.; Yuan, W.; Sun, Y.; Han, H.; Hou, X.; Guerrero, J.M. A Novel Quasi-Master-Slave Control Frame for PV-Storage Independent Microgrid. Int. J. Electr. Power Energy Syst. 2018, 97, 262–274. [Google Scholar] [CrossRef]
  7. Gao, F.; Kang, R.; Cao, J.; Yang, T. Primary and Secondary Control in DC Microgrids: A Review. J. Mod. Power Syst. Clean Energy 2019, 7, 227–242. [Google Scholar] [CrossRef]
  8. Wang, Y.; Qiu, F.; Liu, G.; Lei, M.; Yang, C.; Wang, C. Adaptive Reference Power Based Voltage Droop Control for VSC-MTDC Systems. J. Mod. Power Syst. Clean Energy 2023, 11, 381–388. [Google Scholar] [CrossRef]
  9. Eskandari, M.; Li, L.; Moradi, M.H.; Wang, F.; Blaabjerg, F. A Control System for Stable Operation of Autonomous Networked Microgrids. IEEE Trans. Power Deliv. 2020, 35, 1633–1647. [Google Scholar] [CrossRef]
  10. Gorijeevaram Reddy, P.K.; Dasarathan, S.; Krishnasamy, V. Investigation of Adaptive Droop Control Applied to Low-Voltage DC Microgrid. Energies 2021, 14, 5356. [Google Scholar] [CrossRef]
  11. Kim, D.; Park, J.W.; Lee, S.H. A Study on the Power Reserve of Distributed Generators Based on Power Sensitivity Analysis in a Large-Scale Power System. Electronics 2021, 10, 769. [Google Scholar] [CrossRef]
  12. Imran, R.M.; Wang, S.; Flaih, F.M.F. DQ-Voltage Droop Control and Robust Secondary Restoration with Eligibility to Operate during Communication Failure in Autonomous Microgrid. IEEE Access 2019, 7, 6353–6361. [Google Scholar] [CrossRef]
  13. Bunker, K.J.; Weaver, W.W. Multidimensional Droop Control for Wind Resources in Dc Microgrids. IET Gener. Transm. Distrib. 2017, 11, 657–664. [Google Scholar] [CrossRef]
  14. Alatshan, M.S.; Alhamrouni, I.; Sutikno, T.; Jusoh, A. Improvement of the Performance of STATCOM in Terms of Voltage Profile Using ANN Controller. Int. J. Power Electron. Drive Syst. (IJPEDS) 2020, 11, 1966–1978. [Google Scholar] [CrossRef]
  15. Joshi, Y.; Kumar Maherchandani, J.; Raj Joshi, R.; Kumar Yadav, V. Intelligent Control Strategy to Enhance Power Smoothing of Renewable Based Microgrid with Hybrid Energy Storage. Turk. J. Comput. Math. Educ. 2021, 12, 3090–3100. [Google Scholar]
  16. Amer, R.A.; Morsy, G.A.; Yassin, H.A. ANN Controller For Statcom To Enhance Performance of Multi-Machine Power Systems Including SCG. ERJ. Eng. Res. J. 2011, 34, 345–351. [Google Scholar] [CrossRef]
  17. Abdolrasol, M.G.M.; Hannan, M.A.; Suhail Hussain, S.M.; Ustun, T.S.; Sarker, M.R.; Ker, P.J. Energy Management Scheduling for Microgrids in the Virtual Power Plant System Using Artificial Neural Networks. Energies 2021, 14, 6507. [Google Scholar] [CrossRef]
  18. Wei, B.; Marzabal, A.; Ruiz, R.; Guerrero, J.M.; Vasquez, J.C. DAVIC: A New Distributed Adaptive Virtual Impedance Control for Parallel-Connected Voltage Source Inverters in Modular UPS System. IEEE Trans. Power Electron. 2019, 34, 5953–5968. [Google Scholar] [CrossRef]
  19. Yang, D.; Wang, J.; Cai, H.; Rao, J.; Cui, C. Intelligent Control Strategy for Electrified Pressure-Swing Distillation Processes Using Artificial Neural Networks-Based Composition Controllers. Sep. Purif. Technol. 2025, 360, 130991. [Google Scholar] [CrossRef]
  20. Ciancetta, F.; Fiorucci, E.; Fioravanti, A.; Mari, S.; Prudenzi, A.; Silvestri, A. System for Repetitive Battery Charge and Discharge Tests for Battery Life Analysis. Renew. Energy Power Qual. J. 2022, 20, 90–94. [Google Scholar] [CrossRef]
  21. Prochazka, P.; Cervinka, D.; Martis, J.; Cipin, R.; Vorel, P. Li-Ion Battery Deep Discharge Degradation. ECS Trans. 2016, 74, 31–36. [Google Scholar] [CrossRef]
  22. Wei, Y.; Yao, Y.; Pang, K.; Xu, C.; Han, X.; Lu, L.; Li, Y.; Qin, Y.; Zheng, Y.; Wang, H.; et al. A Comprehensive Study of Degradation Characteristics and Mechanisms of Commercial Li(NiMnCo)O2 EV Batteries under Vehicle-To-Grid (V2G) Services. Batteries 2022, 8, 188. [Google Scholar] [CrossRef]
  23. Gailani, A.; Mokidm, R.; El-Dalahmeh, M.; El-Dalahmeh, M.; Al-Greer, M. Analysis of Lithium-Ion Battery Cells Degradation Based on Different Manufacturers. In Proceedings of the UPEC 2020—2020 55th International Universities Power Engineering Conference, Turin, Italy, 1–4 September 2020. [Google Scholar] [CrossRef]
  24. Sun, Y.; Saxena, S.; Pecht, M. Derating Guidelines for Lithium-Ion Batteries. Energies 2018, 11, 3295. [Google Scholar] [CrossRef]
  25. Mendoza-Hernandez, O.S.; Bolay, L.J.; Horstmann, B.; Latz, A.; Hosono, E.; Asakura, D.; Matsuda, H.; Itagaki, M.; Umeda, M.; Sone, Y. Durability Analysis of the REIMEI Satellite Li-Ion Batteries after More than 14 Years of Operation in Space. Electrochemistry 2020, 88, 300–304. [Google Scholar] [CrossRef]
  26. Karunarathna, J.; Madawala, U.; Baguley, C.; Blaabjerg, F.; Sandelic, M. Battery Reliability of Fast Electric Vehicle Charging Systems. In Proceedings of the 2021 IEEE Southern Power Electronics Conference (SPEC), Kigali, Rwanda, 6–9 December 2021. [Google Scholar] [CrossRef]
  27. Tran, M.K.; Cunanan, C.; Panchal, S.; Fraser, R.; Fowler, M. Investigation of Individual Cells Replacement Concept in Lithium-Ion Battery Packs with Analysis on Economic Feasibility and Pack Design Requirements. Processes 2021, 9, 2263. [Google Scholar] [CrossRef]
  28. Lin, C.; Tang, A.; Wu, N.; Xing, J. Electrochemical and Mechanical Failure of Graphite-Based Anode Materials in Li-Ion Batteries for Electric Vehicles. J. Chem. 2016, 2016, 2940437. [Google Scholar] [CrossRef]
  29. Elmahallawy, M.; Elfouly, T.; Alouani, A.; Massoud, A.M. A Comprehensive Review of Lithium-Ion Batteries Modeling, and State of Health and Remaining Useful Lifetime Prediction. IEEE Access 2022, 10, 119040–119070. [Google Scholar] [CrossRef]
  30. Long, Q.; Zhu, R.; Das, K.; Sørensen, P.E. Interfacing Energy Management with Supervisory Control for Hybrid Power Plants. IET Conf. Proc. 2021, 2021, 347–351. [Google Scholar] [CrossRef]
  31. Zhang, H.; Yue, D.; Dou, C.; Li, K.; Xie, X. Event-Triggered Multiagent Optimization for Two-Layered Model of Hybrid Energy System with Price Bidding-Based Demand Response. IEEE Trans. Cybern. 2021, 51, 2068–2079. [Google Scholar] [CrossRef]
  32. Li, J.; Wei, W.; Peng, Y.; Li, Y.; Xiao, D. A Spectral Approximate Strategy for Energy Management of Hybrid AC/DC System with Uncertainty. IEEE Access 2020, 8, 88575–88583. [Google Scholar] [CrossRef]
  33. Saidi, M.; Li, Z.; Ben Elghali, S.; Outbib, R. Realization of the Optimal Sizing of Local Hybrid Photovoltaic and Wind Energy Systems with Load Scheduling Capacity. Int. J. Energy Res. 2022, 46, 21523–21537. [Google Scholar] [CrossRef]
  34. Kabeyi, M.J.B.; Olanrewaju, O.A. The Levelized Cost of Energy and Modifications for Use in Electricity Generation Planning. Energy Rep. 2023, 9, 495–534. [Google Scholar] [CrossRef]
  35. Boros, R.R.; Bodnár, I. Effect of SPWM Inverter in Combination with Solar Uninterruptible Induction Motor Drive. Energies 2023, 16, 5061. [Google Scholar] [CrossRef]
  36. Boros, R.R.; Bodnár, I. LLC Resonant Converter Design and Simulation for PV Motor Drives. In Proceedings of the 2021 22nd International Carpathian Control Conference (ICCC), Velké Karlovice, Czech Republic, 31 May–1 June 2021; pp. 1–5. [Google Scholar]
  37. Boros, R.R.; Bodnár, I. Grid and PV Fed Uninterruptible Induction Motor Drive Implementation and Measurements. Energies 2022, 15, 708. [Google Scholar] [CrossRef]
  38. HuangPeng, Q.; Sun, Q.; Feng, J.; Pan, Z.; Wu, D. Cycle Life Prediction for Space Nickel Hydrogen Battery Based on Accelerated EODV Multi-Phase Model. J. Electrochem. Soc. 2015, 162, A658–A666. [Google Scholar] [CrossRef]
  39. Somogyiné Molnár, J.; Szalánczi, D. Napelemes Rendszerek Megtérülési Idejének Vizsgálata. In Proceedings of the Elektrotechnikai és Elektronikai Szeminárium 2022, Miskolc, Hungary, 2 December 2022; pp. 119–135. [Google Scholar]
  40. Feng, C.; Shao, L.; Wang, J.; Zhang, Y.; Wen, F. Short-Term Load Forecasting of Distribution Transformer Supply Zones Based on Federated Model-Agnostic Meta Learning. IEEE Trans. Power Syst. 2025, 40, 31–45. [Google Scholar] [CrossRef]
  41. Hu, Z.; Su, R.; Veerasamy, V.; Huang, L.; Ma, R. Resilient Frequency Regulation for Microgrids Under Phasor Measurement Unit Faults and Communication Intermittency. IEEE Trans Ind. Inf. 2025, 21, 1941–1949. [Google Scholar] [CrossRef]
Figure 1. Intelligent online hybrid UPS system with optional bypass switch.
Energies 18 01321 g001
Figure 2. Centralized leader–follower control strategy [7].
Energies 18 01321 g002
Figure 3. Block diagram of the hybrid UPS system studied in this research.
Energies 18 01321 g003
Figure 4. ANN-based centralized control strategy.
Energies 18 01321 g004
Figure 5. Identifier algorithm for hybrid UPS system with thyristor rectifier.
Energies 18 01321 g005
Figure 6. Identification of the hybrid UPS system with a thyristor rectifier.
Energies 18 01321 g006
Figure 7. Three-phase rectifier block internal structure.
Energies 18 01321 g007
Figure 8. ANN-based centralized controller simulation.
Energies 18 01321 g008
Figure 9. Total LCOE as a function of green current at different loads, if the solar panel is not producing energy (the points on the curves represent the optimum).
Energies 18 01321 g009
Figure 10. Setpoints of the identified LLC converter at different loads and battery voltages.
Energies 18 01321 g010
Figure 11. Firing angles of the identified rectifier at different loads and battery voltages.
Energies 18 01321 g011
Figure 12. Change in MSE during the epochs, (a) and different aspects of the training process (b).
Energies 18 01321 g012
Figure 13. The effect of ramping the green current ratio.
Energies 18 01321 g013
Figure 14. Effect of dynamic battery voltage change.
Energies 18 01321 g014
Figure 15. The effect of load and battery voltage variation.
Energies 18 01321 g015
Figure 16. The effect of dynamic change in green current ratio setpoint.
Energies 18 01321 g016
Figure 17. The effect of power outage and recovery.
Energies 18 01321 g017
Figure 18. Battery cycle as a function of DoD and load current.
Energies 18 01321 g018
Figure 19. Actual energy that can be extracted from the battery as a function of load.
Energies 18 01321 g019
Figure 20. Battery LCOE as a function of DoD and load current.
Energies 18 01321 g020
Figure 21. LCOEs as a function of load current and DoD.
Energies 18 01321 g021
Figure 22. Battery LCOE as a function of DoD and current (warmer colors means higher LCOE value).
Energies 18 01321 g022
Figure 23. LLC converter efficiency as a function of load.
Energies 18 01321 g023
Figure 24. Optimal green current ratios for different grid electricity tariffs and loads when the solar panel is not producing electricity.
Energies 18 01321 g024
Figure 25. Optimized cost as a function of load and grid electricity tariff cost (warmer colors means higher price).
Energies 18 01321 g025
Figure 26. Optimal green current ratios for different grid electricity tariffs and loads when the solar panel is not generating electricity and DoD = 70% (warmer colors means higher optimal green current ratio).
Energies 18 01321 g026
Figure 27. Total LCOEs (a,c,e,g) and optimal green current ratios (b,d,f,h) for different grid electricity tariffs, DoDs, PV generations, and loads.
Energies 18 01321 g027
Figure 28. LCOETOTPV0 as a function of green current ratio (a,c,e,g) with GA and global optima and fitness value during generations (b,d,f,h).
Energies 18 01321 g028
Table 1. Key parameters of LLC converter.
ParameterName of Parameter ValueUnit
VinInput voltage25–40V
VoutOutput voltage340V
PoutRated power400W
IDCoutRated current1.1765A
nTransformer ratio0.128414-
CrResonant capacitance2154nF
LrResonant inductance1.1756µH
LpPrimary inductance9.405µH
LmMagnetizing inductance8.2294µH
frResonant frequency100kHz
fminLowest switching frequency38.6kHz
Table 2. Key parameters of rectifier.
ParameterName of Parameter ValueUnit
RtionThyristor on-state resistance1
UtifThyristor forward voltage drop0.8V
RdionDiode on-state resistance1
UdifDiode forward voltage drop0.8V
CbuffBuffer capacitor capacitance3000µF
RbuffBuffer capacitor series resistance20
PSCRRated output power11kVA
UinSCRRated input voltage 13 × 400V
1 During the simulations, the grid voltage is symmetrical and does not flicker.
Table 3. Key parameters of inverters.
ParameterName of Parameter ValueUnit
RIGBTonIGBT on-state resistance30
UIGBTfIGBT saturation voltage1.5V
RIGBTdionFlywheel diode on-state resistance1
UIGBTdifFlywheel diode forward voltage drop0.8V
Table 4. Key parameters of induction motor.
ParameterName of Parameter ValueUnit
PnRated power371.8W
UnRated voltage230V
fnRated frequency50Hz
RsStator resistance10
LlsStator inductance18.42mH
RrRotor resistance625.8
LlrRotor inductance5.473mH
LmMutual inductance701.3mH
JMoment of inertia0.08kg·m2
FFriction coefficient5.879mNm·s
pNumber of pole pairs2-
Table 5. Constant input parameters for optimization.
Description of the ParameterParametersDimension
Maximum power of loads 1PLkW
Initial capacity of the battery packCbatAh
Nominal voltage of the battery packUbatnomV
Initial cost of the battery packCinbatEUR
Peukert exponent of the batteryk-
Initial cost of the LLC converterCinLLCEUR
Initial cost of the PV systemCinPVEUR
Initial nominal power of the PV systemPPVikWp
Degradation rate of the solar paneld-
Annual energy production per 1 kWp of solar panel capacityE1yearkWh
MPPT charge controller efficiency 2ηcharge%
1 DC bus total load. 2 Regardless of the solar panel power in this case.
Table 6. The values expected and obtained during training.
ParameterInitial ValueFinal ValueTarget Value
Epoch050005000
Elapsed time-2 s-
Performance39.40.0007871 × 10−14
Gradient57.70.0002151 × 10−7
Mu0.0011 × 10−91 × 1010
Validation04.13 × 1035 × 104
Table 7. Set parameters to run the genetic algorithm.
ParameterSet Value
Population200
Max. generations200
Crossover probability0.8
Mutation probability1%
Elitism5%
Fitness function stabilization (stopping criterion)10−20
Constraint tolerance (stopping criterion) 10−20
Table 8. Static input parameters of the example system.
ParameterValueDimension
PL48kW
Cbat1000Ah
Ubatnom48V
Cinbat 110,800EUR
k1.005-
CinLLC5000EUR
CinPV 218,000EUR
PPVi48kWp
d0.005-
E1year1100kWh
ηcharge90%
1 LiFePO4 battery. 2 Includes MPPT charge controller.
Disclaimer/Publisher’s Note: The statements, opinions and data contained in all publications are solely those of the individual author(s) and contributor(s) and not of MDPI and/or the editor(s). MDPI and/or the editor(s) disclaim responsibility for any injury to people or property resulting from any ideas, methods, instructions or products referred to in the content.

