
The Role of Environmental Product Declarations in the Decarbonization of Building Materials and Components


Abstract
1. Introduction
2. Materials and Methods
2.1. Materials
- International EPD Systems (INT)—a global program for EPDs managed by Environmental Product Declaration International AB.
- The IBU program (IBU)—a certification and verification process for EPDs managed by the Institut Bauen und Umwelt e.V., a German organization.
- EPD-Norge (NOR)—a Norwegian platform for EPDs.
- The INIES program (INI)—a French database that includes EN 15804 certifications voluntarily submitted by manufacturers and trade associations.
- The BRE EPD program (BRE)—an EPD certification system managed by Building Research Establishment (BRE) in the UK.
- EPD Danmark (DAN)—a national platform for EPDs in Denmark managed by Miljømærkning Danmark.
- EPD Italy (ITA)—a national program for EPDs in Italy managed by the organization Federazione Anima.
- EPD Ireland (IRE)—a national platform for EPDs in Ireland.
- Stichting MRPI (MRPI)—a Dutch initiative aimed at providing reliable EPDs in the Netherlands; it is managed by the Milieu Centraal organization.
- Bau-EPD (BAU)—an Austrian platform that provides EPDs for the construction sector.
- DAPconstrucción (DAPc)—the “Declaración Ambiental de Producto para la Construcción” is a Spanish program for EPDs specifically related to the construction sector.
- Asociación Española de Normalización database (AEN)—another Spanish initiative.
- DAPhabitat (DAPh)—a Portuguese national initiative for the management of EPDs specifically tailored for the construction and building sector; it is managed by the Associação para a Sustentabilidade da Construção.
- EPD Hub (HUB)—a global platform that provides EPDs for various industries, including construction, manufacturing, and other sectors.
- ZAG EPD (ZAG)—refers to the platform managed by the Zagreb Institute of Construction, which is a Croatian organization that manages the issuance of EPDs for products in the construction industry.
- RTS EPD (RTS)—a Finnish EPD program primarily focused on the construction and building materials sector.
- Technical and Test Institute for Construction Prague (TZUS)—a Czech company operating as a certification and testing body for construction materials and related products.
- ITB EPD Program (ITB)—voluntary program for construction products in Poland.
- Kiwa EPDs (KIW)—a database developed and verified by Kiwa, an international certification body.
- SCS Global Services (SCS)—an international organization active in environmental certification and sustainability verification.
- Tata Steel EPDs (TAT)—an international company developing EPDs for some of its products.
- ASTM International (ASTM)—an American organization developing voluntary technical international standards for a wide range of materials.
- UL Solution (UL)—an American independent company that certificates environmental product declaration for different type of products.
- EPD Australasia (AUS)—an independent organization active in Australia and New Zealand that provides EPDs for the businesses sector.
- Belgian EPD Program (B-EPD)—voluntary program for construction products in Belgium.
2.1.1. Insulation Materials
2.1.2. Bricks
2.1.3. Concrete
2.1.4. Cement
2.1.5. Natural Stones
2.1.6. Structural Steel
2.1.7. Windows
2.1.8. Wood
2.1.9. Photovoltaic Panels
2.1.10. Heat Pumps
2.2. Methods
3. Results
3.1. Insulation Materials
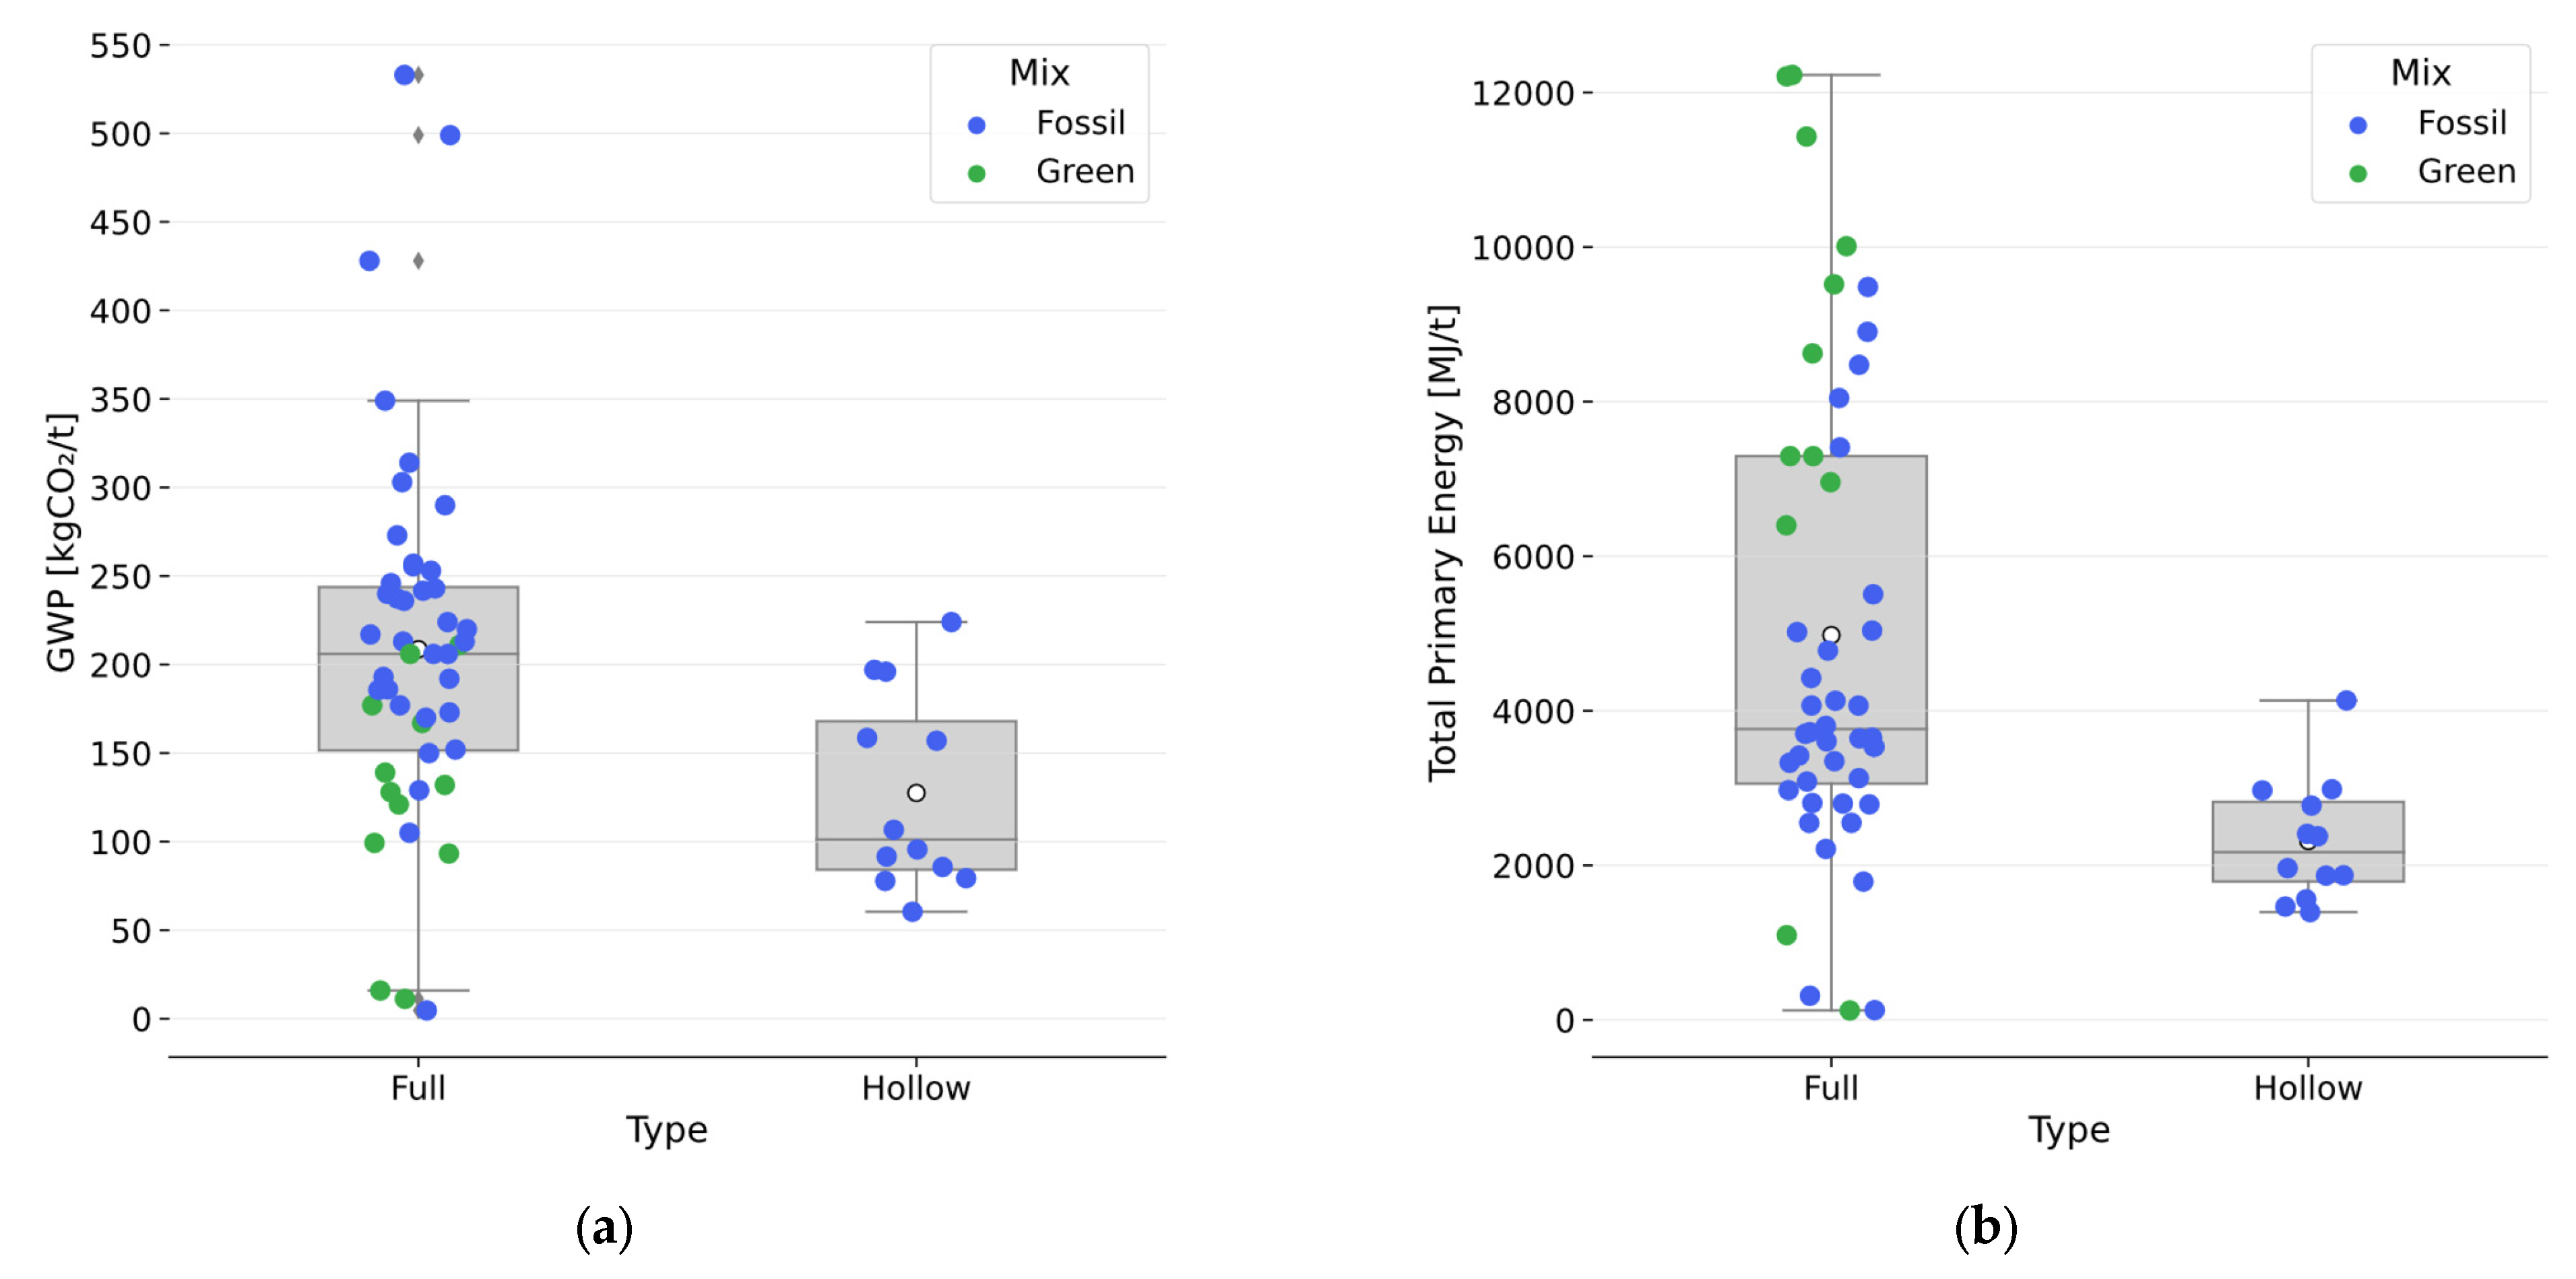
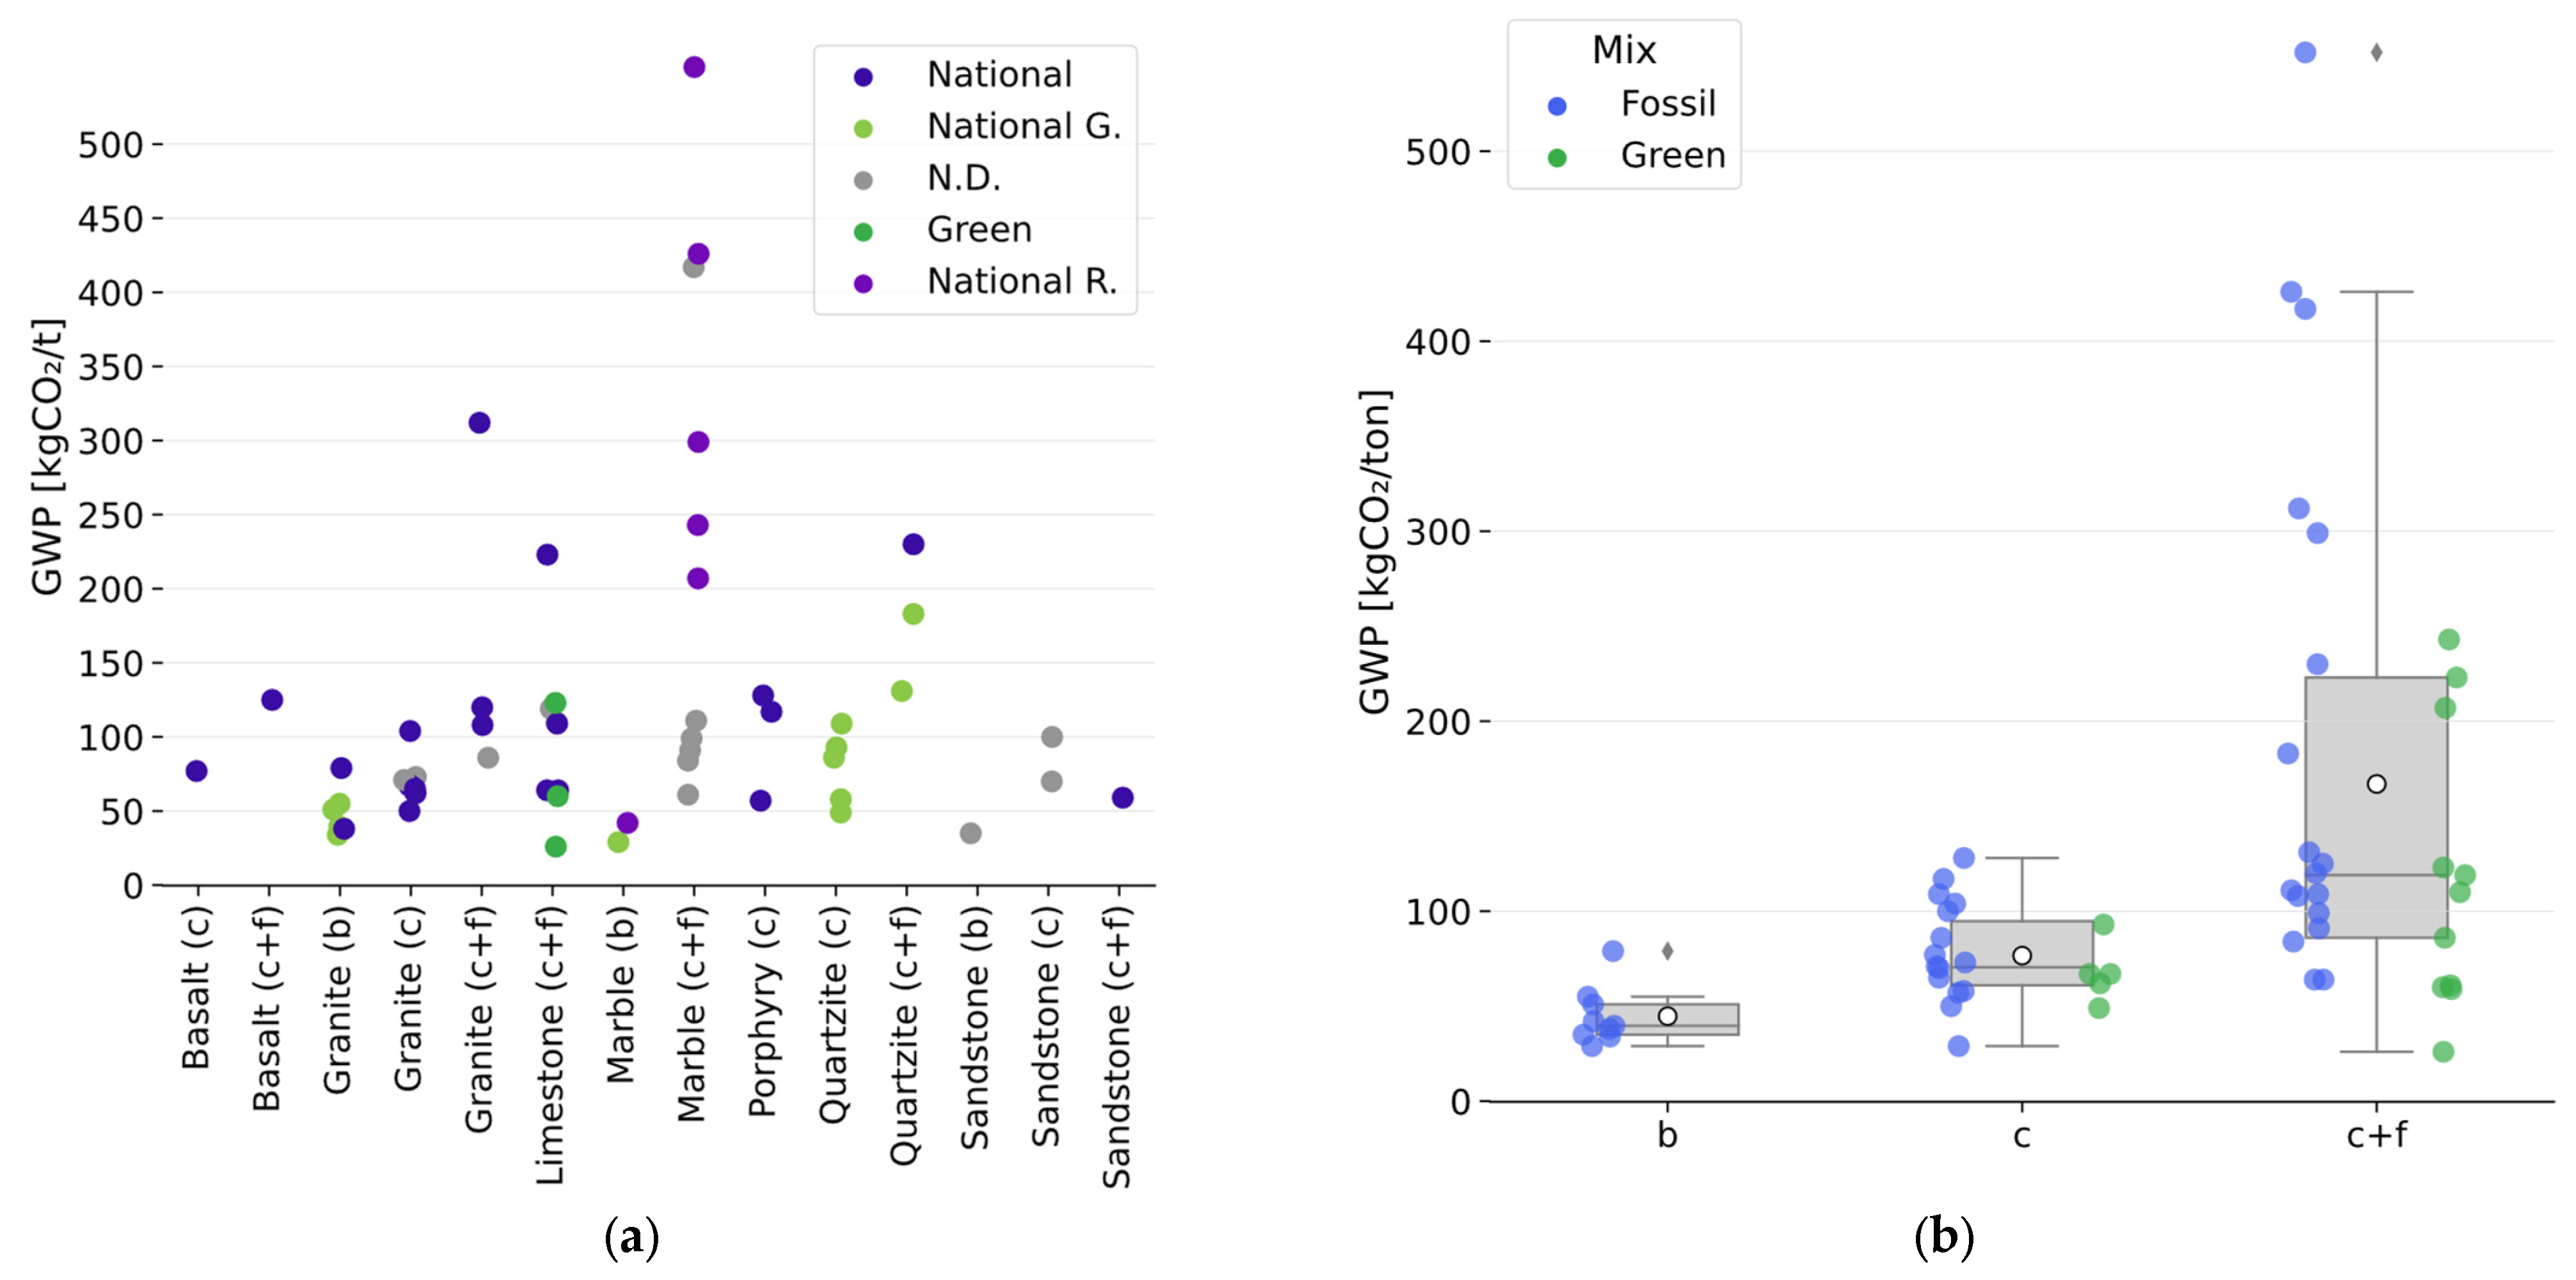
3.2. Bricks
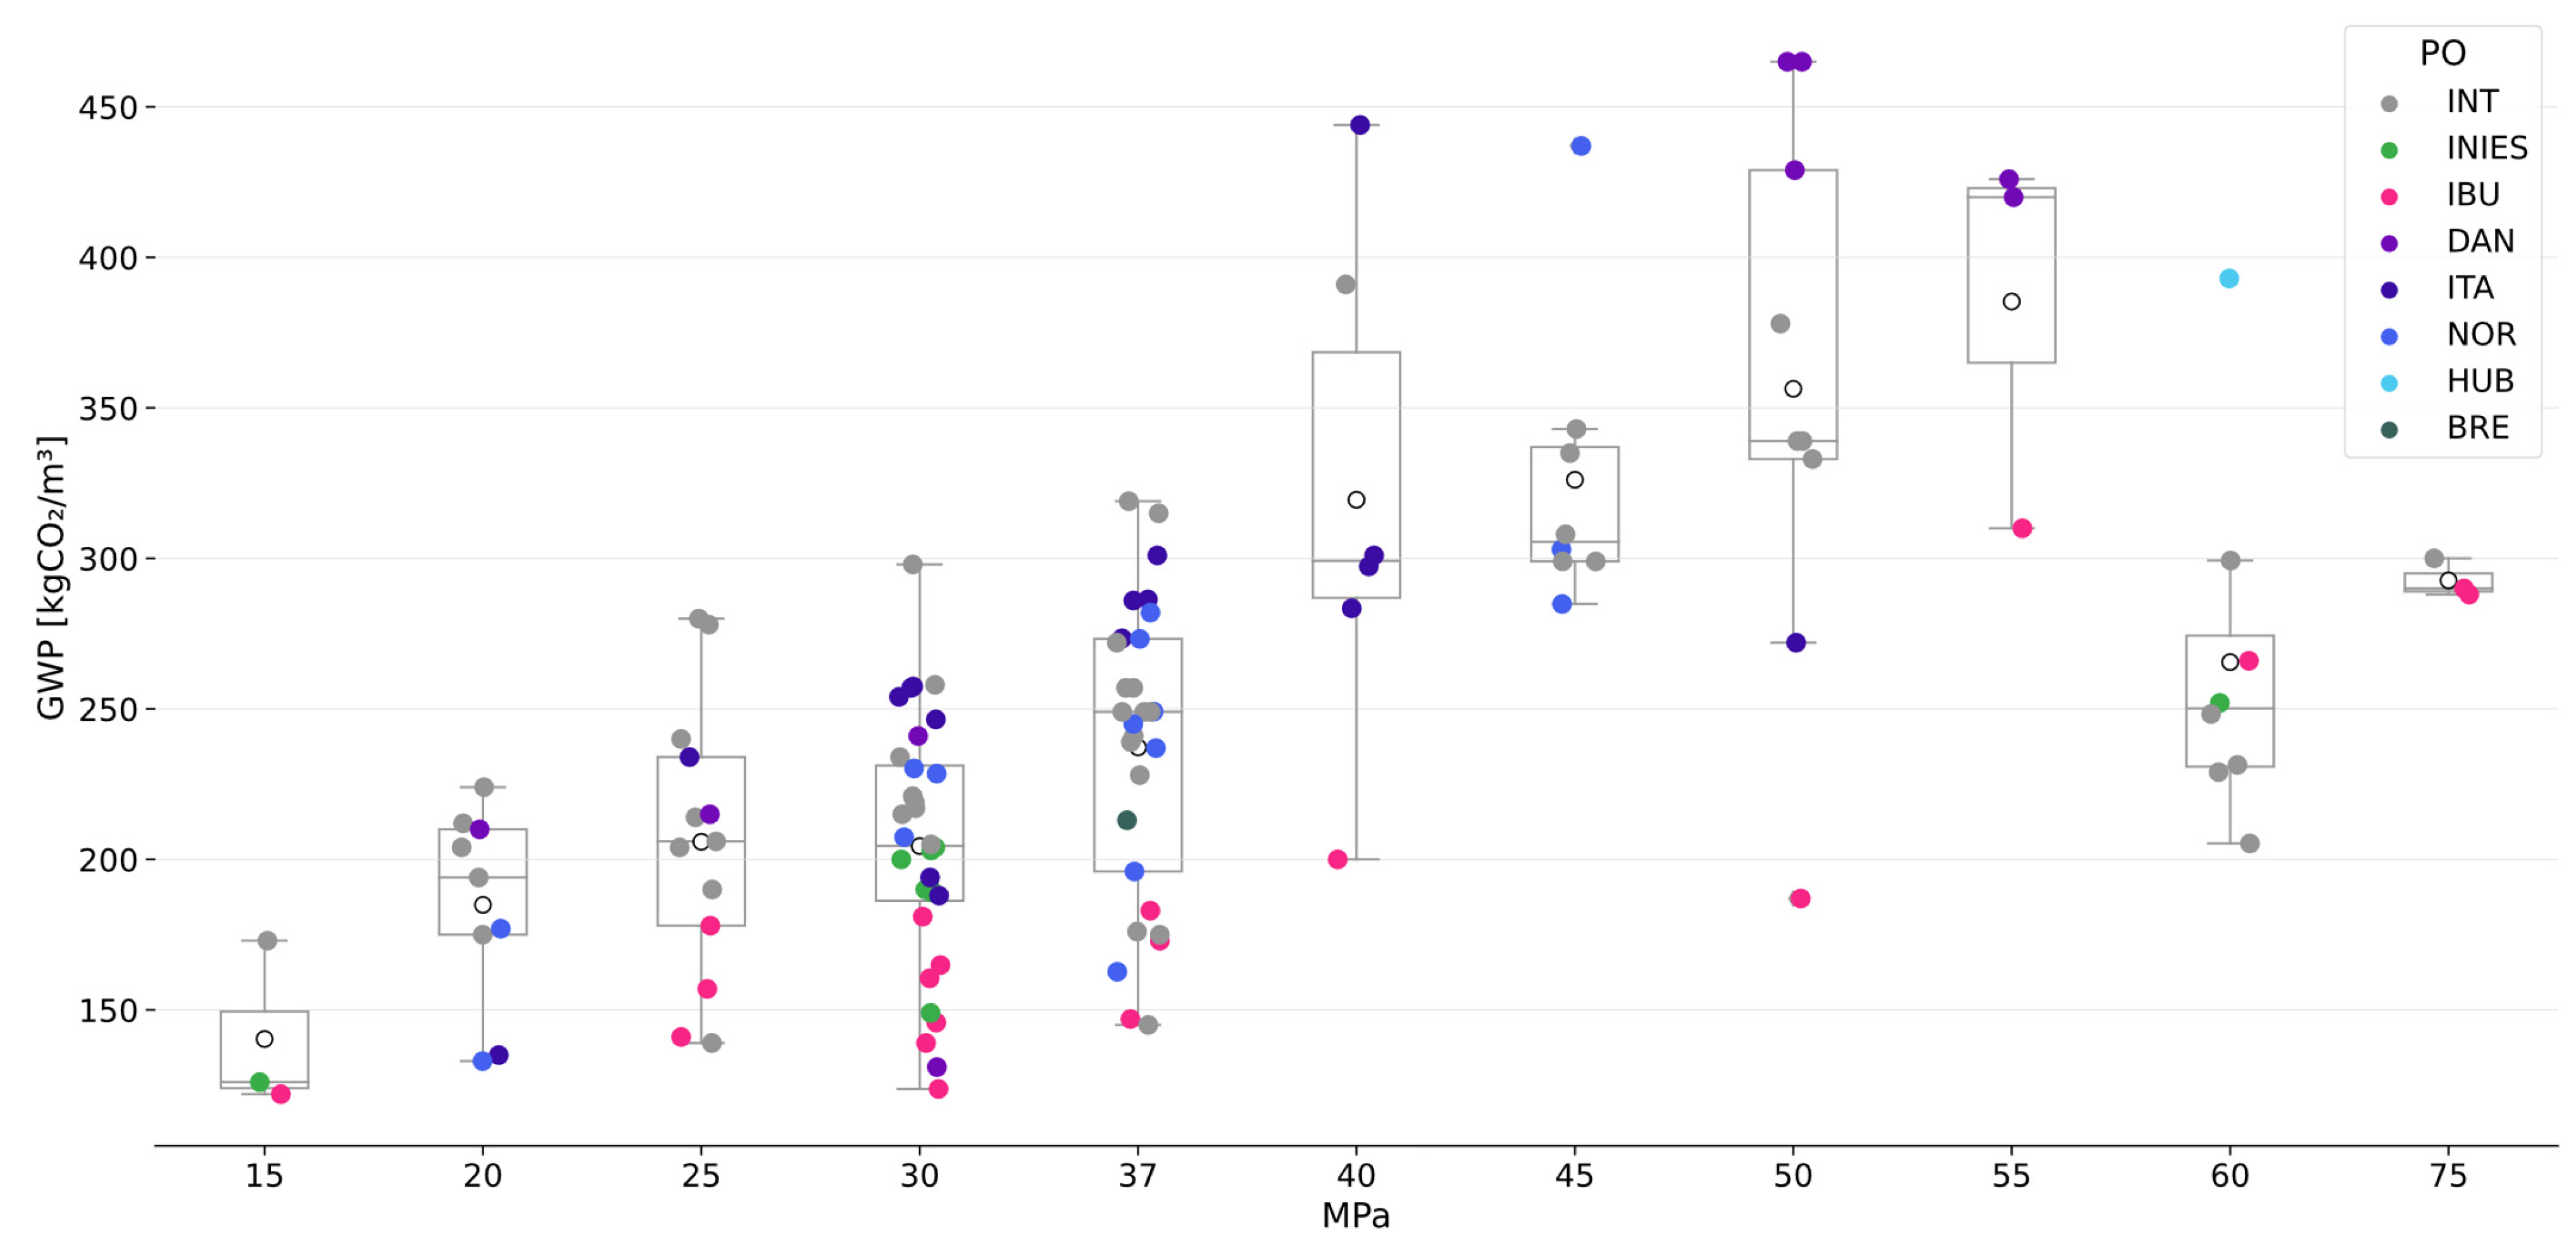
3.3. Concrete
3.4. Cement
3.5. Natural Stones
3.6. Structural Steel
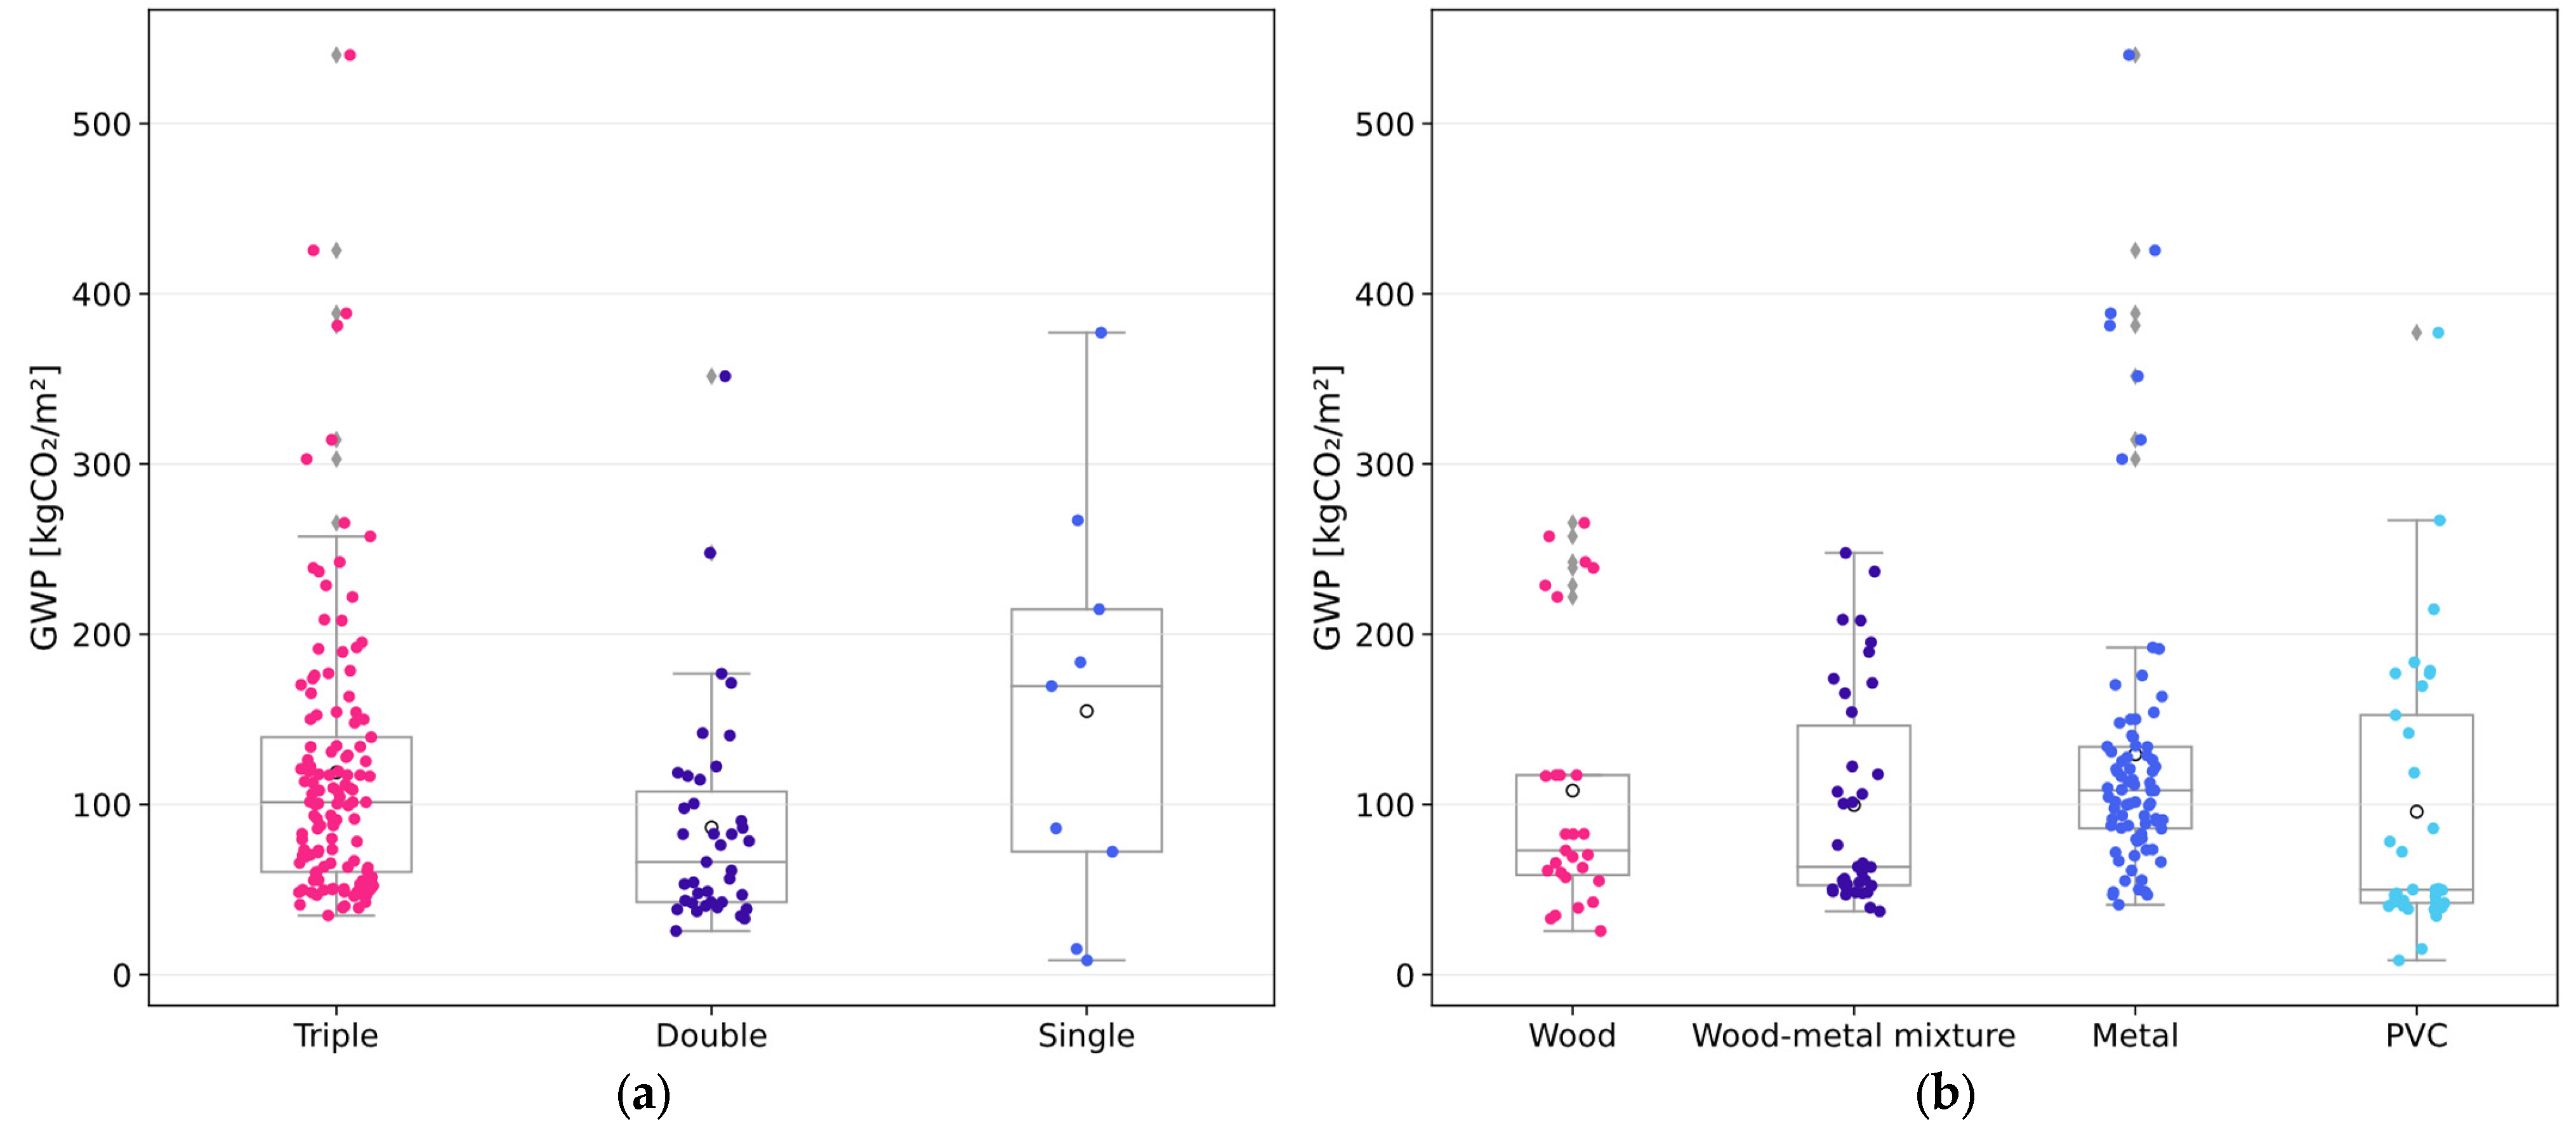
3.7. Windows
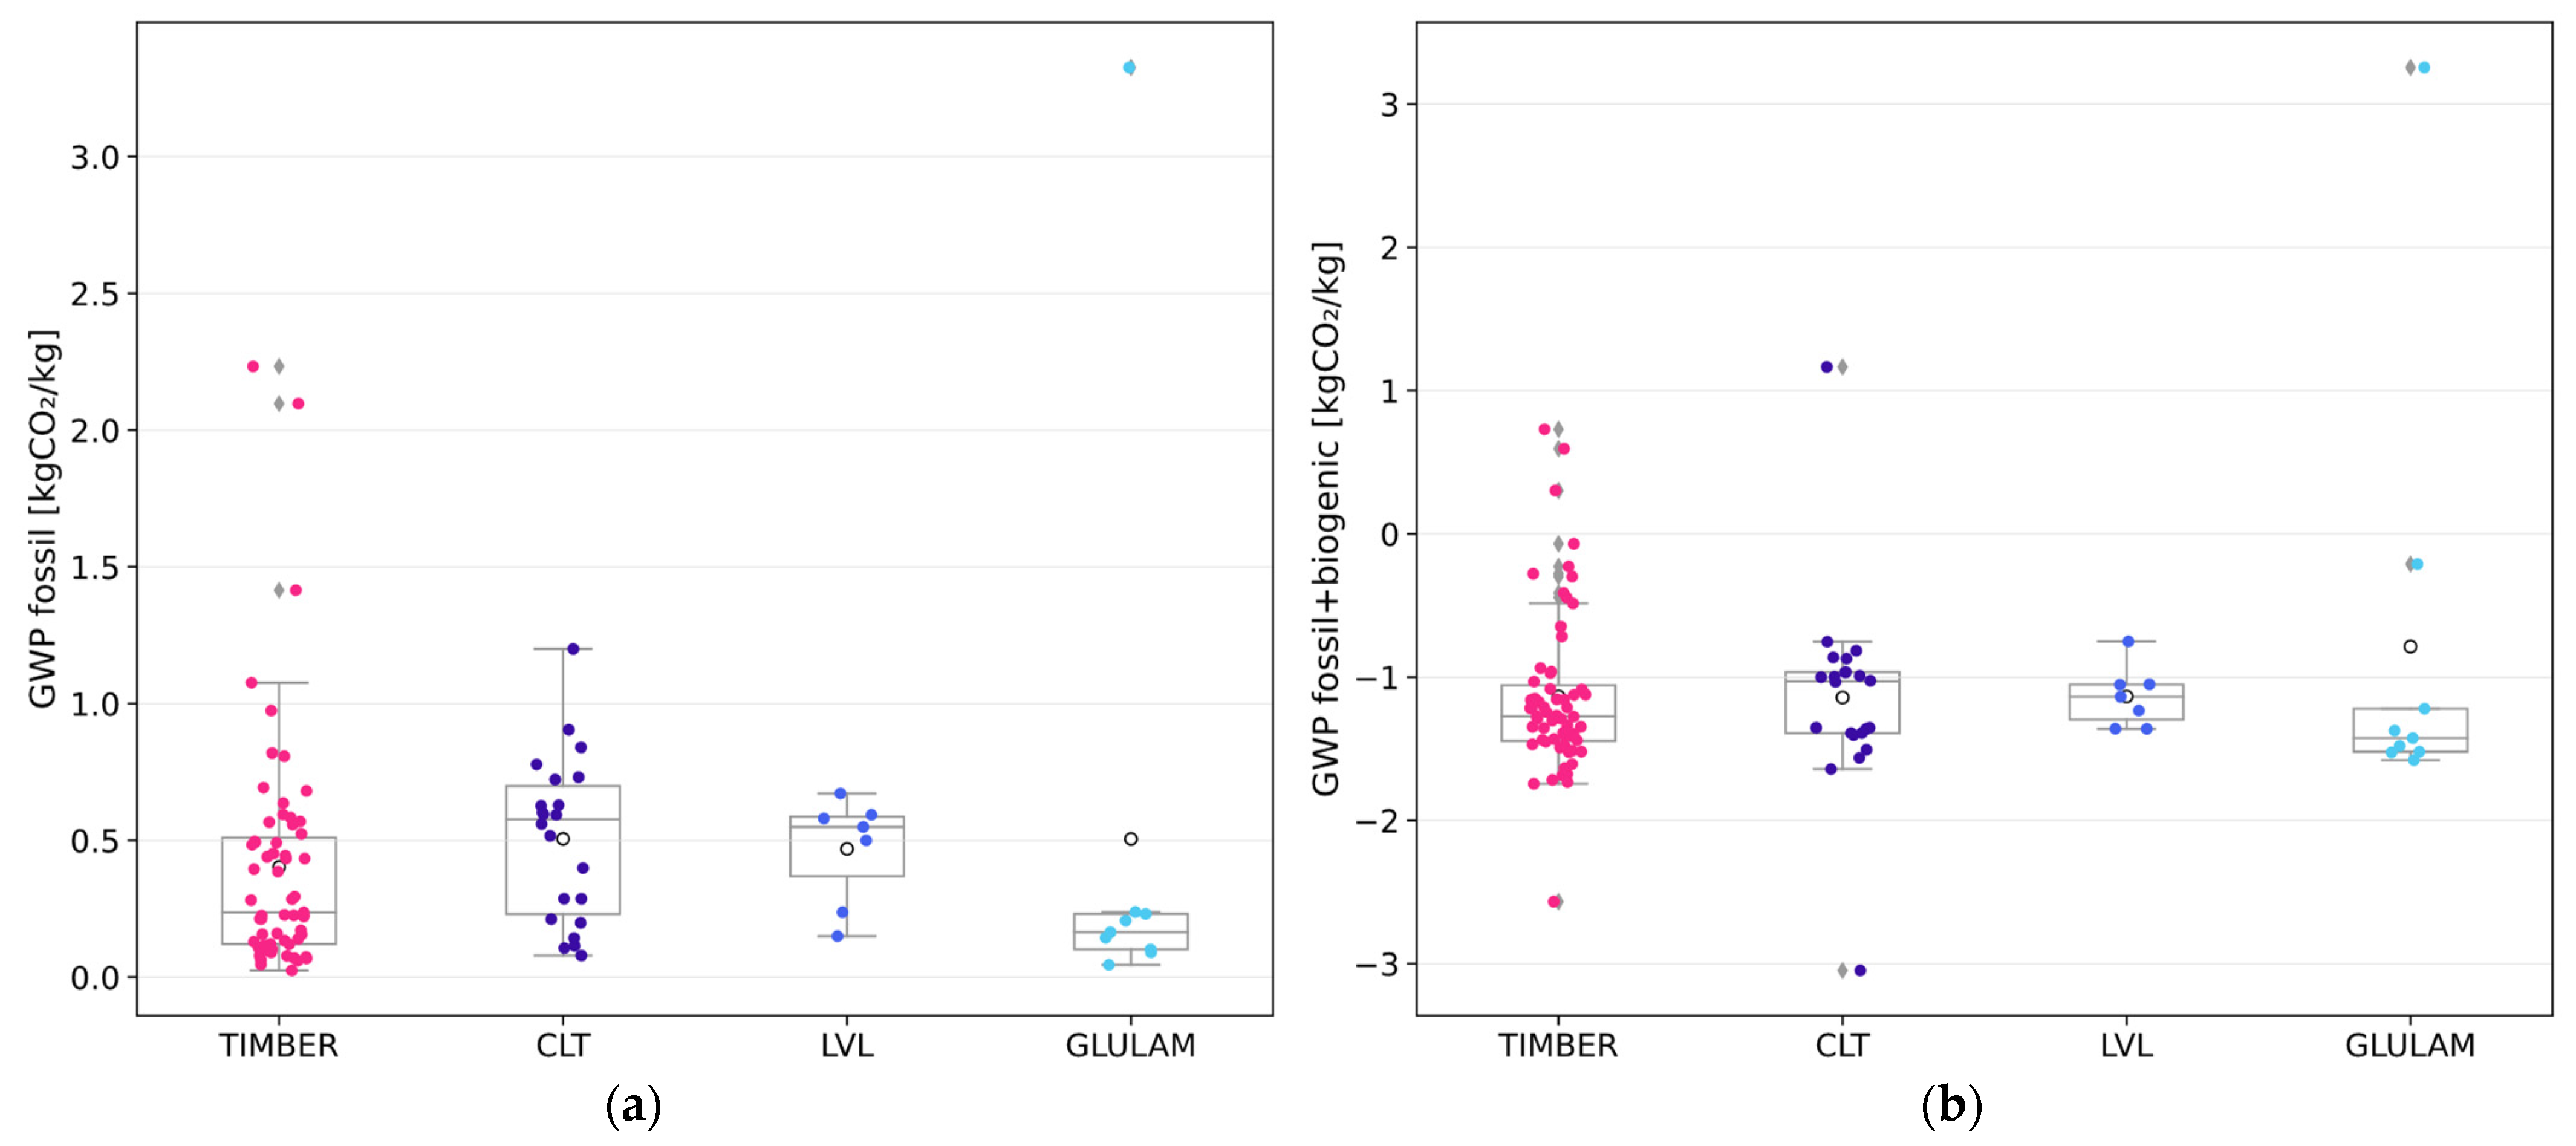
3.8. Wood
3.9. Photovoltaic Panels
3.10. Heat Pumps
4. Discussion
- Determine the reference mean or median values for different product categories;
- Define reference thresholds for lower and upper interquartile ranges representing over- and under-performant construction products from an environmental perspective;
- Individuate possible outliers (e.g., minimum or maximum thresholds and values that fall above or below box plot whiskers).
5. Conclusions
Author Contributions
Funding
Data Availability Statement
Conflicts of Interest
Abbreviations
| BOF | Blast Oxygen Furnace |
| CLT | Cross-Laminated Timber |
| EAF | Electric Arc Furnace |
| EoL | End of Life |
| EPDs | Environmental Product Declarations |
| EPS | Expanded Polystyrene |
| FU | Functional Unit |
| Glulam | Glued Laminated Timber |
| GWP | Global Warming Potential (100 years) |
| LCA | Life Cycle Analysis or Assessment |
| LVL | Laminated Veneer Lumber |
| NRSF | Non-Renewable Secondary Fuels |
| PCR | Product Category Rules |
| PENRE | Total Non-Renewable Primary Energy, Energy Carriers |
| PENRM | Total Non-Renewable Primary Energy, Materials |
| PENRT | Total Non-Renewable Primary Energy |
| PERE | Total Renewable Primary Energy, Energy Carriers |
| PERM | Total Renewable Primary Energy, Materials |
| PERT | Total Renewable Primary Energy |
| PET | Total Primary Energy Requirement (PERT + PENRT + RSF + NRSF) |
| PETE | Total Primary Energy Requirement, Energy Carriers (PERE + PENRE + RSF + NRSF) |
| PO | Program Operator(s) |
| PV | Photovoltaic Panels |
| RSF | Renewable Secondary Fuels |
| SW | Stone Wool |
| WP | Peak Power |
References
- United Nations Environment Programme. Global Status Report for Buildings and Construction: Beyond Foundations - Mainstreaming Sustainable Solutions to Cut Emissions from the Buildings Sector. 2023. Available online: www.unep.org (accessed on 13 January 2025).
- United Nations Environment Programme. Global Status Report for Buildings and Construction: Towards a Zero-Emission, Efficient and Resilient Buildings and Construction Sector. 2022. Available online: www.unep.org (accessed on 13 January 2025).
- Economidou, M.; Todeschi, V.; Bertoldi, P.; D’Agostino, D.; Zangheri, P.; Castellazzi, L. Review of 50 years of EU Energy Efficiency Policies for Buildings. Energy Build. 2020, 225, 110322. [Google Scholar] [CrossRef]
- European Parliament and Council Directive 2010/31/EU of the European Parliament and of the Council of 19 May 2010 on the Energy Performance of Buildings. Available online: https://eur-lex.europa.eu/eli/dir/2010/31/oj/eng (accessed on 16 January 2025).
- Norouzi, M.; Haddad, A.N.; Jiménez, L.; Hoseinzadeh, S.; Boer, D. Carbon Footprint of Low-Energy Buildings in the United Kingdom: Effects of Mitigating Technological Pathways and Decarbonization Strategies. Sci. Total Environ. 2023, 882, 163490. [Google Scholar] [CrossRef] [PubMed]
- Asdrubali, F.; Ballarini, I.; Corrado, V.; Evangelisti, L.; Grazieschi, G.; Guattari, C. Energy and Environmental Payback Times for an NZEB Retrofit. Build. Environ. 2019, 147, 461–472. [Google Scholar] [CrossRef]
- Asdrubali, F.; Grazieschi, G. Life Cycle Assessment of Energy Efficient Buildings. Energy Rep. 2020, 6, 270–285. [Google Scholar] [CrossRef]
- Cusenza, M.A.; Guarino, F.; Longo, S.; Cellura, M. An Integrated Energy Simulation and Life Cycle Assessment to Measure the Operational and Embodied Energy of a Mediterranean Net Zero Energy Building. Energy Build. 2022, 254, 111558. [Google Scholar] [CrossRef]
- Asdrubali, F.; Baggio, P.; Prada, A.; Grazieschi, G.; Guattari, C. Dynamic Life Cycle Assessment Modelling of a NZEB Building. Energy 2020, 191, 116489. [Google Scholar] [CrossRef]
- Asdrubali, F.; Fronzetti Colladon, A.; Segneri, L.; Gandola, D.M. LCA and Energy Efficiency in Buildings: Mapping More than Twenty Years of Research. Energy Build. 2024, 321, 114684. [Google Scholar] [CrossRef]
- Röck, M.; Saade, M.R.M.; Balouktsi, M.; Rasmussen, F.N.; Birgisdottir, H.; Frischknecht, R.; Habert, G.; Lützkendorf, T.; Passer, A. Embodied GHG Emissions of Buildings—The Hidden Challenge for Effective Climate Change Mitigation. Appl. Energy 2020, 258, 114107. [Google Scholar] [CrossRef]
- Papadaki, D.; Nikolaou, D.A.; Assimakopoulos, M.N. Circular Environmental Impact of Recycled Building Materials and Residential Renewable Energy. Sustainability 2022, 14, 4039. [Google Scholar] [CrossRef]
- Trancone, G.; Policastro, G.; Spasiano, D.; Race, M.; Parrino, F.; Fratino, U.; Fabbricino, M.; Pirozzi, F. Treatment of Concrete Waste from Construction and Demolition Activities: Application of Organic Acids from Continuous Dark Fermentation in Moving Bed Biofilm Reactors. Chem. Eng. J. 2025, 505, 159536. [Google Scholar] [CrossRef]
- IPCC Climate Change 2021: The Physical Science Basis. Contribution of Working Group I to the Sixth Assessment Report of the Intergovernmental Panel on Climate Change; Cambridge University Press: Cambridge, UK; New York, NY, USA, 2021. [Google Scholar]
- Otero, M.S.; Garnica, T.; Montilla, S.; Conde, M.; Tenorio, J.A. Analysis of Sectoral Environmental Product Declarations as a Data Source for Life Cycle Assessment. Buildings 2023, 13, 3032. [Google Scholar] [CrossRef]
- 15804:2012+A1:2013; Sustainability of Construction Works—Environmental Product Declarations - Core Rules for the Product Category of Construction Products. European Committee for Standardization (CEN): Brussels, Belgium, 2013.
- EN 15804+A2:2019; Sustainability of Construction Works—Environmental Product Declarations - Core Rules for the Product Category of Construction Products. European Committee for Standardization (CEN): Brussels, Belgium, 2019.
- Anderson, J.; Moncaster, A. Embodied Carbon, Embodied Energy and Renewable Energy: A Review of Environmental Product Declarations. Proc. Inst. Civ. Eng. -Struct. Build. 2023, 176, 986–997. [Google Scholar] [CrossRef]
- ECO Platform AISBL ECO Platform. Available online: www.eco-platform.org (accessed on 15 January 2025).
- Blagoeva, D.; Pavel, C. Competitive Landscape of the EU’s Insulation Materials Industry for Energy-Efficient Buildings; Publications Office of the European Union: Luxembourg, 2018; ISBN 978-92-79-96383-4. [Google Scholar]
- Füchsl, S.; Rheude, F.; Röder, H. Life Cycle Assessment (LCA) of Thermal Insulation Materials: A Critical Review. Clean. Mater. 2022, 5, 100119. [Google Scholar] [CrossRef]
- Grazieschi, G.; Asdrubali, F.; Thomas, G. Embodied Energy and Carbon of Building Insulating Materials: A Critical Review. Clean. Environ. Syst. 2021, 2, 100032. [Google Scholar] [CrossRef]
- Hill, C.; Norton, A.; Dibdiakova, J. A Comparison of the Environmental Impacts of Different Categories of Insulation Materials. Energy Build. 2018, 162, 12–20. [Google Scholar] [CrossRef]
- Pargana, N.; Pinheiro, M.D.; Silvestre, J.D.; de Brito, J. Comparative Environmental Life Cycle Assessment of Thermal Insulation Materials of Buildings. Energy Build. 2014, 82, 466–481. [Google Scholar] [CrossRef]
- EN 1992-1-1:2004; Eurocode 2: Design of Concrete Structures—Part 1-1: General Rules and Rules for Buildings. European Committee for Standardization (CEN): Brussels, Belgium, 2004.
- EN 197-1; Cement—Part 1: Composition, Specifications and Conformity Criteria for Common Cements. European Committee for Standardization (CEN): Brussels, Belgium, 2011.
- World Steel Association Steel. Statistical Yearbook. 2024. Available online: https://worldsteel.org/ (accessed on 13 January 2025).
- Souviron, J.; van Moeseke, G.; Khan, A.Z. Analysing the Environmental Impact of Windows: A Review. Build. Environ. 2019, 161, 106268. [Google Scholar] [CrossRef]
- Asdrubali, F.; Roncone, M.; Grazieschi, G. Embodied Energy and Embodied GWP of Windows: A Critical Review. Energies 2021, 14, 3788. [Google Scholar] [CrossRef]
- Menzies, G.; Wherrett, J. Multiglazed Windows: Potential for Savings in Energy, Emissions and Cost. Build. Serv. Eng. Res. Technol. 2005, 26, 249–258. [Google Scholar] [CrossRef]
- Ramage, M.H.; Burridge, H.; Busse-Wicher, M.; Fereday, G.; Reynolds, T.; Shah, D.U.; Wu, G.; Yu, L.; Fleming, P.; Densley-Tingley, D.; et al. The Wood from the Trees: The Use of Timber in Construction. Renew. Sustain. Energy Rev. 2017, 68, 333–359. [Google Scholar] [CrossRef]
- D’Amico, B.; Pomponi, F.; Hart, J. Global Potential for Material Substitution in Building Construction: The Case of Cross Laminated Timber. J. Clean. Prod. 2021, 279, 123487. [Google Scholar] [CrossRef]
- Rasmussen, F.; Andersen, C.; Wittchen, A.; Hansen, R.; Birgisdóttir, H. Environmental Product Declarations of Structural Wood: A Review of Impacts and Potential Pitfalls for Practice. Buildings 2021, 11, 362. [Google Scholar] [CrossRef]
- Asdrubali, F.; Ferracuti, B.; Lombardi, L.; Guattari, C.; Evangelisti, L.; Grazieschi, G. A Review of Structural, Thermo-Physical, Acoustical, and Environmental Properties of Wooden Materials for Building Applications. Build. Environ. 2017, 114, 307–332. [Google Scholar] [CrossRef]
- EN 16449:2014; Wood and Wood-Based Products—Calculation of the Biogenic Carbon Content of Wood and Conversion to Carbon Dioxide. European Committee for Standardization (CEN): Brussels, Belgium, 2014.
- Asdrubali, F.; Grazieschi, G.; Roncone, M.; Thiebat, F.; Carbonaro, C. Sustainability of Building Materials: Embodied Energy and Embodied Carbon of Masonry. Energies 2023, 16, 1846. [Google Scholar] [CrossRef]
- Christoforou, E.; Kylili, A.; Fokaides, P.A.; Ioannou, I. Cradle to Site Life Cycle Assessment (LCA) of Adobe Bricks. J. Clean. Prod. 2016, 112, 443–452. [Google Scholar] [CrossRef]
- Dabaieh, M.; Heinonen, J.; El-Mahdy, D.; Hassan, D.M. A Comparative Study of Life Cycle Carbon Emissions and Embodied Energy between Sun-Dried Bricks and Fired Clay Bricks. J. Clean. Prod. 2020, 275, 122998. [Google Scholar] [CrossRef]
- Tibrewal, K.; Venkataraman, C.; Phuleria, H.; Joshi, V.; Maithel, S.; Damle, A.; Gupta, A.; Lokhande, P.; Rabha, S.; Saikia, B.K.; et al. Reconciliation of Energy Use Disparities in Brick Production in India. Nat. Sustain. 2023, 6, 1248–1257. [Google Scholar] [CrossRef]
- Soussi, N.; Kriaa, W.; Mhiri, H.; Bournot, P. Reduction of the Energy Consumption of a Tunnel Kiln by Optimization of the Recovered Air Mass Flow from the Cooling Zone to the Firing Zone. Appl. Therm. Eng. 2017, 124, 1382–1391. [Google Scholar] [CrossRef]
- Anderson, J.; Moncaster, A. Embodied Carbon of Concrete in Buildings, Part 1: Analysis of Published EPD. Build. Cities 2020, 1, 198–217. [Google Scholar] [CrossRef]
- Witte, A.; Garg, N. Quantifying the Global Warming Potential of Low Carbon Concrete Mixes: Comparison of Existing Life Cycle Analysis Tools. Case Stud. Constr. Mater. 2024, 20, e02832. [Google Scholar] [CrossRef]
- Barbhuiya, S.; Kanavaris, F.; Das, B.B.; Idrees, M. Decarbonising Cement and Concrete Production: Strategies, Challenges and Pathways for Sustainable Development. J. Build. Eng. 2024, 86, 108861. [Google Scholar] [CrossRef]
- Benhelal, E.; Zahedi, G.; Shamsaei, E.; Bahadori, A. Global Strategies and Potentials to Curb CO2 Emissions in Cement Industry. J. Clean. Prod. 2013, 51, 142–161. [Google Scholar] [CrossRef]
- Aranda Usón, A.; López-Sabirón, A.M.; Ferreira, G.; Llera Sastresa, E. Uses of Alternative Fuels and Raw Materials in the Cement Industry as Sustainable Waste Management Options. Renew. Sustain. Energy Rev. 2013, 23, 242–260. [Google Scholar] [CrossRef]
- Lasvaux, S.; Habert, G.; Peuportier, B.; Chevalier, J. Comparison of Generic and Product-Specific Life Cycle Assessment Databases: Application to Construction Materials Used in Building LCA Studies. Int. J. Life Cycle Assess. 2015, 20, 1473–1490. [Google Scholar] [CrossRef]
- CEMBUREAU The European Cement Association EPD for Cement. Available online: https://cembureau.eu/ (accessed on 14 January 2025).
- Amran, Y.H.M.; Alyousef, R.; Alabduljabbar, H.; El-Zeadani, M. Clean Production and Properties of Geopolymer Concrete; A Review. J. Clean. Prod. 2020, 251, 119679. [Google Scholar] [CrossRef]
- Verma, M.; Dev, N.; Rahman, I.; Nigam, M.; Ahmed, M.; Mallick, J. Geopolymer Concrete: A Material for Sustainable Development in Indian Construction Industries. Crystals 2022, 12, 514. [Google Scholar] [CrossRef]
- Scrivener, K.L.; John, V.M.; Gartner, E.M. Eco-Efficient Cements: Potential Economically Viable Solutions for a Low-CO2 Cement-Based Materials Industry. Cem. Concr. Res. 2018, 114, 2–26. [Google Scholar] [CrossRef]
- Bianco, I.; Blengini, G.A. Life Cycle Inventory of Technologies for Stone Quarrying, Cutting and Finishing: Contribution to Fill Data Gaps. J. Clean. Prod. 2019, 231, 419–427. [Google Scholar] [CrossRef]
- Spooner, S.; Davis, C.; Li, Z. Modelling the Cumulative Effect of Scrap Usage within a Circular UK Steel Industry—Residual Element Aggregation. Ironmak. Steelmak. 2020, 47, 1100–1113. [Google Scholar] [CrossRef]
- Nurdiawati, A.; Zaini, I.N.; Wei, W.; Gyllenram, R.; Yang, W.; Samuelsson, P. Towards Fossil-Free Steel: Life Cycle Assessment of Biosyngas-Based Direct Reduced Iron (DRI) Production Process. J. Clean. Prod. 2023, 393, 136262. [Google Scholar] [CrossRef]
- Citherlet, S.; Di Guglielmo, F.; Gay, J.-B. Window and Advanced Glazing Systems Life Cycle Assessment. Energy Build. 2000, 32, 225–234. [Google Scholar] [CrossRef]
- Akinyele, D.O.; Rayudu, R.K.; Nair, N.K.C. Life Cycle Impact Assessment of Photovoltaic Power Generation from Crystalline Silicon-Based Solar Modules in Nigeria. Renew. Energy 2017, 101, 537–549. [Google Scholar] [CrossRef]
- Galimshina, A.; Hollberg, A.; McCarty, J.; Waibel, C.; Schlueter, A. High-Resolution and Localized Parametric Embodied Impact Calculator of PV Systems. IOP Conf. Ser. Earth Environ. Sci. 2023, 1196, 012014. [Google Scholar] [CrossRef]
- Khan, A.A.; Reichel, C.; Molina, P.; Friedrich, L.; Subasi, D.M.; Neuhaus, H.; Nold, S. Global Warming Potential of Photovoltaics with State-of-the Art Silicon Solar Cells: Influence of Electricity Mix, Installation Location and Lifetime. Sol. Energy Mater. Sol. 2024, 269, 112724. [Google Scholar] [CrossRef]
- Palumbo, E.; Soust-Verdaguer, B.; Llatas, C.; Traverso, M. How to Obtain Accurate Environmental Impacts at Early Design Stages in BIM When Using Environmental Product Declaration. A Method to Support Decision-Making. Sustainability 2020, 12, 6927. [Google Scholar] [CrossRef]
- Passer, A.; Lasvaux, S.; Allacker, K.; De Lathauwer, D.; Spirinckx, C.; Wittstock, B.; Kellenberger, D.; Gschösser, F.; Wall, J.; Wallbaum, H. Environmental Product Declarations Entering the Building Sector: Critical Reflections Based on 5 to 10 Years Experience in Different European Countries. Int. J. Life Cycle Assess. 2015, 20, 1199–1212. [Google Scholar] [CrossRef]


| PO | GWP Values * | Production Country * |
|---|---|---|
| INT | EPS (28), SW (19) | EPS: Italy (10), Greece (10), Sweden (7), Turkey (1) SW: Belgium (3), Croatia (2), Czechia (3), France (1), Germany (1), Italy (2), Serbia (1), Slovakia (2), Slovenia (1), Turkey (2), UK (1) |
| IBU | EPS (28), SW (8) | EPS: Germany (24), Italy (3), Norway (1) SW: Germany (6), Belgium (2) |
| INI | EPS (16), SW (1) | France |
| NOR | EPS (4), SW (8) | Norway |
| BAU | EPS (5), SW (3) | Austria |
| ITA | EPS (6) | Italy |
| IRE | EPS (2), SW (1) | Ireland |
| DAN | EPS (3) | Denmark |
| BRE | EPS (3) | United Kingdom |
| DAPh | SW (1) | Portugal |
| TZUS | EPS (1) | Czech Republic |
| ZAG | EPS (1) | Bosnia Herzegovina |
| PO | N. of EPDs | Production Country | Typology * |
|---|---|---|---|
| DAN | 24 | Denmark | Full bricks |
| IBU | 10 | Germany | Full bricks (8), hollow bricks (1), adobe bricks (1) |
| BRE | 7 | United Kingdom | Full bricks (6), hollow bricks (1) |
| INT | 6 | Czech Republic, Greece, Latvia, Poland, Sweden, Turkey | Full bricks (4), hollow bricks (2) |
| INIES | 3 | France | Hollow bricks |
| ITA | 2 | Italy | Hollow bricks |
| RTS | 2 | Finland | Full bricks |
| ZAG | 2 | Croatia, Slovenia | Hollow bricks |
| MRPI | 1 | The Netherlands | Full bricks |
| IRE | 1 | Ireland | Full bricks |
| BAU | 1 | Austria | Hollow bricks |
| NOR | 1 | Norway | Full bricks |
| PO | GWP Values | Production Country * | Cubic Compression Resistance (MPa) * |
|---|---|---|---|
| INT | 52 | Greece (30), Australia (7), Dubai (5), UK (5), Sweden (3), Turkey (1), Denmark (1) | 15 (1), 20 (5), 25 (8), 30 (8), 37 (14), 40 (1), 45 (5), 50 (4), 60 (5), 75 (1) |
| IBU | 19 | Germany (14), UK (5) | 15 (1), 25 (3), 30 (6), 37 (3), 40 (1), 50 (1), 55 (1), 60 (1), 75 (2) |
| ITA | 17 | Italy (17) | 20 (1), 25 (1), 30 (6), 37 (4), 40 (4), 50 (1) |
| NOR | 15 | Norway (11), Denmark (2), Sweden (1), UK (1) | 20 (2), 30 (3), 37 (7), 45 (3) |
| INI | 9 | France (9) | 15 (1), 30 (7), 60 (1) |
| DAN | 9 | Denmark (9) | 20 (1), 25 (1), 30 (2), 50 (3), 55 (2) |
| BRE | 1 | UK | 37 |
| HUB | 1 | UK | 60 |
| PO | GWP Values | Production Country * | EN 197-1 Type + Strength Class * |
|---|---|---|---|
| ITA | 32 | Italy (32) | CEM I 52.5 (6), CEM I 42.5 (2), CEM II 42.5 (7), CEM II 32.5 (6), CEM III 42.5 (3), CEM IV 42.5 (4), CEM IV 32.5 (4) |
| INT | 16 | Italy (8), Spain (3), Greece (3), Denmark (1), Bulgaria (1) | CEM I 52.5 (3), CEM I 42.5 (4), CEM II 42.5 (2), CEM II 32.5 (1), CEM III 42.5 (4), CEM IV 42.5 (1), CEM IV 32.5 (1) |
| ITB | 5 | Poland | CEM I 42.5 |
| NOR | 4 | Norway (2), Latvia, Lithuania | CEM I 52.5, CEM I 42.5, CEM II 42.5 (2) |
| IRE | 3 | Ireland (3) | CEM I 42.5, CEM I 52.5, CEM II 42.5 |
| MRPI | 2 | The Netherlands | CEM III 42.5 |
| IBU | 1 | Germany | CEM III 42.5 |
| DAPh | 1 | Portugal | CEM II 42.5 |
| PO | GWP Values | Production Country * | Type * |
|---|---|---|---|
| INT | 18 | Italy (9), Sweden (5), Portugal (3), Turkey (1) | Marble (9), granite (7), limestone (2) |
| NOR | 15 | Norway (14), Portugal (1) | Quartzite (8), granite (6), marble (1) |
| RTS | 6 | Finland | Granite (6), basalt (1) |
| BRE | 4 | Portugal (2), UK (2) | Limestone (2), basalt (1), sandstone (1) |
| ITA | 4 | Italy | Porphyry (3), sandstone (1) |
| AEN | 3 | Spain | Marble |
| DAPh | 3 | Portugal | Limestone |
| LOO | 2 | UK | Sandstone |
| IBU | 2 | Germany | Limestone |
| PO | GWP Values | Production Country | Typology * |
|---|---|---|---|
| INT | 25 | Sweden, Italy, Turkey, Poland, Finland, Poland, Latvia, UK, Spain, Greece, Switzerland | Sections (15), rebars (10) |
| IBU | 12 | Luxemburg, Romania, Germany, Spain, Poland, Denmark | Sections (11), rebars (1) |
| NOR | 5 | Norway, Poland | Sections (2), rebars (3) |
| BRE | 3 | United Kingdom | Sections (1), rebars (3) |
| ITA | 2 | Italy | Rebars (2) |
| KIW | 2 | France | Sections (1), rebars (1) |
| SCS | 2 | Spain, Luxemburg | Sections (1) |
| AEN | 1 | Spain | Sections (1) |
| DAN | 1 | Denmark | Sections (1) |
| PO | N. of Wood Products | Typology * | Production Country |
|---|---|---|---|
| INT | 63 | Timber (44), LVL (6), Glulam (1), CLT (12) | Finland (18), United Kingdom (10), Sweden (8), Spain (5), Australia (5), Denmark (4), Latvia (4), Brazil (3), Indonesia (2), Germany (1), Turkey (1), Ukraine (1), Italy (1), New Zealand (1) |
| DAN | 12 | Timber (8), Glulam (2), CLT (2) | Denmark |
| NOR | 10 | Timber (3), Glulam (4), CLT (3) | Norway (5), Sweden (5) |
| IBU | 6 | Timber (2), Glulam (2), CLT (2) | Germany (4), Austria (1), Italy (1) |
| RTS | 3 | Timber (2), CLT (1) | Finland |
| UL + | 3 | Timber (1), LVL (1), Glulam (1) | North America |
| AUS | 3 | Timber (3) | Australia |
| B-EPD + | 1 | CLT (1) | Belgium |
| Product Type | Power (kW) | SCOP | Refrigerant | Weight (kg) | Lifespan (Years) |
|---|---|---|---|---|---|
| Air-to-water monobloc heat pump | 5–14 | 3.24–4.84 | R32 | 165–226 | 17 |
| Air-to-air heat recovery system | 33.5 | 4.49 | R32 | 224 | 22 |
| Air-to-water monobloc heat pump | 5 | 4.65 | R290 | 124.9 | 15 |
| Air-to-water monobloc heat pump with hydraulic unit | 7 | 4.65 | R290 | 160.7 | 15 |
| Air-to-air heat recovery system | 33.5 | 4.49 | R32 | 213 | 22 |
| Heat pump-based heater | 2.85 | - | - | 22.08 | - |
| Chiller and heat pump | 160–315 | 4.13–4.68 | R454B | 1047–2188 | 22 |
| Air-to-water monobloc heat pump | 5–14 | 3.24–4.84 | R32 | 165–226 | 17 |
| Air-to-air heat recovery system | 33.5 | 4.49 | R32 | 224 | 22 |
| Statistics/Classes | EPS 15 | EPS 20 | EPS 25 | EPS 30 | EPS 40 |
|---|---|---|---|---|---|
| Mean ± marginal error | 1.72 ± 6.25% | 2.35 ± 7.71% | 2.68 ± 8.34% | 3.21 ± 6.46% | 4.48 ± 18.84% |
| Median ± marginal error | 1.70 ± 10.56% | 2.26 ± 14.37% | 2.62 ± 14.35% | 3.07 ± 8.88% | 4.28 ± 23.71% |
| Statistics/Classes | Low (11–39 kg/m3) | Medium (48–70 kg/m3) | High (90–110 kg/m3) | Very High (122–150 kg/m3) |
|---|---|---|---|---|
| Mean ± marginal error | 1.15 ± 21.78% | 1.89 ± 42.27% | 3.89 ± 6.73% | 5.02 ± 24.02% |
| Median ± marginal error | 1.13 ± 35.53% | 1.65 ± 44.78% | 3.83 ± 11.75% | 5.02 ± 23.57% |
| Classes/Statistics | Mean GWP (kg CO2/t) | Median GWP (kg CO2/t) | Mean PET (MJ/t) | Median PET (MJ/t) |
|---|---|---|---|---|
| Hollow | 127 ± 22.76% | 101 ± 36.04% | 2314 ± 17.95% | 2170 ± 23.30% |
| Full (fossil-based) | 203 ± 7.59% | 206 ± 7.96% | 3804 ± 13.66% | 3571 ± 5.61% |
| Full (fossil + second firing) | 487 ± 18.56% | 499 ± 10.52% | 7978 ± 11.36% | 8048 ± 6.64% |
| Full (renewable-based) | 147 ± 16.25% | 136 ± 20.66% | 9197 ± 22.79% | 9072 ± 14.00% |
| No baking (adobe, reused) | 10.6 ± 89.78% | 11.2 ± 50.13% | 449 ± 210.71% | 127 ± 383.46% |
| Class | This Study * | Ecoinvent (RER) * | General EPD * |
|---|---|---|---|
| CEM I | 801 (97.5%) | 856 (95–100%) | 803 (92%) |
| CEM II/A | 747 (82%) | 786 (80–94%) | 683 (77%) |
| CEM II/B | 650 (74%) | 658 (65–79%) | |
| CEM III/A | 536 (55%) | 533 (45–64%) | 526 (44%) |
| CEM III/B | 347 (37%) | 370 (20–44%) | |
| CEM III/C | Not significant | 260 (5–19%) |
| Classes/Statistics | Mean GWP ± Marginal Error (90%) | Median GWP ± Marginal Error (90%) |
|---|---|---|
| EAF—Sections | 556 ± 14.50% | 558 ± 18.46% |
| BOF—Sections | 2522 ± 4.84% | 2530 ± 2.35% |
| EAF—Rebars | 487 ± 13.61% | 458 ± 15.72% |
| EAF—Green | 384 ± 18.72% | 347 ± 14.48% |
| EAF—Fossil | 566 ± 10.62% | 558 ± 11.38% |
| Frame Material Glazing | Average GWP/m2 | Dev. Standard GWP/m2 | U-Value W/(m2K) |
|---|---|---|---|
| Metals | 129.4 | 89.91 | 1.5 |
| 113.4 | 87.91 | 1.9 |
| 131.8 | 90.58 | 1.5 |
| Wood | 108.2 | 77.65 | 1.0 |
| 70.5 | 34.63 | 1.2 |
| 118.9 | 83.62 | 0.9 |
| Wood–metals | 94.4 | 70.53 | 1.0 |
| 92.4 | 65.43 | 1.2 |
| 95.2 | 73.57 | 1.0 |
| PVC | 95.8 | 83.52 | 1.1 |
| 154.9 | 122.04 | 0.8 |
| 66.6 | 49.41 | 1.4 |
| 80.6 | 54.65 | 1.0 |
| Product Category | Mean Density (kg/m3) | Mean GWP Fossil (kg CO2/kg) | Mean GWP Biogenic (kg CO2/kg) | Mean PERE + RSF (MJ/kg) | Mean PENRE + NRSF (MJ/kg) | Mean PERM (MJ/kg) | Mean PENRM (MJ/kg) |
|---|---|---|---|---|---|---|---|
| CLT | 453.91 | 0.506 | −1.142 | 23.16 | 2.36 | 9.11 | 4.05 |
| Glulam | 470.78 | 0.505 | −0.787 | 19.33 | 7.34 | 13.55 | 1.70 |
| LVL | 531.43 | 0.469 | −1.135 | 35.17 | 10.61 | 14.28 | 2.32 |
| Timber | 524.76 | 0.403 | −1.134 | 36.60 | 8.15 | 20.15 | 0.31 |
| EPD Title (Heat Pump Model) | FU | GWP/FU (kg CO2eq) | Mean PET (MJ/FU) |
|---|---|---|---|
| PUZ-WM Series | 1 combined unit | 41,362 | 914,900 |
| VRV 5 Heat Recovery Outdoor Unit | 1 kW of heating/cooling | 2940 | 87,800 |
| aroTHERM plus (5 kW) | 1 unit of heat pump system | 730 | 5345 |
| aroTHERM plus (7 kW) | 1 unit of heat pump system | 921 | 10,693 |
| FJ4 Fan Coil Indoor Unit and 38MURA Heat Pump Outdoor | 1 kWh of thermal energy | 6210 | 127,000 |
| PowerKon LT—size 3 | 1 unit of heat pump system | 132 | 1833 |
| VLS 160—315 KW | Cooling 250 kW over 22 years with standard conditions | 289,617 | 1,620,903 |
Disclaimer/Publisher’s Note: The statements, opinions and data contained in all publications are solely those of the individual author(s) and contributor(s) and not of MDPI and/or the editor(s). MDPI and/or the editor(s) disclaim responsibility for any injury to people or property resulting from any ideas, methods, instructions or products referred to in the content. |
© 2025 by the authors. Licensee MDPI, Basel, Switzerland. This article is an open access article distributed under the terms and conditions of the Creative Commons Attribution (CC BY) license (https://creativecommons.org/licenses/by/4.0/).
Share and Cite
Asdrubali, F.; Grazieschi, G.; Gandola, D.M. The Role of Environmental Product Declarations in the Decarbonization of Building Materials and Components. Energies 2025, 18, 1308. https://doi.org/10.3390/en18051308
Asdrubali F, Grazieschi G, Gandola DM. The Role of Environmental Product Declarations in the Decarbonization of Building Materials and Components. Energies. 2025; 18(5):1308. https://doi.org/10.3390/en18051308
Chicago/Turabian StyleAsdrubali, Francesco, Gianluca Grazieschi, and Dante Maria Gandola. 2025. "The Role of Environmental Product Declarations in the Decarbonization of Building Materials and Components" Energies 18, no. 5: 1308. https://doi.org/10.3390/en18051308
APA StyleAsdrubali, F., Grazieschi, G., & Gandola, D. M. (2025). The Role of Environmental Product Declarations in the Decarbonization of Building Materials and Components. Energies, 18(5), 1308. https://doi.org/10.3390/en18051308