Abstract
In recent years, packed-bed systems for large-scale applications have emerged as a highly promising design for Thermal Energy Storage systems because of their high thermal efficiency and economic feasibility. Large-scale application systems typically include packed-bed thermal energy stores as essential components, enabling effective integration with renewable energy and processed heat. The packed-bed systems investigated in this paper utilise Magnesia as the storage medium and optimised parameters, which have previously been identified through research involving charging and discharging cycles of both the hot and cold storage systems when air is the heat transfer fluid. This includes solid particle diameters of 0.004 m, a material porosity of 0.2, an aspect ratio of 1 for the storage tank, and a mass flow rate of 13.7 kg/m3. This paper aims to present a comparative analysis of the influence of alternative heat transfer gases, namely air, argon, carbon dioxide, helium, hydrogen, and nitrogen, on the performance of Pumped Thermal Energy Storage hot and cold storage systems. The performance of the six gases in the storage system was evaluated using an axisymmetric model simulated with COMSOL Multiphysics 5.6 software, with the total energy stored and the capacity factor serving as key performance indicators. The results revealed that carbon dioxide gas was the most promising heat transfer fluid and that the packed bed could be operated efficiently over 72% and 76% of its range for hot and cold systems, respectively. Hydrogen, nitrogen, and air performed similarly but less adequately than carbon dioxide and had operating ranges of 55% and 75% for hot and cold storage. Helium and argon had the poorest performance, with optimal charging and discharging rates corresponding to 50% and 66%.
Keywords:
packed bed; PTES; thermal energy; capacity factor; thermal power; HTF; performance; COMSOL 1. Introduction
Energy storage is crucial for balancing energy demand and intermittent renewable generation. The increase in renewable energy deployment is driven by efforts to reduce greenhouse gas emissions and enhance energy security. According to the International Energy Agency (IEA), renewable sources generated 29% of global electricity in 2020 [1,2]. This percentage is expected to increase to 49% by 2030 [3,4]. To address the intermittency of renewable energy technologies, such as solar and wind power, Thermal Energy Storage systems (TESs) will be essential [4]. TESs also have applications in waste heat recovery.
The storage of thermal energy can be classified into three distinct methods, each tailored for specific applications.
Sensible heat storage (SHS) is a widely used technique which stores and releases thermal energy by varying the temperature of a medium without changing its phase. In this method, temperature changes occur linearly with the amount of heat stored, depending on the specific heat capacity of the material. Traditional SHS systems commonly utilise water storage tanks. Latent heat storage (LHS) involves the energy absorbed or released during a phase transition. This method is generally applied in low-temperature settings, using phase-change materials selected based on the temperature requirements. Thermochemical energy storage employs reversible chemical reactions to facilitate the storage and release of thermal energy. This approach is characterised by its high energy density and versatility across various contexts [2].
Packed beds have applications in a range of thermal systems, such as the storage of renewable solar energy, industrial waste heat recovery, and geothermal energy [5] and can be more compact and cost-effective and compact compared to alternative storage systems. In addition, depending on the storage medium and heat transfer fluid (HTF) used, packed beds often utilise more abundant, locally sourced, environmentally friendly, and non-reactive materials than other storage technologies [6].
As illustrated in Figure 1, the PBSS system has three main components: a storage vessel (container), storage media (filler), and heat transfer fluid (HTF). The storage vessel is filled with solid packing material known as the “filler”. These solid particles receive energy through an HTF, which may also function as the working fluid within the system that incorporates the packed bed. Various packed-bed designs can be found in numerous publications [7,8,9,10], showcasing differences in shape, the materials used for storage, and the HTF employed.
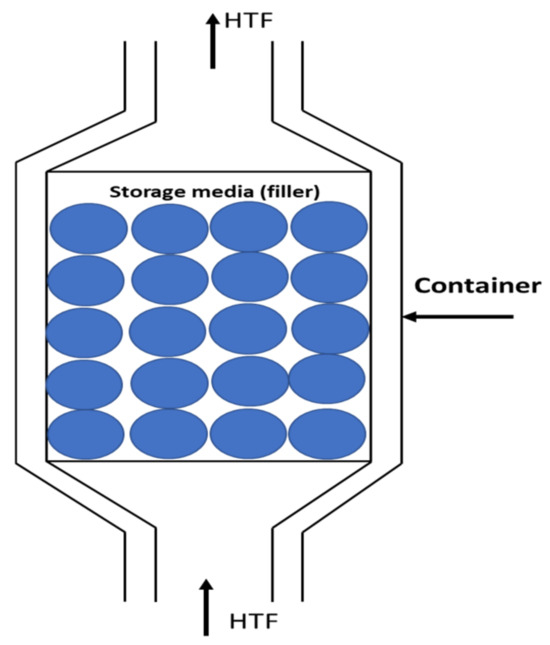
Figure 1.
Packed-bed main components [6].
Storage units are typically cylindrical, with the HTF flowing along the axis. These packed beds are classified as sensible heat storage (SHS) because energy is stored by changing the temperature of the filler material. An alternative approach could involve using latent heat storage systems with phase-change materials [11], but this may lead to higher costs and increased system complexity [12,13]. HTFs can be gases, such as air, carbon dioxide, or argon [14], or they can be liquids, like thermal oils [15] or molten salts [16].
Several applications of thermal energy storage have proposed the utilisation of packed-bed storage systems (PBSSs). These applications include Pumped Thermal Energy Storage (PTES) [1,2,3,4,5], Advanced-Adiabatic Compressed-Air Energy Storage (AA-CAES) [6,7], and Liquid Air Energy Storage (LAES) [4], specifically for large-scale systems.
Packed-bed thermal tanks are an essential component of the Pumped Thermal Energy Storage (PTES) system, which is an emerging technology for industrial applications [17,18,19]. Since this technology is not yet commercially available and requires further research [19,20,21], optimising the design of the packed bed—both hot and cold—is essential for enhancing the overall PTES system. This optimisation can also contribute valuably to the existing literature in this area.
Pumped Thermal Energy Storage (PTES) is a promising technology for large-scale energy storage. Compared to other thermal energy storage methods, PTES provides high round-trip efficiency (RTE), substantial capacity, a lifespan of up to 30 years, short response times [2,3,4], and quick start-up times [5,6]. Additionally, PTESs are environmentally friendly and have a smaller carbon footprint compared to other large-scale energy storage technologies, such as Compressed Air Energy Storage (CAES) and Pumped Hydro Energy Storage Systems (PHES) [6,7]. Moreover, PTES can achieve reasonable round-trip efficiencies of up to 70% and competitive energy and power densities at affordable costs, as shown in Table 1.

Table 1.
A comparison of the most promising TES technologies: PTES, PHES, and CAES systems [22].
The PTES system consists of five main components: two storage tanks where the PTES stores the electrical energy as thermal energy, a heat pump, a heat engine, and a motor or generator [2]. Figure 2 illustrates the traditional configuration of the PTES.
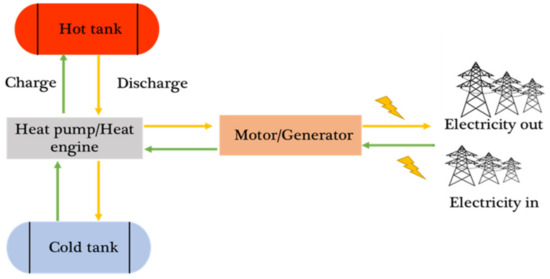
Figure 2.
The conventional layout of PTES and its main components for charging (green) and discharging (yellow) [2].
The charging cycle involves a heat pump that uses electrical energy to move heat from a low-temperature reservoir (cold tank) to a high-temperature reservoir (hot tank). Electricity is generated during discharge by a heat engine, using the thermal energy stored in the reservoirs. While leakage losses typically do not affect large systems, the storage tanks are designed with insulation to minimise heat loss during storage [23].
It is important to note that sensible heat storage is the simplest and most cost-effective method for storing thermal energy. While there are some advantages to phase-change energy storage, due to these technological and economic factors, sensible heat storage tends to be more suitable and appealing for large-scale energy storage systems compared to phase-change energy storage [22].
1.1. Literature Review and Research Gap
Desrues et al. [24] investigated a system utilising the Brayton cycle with argon gas in HTF, aiming to develop PTESs for large-scale applications using MATLAB programming. An RTE of 66.7% was achieved; however, this required a maximum temperature of 1000 °C, which exceeds the current compressor’s operating temperature of approximately 900 K. Adding a second electrical heater can partially mitigate this limitation. Howes [25] analysed the heat transfer mechanisms and losses associated with three PTES prototypes using mathematical modelling, where reciprocating devices replaced conventional compressor/turbine pairs. Furthermore, White et al. [26] used the numerical analysis to explore how the geometry of storage tanks, operational modes, and temperature variations impact thermodynamic losses, noting that long-term storage results in considerable losses, while intermittent operation generates manageable losses.
Furthermore, numerous researchers have refined the system’s configuration through the thermodynamic numerical analyses of packed-bed effects, incorporating buffer vessels and characterising energy loss and generation mechanisms [1,3,27,28,29]. Wang suggested a method for transient analysis, as outlined by Wang et al. [30], who studied the influence of numerous factors and contrasted systems involving helium and argon. Helium demonstrated a higher RTE, as determined by the study, with energy storage performance increasing at isentropic conditions and higher pressure ratios. Charging was achieved using an electric heater in a plant developed by Benato et al. [22,31,32]. Furthermore, a one-dimensional, two-phase packed-bed model was developed to evaluate the performance of nine heat storage materials with two heat transfer fluids.
Ge et al. [17] utilised MATLAB to construct an analytical model of a 10.5 MW, 5 h packed-bed latent heat/cold storage system. The study conducted an energy and exergy analysis of various components. It also investigated whether packed-bed latent heat or cold storage systems could effectively replace packed-bed sensible heat or cold storage systems in pumped thermal electricity storage. The research systematically evaluated thermodynamic performance under optimal conditions by analysing the effects of porosity, compression ratios, inlet velocities, and isentropic efficiency. The findings revealed that replacing latent heat and cold storage with packed-bed sensible heat and cold storage could increase the energy storage density of the system from 232.5 kWh/m3 to 245.4 kWh/m3. Furthermore, this new system achieved a round-trip efficiency of 84.7% and a power density of 216.5 kW/m3, demonstrating its competitiveness and efficiency compared to large-scale electrical energy storage systems.
A novel PTES system integrated with a CSP was presented and evaluated by Petrollese et al. [19]. The system incorporated the same working fluid (argon) as the CSP, allowing for both the simultaneous and independent operation of its various components. The Thermal Energy Storage (TES) system is made up of three packed-bed tanks that utilise thermoclines. In this research, the functioning PTES-CSP plant that integrates TES tanks was simulated in MATLAB, employing particular mathematical models under standard conditions.
A research study was carried out to examine how the primary design parameters of TESs, such as operating temperatures and pressure ratios, influence the main performance metrics. It was determined that a pressure ratio of roughly 5:2 is ideal for maximising the exergetic round-trip efficiency of the integrated system. Consequently, an effective PTES-CSP system was established, achieving an exergetic round-trip efficiency of about 60% [19].
Table 2 and Table 3 show a summary of different packed-bed systems in the literature and in operations, respectively.

Table 2.
Summary of the different packed-bed systems outlined in the literature.

Table 3.
Packed-bed application to date.
1.2. Research Novelty and Research Structure
In previous work, studies have used a single HTF and focused on other aspects of the design and operation of the packed-bed storage system.
Rabi et al. [6] used air as the HTF and performed a study to determine optimal parameters for the storage system. This study suggests using Magnesia as the packed-bed particles with a diameter of 0.004 m and a porosity of 0.2 with a mass flow rate of 13.7 kg/m3, along with an aspect ratio of 1. These values were used in the study presented here.
Alva et al. [7] presented a review of storage systems for solar applications. Here, the focus, aligning with the majority of work in this area, focused on considering different storage materials for both SHS and LHS. It identified air as being a common HTF but did not consider comparisons between different fluids.
Meier et al. [45] investigated rock bed storage systems using air as the HTF and focused on the properties and performance of the storage without considering alternative HTFs. Similarly, the work of White et al. [1] focused on the storage system and only considered a single HTF: argon.
Other studies have also considered only a single HTF. For gas-based systems, this is typically air or argon, but there has been no consideration of the effect the HTF has on the operation and performance of the packed-bed storage system. Here, we present an analysis using six different HTFs, air, argon, carbon dioxide, helium, hydrogen, and nitrogen, to investigate and analyse how the different gases affect the performance and operation of the packed-bed system.
2. Model Set-up and Methodology
A cylindrical model with 2D axisymmetric has been developed for a fully insulated tank positioned with its axis vertical. This model uses a porous media formulation available in COMSOL 5.6.
COMSOL Multiphysics is a high-performance software package suitable for simulating a range of physical processes, including fluid flow through porous materials and heat transfer phenomena. Its strength lies in its ability to combine various physics models to simulate complex multiphysics systems. Considering the specific requirements and preferences of this simulation project, COMSOL has been chosen.
A predefined triangular mesh has been employed to discretise the geometry of the model. The nine available mesh options in COMSOL were evaluated [6] for the physical model used in this study using air as the HTF. The temperature was recorded at three different heights within the packed bed at 0.5 m, 1.5 m, and 3.5 m following an 8 h charging cycle with a time step of 0.2 s. The results indicate that the three finest mesh options (referred to as Finer, Extra Fine and Extremely Fine) all produce comparable results with variation of no more than 3%. Here, we used the Extra Fine option.
The boundary conditions set included a no-slip wall where the velocity was zero at the solid surfaces (. At the inlet, a condition of fully developed flow was established with a constant volume flow rate ( m3/s), while a pressure condition was applied at the outlet to avoid backflow. Adiabatic boundary conditions were used at the outer boundary of the insulating material (). The simulation examines incompressible fluid flow with operational pressures of 10.5 bar for the hot-storage reservoir and 1.05 bar for the cold-storage reservoir. The boundary conditions are shown in Figure 3.
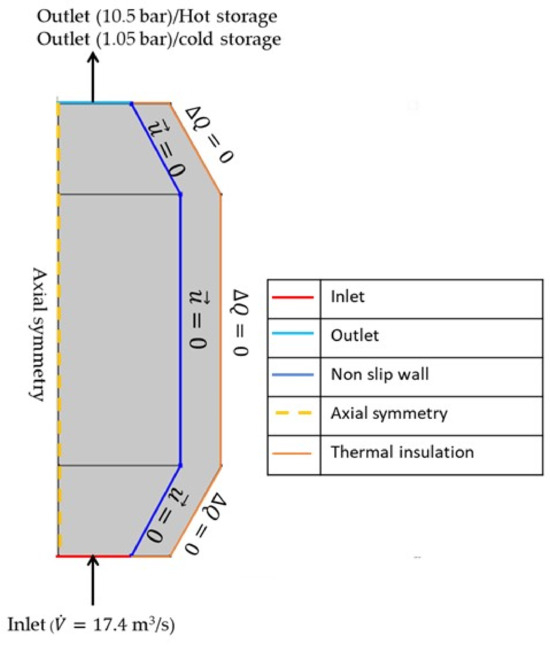
Figure 3.
The boundary conditions employed in the axisymmetric modelling.
The classification of the flow regime in a packed bed is determined by the bed’s Reynolds number, which was computed using the size of the particles shown in Equation (1):

Table 4.
The fluid-flow regime based on the Reynold number.
In this study, Re = 352.4 and the flow is fully turbulent. This is simulated within COMSOL using the Brinkman equation with a turbulent viscosity based on the RANS k-ε (turbulent kinetic energy and dissipation) model [6,50].
This study employs a modified version of the one-dimensional Schumann equations [51] to simulate packed beds. This approach is an extension of the Schumann model and relies on the following assumptions:
- The interfacial thermal resistance at the particle surface limits heat transfer between the gas and the solid. The small particle size and the resultant low Biot numbers underlie this assumption.
- The solid allows for convenient axial direction longitudinal conduction through the bed. Heat leakage to the surroundings also occurs from the solid.
- The gas flow’s kinetic and potential energy terms are negligible.
- A numerical solution to the heat transfer problem was obtained using COMSOL Multiphysics. The solution was derived using the local thermal non-equilibrium equation, Fourier’s law, and the non-Darcian flow model. Heat transfer in porous media is described using the local thermal non-equilibrium hypothesis.
The standard equations for momentum and mass conservation are presented in Equations (2) and (3) [52] below:
CF is the parameter associated with Forchheimer. Moreover, the Schumann method independently addresses two coupled energy equations: one of the solids and the other of the heat transfer fluid (HTF). The principles of this theory can be explained using Equations (4) and (5) [53].
where represents the volume fraction of the solid; ε is the void fraction (material porosity); indicates the density of the solid; refers to the density of the fluid; is the heat capacity of the solid at constant pressure; is the heat capacity of the fluid at constant pressure; qs denotes the conductive heat flux in the solid; qf signifies the conductive heat flux in the fluid; qsf represents the coefficient for interstitial convective heat transfer; Qs stands for the heat source in the solid; Qf is the heat source in the fluid; refers to the contribution of thermoelastic damping that comes straight from the interfaces of the solid mechanics; q is the conductive heat flux; and ∇ is the gradient operator.
COMSOL numerically addresses the heat transfer through Equations (6)–(8).
Following [6], the heat transfer is included in Equations (9) and (11):
and Fourier conduction is simulated using Equations (12) and (13) [6]:
where is the porosity; is the viscous dissipation in the fluid; is the tensor that describes viscous stress; S is the second Piola–Kirchhoff tensor; and Ts and Tf and are the temperatures and thermal conductivities, respectively, for the of the solid and fluid, respectively. The pressure is uncoupled from the velocity, and the solution is that of the second order. The convergence criteria were set at 10−4 for all variables.
This study analysed a hot and a cold cylindrical packed-bed storage reservoir. The numerical approach employed in this paper was previously utilised in reference [6], where it was validated through the experimental research conducted by Meier et al. [45]. The parameters used in [6] are detailed in Table 5, while the optimal parameters, which were determined, are shown in Table 6. These were applied throughout this study, with Magnesia as the storage material.

Table 5.
Hot and cold storage reservoir dimensions and operational parameters [6,30].

Table 6.
The packed-bed optimum design parameters [6].
Table 7 and Table 8 [33] show the thermodynamic properties of the considered gases at the average operational temperature for the hot and cold storage-packed beds, respectively.

Table 7.
HTF average properties (25 °C to 500 °C).

Table 8.
HTF average properties (25 °C to −154 °C).
The following sections provide a comprehensive overview of the considered optimisation criteria and comparative analyses of the selected heat transfer fluids (HTFs) during the charging and discharging cycles of the hot and cold storage packed bed.
Modelling Hot/Cold Thermal Energy Storage Simulations
The charging process for hot and cold storage involved the use of HTF based on the charging temperatures outlined in Table 5; specifically, 476 °C for hot storage and −154 °C for cold storage. During this process, the HTF was circulated through the SHS tank. The HTF exchanged energy with Magnesia particles, which had a particle diameter of 4 mm and a void fraction of 0.2, while the tanks maintained an aspect ratio of 1.
Initially, the temperature of the Magnesia and HTF within the packed bed was set to 25 °C. The charging cycle was simulated until the majority of the Magnesia reached temperatures approaching the charging temperature of the HTF (476 °C and −154 °C for the hot and cold storage, respectively). This was then taken as the initial condition for the discharge process, where the flow direction of the HTF was reversed. Simulations were performed for each of the six selected HTFs to evaluate the performance of each gas during the charging and discharging processes, leading to a comparative study presented in the results and analysis section based on the established performance criteria.
The thermal performance of the packed bed during the charging and discharging processes was assessed using three criteria: the total energy stored
3. Results and Discussion
The following sections present a detailed analysis of the heat transfer performance of the hot and cold storage reservoirs during the charging and discharging cycles. This analysis focuses on the six promising heat transfer gases for large-scale applications, employing the optimal operational parameters in Table 5 and Table 6.
3.1. Hot Storage Charging Cycle
The performance of the investigated HTFs was evaluated for a charging cycle over eight hours. The results are presented below. Figure 4 shows a comparison of the capacity CF and the thermal power of the studied gases for hot storage during the 8 h charging period.
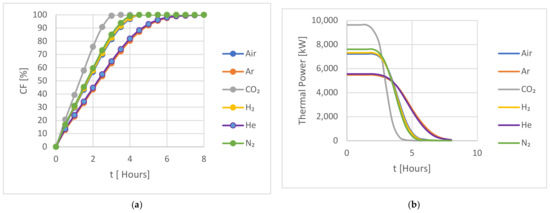
Figure 4.
A comparison of the HTFs for (a) the capacity factor (CF) and (b) the thermal power during an 8 h charging period for the hot storage.
All gases show the same overall features. During the initial charging stages, the heat transfer rate is high due to the significant thermal difference between the HTF and the storage medium. As the charging process continues, the thermal energy is absorbed by the storage medium, resulting in a reduction in the thermal difference between the storage medium and the HTF, which leads to a reduction in the heat transfer rate to the storage medium.
In Figure 4a, the studied gases during the hot storage charging cycle are grouped into three categories: group 1 contained Argon and Helium; group 2 contained Air, Nitrogen, and Hydrogen; and group 3 contained CO2. All three groups reached 100% charging capacity by the end of the cycle but with varying performances. The Argon/Helium group demonstrated comparable performance, with both gases reaching full capacity after approximately 6.5 h. The Air/Nitrogen/Hydrogen group showed a similar trend to the first group but achieved full charge by 4.5 h, indicating a faster charging rate. CO2 outperformed all the studied gases, reaching full capacity after approximately 3 h of charging. A comparison of the charging performance of these gases after 3 h revealed that CO2 reached full capacity by that time, while the Air/Nitrogen/Hydrogen and Argon/Helium groups reached around 85% and 63% of their full capacity, respectively.
The same grouping can be seen in Figure 5b, where the thermal power for CO2 is initially higher than the other gases before reducing as the hot storage approaches full capacity. The group 2 HTFs all behaved similarly to each other, had a lower initial thermal power, and took longer to reach their full capacity. The initial thermal power of the group 1 gases was still lower, and both gases took longer to fully change the system.
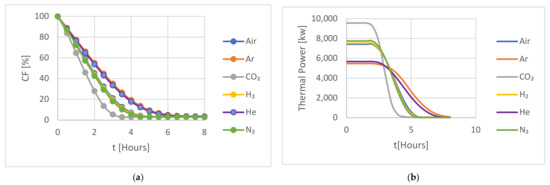
Figure 5.
A comparison of the HTFs for (a) the capacity factor (CF) and (b) the thermal power during an 8 h discharging period for the hot storage.
3.2. Hot Storage Discharging Cycle
The performance of the investigated HTFs was also evaluated during discharge, starting from the conditions at the end of charging. Figure 5 illustrates a comparison of the capacity factor (CF) and the thermal power of the studied HTF for hot storage during an 8 h discharging period.
In Figure 5 the CF decreases as the discharging time increases. In the discharging cycle, the gases follow a similar behaviour to the charging cycle in the section above, both in terms of the discharge initially being at a constant rate, which then decreases at lower values of the CF; and the same three groups were observedbased on their behaviour during the discharging process: Argon/Helium, Air/Nitrogen/Hydrogen, and CO2. The Argon/Helium group demonstrated similar performance, with both gases fully discharging after 6 h. The Air/Nitrogen/Hydrogen group showed a similar trend to the first group but achieved full discharge after 4.5 h, while the CO2 group reached full discharge after 4 h. We note that the CF is not zero, as “full discharge” would suggest, due to residual heat transfer to the backed bed from the insulated walls.
3.3. Cold Storage Charging Cycle
Similarly, to the hot storage in the previous section, the cold storage charging cycle has been studied and analysed using the same six gases for an 8 h charging period. Accordingly, the cold storage thermal performance analysis has been conducted to evaluate the cold storage packed bed during the charging process over an 8 h charging period. Figure 6 shows the studied gas capacity factor and the thermal power during the charge operation.

Figure 6.
A comparison of the HTFs for (a) the capacity factor (CF) and (b) the thermal power during an 8 h charging period for the cold storage.
In Figure 6, the studied gases during the cold storage charging cycle are again grouped into three categories: Argon/Helium, Air/Nitrogen/Hydrogen, and CO2. All three groups reached 100% charging capacity by the end of the cycle but with varying performances, with Argon/Helium reaching full capacity after 7 h, Air/Nitrogen/Hydrogen reaching full capacity after 5 h, and CO2 outperforming all the studied gases and reaching full capacity after around 3 h of charging. A comparison of the charging performance of these gases after 3 h reveals that CO2 reached 97% of its full capacity by that time, while the Air/Nitrogen/Hydrogen and Argon/Helium groups reached around 85% and 60% of their full capacity, respectively. This suggests that CO2 had the fastest charging rate compared to the other gases due to CO2 having the lowest specific heat ratio compared with the other studied gases.
3.4. Cold Storage Discharging Cycle
Similarly, the cold storage tank was studied and analysed using the six investigated gases over 8 h of discharging from the conditions at the end of charging. Figure 7 shows the discharging capacity factor and the thermal power over the same period of charging.

Figure 7.
A comparison of the HTFs for (a) the capacity factor (CF) and (b) the thermal power during an 8 h discharging period for the cold storage.
The result shows a similar behaviour to that observed for the hot storage. The shorter charge/discharge time, compared to the hot storage tank, is affected by the different dimensions of the cold storage tank and, more importantly, by the smaller temperature difference between the charging and discharging temperatures, as shown in Table 5.
3.5. The Packed-Bed Operation Range
When observing the charging and discharging of both the hot and cold storage tanks, it is evident that charging is most rapid during the initial charging period when the total energy stored is low for all studied gases. These would appear to be the conditions to achieve maximum performance for the storage tank. However, during discharge, the discharge rate is lowest when the level of energy stored is low. In particular, removing the final 10–20% of capacity takes a significant amount of time, during which the rate of energy transfer is low. Consequently, emptying the storage completely in order to use the rapid charge rate for an empty-backed bed may not be the best manner in which to operate the system. Similarly, the discharge rate is high when the charge level is also high; however, achieving a full charge involves a period of charging over several hours at a low rate. It is, therefore, beneficial to consider the optimal operating process for the packed-bed storage. The PBES hot/cold storage operating range is shown in Figure 8 and Table 9.
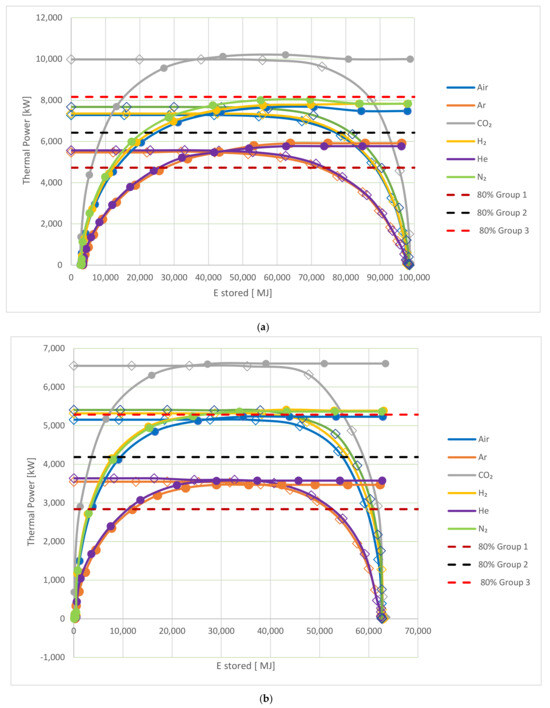
Figure 8.
The operating range of the TES (a) for the hot storage and (b) for the cold storage at six different HTFs; the circle symbol represents charging, and the rhombus represents the discharging.

Table 9.
The hot/cold storage at a level of 80% of maximum operating power.
Figure 8a,b show how the thermal power is related to the energy stored for the hot and cold storage, respectively. This indicates how well the storage system performs in terms of the thermal power for different levels of charge during both the charging and the discharging cycle. During charging, as seen in Figure 4 and Figure 6, the thermal power is initially high when the CF is low and drops off as the tank approaches 100% charge. During discharge, as seen in Figure 5 and Figure 7, the thermal power is initially high where the CF is large before decreasing as the CF reduces. This means that the storage tank has three operating ranges. At a low CF, it will charge rapidly but discharge slowly. Similarly, at a high CF, it will discharge rapidly but charge more slowly. Between these regions, there is an optimal operating range where the system will both change and discharge at an acceptable rate. Here, we select the region where both the charging and discharging thermal powers are within 80% of their maximum. The red, black and brown horizontal lines in Figure 8a,b show the level of 80% maximum power input/output for the three mentioned groups. A single line is shown for each group to improve the visibility of the figures. To ensure that the PBES operates within 80% of the maximum power, the CFs corresponding to the lower and upper limit of this range are shown in Table 9 for each group, along with H2 and He, which are selected to represent groups 2 and 1, respectively. Also shown in Table 9 is the range of CF for each group, over which the packed bed can operate within 80% of the maximum power.
For the hot storage, the operating range, based on operations within 80% or maximum power, is largest for group 3 (CO2), corresponding to 72% of the full range. This is significantly smaller for the HTF in groups 2 and 1, where He has the smallest range, corresponding to only 50% of the full operating range. Similar results are seen for cold storage, with group 3 having the largest range and group 1 having the smallest range. For all groups, the operating range is higher, and the variation in the operating range is smaller compared to the hot storage. Despite the smaller variation in the operating range for cold storage, there is still a significant difference between the operating range of 76% for CO2 and 66% for He.
3.6. HTF Performance
The results presented in Figure 4, Figure 5, Figure 6, Figure 7 and Figure 8 describe the performance of PBSS using different HTFs. These indicate that the fluids can be arranged into groups relating to their performance as an HTF: group 1 containing Argon/Helium, group 2 containing Nitrogen/Hydrogen/Air, and group 3 containing CO2. The physical properties of these gases are shown in Table 7 and Table 8. Of these physical parameters, only demonstrates the same grouping, as illustrated in Figure 9 for the hot storage system, which indicates that the HTFs in each group have similar values and also indicates that these are negatively correlated with the maximum power achieved in the PBSS.
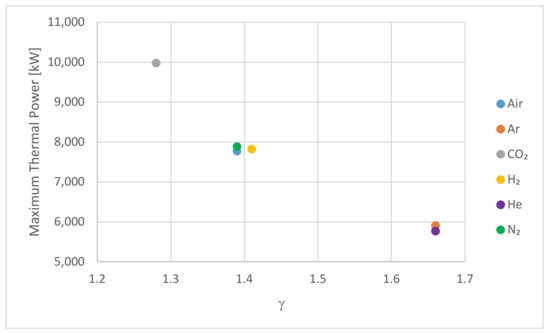
Figure 9.
The maximum thermal power for the hot storage system against the ratio of heat capacities,
Despite the wide range of values seen in Table 7 and Table 8 for the specific heat capacity and density of the HTFs, their product is given as follows:
which represents the capacity of the HTF to add or remove energy from the PBSS, which was also observed to demonstrate the same groupings and a positive correlation with the maximum power, as demonstrated in Figure 10. This suggested that and could be useful in assessing the suitability of alternative HTFs in the future.
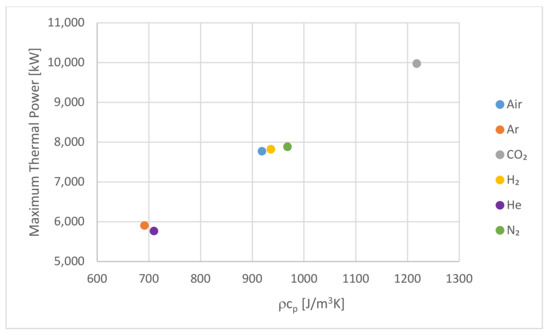
Figure 10.
The maximum thermal power for the hot storage system against the capacity.
4. Conclusions and Future Work
Packed-bed systems have emerged as a prominent solution for large-scale thermal energy storage applications, owing to their impressive thermal efficiency and economic viability. The packed beds examined in this study employed optimised parameters identified in previous research using air as the HTF, involving a solid particle diameter of 0.004 m, a material porosity of 0.2, a mass flow rate of 13.7 kg/m3, and an aspect ratio of 1, using Magnesia as the storage medium.
This paper presents a comparative analysis to determine the influence of different heat transfer gases, namely air, Ar, CO2, He, H2, and N2, on the heat transfer efficiency of the studied hot/cold packed beds. The findings have been categorised into three groups: Argon/Helium, Nitrogen/Hydrogen/Air, and CO2. Comparative analysis of hot and cold storage systems indicated that CO2 emerged as the most efficient HTF among the studied gases, with the highest rate of charge and discharge. Analysis of the maximum operating range for both reservoirs, at 80% of their fully charged storage capacity, indicates that CO2 also provided the largest operating range compared to the others. The results showed that carbon dioxide (group 3) had an operating range of 72% for hot storage and 76% for cold storage. In comparison, group 2, which is hydrogen, nitrogen and air (group 2), had an operating range of 55% for hot storage and 75% for cold storage. Helium and argon (group 1) had an operating range of 50% for hot storage and 66% for cold storage. Additionally, the results indicate that carbon dioxide gas was the most promising heat transfer fluid for the packed beds studied.
The study also indicated that the maximum power level was inversely proportional to the ratio of specific heats, , and proportional to This suggests that when considering alternative HTFs, fluids with a low value and high may perform well.
The results also indicate that Ar was in the poorest performing group, suggesting that despite its existing use [1,22], it is not a good choice for HTF.
The following practical recommendations are made for the operation of backed bed storage tanks:
- CO2 was identified as the preferred HTF for use in a system in terms of its performance.
- Air performed less well but may be preferred on the basis of cost and availability.
- When CO2 is used, the storage system should be used within the charging range of between 16% and 88% of full charge for the hot storage system and 11% and 87% for the cold tank. This ensures that the system is operating within 80% of its maximum power.
- For alternative fluids, the corresponding ranges are given in Table 9. For air, they are 24–79% and 13–87% for the hot and cold tanks, respectively.
A key limitation of this work is that the tank was assumed to be perfectly insulated, and heat losses to the environment were not considered. While this is appropriate when the storage is being constantly charged and discharged, it will not account for losses which occur, particularly when storage occurs over a longer time period. Future work should investigate the effect of these heat losses over both a short and a long storage period.
Author Contributions
Conceptualisation, J.R. and J.M.B.; methodology, A.M.R., J.R. and J.M.B.; software, A.M.R.; validation, A.M.R.; formal analysis, A.M.R.; investigation, A.M.R., J.R. and J.M.B.; resources, J.R. and J.M.B.; data curation, A.M.R.; writing—original draft preparation, A.M.R.; writing—review and editing, A.M.R., J.R. and J.M.B.; visualisation, A.M.R.; supervision, J.R. and J.M.B.; project administration, J.R. and J.M.B. All authors have read and agreed to the published version of the manuscript.
Funding
This research received no external funding.
Data Availability Statement
The datasets are available upon request from the authors.
Conflicts of Interest
The authors declare no conflicts of interest.
Nomenclature
| Abbreviation | |
| AA-CAES | Advanced-Adiabatic Compressed-Air Energy Storage |
| CF | The capacity factor |
| HTF | Heat transfer fluid |
| IEA | International Energy Agency |
| LAES | Liquid Air Energy Storage |
| LHS | Latent heat storage |
| PBSS | Packed-bed storage system |
| PHES | Pumped Heat Energy Storage |
| PTES | Pumped Thermal Energy Storage |
| RTE | Round Trip Efficiency |
| SHS | Sensible Heat Storage |
| TES | Thermal Energy Storage |
| Greek symbols | |
| α | The thermal diffusivity |
| The ratio of specific heat | |
| ɛ | The porosity (void fraction) |
| ɳHT | The heat transfer efficiency |
| θ | The volume fraction |
| λ | The ratio of specific heat |
| μ | The porous media viscosity |
| ρ | The desnity |
| τ | The viscous stress tensor |
| Subscripts | |
| ch | Charging |
| dis | Discharging |
| f | Fluid |
| HT | Heat transfer |
| i | Initial |
| p | Particle |
| s | Solid |
| TH | Thermal |
| Roman symbols | |
| cf | The coefficient of friction |
| Cf | The Forcheimer parameter |
| cp | The heat capacity |
| The Capacity of Heat Transfer Fluid | |
| D | The packed-bed diameter |
| dp | Particle diameter |
| Estored | The energy stored |
| g | The acceleration of gravity |
| H | The packed-bed height |
| K | Thermal conductivity |
| l | The length scale |
| m | The mass |
| P | The operating pressure |
| q | The conductive heat fluxes |
| qsf | The interstitial convective heat transfer coefficient |
| Q | The heat sources |
| Qvd | The viscous dissipation |
| Qted | The thermoelastic damping |
| Re | Reynold number |
| S | The Seebeck coefficient |
| t | Time |
| T | Temperature |
| ∆t | The change in time |
| u | The velocity |
| The volume fow rate | |
References
- White, A.; Parks, G.; Markides, C.N. Thermodynamic analysis of pumped thermal electricity storage. Appl. Therm. Eng. 2013, 53, 291–298. [Google Scholar] [CrossRef]
- Rabi, A.M.; Radulovic, J.; Buick, J.M. Pumped Thermal Energy Storage Technology (PTES): Review. Thermo 2023, 3, 396–411. [Google Scholar] [CrossRef]
- McTigue, J.D.; White, A.J.; Markides, C.N. Parametric studies and optimisation of pumped thermal electricity storage. Appl. Energy 2015, 137, 800–811. [Google Scholar] [CrossRef]
- Mercangöz, M.; Hemrle, J.; Kaufmann, L.; Z’Graggen, A.; Ohler, C. Electrothermal energy storage with transcritical CO2 cycles. Energy 2012, 45, 407–415. [Google Scholar] [CrossRef]
- ELSihy, E.S.; Wang, X.; Xu, C.; Du, X. Numerical investigation on simultaneous charging and discharging process of molten-salt packed-bed thermocline storage tank employing in CSP plants. Renew. Energy 2021, 172, 1417–1432. [Google Scholar] [CrossRef]
- Rabi’, A.M.; Radulovic, J.; Buick, J.M. Packed Bed Thermal Energy Storage System: Parametric Study. Thermo 2024, 4, 295–314. [Google Scholar] [CrossRef]
- Alva, G.; Liu, L.; Huang, X.; Fang, G. Thermal energy storage materials and systems for solar energy applications. Renew. Sustain. Energy Rev. 2017, 68, 693–706. [Google Scholar] [CrossRef]
- Alva, G.; Lin, Y.; Fang, G. An overview of thermal energy storage systems. Energy 2018, 144, 341–378. [Google Scholar] [CrossRef]
- Gil, A.; Medrano, M.; Martorell, I.; Lázaro, A.; Dolado, P.; Zalba, B.; Cabeza, L.F. State of the art on high temperature thermal energy storage for power generation. Part 1—Concepts, materials and modellization. Renew. Sustain. Energy Rev. 2010, 14, 31–55. [Google Scholar] [CrossRef]
- Medrano, M.; Gil, A.; Martorell, I.; Potau, X.; Cabeza, L.F. State of the art on high-temperature thermal energy storage for power generation. Part 2-Case studies. Renew. Sustain. Energy Rev. 2010, 14, 56–72. [Google Scholar] [CrossRef]
- Balakrishnan, A.R.; Pei, D.C.T. Heat Transfer in Gas-Solid Packed Bed Systems. 2. The Conduction Mode. Ind. Eng. Chem. Process Des. Dev. 1979, 18, 40–46. [Google Scholar] [CrossRef]
- Almendros-Ibáñez, J.A.; Fernández-Torrijos, M.; Díaz-Heras, M.; Belmonte, J.F.; Sobrino, C. A review of solar thermal energy storage in beds of particles: Packed and fluidized beds. Sol. Energy 2019, 193, 193–237. [Google Scholar] [CrossRef]
- Zanganeh, G.; Pedretti, A.; Haselbacher, A.; Steinfeld, A. Design of packed bed thermal energy storage systems for high-temperature industrial process heat. Appl. Energy 2015, 137, 812–822. [Google Scholar] [CrossRef]
- de Gracia, A.; Cabeza, L.F. Numerical simulation of a PCM packed bed system: A review. Renew. Sustain. Energy Rev. 2017, 69, 1055–1063. [Google Scholar] [CrossRef]
- Elouali, A.; Kousksou, T.; El Rhafiki, T.; Hamdaoui, S.; Mahdaoui, M.; Allouhi, A.; Zeraouli, Y. Physical models for packed bed: Sensible heat storage systems. J. Energy Storage 2019, 23, 69–78. [Google Scholar] [CrossRef]
- Sanderson, T.M.; Cunningham, G.T. Performance and efficient design of packed bed thermal storage systems. Part 1. Appl. Energy 1995, 50, 119–132. [Google Scholar] [CrossRef]
- Ge, Y.Q.; Zhao, Y.; Zhao, C.Y. Transient simulation and thermodynamic analysis of pumped thermal electricity storage based on packed-bed latent heat/cold stores. Renew. Energy 2021, 174, 939–951. [Google Scholar] [CrossRef]
- Gallo, A.B.; Simões-Moreira, J.R.; Costa, H.K.M.; Santos, M.M.; dos Santos, E.M. Energy storage in the energy transition context: A technology review. Renew. Sustain. Energy Rev. 2016, 65, 800–822. [Google Scholar] [CrossRef]
- Petrollese, M.; Cascetta, M.; Tola, V.; Cocco, D.; Cau, G. Pumped thermal energy storage systems integrated with a concentrating solar power section: Conceptual design and performance evaluation. Energy 2022, 247, 123516. [Google Scholar] [CrossRef]
- Mazzucco, G.; Xotta, G.; Salomoni, V.A.; Giannuzzi, M.; Maiorana, C.E. Solid thermal storage with PCM materials. Numerical investigations. Appl. Therm. Eng. 2017, 124, 545–559. [Google Scholar] [CrossRef]
- Benato, A.; Stoppato, A. Pumped Thermal Electricity Storage: A technology overview. Therm. Sci. Eng. Prog. 2018, 6, 301–315. [Google Scholar] [CrossRef]
- Benato, A.; Stoppato, A. Heat transfer fluid and material selection for an innovative pumped thermal electricity storage system. Energy 2018, 147, 155–168. [Google Scholar] [CrossRef]
- Farres-Antunez, P.; McTigue, J.D.; White, A.J. A pumped thermal energy storage cycle with capacity for concentrated solar power integration. In Proceedings of the 2019 Offshore Energy and Storage Summit (OSES), Brest, France, 10–12 July 2019. [Google Scholar] [CrossRef]
- Desrues, T.; Ruer, J.; Marty, P.; Fourmigué, J.F. A thermal energy storage process for large scale electric applications. Appl. Therm. Eng. 2010, 30, 425–432. [Google Scholar] [CrossRef]
- Howes, J. Concept and Development of a Pumped Heat Electricity Storage Device. Proc. IEEE 2012, 100, 493–503. [Google Scholar] [CrossRef]
- White, A.J. Loss analysis of thermal reservoirs for electrical energy storage schemes. Appl. Energy 2011, 88, 4150–4159. [Google Scholar] [CrossRef]
- McTigue, J.; White, A. A comparison of radial-flow and axial-flow packed beds for thermal energy storage. Appl. Energy 2018, 227, 533–541. [Google Scholar] [CrossRef]
- White, A.; McTigue, J.; Markides, C. Wave propagation and thermodynamic losses in packed-bed thermal reservoirs for energy storage. Appl. Energy 2014, 130, 648–657. [Google Scholar] [CrossRef]
- White, A.J.; McTigue, J.; Markides, C. Analysis and optimisation of packed-bed thermal reservoirs for electricity storage applications. Proc. Inst. Mech. Eng. Part A J. Power Energy 2016, 230, 739–754. [Google Scholar] [CrossRef]
- Wang, L.; Lin, X.; Chai, L.; Peng, L.; Yu, D.; Chen, H. Cyclic transient behavior of the Joule–Brayton based pumped heat electricity storage: Modeling and analysis. Renew. Sustain. Energy Rev. 2019, 111, 523–534. [Google Scholar] [CrossRef]
- Benato, A. Performance and cost evaluation of an innovative Pumped Thermal Electricity Storage power system. Energy 2017, 138, 419–436. [Google Scholar] [CrossRef]
- Benato, A.; Stoppato, A.; Mirandola, A. State-of-the-art and future development of sensible heat thermal electricity storage systems. Int. J. Heat Technol. 2017, 35, S244–S251. [Google Scholar] [CrossRef]
- McTigue, J. Analysis & Optimization of Thermal Energy Storage. Ph.D. Thesis, Cambridge University Engineering Department, Cambridge, UK, 2016. [Google Scholar]
- Zhao, Y.; Song, J.; Liu, M.; Zhao, Y.; Olympios, A.V.; Sapin, P.; Yan, J.; Markides, C.N. Thermo-economic assessments of pumped-thermal electricity storage systems employing sensible heat storage materials. Renew. Energy 2022, 186, 431–456. [Google Scholar] [CrossRef]
- Farres Antunez, P. Modelling of Thermal Energy Storage Systems for Bulk Electricity Storage. Ph.D. Thesis, Cambridge University, Cambridge, UK, 2015. [Google Scholar]
- Chen, L.X.; Hu, P.; Zhao, P.P.; Na Xie, M.; Wang, F.X. Thermodynamic analysis of a High Temperature Pumped Thermal Electricity Storage (HT-PTES) integrated with a parallel organic Rankine cycle (ORC). Energy Convers. Manag. 2018, 177, 150–160. [Google Scholar] [CrossRef]
- Davenne, T.R.; Peters, B.M. An Analysis of Pumped Thermal Energy Storage With De-coupled Thermal Stores. Front. Energy Res. 2020, 8, 160. [Google Scholar] [CrossRef]
- Georgiou, S.; Aunedi, M.; Strbac, G.; Markides, C.N. Application of Liquid-Air and Pumped-Thermal Electricity Storage Systems in Low-Carbon Electricity Systems. In Proceedings of the Heat Powered Cycles (HPC-2018), Bayreuth, Germany, 16–19 September 2018. [Google Scholar]
- Georgiou, S.; Shah, N.; Markides, C.N. A thermo-economic analysis and comparison of pumped-thermal and liquid-air electricity storage systems. Appl. Energy 2018, 226, 1119–1133. [Google Scholar] [CrossRef]
- Georgiou, S.; Aunedi, M.; Strbac, G.; Markides, C.N. On the value of liquid-air and pumped-thermal electricity storage systems in low-carbon electricity systems. Energy 2020, 193, 116680. [Google Scholar] [CrossRef]
- Guo, J.; Cai, L.; Chen, J.; Zhou, Y. Performance optimization and comparison of pumped thermal and pumped cryogenic electricity storage systems. Energy 2016, 106, 260–269. [Google Scholar] [CrossRef]
- Zhang, H.; Wang, L.; Lin, X.; Chen, H. Combined cooling, heating, and power generation performance of pumped thermal electricity storage system based on Brayton cycle. Appl. Energy 2020, 278, 115607. [Google Scholar] [CrossRef]
- Wang, L.; Lin, X.; Chai, L.; Peng, L.; Yu, D.; Liu, J.; Chen, H. Unbalanced mass flow rate of packed bed thermal energy storage and its influence on the Joule-Brayton based Pumped Thermal Electricity Storage. Energy Convers. Manag. 2019, 185, 593–602. [Google Scholar] [CrossRef]
- Steinmann, W.-D.; Jockenhöfer, H.; Bauer, D. Thermodynamic Analysis of High-Temperature Carnot Battery Concepts. Energy Technol. 2020, 8, 1900895. [Google Scholar] [CrossRef]
- Meier, A.; Winkler, C.; Wuillemin, D. Experiment for modelling high temperature rock bed storage. Sol. Energy Mater. 1991, 24, 255–264. [Google Scholar] [CrossRef]
- ADELE-Adiabatic Compressed-Air Energy Storage for Electricity Supply-RWE Power. n.d. Available online: https://www.readkong.com/page/adele-adiabatic-compressed-air-energy-storage-for-2887816 (accessed on 12 February 2025).
- Raju, M.; Khaitan, S.K. Modeling and simulation of compressed air storage in caverns: A case study of the Huntorf plant. Appl. Energy 2012, 89, 474–481. [Google Scholar] [CrossRef]
- King, M.; Jain, A.; Bhakar, R.; Mathur, J.; Wang, J. Overview of current compressed air energy storage projects and analysis of the potential underground storage capacity in India and the UK. Renew. Sustain. Energy Rev. 2021, 139, 110705. [Google Scholar] [CrossRef]
- Meli, P. A Tale of Fire and Ice. MAN Energy Solutions. Available online: https://www.man-es.com/discover/a-tale-of-fire-and-ice (accessed on 12 February 2025).
- Theory for Turbulence in Porous Media. Available online: https://doc.comsol.com/6.1/doc/com.comsol.help.cfd/cfd_ug_fluidflow_single.06.098.html (accessed on 12 February 2025).
- Schumann, T. Heat transfer: A liquid flowing through a porous prism. J. Frankl. Inst. 1929, 208, 405–416. [Google Scholar] [CrossRef]
- Xu, C.; Wang, Z.; He, Y.; Li, X.; Bai, F. Sensitivity analysis of the numerical study on the thermal performance of a packed-bed molten salt thermocline thermal storage system. Appl. Energy 2012, 92, 65–75. [Google Scholar] [CrossRef]
- COMSOL Multiphysics. Porous Media Flow Module. 2020. Available online: https://doc.comsol.com/5.6/doc/com.comsol.help.porous/PorousMediaFlowModuleUsersGuide.pdf (accessed on 12 February 2025).
Disclaimer/Publisher’s Note: The statements, opinions and data contained in all publications are solely those of the individual author(s) and contributor(s) and not of MDPI and/or the editor(s). MDPI and/or the editor(s) disclaim responsibility for any injury to people or property resulting from any ideas, methods, instructions or products referred to in the content. |
© 2025 by the authors. Licensee MDPI, Basel, Switzerland. This article is an open access article distributed under the terms and conditions of the Creative Commons Attribution (CC BY) license (https://creativecommons.org/licenses/by/4.0/).