Article

Research on the Health Evaluation of a Pump Turbine in Smoothing Output Volatility of the Hybrid System Under a High Proportion of Wind and Photovoltaic Power Connection

1
School of Electrical Engineering, North China University of Water Resources and Electric Power, Zhengzhou 450045, China
2
School of Energy and Power Engineering, North China University of Water Resources and Electric Power, Zhengzhou 450045, China
3
School of Energy and Power Engineering, Xi’an Jiaotong University, Xi’an 710049, China
4
Power China Henan Electric Power Survey & Design Institute Co., Ltd., Zhengzhou 450007, China
5
Henan Rural Industry Development Service Center, Zhengzhou 450002, China
6
Hunan Heimifeng Pumped Storage Co., Ltd., Changsha 410219, China
7
Jiangxi Hongping Pumped Storage Co., Ltd., Yichun 330603, China
*
Authors to whom correspondence should be addressed.
Energies 2025, 18(5), 1306; https://doi.org/10.3390/en18051306
Submission received: 25 January 2025 / Revised: 25 February 2025 / Accepted: 5 March 2025 / Published: 6 March 2025
(This article belongs to the Special Issue Planning, Operation, and Control of New Power Systems)

Abstract

:
With the high proportion of wind and photovoltaic (PV) power connection in the new electricity system, the system output power volatility is enhanced. When the output fluctuation of the system is suppressed, the pumped storage condition is changed frequently, which leads to the vibration enhancement of the unit and a decrease in the system safety. This paper proposes a pump turbine health evaluation model based on the combination of a weighting method and cloud model in a high proportion wind and PV power connection scenario. The wind–PV output characteristics of the complementary system in a year (8760 h) and a typical week in four seasons (168 h) are analyzed, and the characteristics of frequent working condition transitions of pumped storage units are studied against this background. A five-level health classification system including multi-dimensional evaluation indicators is established, and a multi-level health evaluation based on cloud membership quantification is realized by combining the weighting method and cloud model method. The case analysis of a pumped storage power station within a new electricity system shows that the system as a whole presents typical cloud characteristics (Ex = 76.411, En = 12.071, He = 4.014), and the membership degree in the “good” state reaches 0.772. However, the draft tube index (Ex = 62.476) and the water guide index (Ex = 50.333) have shown a deterioration trend. The results verify the applicability and reliability of the evaluation model. This study provides strong support for the safe and stable operation of pumped storage units in the context of the high-proportion wind and PV power connection, which is of great significance for the smooth operation of the new electricity system.

1. Introduction

With the “carbon peaking and carbon neutrality” goal proposed [1], China is committed to building a new electricity system with new energy as the core [2]. This system relies heavily on large-scale access to renewable energy sources, such as wind and solar, to reduce dependence on traditional fossil energy sources [3,4]. However, wind power (WP) and PV power generation have strong volatility and randomness [5,6], and although they have certain complementarity in time and space, the output of a hybrid wind/PV system still has significant fluctuations. In this context, the hybrid wind/PV/pumped storage systems have become an important way to meet the challenge of a high proportion of wind and PV power connection, by coordinating the complementarity of different energy forms, to achieve a smooth and efficient energy supply [7,8,9]. Among them, the advantages of pumped storage “peak cutting and valley filling” are becoming more prominent. Pumped storage converts excess electric energy into potential energy, which is stored in the turbine condition when the power is in excess and released in the power generation condition when the power is insufficient, thus realizing the wind and PV power fluctuations of effective suppression [10,11]. At the same time, pumped storage units are also key equipment for balancing fluctuations in power supply and demand and for ensuring the stable operation of the power grid [12,13]. However, due to the characteristics of a large difference between day and night in wind and PV power generation and the significant increase in the proportion of wind and PV resources [14,15,16] as the main feature of the new electricity system compared with the traditional electricity system, the working condition conversion of pumped storage units used to smooth the wind and PV power fluctuations becomes more frequent. Frequent startups and shutdowns aggravate the vibration of the unit, which poses a challenge to the stability of the unit, and may also lead to reduced operational efficiency and shorter service life, thus adversely affecting the overall stability of the power grid [17]. As the core component of the unit, the performance of the pump turbine is directly related to the operating efficiency of the unit and the stability of the power grid [18]. In view of this, health status evaluation of pump turbines plays an indispensable role in ensuring the stable operation of new electricity systems. The aim of this study is to explore effective evaluation methods to improve the reliability and safety of pump turbines by accurately monitoring and diagnosing their operating conditions to provide solid technical support for the construction of a new type of efficient and stable electricity system.
In recent years, scholars from various countries have conducted some research on the new electricity system. For the theoretical basis of the new electricity system, Yu et al. [19] explored the fundamentals and key technologies of electric–carbon coupling in the new electricity system and provided the theoretical basis and technical support for the low-carbon planning, operation, and maintenance of the new electricity system. Wu et al. [20] analyzed the power balance problem of the new electricity system under the dual-carbon target, put forward the concept of “carbon linkage”, and explored the technical solutions of power balance from the perspective of planning and operation. In terms of risk assessment and control strategies for new electricity systems, Hu et al. [21] provides an in-depth analysis of the risk review of the new electricity system, summarizes the risk characteristics, index system, and evaluation methods of the new electricity system, and discusses the organic integration of risk evaluation and vulnerability identification. Wang et al. [22] proposes a new type of power system control and optimization strategy to enhance system reliability and new energy consumption, providing technical support for low-carbon power system planning.
While solving the problems related to low-carbon power technology, the effective utilization of renewable energy in the electricity power system is also the key direction of research. In the framework of a new electricity system, the complementarity of wind and PV power becomes a key factor in improving the reliability of energy supply. For the benefit of improving the hybrid wind and PV system, Alaoui et al. [23] explores the potential of PV and wind power as alternative sources of energy, focusing on the analysis of various configurations of hybrid wind and PV systems. Yahya et al. [24] uses MATLAB R2022a modeling to analyze Darnah and Alkhums regions of Libya and studies the influence of different configuration optimization methods on system cost in combination with the hybrid wind and PV system. Qudah et al. [25] used a differential evolution algorithm to optimize the configuration of renewable energy system for Dhahran city and studied the impact of different optimization algorithms on system cost and reliability. The research on hybrid wind and PV system is an important link in the construction of a stable and reliable renewable energy supply system for new electrical systems, and it explores how to improve the performance of wind and PV energy on different levels. Through optimal design and multi-energy complementary strategy, the stability of wind and PV power generation has been partially improved.
However, with the continuous expansion of new energy access scale, the intermittence and volatility of its power generation brought about by the power balance, grid, and other problems become more prominent, and it is difficult to rely solely on the hybrid wind and PV system to solve these deep-rooted problems. Therefore, the hybrid wind/PV/pumped storage system has been proposed, which smoothes out the fluctuation of new energy generation through the characteristics of pumped storage in shaving peaks and filling valleys [26]. In the study of benefit optimization of hybrid systems, Sun et al. [27] proposed an optimal operation strategy for hybrid pumped storage/wind/PV power generation based on a voltage source converter for multi-terminal high voltage DC systems to enhance the supply–demand balance of the grid and the fairness of the market participants in response to the volatility of wind and PV power generation. Jurasz et al. [28] proposed a regional power system optimization model integrating hybrid wind/PV/pumped storage system, introduced a local consumption index, and confirmed the cost-effectiveness of PV and wind energy with carbon pricing considerations. Wang et al. [29] proposed a multi-scale optimization model of hybrid pumped storage/wind/PV system, which has significant advantages in improving power generation efficiency and reducing power abandonment, especially its economic performance under different hydrological conditions, and electricity price mechanism has been verified.
With the wide application of hybrid wind/PV/pumped storage systems, the frequent changeover of operating conditions of pumped storage units has become the focus of research. This kind of working condition change puts forward higher requirements on the health status of the equipment, and the health status of the pump turbine, as the core equipment of the pumped storage unit, has a direct impact on the overall efficiency of the unit and the safety and stability of the power grid, so the research on the health evaluation of the pump turbine is particularly important. In this field of health evaluation, domestic and foreign scholars have also conducted a great deal of research on it. Traditional evaluation methods usually rely on empirical judgment or single-indicator analysis, where it is difficult to fully reflect the health status of the equipment [30]. In order to solve this problem, scholars have started to study data-driven intelligent evaluation methods based on fuzzy comprehensive evaluation [31,32,33,34], neural networks [35,36,37], and support vector machines [38]. For the evaluation of water pump turbine, Zhao et al. [39] conducted condition monitoring of water pump turbine by artificial neural network and investigated the effect of complex hydraulic phenomena on the wear of the equipment, thus improving the accuracy of health evaluation. Dorber et al. [40] developed the first globally applicable midpoint characterization factors (CFs) for pump turbine use in pumped storage power plants, which provide a quantitative method for environmental impact evaluation of pump turbine use and help more accurately assess environmental impacts in hydropower production. Zhang et al. [41] proposes a water turbine health status assessment method based on heterogeneous graph contrast learning, which can effectively evaluate turbine degradation status without state labels. Chen et al. [42] established a hydraulic model of hydraulic turbine for the effect of sediment wear on the fatigue life of hydraulic turbine runner blades and calculated the dynamic stress data in the dangerous areas of the blades under different wear degrees by one-way fluid–solid coupling method, which provided a reference for the fatigue life evaluation of the blades. Zhang et al. [43] proposed an interactive data model enhancement approach based on a graph-driven health benchmark model for assessing the health of Francis turbine units.
To sum up, the existing health assessment models have limitations in the new electricity system environment with a high proportion of wind and PV access. These models fail to fully consider the unique operation characteristics of pump turbine in the new electricity system, leading to its shortcomings in adapting to the complex operating environment of the new electricity system. Specifically, in the scenario of grid-connected operation of a high proportion of wind and PV access, the frequent state transition between units and the dynamic change of operating parameters make it difficult for the health prediction results based on the traditional evaluation model to accurately reflect the real state of the equipment, and it is difficult for the model to meet the actual needs in terms of accuracy and reliability indicators.
Therefore, based on the new electrical system, this paper constructs a set of evaluation models that can fully reflect the health state of the pump turbine to evaluate the health state of the pump turbine. In this study, with the new electricity system as the background, through the hybrid wind/PV/pumped storage system output characteristic analysis, it points out the characteristics of the pump turbine working condition frequently switching under the hybrid system so as to put forward the necessity of its health evaluation. On this basis, this paper establishes an evaluation index system that comprehensively reflects the health status of pump turbine, optimizes the existing combination assignment method by using the game theory idea to accurately determine the weights of each index, and, finally, applies the cloud model theory to carry out a fuzzy comprehensive evaluation of the indexes to obtain the overall health status of the pump turbine step by step. Compared with the traditional model, the method proposed in this paper has higher adaptability in dealing with the condition conversion caused by the wind and PV power fluctuation, improves the accuracy of the health assessment of the pump turbine under the conditions of the new electricity system with a high proportion of wind and PV access, enhances the applicability of the assessment model, and effectively makes up for the shortcomings of the existing research in this respect. It also provides a more effective and innovative solution for equipment health assessment in new electricity system environments with a high percentage of wind and PV access, thus helping improve the system stability and safety.

2. Mathematical Models and Methods

2.1. System Output Model

2.1.1. Mathematical Model of Wind Power Generation

The wind power output depends mainly on the wind speed v, which is calculated as follows [44]:
P W = 0 , 0 v < v i N W P w r v 3 v r 3 v i 3 P w r v i 3 v r 3 v i 3 , v i v < v r N W P w r , v r v v o 0 , v > v o
where vi and vo are the cut-in and cut-out wind speeds, m/s; vr is the rated speed of the fan, r/min; NW is the number of fans installed; the rated power of the fan is calculated as follows [45]:
P w r = 1 2 τ ρ S W v 3
where ρ and S W are the air density and the swept area of the rotor, respectively, and τ is the fan’s coefficient of performance.

2.1.2. Mathematical Model of PV Power Generation

The PV array converts PV radiation into electrical energy through the PV effect, and the PV output Ppv is calculated as follows [44]:
P PV = I p N 1 U PV I r N 1 U PV I r e b U PV N 2 a BT N 1 U PV
where N1 and N2 are the number of PV cells in parallel and series, respectively; Ip and Ir are the PV generation current and the reverse saturation current of the diode respectively, A; UPV is the output voltage of the PV cell, V; T is the operating temperature of the PV cell, °C; a and b are the diode quality factor and the electronic charge, respectively; and B represents the Boltzmann’s constant, J/K.

2.1.3. Output Model of Pumped Storage

The pumped storage output is calculated as follows:
In the pumping condition, the power transferred to the pump turbine shaft is calculated as follows [44]:
P y = 9.81 Q y H y η y
where H y is the head of the pumped storage unit under pumping conditions, m; Q y is the flow rate of the unit under pumping conditions, m3/s; η y is the unit efficiency under pumping conditions.
In turbine operation, the power transferred to the runner is calculated as follows [46]:
P p = 9.81 Q p H p η p
where H p is the head of the pumped storage unit under turbine operation, m; Q p is the flow rate of the unit under turbine operation, m3/s; η p is the unit efficiency during turbine operation. The relevant parameters of pump turbine are shown in Table 1 below.

2.2. Health Evaluation Methods

2.2.1. Improved Analytic Hierarchy Process (IAHP)

AHP is a subjective assignment method, but judgment matrices often fail consistency tests [47]. Therefore, an IAHP method can be used to determine the judgment matrix using the scale construction method [48]. The ratio values between neighboring factors were determined by ranking the importance of the factors, and these values were used to determine the other elements in the matrix.
The judgment matrix R = [rij] satisfies the following conditions: ( 1 )   r i j > 0 ;   ( 2 )   r i i = 1 ;   ( 3 )   r i j = 1 / r j i ;   ( 4 )   r i j = r i k r k j where rij is the scale value of the i th indicator relative to the j th indicator. The meaning of the scale values is shown in Table 2.
The n indicators x1, x2, …, xn are subjectively ranked according to the principle of non-decreasing importance, and the result is x1x2 ≥…≥ xn, Comparing the importance relationship between xi and xi+1 according to Table 1, the scale value is determined, the corresponding scale is recorded as ti, and, finally, the scale values t1, t2, …, tn−1 between all the neighboring indicators are obtained. The other elements in the judgment matrix are obtained according to the transmissibility of importance, and the final judgment matrix R is shown in the following equation:
R = 1 t 1 t 1 t 2 i = 1 n 1 t i 1 t 1 1 t 2 i = 2 n 1 t i 1 t 1 t 2 1 t 2 1 i = 3 n 1 t i 1 i = 1 n 1 t i 1 i = 2 n 1 t i 1 i = 3 n 1 t i 1
The consistency index CI of the judgment matrix is calculated as follows [49]:
CI = λ max -   n n - 1
where λ max is the largest eigenvalue of the judgment matrix.
The formula for calculating the consistency test is as follows [49]:
CR = CI RI
where CR is the consistency ratio, CI is the consistency index of the judgment matrix, and RI is the average consistency index.
In this paper, the judgment matrix in the process of calculating the weights of the indicators involves matrix orders 1, 2, 3, 5, and 6, and the corresponding RI values are shown in Table 3 below [49].
If CR < 0.1, the test passes, indicating that the established weight vector can be applied; if CR ≥ 0.1, the judgment matrix needs to be corrected. According to the calculation results, the CR values of the judgment matrices are all <0.1, which indicates that the judgment matrices obtained by this method satisfy the consistency and can be directly used in the calculation of weights.
The formula for calculating the subjective weights of the indicators is as follows:
α i = j = 1 n r i j 1 / n / i = 1 n j = 1 n r i j 1 / n
where α i is the value of the weight of the i th indicator; j = 1 n r i j is the product of all the elements of the i th row of the matrix R. From this, the subjective weights of the indicators can be quantitatively determined.

2.2.2. Improved Criteria Importance Through Intercriteria Correlation Analysis Method (ICRITIC)

The traditional CRITIC method is a method through the correlation of the indicators based on the correlation of the indicators [50]. The entropy weight method can identify indicators with a large amount of information and give them higher weights so that the evaluation results can better reflect the real situation. By using the entropy weight method to improve the CRITIC method, the indicator information can be more comprehensively utilized to achieve more scientific weight allocation, so the entropy weighting method is used to improve the CRITIC method, and the formula is as follows:
(1)
The m predictive objects and the j th indicator value aij of the i object among the n predictive indicators constitute the original predictive indicator value matrix A = a i j m × n .
(2)
Positive and negative indicators are standardized to the initial matrix B according to two standardizations: the larger the better and the smaller the better, respectively, to obtain matrix B = b i j m × n . The standardized formula is calculated as follows:
b i j = a i j m i n { a i j } m a x { a i j } m i n { a i j }
b i j = m a x { a i j } a i j m a x { a i j } m i n { a i j }
where Equations (10) and (11) are the larger and better indicators and the smaller and better indicators, respectively, and aij is the initial value of the indicator.
(3)
The information entropy ej of the jth indicator is calculated according to the entropy weight method with the following formula:
e j = D i = 1 m T i j ln ( T i j )
where T i j = b i j i = 1 m b i j , D = 1 ln ( m ) , b i j is the standardized value of the indicator.
(4)
The mean difference vj for each indicator of the standardized matrix B is calculated using the following formula:
ν j = 1 m i = 1 m | b i j b ¯ j | , ( j = 1 , 2 , , n )
(5)
The quantitative coefficients of the degree of independence of each evaluation indicator are calculated using the following formula:
η j = k = 1 b ( 1 | r k j | ) ( j = 1 , 2 , , n )
where rkj is the correlation coefficient between the indicators in matrix B.
(6)
The quantitative coefficients rj for calculating the combined informativeness and degree of independence of each indicator are given in the following formulas:
r j = ( v j + e j ) k = 1 n ( 1 r k j ) ( j = 1 , 2 , , n )
(7)
The weight ω2 of the indicator layer is calculated using the following formula:
ω 2 = r j i = 1 n r j , j = 1 , 2 , , n

2.2.3. Game Theory Combinatorial Weighting (GTCW)

In order to effectively combine subjective and objective weights, it is important to seek the consistency between various evaluation indicators and avoid the subjectivism and error of decision results caused by defects in the process of single weight. The game theory is used to combine the calculation results of the main and objective weights to minimize the deviation between the combined weights and the basic weights and, finally, obtain the main and objective combined weights of indicators [51].
(1)
Construct the set of base weight vectors ωk. Suppose Q weight calculation methods are adopted to assign weights to n evaluation indicators in the indicator evaluation system based on the combination of game theory ideas. Then, the corresponding weight vectors ω k = { ω k 1 , ω k 2 , ω k n } ( k = 1 , 2 , , Q ) can be obtained, and the arbitrary linear combination of n weight vectors, the weight set is further obtained:
W = k = 1 Q α k ω k T ( α k > 0 , k = 1 , 2 , , Q )
where α k is the weighting factor.
(2)
Construct the optimal linear combination. By optimizing the weight coefficients α k , the deviation between ω and each ω k n is minimized by the following equation:
m i n k = 1 Q α k ω k T ω k T 2
Using the differential properties of matrices, the system of linear differential equations for the first order derivative condition of the optimization of the above equation can be derived as:
ω 1 ω 1 T ω 1 ω 2 T ω 1 ω Q T ω 2 ω 1 T ω 2 ω 2 T ω 2 ω Q T ω Q ω 1 T ω Q ω 2 T ω Q ω Q T α 1 α 2 α Q = ω 1 ω 1 T ω 2 ω 2 T ω Q ω 1 T
From the above equation, the optimal linear combination is obtained as (α1, α2, …, αQ), and it is normalized:
α * = α k k = 1 Q α k
(3)
Solve for the final portfolio weights ω:
ω = k = 1 Q α * ω k T , k = 1 , 2 , , Q

2.2.4. Cloud Model (CM)

Cloud model is an important tool to deal with ambiguity and uncertainty. Compared with traditional health assessment methods, the cloud model can comprehensively analyze multi-dimensional data, especially for assessment scenarios involving multi-variables and multi-time scales. By generating cloud parameters, the cloud model can provide intuitive evaluation results, which are easy to interpret and visualize. Therefore, the cloud model can be used to assess the health status of the pump turbine more accurately [52]. In the numerical quantitative field A, U is the qualitative concept of A. If the quantitative value aA, and A is a random quantity on U, membership λ(a) ∈ [0,1], and a is a cloud droplet of cloud A, then:
λ : A [ 0 , 1 ] , a A , a λ ( a )
The digital features of the cloud model include expected Ex, entropy En, and hyper-entropy H, where Ex is the central point of the cloud droplet and represents the central value of the health evaluation index, which usually corresponds to the average health level of the equipment or system in a certain state. En describes the uncertainty of cloud droplets, reflecting the concepts of qualitative randomness and fuzziness. A large entropy value indicates that the health state fluctuates within a large range, which may increase the uncertainty of evaluation due to the influence of various factors. He is the uncertainty index of En, representing the thickness of the cloud layer, and a large overentropy indicates that the uncertainty of the health state is relatively unstable, indicating that the degradation mode of the component is more complex and may be affected by sudden factors, such as abnormal working conditions or sudden failures. The normal cloud model is shown in Figure 1.
The advantages of each evaluation method and the key points of solving problems are shown in Table 4 below.
In the health evaluation of pump turbine, IAHP systematically evaluates the importance of each index through hierarchical analysis to ensure the accuracy of weight allocation. The improved CRITIC method provides an objective method, comprehensively considers the contrast and correlation of indicators, and further improves the reliability of weight allocation. The combinatorial weighting method of game theory focuses on the mutual influence of indicators to form a reasonable weight allocation. The cloud model can deal with uncertainty and ambiguity to ensure the reliability of the evaluation results. The comprehensive application of the above methods can establish a multi-level and multi-dimensional evaluation framework, which can better adapt to the impact of a high proportion of wind energy on the operation characteristics of the pump turbine in the new electrical system and can reflect the health status of the pump turbine more comprehensively.

2.3. Health Evaluation Model

2.3.1. Model Composition

The following assumptions exist in this study: the selected health assessment indicators are relatively independent. In the selected typical week, the meteorological conditions such as wind speed and light remain relatively stable and can characterize the future resource status under similar conditions.
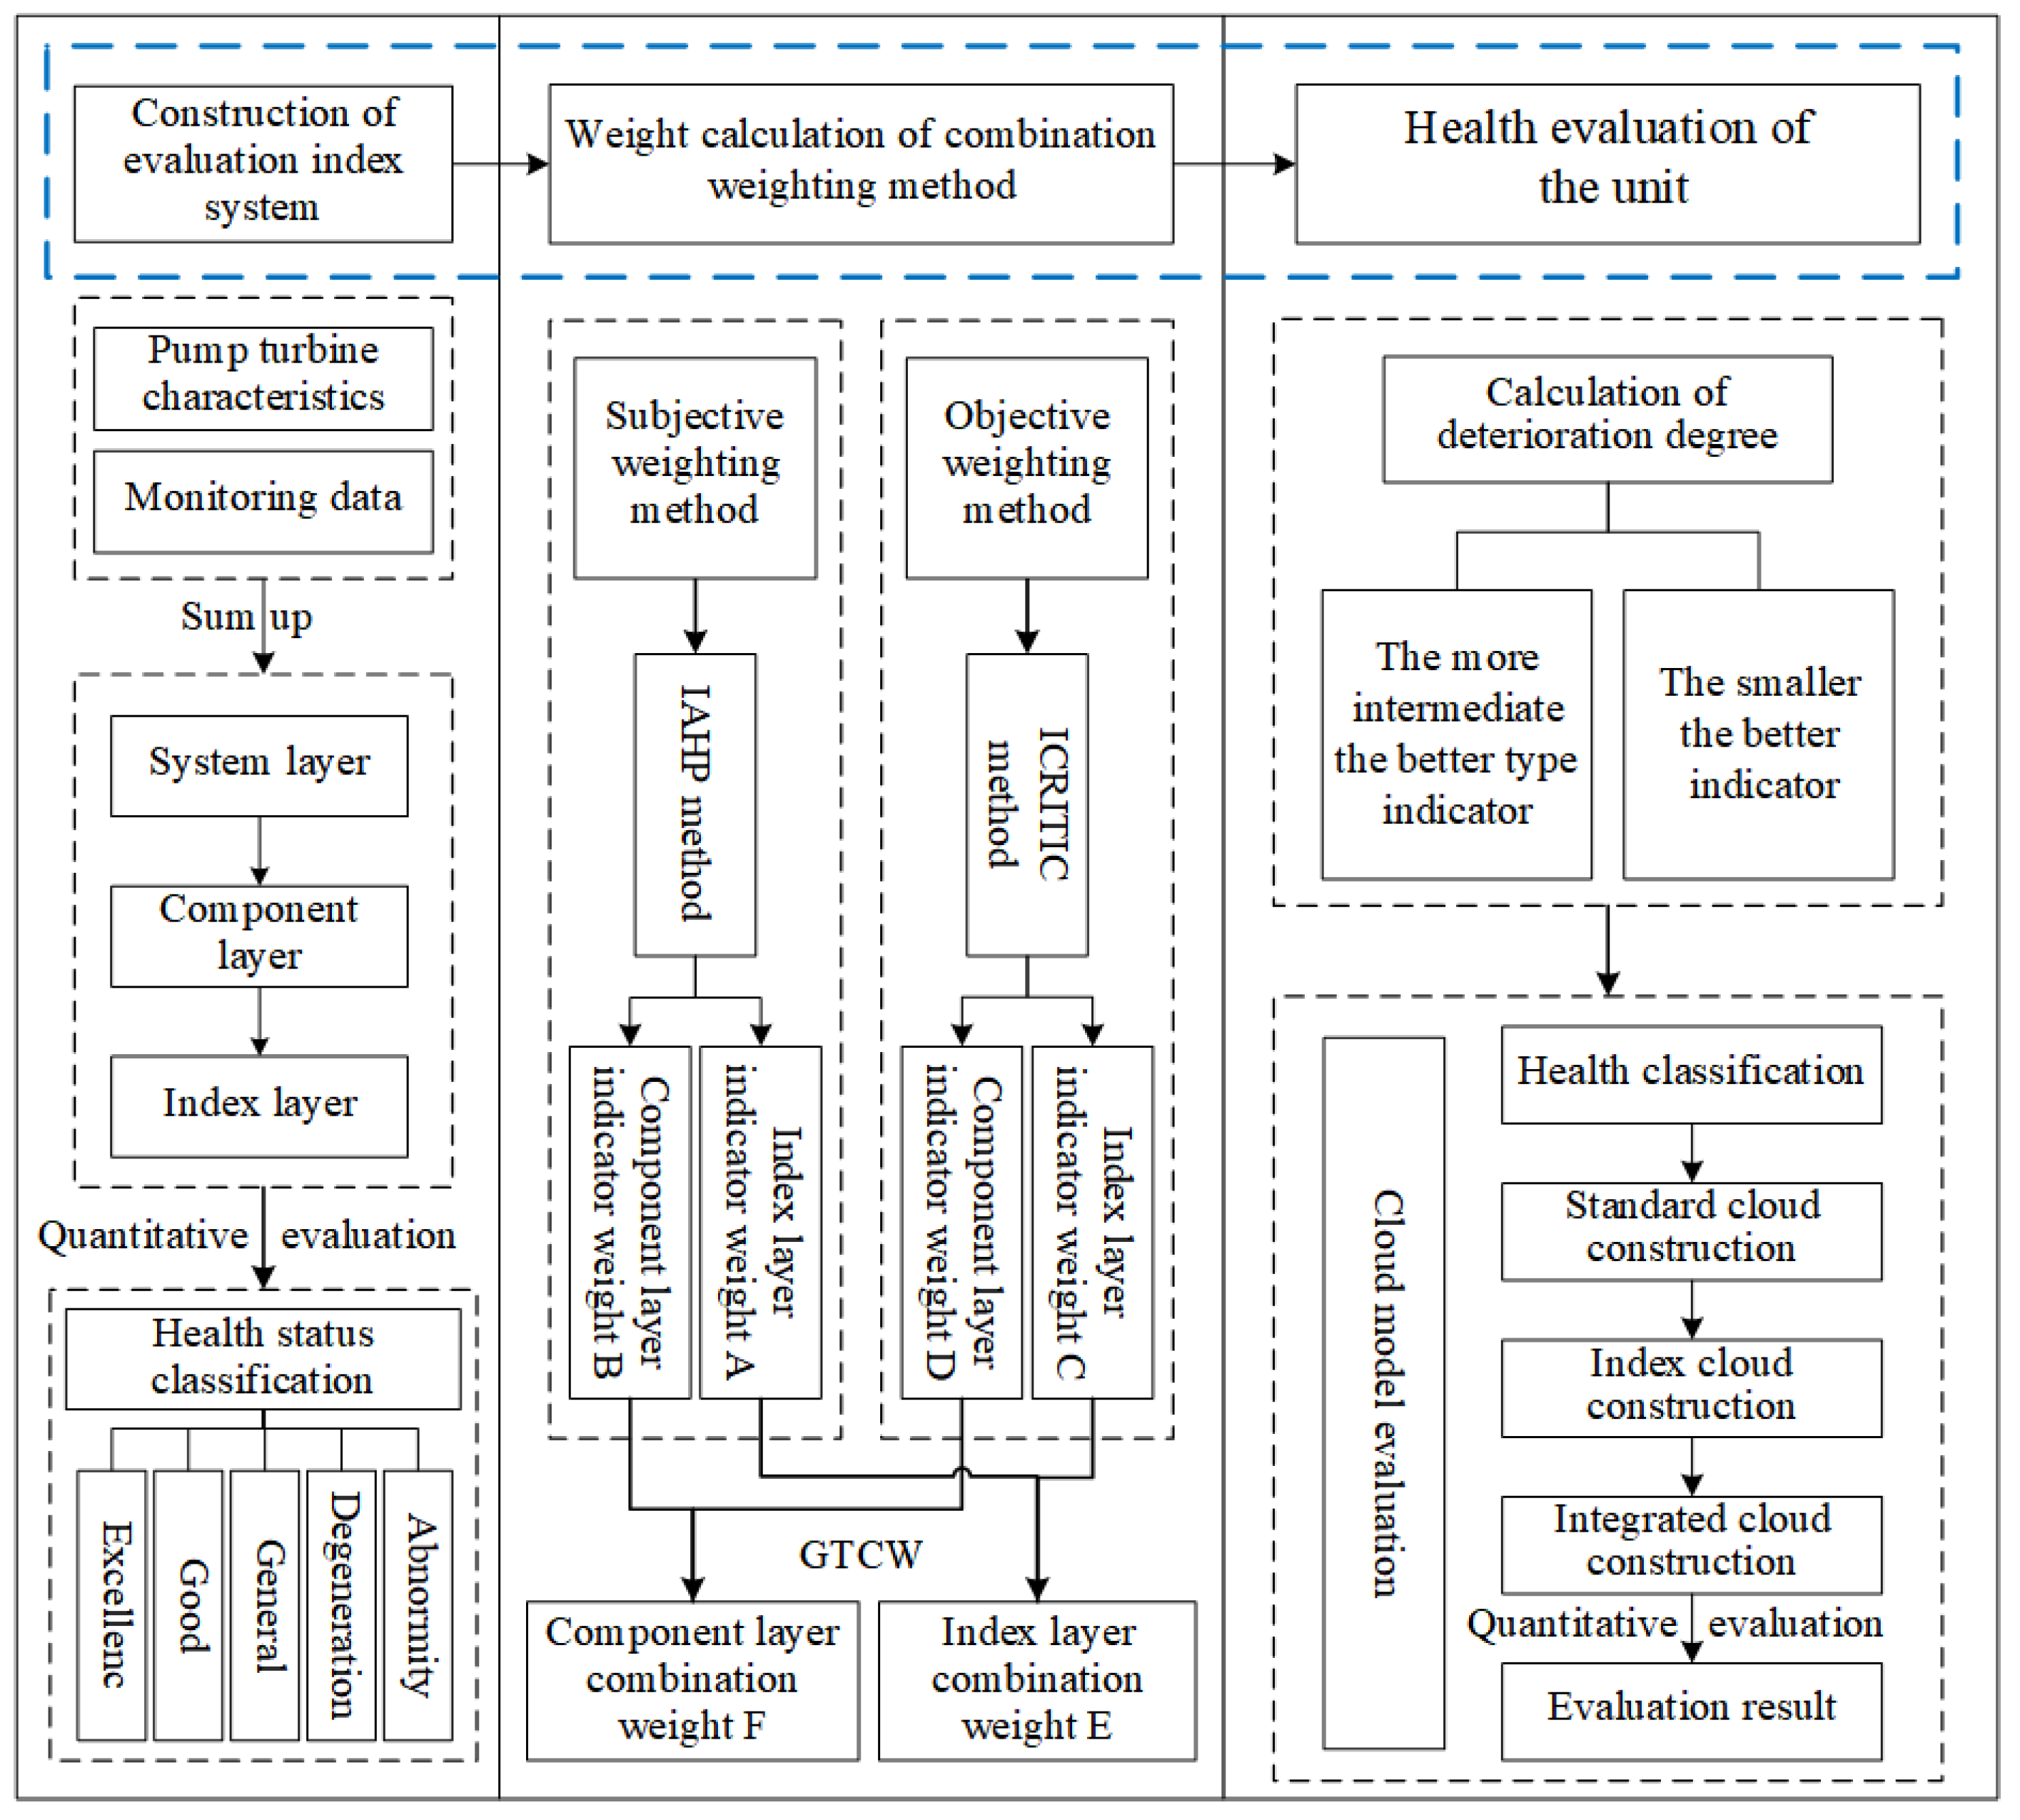
The specific steps of the pump turbine health evaluation method proposed in this paper are shown in Figure 2. The health evaluation process in this paper is mainly divided into three parts: the construction of the evaluation index system, the solution of the weights of the combination assignment method, and the evaluation of the unit’s health status. In the construction part of the evaluation index system, the monitoring data of the unit are first collected according to the operation profile of the pump turbine, then the evaluation index system is divided into the system layer, component layer, and index layer, and the health level is categorized into five levels. In the part of combining assignment to solve the weights, firstly, the IAHP method and ICRITIC method are applied to solve the weights of each index in the index layer, respectively; then, the GTCW method is used to integrate to obtain the combining weights of the index layer; and, finally, the combining weights of the component layer are calculated layer by layer. In the unit condition evaluation section, the deterioration degree of each indicator is first calculated based on the indicator type. Subsequently, the relevant digital features of the cloud model are defined, and the indicator cloud and comprehensive cloud are calculated layer by layer using the measured data. Finally, the health condition evaluation results of the pump turbine are obtained through quantitative evaluation.

2.3.2. Evaluation of the Indicator System

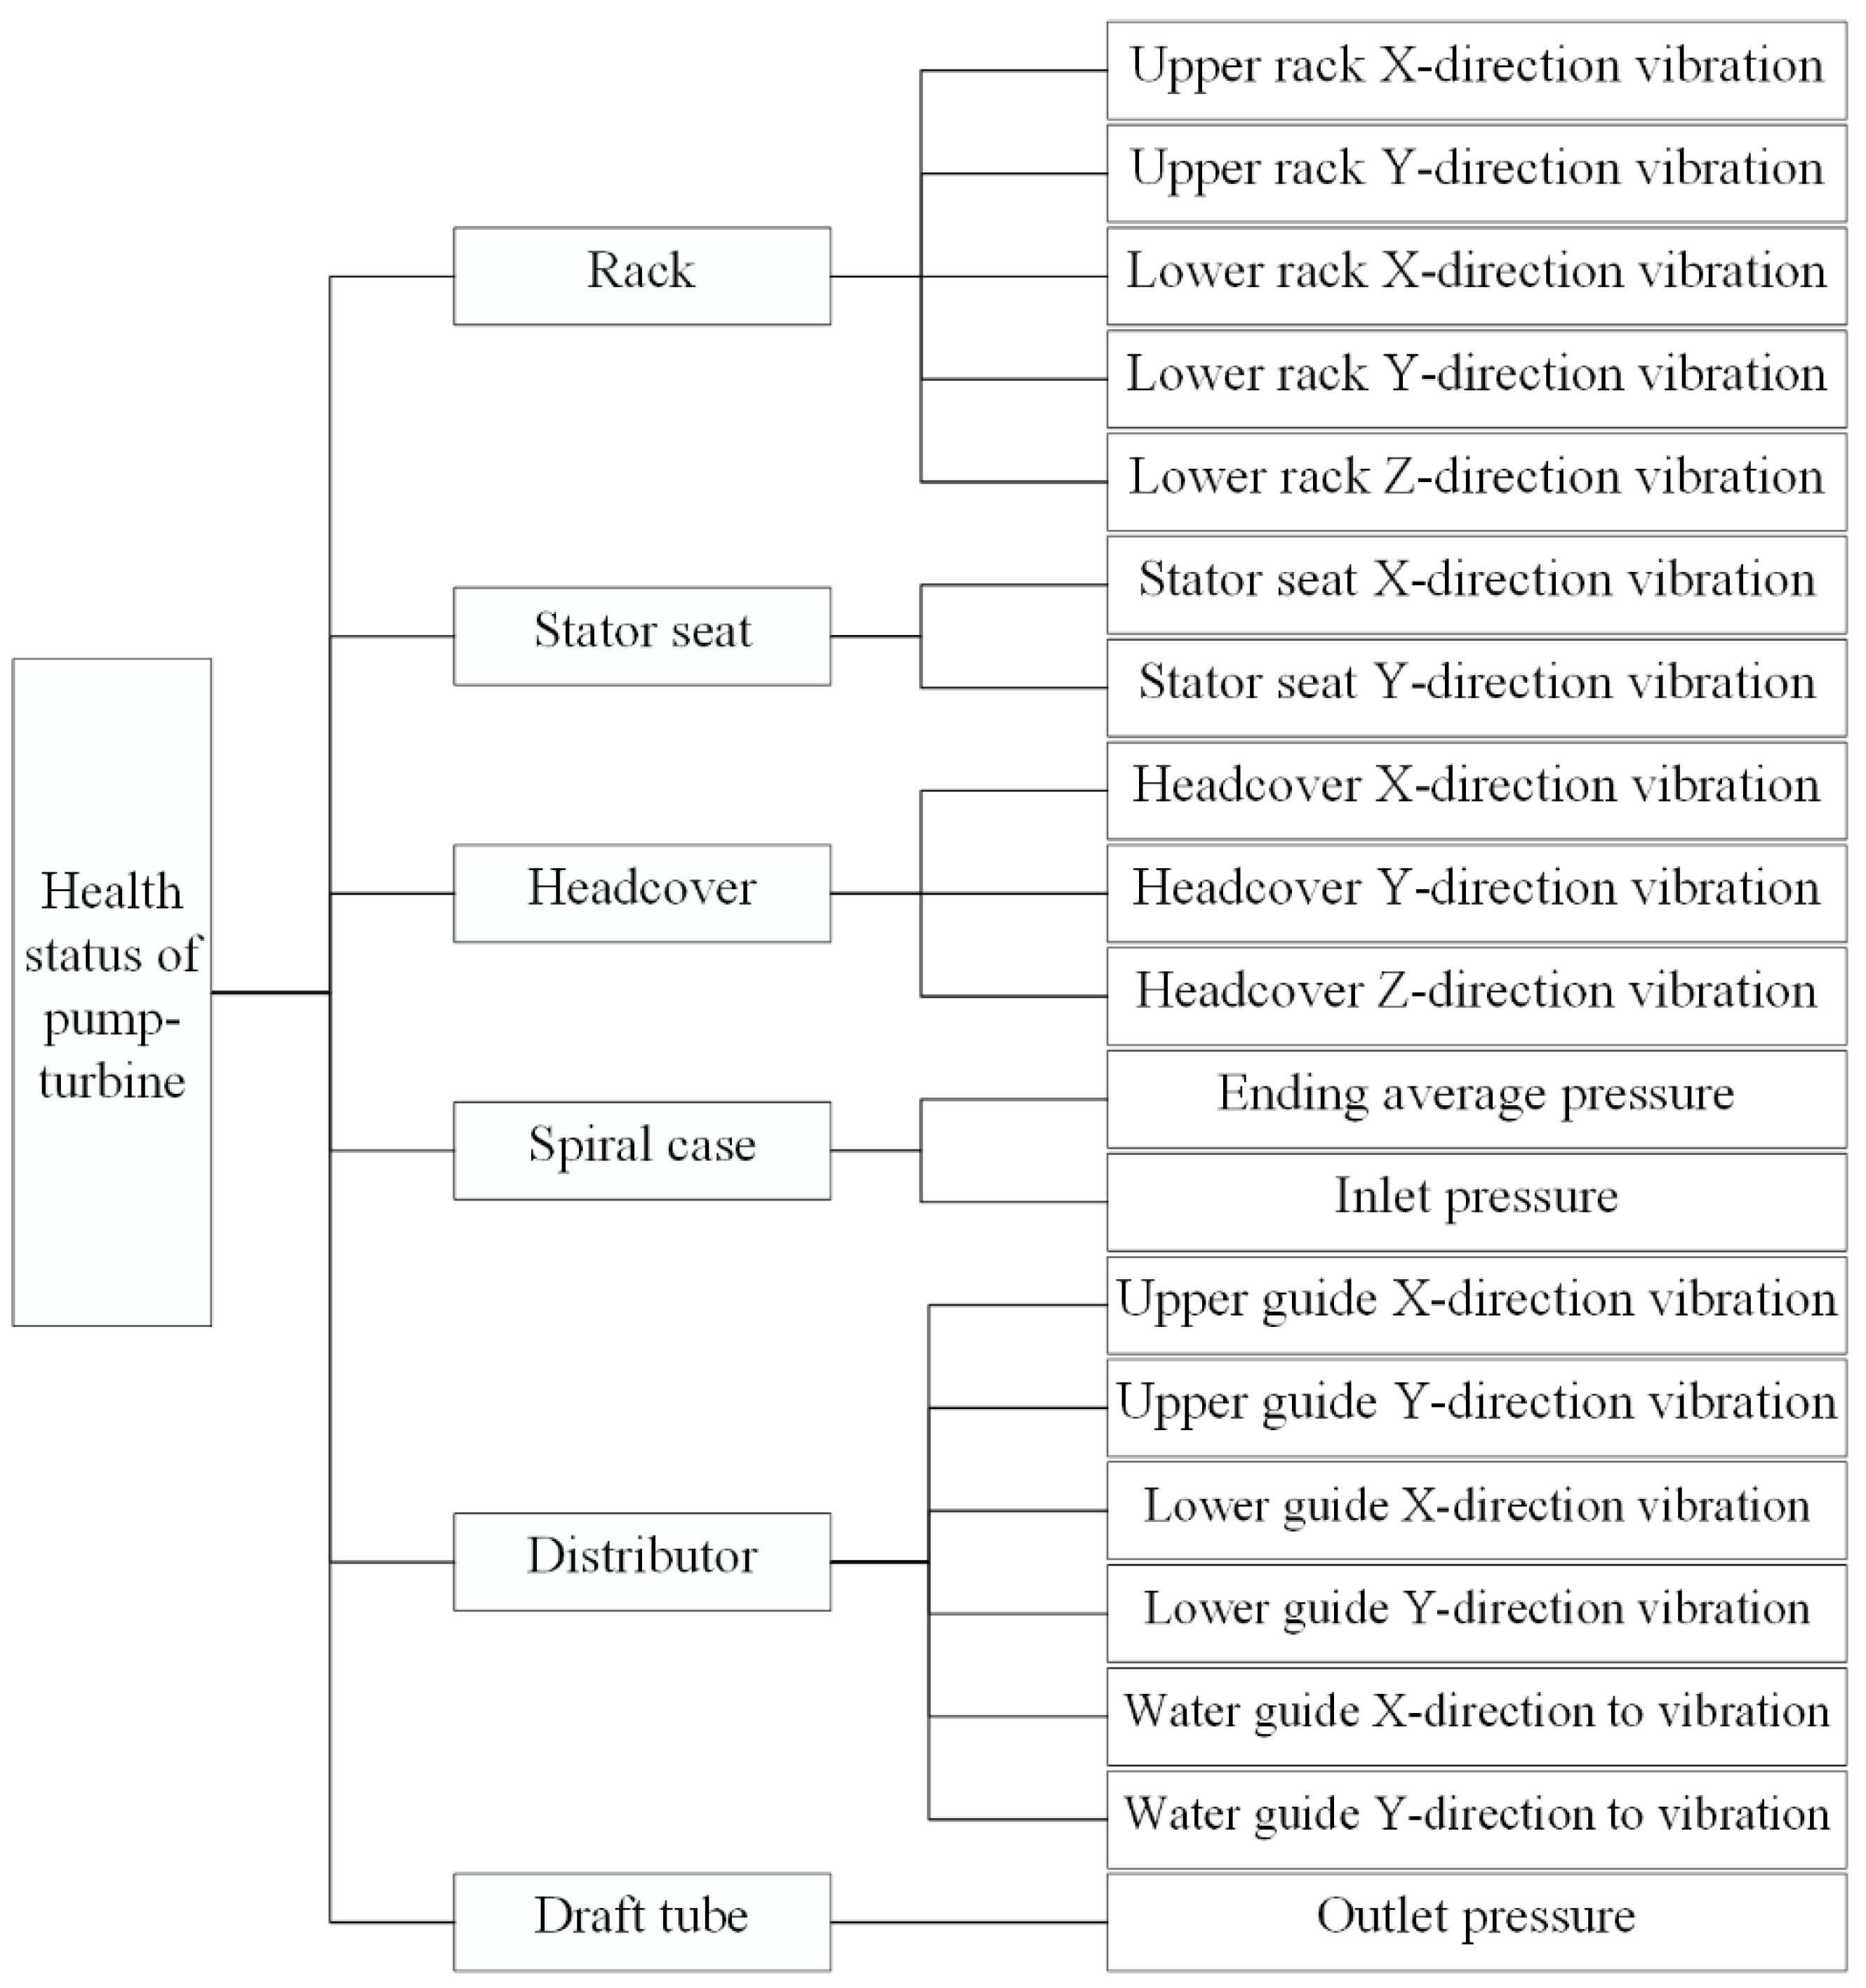
In the new electricity system, due to access to a high proportion of wind power and PV power, the operation environment of pumped storage units has become more complex, and the working condition conversion frequency of the pump turbine has significantly increased, which has intensified the vibration amplitude and frequency during the operation of the unit and, also, put forward higher requirements for the stability and reliability of the equipment. As a key characteristic index of unit operation, vibration signal can effectively reflect most fault characteristics and has high diagnostic and evaluation value. In order to evaluate the health status of pump turbine more comprehensively and accurately, the vibration signal is mainly selected as the measurement index in this paper. Based on the actual situation of the unit, the failure mode and historical data of the unit are comprehensively summarized and analyzed, and a multi-level health assessment index system for pump turbine is established, as shown in Figure 3.
The system consists of 3 level:, the system level, component level, and index level. Where the health state of the pump turbine is taken as the system layer, the system layer is further decomposed into six component layer evaluation indexes, denoted as A = { A 1 , A 2 , A 3 , A 4 , A 5 , A 6 } = {rack, stator seat, headcover, spiral case, distributor, draft tube}, where each component layer element Ai contains n indicators, i.e., Ai = {ai1, ai2, …, ain} and where aij is the j th evaluation indicator of the ith component layer element, e.g., A1 = {rack} = {upper rack X-direction vibration, upper rack Y-direction vibration, lower rack X-direction vibration, lower rack Y-direction vibration, lower rack Z-direction vibration}.

2.3.3. Construction of Cloud Model

The mapping between indicators and measured values is realized by converting the fixed values into cloud parameters through the inverse cloud generator and then transforming the parameters into cloud drops using the forward cloud generator. Finally, the condition evaluation results of the pump turbine unit are obtained [53]. The specific steps are as follows:
(1) Determine the standard cloud. Using the cloud model to evaluate the state of the pump turbine, it is necessary to construct a cloud of evaluation criteria for each layer of indicators as a grade evaluation standard, divided into five state grades. The index score interval and the corresponding grade are shown in Table 5 [54].
Combined with Table 5, the standard cloud parameters are calculated using the following equation.
E x = ( X m a x + X m i n ) 2 E n = ( X m a x X m i n ) 6 H e = k
where k is a constant, determined by the actual application, here taken to be 0.5.
Then, the numerical characteristics of each class are shown in Table 6.
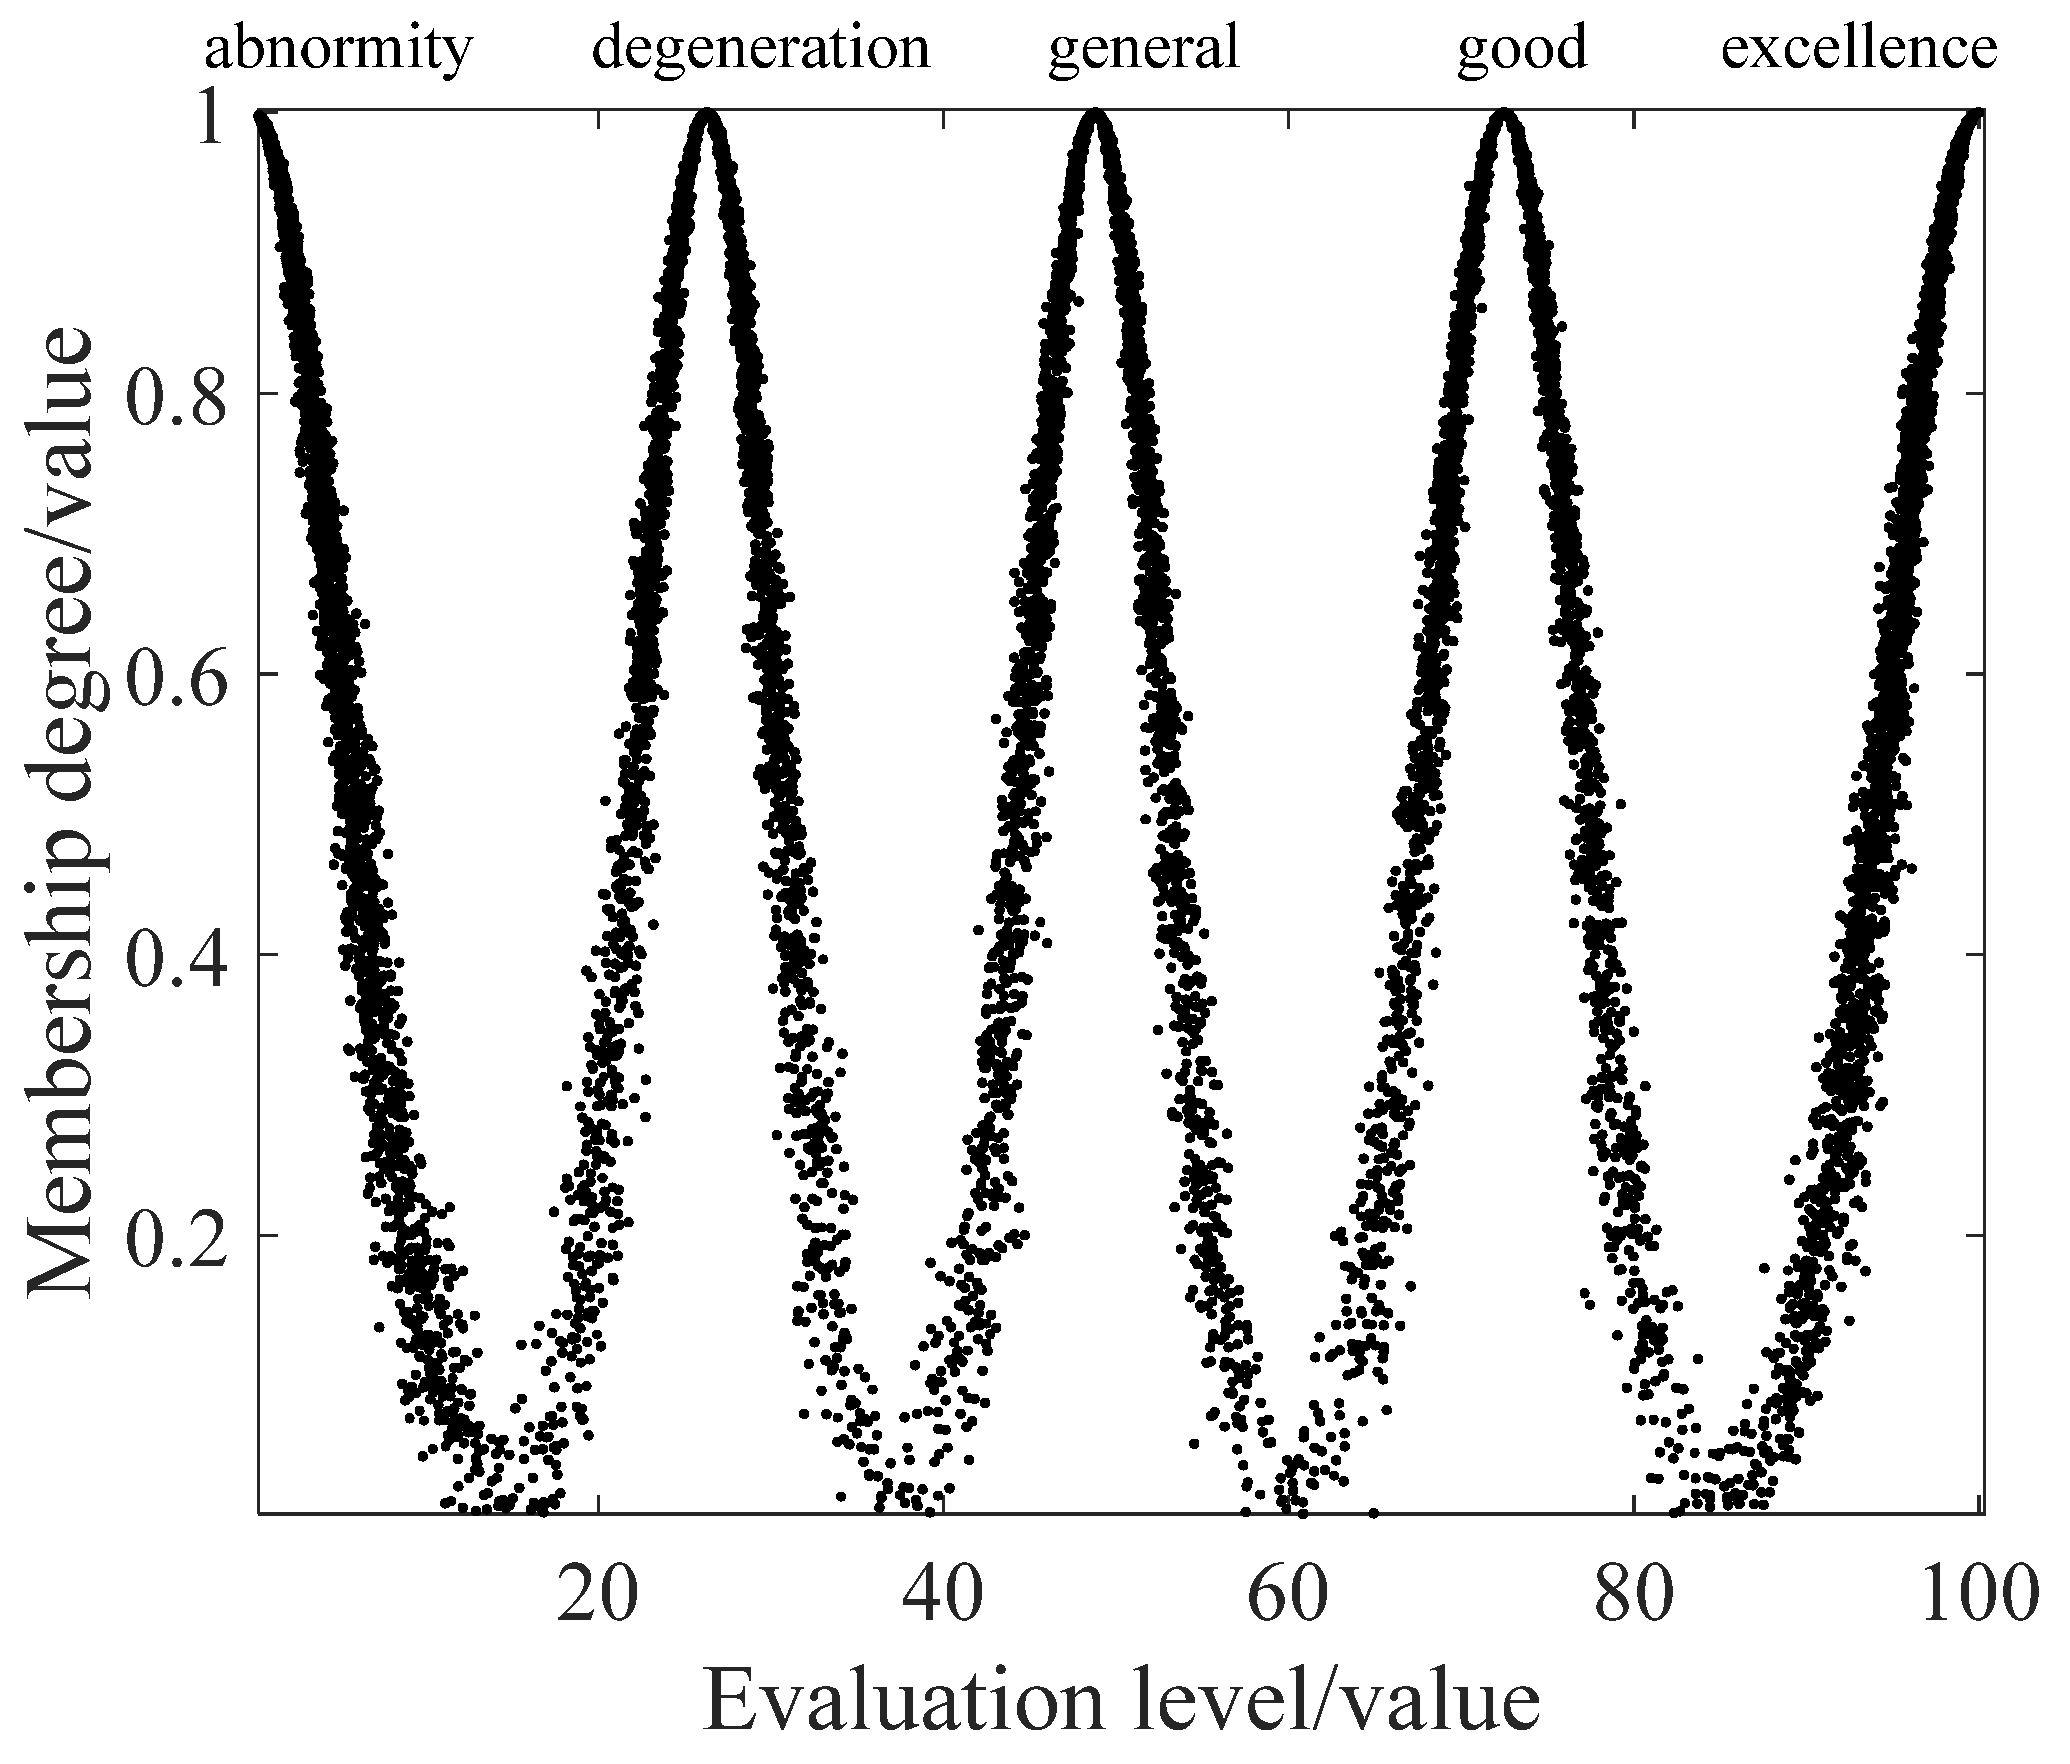
Each digital feature is brought into the cloud generator and solved to obtain the standard cloud model as shown in Figure 4.
(2) Calculate the index cloud parameters. The use of relative degradation to obtain the cloud model parameters of the evaluation metrics prevents the overall evaluation from being too subjective. Relative degree of deterioration characterizes the degree of deterioration of an indicator and ranges from [0, 1] where a relative degree of deterioration of 0 represents the best performance of the indicator, mapping to a healthy level for the healthiest; a relative deterioration of 1 represents the worst performance of the indicator and maps to a healthy level as the most abnormal. Deterioration is divided into two main types of indicators: the more intermediate the better type and the smaller the better type [55]:
(1)
For the smaller the better type indicator, such as the temperature parameter, the deterioration formula can be expressed as:
g ( x ) = 0 x < x m i n x x m i n x m a x x m i n x m i n x x m a x 1 x x m a x
(2)
For intermediate more-optimal type indicators, such as pressure, the deterioration formula can be expressed as:
g ( x ) = 1 x < x m i n x x m i n γ 1 x m i n x m i n x < γ 1 0 γ 1 x γ 2 x m a x x x m a x γ 2 γ 2 < x x m a x 1 x > x m a x
where g(x) is the degradation, x m i n < γ1 < γ2 < x m a x 1 and γ2 are optimal); x is the measured value of the parameter, and [ x m i n , x m a x ] are the parameter operating intervals.
To facilitate the evaluation of health status, the degree of deterioration was mapped to a health level score. The health level score data were converted to the health level score using the following equation:
ν ( x ) = H m a x × [ 1 d ( x ) ]
where H m a x is the upper limit of the health evaluation level score, which is taken as 100 in this paper; d ( x ) is the deterioration degree of the x th indicator.
Assuming that there is a total of n sets of data for an indicator, the corresponding relative degree of deterioration can be calculated and then mapped to a health level score, and the formulas for the numerical features of the cloud model for this indicator are, respectively:
E x = 1 n i = 1 n ν i
E n = π 2 1 n i = 1 n | ν i E x |
H e = 1 n 1 i = 1 n ( ν i E x ) 2 E n 2
where ν i is the health level score of group i.
Using the numerical features obtained from the solution brought into the forward cloud generator to generate an indicator cloud map and compare it with the standard cloud map, the health level mapped by the parameter can be qualitatively obtained.
(3)
Integrated cloud solving and quantization
Assuming that there is a total of m metrics in a component layer, the synthesized cloud parameters for this component layer are calculated as follows:
E x = i = 1 m W i E x i
E n = i = 1 m W i 2 i = 1 m W i 2 E n i 2
H e = i = 1 m W i 2 i = 1 m W i 2 H e i 2
where W i is the weight of each indicator, (Exi, Eni, Hei) is the parameter of each evaluation index cloud.
After the three digital characteristics of the integrated cloud are obtained, the health status of the component layer can be analyzed according to the comparison between the integrated cloud image and the standard cloud image. Specifically, the domain center point (Ex) of the cloud image represents the standard position of the turbine under the health state, while the uncertainty (En) of the cloud droplet reflects the qualitative randomness and fuzziness, quantifying and reflecting the uncertainty of the system. The thickness of the cloud (He) reflects the degree of ambiguity of the system, and the greater the thickness, the higher the uncertainty or ambiguity of the health state. Through the comparison method of the integrated cloud image, the operation state of the turbine can be evaluated effectively, and the possible faults or anomalies can be predicted according to the morphological changes of the cloud image.
However, in order to make it easier to distinguish the health level to which the cloud map belongs, the quantitative metric of cloud affiliation is introduced [56].
φ i = C ( C i , C 0 ) i = 1 5 C ( C i , C 0 )
where φ i is the affiliation of the i th class under the index set; C ( C i , C 0 ) is the similarity of the two cloud models of C i and C 0 . The similarity formula is as follows:
C ( C i , C 0 ) = 1 2 + 1 2 θ θ
where θ is calculated as follows:
θ = t 1 2 π e x 2 2 d x
where t is calculated as follows:
t = | E x i E x 0 | E n i 2 + H e i 2 + E n 0 2 + H e 0 2
The calculation of the cloud affiliation degree allows for a more intuitive view of the health level of the object. This enables targeted work for subsequent maintenance, cause detection, etc.

3. Analysis of Results

3.1. System Composition and Mode of Operation

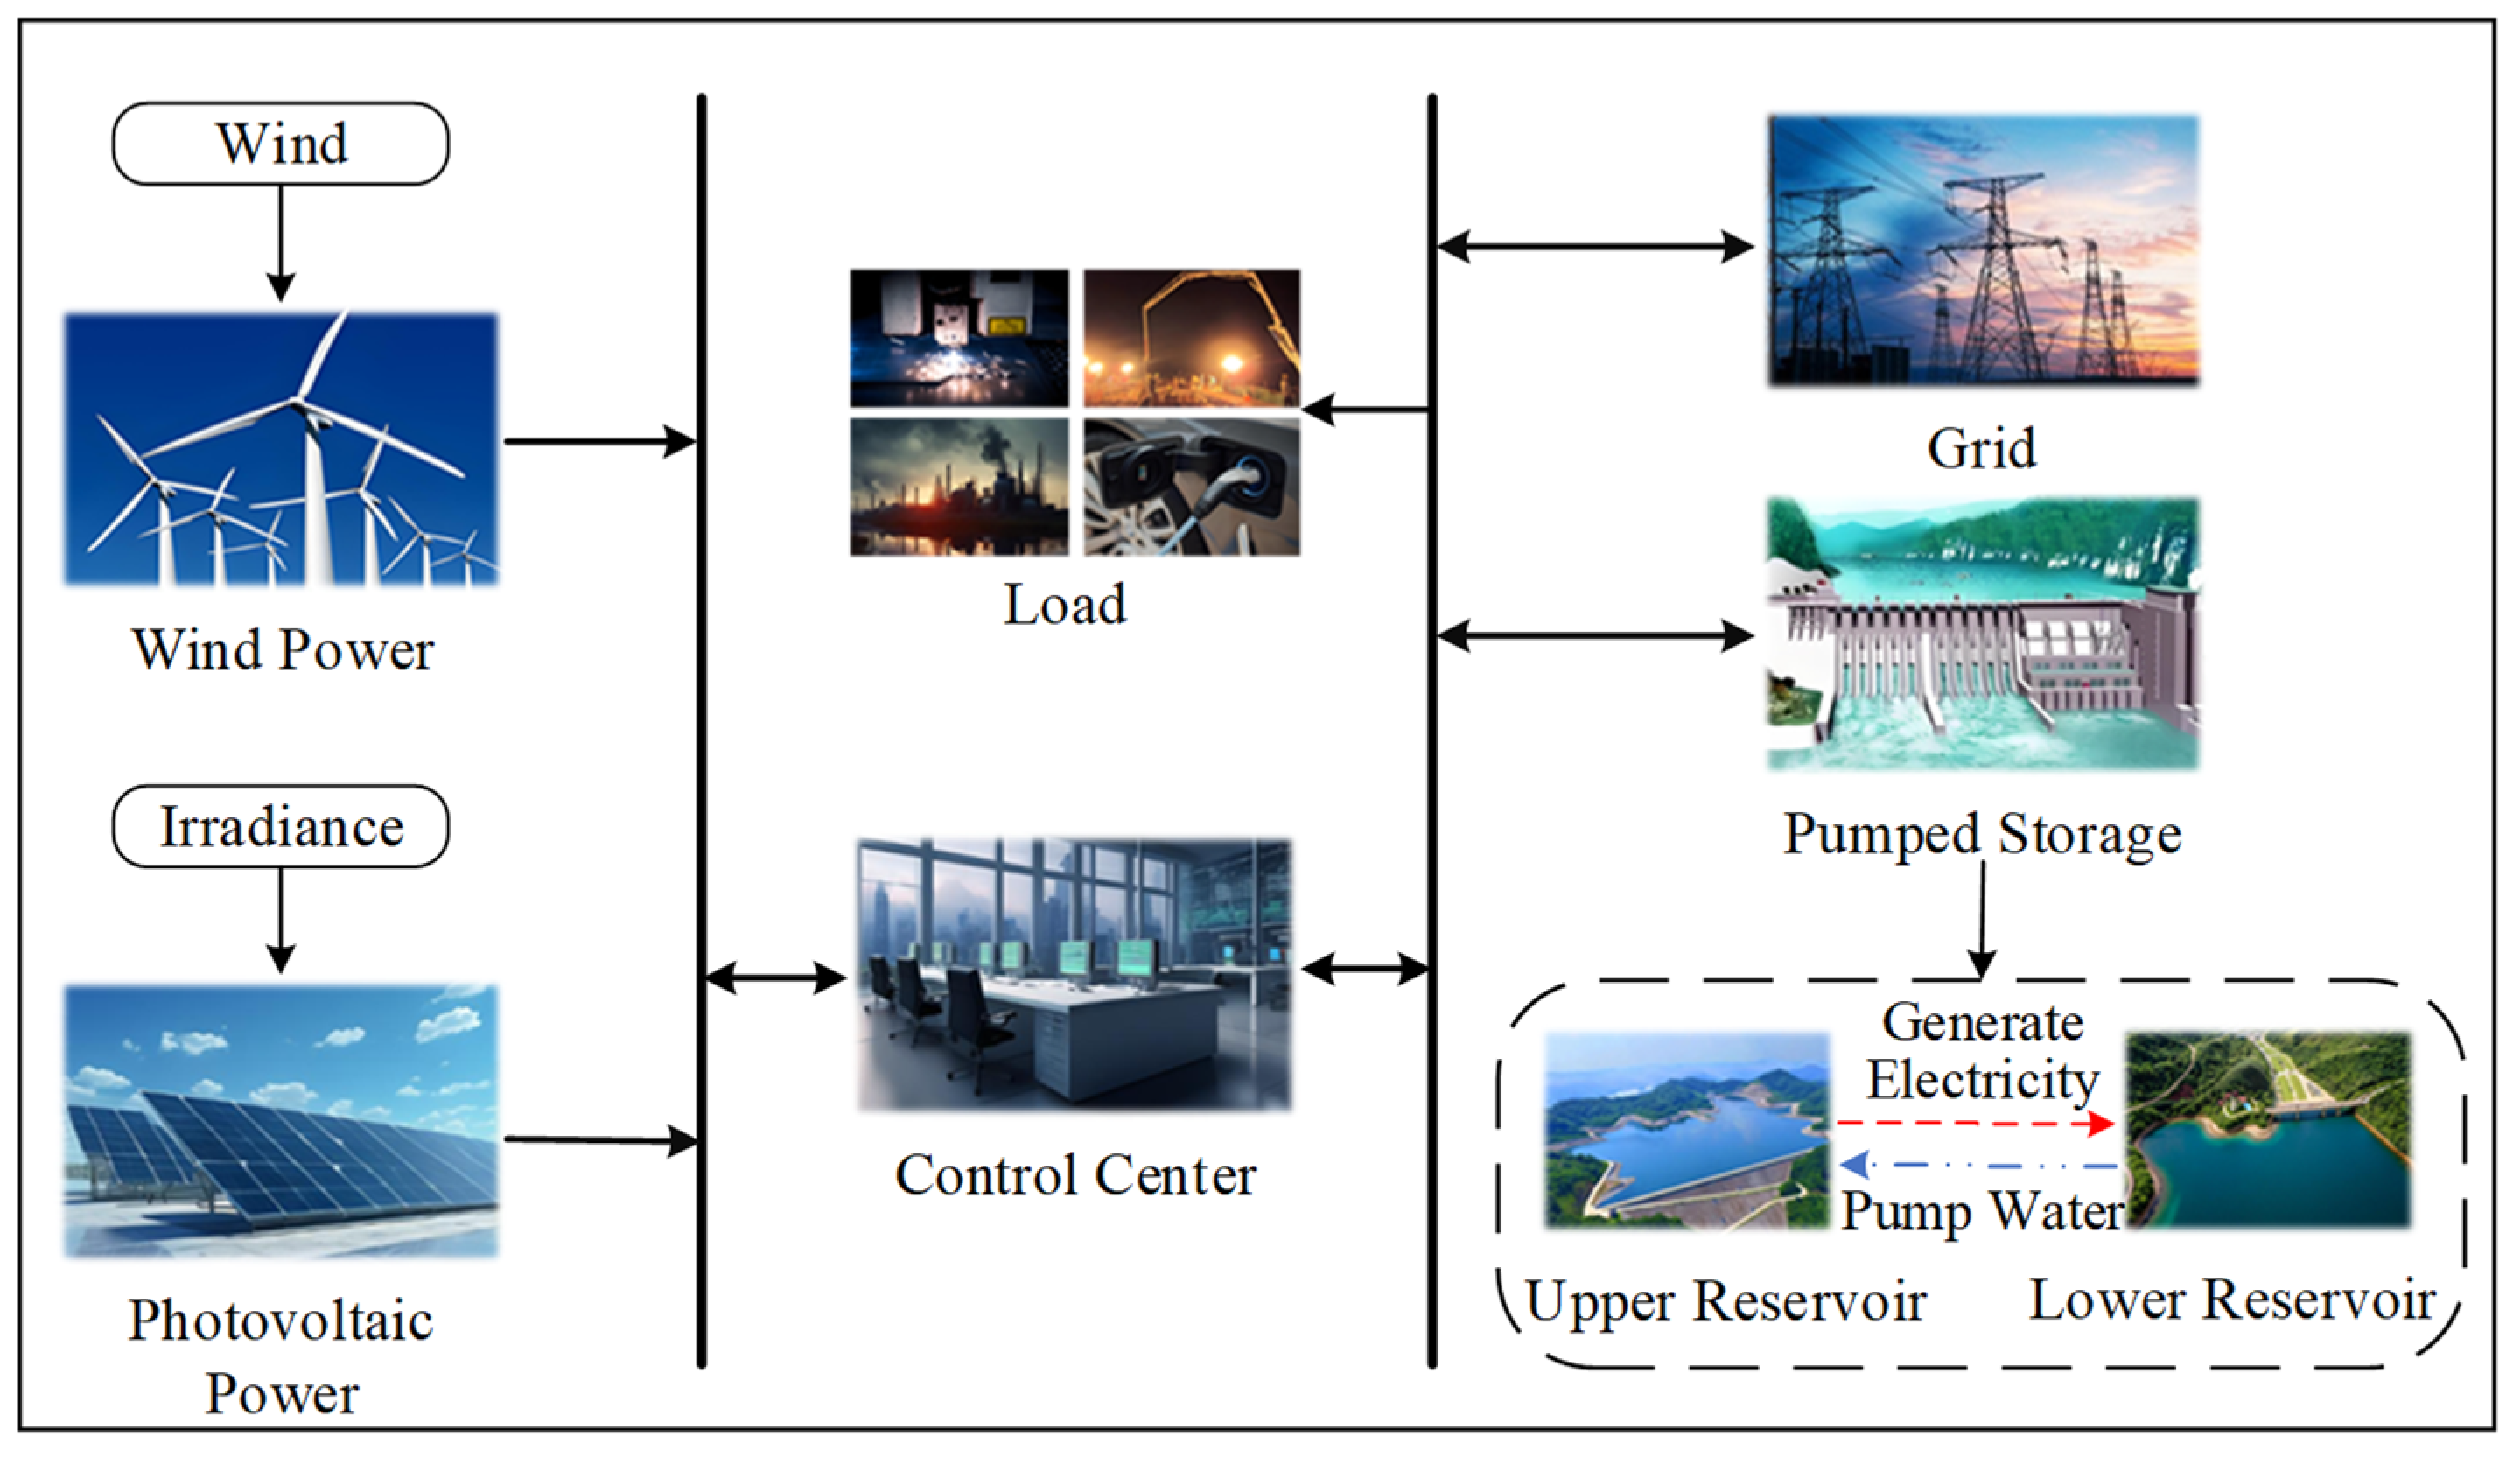
A wind–light-pumped storage complementary system combines wind power and photovoltaic power generation with pumped storage technology. Wind and PV power generation is used to meet electricity demand, and pumped storage units are used to smooth out the volatility caused by wind and PV power generation. Health evaluation of pump turbines in pumped storage units with a high percentage of wind and PV power connection is investigated based on a hybrid wind/PV/pumped storage system. This hybrid system has an installed capacity of 2688 MW of PV power, 1263 MW of wind power, 1200 MW of pumped storage plants, and 1000 MW of transmission corridors. The structure of the hybrid wind/PV/pumped storage system is shown in Figure 5. The hybrid system has two modes of operation:
(1)
When wind and PV power generation is sufficient, and the load demand is not large at that time, the excess power will be pumped through the pumped storage plant to convert the excess power into water potential energy storage to be used when the load peaks.
(2)
When the load demand is large but the wind and PV power generation is insufficient, for example, the wind and PV power generation has been fully generated but still cannot meet the demand of the grid load, the pumped storage power station will have stored water released to the lower reservoir, and the potential energy of the water will be converted into electricity, using pumped storage fast peak shifting frequency adjustment ability and rapid tracking of the load, to solve the demand of the power grid.
By integrating wind and PV resources around the pumped storage power plant, this study analyzes the wind and PV output characteristics over 8760 h and the output characteristics of the hybrid wind/PV/pumped storage system over 168 h, and explores the role of the pumped storage plant in smoothing out the fluctuations of wind and PV power generation in the new electricity system. Based on the actual monitoring data of different components of pumped storage unit No. 1 in the hybrid wind/PV/pumped storage system under a certain operating condition in 2021, further research on the health evaluation of pumped storage units within the new electricity system was carried out.

3.2. System Output Characteristics

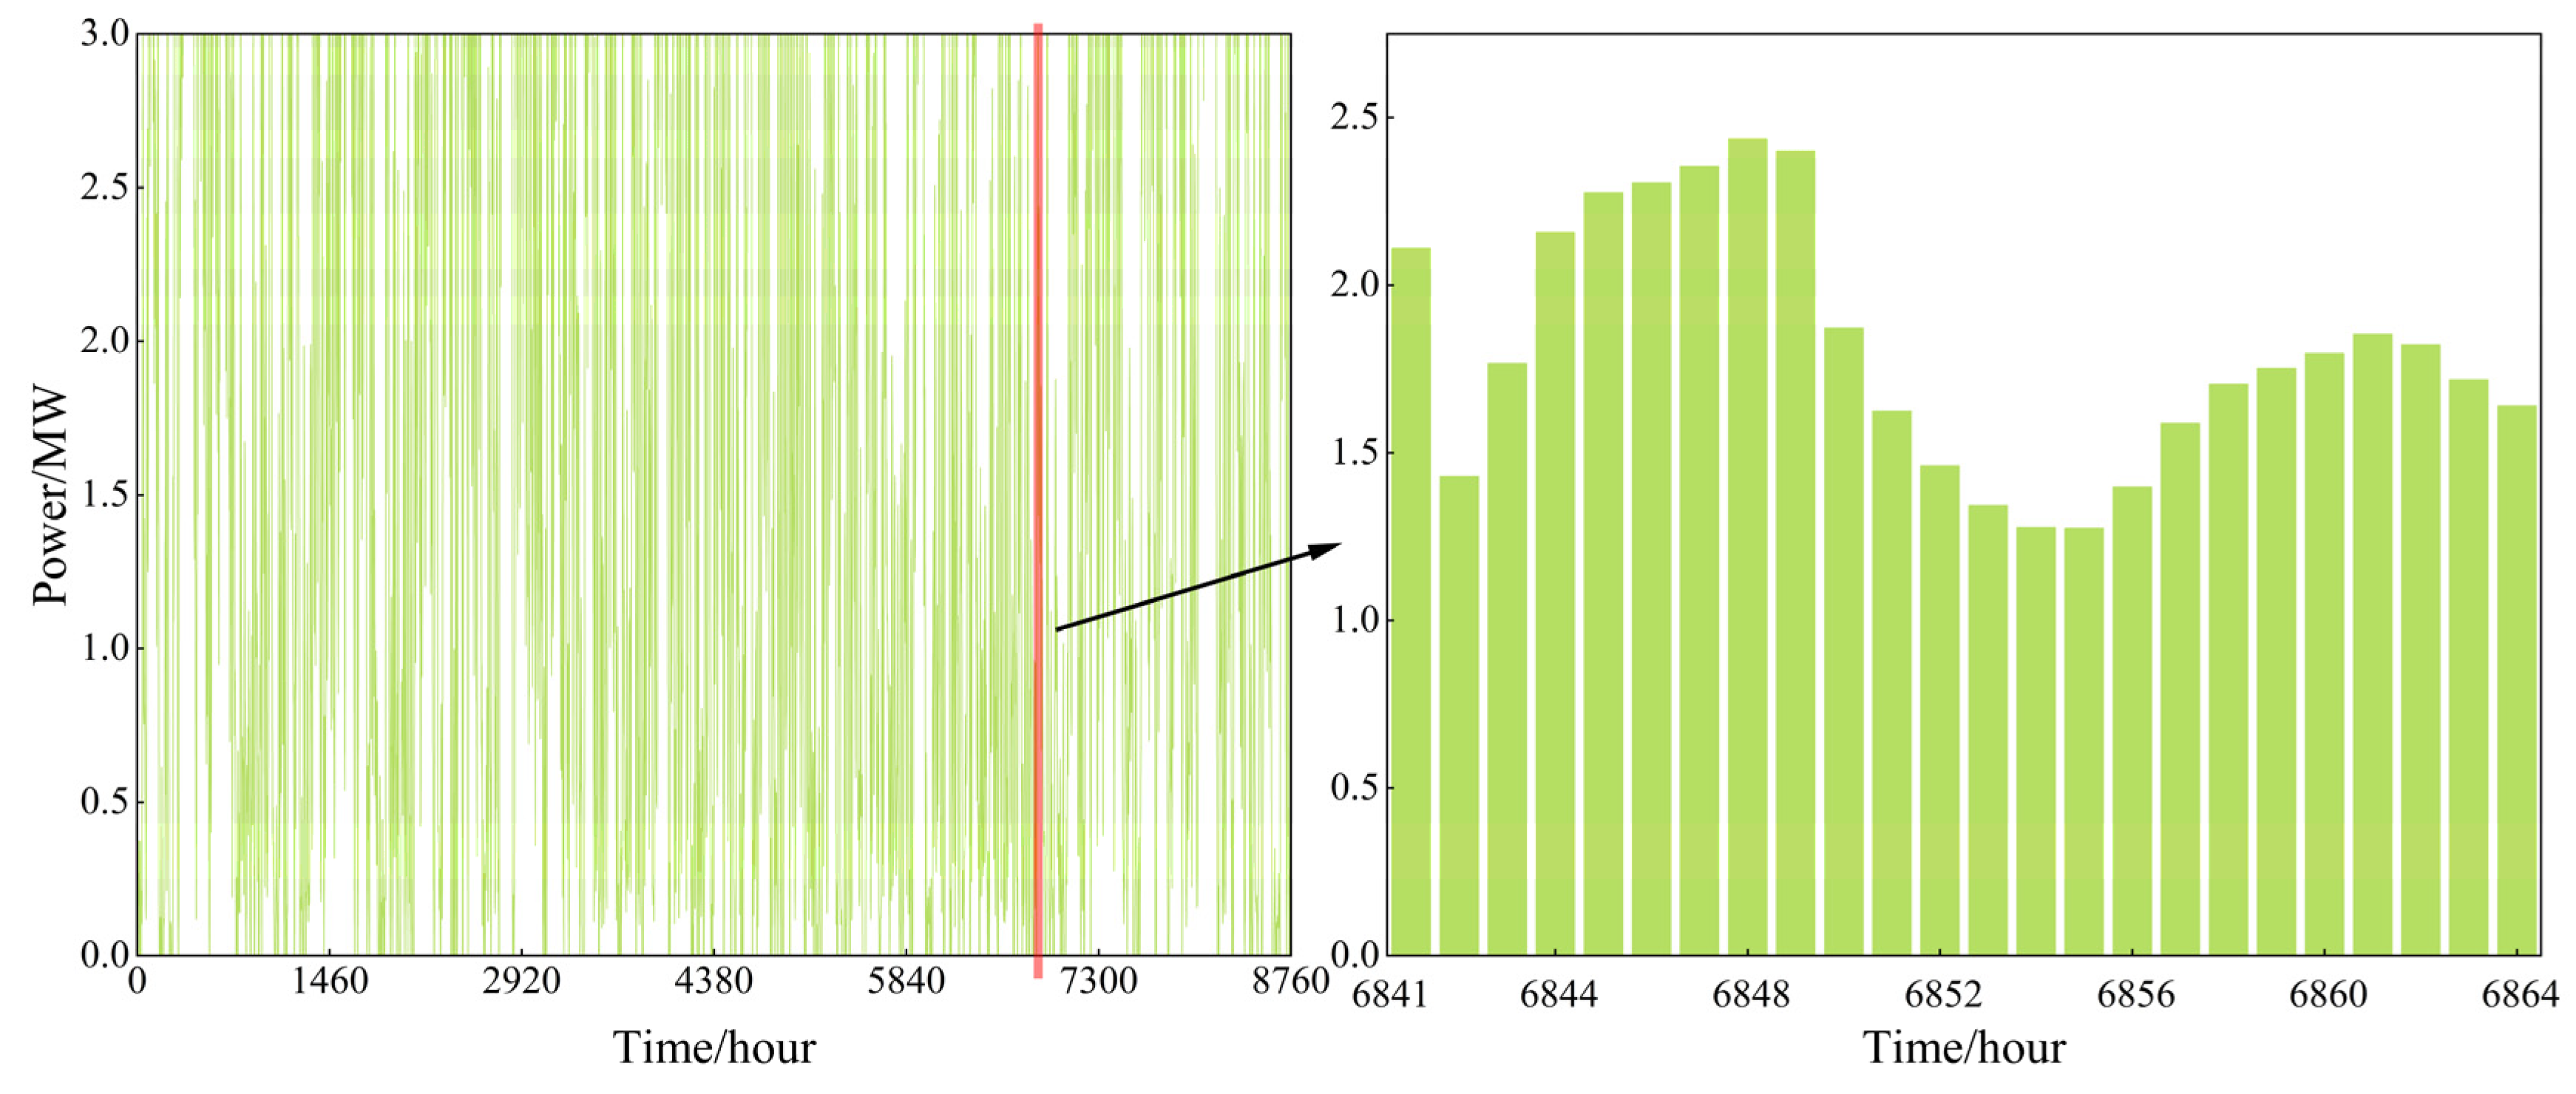
Using the wind speed, irradiance, and other parameters around the power station, the output is calculated by the above system output model, which is visualized to obtain the 8760 h wind and PV output of the power station in a certain year (see Figure 6 and Figure 7).
PV and wind power generation are affected by season, weather, and other factors; the power generation characteristics show strong volatility and stochasticity (see Figure 6 and Figure 7) due to the output characteristics of the PV power generation system and wind power generation system. They also have a natural spatiotemporal complementary characteristics, so the hybrid system reduces the system output fluctuations to a certain extent. However, the power generation system after wind–PV coupling cannot meet the load demand. Therefore, the pumped storage power plant can be used to smooth the fluctuation of wind and PV output in the area to achieve efficient storage and utilization of energy.
From the calculation of wind and PV output in Figure 6 and Figure 7, the average annual continuous power output of wind and PV power is 1150.3 MW. Four typical weeks from spring, summer, autumn, and winter are selected as the time scale in Figure 8.
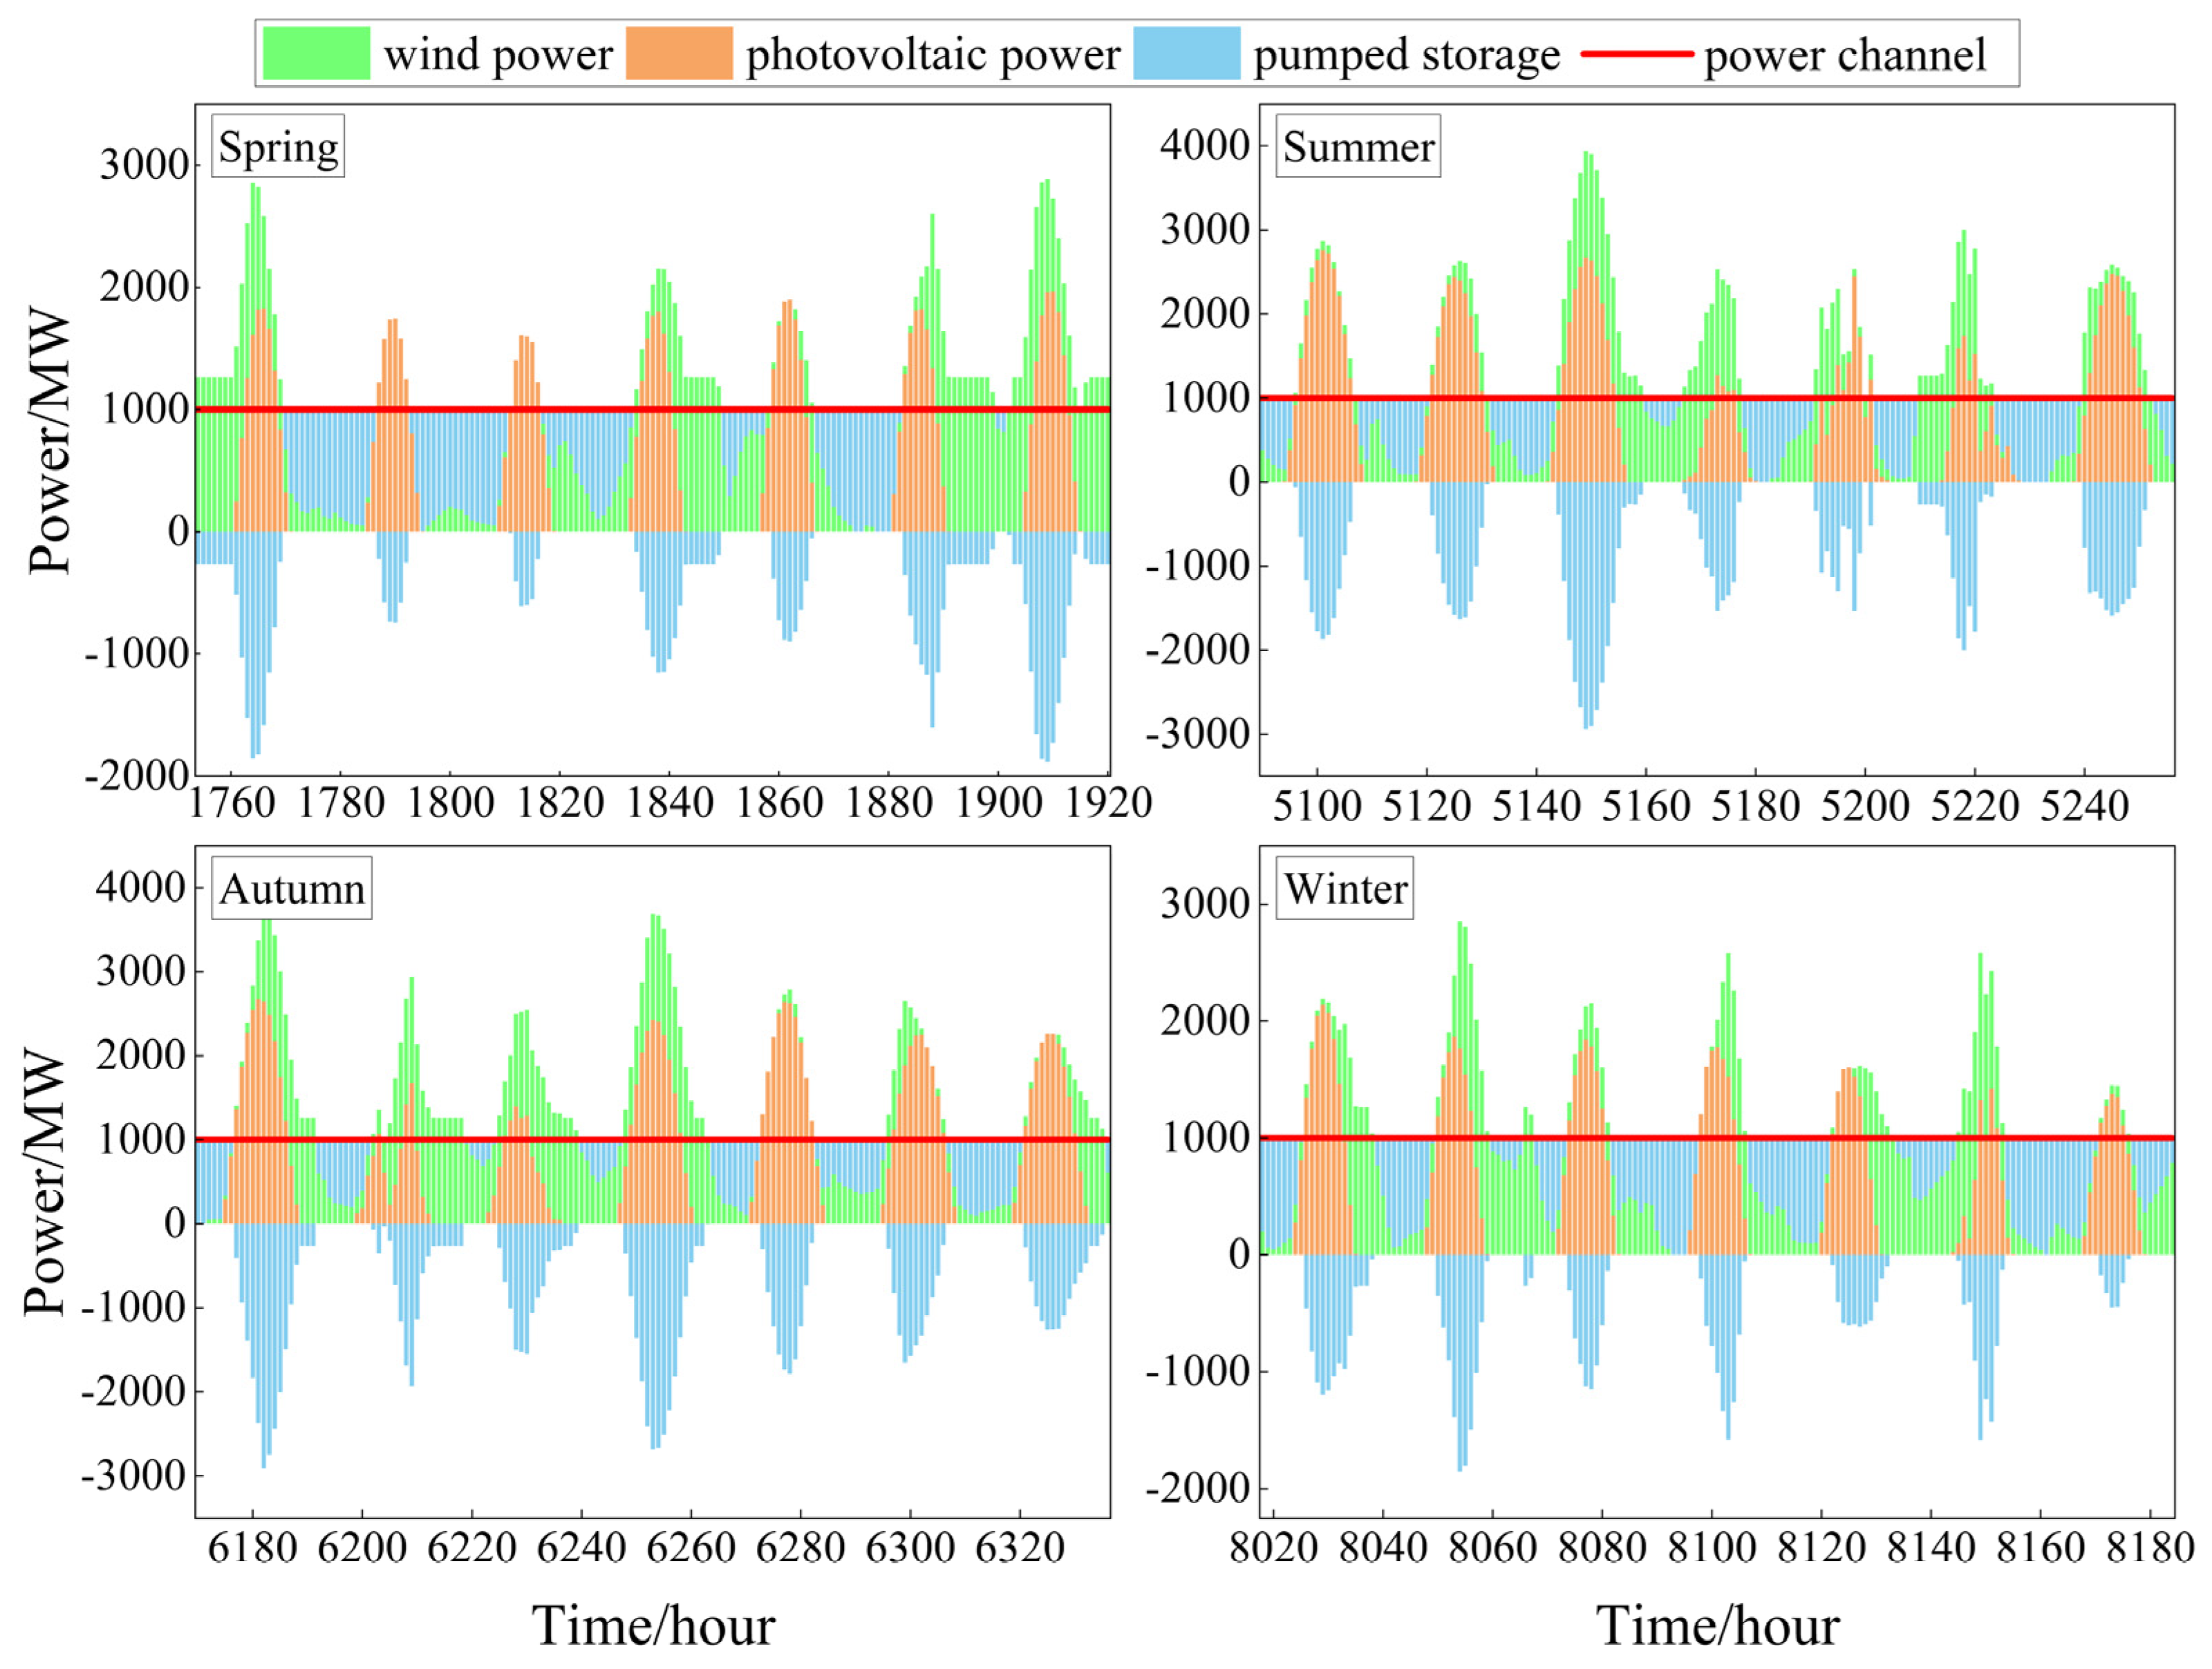
According to the analysis in Figure 8, the 3rd week in spring, the 9th week in summer, the 3rd week in autumn, and the 1st week in winter are selected as typical weeks for follow-up research. By taking the difference of the sum of the 1000 MW transmission channel and the hybrid wind–PV output as the output of the pumped storage unit, when the difference is greater than 0, the unit is in power generation condition. On the contrary, the unit is in pumping condition, and the output characteristic curve of the hybrid wind–PV-pumped storage system is finally obtained, as shown in Figure 9.
By comparing and analyzing the output of spring scenario in Figure 9 with that of conventional pumped storage in the same period, Figure 10 can be obtained.
When the output of a pumped storage unit is negative, it means that it is in the pumping condition. When the output is positive, it is in the power generation condition. As can be seen from Figure 10, the conventional pumped storage unit performs one pumping and two pumping in a day and realizes seven pumping and fourteen power generation in a week, with a total of fourteen times of working condition conversion. After access to a high proportion of wind and PV resources, the pumped storage unit achieved multiple pumping and multiple power generation within a week, and the number of working conditions was more than 30 times, and the conversion frequency was significantly higher than the level before access.
It can be seen that in the new electrical system, the pumped storage unit needs to adjust its operating state more frequently to adapt to the intermittency brought about by the high proportion of wind and PV power generation. However, frequent switching of operating conditions, especially between pumping and power generation modes, can cause additional wear and fatigue on key components of the unit, thus accelerating the aging process and increasing the risk of failure.
In new electricity systems, the intermittent nature of a high proportion of wind and PV power can lead to fluctuations in grid frequency, and pumped storage units need to adjust their operating conditions more frequently to adapt to such changes. However, such frequent switching of operating conditions, especially between pumping and power generation modes, may cause additional wear and fatigue on the unit’s critical components, which can accelerate the aging process and increase the risk of failures.
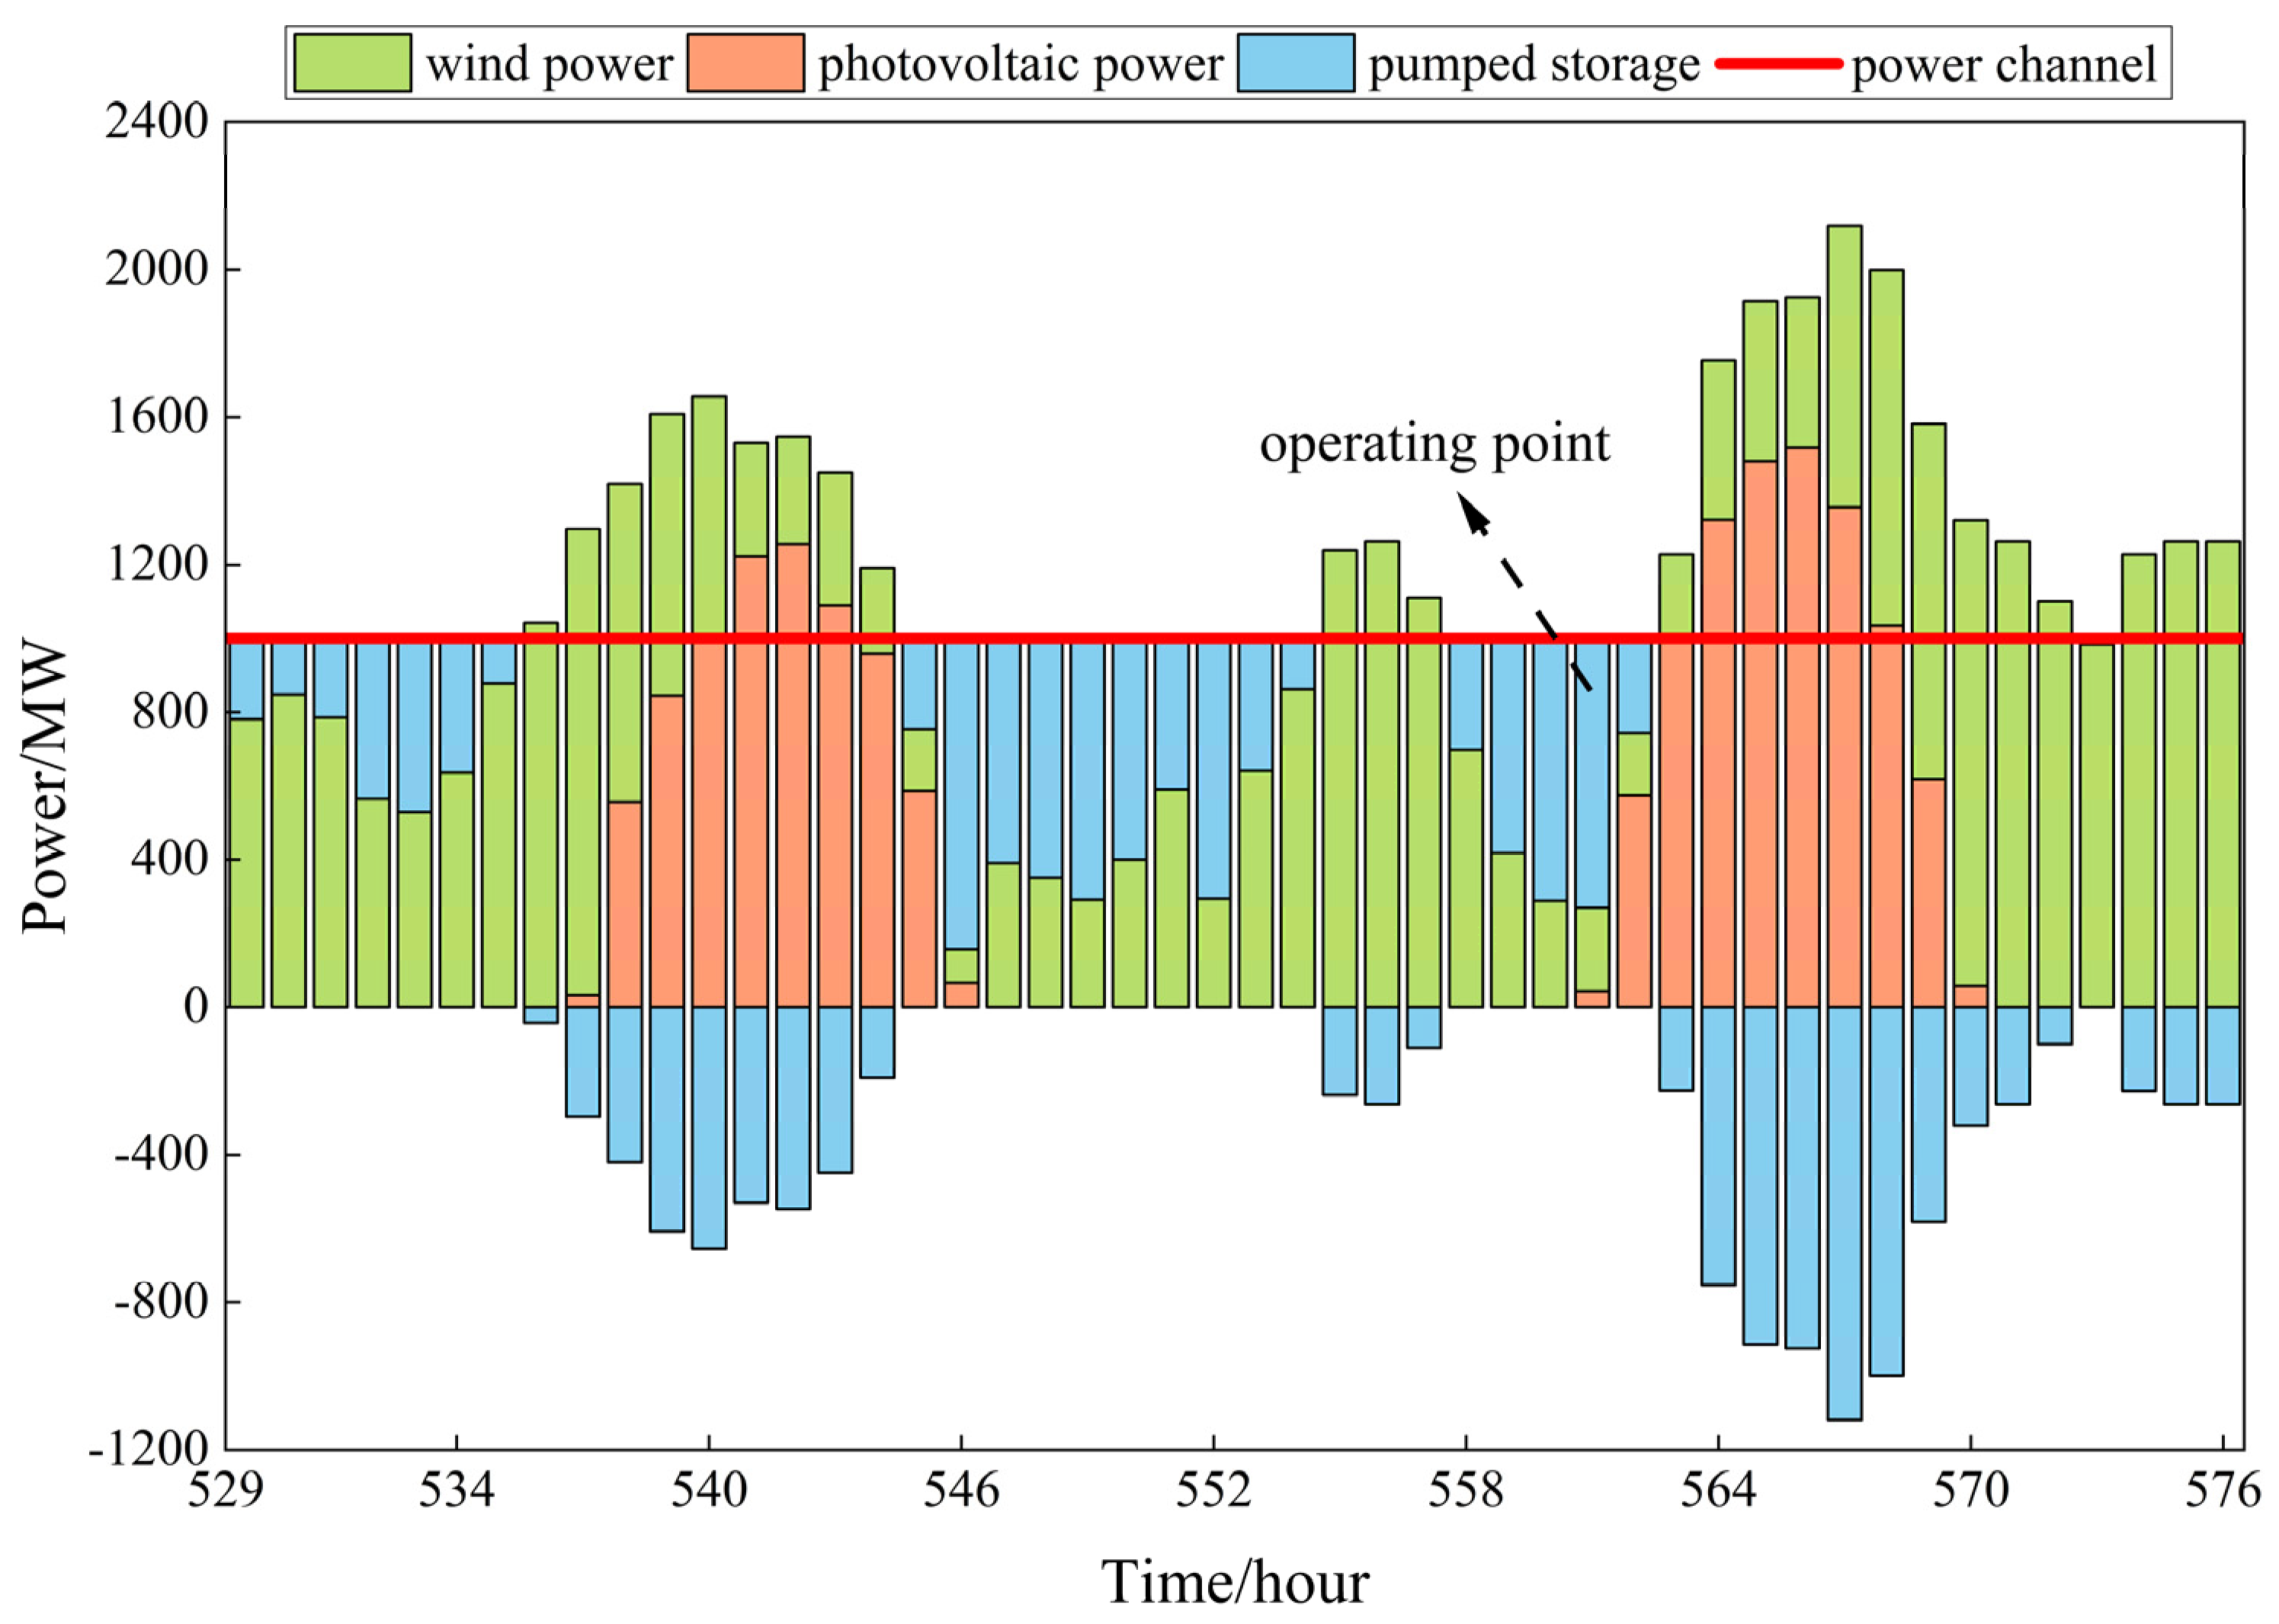
When the unit’s working condition is just beginning to change, the vibration generation may have an impact on the accuracy of the evaluation results. Therefore, this paper chooses the time node when the unit is in a stable power generation state as the working condition point under the hybrid wind/PV/pumped storage system to ensure the reliability of the evaluation, as shown in Figure 11. At the time, the wind power output is 226.469 MW, PV output is 43.401 MW, and pumped storage output is 730.130 MW. In this paper, we will take the water pump turbine in the pumped storage unit, which is used to suppress the fluctuation of wind and PV power, as the object of the study and collect the monitoring data of the components in the working condition to further analyze the health status of the pump turbine.

3.3. Weights Solution

Firstly, the acquired vibration and other data are cleaned, the missing values and outliers are removed, and the characteristic indicators conducive to health assessment are extracted from the original data, and the data from different sources (field monitoring and historical records) and different types (operating status, environmental impact, etc.) are integrated to form a comprehensive database to provide the basis for subsequent health assessment. According to the above established index system and weight solving method, in order to ensure the reasonableness and scientific of the weights, several experts are first invited to score the indicators, construct judgment matrix, and use IAHP to extract the subjective weights of each indicator. At the same time, in order to reflect the actual role of the indicators more objectively, according to the actual monitoring data of the power station, the ICRITIC method is used to determine the objective weights, effectively avoiding the subjectivity of hierarchical analysis. Adopting the game theory idea, constructing the weight combination model, and synthesizing the subjective and objective weights, the final integrated weights of all indicators and their calculation results are shown in Table 7.
According to Table 7, in the weight of the component layer, the stator seat, spiral case, draft tube, headcover, distributor, and rack are ranked in descending order of importance, and the corresponding weights are 0.233, 0.224, 0.195, 0.132, 0.117, and 0.099, respectively, which shows that the stator seat and spiral case are relatively important to the unit as a whole. In the index layer, the top seven indexes in terms of weight are, in descending order, draft tube outlet pressure, Y-direction vibration of the stator seat, inlet pressure of the spiral case, X-direction vibration of the stator seat, ending average pressure of the spiral case, X-direction vibration of the headcover, and Y-direction vibration of the headcover, and the indexes’ weights are greater than 0.045, which has a greater influence on the health state of the pump turbine, and they should be given proper attention.
In order to more intuitively see the difference between the subjective and objective assignment method and the game theory combination assignment method for solving the weights, the results of the weights of each indicator obtained by these three methods are compared in Figure 12.
As can be seen in Figure 12, from the perspective of the overall weight distribution, the game theory combination assignment method has a more balanced weight distribution on most indicators, avoiding the bad results that may be brought about by a single method. The results of IAHP calculations for A2, A4, A14, A51, A52, A55, and A56 are 0.076, 0.341, 0.115, 0.275, and 0.229, respectively, and 0.098 and 0.098, which is subjective and ignores the objective factors related to the indicators compared with the calculation results of the remaining two methods, while the results of the combination of empowerment are more reasonable. Through comparison, it can be seen that the game theory combination assignment method not only inherits the importance of the IAHP method to the key indicators but also draws on the advantages of the ICRITIC method in the evaluation, and ultimately realizes the comprehensiveness and equilibrium of the weight distribution, making the results more scientific and reliable.

3.4. Cloud Model Health Evaluation

3.4.1. Index Cloud Solving

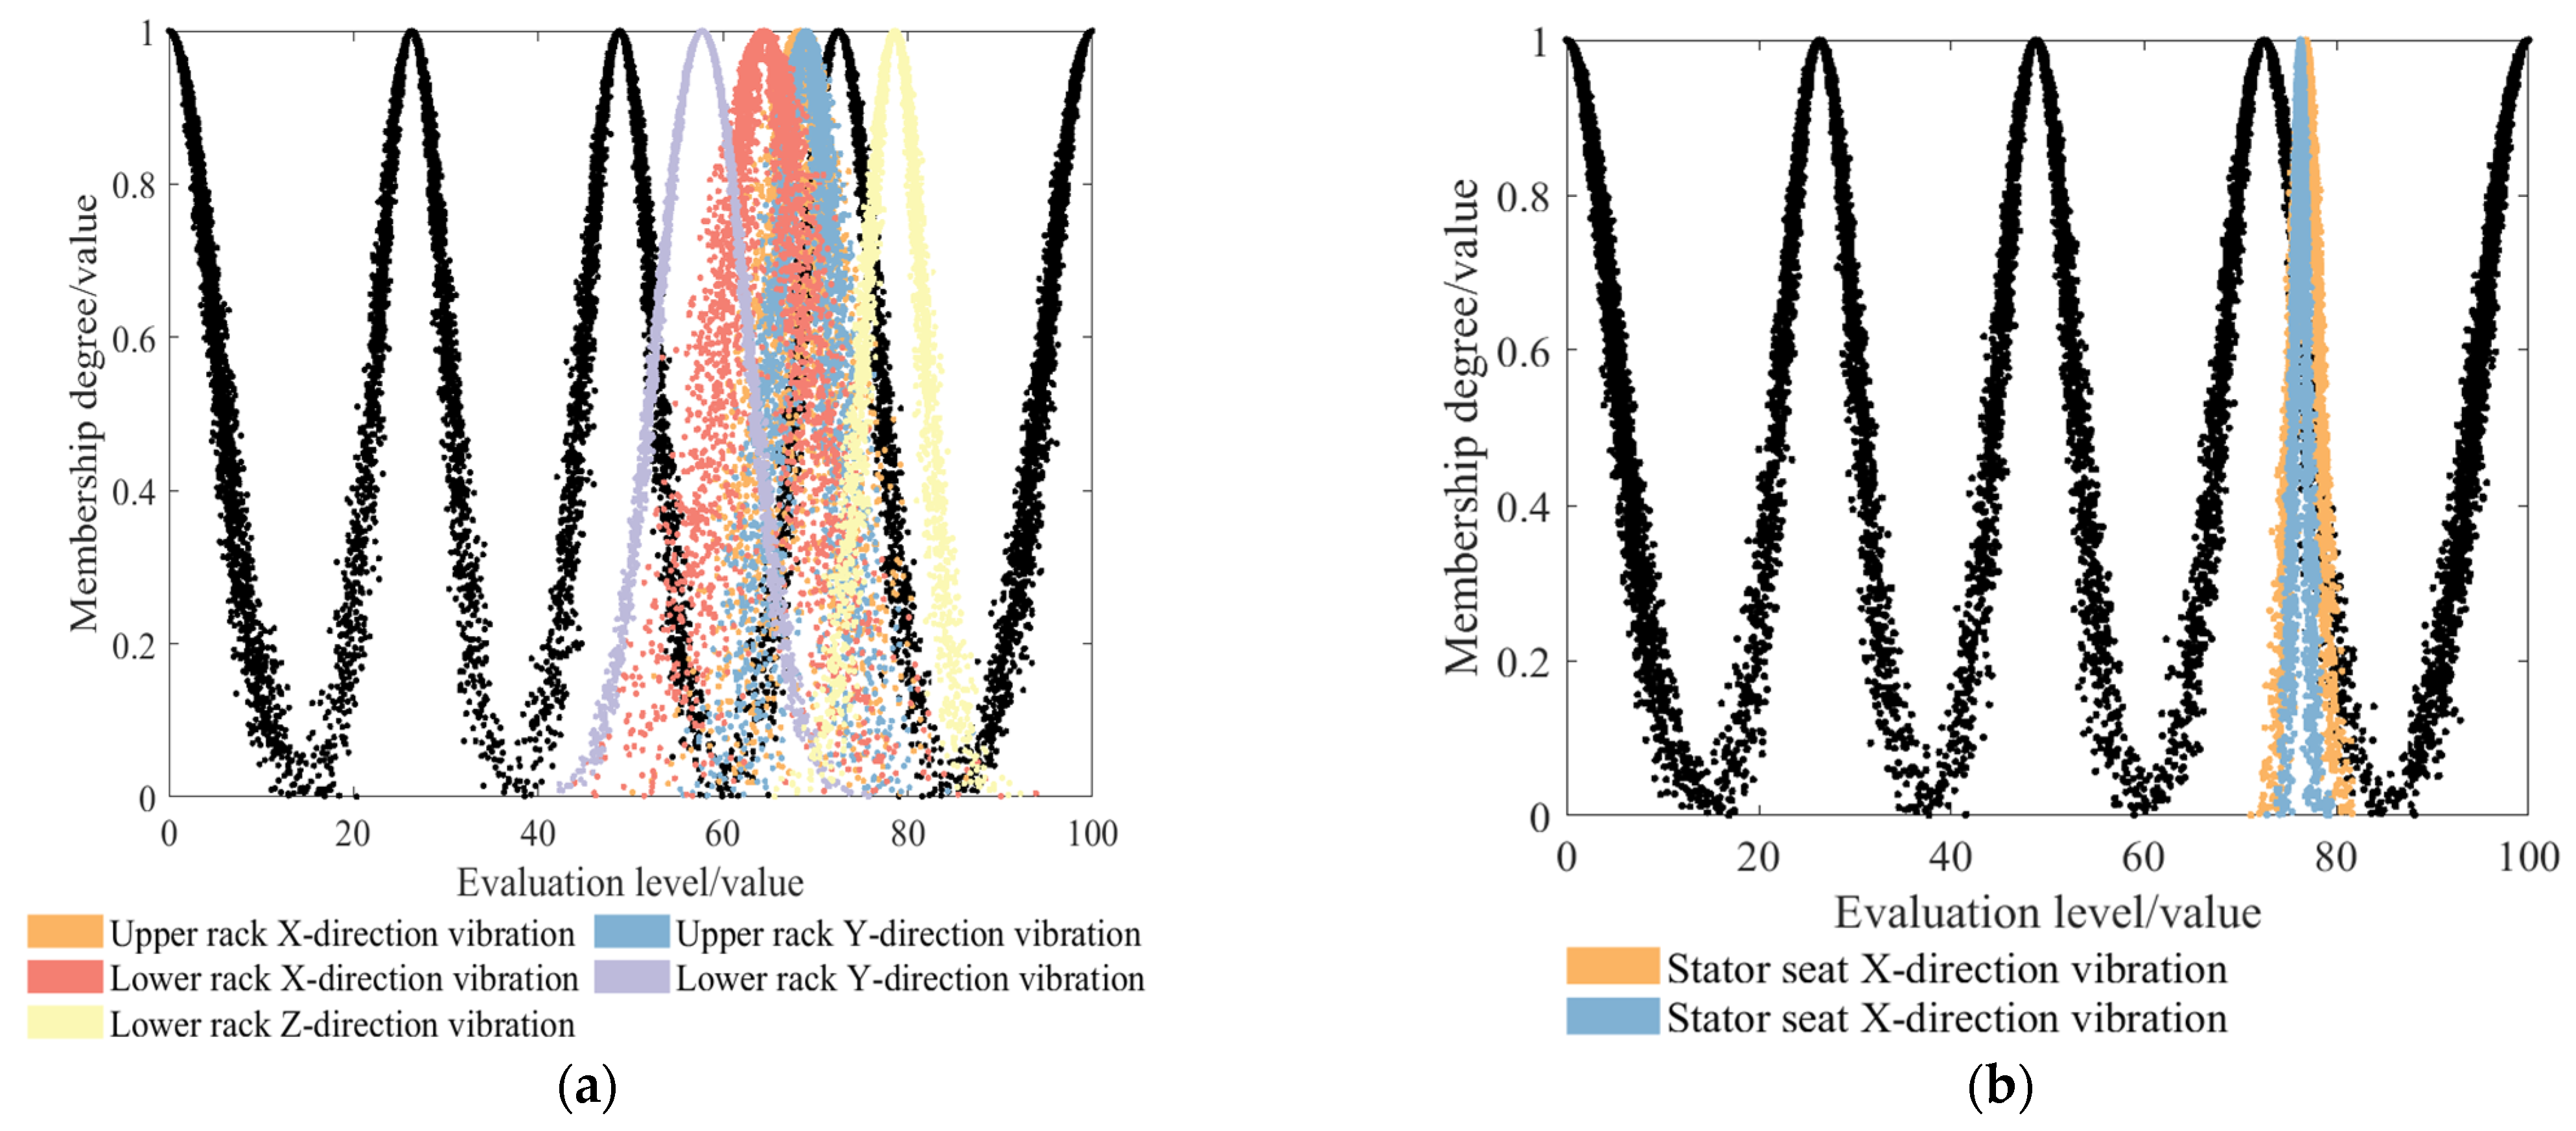
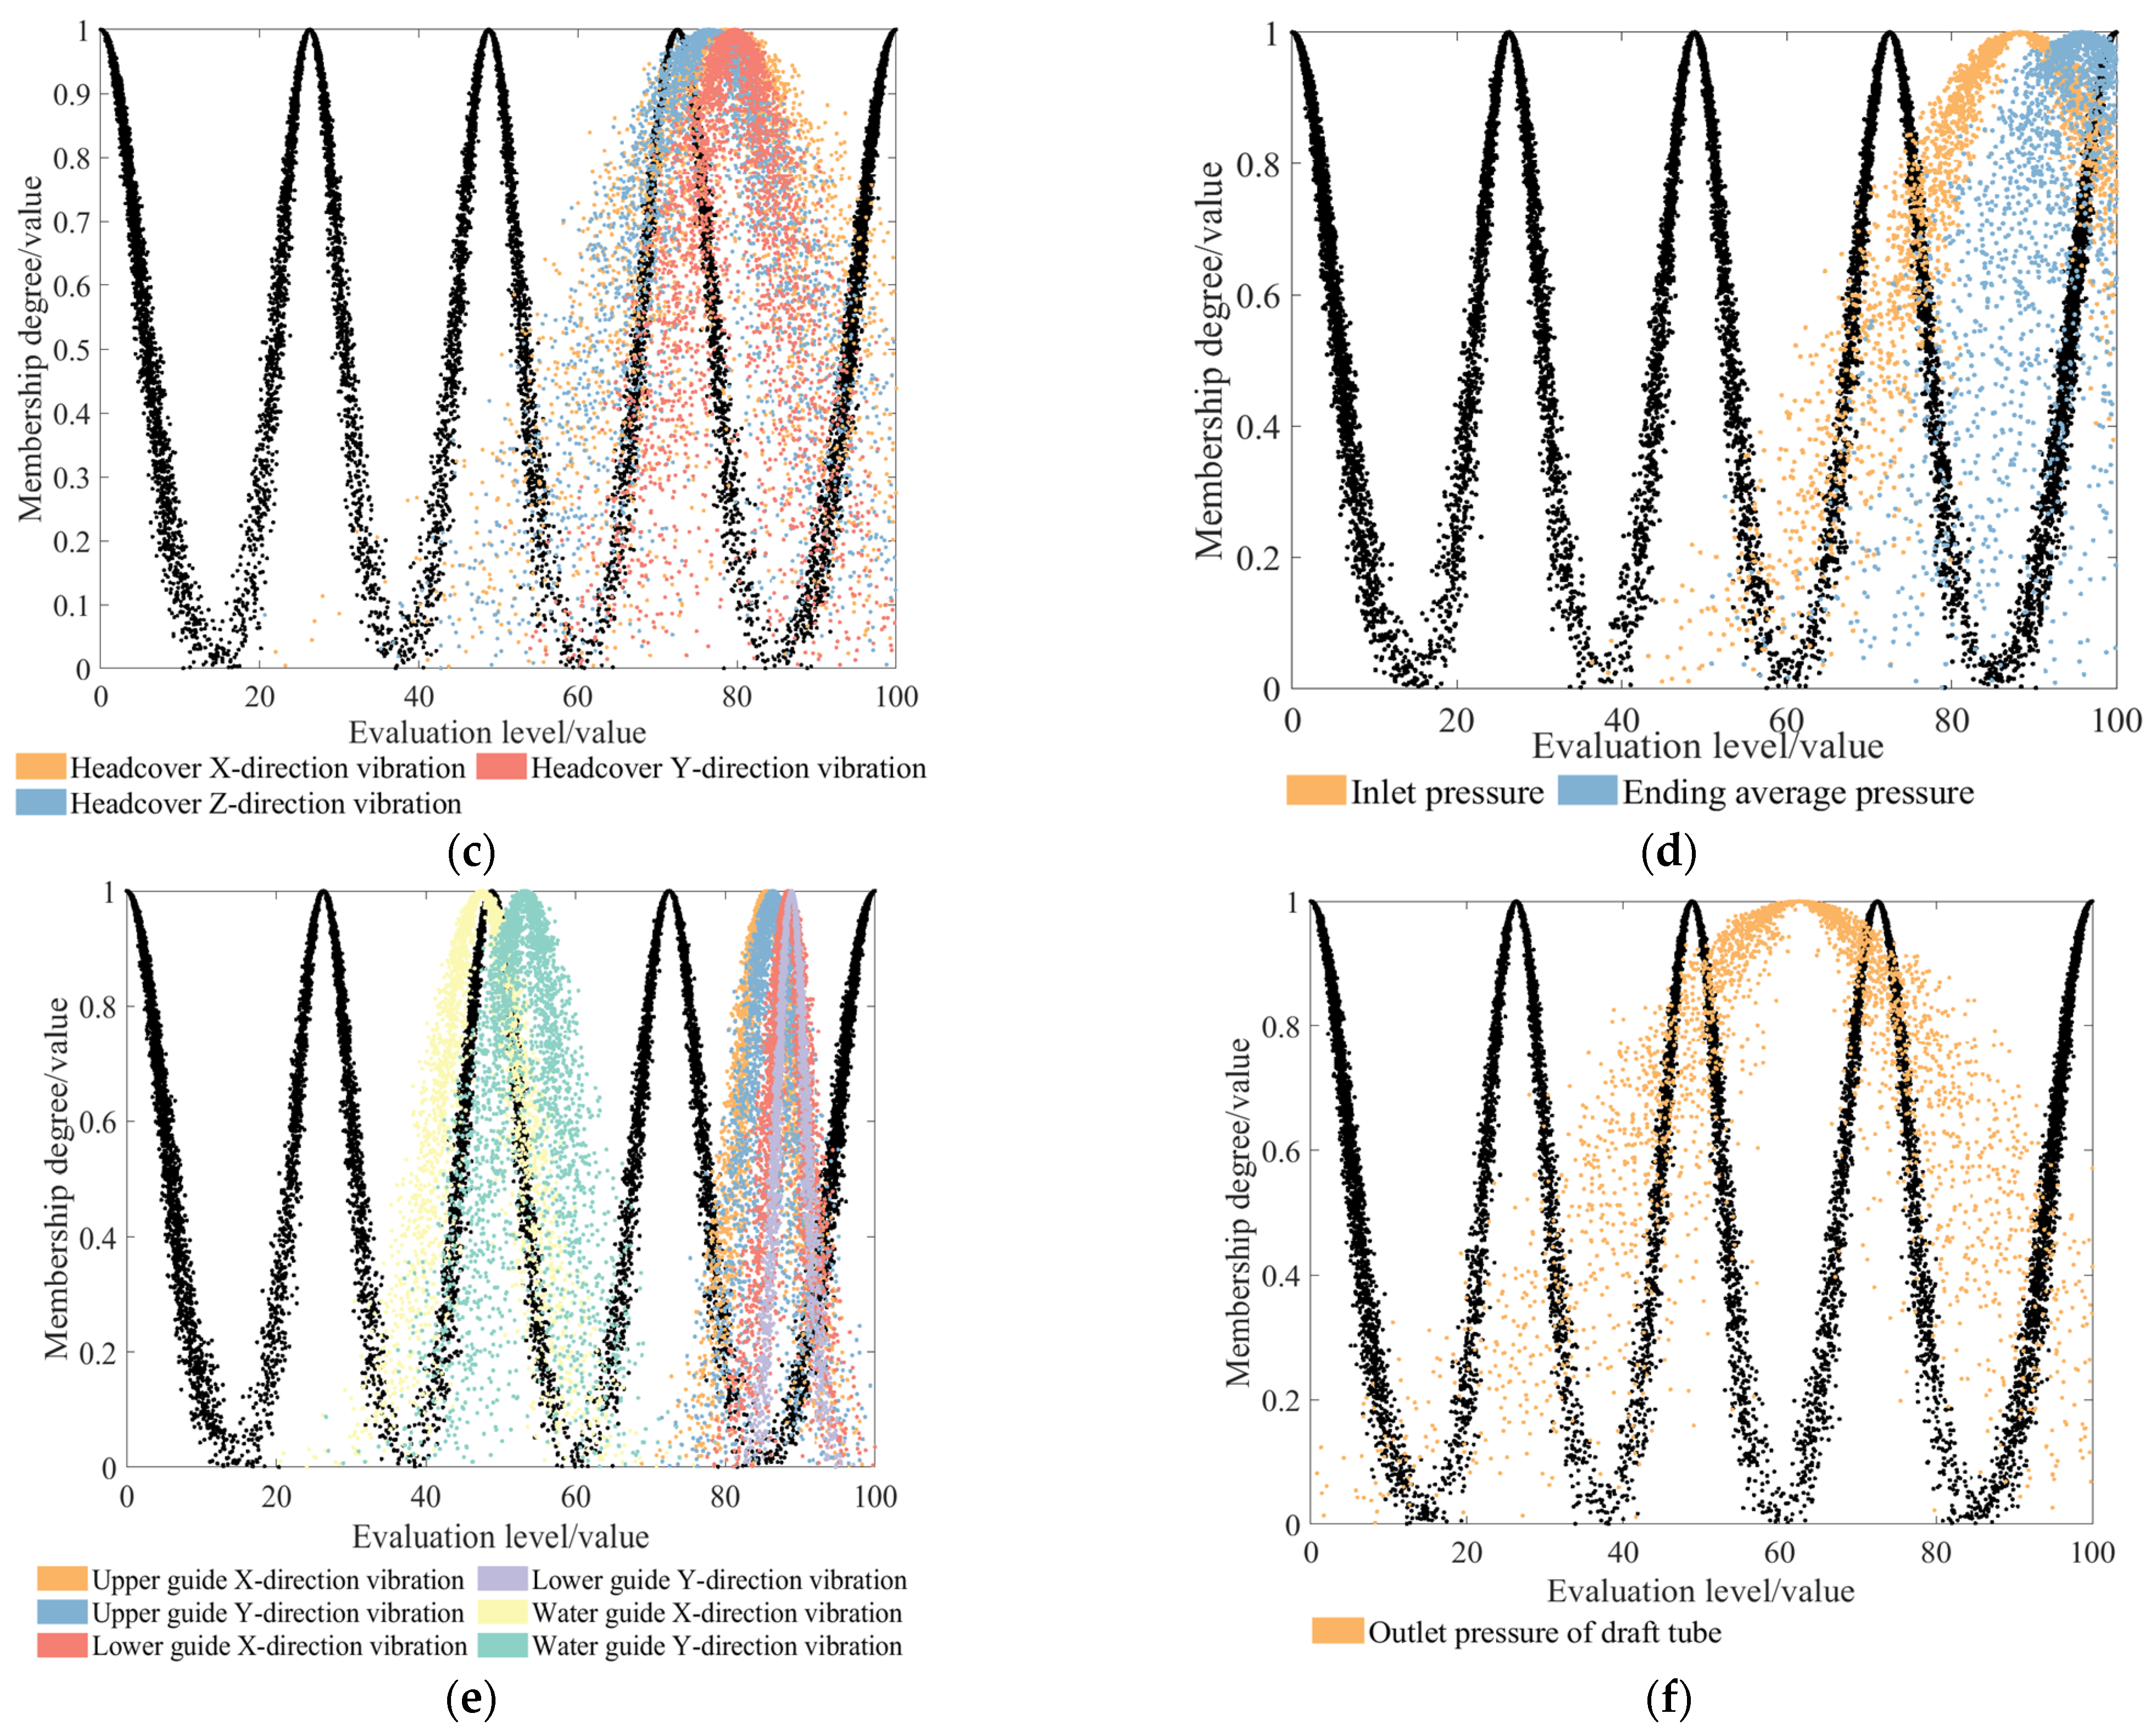
According to the above formula, the deterioration degree of the index is solved by using the measured data of the unit, and the corresponding characteristic parameters of the cloud model are calculated by combining the weights and finally mapped to the cloud image and compared with the standard cloud. Figure 13a–f shows the indicator cloud. The black curve represents a standard cloud image, as shown in Figure 4.
Figure 13a shows that the scores of the health indicators of the rack components are around 60 to 85, which is roughly at a good level, with the lower rack Z-direction vibration having the best health status, while the upper rack Y-direction vibration has a relatively poor health status. Figure 13b shows that the two health scores of the stator seat components are close to 75 and have similar indicator statuses, all of which tend to be good. Figure 13c,d,f shows that the health scores of the headcover, spiral case, and draft tube are all higher than 60, with good, excellent, and good health status, respectively. However, the cloud diagrams of these components are thicker and there is a large uncertainty in the model; therefore, further analysis is needed to accurately assess their health. Figure 13e clearly shows that the water guide indicator in the distributor exhibits some fluctuations and the health score tends to be 50, which is close to fair health, implying that it may be close to the warning value and indicating that the component may be in a deteriorating trend. Overall, most of the indicators are in good health, with a slight trend of deterioration in some of them, and the water guide indicator is in the worst state of health. It is recommended that the monitoring of the water guide components of the distributor be strengthened and that a targeted overhaul program be developed to prevent performance degradation and to ensure the reliability of its long-term operation.

3.4.2. Integrated Cloud Solving

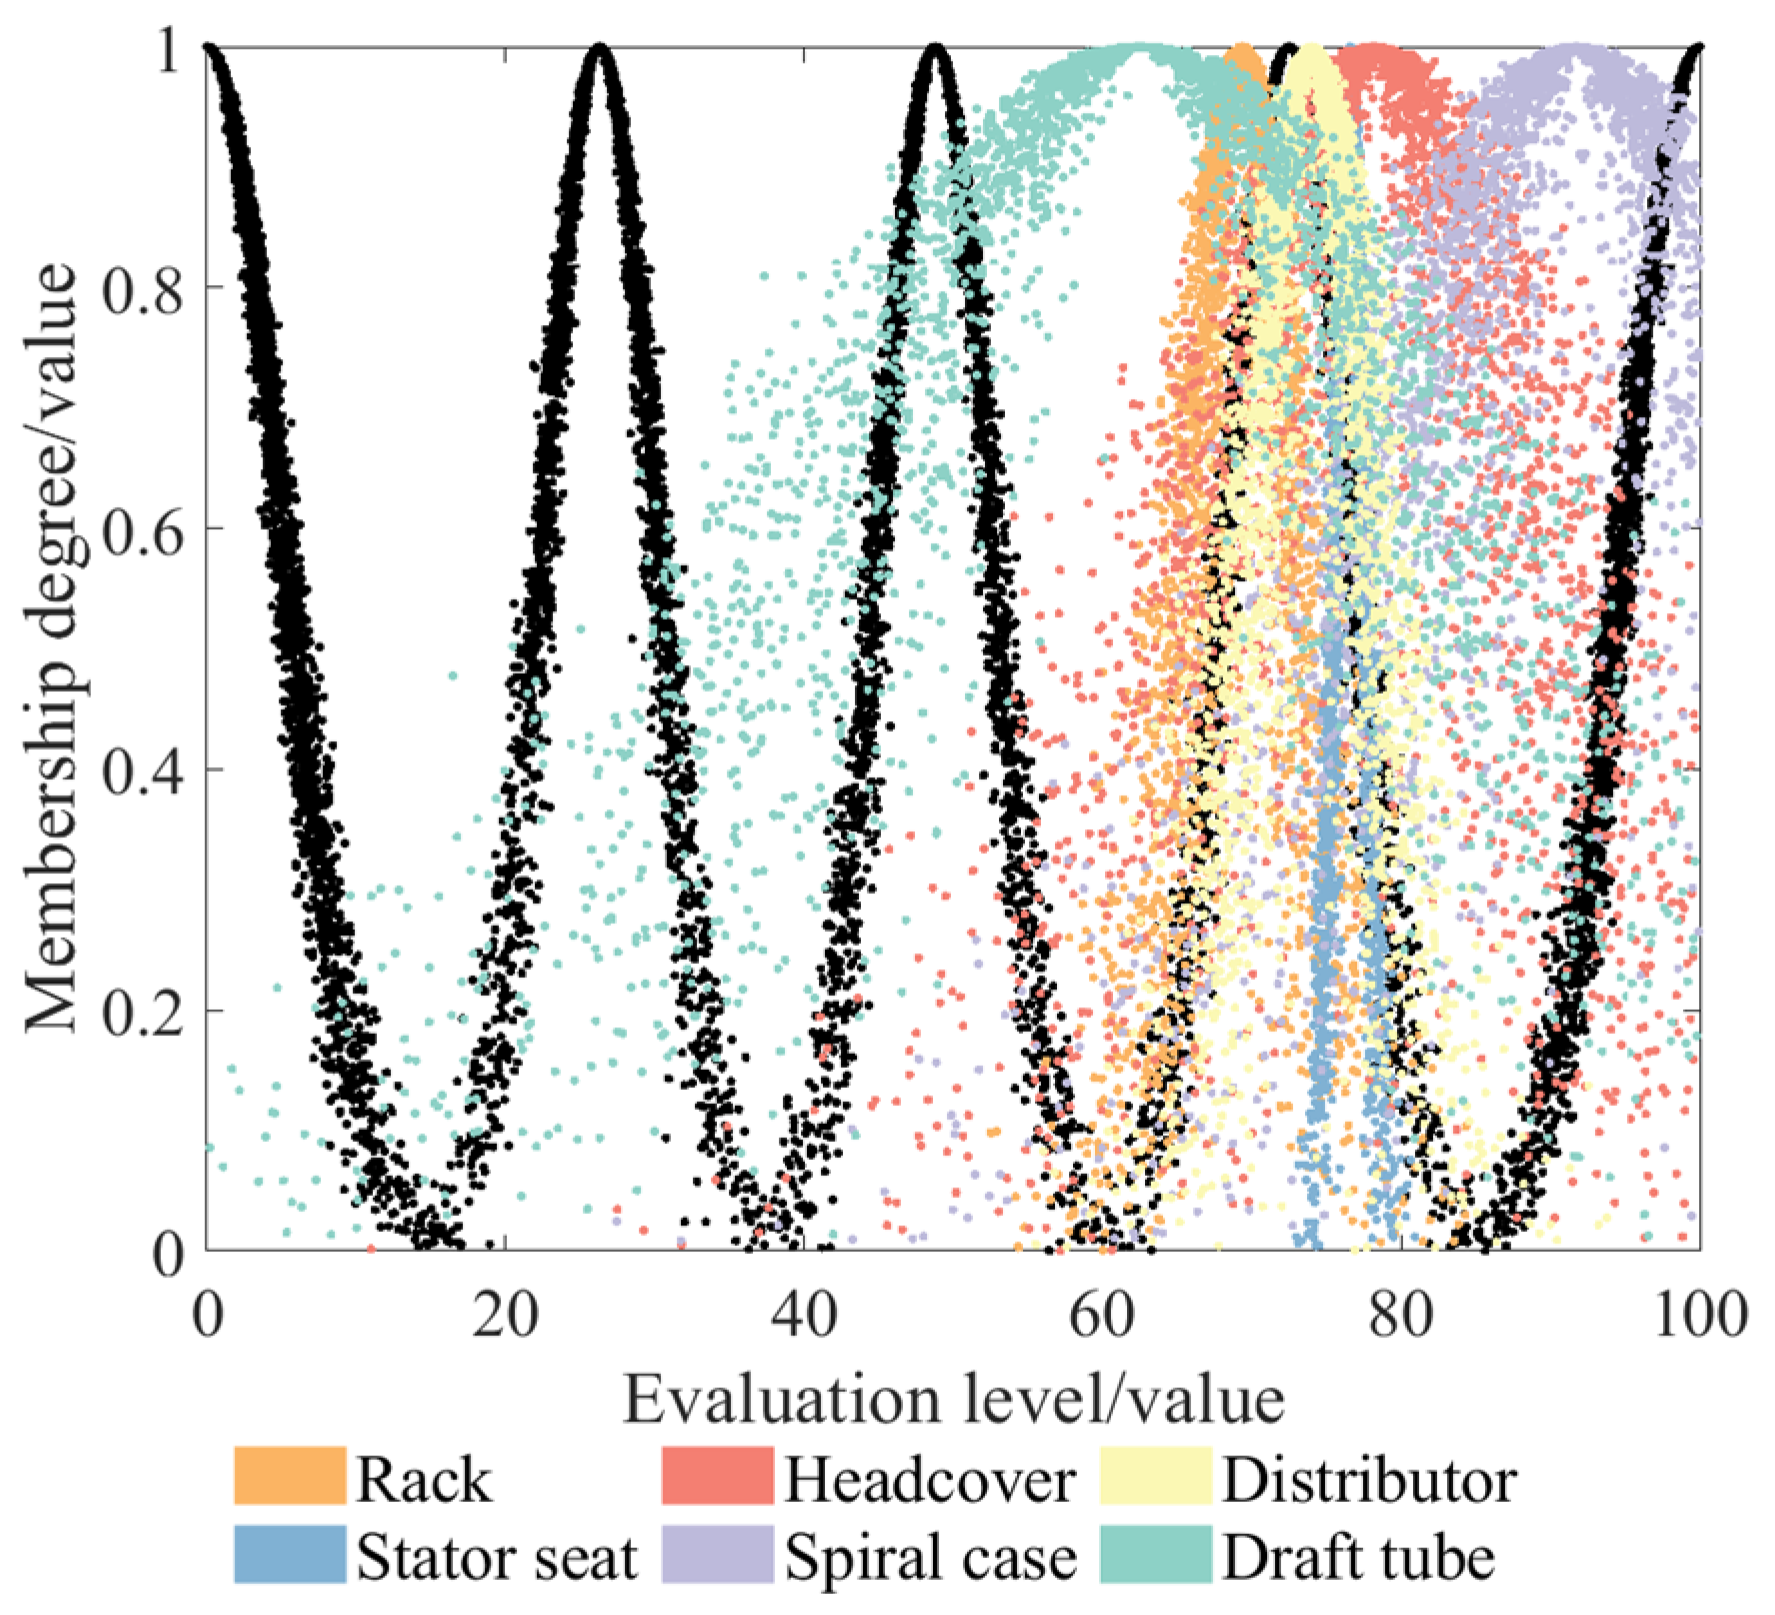
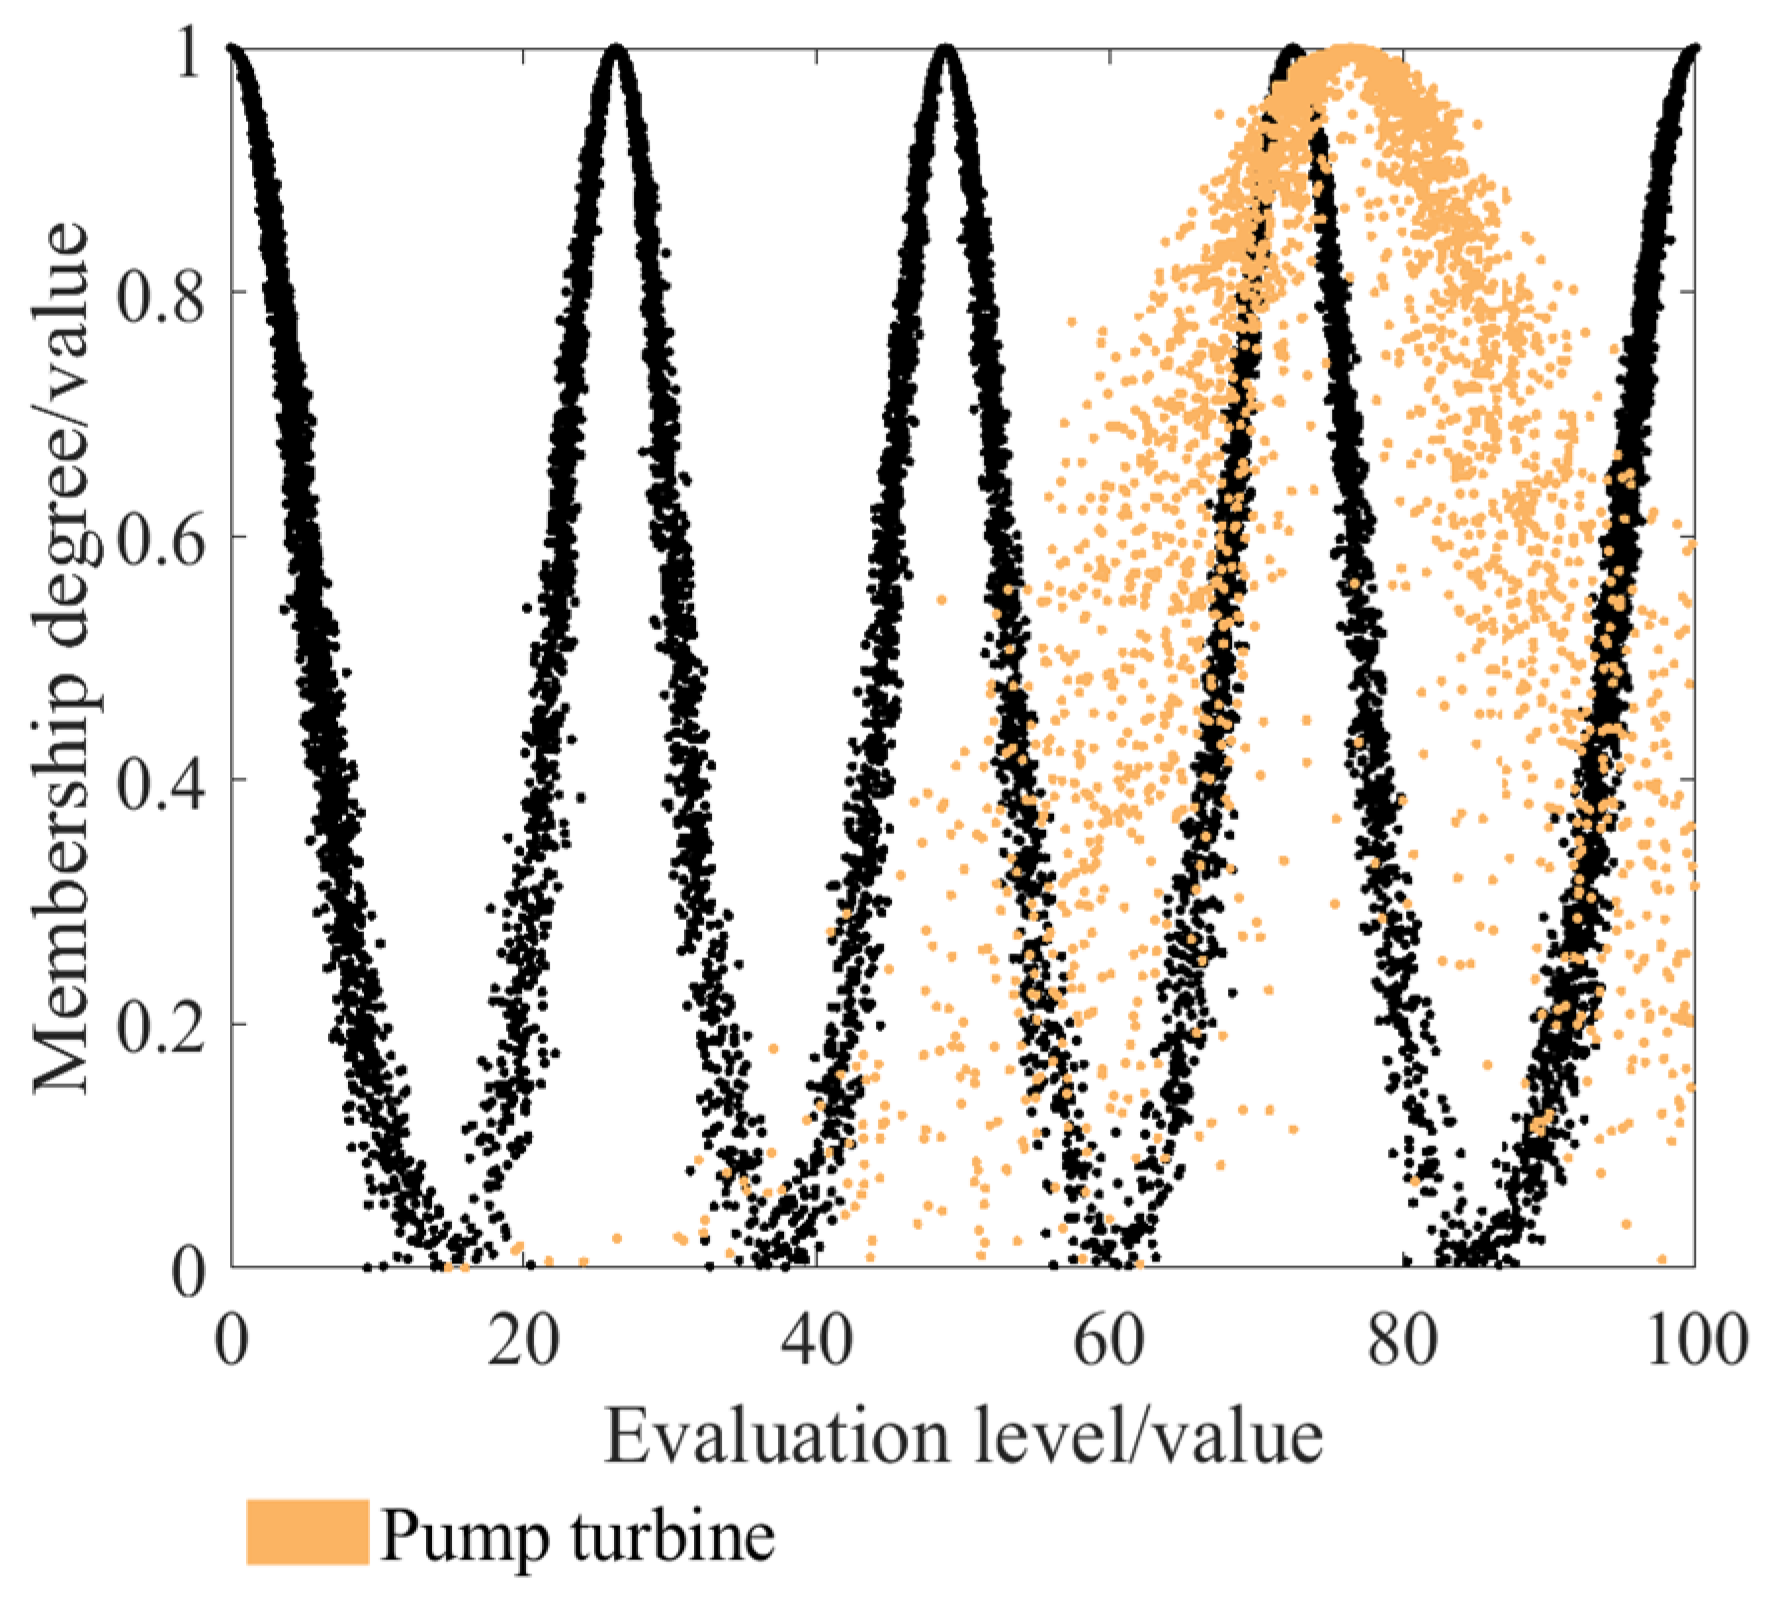
Each indicator cloud must be integrated in the indicator layer and the weights of the indicators in the component layer needs to be combined to get the comprehensive cloud in the corresponding component layer. The same method can be used to get the comprehensive cloud of the pump turbine as a whole, and the results are shown in Figure 14 and Figure 15. The black curve represents a standard cloud image, as shown in Figure 14.
Figure 12 clearly shows that the health scores of the rack, stator seat, headcover, and distributor components are around 60~85 points, which is a relatively good health status. The health status of the spiral case and draft tube tends to be excellent and good, respectively, from the graph, but due to the thicker and more discrete cloud diagram, their health status is difficult to judge intuitively and needs to be further analyzed by calculating the cloud affiliation. As can be seen in Figure 13, the overall health score of the pump turbine is close to 75, which is close to a good condition, with no significant deterioration trend, but the cloud diagrams are likewise thicker, and further analysis is required to determine their health status.
In order to visualize the health level of each index and avoid the situation where the cloud diagram is difficult to distinguish, the cloud affiliation degree is used to quantitatively analyze the health status level of each component layer and system layer, and the solution results are shown in Table 8.
As can be seen from Table 8, the membership degree of the spiral case belonging to excellent grade is the highest, which is 0.7102, indicating that its health status is the best and at an excellent level. In addition, the key components such as rack, stator seat, headcover, distributor, and draft tube have the highest cloud affiliation of being in good health status, which are 0.9910, 0.9998, 0.7832, 0.9928, and 0.4487, respectively, which further confirms their good health status. Overall, the health status of the pump turbine shows a good trend with no obvious signs of deterioration.
In summary, the affiliation of the draft tube shows that it is in good condition, while the expectation (Ex = 62.476) is close to the lower limit of the good level, indicating that it may be about to show a trend of deterioration; the average expectation of the water guide indicator (Ex = 50.333) shows that it is in poor condition, showing a trend of deterioration, and has a gradual deterioration of the risk, so it is necessary to give a more careful attention to the health status of the draft tube and water guide indicator, as well as timely development and implementation of targeted maintenance programs, to preserve the overall stability and operational efficiency of the unit. Therefore, it is necessary to pay more attention to the health status of the tail pipe and the water conductivity indexes and formulate and implement a targeted maintenance program in time to prevent affecting the overall stability and operational efficiency of the unit. Through a comprehensive analysis of the actual maintenance situation in the late stage of Unit 1 of the pumped storage power station, it was found that the draft tube had a tendency to deteriorate mainly due to the continuous scouring of particles in the water over a long period of time, and the wear and tear on the inner wall surface and aging of the material led to a decline in performance; whereas, due to a long period of time spent in a high-load, high-speed operating environment, tiny cracks appeared in the critical parts due to the fatigue of the material and the cumulative wear and tear, and a trend of deterioration was produced. Slight deterioration occurred. This actual case is highly consistent with the predicted results of the model, which effectively verifies the accuracy and reliability of the model in predicting health scores and, also, provides an important reference basis for the subsequent maintenance work.
According to the actual data on site, the state of the unit components is judged, which is taken as the actual result of the pump turbine components. By sorting the model prediction results with the actual state of the unit components, Table 9 can be obtained.
As can be seen from Table 9, the prediction results of the model show a consistency with the actual case results, which effectively verifies the accuracy and reliability of the model in predicting health scores and, also, provides an important reference for subsequent maintenance work.

4. Conclusions

In order to cope with the volatility caused by the high proportion of wind and PV resources in the new electricity system, this paper discusses the output characteristics of the hybrid wind/PV/pumped storage system, evaluates the health status of the pump turbine in the pumped storage unit, and constructs a scientific pump turbine health evaluation model. The results of the study are of great significance for improving the stability and reliability of new electricity systems. The main conclusions of this study are as follows:
(1)
By analyzing the output characteristics of wind and PV in the hybrid system over a year (8760 h) and the output characteristics of the hybrid wind/PV/pumped storage system over a typical week (168 h) in all four seasons, the study shows that the pumped storage units switch operating conditions more frequently when smoothing out large-scale wind and PV fluctuations.
(2)
A set of pump turbine health evaluation index systems based on high proportion of wind and PV power connection background was constructed, including one system layer index, six component layer indexes, and 19 index layer indexes, and the final weights of the indexes were determined based on the GTCW method. The results showed that the weight values of each evaluation index were in the following order: stator seat (0.233), spiral case (0.224), and draft tube (0.195); the weight of these three indicators is high, and the impact on the overall performance of the unit is large and should be paid attention to.
(3)
Based on the cloud model, a health state evaluation model of the pump turbine was constructed, and the health condition of the unit was quantitatively analyzed by the degree of affiliation. The results show that the draft tube (Ex = 62.476) and the water guide index in the distributor mechanism (Ex = 50.333) have different degrees of deterioration tendency, and suitable overhauling strategies need to be formulated to avoid further damages; the numerical characteristics of the cloud model of the overall health status of the pump turbine are (Ex = 76.411, En = 12.071, He = 4.014), and in the good grade, the affiliation degree reaches 0.7772, reflecting that the unit is in good condition and the overall performance is stable.
(4)
The methods of this research are also applicable to other energy storage solutions using pump turbine systems for smoothing the output of the hybrid wind/PV systems, such as abandoned mine pumped storage and compressed air energy storage. These systems can achieve more stable operations in smoothing output fluctuations under high proportions of wind/PV power connection by utilizing the health assessment technology of pump turbine systems, thereby enhancing the efficiency of renewable energy utilization. There are still some limitations in this study. First of all, the results of the model are highly dependent on the quality and accuracy of the input data. If there is noise or error in the data, the reliability of the evaluation results may be affected. Secondly, this study did not fully consider the influence of external factors such as dynamic changes in water quality, which may limit the adaptability of the model in different situations.
(5)
The research and analysis in this paper are mainly based on the external characteristics of the unit, focusing on the operation characteristics of the pump turbine and the construction of the health evaluation model under the conditions of high-proportion wind and PV access. The direction of future research work is to further analyze the internal characteristics of the unit, especially the factors related to the vortex structure. This analysis can provide important theoretical support for understanding the internal flow characteristics, energy conversion efficiency, and health state of the unit, and help provide new ideas and methods for the optimization of the unit operation and fault diagnosis.

Author Contributions

Y.R.: supervision, conceptualization, writing—original draft. H.Z.: methodology, writing—original draft. L.W.: data curation, validation, software, investigation, resources. K.Z.: visualization, formal analysis, review and editing. Z.C., K.S.: data curation, validation, software, investigation, resources. Y.S., L.H.: data curation, software. All authors have read and agreed to the published version of the manuscript.

Funding

This work is supported by the following projects: Industry-University Cooperation Education Project of the Ministry of Education (No. 220506429133218), and Key Scientific Research Projects of Colleges and Universities in Henan Province (No. 23B480001).

Data Availability Statement

The data presented in this study are available on request from the corresponding authors. The data is not publicly available due to company privacy concerns.

Conflicts of Interest

Authors Lile Wu and Zutian Cheng were employed by the company Power China Henan Electric Power Survey & Design Institute Co., Ltd. Author Yuan Sun was employed by the company Hunan Heimifeng Pumped Storage Co., Ltd. Author Leiming Hu was employed by the company Jiangxi Hongping Pumped Storage Co., Ltd. The remaining authors declare that the research was conducted in the absence of any commercial or financial relationships that could be construed as a potential conflict of interest.

Nomenclature

aDiode quality factor
aijInitial value of the indicator
bElectronic charge (C)
bijStandardized value of the indicator
BBoltzmann’s constant (J/K)
dThe degree of deterioration of the index
ejInformation entropy
HyHead of the pumped storage unit under pumping conditions (m)
HpHead of the pumped storage unit under turbine operation (m)
HmaxUpper limit of health assessment level score
IpPV generation current (A)
IrReverse saturation current of the diode (A)
N1Number of parallel PV cells
N2Number of series PV cells
NWNumber of fans installed
PwWind power output (MW)
PpvPV output (MW)
PwrRated power of the fan (MW)
PyOutput of pumped storage unit under pump condition (MW)
PpOutput of pumped storage unit under water turbine condition (MW)
QyFlow rate of the unit under pumping conditions (m3/s)
QpFlow rate of the unit under turbine operation (m3/s)
rijAn element in a judgment matrix
rkjCorrelation coefficient between the indicators
rjQuantitative coefficients
SwSwept area of the rotor (m2)
TOperating temperature of the PV cell (°C)
UPVOutput voltage of the PV cell (V)
vWind speed flowing through the wind turbine (m/s)
viCut-in wind speed (m/s)
voCut-out wind speed (m/s)
vrRated speed of the fan (r/min)
vjThe average difference of each indicator
WArbitrary linear combination set of weights
xParameter measurement value
xmaxThe maximum value of the parameter run
xminThe minimum value of the parameter run
XmaxThe maximum value of evaluation interval
XminThe minimum value of evaluation interval
Greek alphabet
φMembership of the index
ρAir density (kg/m3)
τFan’s coefficient of performance (%)
ηyUnit efficiency under pump conditions (%)
ηpUnit efficiency under water turbine condition (%)
λmaxLargest eigenvalue of the judgment matrix
ω2The weights obtained by ICRITIC method
ωThe final combined weight
αkWeight coefficient
αiValue of the weight of the i th indicator
γ1The minimum value of the parameter in the optimal interval
γ2The maximum value of the parameter in the optimal interval

References

  1. Zhao, X.; Ma, X.; Chen, B.; Shang, Y.; Song, M. Challenges toward carbon neutrality in China: Strategies and countermeasures. Resour. Conserv. Recycl. 2022, 176, 105959. [Google Scholar] [CrossRef]
  2. Li, Z.; Li, W.; Zhang, Z.; Chang, G.; Lyu, J.; Yue, G.; Li, L.; Ni, W. Development Strategy of Flexible Resources in China’s Power System under the Carbon Peaking and Carbon Neutrality Goals. Strateg. Study CAE 2024, 26, 108–120. [Google Scholar]
  3. Koholé, Y.W.; Fohagui, F.C.V.; Tchuen, G. A holistic overview of Cameroon renewable energy sources: Potentials, achievements, challenges and perspectives. Int. J. Ambient. Energy 2022, 43, 7308–7320. [Google Scholar] [CrossRef]
  4. Arabzadeh, V.; Frank, R. Creating a renewable energy-powered energy system: Extreme scenarios and novel solutions for large-scale renewable power integration. Appl. Energy 2024, 374, 124088. [Google Scholar] [CrossRef]
  5. Ai, C.; Zhang, L.; Gao, W.; Yang, G.; Wu, D.; Chen, L.; Chen, W.; Plummer, A. A review of energy storage technologies in hydraulic wind turbines. Energy Convers. Manag. 2022, 264, 115584. [Google Scholar] [CrossRef]
  6. Arunkumar, A.P.; Kuppusamy, S.; Muthusamy, S.; Pandiyan, S.; Panchal, H.; Nagaiyan, P. An extensive review on energy management system for microgrids. Energy Sources Part A Recovery Util. Environ. Eff. 2022, 44, 4203–4228. [Google Scholar] [CrossRef]
  7. Lin, J.; Gu, Y.; Wang, Z.; Zhao, Z.; Zhu, P. Operational characteristics of an integrated island energy system based on multi-energy complementarity. Renew. Energy 2024, 230, 120890. [Google Scholar] [CrossRef]
  8. Wu, C.; Chen, Z.; Zhang, Y.; Feng, J.; Xie, Y.; Qin, C. A case study of multi-energy complementary systems for the building based on Modelica simulations. Energy Convers. Manag. 2024, 306, 118290. [Google Scholar] [CrossRef]
  9. Yongli, W.; Pengxu, D.; Miaomiao, X.; Yiwen, L.; Dong, Z.; Ximei, L. Research on collaborative operation optimization of multi-energy stations in regional integrated energy system considering joint demand response. Int. J. Electr. Power Energy Syst. 2024, 155, 109507. [Google Scholar]
  10. Liao, S.; Su, K.; Yu, Q.; Wang, D.; Zhang, Q.; Qi, M. Optimal Capacity Allocation for Wind-Solar Station Considering Power Response of Pumped Storage. In Proceedings of the 2019 IEEE 3rd Conference on Energy Internet and Energy System Integration (EI2), Changsha, China, 8–10 November 2019; pp. 2053–2058. [Google Scholar]
  11. Ren, Y.; Jin, K.; Gong, C.; Hu, J.; Liu, D.; Jing, X.; Zhang, K. Modelling and capacity allocation optimization of a combined pumped storage/wind/photovoltaic/hydrogen production system based on the consumption of surplus wind and photovoltaics and reduction of hydrogen production cost. Energy Convers. Manag. 2023, 296, 117662. [Google Scholar] [CrossRef]
  12. Menéndez, J.; Schmidt, F.; Konietzky, H.; Fernández-Oro, J.M.; Galdo, M.; Loredo, J.; Díaz-Aguado, M.B. Stability analysis of the underground infrastructure for pumped storage hydropower plants in closed coal mines. Tunn. Undergr. Space Technol. 2019, 94, 103117. [Google Scholar] [CrossRef]
  13. Menéndez, J.; Fernández-Oro, J.M.; Galdo, M.; Loredo, J. Efficiency analysis of underground pumped storage hydropower plants. J. Energy Storage 2020, 28, 101234. [Google Scholar] [CrossRef]
  14. Chen, Y.; Feng, L.; Mansir, I.B.; Taghavi, M.; Sharma, K. A new coupled energy system consisting of fuel cell, solar thermal collector, and organic Rankine cycle; Generation and storing of electrical energy. Sustain. Cities Soc. 2022, 81, 103824. [Google Scholar] [CrossRef]
  15. Wang, Y.-Y.; Mori, A. A review of dynamic changes in complementarities and transition pathways toward distributed energy resource–based electrical system. Renew. Energy Focus 2024, 51, 100626. [Google Scholar] [CrossRef]
  16. Aguilar, F.I.; Gibson, R.B. Advancing a New Generation of Sustainability-Based Assessments for Electrical Energy Systems: Ontario as an Illustrative Application—A Review. Energies 2023, 16, 6285. [Google Scholar] [CrossRef]
  17. Yi, Y.; Chang, L.; Wu, B.; Zhao, J.; Peng, H.; Li, L.; Wang, A. Life Cycle Assessment of Energy Storage Technologies for New Power Systems under Dual-Carbon Target: A Review. Energy Technol. 2024, 12, 2301129. [Google Scholar] [CrossRef]
  18. Prasasti, E.; Joseph, M.; Miao, X.; Zangeneh, M.; Terheiden, K. Design of shaft-and rim-driven contra-rotating reversible pump-turbine to optimize novel low-head pumped hydro energy storages. Energy 2024, 306, 132237. [Google Scholar] [CrossRef]
  19. Yu, W.; Liu, C.; Chen, W.; Zhang, H.; Yu, Y.; Wang, D.; Wei, F. Development status and technical challenges of new low-carbon technologies for power systems under the dual-carbon goal. In Proceedings of the 2024 7th International Conference on Energy, Electrical and Power Engineering (CEEPE), Yangzhou, China, 26–28 April 2024. [Google Scholar]
  20. Wu, M.; Shi, J.; Wen, H.; Qiu, Y.; Guo, C. Research on power and energy balance of new power system under low carbon emission path. Energy Rep. 2022, 8, 197–207. [Google Scholar] [CrossRef]
  21. Hu, B.; Xie, K.; Shao, C.; Pan, C.; Lin, C.; Zhao, Y. Commentary on Risk of New Power System Under Goals of Carbon Emission Peak and Carbon Neutrality: Characteristics, Indices and Assessment Methods. Autom. Electr. Power Syst. 2023, 47, 1–15. [Google Scholar]
  22. Wang, W.; Yu, T.; Huang, Y.; Han, Y.; Liu, D.; Shen, Y. The situation and suggestions of the new energy power system under the background of carbon reduction in China. Energy Rep. 2021, 7, 1477–1484. [Google Scholar] [CrossRef]
  23. Alaoui, L.C.; Drid, S.; Ouriagli, M.; Mehdi, D. Overview of Photovoltaic and Wind Electrical Power Hybrid Systems. Energies 2023, 16, 4778. [Google Scholar] [CrossRef]
  24. Yahya, W.; Saied, K.M.; Nassar, A.; Qader, M.R.; Al-Nehari, M.; Zarabia, J.; Jian, Z. Optimization of a hybrid renewable energy system consisting of a of PV/wind turbine/battery/fuel cell integration and component design. Int. J. Hydrogen Energy 2024, 94, 1406–1418. [Google Scholar] [CrossRef]
  25. Qudah, A.; Almerbati, A.; Mokheimer, E.M.A. Techno-economic analysis and optimization of standalone Hybrid Photovoltaic (PV)/Wind Turbine (WT) with water tank storage driven Reverse Osmosis (RO) desalination system. Desalination 2025, 600, 118522. [Google Scholar] [CrossRef]
  26. Ren, Y.; Sun, K.; Zhang, K.; Han, Y.; Zhang, H.; Wang, M.; Jing, X.; Mo, J.; Zou, W.; Xing, X. Optimization of the capacity configuration of an abandoned mine pumped storage/wind/photovoltaic integrated system. Appl. Energy 2024, 374, 124089. [Google Scholar] [CrossRef]
  27. Sun, K.; Li, K.-J.; Pan, J.; Liu, Y.; Liu, Y. An optimal combined operation scheme for pumped storage and hybrid wind-photovoltaic complementary power generation system. Appl. Energy 2019, 242, 1155–1163. [Google Scholar] [CrossRef]
  28. Jurasz, J.; Dąbek, P.B.; Kaźmierczak, B.; Kies, A.; Wdowikowski, M. Large scale complementary solar and wind energy sources coupled with pumped-storage hydroelectricity for Lower Silesia (Poland). Energy 2018, 161, 183–192. [Google Scholar] [CrossRef]
  29. Wang, Z.; Fang, G.; Wen, X.; Tan, Q.; Zhang, P.; Liu, Z. Coordinated operation of conventional hydropower plants as hybrid pumped storage hydropower with wind and photovoltaic plants. Energy Convers. Manag. 2023, 277, 116654. [Google Scholar] [CrossRef]
  30. Dhingra, T.; Sengar, A.; Sajith, S. A fuzzy analytic hierarchy process-based analysis for prioritization of barriers to offshore wind energy. J. Clean. Prod. 2022, 345, 131111. [Google Scholar] [CrossRef]
  31. Chuanhao, F.; Yan, C.; Yan, Z.; Long, Z.; Wenjuan, W.; Bin, L.; Sijie, T. Using Fuzzy Comprehensive Evaluation to Assess the Competency of Full-Time Water Conservancy Emergency Rescue Teams. Mathematics 2022, 10, 2111. [Google Scholar] [CrossRef]
  32. Meng, X.; Chang, J.; Wang, X.; Wang, Y.; Wang, Z. Flood control operation coupled with risk assessment for cascade reservoirs. J. Hydrol. 2019, 572, 543–555. [Google Scholar] [CrossRef]
  33. Luan, W.; Wei, Z.; Liu, B.; Yu, Y. A training-free non-intrusive air conditioning load monitoring method based on fuzzy comprehensive evaluation. Appl. Energy 2024, 376, 124058. [Google Scholar] [CrossRef]
  34. Hou, J.; Gao, T.; Yang, Y.; Meng, S. Battery inconsistency evaluation based on hierarchical weight fusion and fuzzy comprehensive evaluation method. J. Energy Storage 2024, 84, 110878. [Google Scholar] [CrossRef]
  35. Castellani, F.; Natili, F.; Astolfi, D.; Vidal, Y. Wind turbine gearbox condition monitoring through the sequential analysis of industrial SCADA and vibration data. Energy Rep. 2024, 12, 750–761. [Google Scholar] [CrossRef]
  36. Liu, D.; Wang, S.; Fan, Y.; Fernandez, C.; Blaabjerg, F. An optimized multi-segment long short-term memory network strategy for power lithium-ion battery state of charge estimation adaptive wide temperatures. Energy 2024, 304, 132048. [Google Scholar] [CrossRef]
  37. Wang, C.; Huang, Z.; He, C.; Lin, X.; Li, C.; Huang, J. Research on remaining useful life prediction method for lithium-ion battery based on improved GA-ACO-BPNN optimization algorithm. Sustain. Energy Technol. Assess. 2025, 73, 104142. [Google Scholar] [CrossRef]
  38. Zhang, S.; Zhou, H. Transformer Fault Diagnosis Based on Multi-Strategy Enhanced Dung Beetle Algorithm and Optimized SVM. Energies 2024, 17, 6296. [Google Scholar] [CrossRef]
  39. Zhao, W.; Egusquiza, M.; Valero, C.; Valentín, D.; Presas, A.; Egusquiza, E. On the use of artificial neural networks for condition monitoring of pump-turbines with extended operation. Measurement 2020, 163, 107952. [Google Scholar] [CrossRef]
  40. Dorber, M.; Scherer, L.; Verones, F. Midpoint characterization factors to assess impacts of turbine water use from hydropower production. Int. J. Life Cycle Assess. 2024, 29, 2151–2164. [Google Scholar] [CrossRef]
  41. Zhang, F.; Liu, J.; Liu, Y.; Li, Y.; Duan, R.; Chen, Z.; Jiang, X. Heterogeneous graph contrastive learning-based transductive health condition assessment of Francis turbine unit. Eng. Appl. Artif. Intell. 2025, 145, 110240. [Google Scholar] [CrossRef]
  42. Chen, H.; Pan, J.; Wang, S.; Ma, J.; Zhang, W. Fatigue Damage Assessment of Turbine Runner Blades Considering Sediment Wear. Appl. Sci. 2024, 14, 4660. [Google Scholar] [CrossRef]
  43. Zhang, F.; Liu, J.; Liu, Y.; Li, H.; Jiang, X. Data-model-interactive enhancement-based Francis turbine unit health condition assessment using graph driven health benchmark model. Expert Syst. Appl. 2024, 249, 123724. [Google Scholar]
  44. Su, W.; Li, Q.; Zheng, W.; Han, Y.; Yu, Z.; Bai, Z.; Han, Y. Enhancing wind-solar hybrid hydrogen production through multi-state electrolyzer management and complementary energy optimization. Energy Rep. 2024, 11, 1774–1786. [Google Scholar] [CrossRef]
  45. Nasrabadi, A.M.; Korpeh, M. Techno-economic analysis and optimization of a proposed solar-wind-driven multigeneration system; case study of Iran. Int. J. Hydrogen Energy 2023, 48, 13343–13361. [Google Scholar] [CrossRef]
  46. Wang, J.; Wen, Y.; Wu, K.; Ding, S.; Liu, Y.; Tian, H.; Zhang, J.; Wang, L.; Cao, Q.; Zhang, Y.; et al. Optimization study of wind, solar, hydro and hydrogen storage based on improved multi-objective particle swarm optimization. J. Energy Storage 2024, 93, 112298. [Google Scholar]
  47. Ahadi, P.; Fakhrabadi, F.; Pourshaghaghy, A.; Kowsary, F. Optimal site selection for a solar power plant in Iran via the Analytic Hierarchy Process (AHP). Renew. Energy 2023, 215, 118944. [Google Scholar]
  48. Zhao, S.; Tang, S. Comprehensive evaluation of transmission network planning scheme based on improved analytic hierarchy process, CRITIC method and TOPSIS. Electr. Power Autom. Equip. 2019, 39, 143–148+162. [Google Scholar]
  49. Šostar, M.; Ristanović, V. Assessment of influencing factors on consumer behavior using the AHP model. Sustainability 2023, 15, 10341. [Google Scholar] [CrossRef]
  50. Diakoulaki, D.; Mavrotas, G.; Papayannakis, L. Determining objective weights in multiple criteria problems: The CRITIC method. Comput. Oper. Res. 1995, 22, 763–770. [Google Scholar]
  51. Li, Y.-N.; Hu, Z.-H. A tri-system urban waterlogging risk assessment framework based on GIS- game theory combination weight: A case of Zhengzhou City. Nat. Hazards 2024, 120, 14649–14681. [Google Scholar]
  52. Mao, Y.; Luobin, Z.; Yang, C. Wind speedpower curve modeling method based on hybrid half-cloud model. Electr. Power Autom. Equip. 2020, 40, 106–114. [Google Scholar]
  53. Cheng, J.; Duan, Z. Cloud model based sine cosine algorithm for solving optimization problems. Evol. Intell. 2019, 12, 503–514. [Google Scholar]
  54. Zhang, B.; Yang, Y.; Liu, L.; Ma, Z. Operation status evaluation of hydraulic turbine regulation system based on improved AHP and cloud model. Yangtze River 2024, 55, 219–225. [Google Scholar]
  55. Liu, J.; An, B.; Zhang, W.; Gan, Q. Review of health status evaluation of large wind turbines. Power Syst. Prot. Control. 2023, 51, 176–187. [Google Scholar]
  56. Gong, Y.; Jiang, Y.; Liang, X. Similarity Measurement for Normal Cloud Models Based on Fuzzy Similarity Measure. Syst. Eng. 2015, 33, 133–137. [Google Scholar]
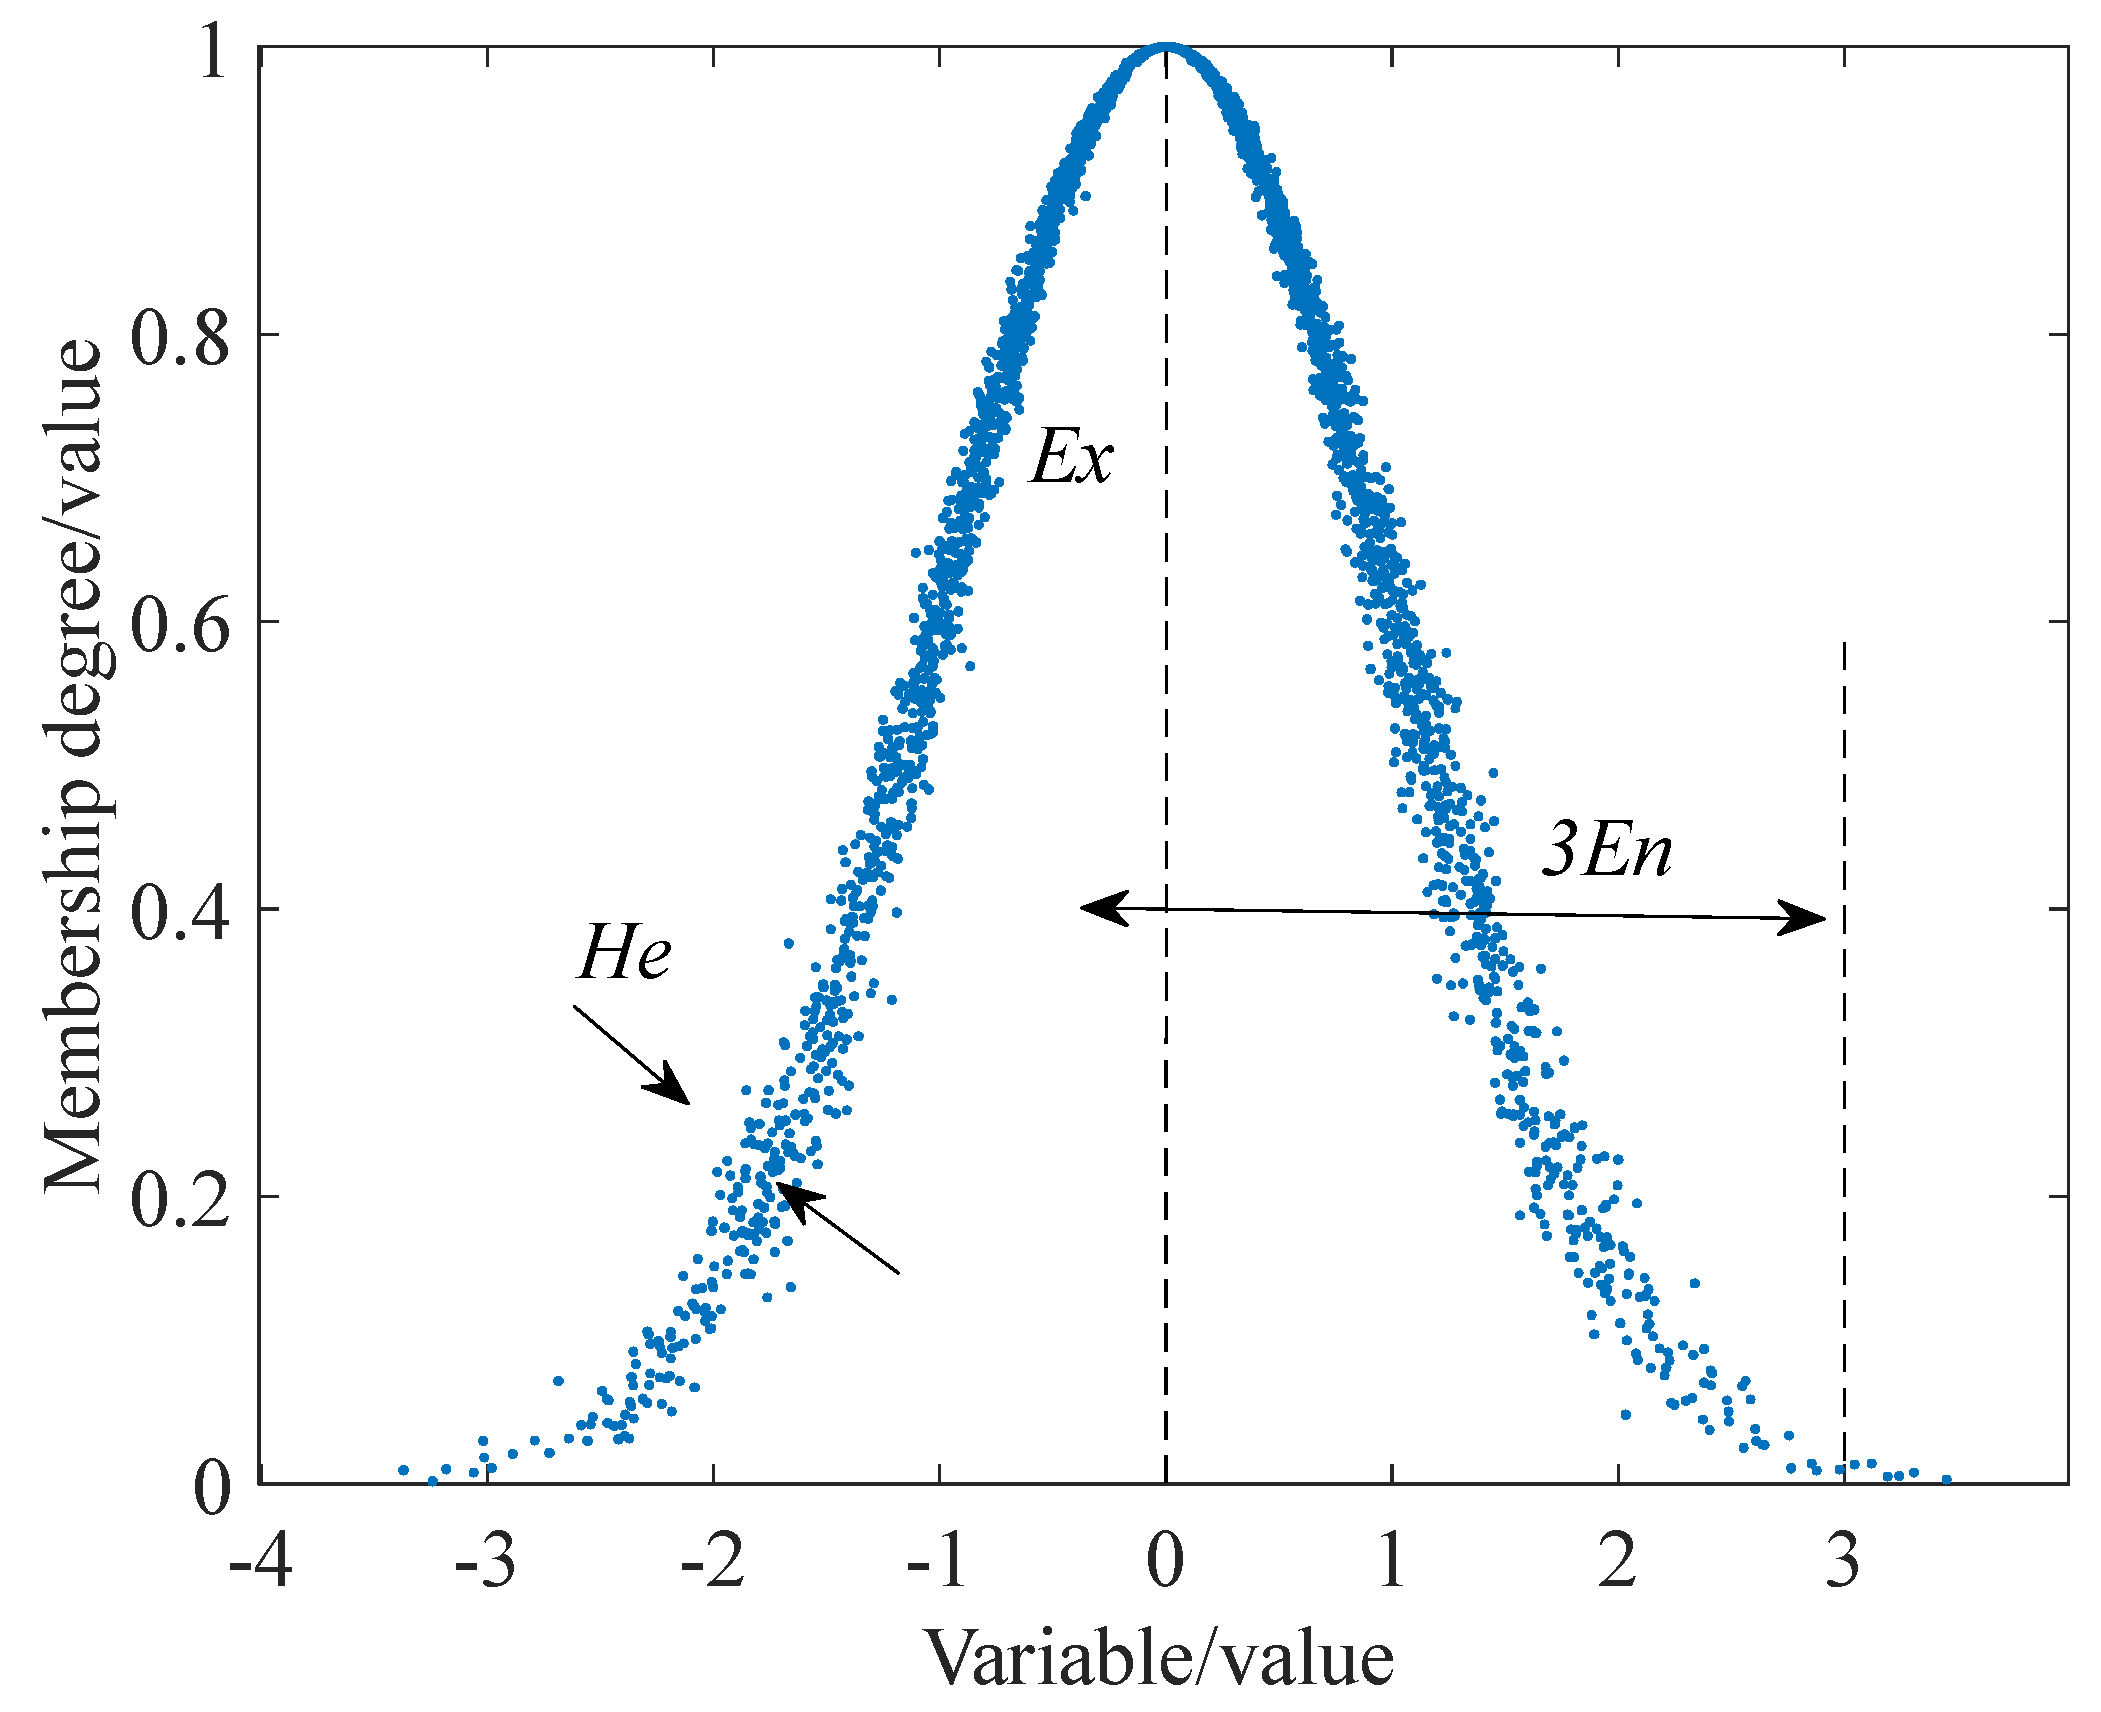
Figure 1. The normal cloud model.
Energies 18 01306 g001
Figure 2. Health evaluation flowchart.
Energies 18 01306 g002
Figure 3. Health evaluation indicator system.
Energies 18 01306 g003
Figure 4. Standard cloud model.
Energies 18 01306 g004
Figure 5. The structure of the hybrid wind/PV/pumped storage system.
Energies 18 01306 g005
Figure 6. The PV output characteristic curve.
Energies 18 01306 g006
Figure 7. The wind power output characteristic curve.
Energies 18 01306 g007
Figure 8. The wind–PV continuous output curve.
Energies 18 01306 g008
Figure 9. The output characteristic curve of hybrid system.
Energies 18 01306 g009
Figure 10. The state of the unit before and after high-proportion wind–PV access.
Energies 18 01306 g010
Figure 11. Pumped storage operating point selection.
Energies 18 01306 g011
Figure 12. The radar chart of the three weight calculation methods. (a) Component layer indicator weight; (b) Rack indicator weight; (e) Index weight of water guide mechanism.
Energies 18 01306 g012
Figure 13. Index cloud solving result. (a) Rack index cloud. (b) Stator seat index cloud. (c) Headcover index cloud. (d) Spiral case index cloud. (e) Distributor index cloud. (f) Draft tube index cloud.
Energies 18 01306 g013aEnergies 18 01306 g013b
Figure 14. Component integrated cloud.
Energies 18 01306 g014
Figure 15. Integrated cloud for pump turbine.
Energies 18 01306 g015
Table 1. Pump turbine parameters.
Type of PS UnitInstalled Capacity/MWTurbine Power/MWPump Power/MWRated Head/m
Mixed-flow single-stage reversible type4 × 300306324.2550
Table 2. Meaning of scale values.
Scale ValueMeaning
1.0
Equally important
1.2
Slightly important
1.4
Strongly important
1.6
Significantly important
1.8
Definitely important
Table 3. RI parameter list.
Rank12356
RI000.521.121.24
Table 4. Evaluation method.
MethodAdvantage DescriptionFocus on Solving Problems
Traditional CRITIC methodThe weight is determined by the correlation between indicators to ensure the rationality of the evaluation results.The objectivity and impartiality of index weights, especially the mutual influence of indicators.
Entropy weight methodIt can identify indicators with large information and give them higher weights to reflect the real situation.Address the problem of information asymmetry and strengthen the influence of important indicators.
IAHP methodThe combination of analytic hierarchy process and fuzzy mathematics can deal with uncertainty and subjectivity in complex decision making.Conduct multi-level and multi-index decision analysis to optimize resource allocation and evaluation.
Game theory method of weightingCombine subjective and objective empowerment to reduce subjectivity and error caused by single empowerment.Seek the consistency between evaluation indicators and optimize the decision-making process.
Cloud modelIt deals with the uncertain transformation of qualitative and quantitative information, and the description ability is stronger than that of fuzzy membership function.Accurate assessment of uncertainty issues, such as health assessment of pump turbines.
Table 5. Evaluation rating scale.
Health StatusInterval RangeHealth Status Description
Excellence85~100Indicator is in the normal range and close to the optimal value
Good60~85Indicators are generally satisfactory, with no deterioration trend
General37.5~60A small number of indicators are close to the warning value, but most of the indicators are generally acceptable, with a deterioration trend.
Degeneration15~37.5Indicators are close to the warning value, with a deterioration trend
Abnormality0~15The unit is operating abnormally, and the indicator data exceed the threshold value.
Table 6. Standard cloud model numerical characteristics.
Numerical CharacteristicsAbnormityDegenerationGeneralGoodExcellence
Ex026.348.872.5100
En53.753.754.175
He0.50.50.50.50.5
Table 7. Results of solving for indicator weights.
Component LayerSubjective WeightsObjective WeightsCombination CoefficientsCombination WeightsIndex LayerSubjective WeightsObjective WeightsCombination CoefficientsCombination WeightsCombined Weights
Rack
A1
0.0910.107ω1 = 0.4802
ω2 = 0.5198
0.099A110.2260.213ω1 = 0.7548
ω2 = 0.2542
0.2250.022
A120.2710.2340.2640.026
A130.1610.1890.1700.017
A140.1150.1800.1330.013
A150.2260.1850.2180.022
Stator seat
A2
0.0760.3780.233A210.4170.496ω1 = 0.6840
ω2 = 0.3160
0.4420.103
A220.5830.5040.5580.130
Headcover
A3
0.1520.1130.132A310.4330.307ω1 = 0.7625
ω2 = 0.2375
0.4030.053
A320.3090.3750.3250.043
A330.2580.3190.2720.036
Spiral case A40.3410.1170.224A410.5450.497ω1 = 0.9370
ω2 = 0.0630
0.5420.121
A420.4550.5030.4580.103
Distributor
A5
0.1270.1080.117A510.2750.123ω1 = 0.5044
ω2 = 0.4956
0.2000.023
A520.2290.1320.1810.021
A530.1640.1150.1390.016
A540.1370.1160.1260.015
A550.0980.2500.1730.020
A560.0980.2650.1800.021
Draft tube A60.2130.1780.195A611.000 1.000 ω1 = 0.5000
ω2 = 0.5000
1.0000.195
Table 8. Index-integrated cloud affiliations.
IndicatorsParameters (Ex, En, He)AbnormityDegradationGeneralGoodExcellence
Rack(69.3459, 3.5861, 1.3229)0.00000.00000.00840.99100.0006
Stator seat(76.5678, 0.9935, 0.2588)0.00000.00000.00000.99980.0002
Headcover(78.1769, 10.1289, 4.6672)0.00000.00050.04610.78320.1702
Spiral case(91.7296, 12.7871, 4.9559)0.00000.00020.01310.27650.7102
Distributor(73.9884, 4.1202, 1.5261)0.00000.00000.00190.99280.0053
Draft tube(62.4756, 20.7153, 5.8250)0.01020.08580.36670.44870.0885
Pump turbine(76.4117, 12.0705, 4.0141)0.00000.00190.07410.77720.1468
Table 9. Forecast and actual results.
Part NameForecast ResultActual Result
Upper rackGoodGood
Lower rackGoodGood
Upper guideGoodGood
Lower guideGoodExcellence
Water guideGeneralGeneral
RackGoodGood
Stator seatGoodGood
HeadcoverGoodGood
Spiral caseExcellenceGood
DistributorGoodGood
Draft tubeGoodGeneral
Disclaimer/Publisher’s Note: The statements, opinions and data contained in all publications are solely those of the individual author(s) and contributor(s) and not of MDPI and/or the editor(s). MDPI and/or the editor(s) disclaim responsibility for any injury to people or property resulting from any ideas, methods, instructions or products referred to in the content.