Article

Potential Use of Pyrolysis Char from Waste Polymers as a Reductant for Direct Reduction of Mill Scale

Department of Materials Science and Engineering, Chosun University, Gwangju 61452, Republic of Korea
*
Author to whom correspondence should be addressed.
Energies 2025, 18(5), 1122; https://doi.org/10.3390/en18051122
Submission received: 19 January 2025 / Revised: 12 February 2025 / Accepted: 15 February 2025 / Published: 25 February 2025

Abstract

:
Waste polymers composed of carbonaceous compounds can be converted into gases and oils by pyrolysis. Although pyrolysis char is generated continuously in the pyrolysis process, its high ash content limits its industrial application. In the present study, the use of pyrolysis char with a high ash content as a reductant for the reduction reaction of mill scale was investigated. The mill scale reduction behaviors were investigated by modifying the mixing ratio of oxygen in the mill scale and fixed carbon in the pyrolysis char at temperatures ranging from 1723 to 1873 K. The degree of reduction of molten iron oxide in the mill scale was obtained by measuring the amounts of CO and CO2 gases generated during the reduction reaction in an Ar gas atmosphere. The degree of reduction increased with temperature and mixing ratio of the mill scale and pyrolysis char. In this study, the maximum degrees of reduction of mill scale at 1873 K were 0.32 and 0.65 for C/O ratios of 0.77 and 1.33, respectively. Based on a comparison of the rate constants for the overall mill scale reduction reaction with the previous rate constants, the rate-determining step in the present study was assumed to be the insufficient agitation effects owing to the limited gas evolution of CO and CO2 caused by the low gases released during reduction resulting from the low initial carbon concentration. In addition, the potential use of pyrolysis char produced from the pyrolysis of waste materials composed of carbon compounds as an alternative carbon source was investigated.

1. Introduction

High-quality steel scrap is necessary in the electric arc furnace process (from here, referred to as EAF process) for producing high-quality steel products. The amount of end-of-life steel scrap is likely to increase from the mid-2020s because global steel production has increased significantly since the early 2000s. It is largely driven by growth in China [1]. The largest amount of steel scrap use is likely to be for low-quality scrap. It is expected to increase by 380% between 2015 and 2050. [2]. Because the use of high-quality scrap has increased in the basic oxygen furnace steelmaking process owing to the reduction in CO2 emissions, it is assumed that the deficiency of high-quality scrap becomes significant in the EAF process.
For the EAF process, it is necessary to develop and reserve high-quality Fe resources for the production of high-quality steel products. Mill scale is a byproduct of the iron content generated during continuous casting and rolling processes [3]. The size of mill scale is generally within 1–5 mm. It contains approximately 70% iron in the form of hematite (Fe2O3), magnetite (Fe3O4), wustite (FeO), metallic iron (Fe), other non-ferrous materials, and alkaline impurities. The chemical composition of mill scale varies depending on the quality and composition of the steel manufactured during its production [4,5]. Mill scale contains complex oxide phases generated during steel processing. Its recycling process is being developed continuously. The reduction reaction of mill scale consists of several steps: mill scale → Fe2O3 → Fe3O4 → FeO → Fe. Depending on the reaction conditions, the steps of the reduction reaction can be shortened [6]. One of the mill scale recycling methods is the reduction of mill scale carbon composite briquettes. It has been investigated extensively using various reducing agents [3,7,8,9,10]. In most research studies, the reduction behavior of mill scale has been investigated in the solid state. Moreover, studies using waste carbon resources have reported the reduction behavior of mill scale by using waste polymers and waste tires [11].
One of the issues in ironmaking and steelmaking is the continuous research on the utilization of unused carbonaceous materials as alternatives to fossil fuels such as coke. The CO2 emissions during the reduction reaction of iron oxides can be reduced by using biomass samples pretreated by torrefaction. Released volatiles of torrefied biomass samples indicated reduction effects even at lower temperatures than graphite. The reduction steps of “Fe2O3 → Fe3O4 → FeO → Fe” were observed in the low temperature range of 300 to 400 °C [12]. In most studies on the use of alternative carbonaceous materials, waste polymers (composed primarily of carbon and hydrogen) have demonstrated their potential to partially replace coke as a carbon source in the EAF process. This, in turn, has demonstrated the feasibility of reducing electricity and carbon usage [11,13,14]. Mixtures of coke and waste plastics have been reported to enhance slag foaming during EAF [11]. With regard to the reduction reaction of FeO in slag with alternative carbon materials, it has been reported that the use of appropriate amounts of plastics and waste tires improves the reduction rate and decreases CO2 gas emissions. When coke and plastic were mixed in an appropriate ratio, a reduction rate more than twice that of coke alone was observed. In addition, when rubber was used, a faster reduction reaction rate than that of coke was shown, while a slower reduction reaction rate was confirmed with biomass (palm char). The difference in reduction reaction rate was attributed to the fixed carbon content and the hydrogen mixed gas [13,14].
Meanwhile, carbon bond waste can be converted into gas and oil via pyrolysis. Additionally, the oil and gas produced can be used as new energy sources for methanol production. The synthesis of gas and oil generated from waste pyrolysis can be used for methanol production. The global demand for methanol is likely to reach 180,000 metric tons by 2024 and 500,000 metric tons by 2050 [15,16]. Solid residues are also produced during the pyrolysis of various carbonaceous materials such as biomass, waste-life polymers, and tires. These residues are called pyrolysis char (from here, referred to as pyrochar) and mesoporous materials and have an average calorific value of 30 kJ/g [17]. In the case of waste polymer pyrolysis, approximately 30–50% pyrochar is generated [18]. Pyrochar with a low ash content (produced from the pyrolysis oil of waste tires) has a chemical composition similar to that of carbon black. This makes it suitable for reinforcing tire materials [19]. However, pyrochar with a high ash content is not suitable for reinforcing tire materials. This is because the ash content decreases the surface activity of carbon black and causes low dispersion and large agglomeration of carbon black in solvents [20]. Through demineralization, the ash content in the pyrochar can be reduced. However, a reduction in the carbon black structure and the formation of acidic surface groups are observed [19,20]. Although a large amount of alternative carbonaceous materials can be produced from the generation of pyrolysis gas and oil, their high ash content limits their industrial application.
In this study, the feasibility of using high-ash-content pyrochar as a reducing agent for mill scale material generated in the steelmaking process was investigated. The process of using pyrochar, which is difficult to use because of high content ash and without any preprocessing, has been identified. The composition of the pyrochar obtained from the industrial pyrolysis of waste polymer mixtures was measured by proximate and ultimate analyses. The influence of pyrochar addition on the mill scale reduction behavior was investigated from 1723 to 1873 K.

2. Experiments

In this study, the reduction behavior of mill scale pyrochar obtained from the industry was investigated from 1723 K to 1873 K under an Ar atmosphere. Figure 1 shows a schematic of the experimental setup incorporating a gas analyzer. First, the powders of pyrochar and mill scale were crushed using a mortar and pestle and then sieved to below 500 μm. Then, the powders were mixed meticulously to a total amount of approximately 10 g. Table 1 presents the mixing ratios and molar ratios of the powder mixtures based on the oxygen content of mill scale and the fixed carbon content of pyrochar (see Table 2 and Table 3, respectively). A detailed analysis of the compositions and phases of the mill scale and pyrochar is presented in Section 3.1.
The powder mixtures were pelletized to a diameter of 10 mm and charged in an alumina crucible (35 × 45 mm). The furnace temperature was increased to the target temperature at the rate of 6 K/min under an Ar flow of 0.001 m3/min. After the target temperature was attained, the prepared mixture in the crucible was charged from the top of the furnace. Immediately after covering the cap of the furnace with the gas outlet, the O2 content in the emitted gas was analyzed by a potable gas analyzer (NOVA9K, MRU Instruments, Neckarsulm, Germany). It reduced to below 0.03 vol% within approximately 10 s. The start time of the reduction reaction is defined as the point when the O2 content in the emitted gas was below 0.03 vol%. The reaction was maintained for approximately 20 min.
The reduction behavior of mill scale was investigated by varying the pyrochar mixing ratio. The samples were prepared at a ratio sufficient to reduce oxygen in mill scale based on the fixed carbon content of the pyrochar. During the reduction reaction, the CO and CO2 in the released gas were analyzed using a gas analyzer to estimate the degree of reduction in the mill scale. After completing the reduction reaction, the samples were removed from the top of the furnace and quenched with water. The carbon and oxygen contents of the metal phases separated from the meticulously collected samples were analyzed using a C/S analyzer (CS-2000, ELTRA, Haan, Germany) and an O/N analyzer (ON-900, ELTRA, Haan, Germany), respectively. The compositions and phases of the oxide phase from the quenched samples were analyzed by using inductively coupled plasma optical emission spectroscopy (ICP-OES; from here, referred to as ICP) analysis (Optima 5300 DV, Perkin Elmer Ltd., Waltham, MA, USA) and XRD analysis (EMPYREAN, PANalytical, Malvern, UK), respectively.

3. Results

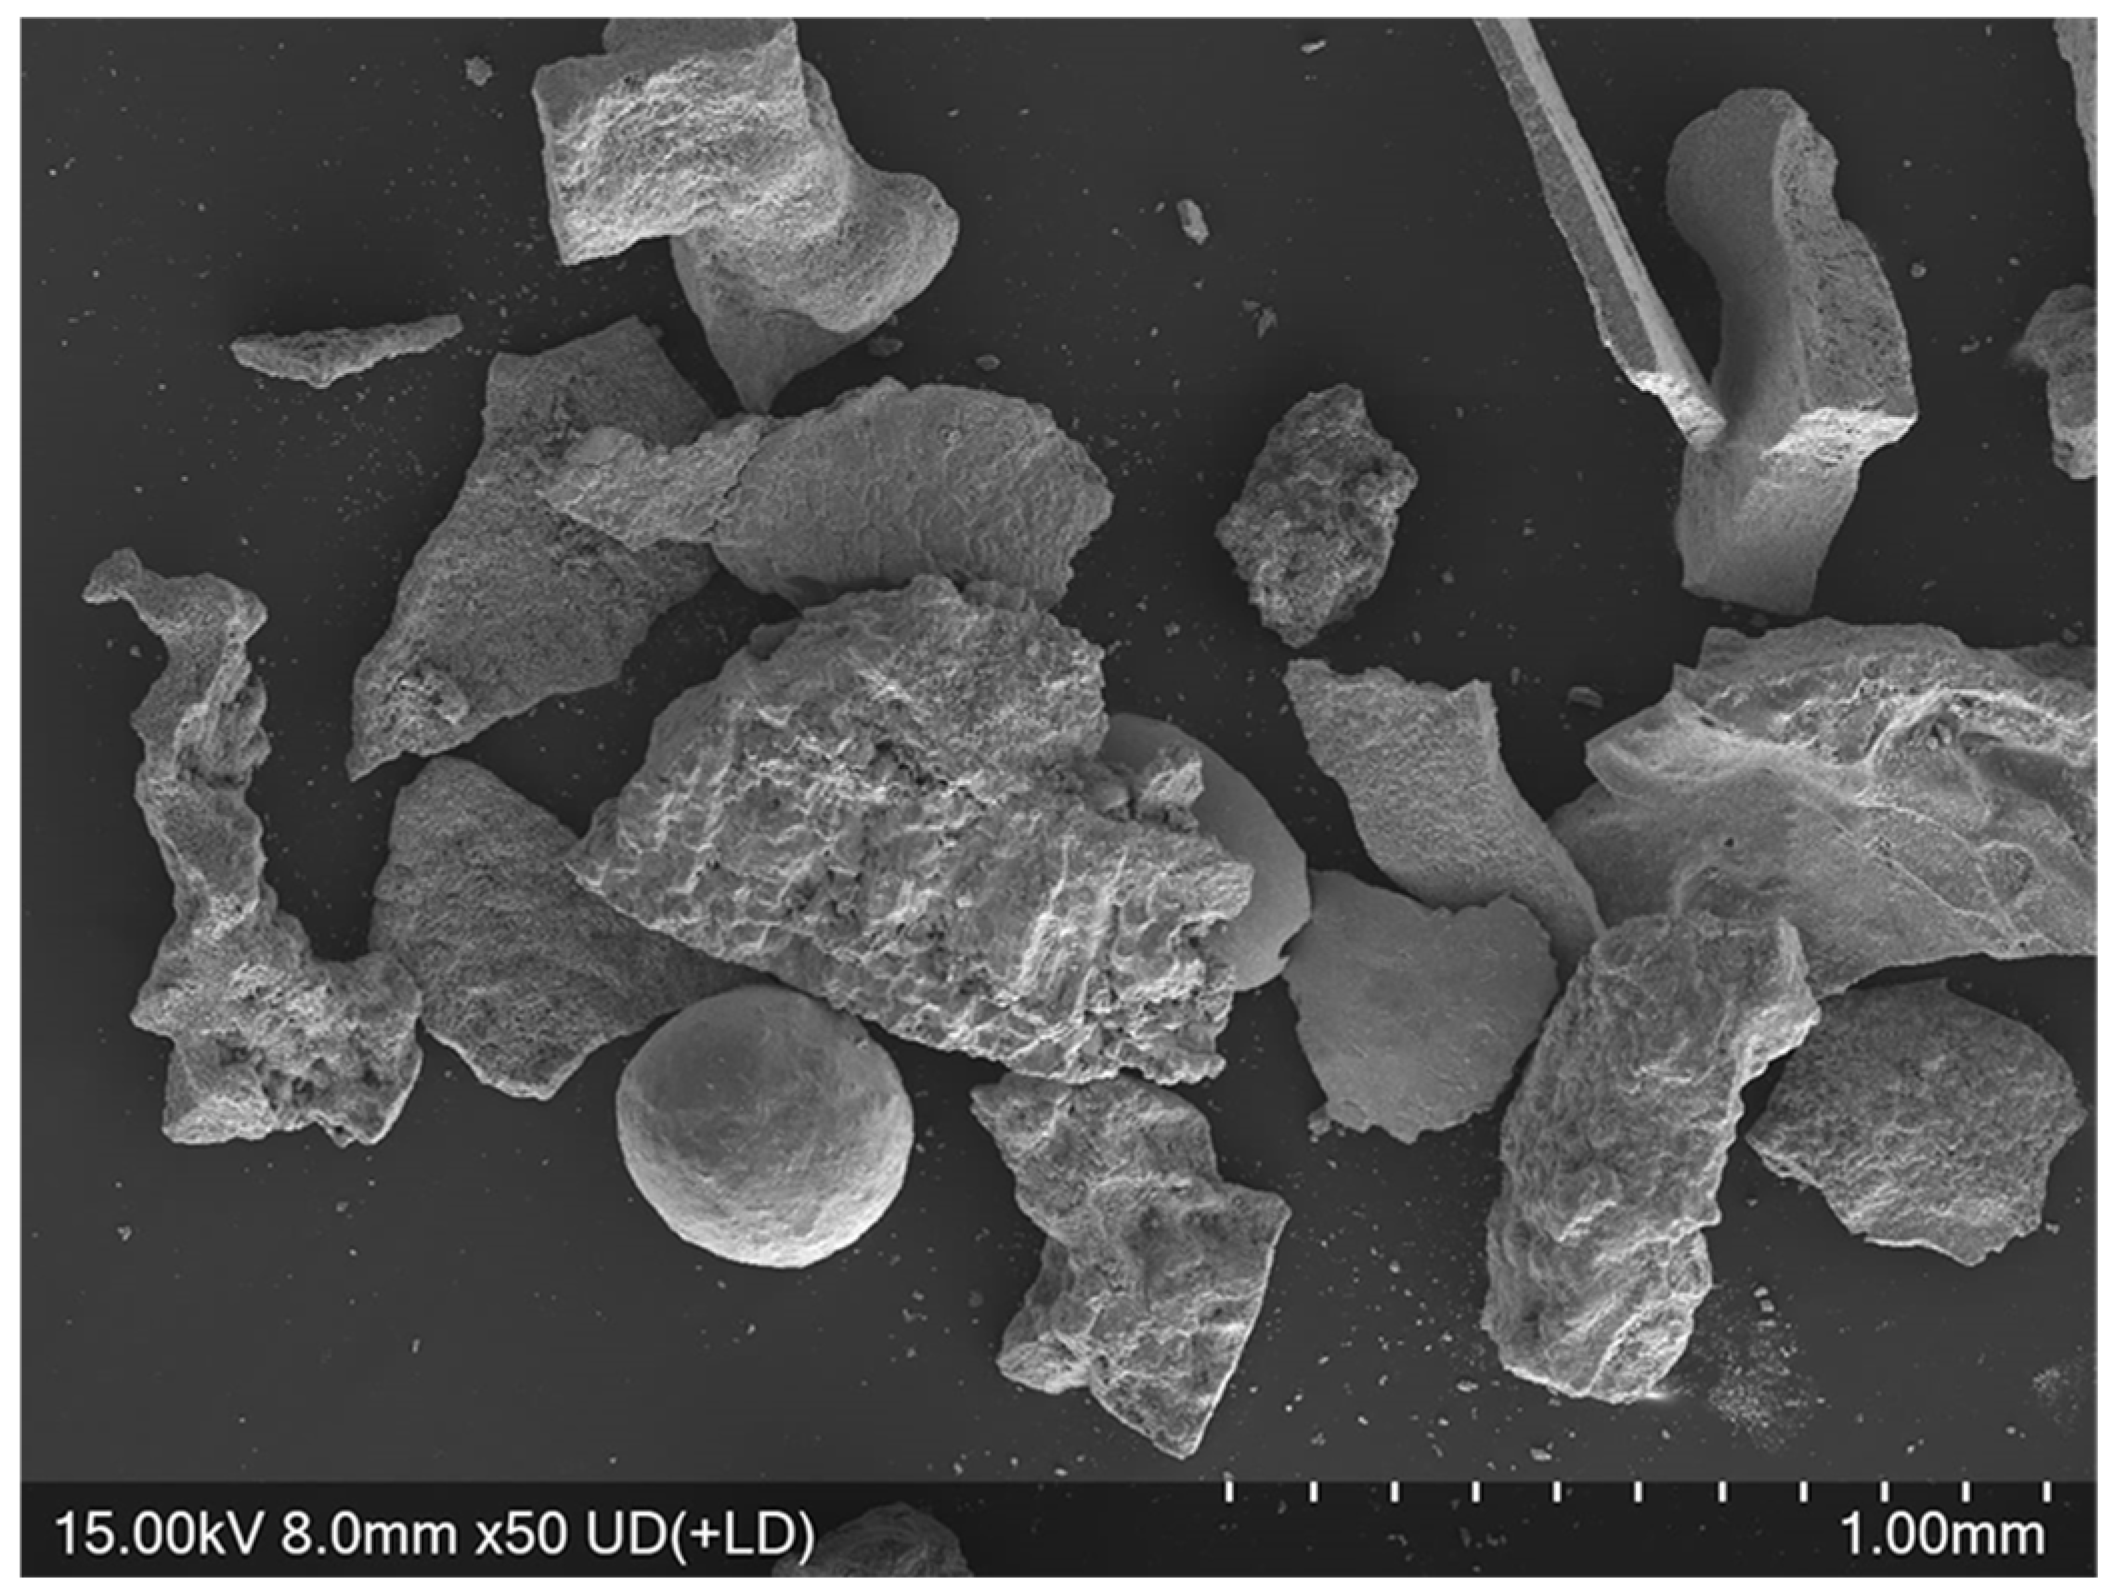
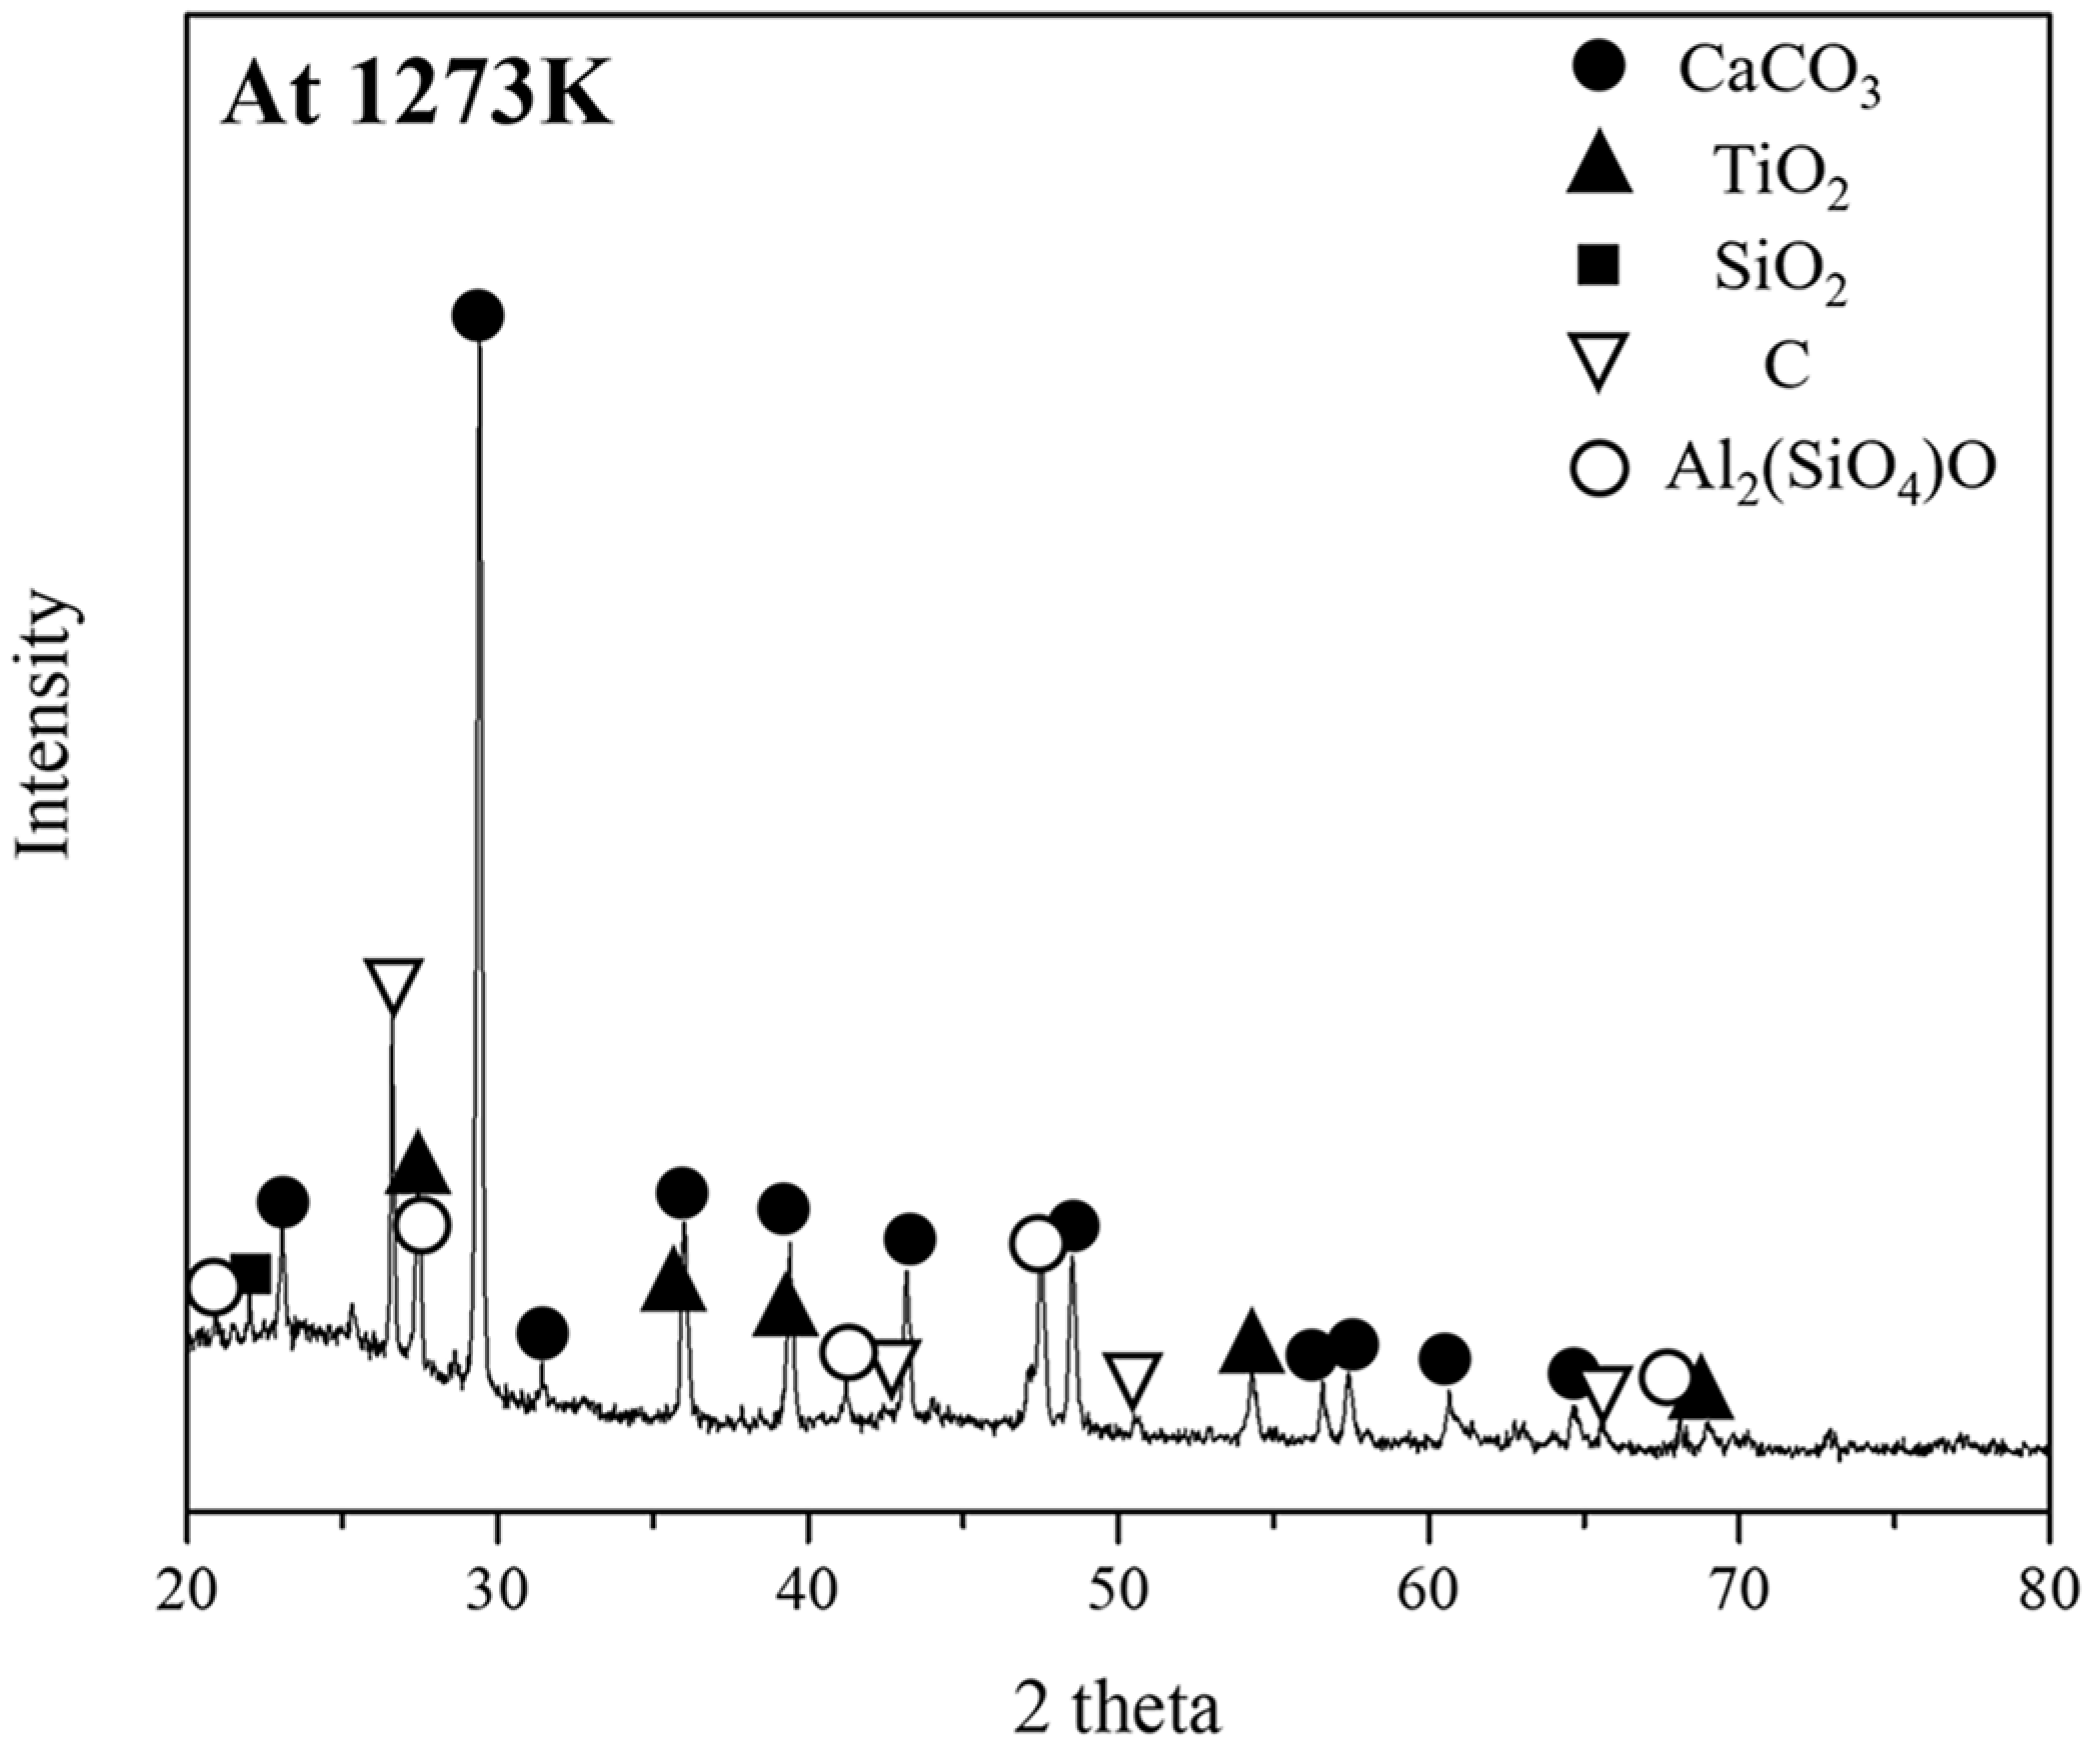
3.1. Characterizations of Mill Scale and Pyrochar

Figure 2 and Figure 3 show the mineralogical image and quantitative phase analysis of mill scale observed using SEM and XRD, respectively. In Figure 2, various shapes of the crushed mill scale powder are observed. As shown in Figure 3, the mill scale consisted of various iron oxide phases such as FeO, Fe2O3, and Fe3O4. The FeO, Fe2O3, and Fe3O4 phases were identified as 36.7%, 11.2%, and 52.1%, respectively, by using XRD Rietveld analysis. The chemical composition of mill scale is presented in Table 2. The Fe, Si, Ca, Mn, Mg, and Al contents were determined using ICP. The concentrations of the metallic elements except Fe are represented in oxide forms. The total oxygen content in the mill scale is represented as the average value from more than five O/N analyses of the powder samples.
Figure 4 shows a mineralogical image of the pyrochar obtained using SEM-EDS. Table 4 presents the phase compositions of the pyrochar. The pyrochar was divided into two main phases: phase 1 (composed of complex oxides) and phase 2 (had a high carbon content). In addition, chlorine was detected in both the phases. It is likely to have originated from the pyrolysis of waste plastics including PVC. Table 3 lists the composition of the pyrochar obtained with proximate and ultimate analyses. As shown in this table, the pyrochar had a high ash content of approximately 35%. Meanwhile, the content of fixed carbon in the pyrochar was approximately 56% (similar to that of typical coal). The volatile matter and moisture contents were similar to those for coke owing to the evaporation during pyrolysis.
Table 5 and Figure 5 show the composition and phase analysis of the ash obtained by heating the pyrochar at 1273 K for 6 h, using XRF and XRD, respectively. The ash in the pyrochar had high CaO and Al2O3 contents and a low SiO2 content. An XRD analysis revealed that the CaO in the ash did not form a slag phase and rather formed CaCO3. In ferrous metallurgy, the slag basicity of CaO/SiO2 is an important factor for the reduction of iron oxide [21]. Slag basicity is generally controlled by adding free CaO obtained from CaCO3. Therefore, pyrochar can be considered a carbonaceous resource with significantly low volatile matter and moisture contents and a high ash content (including a high CaO content).

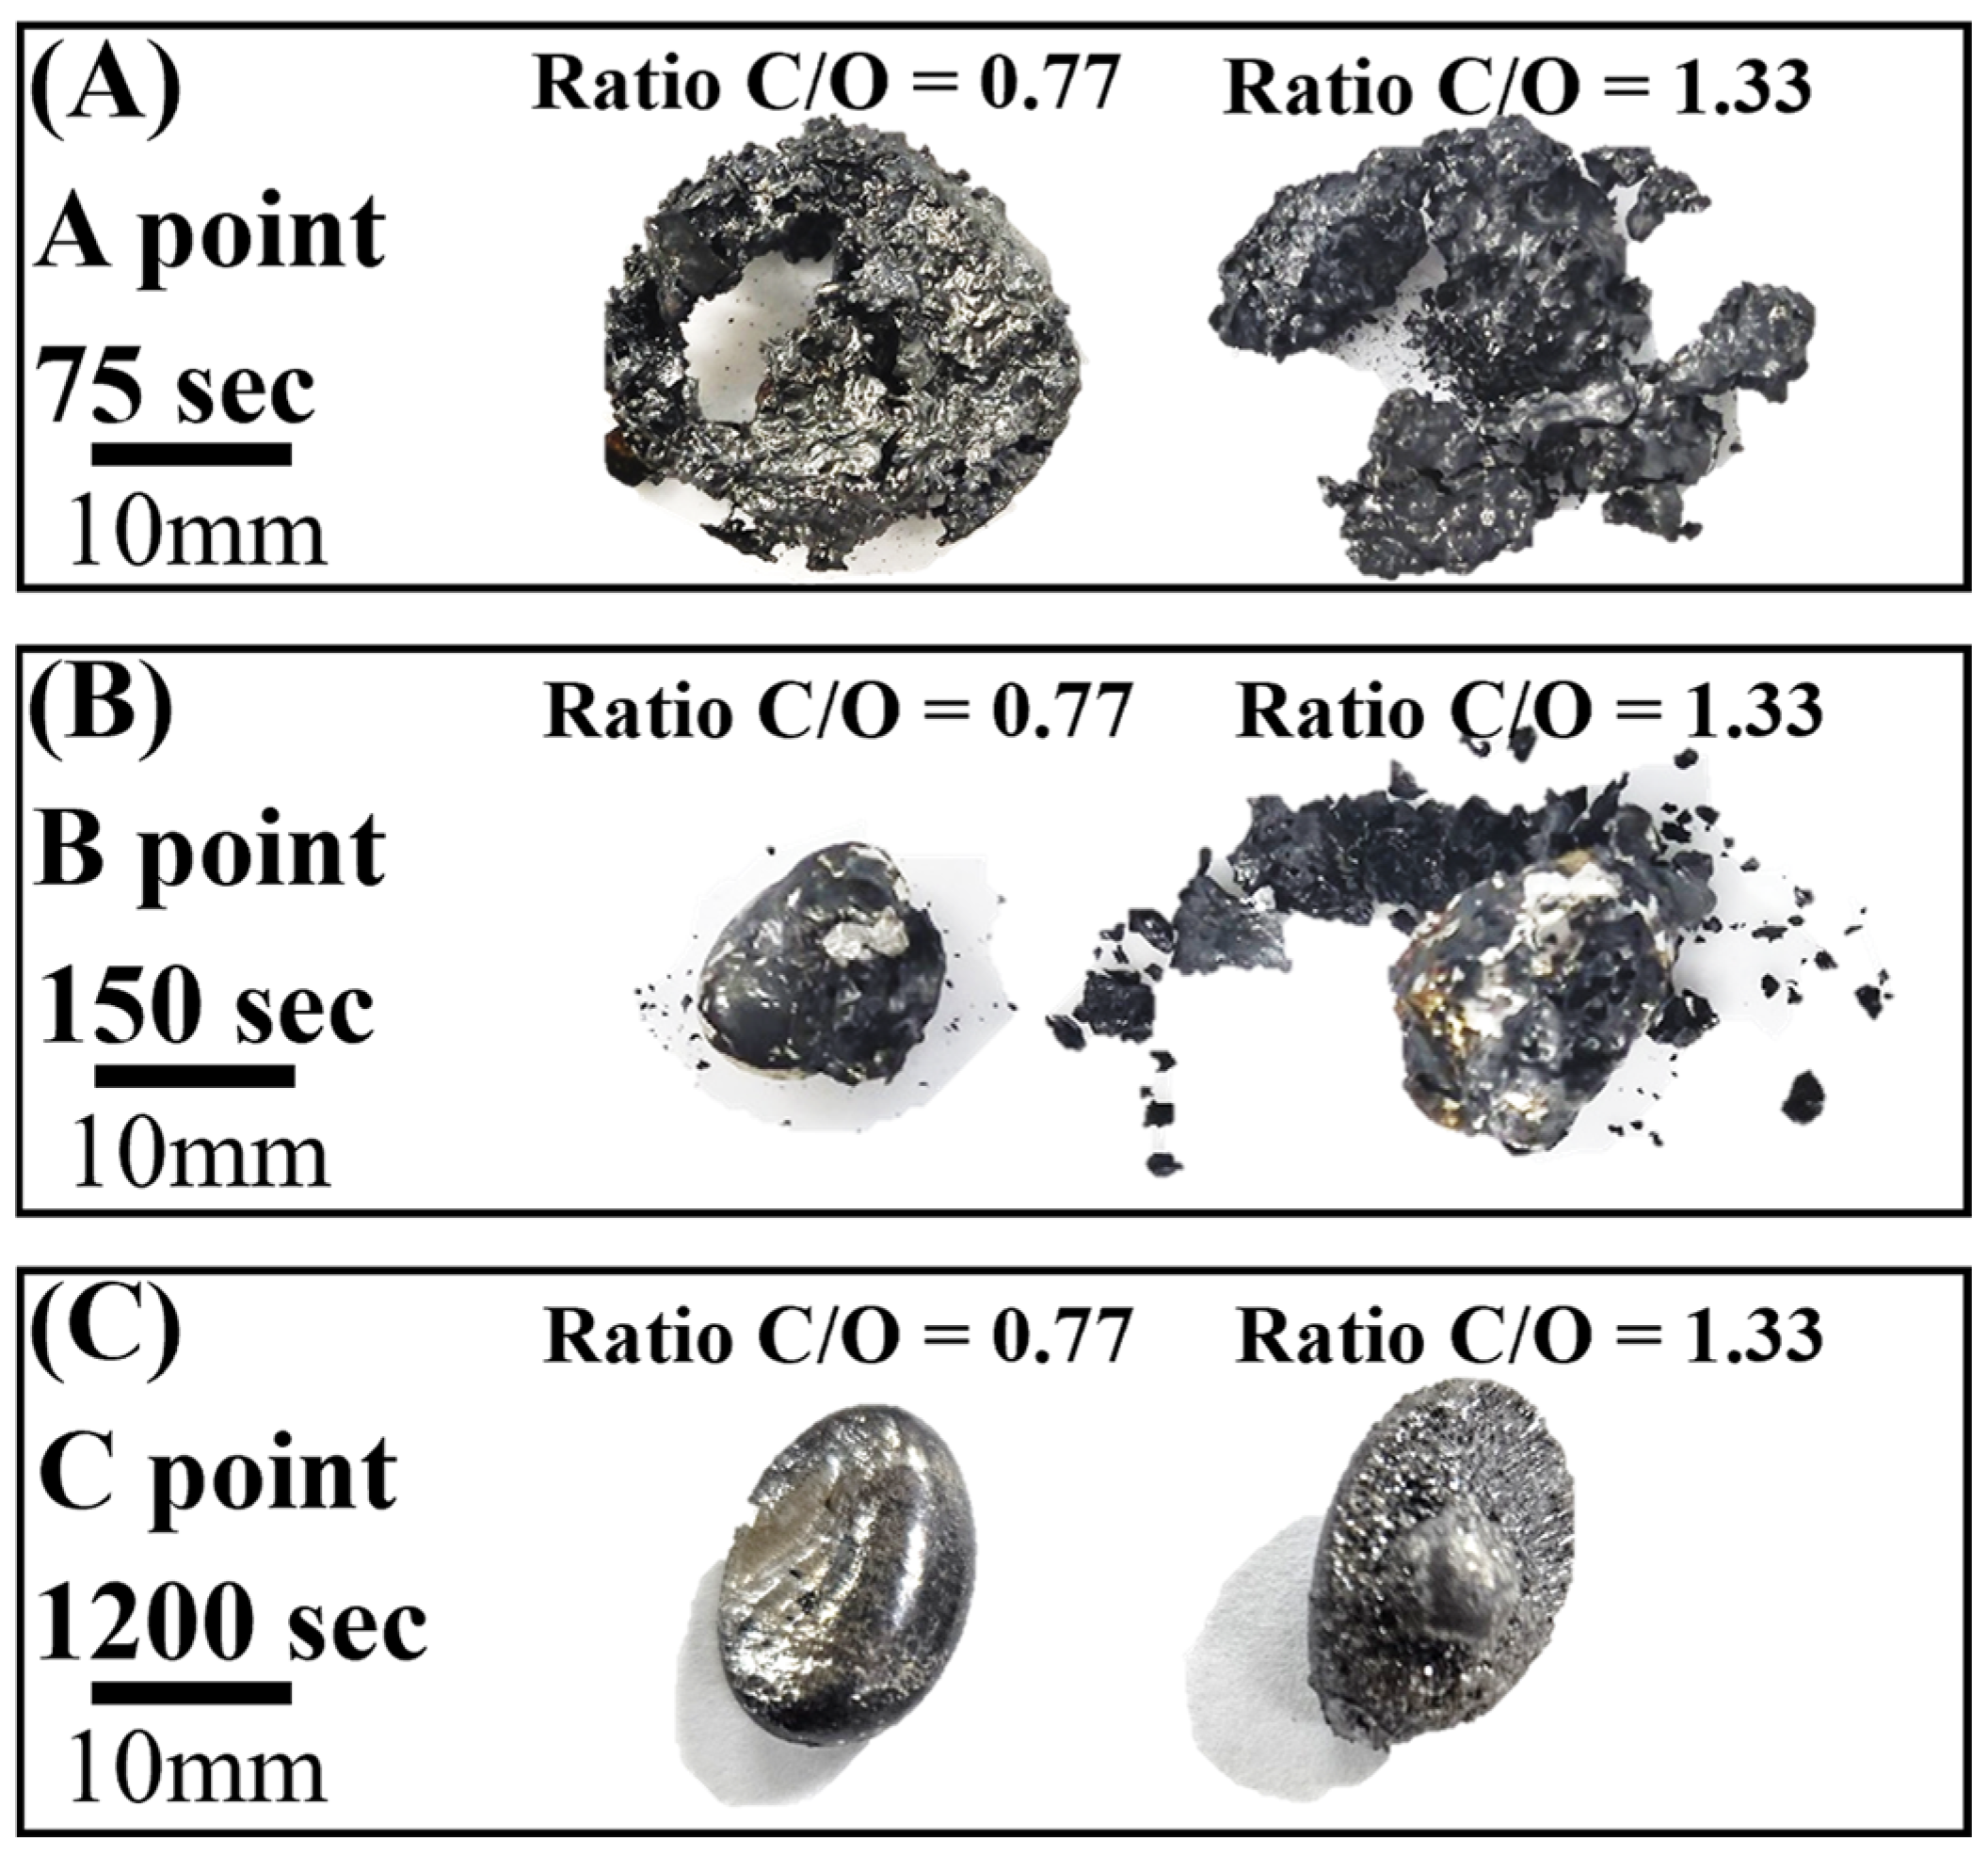
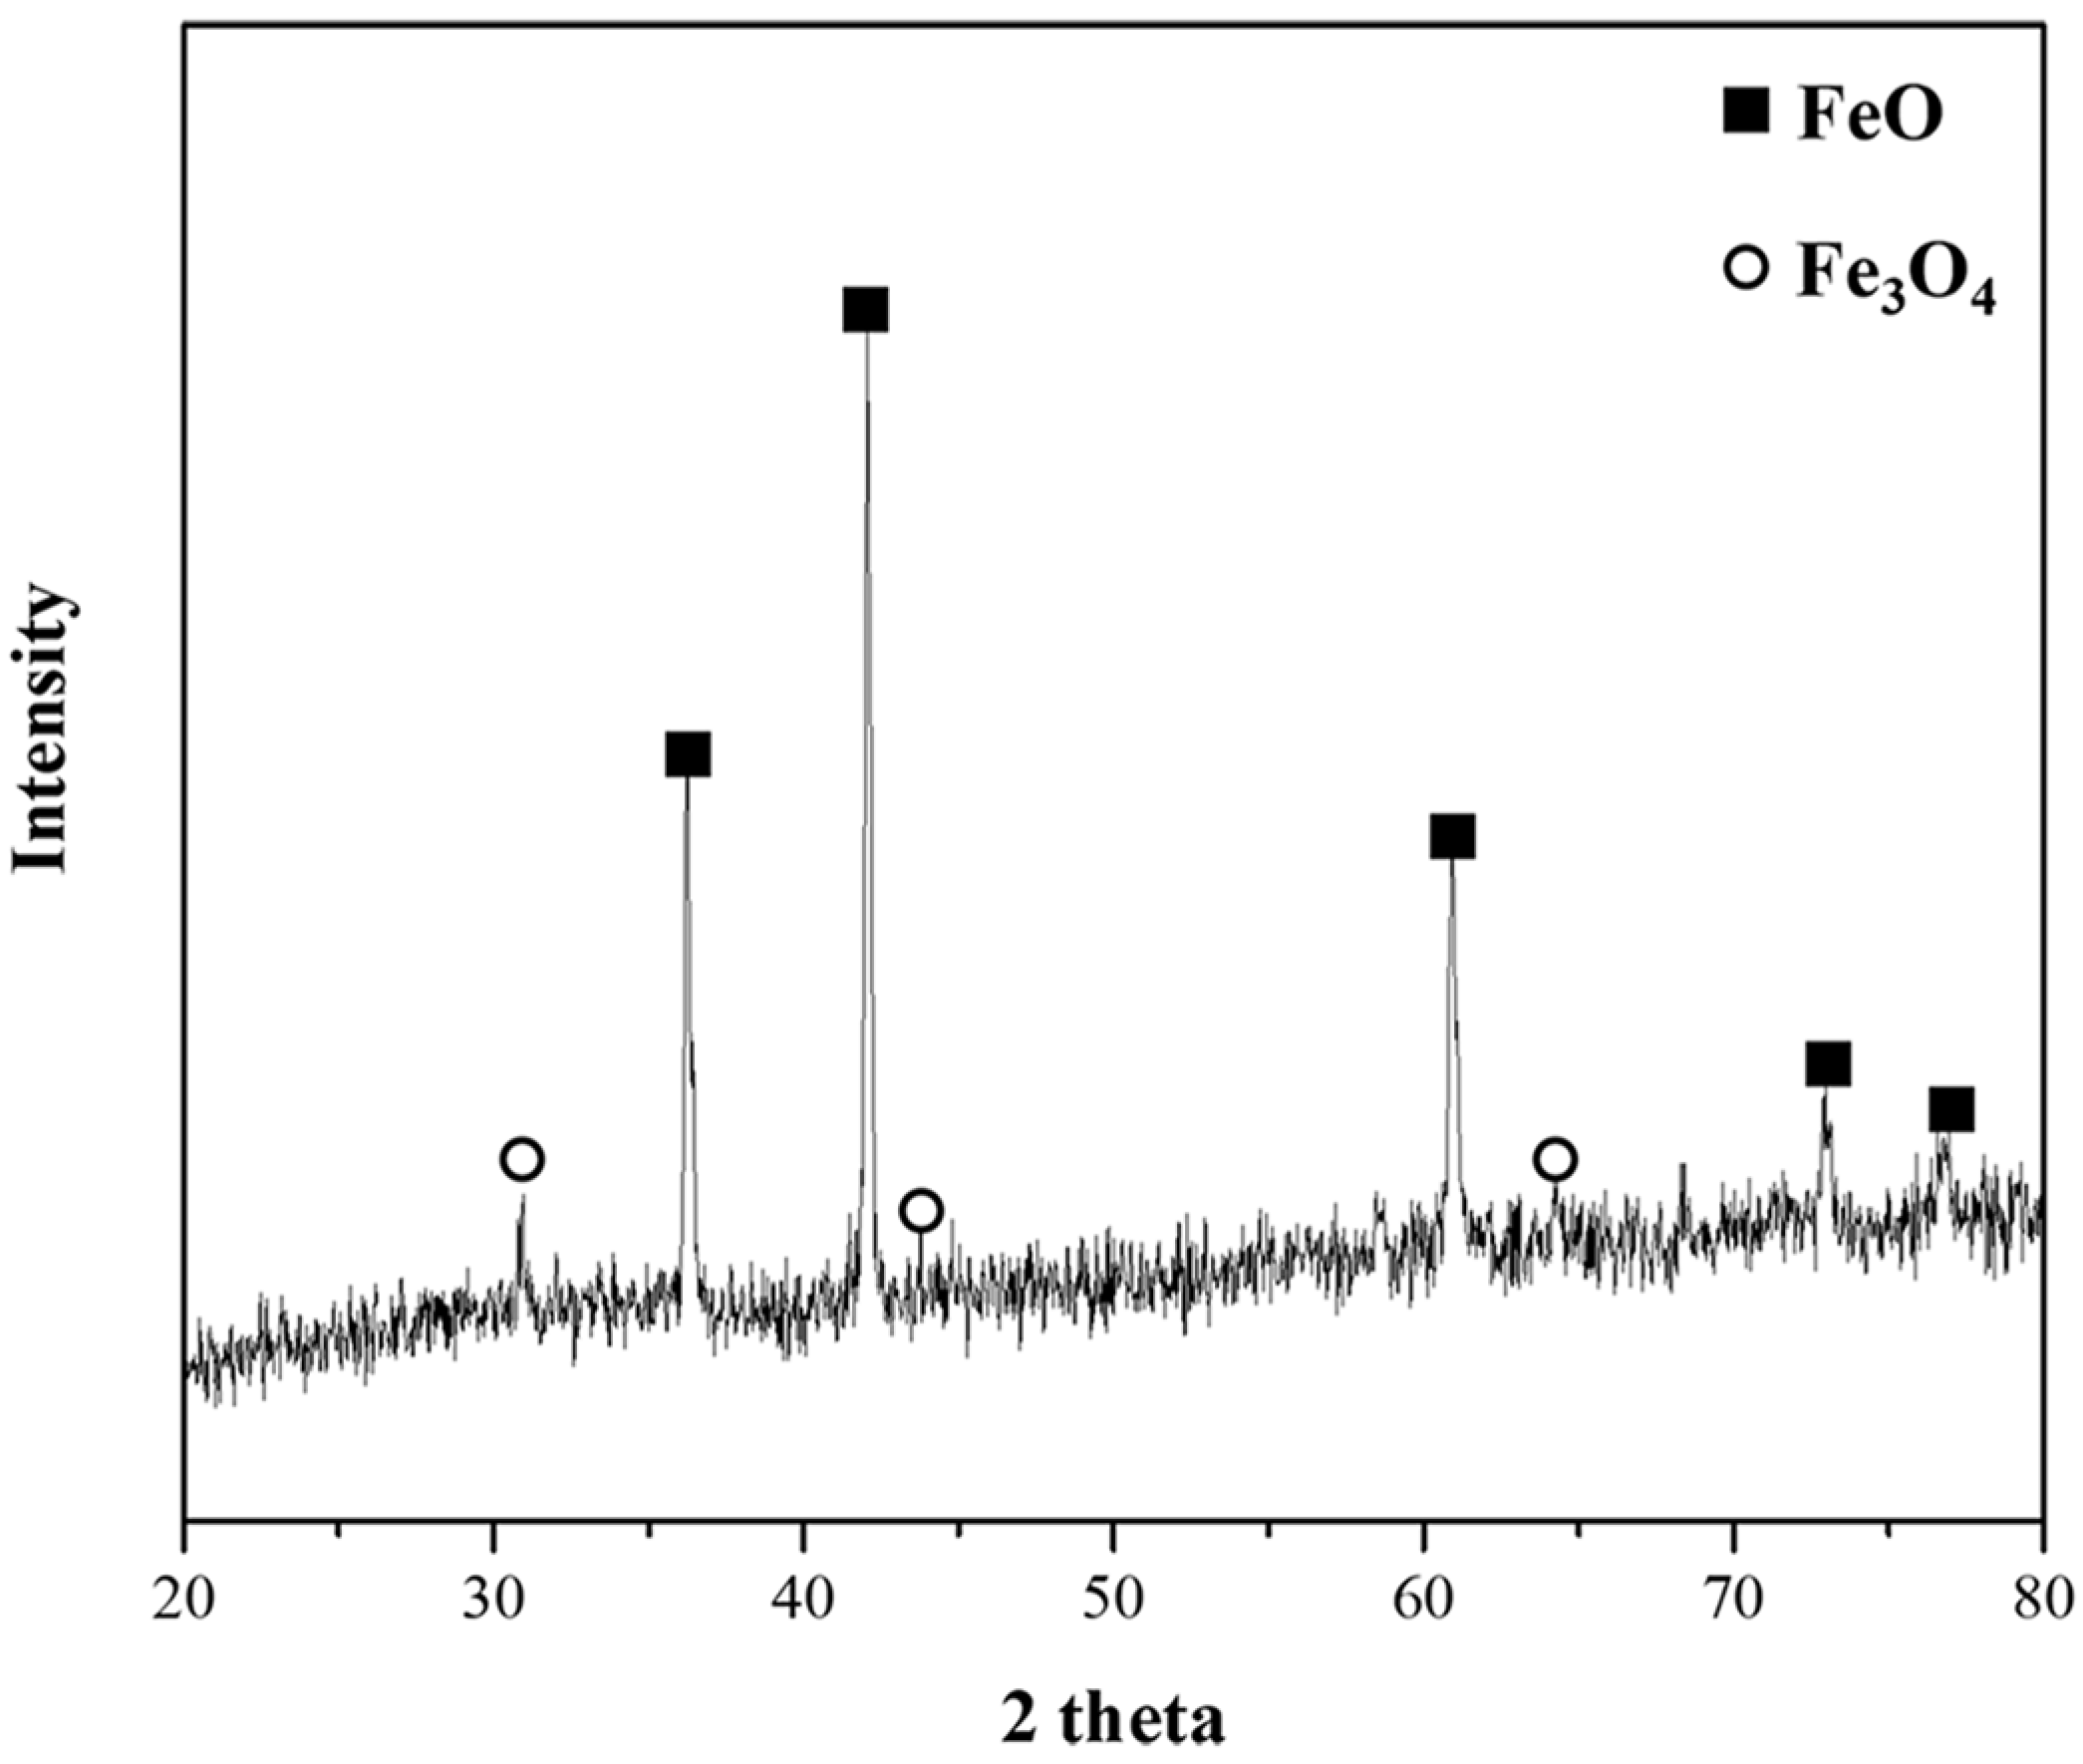
3.2. Observation of Reduced Samples over Time

Figure 6 shows the variations in CO and CO2 concentrations in the generated gas over the reaction time. The experiments were conducted at 1823 K for 20 min. The molar ratios of the fixed carbon in pyrochar to the oxygen in mill scale (C/O ratios) of the mixture were 0.77 and 1.33. As shown in Figure 6, the local maximum points of the CO and CO2 concentrations were observed as the holding time increased. The CO concentration for a C/O ratio of 1.33 was higher than that for a C/O ratio of 0.77. This was notwithstanding the insignificant differences in concentration variations of CO2 for both the ratios.
Figure 7A–C show photographs of the reduced samples obtained at positions A, B, and C in Figure 6, respectively. The reduced samples were obtained at approximately 75, 150, and 1200 s. In Figure 7A, at the start of the reduction reaction, the sample appears to be a sintered oxide. It is identified as a mixture of FeO and Fe3O4 based on the XRD analysis, as shown in Figure 8. It was verified that the Fe2O3 phase was reduced by the reduction reaction with pyrochar, as revealed by the comparison of the phases in the raw mill scales in Figure 3. This indicates that the direct reduction reaction between mill scale and pyrochar started with the generation of CO in the released gas. In Figure 7B,C, the metal phase is observed when the concentration of CO in the generated gas decreases after attaining the local maximum point (Figure 6). This indicates that the reduction degree and rate are related to the variations in the composition of CO in the generated gas.

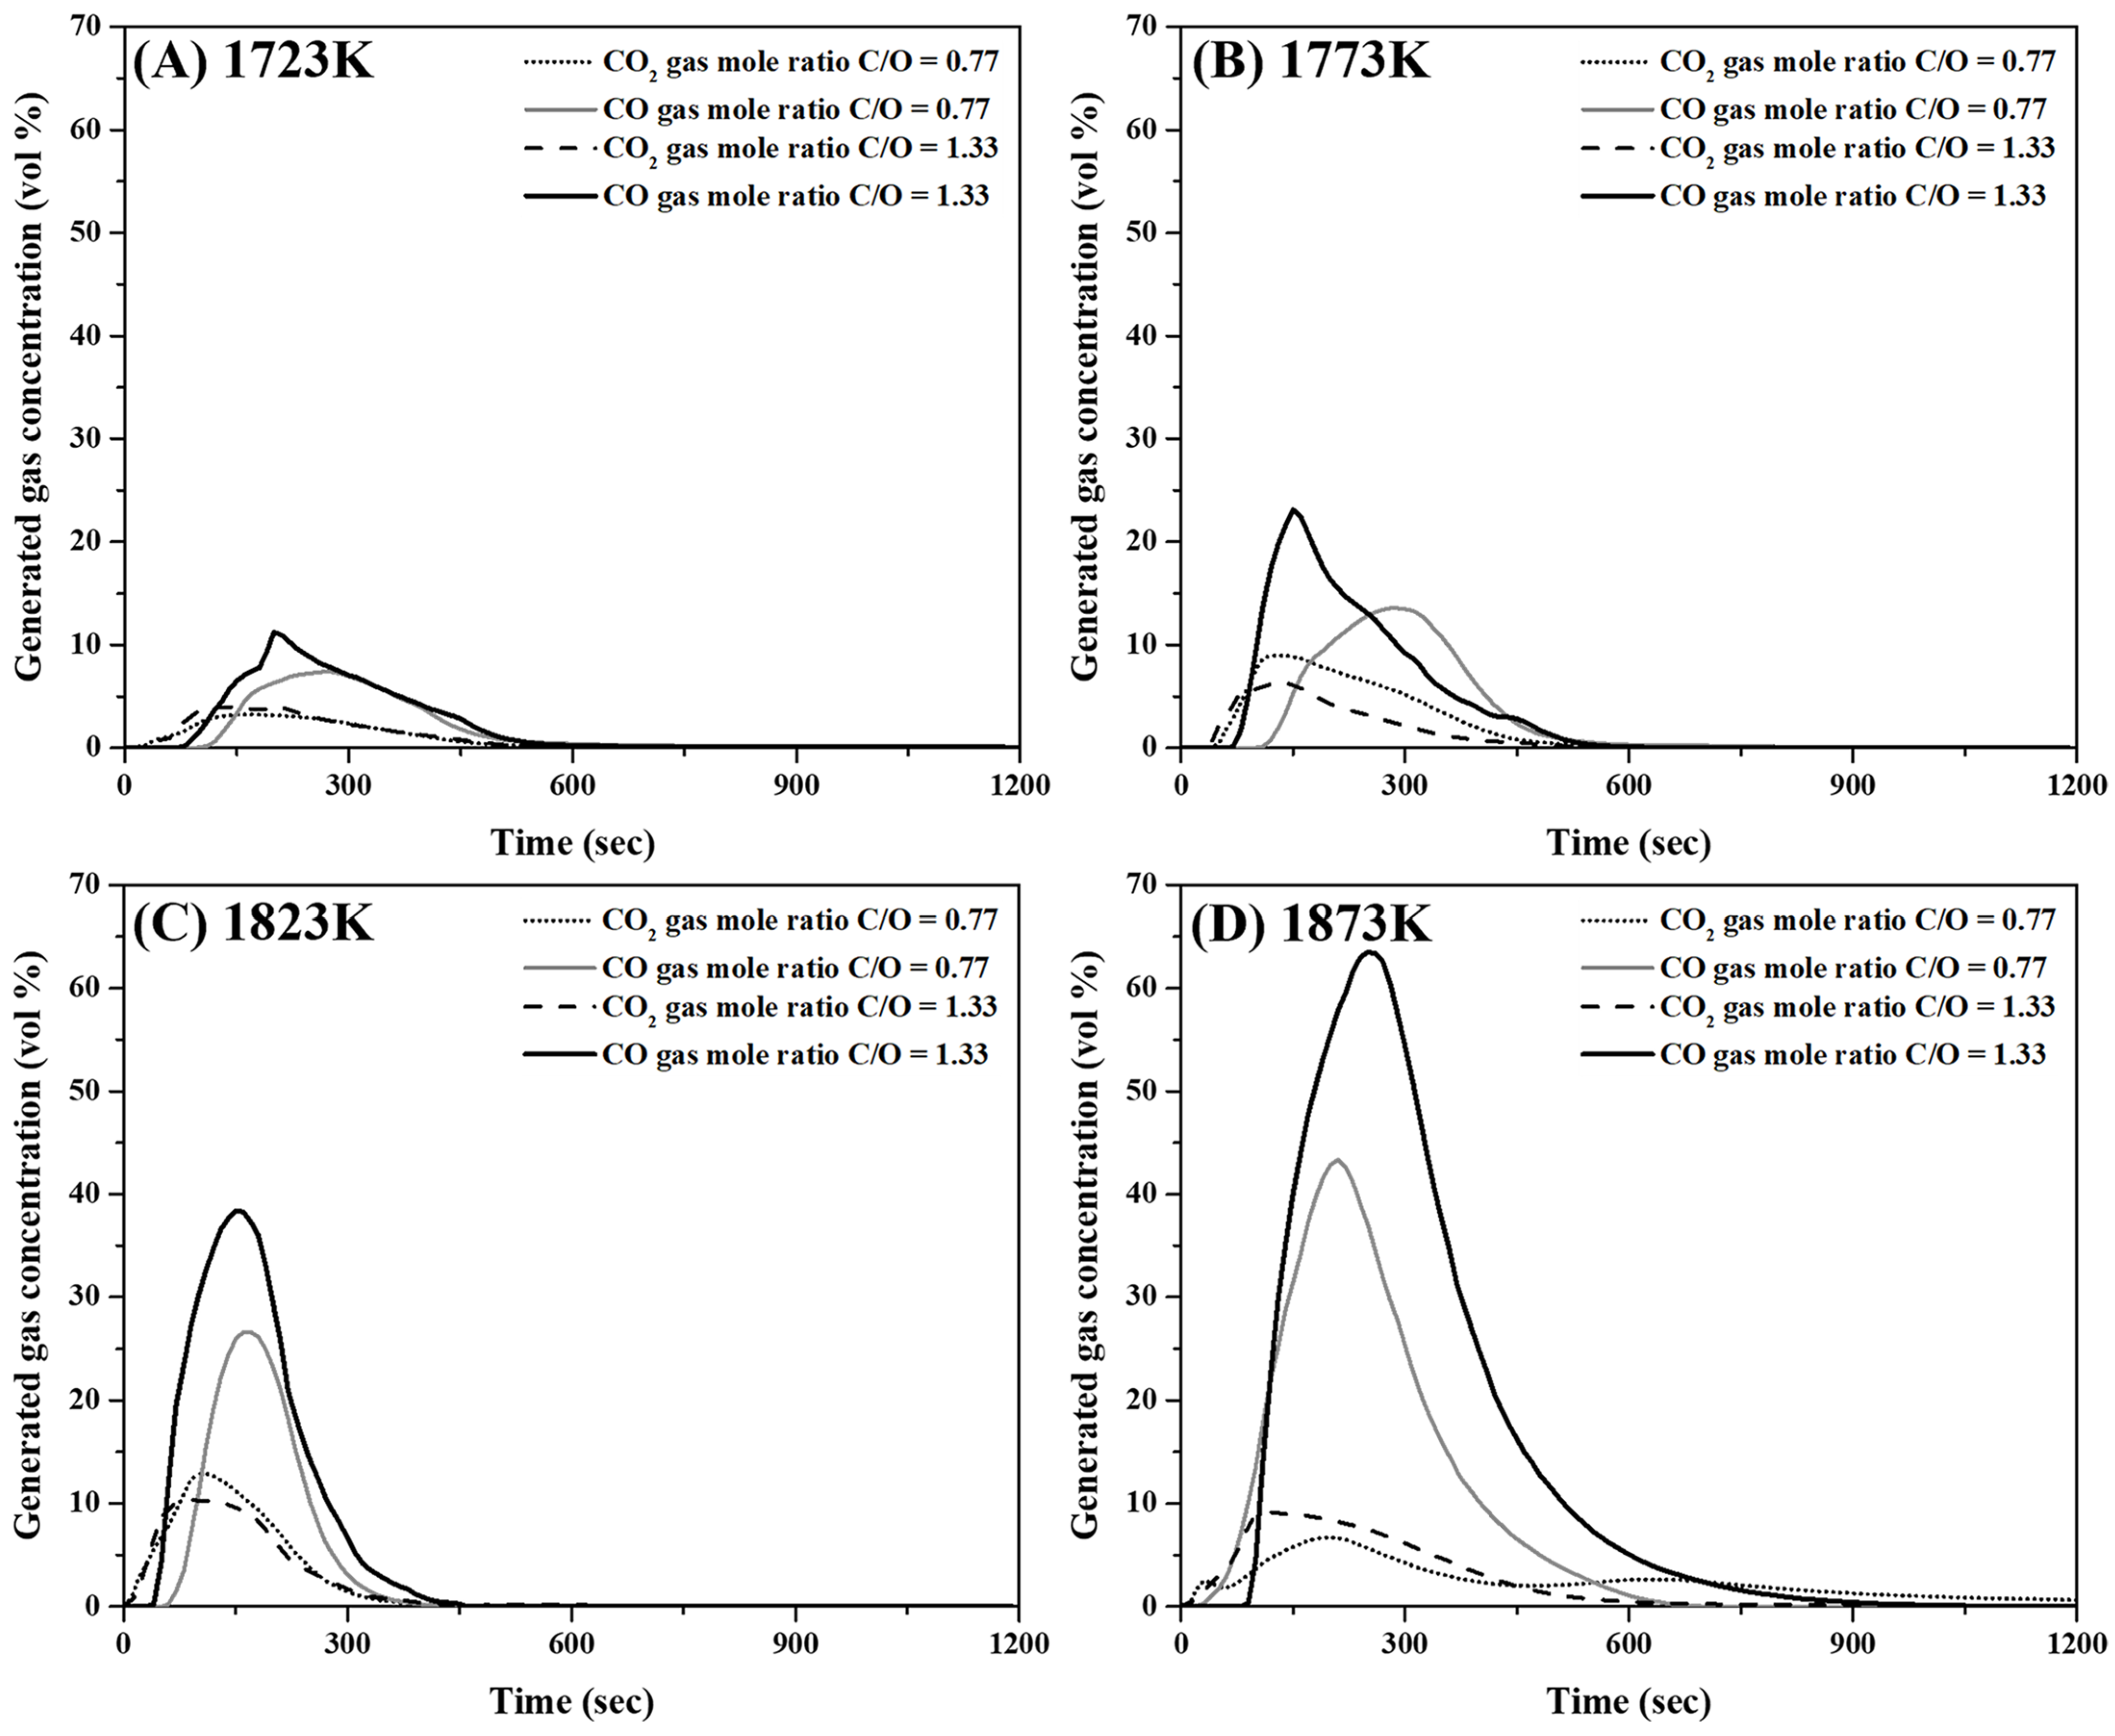
3.3. Concentration Variations of CO and CO2 in Released Gas During the Reduction Reaction at Various Temperatures

Figure 9A–D show the concentration variations of CO and CO2 in the released gas at 1723 K, 1773 K, 1823 K, and 1873 K, respectively. As shown in Figure 9, the variation in CO2 concentration between the two mixtures with different molar ratios was not significant. Moreover, the maximum CO gas generation increased with an increase in the C/O ratio and temperature.
The conditions for the reduction of the metal phase with slag separation are summarized in Table 6. In the present study, the reduced metal phases with slag separation were obtained at temperatures higher than 1823 and 1773 K when the molar ratios of C/O were 0.77 and 1.33, respectively. As shown in Figure 9, when the CO concentration in the released gas was high, a reduced metal phase was generated. The carbon and oxygen contents of the reduced metal phase are shown in Figure 10. These were less than approximately 0.02 and 0.20 wt%, respectively. When the C/O ratio and temperature were 0.77 and 1773 K, respectively, the oxygen content in the oxide phase without metal separation was approximately 21 wt%. This is shown in Figure 10. At the C/O ratio of 1.33, the O content in the metal phase decreased from 0.18 wt% to 0.02 wt% as the temperature increased from 1773 to 1823 K. This indicates that a reduced metal phase with low impurities from mill scale can be obtained by increasing the mixing ratio of pyrochar and the temperature.
Table 7 lists the composition of the oxide phases with slag basicity (the ratio of basic oxides (CaO and MgO) to acidic oxides (SiO2 and Al2O3)) under all the experimental conditions. As shown in Table 6, the oxide phases without the separation of the metal phase were obtained at temperatures below 1773 K and at 1723 K when the C/O ratios were 0.77 and 1.33, respectively. Figure 11 shows the FetO (The FetO is assumed to represent FeO contents calculated from Fe contents obtained by ICP-OES analysis), SiO2, and Al2O3 contents and slag basicity listed in Table 7. As shown in Figure 11A, the FetO content in the oxide phases decreased as the temperature and C/O ratio increased. Moreover, a significant decrease in FetO content was observed at 1823 K. At a C/O ratio of 1.33, the FetO content decreased from approximately 78 to 25 wt% as the temperature increased. However, at 1873 K, the FetO content at the C/O ratio of 0.77 was 58 wt% (higher than that at the C/O ratio of 1.33). Therefore, the FetO content could be reduced conveniently as the temperature and C/O ratio increased (Table 6).
Meanwhile, in Figure 11A, the slag basicity with a C/O ratio of 1.33 was marginally higher than that with a C/O ratio of 0.77. This was owing to the high CaO content in the pyrochar, although the slag basicity values were lower than unity. The lower slag basicities were caused by an increase in the Al2O3 content in the oxide phases with the increase in temperature. Meanwhile, the SiO2 content did not vary significantly, as shown in Figure 11B. Moreover, the Al2O3 content with a C/O ratio of 1.33 was higher than that with a C/O ratio of 0.77. This was owing to the high Al2O3 content in the pyrochar, as shown in Table 5. In general, the degree of reduction of FetO in slags with high slag basicities increases because the content of basic oxides such as CaO can improve the activity coefficients of FetO in slag [22]. Therefore, in the present study, the reduction degree of FetO in mill scale was regulated by varying the temperature and mixing ratio of pyrochar without controlling the slag basicity.

4. Discussion

Based on the results shown in Figure 9, the degree of reduction of mill scale can be obtained as follows. Equations (1) and (2) can be used to calculate the fluxes of CO and CO2 in the released gas.
J C O = 273 298 × F A r × p c t C O 22.4 × p c t A r × 1 A
J C O 2 = 273 298 × F A r × p c t C O 2 22.4 × p c t A r × 1 A
J O t i = J C O t i + ( J C O 2 t i ) / 2
In Equations (1) and (2), Ji, A, and FAr are the molar flux of i (mole-i/m2·s), reaction area (m2), and flow rate of Ar (m3/s). FAr was assumed to be 0.00017 m3/s based on the experimental conditions. A was assumed to be the reaction surface of mill scale. The reaction areas for the C/O ratios of 0.77 and 1.33 were 0.00209 and 0.00183 m2, respectively, and assumed to be spherical with a diameter of 500 μm.
Assuming that CO, CO2, and Ar gases behave ideally, the molar flux of oxygen reduced in the mill scale can be calculated using calculation of JCO, JCO2, and Equation (3). From this equation, the variations in the number of moles of oxygen and degree of reduction can be calculated using the following equations:
O t t = J O t i × A
R t i = i O t O i n i .
In Equations (4) and (5), ∆Ot, Oini., and Rti are the variations in oxygen mole (mol/s), the initial mole of oxygen in mill scales (mol), and the reduction degree (-), respectively.
Figure 12A,B show the influence of the temperature on the degree of reduction as a function of the reaction time when the molar ratio of C/O is 0.77 and 1.33, respectively. The degree of reduction remained constant after approximately 600 s and increased with an increase in the temperature. The maximum reduction degrees at a temperature of 1873 K were 0.32 and 0.65 for C/O ratios of 0.77 and 1.33, respectively. At a temperature of 1823 K, the maximum reduction degrees were 0.18 and 0.25 for C/O ratios of 0.77 and 1.33, respectively. Both reduction degree slope and maximum values of the reduction degree increased with increases in the C/O ratio and temperature. However, at temperatures below 1773 K, the difference in the degree of reduction owing to the C/O ratio was not significant. The reduction reaction rate constant was determined from the slope of the reduction degree over time, which showed an almost linear behavior.
The overall reaction system between the FeO in mill scale and the solid carbon in pyrochar is shown in Figure 13. The overall reaction between FeO and solid carbon is represented by Equation (6). It includes two chemical reaction steps and a mass-transfer step [23,24]. As shown in Figure 13, the overall reaction consisted of the reduction of FeO in the gas film (Equation (9)), the Boudouard reaction between the gas film and solid carbon in Equation (11), and the counter mass transfer in the gas film of CO and CO2 [25,26,27]. Equation (7) shows the reduction rate in Equation (6) using the overall reaction rate constant (kOV) and reaction area (A). In Equation (8), kOV is represented by the mass transfer coefficients of CO and CO2 in the gas film (kgas) and the rate constants for the two chemical reactions at the FeO/gas and gas/solid carbon interfaces (k7 and k8), respectively.
F e O l + C s = F e l + C O g
d m o l O t d t = k O V × A
1 k O V = 1 k 7 + 1 k g a s + 1 k 8
F e O s + C O g = F e s + C O 2 g
l n k 7 = 7321.6 T + 2.9275
C O 2 g + C s = 2 C O g
l n k 8 1 = 11700 T 0.4836
l n k 8 2 = 12833 T + 7.0031
The mass-transfer coefficients in the gas phase can be determined from Equation (14) [24]. In the case of the reaction between the gas phase and porous carbonaceous materials, the mass transfer coefficients were calculated using the effective diffusivity (De), carbon density (ρ), specific internal surface area (S), and intrinsic rate constant (ki) per unit of total pore surface area.
k g a s = D e ρ S k i R T
The gas counter mass transfer coefficient for solid carbonaceous materials (for the mass transfer of CO and CO2) has been reported to be in the range of 0.5 × 10⁻⁴–2.3 × 10⁻⁴ mol/cm2·s·atm at 1673 K [24]. Furthermore, CO-CO2 counter mass transfer is known to have a significantly low temperature dependence (with an activation energy of 8.37–12.55 kJ/mol) [23]. This indicates that the activation energy value of approximately 300 kJ/mol determined in this study is significantly different from that of CO-CO2 counter mass transfer. The previous mass-transfer coefficient in the gas phase is larger than the overall reaction rate constant calculated in this study (Figure 14). Therefore, it is assumed that the overall reaction in this study was controlled by chemical reaction steps rather than by mass transfer steps.
Figure 14 compares each chemical reaction rate with the reaction rate constants used in this study. The rate constants of the overall reaction for the C/O mole ratios of 0.77 and 1.33 were obtained by integrating Equation (7) using the slopes in Figure 12. In Equation (7), A is considered as a reaction surface on mill scale. It was assumed to be 0.00209 and 0.00183 m2 for the C/O mole ratios of 0.77 and 1.33, respectively (Figure 12). To obtain the relationship between the reaction rate constants and the temperature, the slope of the linear section of the reduction degree curve was used (Figure 12). The relationship between the temperature and rate constants was determined as follows:
l n k O V 1 = 36691 T + 1.8662 ,                   f o r   ( C / O = 0.77 )
l n k O V 2 = 38166 T + 2.1572 ,                 f o r   ( C / O = 1.33 )
The rate constants determined from Equation (10) are based on the work of Chen et al. [25]. They investigated the reduction of iron ores using CO gas in a micro fluidized bed reactor at temperatures ranging from 973 to 1123 K. The reduction degree of iron ore particles with sizes of 100–150 μm was obtained by analyzing the gas compositions of CO2 and CO in the released gas. The activation energy for reducing FexO to Fe is approximately 60.9 kJ/mol. Furthermore, by extrapolating Equation (10), the reaction rate constant determined at 1773 K was 500 times higher than the overall reaction rate constants obtained in this study. This indicates that the reaction-limiting step of the overall process in this study could not be determined using Equation (9).
In Figure 14, the reaction rate constants derived from Equations (12) and (13) are based on Sain and Belton [26] and Frank and Kamenetski [27], respectively. By using Equation (12), the rate constants for the decarburization of liquid iron by CO2 gas were obtained. It was concluded that the reaction was controlled by the adsorption and dissociation of CO2 gas. Equation (13) represents the rate constant of the Boudouard reaction. It is determined using carbon electrodes. Both the reaction rate constants are higher than those obtained in the present study. With these values, it was infeasible to determine the mill scale reduction reaction rate stage using pyrochar.
Figure 15 compares the results of the present study with previous rate constants obtained under various conditions [23,28,29]. To verify similar reaction rates, we extrapolated previously reported data and compared these with the reaction rate constants derived in this study. Lee et al. [23] investigated the reduction of FeO in slag under carbon-saturated conditions. The rate constants for the reduction of liquid iron oxide by dissolved carbon in carbon-saturated molten iron were determined at temperatures ranging from 1673 to 1823 K. In Figure 15, the rate constants of the overall reaction are represented as “FeO + C = Fe + CO”. Under the conditions of carbon saturation and a high carbon content in molten iron, reaction rate constants higher than those in this study were reported.
Sato et al. [28] measured the reaction rate of the reduction of liquid iron oxide using solid carbon in Al2O3 and steel crucibles. In Figure 15, the rate constants of the overall reaction are represented as “FeO + C = Fe + CO”. The reduction rates were calculated from the amount of CO gas generated during the reduction reaction of liquid iron oxide. In addition, they observed that the rate constants of the reduction of liquid iron oxide using carbon in molten iron were higher than those obtained using solid carbon. The reaction rate constants under carbon-saturated conditions reported in previous research [23,28] were higher than those determined in this study.
Meanwhile, Min et al. [29] investigated the kinetic behavior of FeO reduction in slag using solid carbon. The rate-determining step was determined based on the FeO concentration of the slag. When the FeO content was less than 5 wt%, the mass transfer of FeO in the slag was the rate-limiting step. When the FeO content was above approximately 30 wt%, the rate-limiting step could be determined by the chemical reaction at the interface of the gas and solid carbon (Boudouard reaction). This was because the FeO mass transfer in the slag increased with the agitation effects of gas evolution. When the FeO content ranged from 5 to 30 wt%, the rate-limiting step was a mixed mechanism involving both mass transfer of FeO and Boudouard reaction. As shown in Figure 15, the reaction rate constants determined under low-FeO-content conditions were lower than those obtained in this study. The activation energy of the reaction was measured to be 253.55 kJ/mol for 10 wt% FeO in the slag. This indicates that the rate-limiting step in the present study was similar to that of the reduction reaction under low-FeO-content conditions.
Considering the activation energy obtained from the Arrhenius equation using Equations (15) and (16), the difference in activation energy with varying amounts of added pyrochar was not significant (approximately 305.06–317.31 kJ/mol). In this study, as the initial carbon concentration increased, the rate constants increased. Furthermore, the frequency factor (intercept) of both the equations increased as the molar ratio of fixed carbon to oxygen in iron oxide increased. In general, a large amount of CO gas can be generated with a sufficient molar ratio of fixed carbon and oxygen in Fe oxide. The agitation effects are governed by gas evolution [29].
However, as shown in Figure 9, the generation of CO gas decreased for approximately 600 s owing to the complete consumption of fixed carbon by the incomplete reduction reaction of FeO in the mill-scale. As shown in Figure 12, the maximum reduction degree at 1873 K was at most 0.65, when the FexO content was 28.63 wt% in the separated slag phase (Table 7). This indicates that the FeO content in the slag phase was sufficient for the reduction reaction between mill scale and pyrochar. Therefore, in this study, the rate-determining step was assumed to be the insufficient agitation effect owing to the limited gas evolution of CO and CO2 caused by the low amounts of gases released during reduction resulting from the low initial carbon concentration.

5. Conclusions

To clarify the use of the pyrochar produced by the pyrolysis of waste polymers as an alternative carbon source, the reduction behaviors of mill scale with varying pyrochar mixing ratios were investigated at temperatures from 1723 to 1873 K. Moreover, the reduction degrees of mill scale were calculated by measuring the amounts of CO and CO2 gases generated during the reduction reaction. The following results were obtained:
  • The carbon content of pyrochar was similar to that of typical coal ores (~56%). However, the volatile matter and moisture content were lower than those of coal ore.
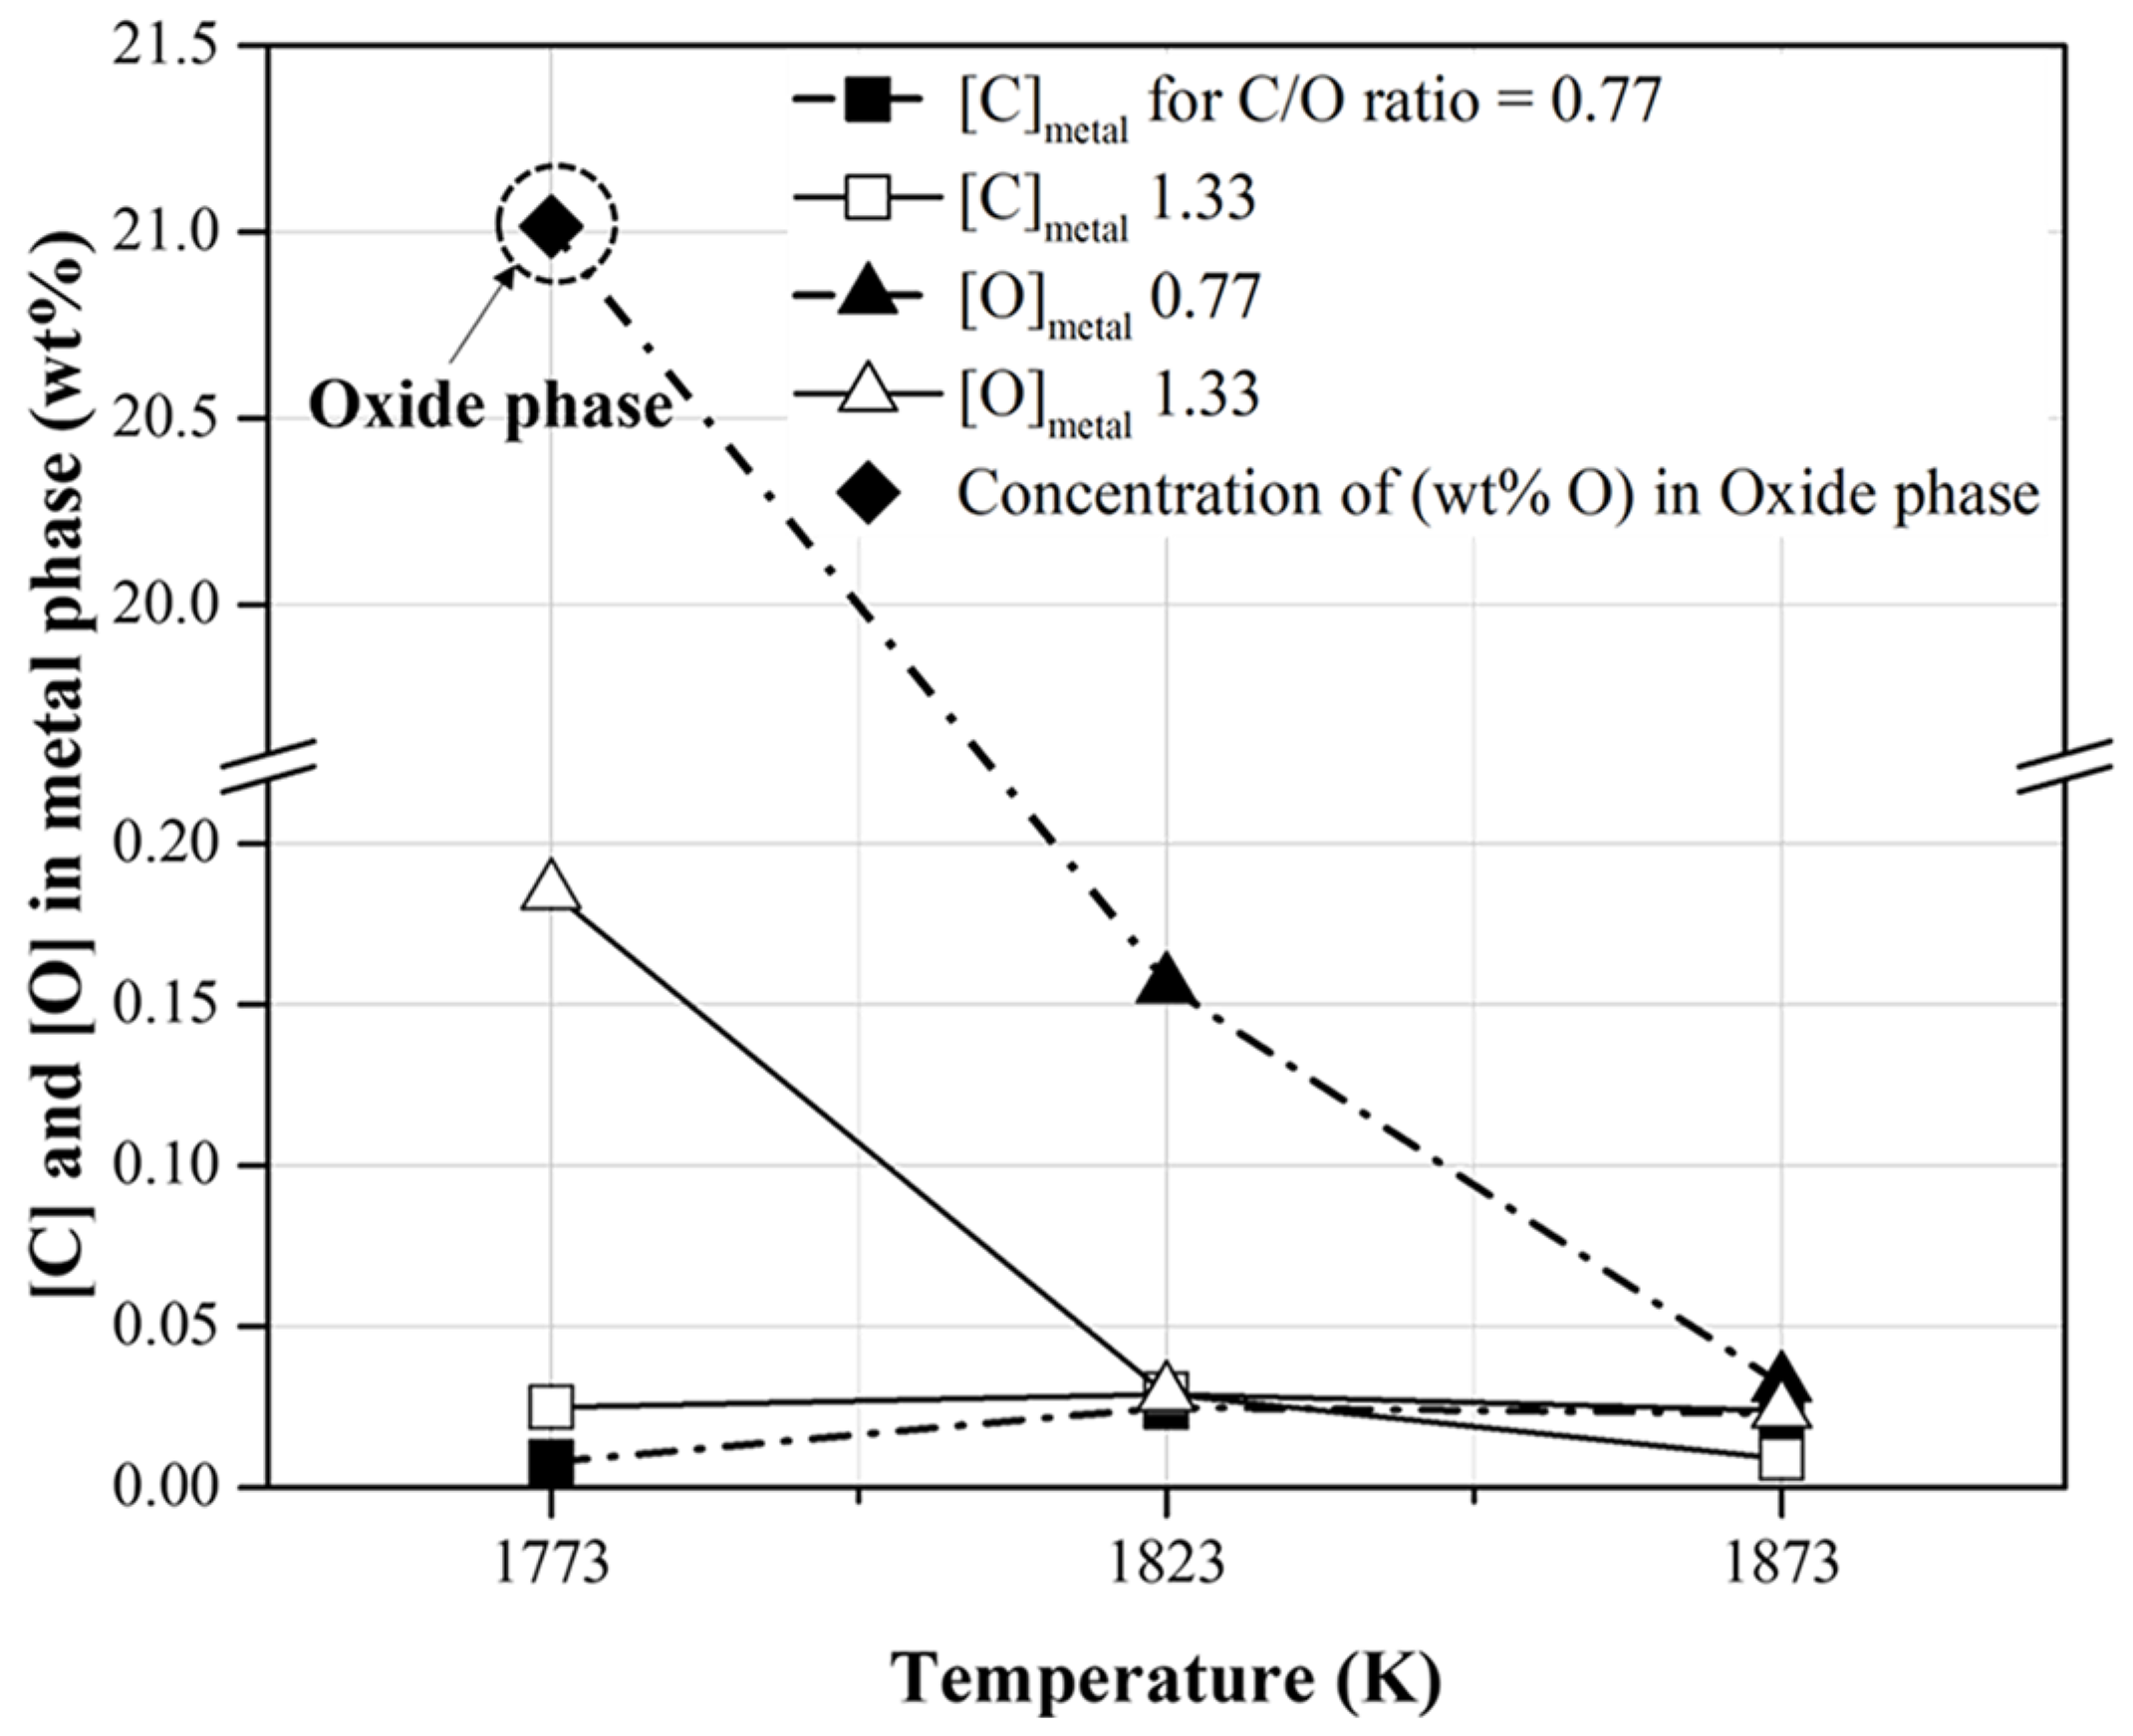
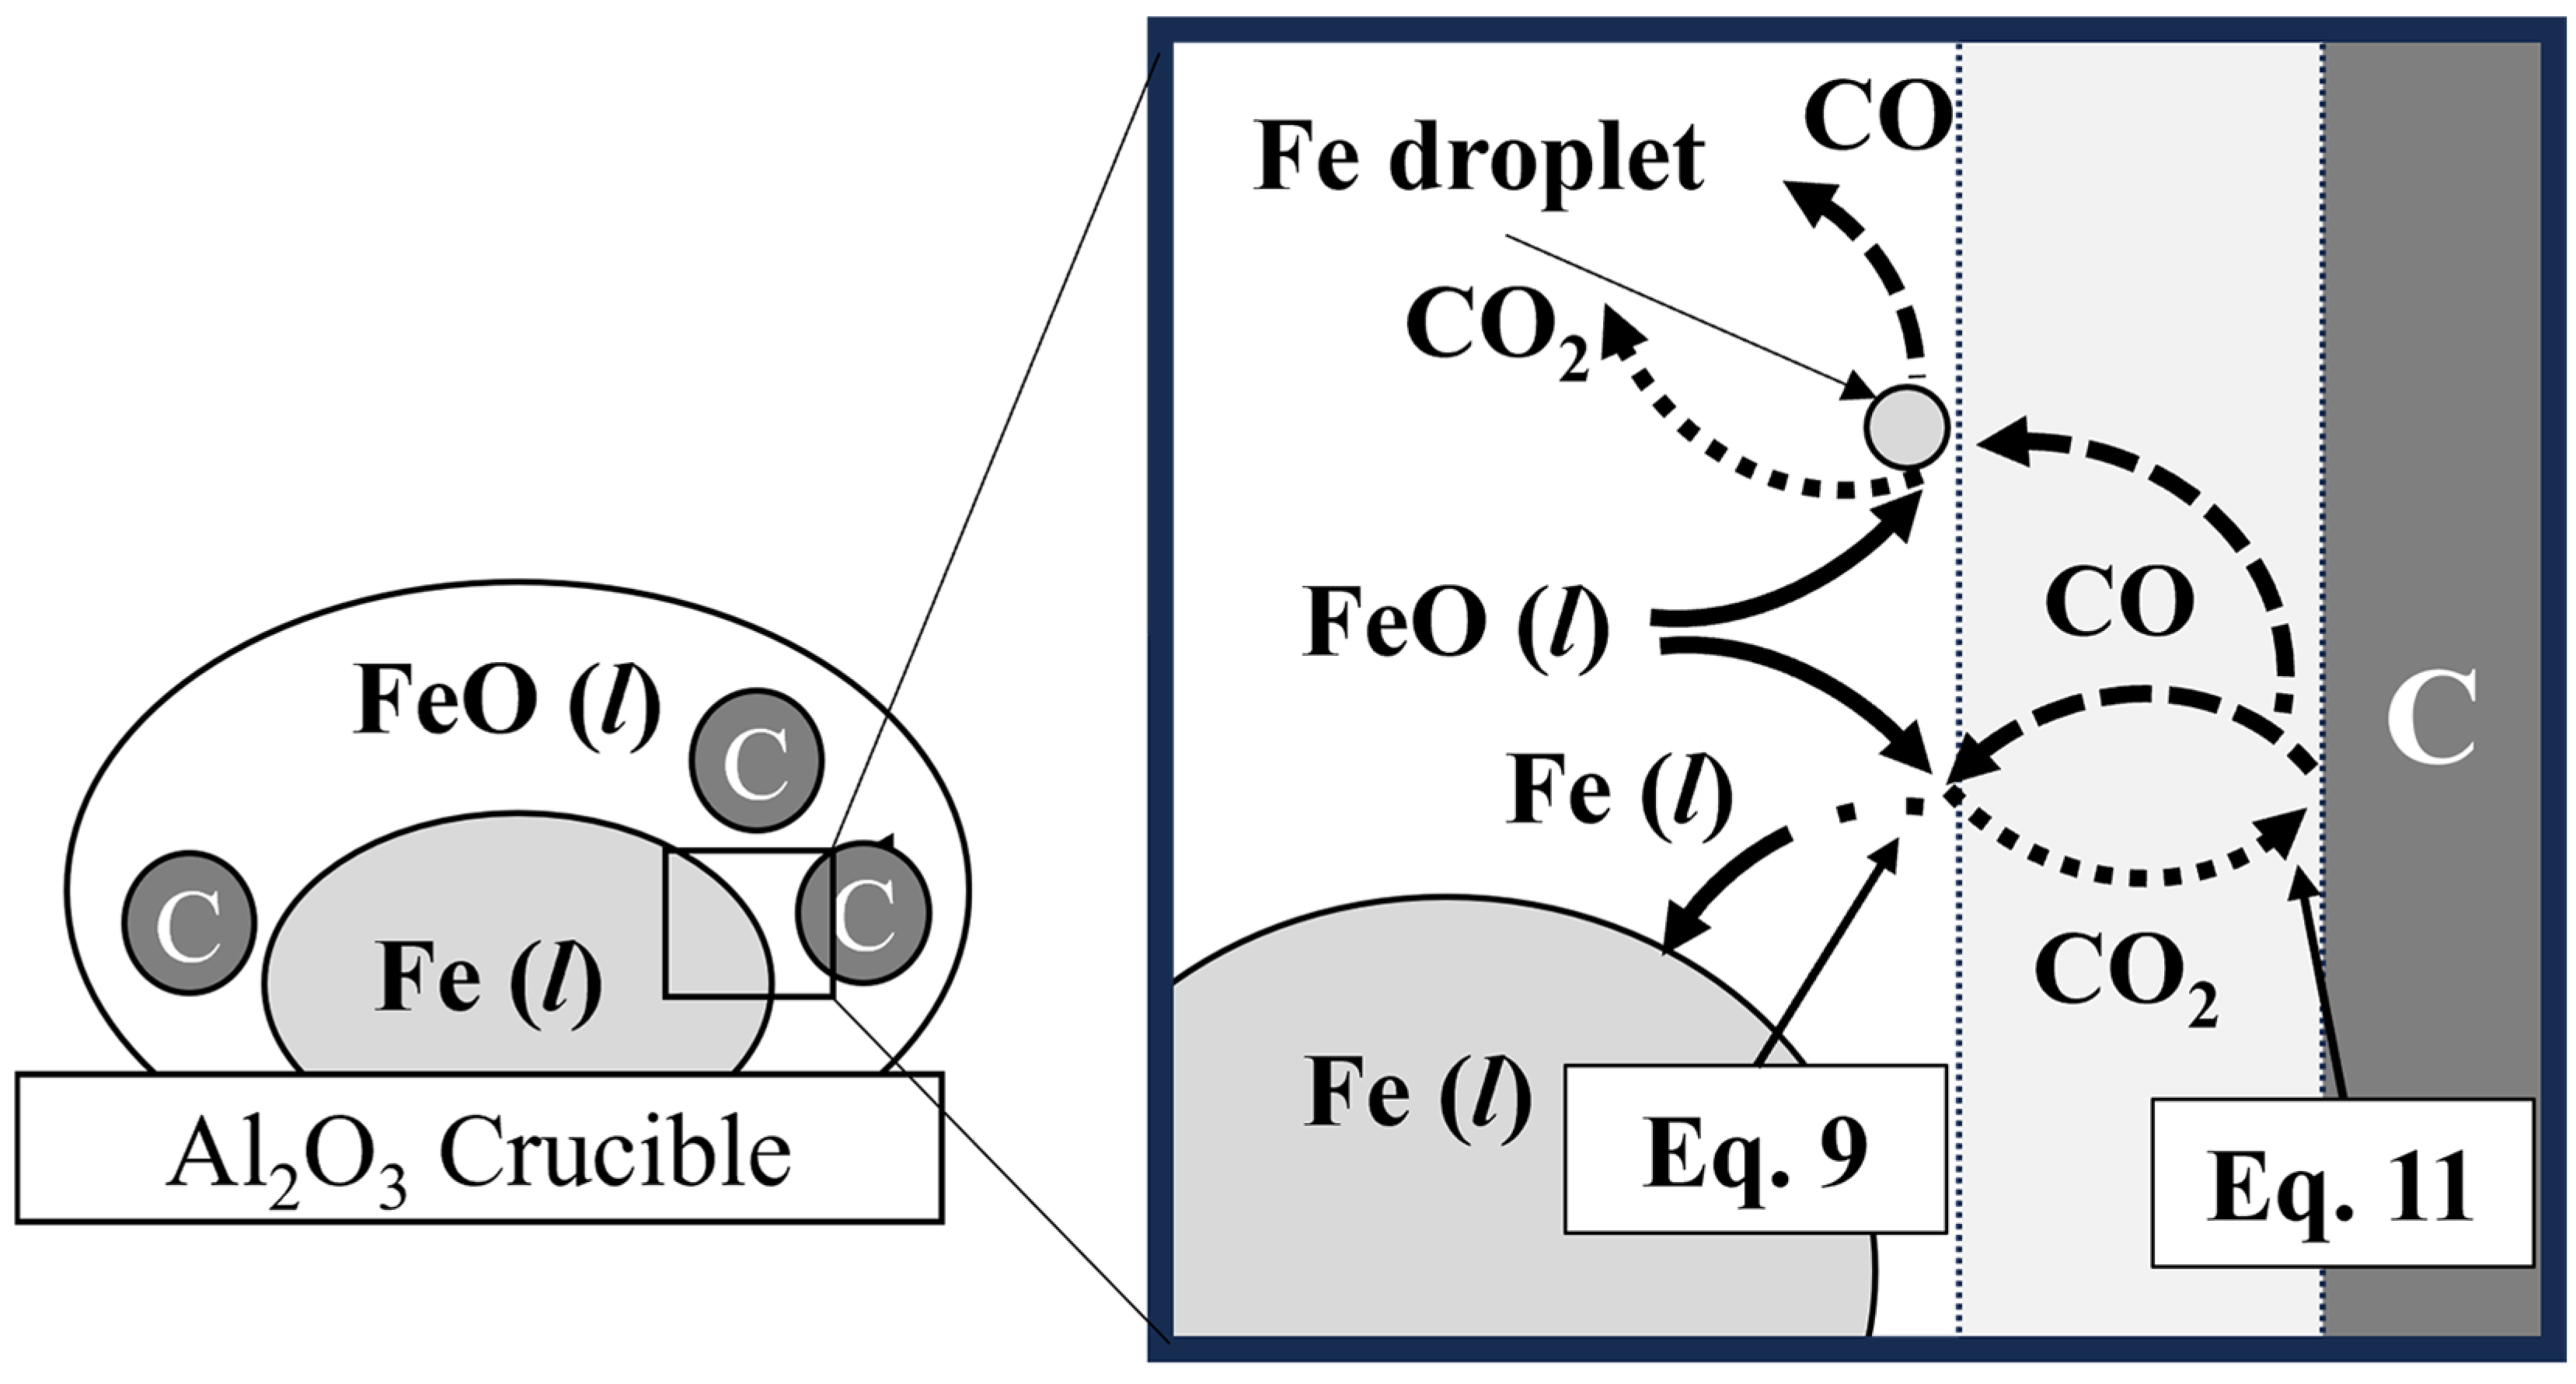
  • When the concentration of CO in the generated gas decreased after attaining the local maximum point owing to the reduction reaction of mill scale with pyrochar at 1823 K, the metal phase was observed in the collected sample. The reduced metal phases with slag separation were obtained at temperatures higher than 1823 and 1773 K when the molar ratio of C/O was 0.77 and 1.33, respectively. The C and O contents of the reduced metal phase were less than approximately 0.02 and 0.20 wt%, respectively.
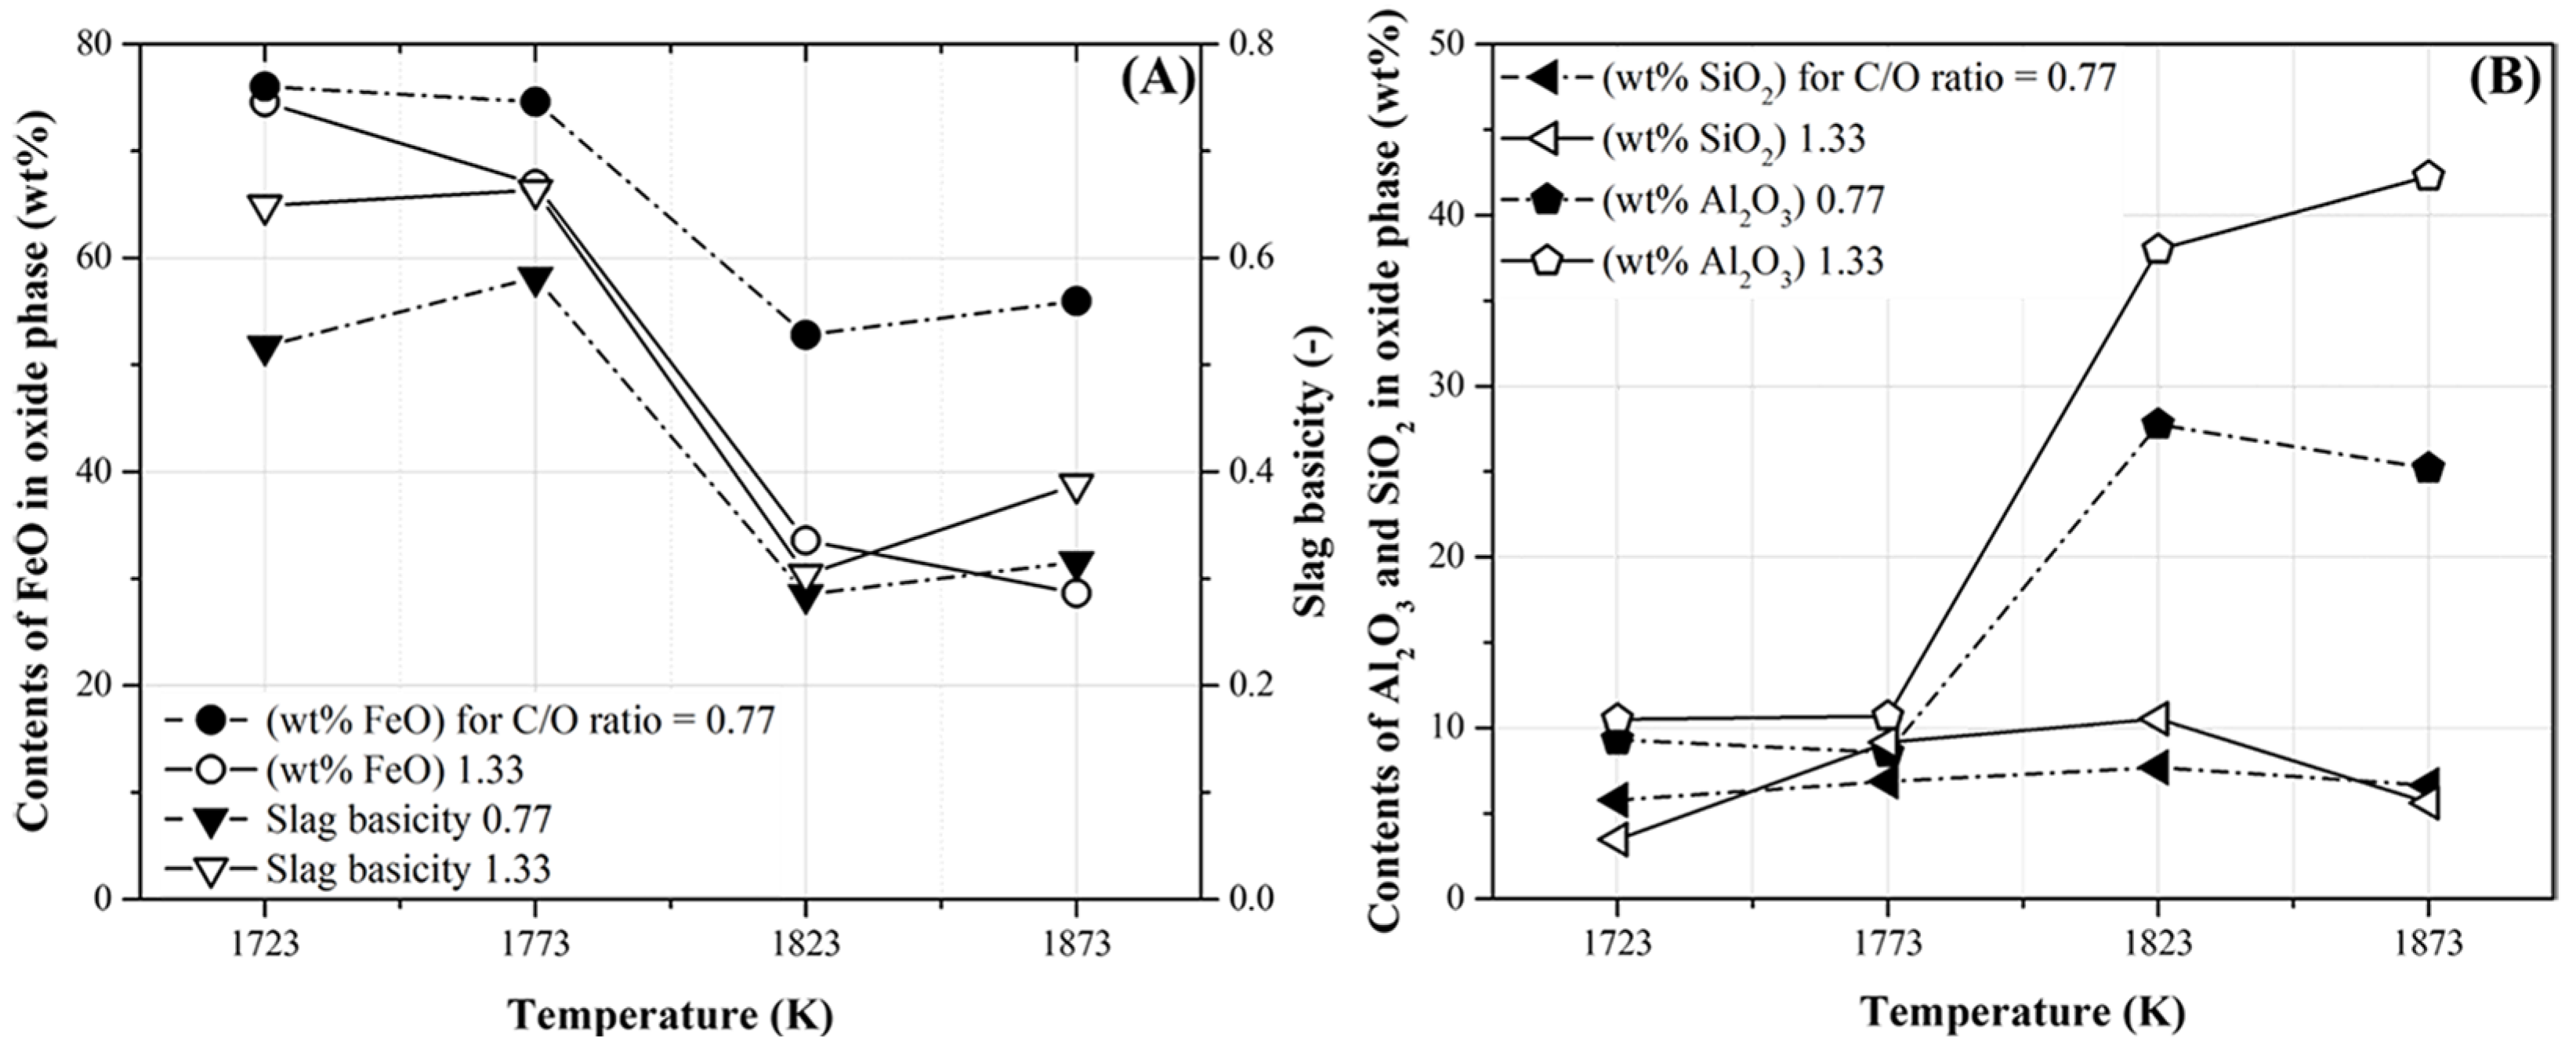
  • The degree of reduction of FetO in mill scale was regulated by varying the temperature and the mixing ratio of pyrochar without controlling the slag basicity. The content of Al2O3 in the slag separated from the metal phase increased with an increase in the mixing ratio of the pyrochar.
  • The CO concentration in the released gas and the degree of reduction increased as both temperature and molar ratio of C/O increased. After approximately 600 s, the degree of reduction remained constant. The maximum reduction degrees at a temperature of 1873 K were 0.32 and 0.65 for C/O ratios of 0.77 and 1.33, respectively.
In the present study, the rate-determining step was assumed to be the limited gas evolution of CO and CO2 during the reduction reaction (caused by insufficient agitation owing to the low initial carbon concentration). Furthermore, the reduction degree of iron oxides in the mill scale was not higher because the FeO content in the slag phase was high compared with previous results under carbon-saturated conditions. To improve the reduction degree of mill scale, the influence of the mixing ratio and slag basicity on the agitation effects by gas evolution during the reduction reaction between mill scale and pyrochar would be investigated in the near future.

Author Contributions

Conceptualization, Y.-W.K. and S.-J.K.; validation, Y.-W.K. and S.-J.K.; investigation, Y.-W.K. and S.-J.K.; data curation, Y.-W.K.; writing—original draft preparation, Y.-W.K.; writing—review and editing, Y.-W.K. and S.-J.K.; visualization, Y.-W.K.; supervision, S.-J.K.; project administration, S.-J.K.; funding acquisition, S.-J.K. All authors have read and agreed to the published version of the manuscript.

Funding

This research was funded by the Korea Institute of Energy Technology Evaluation and Planning and the Ministry of Trade, Industry, and Energy of the Republic of Korea, grant number 20212010100060.

Data Availability Statement

The original contributions presented in this study are included in the article. Further inquiries can be directed to the corresponding authors.

Conflicts of Interest

The authors declare no conflicts of interest.

References

  1. World Steel Association. Scrap Use in the Steel Industry. Facts Sheet. Available online: https://worldsteel.org/publications/fact-sheets/ (accessed on 15 March 2024).
  2. Xylia, M.; Silveira, S.; Duerinck, J.; Meinke-Hubeny, F. Weighing regional scrap availability in global pathways for steel production processes. Energy Effic. 2018, 11, 1135–1159. [Google Scholar] [CrossRef]
  3. Bagatini, M.C.; Zymla, V.; Osório, E.; Vilela, A.C.F. Characterization and reduction behavior of mill scale. ISIJ Int. 2011, 51, 1072–1079. [Google Scholar] [CrossRef]
  4. Martín, M.I.; López, F.A.; Torralba, J.M. Production of sponge iron powder by reduction of rolling mill scale. Ironmak. Steelmak. 2012, 39, 155–162. [Google Scholar] [CrossRef]
  5. Sen, R.; Dehiya, S.; Pandel, U.; Banerjee, M.K. Utilization of low grade coal for direct reduction of mill scale to obtain sponge iron: Effect of reduction time and particle size. Procedia Earth Planet. Sci. 2015, 11, 8–14. [Google Scholar] [CrossRef]
  6. El-Hussiny, N.A.; Abdul-Wahab, H.H.; Ali, M.M.; Omar AL, A.M.; Shalabi, M.E.M.H.; Moharm, M.R. Effect of grinding time of mill scale on the physicochemical properties of produced briquettes and its reduction via hydrogen. Open Access Libr. J. 2014, 1, 1–10. [Google Scholar] [CrossRef]
  7. Sista, K.S.; Dwarapudi, S.; Nerune, V.P. Direct reduction recycling of mill scale through iron powder synthesis. ISIJ Int. 2019, 59, 787–794. [Google Scholar] [CrossRef]
  8. Park, J.W.; Ahn, J.C.; Song, H.; Park, K.; Shin, H.; Ahn, J.S. Reduction characteristics of oily hot rolling mill sludge by direct reduced iron method. Resour. Conserv. Recycl. 2002, 34, 129–140. [Google Scholar] [CrossRef]
  9. Wagner, D.; Devisme, O.; Patisson, F.; Ablitzer, D. A laboratory study of the reduction of iron oxides by hydrogen. arXiv 2008, arXiv:0803.2831. [Google Scholar]
  10. El-Hussiny, N.A.; Shalabi, M.E.H. A self-reduced intermediate product from iron and steel plants waste materials using a briquetting process. Powder Technol. 2011, 205, 217–223. [Google Scholar] [CrossRef]
  11. Sahajwalla, V.; Rahman, M.; Hong, L.; Saha-Chaudhury, N.; Spencer, D. Influence of carbonaceous materials on slag foaming behavior during eaf steelmaking. Iron Steel Technol. 2006, 3, 54. [Google Scholar]
  12. Ubando, A.T.; Chen, W.H.; Ong, H.C. Iron oxide reduction by graphite and torrefied biomass analyzed by TG-FTIR for mitigating CO2 emissions. Energy 2019, 180, 968–977. [Google Scholar] [CrossRef]
  13. Yunos, N.F.M.; Zaharia, M.; Ismail, A.N.; Idris, M.A. Transforming waste materials as resources for EAF steelmaking. Int. J. Mater. Eng 2014, 4, 167–170. [Google Scholar]
  14. Dankwah, J.R.; Koshy, P.; Saha-Chaudhury, N.M.; O’Kane, P.; Skidmore, C.; Knights, D.; Sahajwalla, V. Reduction of FeO in EAF steelmaking slag by metallurgical coke and waste plastics blends. ISIJ Int. 2011, 51, 498–507. [Google Scholar] [CrossRef]
  15. IRENA. International Renewable Energy Agency. Abu Dhabi. 2020. Available online: https://www.irena.org/Energy-Transition/Policy (accessed on 17 February 2024).
  16. Methanol Institute, MMSA (Methanol Market Services Asia). Methanol Price and Supply/Demand. Methanol Institute. 2024. Available online: https://www.methanol.org/methanol-price-supply-demand/ (accessed on 20 September 2024).
  17. Czajczyńska, D.; Anguilano, L.; Ghazal, H.; Krzyżyńska, R.; Reynolds, A.J.; Spencer, N.; Jouhara, H. Potential of pyrolysis processes in the waste management sector. Therm. Sci. Eng. Prog. 2017, 3, 171–197. [Google Scholar] [CrossRef]
  18. Lewandowski, W.M.; Januszewicz, K.; Kosakowski, W. Efficiency and proportions of waste tyre pyrolysis products depending on the reactor type—A review. J. Anal. Appl. Pyrolysis 2019, 140, 25–53. [Google Scholar] [CrossRef]
  19. Okoye, C.O.; Jones, I.; Zhu, M.; Zhang, Z.; Zhang, D. Manufacturing of carbon black from spent tyre pyrolysis oil–A literature review. J. Clean. Prod. 2021, 279, 123336. [Google Scholar] [CrossRef]
  20. Zhong, R.; Xu, J.; Hui, D.; Bhosale, S.S.; Hong, R. Pyrolytic preparation and modification of carbon black recovered from waste tyres. Waste Manag. Res. 2020, 38, 35–43. [Google Scholar] [CrossRef] [PubMed]
  21. Mohanty, M.K.; Mishra, S.; Mishra, B.; Sarkar, S. Effect of basicity on the reduction behavior of iron ore pellets. Arab. J. Sci. Eng. 2018, 43, 5989–5998. [Google Scholar] [CrossRef]
  22. Jung, S.M.; Min, D.J. The effect of FetO content on MgO solubilities in lime-based slags. ISIJ Int. 2010, 50, 1632–1636. [Google Scholar] [CrossRef]
  23. Lee, J.C.; Min, D.J.; Kim, S.S. Reaction mechanism on the smelting reduction of iron ore by solid carbon. Metall. Mater. Trans. B 1997, 28, 1019–1028. [Google Scholar] [CrossRef]
  24. Story, S.R.; Sarma, B.; Fruehan, R.J.; Cramb, A.W.; Belton, G.R. Reduction of FeO in smelting slags by solid carbon: Re-examination of the influence of the gas-carbon reaction. Metall. Mater. Trans. B 1998, 29, 929–932. [Google Scholar] [CrossRef]
  25. Chen, H.; Zheng, Z.; Shi, W. Investigation on the kinetics of iron ore fines reduction by CO in a micro-fluidized bed. Procedia Eng. 2015, 102, 1726–1735. [Google Scholar] [CrossRef]
  26. Sain, D.R.; Belton, G.R. Interfacial reaction kinetics in the decarburization of liquid iron by carbon dioxide. Metall. Trans. B 1976, 7, 235–244. [Google Scholar] [CrossRef]
  27. Frank-Kamenetski, D.A. Diffusion and Heat Exchange in Chemical Kinetics; Princeton University: Princeton, NJ, USA, 1955; p. 59. [Google Scholar]
  28. Sato, A.; Aragane, G.; Kamihira, K.; Yoshimatsu, S. Reducing rates of molten iron oxide by solid carbon or carbon in molten iron. Trans. Iron Steel Inst. Jpn. 1987, 27, 789–796. [Google Scholar] [CrossRef]
  29. Min, D.J.; Han, J.W.; Chung, W.S. A study of the reduction rate of FeO in slag by solid carbon. Metall. Mater. Trans. B 1999, 30, 215–221. [Google Scholar] [CrossRef]
Figure 1. Schematic diagram of experimental set-up.
Energies 18 01122 g001
Figure 2. Mineralogical image of mill scales observed using SEM.
Energies 18 01122 g002
Figure 3. Quantitative phase analysis of various iron oxides of mill scale by using XRD with Rietveld analysis.
Energies 18 01122 g003
Figure 4. Mineralogical image of the pyrochar obtained by using SEM-EDS (A) 300× SEM image and (B) 2000× SEM image.
Energies 18 01122 g004
Figure 5. Phase analysis of the ash obtained by heating pyrochar at 1273 K for 6 h, using XRD.
Energies 18 01122 g005
Figure 6. Concentration variations of CO and CO2 in the released gas as a function of holding time at 1823 K.
Energies 18 01122 g006
Figure 7. Photographs of the reduced sample after reaction at 1823 K (A) A point, (B) B point, and (C) C point.
Energies 18 01122 g007
Figure 8. Phase analysis of sample obtained at A point at 1823 K.
Energies 18 01122 g008
Figure 9. Analysis of gases released during reduction reaction of mixtures comprising mill scale and pyrochar. (A) 1723 K, (B) 1773 K, (C) 1823 K, and (D) 1873 K.
Energies 18 01122 g009
Figure 10. Contents of carbon and oxygen in the reduced metal phase obtained at the conditions described in Table 6.
Energies 18 01122 g010
Figure 11. Contents of FetO, SiO2, and Al2O3 in oxide phase and slag basicity obtained at the conditions presented in Table 7. (A) The FetO content in the oxide phase and slag basicity and (B) SiO2 and Al2O3 in the oxide phase.
Energies 18 01122 g011
Figure 12. Variation in reduction degree according to reaction time (A) molar ratio of C/O 0.77 sample and (B) molar ratio of C/O 1.33 sample.
Energies 18 01122 g012
Figure 13. Schematic diagram of the reduction of FeO by solid carbon.
Energies 18 01122 g013
Figure 14. Comparison of the overall rate constants obtained from Equations (15) and (16) with the previous rate constants of the Boudouard reaction [26,27].
Energies 18 01122 g014
Figure 15. Comparison of rate constants in the present study with the previous rate constants obtained from the reduction reaction of molten iron oxide under carbon-saturated conditions [23,28,29].
Energies 18 01122 g015
Table 1. Conditions for the reaction temperatures and the mixing ratios and the molar ratios of mill scale and pyrochar.
Run NO.Temp. (K)Mixing Ratio of Mass (Wt%)Molar Ratio of
Fixed Carbon (FC)/
Oxygen in Mill Scale
Mill ScalePyrochar
A172380200.77
B70301.33
C177380200.77
D70301.33
E182380200.77
F70301.33
G187380200.77
H70301.33
Table 2. Chemical compositions of mill scale using ICP and O/N analysis (unit: wt%).
ElementsT.FeT.OSiO2CaOMnOMgOAl2O3
Conc.66.624.34.53.21.60.20.9
Table 3. Composition of pyrochar (unit: wt%).
MethodProximate AnalysisUltimate Analysis
ContentsMoistureVolatileAshFixed
carbon
CarbonSulfur
Conc.1.06.935.556.554.30.1
Table 4. Phase compositions of pyrochar using SEM-EDS analysis (unit: wt%).
ElementsCOCaTiSiAlNaCl
No.152.710.116.013.61.51.21.43.5
No.297.8-1.0----1.2
Table 5. Composition of the ash obtained by heating pyrochar at 1273 K for 6 h, using XRF analysis (unit: wt%).
ContentsCaOAl2O3TiO2SiO2FeOMgO
Conc.31.929.217.010.44.71.6
Table 6. Conditions of the reduced metal phase with slag separation.
C/O Ratio1723177318231873
0.77XXOO
1.33XOOO
Table 7. Compositions of the oxide phase with slag basicity under all the experimental conditions.
Temp. (K)C/O RatioSlag Composition (wt%)Slag Basicity
(C + M)/(S + A)
FetOCaOSiO2Al2O3MgOTiO2
17230.7776.017.795.779.290.660.480.52
177374.608.976.868.560.500.510.58
182352.7810.107.6827.750.780.920.29
187355.9610.046.6325.191.101.090.32
17231.3374.549.063.4610.501.111.340.65
177366.9113.169.1610.680.900.980.66
182333.5714.7410.5237.991.461.710.30
187328.6318.585.6242.272.212.690.39
Disclaimer/Publisher’s Note: The statements, opinions and data contained in all publications are solely those of the individual author(s) and contributor(s) and not of MDPI and/or the editor(s). MDPI and/or the editor(s) disclaim responsibility for any injury to people or property resulting from any ideas, methods, instructions or products referred to in the content.

