Abstract
The data derived from Local Climate Zone (LCZ) field measurements can contribute to the construction of regional climate datasets with urban heat island (UHI) effects and accurately present urban heat island intensity (UHII) characteristics in different areas, thereby improving the accuracy of building energy consumption simulations. This study focuses on Shenyang, a severe cold-region city, as the research area. By mapping the LCZs in the central city of Shenyang and selecting eight different types of LCZ plots for field temperature measurement, the UHI effect of various LCZs in Shenyang was analyzed. Air temperature and UHII were used to evaluate the UHII characteristics of LCZs under typical meteorological conditions. Additionally, this study investigated the temperature dynamics and heating/cooling rates of each LCZ under typical meteorological days. The results reveal significant differences in UHII characteristics among LCZ types, closely related to their surface structure and land cover characteristics. These findings further validate the effectiveness of the LCZ classification method in severe cold regions. The data obtained in this study can be used as high-precision climate model parameters for urban energy consumption models and building energy efficiency models, thus making simulation results more consistent with local characteristics and enabling more accurate energy consumption predictions.
1. Introduction
Energy is the fundamental material basis that supports human activities, with buildings and the construction industry accounting for over 34% of global energy demand, making building energy consumption a major component of global energy use [1]. Building energy consumption is influenced by multiple factors, including environmental temperature, building performance, and human activities, with its impact characteristics and extent depending on the specific climate conditions of a region [2]. The urban heat island (UHI) effect, which is closely related to regional climate types, is a significant phenomenon that reflects climate change during urbanization. It refers to the phenomenon where the temperature in urban centers is higher than in surrounding suburbs or rural areas, caused by artificial surfaces, such as buildings and roads, absorbing and re-radiating solar radiation, as well as the heat generated by human activities, such as industrial production and transportation [3,4]. As urbanization progresses, the UHI effect has become increasingly pronounced [5]. The temperature rise caused by the UHI effect increases cooling energy consumption for buildings, reduces heating energy consumption, and alters the overall energy demand of the city [6,7]. Li et al. reviewed the relevant literature and found that the UHI effect can increase building cooling energy consumption by 10–120% while reducing heating energy consumption by 3–45% [8].
To gain a deeper understanding of the impact of the UHI effect on building energy consumption and to compare the differences in energy consumption with and without the UHI effect, various energy consumption prediction models have been developed [2]. In building energy consumption simulations, it is necessary to construct meteorological datasets with and without the UHI effect and to compare the simulation results generated from these datasets [9,10,11]. For example, Santamouris M et al. investigated the impact of the UHI effect on building energy consumption in the Athens area using temperature data collected from urban and rural observation stations [12]. Ignatius et al. estimated air temperature at specific urban locations based on observed rural temperatures and urban variables and then compared building energy consumption using urban temperatures with UHI effects and rural temperatures without UHI effects [13]. However, obtaining temperature data with and without the UHI effect is challenging, so only a limited number of studies have been able to quantify the impact of the UHI effect on building energy consumption [8]. Furthermore, due to factors such as urban morphology, regional characteristics, local microclimates, and meteorological data measurement points, there is spatial variation in urban heat island intensity (UHII), which results in significant differences in the impact of the UHI effect on building energy consumption in different urban areas [14,15]. However, several studies have reported that the use of temperatures from different rural observatories may significantly change the assessment of the impact on the energy demand of buildings. The use of temperatures from multiple rural stations is recommended to reduce this uncertainty.
Studies using the Local Climate Zone (LCZ) scheme in UHI research provide a more accurate representation of the UHI characteristics in different regions, contributing to the construction of regional meteorological datasets with UHI effects. The LCZ classification, developed by Stewart and Oke [16] in 2012, is based on land cover and the built environment, which can describe and analyze the thermal environment more precisely. Traditional urban–rural classification methods primarily measure the UHI effect by comparing the temperatures of “urban” and “rural” areas, which is overly simplistic and fails to capture the complex thermal variations within cities [17,18,19]. In contrast, the LCZ classification offers a finer distinction of the thermal environments, addressing the limitations of traditional urban–rural classifications. According to the differences in surface cover, surface structure, surface material, and human activities, the LCZ system established 10 quantitative indexes, including sky view factor (SVF), aspect ratio (H/W), building surface fraction (BSF), pervious surface fraction, impervious surface fraction (ISF), height of roughness elements (HRE), terrain roughness class, surface admittance, surface albedo, and anthropogenic heat output, and divided the urban underlying surface into 17 basic types, including 10 built types (LCZ 1~10) and 7 land cover types (LCZ A~G). Through this classification, researchers and planners can better understand the formation mechanism of the UHI effect and take corresponding measures to mitigate its impact. The effectiveness of LCZ classification has been verified in many cities in China, Europe, North America, Japan, India, and other places and has been widely used in urban planning and climate change adaptation [20,21].
At present, the application of LCZ theory in the study of the UHI effect mainly involves several fields. The first field is LCZ classification mapping of urban areas using remote sensing and geographic information system (GIS) technology [22,23,24,25] to identify and quantify the thermal environment characteristics of different regions. The second field is to use LCZ theory to guide urban planning, so as to improve urban climate adaptability, alleviate the UHI effect, and improve residents’ quality of life [26,27,28,29]. The third field is to study the thermal environment characteristics under different LCZ types, including the evaluation of UHII and the spatial distribution of land surface temperature (LST) [30,31]. Stewart et al. [32] evaluated the division of LCZ through the temperature observations of Nagano, Japan, Vancouver, Canada, Uppsala, and Sweden. Since then, a series of LCZ temperature observations have been carried out in Paraná, Brazil [33]; Novi Sad, Serbia [34]; Berlin, Germany [35]; Nancy, France [36]; Nagpur, India [37]; Chongqing, China [38]; Nanjing, China [39]; and Guangzhou, China [40]. In these studies, remote sensing inversion, fixed-point observation, and moving measurement methods are used, and models are used to collect and analyze temperature and humidity data related to LCZ. Some studies have applied LCZ to building energy consumption assessment and found a significant correlation between energy consumption and LCZ types. Relevant research has observed that energy consumption in compact LCZs is higher than in open LCZs [37,41,42,43,44], or that energy consumption increases with a decrease in LCZ grade [45]. This indicates that the LCZ classification scheme can be considered for building energy consumption. Additionally, weather data are one of the primary inputs for building energy simulations, and high-precision climate data can serve as a critical parameter for urban energy consumption models and building energy efficiency models. Yang et al. [46,47] used temperature data from LCZ stations to evaluate a diagnostic equation for daily maximum UHI intensity and applied this equation to building energy simulations. Existing research has mainly focused on temperate, subtropical, and tropical regions, while studies on severe cold regions are lacking. Therefore, Shenyang, as a typical city in a severe cold region, requires extensive and long-term temperature observations to validate the effectiveness of the LCZ scheme and to lay the foundation for urban energy consumption simulations.
To obtain temperature, humidity, and other data with and without the UHI effect on Shenyang, a severe cold region, this UHI research based on LCZ was carried out in Shenyang. According to the LCZ classification, an LCZ map of Shenyang central city is drawn. Eight LCZ types in Shenyang were selected and temperature data were collected through field measurements to assess the UHII characteristics of LCZs under typical weather conditions. Air temperature was collected hourly, analyzed according to hourly air temperature and daily maximum and minimum temperature, and UHII was analyzed according to hourly UHII, average, and maximum UHII. In addition, the temperature dynamics and warming/cooling rates of each LCZ under typical meteorological days were analyzed. This paper analyzes the field test results of different LCZ plots on typical meteorological days, including clear days, days with weak wind, and days with few clouds, to analyze the spatial and temporal variation characteristics of UHI in the transitional season in Shenyang, and to preliminarily test the applicability of the LCZ methodology in the severe cold region. The acquired high-precision climate data serve as a key parameter for urban energy consumption models and building energy efficiency models, laying the foundation for accurate energy consumption prediction.
2. Aims and Scope
This study focuses on Shenyang, a city in a severe cold region, aiming to address the research gap in LCZ-based UHI (urban heat island) effect studies in this area. The primary objectives include the following:
- (a)
- Conducting a comprehensive analysis of the UHI intensity characteristics across different LCZs in Shenyang during transitional seasons, with a detailed exploration of their spatiotemporal variation patterns.
- (b)
- Validating the applicability of the LCZ classification method in severe cold regions, providing methodological references for subsequent related research.
- (c)
- Acquiring high-precision meteorological data to supply reliable parameters for urban energy consumption models and building energy efficiency models, thereby improving the accuracy of energy consumption predictions.
Current research has several gaps, such as the scarcity of studies on the thermal environment characteristics of LCZs in severe cold regions, the difficulty in accurately quantifying the impact of UHI effects on building energy consumption in different areas, and the lack of meteorological datasets that precisely reflect urban thermal environment characteristics. The innovation of this study lies in being the first to conduct a systematic LCZ-based UHI study in Shenyang, comprehensively analyzing the performance of UHI effects across different LCZs during transitional seasons. By conducting field measurements of temperatures in eight LCZ types, this study has obtained a wealth of first-hand data, which is pioneering in related research for severe cold regions. Additionally, the study delves into the mechanisms by which factors such as building density and surface properties influence the formation of UHI effects, providing more targeted strategic insights for urban planners and policymakers to mitigate UHI effects and promote sustainable urban development.
As an important city in a severe cold region, Shenyang serves as the basis for this LCZ-based UHI study. The research involves mapping the LCZs in Shenyang’s central urban area, selecting eight LCZ types for field temperature measurements, and analyzing the UHII characteristics, temperature dynamics, and heating/cooling rates of each LCZ under typical weather conditions. The study aims to fill the data and analytical gaps in Shenyang and validate the applicability of the LCZ theory in severe cold regions.
3. Materials and Methods
3.1. Study Area
Shenyang is the capital of Liaoning Province and an important city in Northeast China. It is located in the north-central part of Liaoning Province (41°48′ N, 123°23′ E). The resident population of Shenyang was 9.147 million in 2022 [48], and the urbanization rate was 84.99%, which is higher than the national average. The topography of Shenyang is diverse, consisting mainly of hills, plains, and rivers. Shenyang has a temperate continental monsoon climate with four distinct seasons. The winters are long and cold, and the summers are short and warm. The annual precipitation is relatively low and concentrated in summer, while winter is drier. The hottest month is July, with an average temperature of 24.85 °C, and the coldest month is January, with an average temperature of −10.45 °C [49].
3.2. LCZ Site Selection
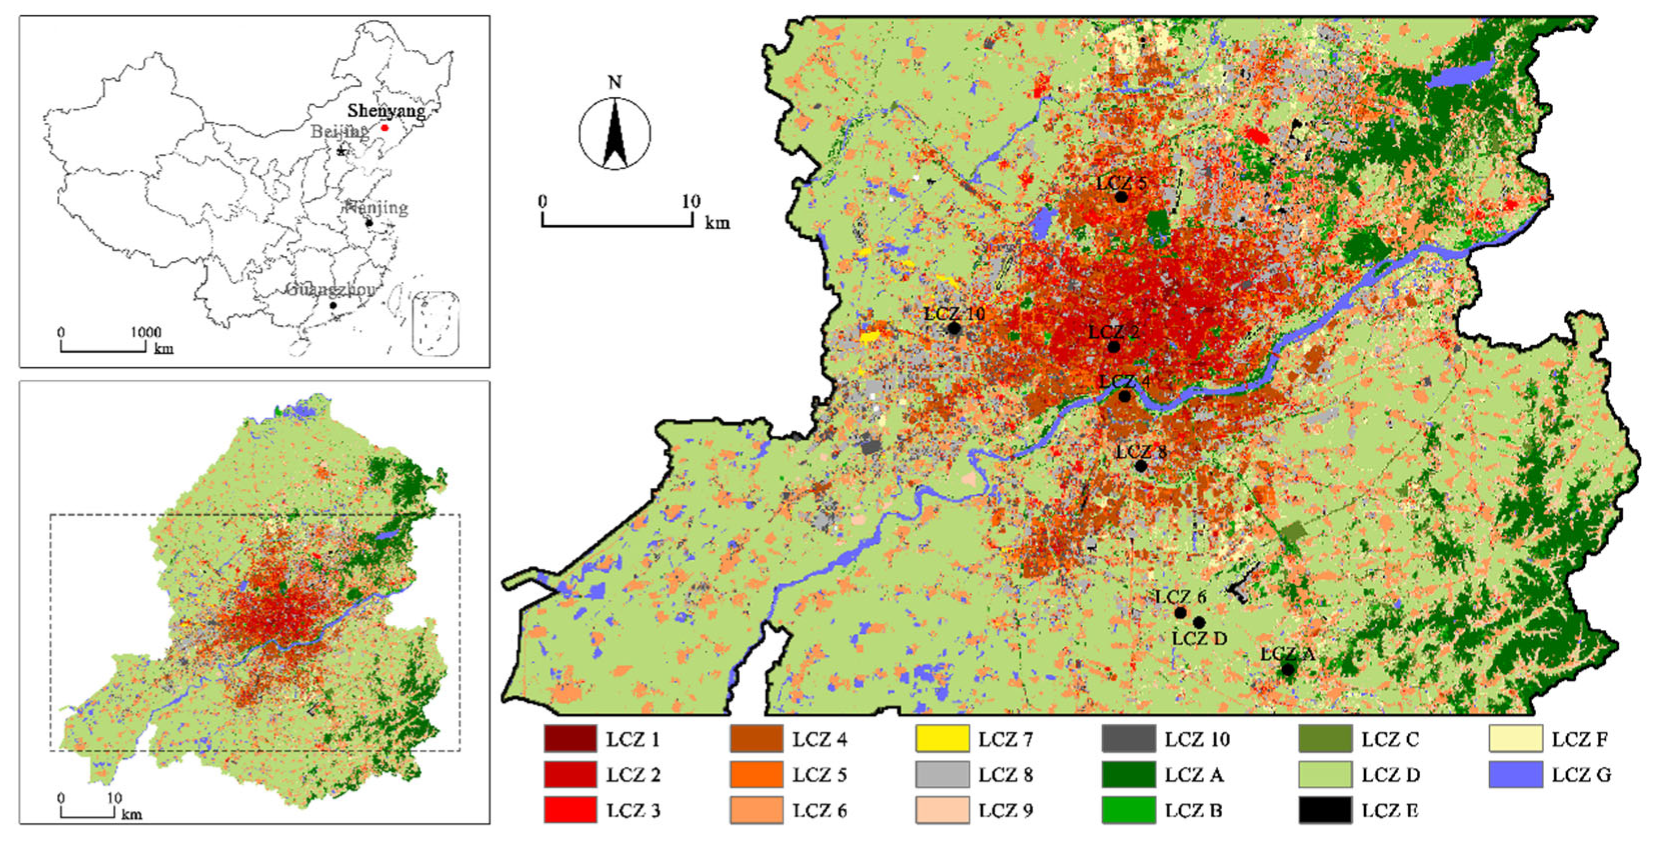
LCZ is divided into 17 categories, 10 built types and 7 land cover types, according to the characteristics of urban form and land cover types. In this paper, the method of the World Urban Database and Access Portal Tools (WUDAPT) [50] is adopted, and the multispectral satellite map Landsat-8 imagery, LCZ Generator [23], Google Earth, Street View map, and field survey in WUDAPT are used as the main data sources. A total of 20–100 “training area samples” are selected for each LCZ type, and the LCZ map of Shenyang central city is constructed as shown in Figure 1.
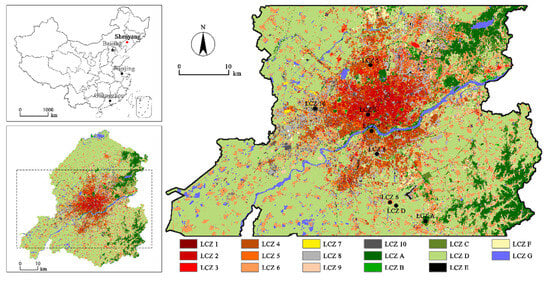
Figure 1.
LCZ map and location of LCZ sites in Shenyang central city.
As shown in Figure 1 and Table 1, Shenyang’s built-type LCZs are concentrated in the middle, whereas its land-cover-type LCZs are distributed in the periphery of the building area. Compact zones (LCZ1 and 2) and open high-rises (LCZ 4) mainly exist in the center. Low-rise zones (LCZ6 and 9) mainly exist in peripheral areas and are scattered in land-cover-type LCZs (mainly LCZ D). Open midrise (LCZ 5) and large low-rise (LCZ 8) areas exist in both inner and ex-central parts of the city. Open low-rises (LCZ 6) account for the largest proportion of built-type LCZs, accounting for 12.68%. In land-cover-type LCZs, the number of low plants (LCZ D) is the largest, accounting for 52.89%, followed by dense trees (LCZ A), mainly distributed in the east. Therefore, LCZ 2, LCZ 4, LCZ 5, LCZ 6, LCZ 8, LCZ 10, LCZ A, and LCZ D are selected as the study areas.

Table 1.
Area and percentage of each type of LCZ.
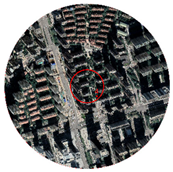
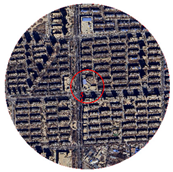
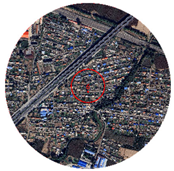
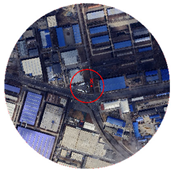
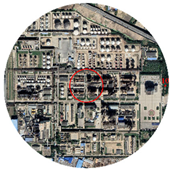
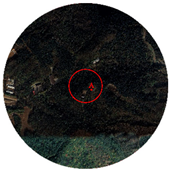
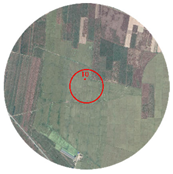
For 8 different types of LCZ plots, we choose a circular area with a radius of 500 m as the research site (as shown in Table 2 satellite images), which is evenly distributed all over Shenyang (as shown in Figure 1). Through the combination of satellite maps and field investigation, we can ensure the uniform distribution of architectural forms and land types in this area. Then, through field investigation, remote sensing images, and network big data, six indicators closely related to thermal environment, such as sky view factor (SVF), aspect ratio (H/W), building surface fraction (BSF), pervious or impervious surface fraction (ISF), and height of roughness elements (HRE), are calculated. However, the surface admittance, surface albedo, and anthropogenic heat flux can not be obtained due to the lack of testing methods and related measuring instruments.
Table 2.
Urban form, site location, and characteristic parameters of LCZ sites.
3.3. Data Sources
3.3.1. Field Measurement
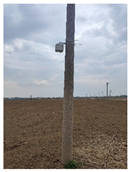
The temperature of each LCZ site was determined by field measurement. We selected the HOBO MX2301A instrument, which was manufactured by Onset Computer Corporation in Bourne, MA, USA, to measure the temperature and relative humidity. This instrument has an accuracy of 0.2 °C (from 0 to 70 °C) and was placed in an RS1 Solar Radiation Shield. In order to obtain the temperature value of each area, we placed the instrument at a suitable position within 100 m from the center (as shown in Table 2), at a height of about 2.5 m, on street lamps or telephone poles, stayed away from heat sources, and ventilated them naturally to ensure safety and reduce the impact on the urban landscape [51]. For the 8 different types of LCZ plots, 1 instrument was used for temperature measurement in each plot, totaling 8 instruments with identical settings. Data were collected simultaneously across all selected LCZ plots (specific locations are shown in Figure 1: LCZ 2, LCZ 4, LCZ 5, LCZ 6, LCZ 8, LCZ 10, LCZ A, and LCZ D) and recorded in the internal memory every 0.5 h. At present, the existing data period is from 27 April 2024 to 30 June 2024, covering the main transition season in Shenyang.
3.3.2. Meteorological Observation Data
Meteorological observation data, including temperature, barometric pressure, humidity, wind, precipitation, cloud, snow, visibility, weather phenomena, and other meteorological observation elements, were obtained from Shenyang National Meteorological Observatory (54342) through the China Meteorological Data Service Center (http://data.cma.cn) [52]. Shenyang National Meteorological Observatory is located at 41.73° N and 123.51° E, and its LCZ type is LCZ D. These comprehensive datasets are used to classify the weather conditions in Shenyang, so that specific weather scenarios can be selected to calculate the UHII.
3.4. Data Analysis
3.4.1. Typical Meteorological Day Selection
The weather conditions of partly cloudy and weakly windy weather are suitable for the development of the UHI effect. The weather factor proposed by Oke [53] is used to select the typical weather days with partly cloudy and weakly windy weather characteristics:
where is wind speed, m/s; is cloud cover, %; the coefficient is taken according to the type of cloud [54,55]. = 0 denotes no heat island effect, and = 1 denotes the maximum heat island effect. The hourly wind speed comes from Shenyang National Weather Station, and the hourly cloud cover and cloud types come from the Meteorological Data Center of the China Meteorological Administration [52]. The selection standard is to exclude rainfall days and the next two days (eliminating the influence of rainfall), calculate the value per hour at night (18:00–06:00), and then calculate its average value, and select the days with , which is consistent with the previous LCZ observation results [32,56]. For the research period from 27 April 2024 to 30 June 2024, a total of 12 days met the selection criteria.
3.4.2. Calculation of UHII
UHII is one of the indexes to measure the UHI effect. The calculation of UHII can be realized by comparing the difference in spatial average land surface temperature or air temperature between urban and rural areas [57]. In this paper, UHII is defined as the air temperature difference between other LCZ types and LCZ D, which is shown in Equation (2):
where represents the temperature (°C) obtained at each LCZ site, and represents the temperature (°C) obtained at LCZ site D.
3.4.3. Warming and Cooling Rates
The formation of UHI is mainly due to the differences in the rates of warming and cooling between urban areas and the surrounding rural areas [54]. Different rates of warming and cooling for different LCZ types result in different temperature changes. Therefore, we define the rate of warming and cooling (°C h−1) at time t of the LCZ measurement point as , which is the difference between the temperature at time and at time , divided by 0.5 h, as shown in Equation (3):
where is the temperature (°C) at time , and is the temperature (°C) at time . When , the measurement point is undergoing a warming process; when , the measurement point is undergoing a cooling process.
4. Results
4.1. Air Temperature Analysis
4.1.1. Diurnal Variation in Air Temperature
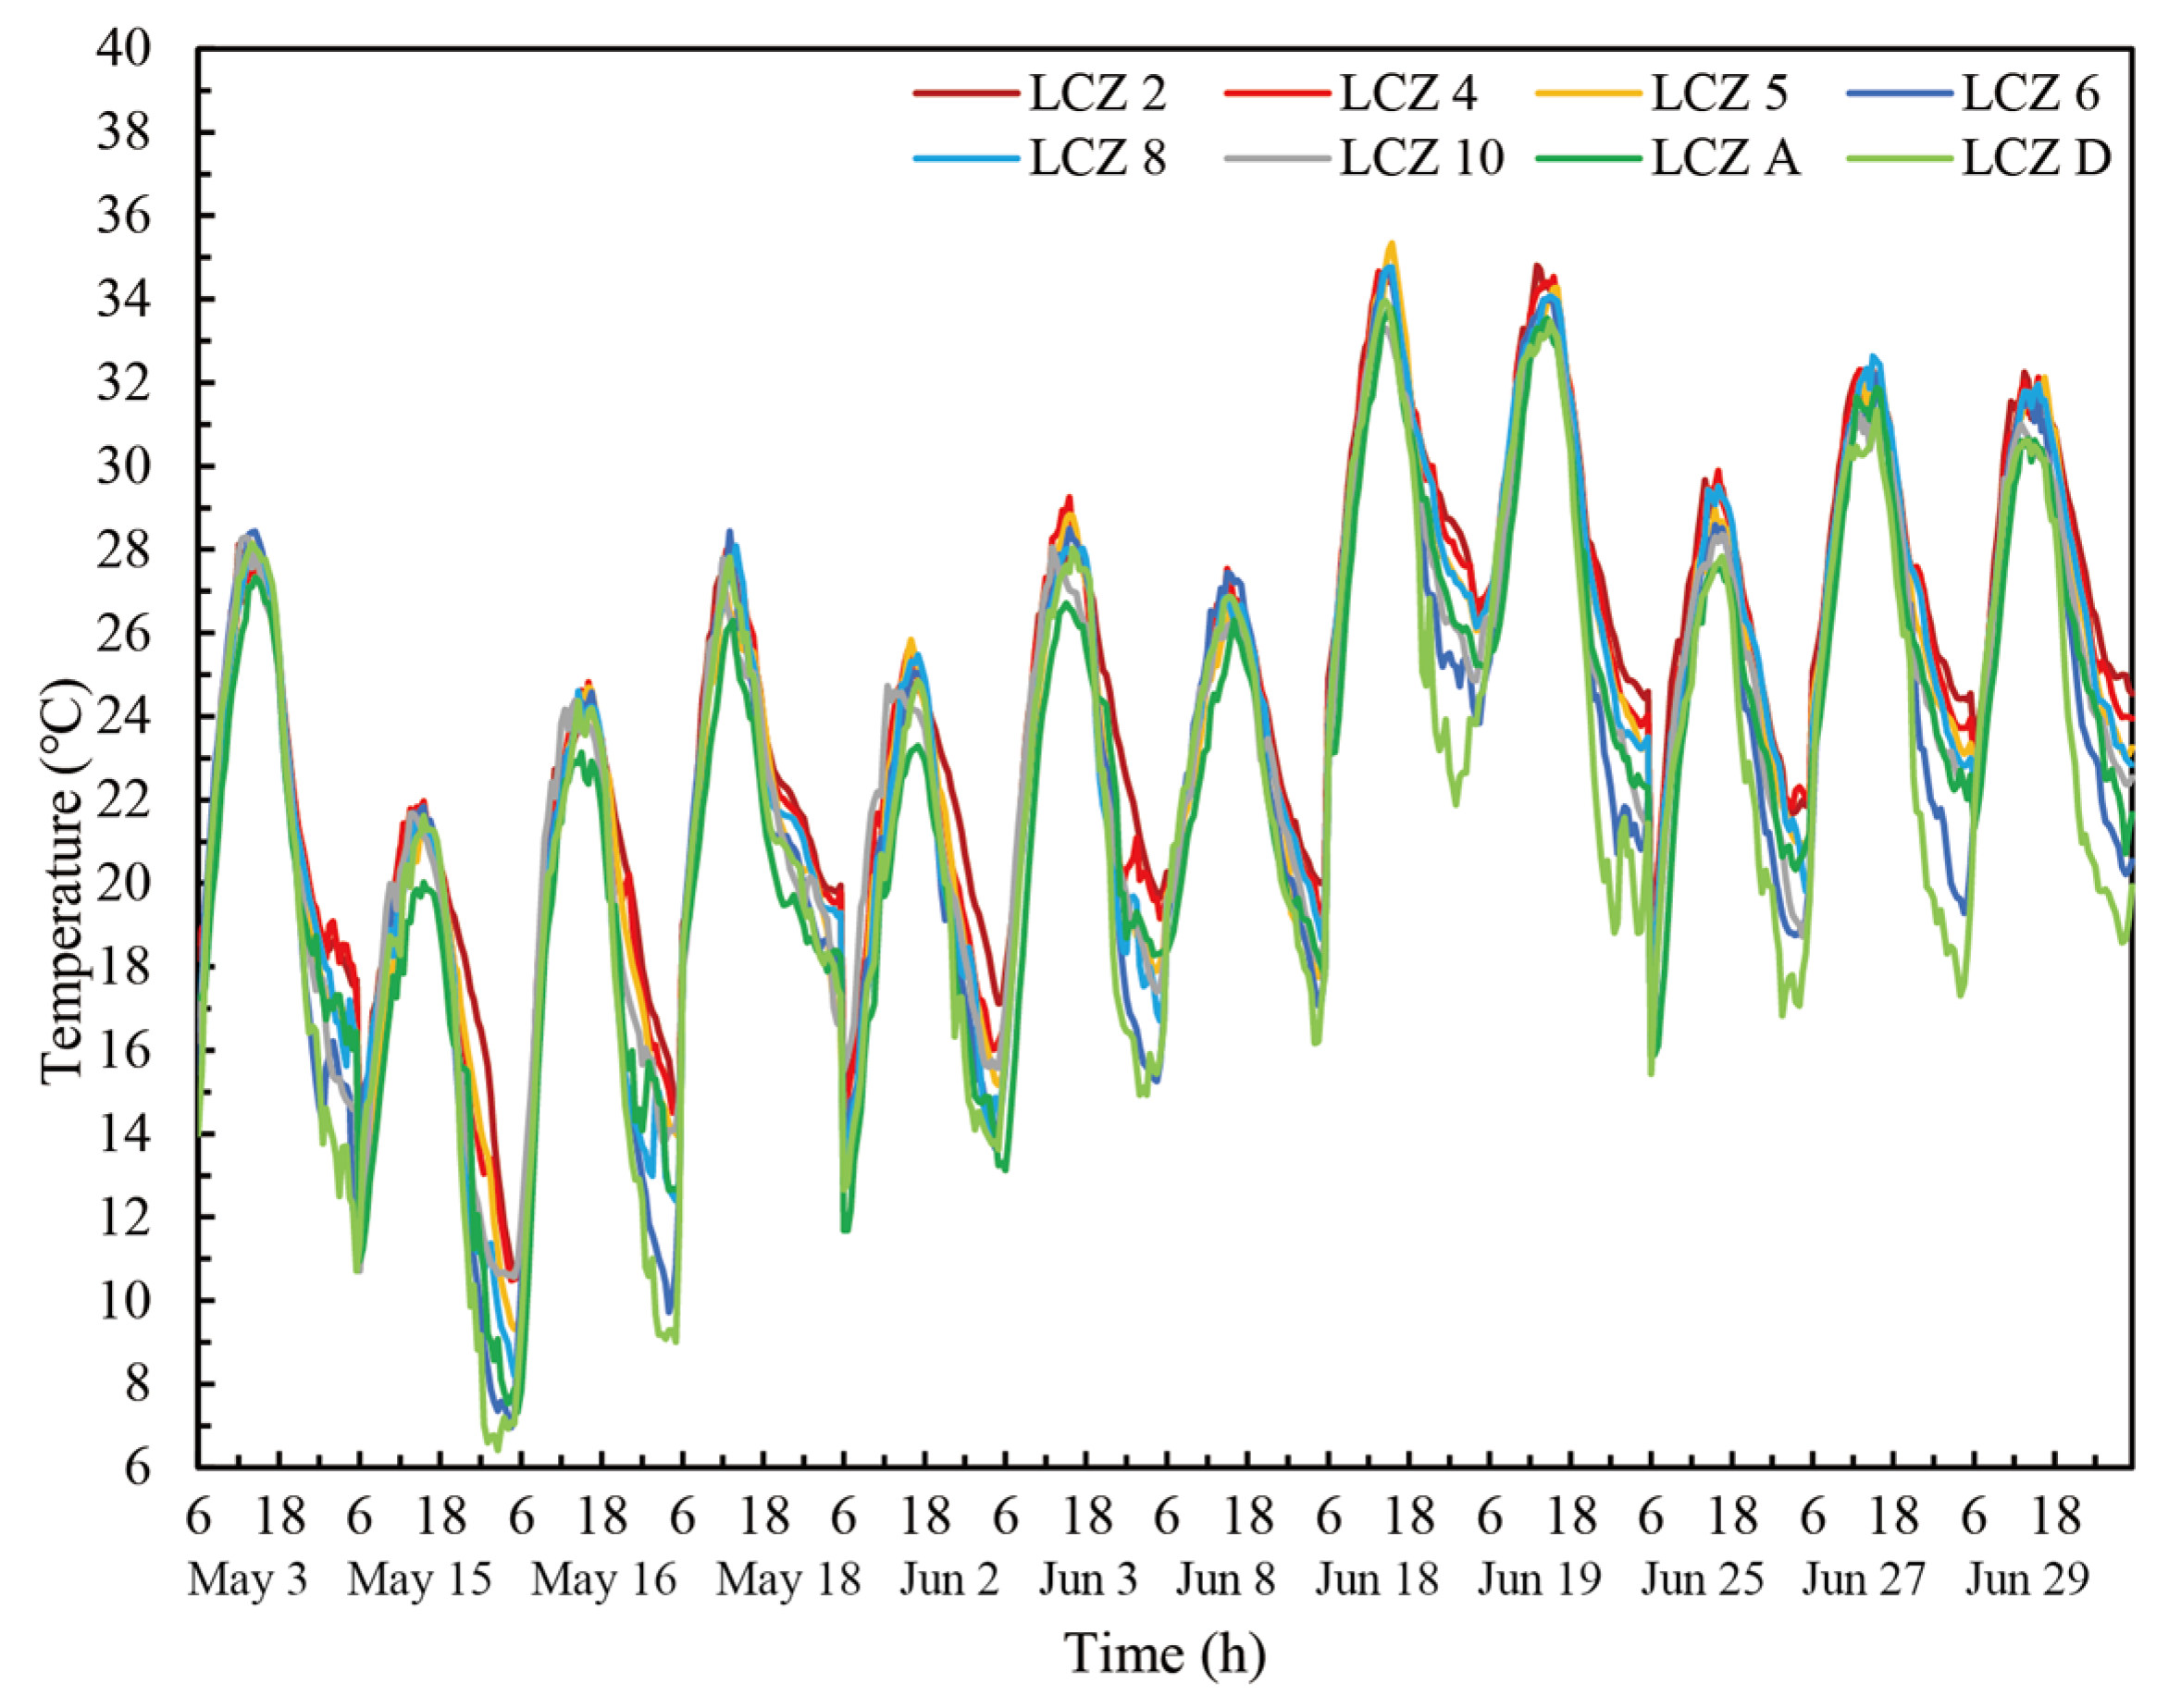
First, the diurnal variation in air temperature on typical meteorological days and the differences among various LCZs are analyzed, laying the foundation for the urban heat island analysis. In this paper, one day is defined as 6:00–5:30 (the next day), covering a complete thermal process of “warming during the day and cooling at night”. The hourly air temperature of each LCZ plot on typical meteorological days is shown in Figure 2. The daily variation trend of temperature in different plots is generally similar, with the highest temperature usually appearing around 15:00 and the lowest temperature around 6:00, and the occurrence time of different plots is slightly different. During the period from 6:00 to 18:00, the air temperature of LCZ A is the lowest, and the temperature difference of other plots is small. This indicates that during the daytime, the dense vegetation in LCZ A has a cooling effect. From 18:00 to 6:00, the air temperature of LCZ D is the lowest, and the temperature difference between different plots is obvious, and the higher the building density in the plots, the higher the temperature.
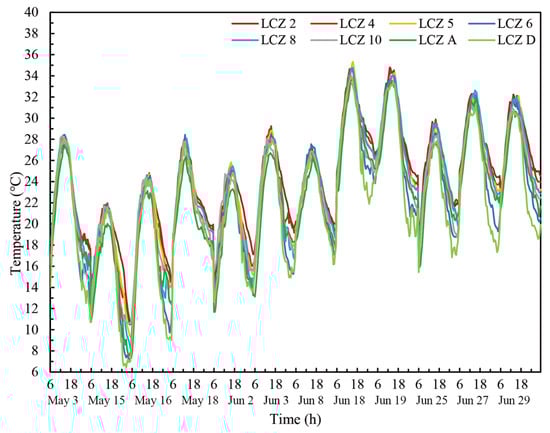
Figure 2.
Hourly air temperature diagram of each LCZ.
In order to deeply explore the influence of building density on air temperature, three urban areas with different building compactness were selected, including LCZ 2 (compact midrise building area), LCZ 5 (open midrise building area), and LCZ 8 (large low-rise building area), and two natural environment zones, namely LCZ A (dense tree area) and LCZ D (low-plant area). May 15th and 16th were selected as typical meteorological days, characterized by stable weather conditions that met the screening criteria (weather factor ≥ 0.7). These days encompass a complete diurnal cycle, clearly demonstrating the temperature variations and urban heat island intensity changes across different LCZ plots over a 24 h period. This facilitates a comparative analysis of the thermal environment characteristics of different LCZ types. A comparative analysis of the air temperatures in these zones is shown in Figure 3. During the warming period from 6:00 to 15:00, the air temperature in LCZ A is the lowest, and the temperature difference in other plots is not significant. LCZ D, which represents suburban form, has similar daily maximum temperature to that in urban form. This suggests that during the morning warming process, building density does not play a dominant role in influencing temperature, while the cooling effect of vegetation in LCZ A is more prominent. During the cooling period from 18:00 to 6:00 the next day, the temperature in the natural environment area is lower than that in the built environment area, with LCZ 2 and LCZ 5 exhibiting relatively higher temperatures. This is because higher building density results in a smaller sky view factor, which limits the surface radiation scattering at night. In contrast, the temperature in LCZ D is lower due to the rapid cooling effect of long-wave radiation.
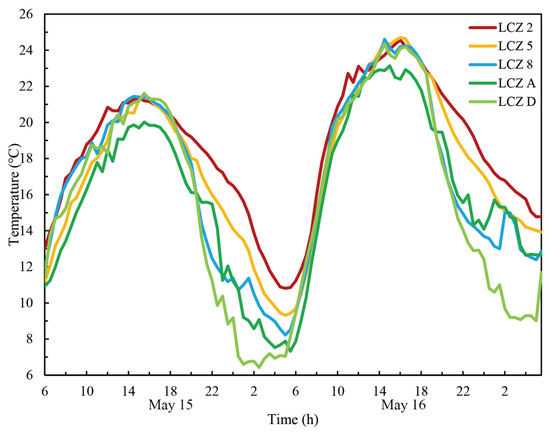
Figure 3.
Hourly air temperature charts of LCZ 2, 5, 8, A, and D.
4.1.2. Daily Maximum and Minimum Temperature
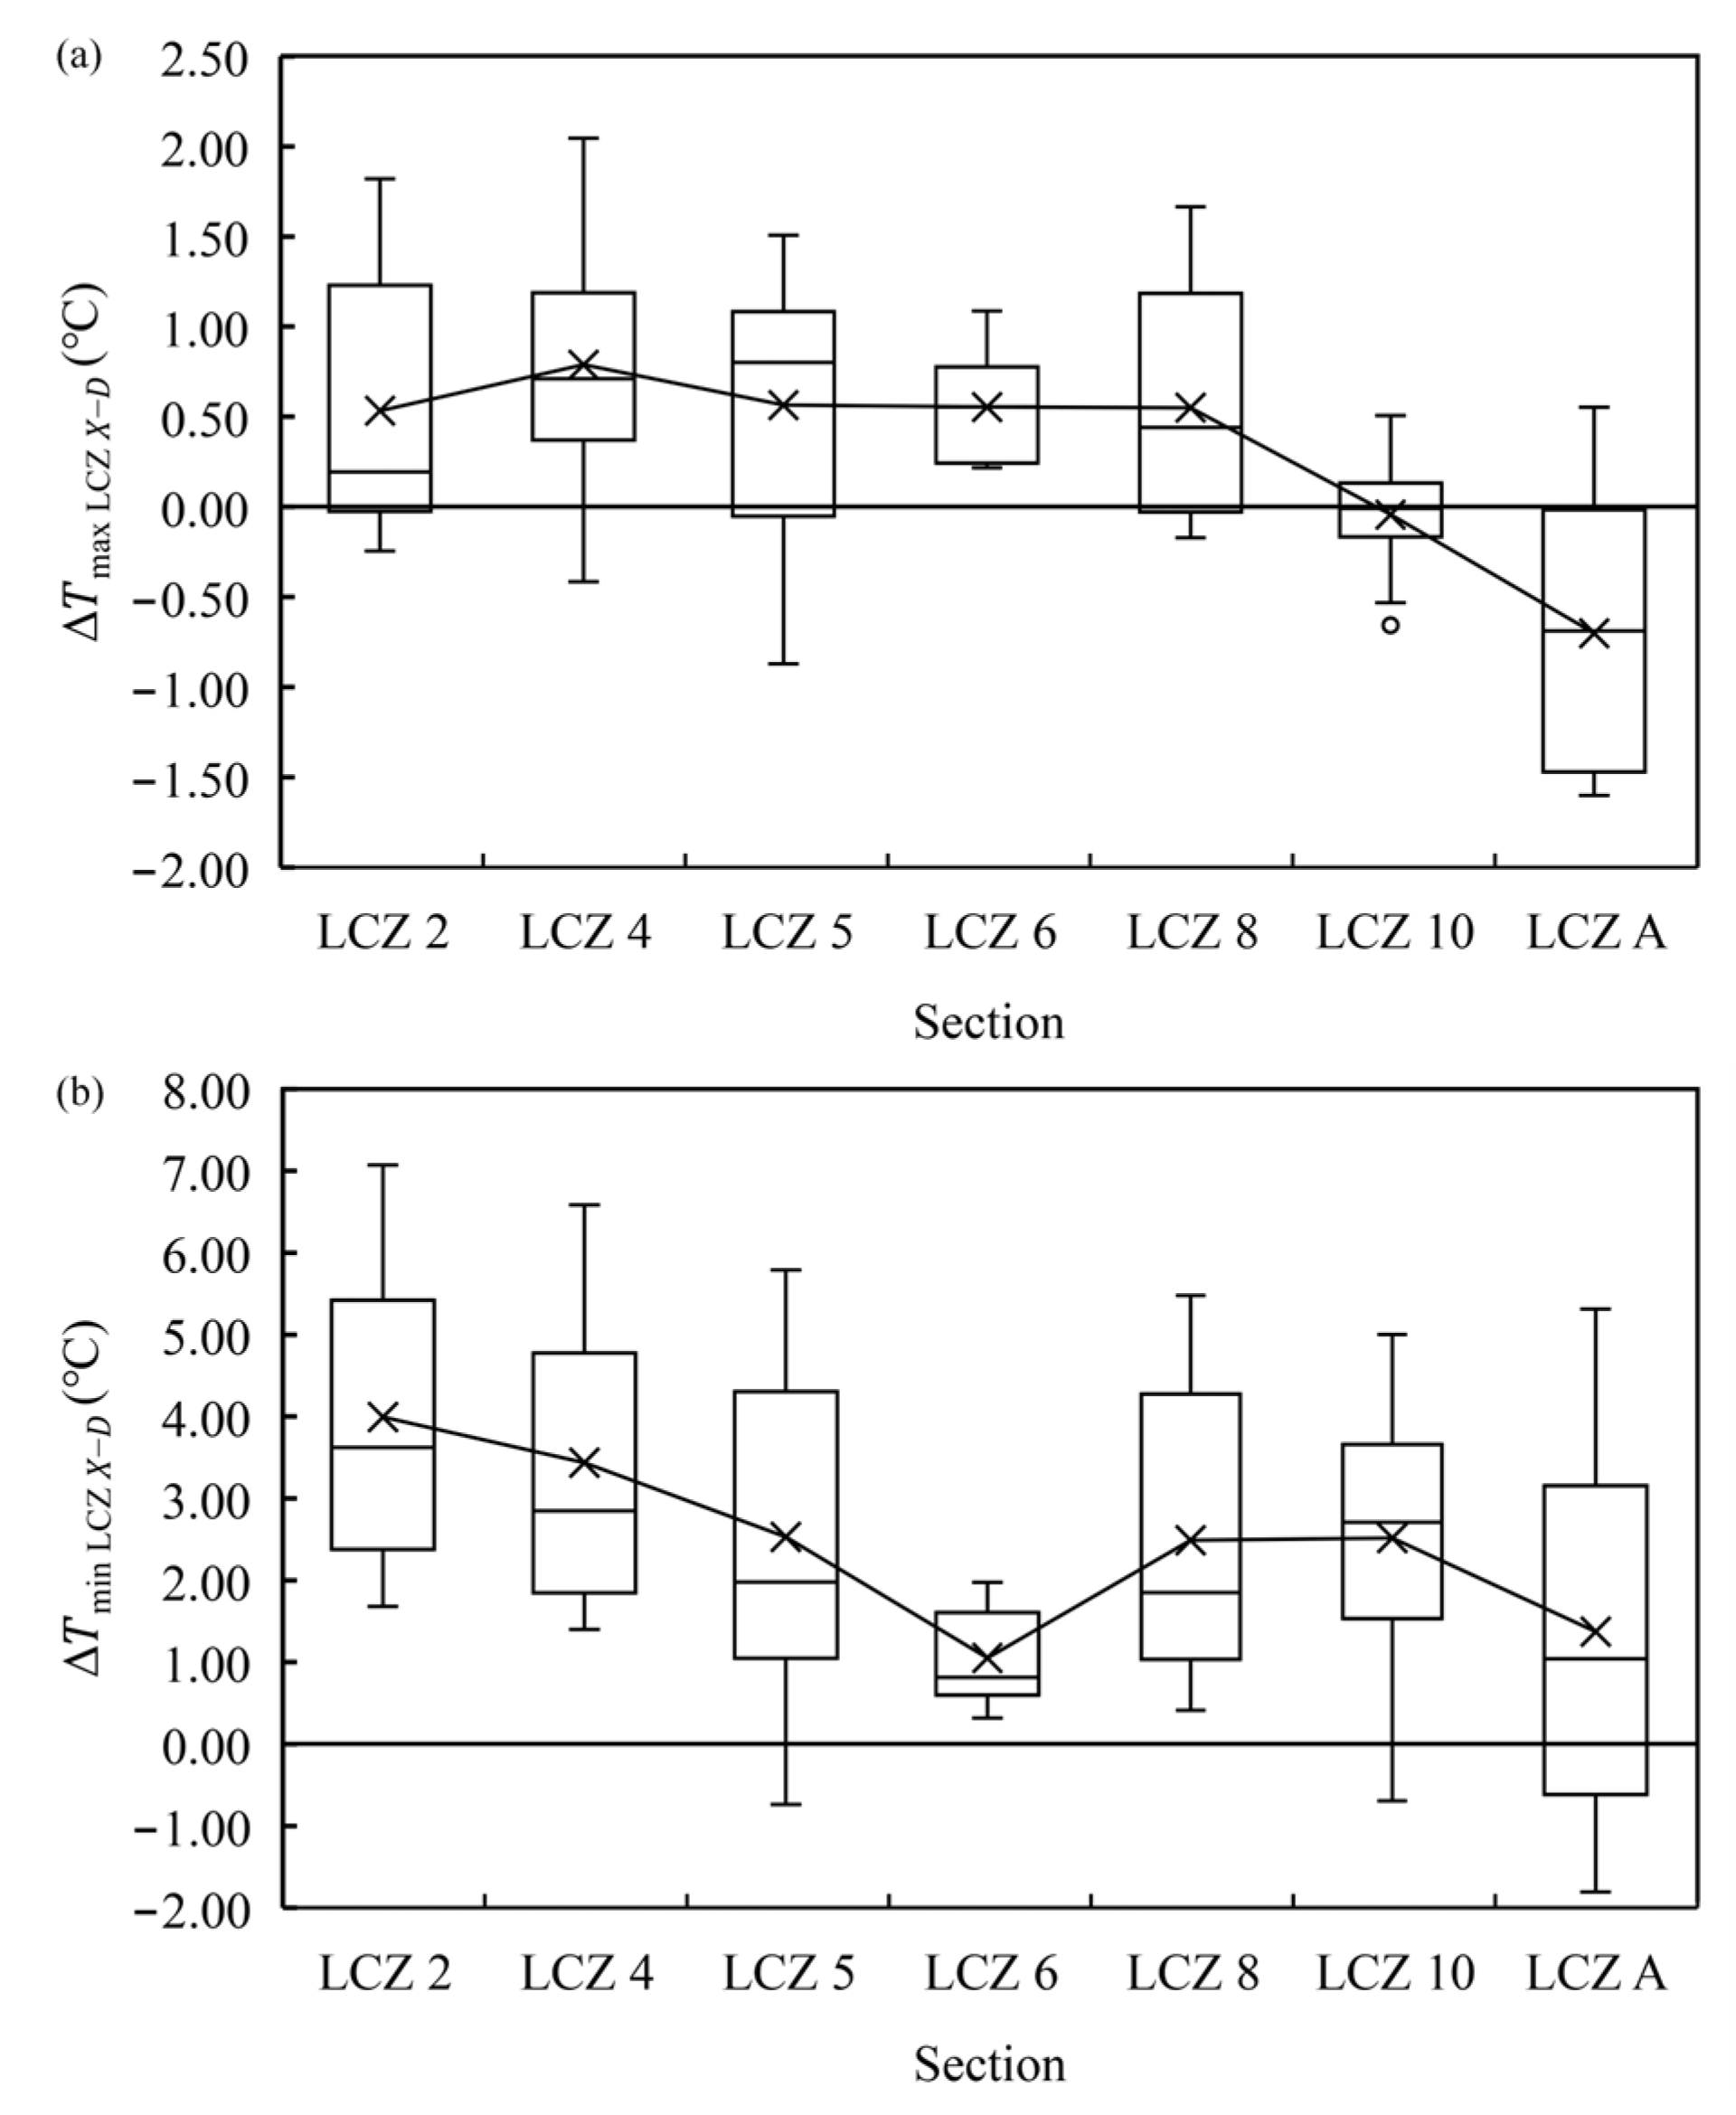
The daily maximum temperature and daily minimum temperature, respectively, reflect the final heating and cooling degree of LCZ plots. The daily maximum temperature difference () and daily minimum temperature difference () between LCZ plots and LCZ plot D on 12 typical meteorological days are shown in Figure 4. The difference in daily minimum temperature between LCZ plots is significantly higher than that of daily maximum temperature.

Figure 4.
Difference between daily maximum and minimum air temperature in each LCZ plot: (a) ; (b) . Circles indicate outliers.
From the daily maximum temperature difference (Figure 4a) of each LCZ, it can be seen that the daily maximum temperature difference between each LCZ plot and LCZ D is between 0.53 °C and 0.79 °C, except LCZs 10 and A, which indicates that there is little difference between urban plots and suburbs during the high-temperature period during the day. LCZ A showed a certain effect on reducing the daily maximum temperature, which is consistent with the aforementioned cooling effect of vegetation during the daytime. From the daily minimum temperature difference (Figure 4b), it can be seen that the daily minimum temperature difference between LCZs 2, 4, 5, 8, and 10 and LCZ D is 2.49–3.99 °C. LCZ D has a relatively low minimum air temperature due to its high open degree, high permeable area, and smooth ventilation, which is beneficial to long-wave radiation heat dissipation, passive evaporation cooling ability, and so on. However, LCZ plots with urban form are not conducive to heat dissipation due to their architectural form and underlying surface properties, so the daily minimum temperature is higher than that in the suburbs, which is conducive to the formation of the UHI effect. The difference between LCZ6 and LCZD is small, and the other indexes are similar to suburbs except for the lower building density and impervious area ratio. The daily minimum temperature of LCZ A is about 1.37 °C higher than that of LCZ D, which is different from previous studies; LCZ A shows an obvious effect of reducing the daily minimum temperature [58], which may be related to seasons and plant types, and needs further study.
4.2. Heat Island Intensity Analysis
4.2.1. Diurnal Variation in Heat Island Intensity
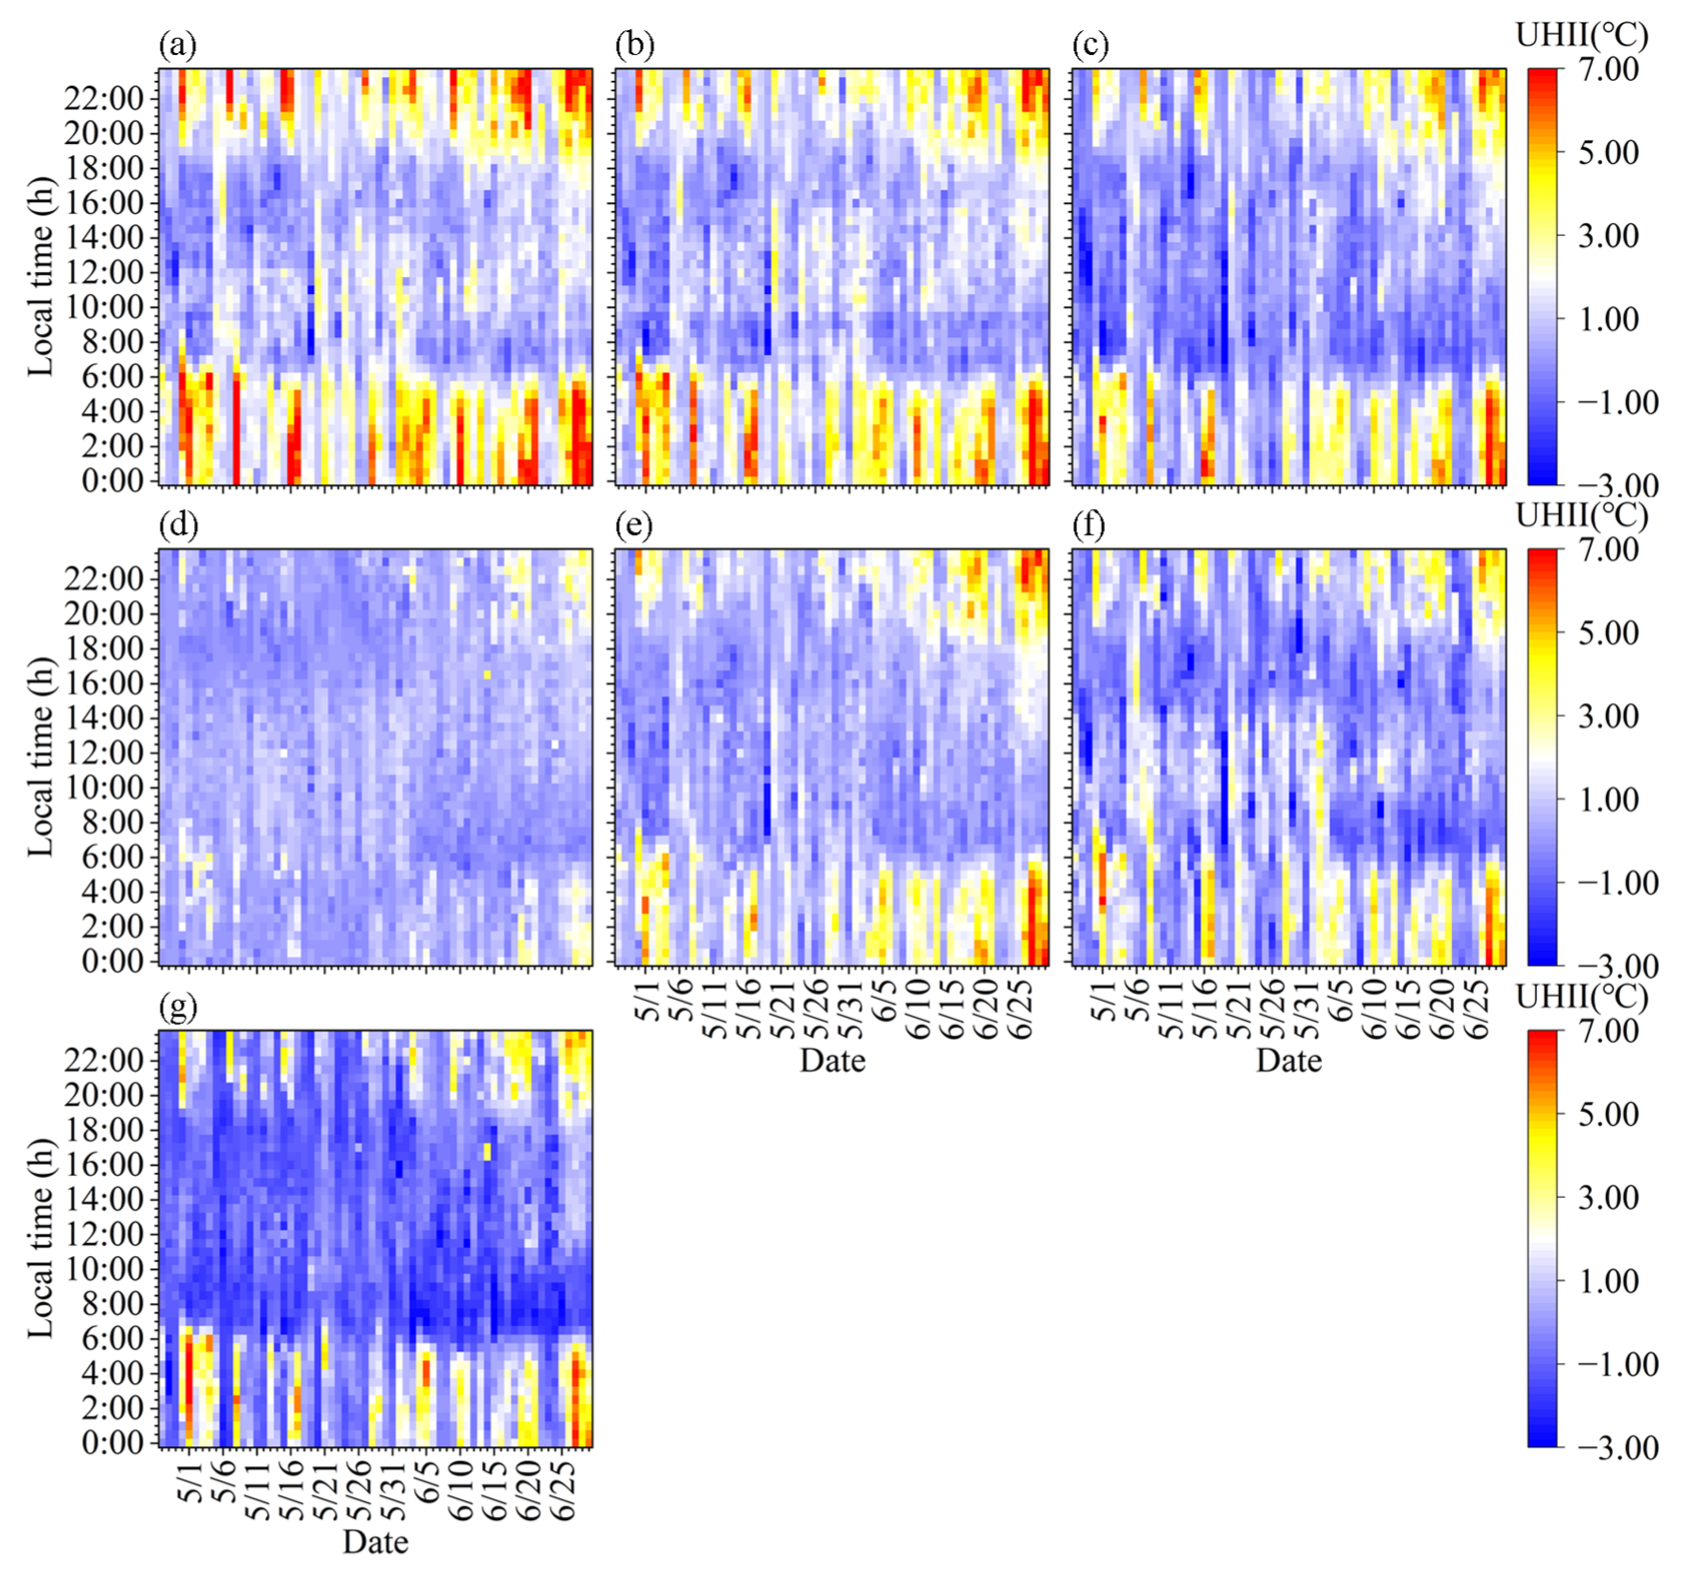
The diurnal variation in urban heat island intensity is a key indicator for assessing the urban heat island effect across different LCZs. Figure 5 shows the hourly UHII heat map of each LCZ during the study period. The horizontal axis represents the study dates, and the vertical axis represents the specific time of day. Each small square indicates the UHII at a particular time, with redder colors indicating higher UHII and bluer colors indicating lower UHII. From the figure, it can be observed that the UHII for each LCZ exhibits a clear diurnal variation pattern. Typically, UHII is higher at night and lower during the day, sometimes even showing negative values, indicating that urban temperatures are lower than those in surrounding areas, a phenomenon known as the urban cold island (UCI) effect, which generally occurs from 8:00 to 18:00. Due to heavy smoke in urban areas (pollutants emitted by industrial and residential pollution sources), solar radiation is absorbed and scattered [59], which leads to significantly lower net radiation on the urban surface than on the rural surface, thus making the urban area a cold island during the day. At the same time, urban building complexes (urban canyons) may block sunlight and reduce solar radiation reaching the ground [60,61]. Moreover, the three-dimensional underlying surface of the city has more artificial surfaces such as concrete and asphalt, and its heat capacity is greater than that of the suburbs. In the warming stage before noon, the warming rate of the underlying surface of the city is slower than that of the suburbs, resulting in the temperature in the central area of the city being lower than that in the surrounding areas [62].
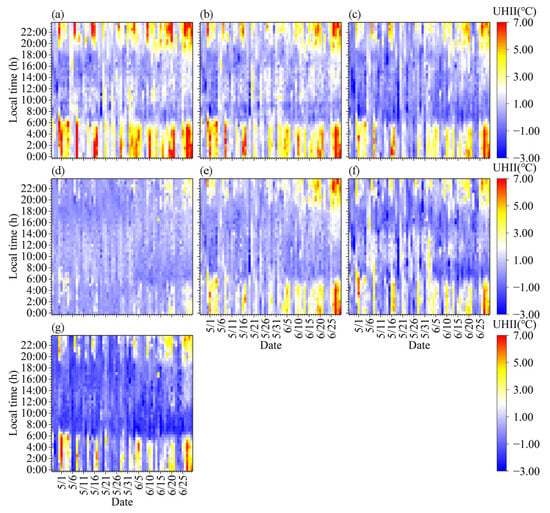
Figure 5.
Hourly UCII heat maps of each LCZ: (a) LCZ 2, (b) LCZ 4, (c) LCZ 5, (d) LCZ 6, (e) LCZ 8, (f) LCZ 10, and (g) LCZ A.
Specifically, the figure illustrates the fluctuation of UHII throughout the day, with higher UHII at night (22:00 to 6:00 the next day), indicating significantly higher urban temperatures compared to surrounding areas. During the day (10:00 to 16:00), UHII is lower, sometimes even negative, suggesting that urban temperatures may be lower than those in surrounding areas. This diurnal variation reflects the typical characteristics of the urban heat island effect. Furthermore, the figure also shows the variation in UHII across different dates, indicating that UHII is influenced not only by the time of day but also by seasonal and weather conditions.
There are obvious differences in the strength of UHII among various LCZs, among which the areas with compact buildings (LCZ 2 and LCZ 4) show the most obvious diurnal variation pattern of the UHI effect; the night temperature is higher, and the UHI effect is obviously higher than other areas. LCZs 5, 8 and 10 showed a similar diurnal variation in the UHI effect, although the intensity was relatively weak compared with LCZs 2 and 4. LCZ 6 is located in the suburbs near LCZ D, and its temperature is almost the same as LCZ D, so there is almost no UHI effect. LCZ A shows a relatively obvious UCI phenomenon during the daytime and at night, which proves that dense vegetation area plays an important role in reducing the UHI effect.
Figure 6 displays the hourly UCII heat map for each LCZ in Shenyang on typical meteorological days, while Table 3 shows the maximum and minimum values of UHII for each LCZ, along with the times at which these maximum and minimum values occur. The UHI effect gradually becomes weaker after sunrise and is the weakest at noon, and the UCI phenomenon may occur. After sunrise at 5:00, the suburbs warm faster than urban areas; the temperature difference between the city and the suburbs falls rapidly, making the UHII low from 8:00 to 18:00, and there may be a UCI effect; after 16:00, the solar altitude angle decreases in the suburbs due to the gradual enhancement of long-wave radiation in the open area and heat dissipation is gradually accelerated, especially after sunset, when the air-layer structure is stable and the rate of cooling is more rapid. However, the city has more heat storage during the day and slow heat dissipation due to the urban architectural form at night, which causes the strongest UHII to be reached 3–7 h after sunset, greater than 7 °C, which has a great impact on urban life and economy. LCZ A has an obvious UCI effect, the maximum of which is −3.3 °C. Except for LCZ 6, five built-up LCZs had a strong UCII, the maximum of which was about 9 °C, and some LCZs had a UCI effect at noon, the maximum of which was about −2 °C; the UHI effect was obviously stronger than the UCI effect.
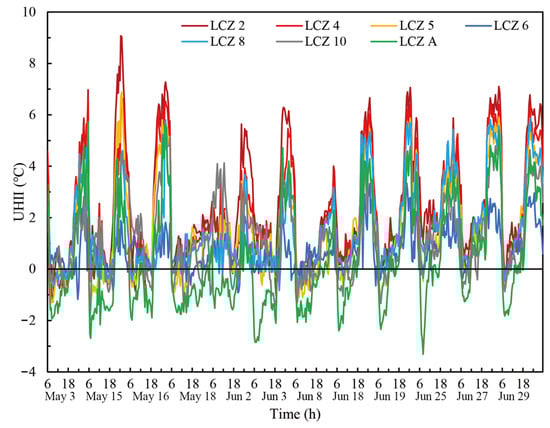
Figure 6.
Hourly UHII diagram of LCZ on typical meteorological days.
Table 3.
The maximum and minimum values of UHII for each LCZ, as well as the times at which these maximum and minimum values occur.
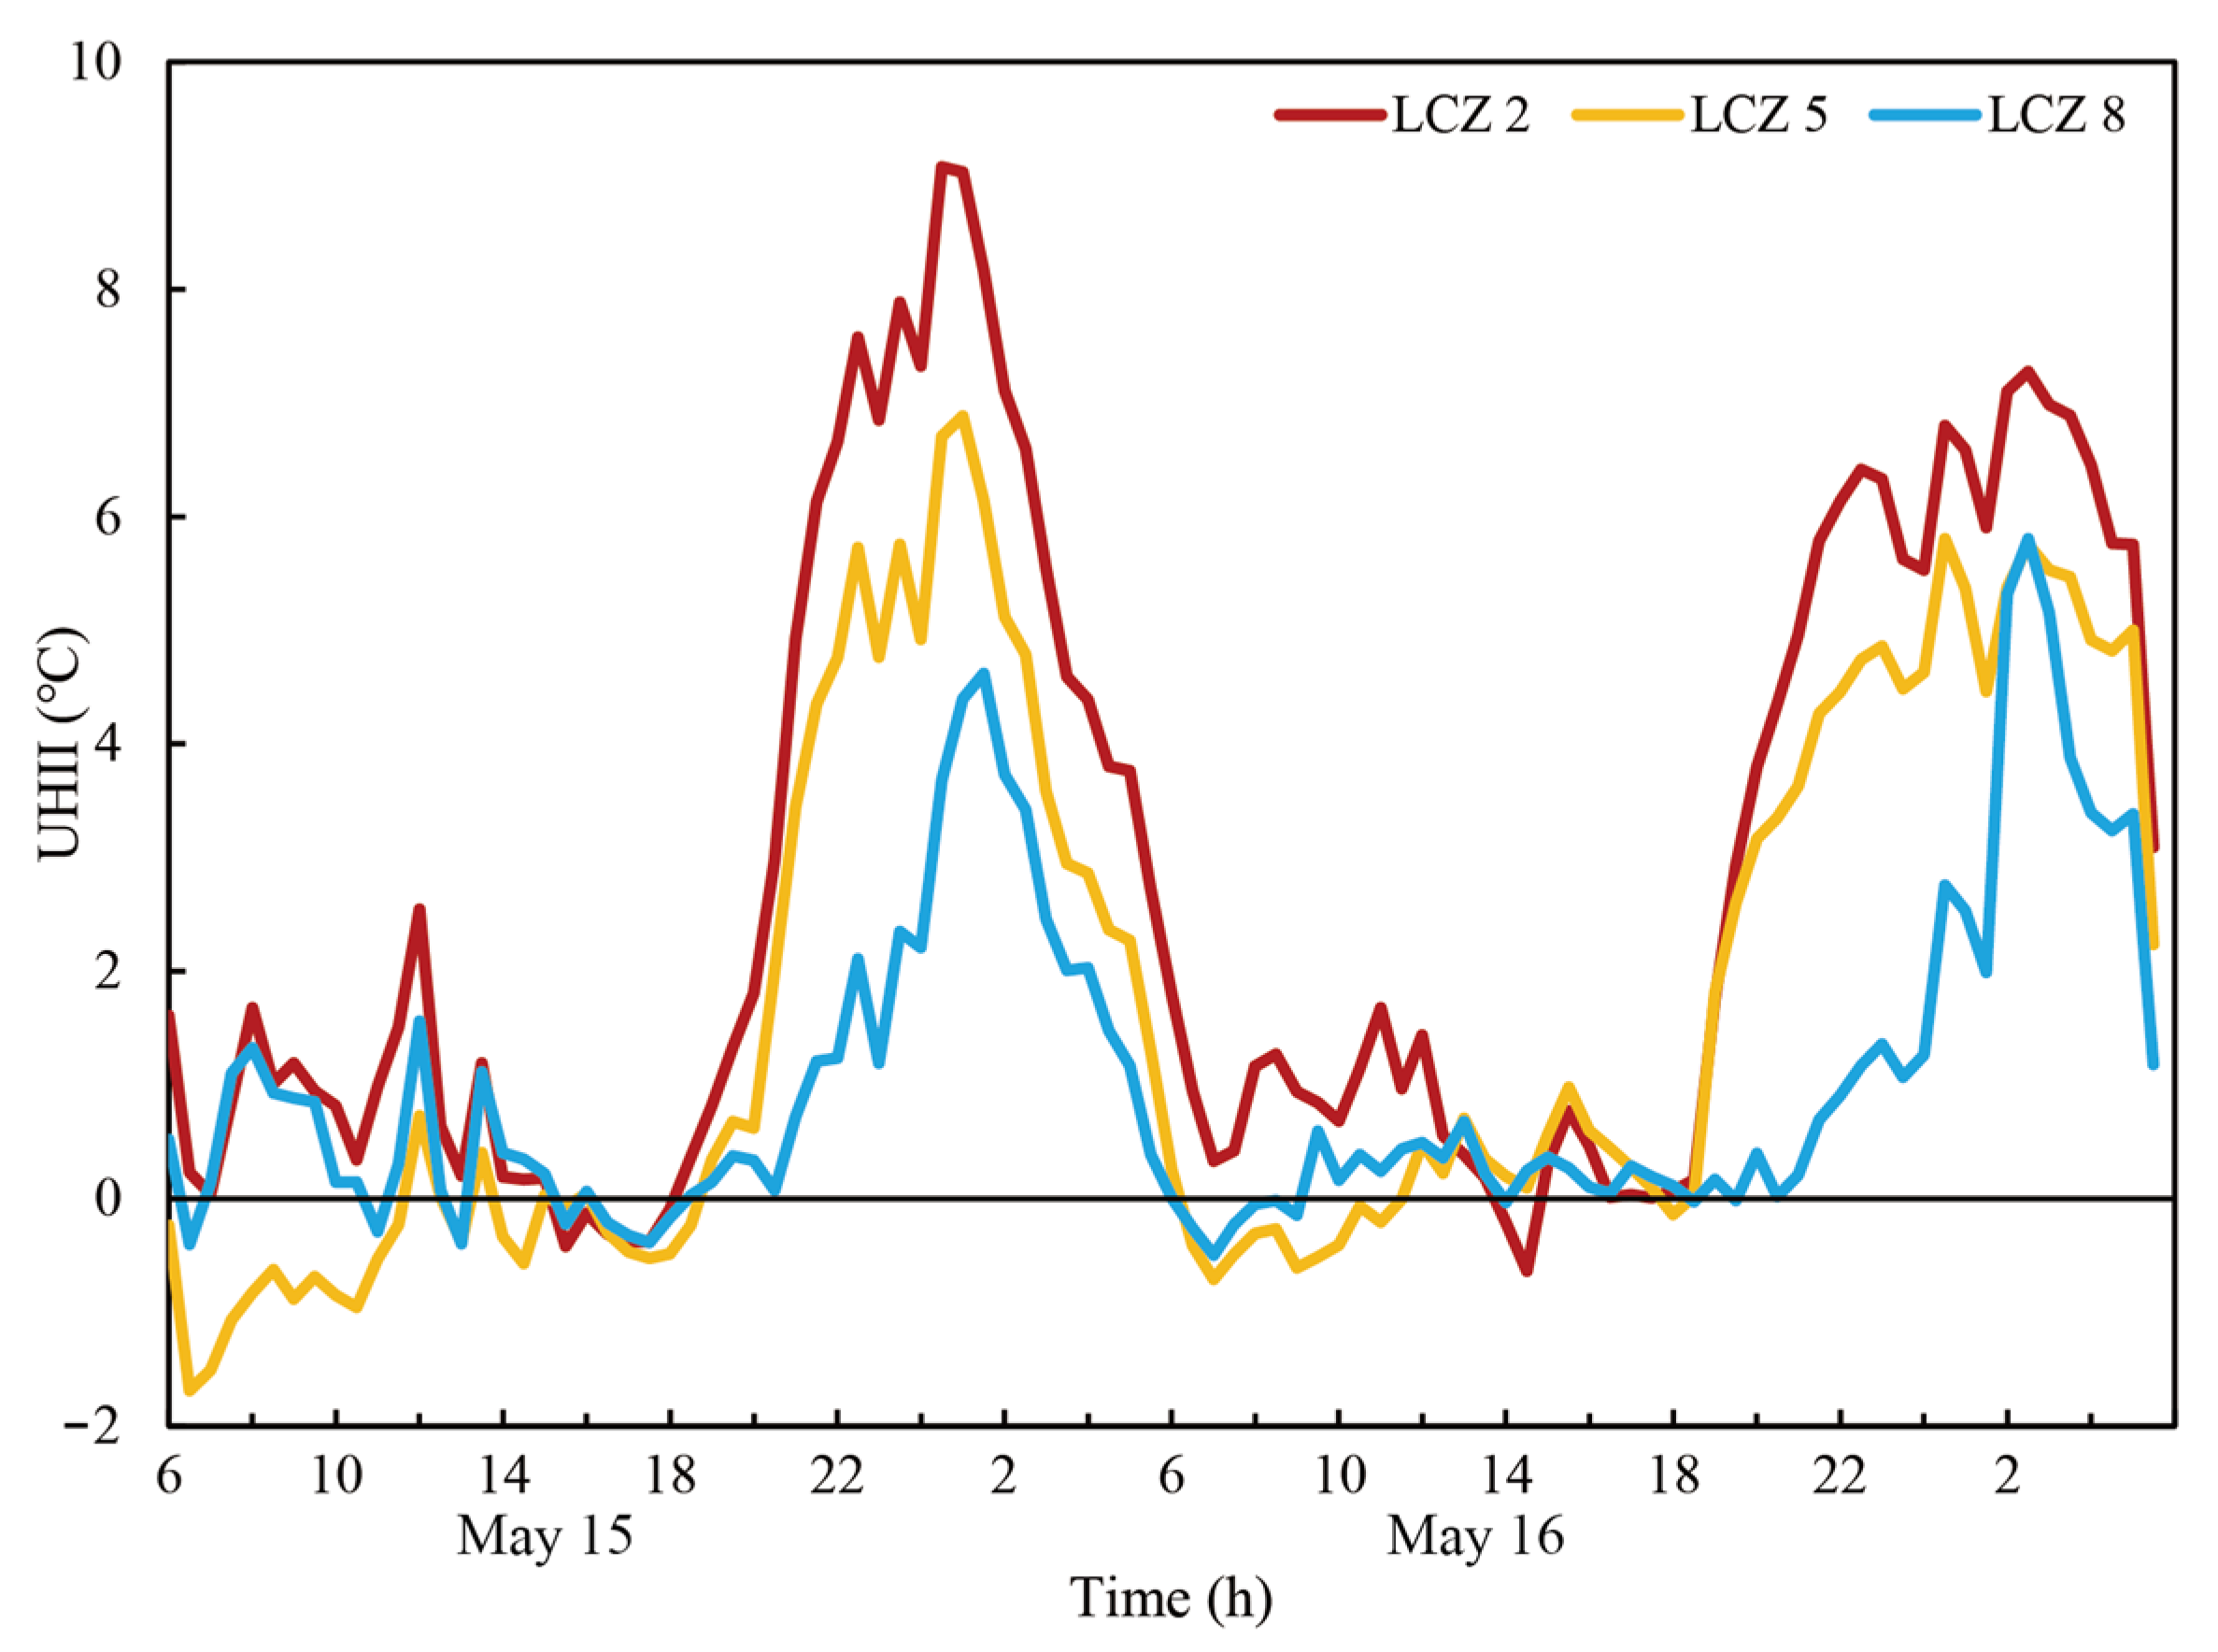
In order to analyze the influence of urban form on UHI more clearly, we selected three zones, LCZ 2 (compact midrise building area), LCZ 5 (open midrise building area), and LCZ 8 (large low-rise building area), as representatives of the comparative analysis of the UHII during the period of 15–16 May, and the results are shown in Figure 7. LCZs 2, 5, and 8 represent the construction intensities from the highest to the lowest, respectively. UHII is weak during the day and strong at night. The UHI effect appears from 18:00 to 6:00 the next day, while the UCI effect appears from 10:00 to 18:00, and UHII is obviously stronger than urban cold island intensity (UCII). At night, the UHII of the three plots changed consistently, reaching the peak value 5~7 h after sunset and then gradually decreasing. The UHII of the three plots is in the order LCZ2 > LCZ4 > LCZ8, and the maximum UHII can reach 9.08 °C, 6.88 °C, and 5.8 °C, respectively. The UHII of the LCZ8 plot is lower than that of the other two plots, because LCZs with high building density and a large impermeable area can accumulate more heat during the day and provide more ground long-wave radiation and turbulent sensible heat after sunset, which makes the urban temperature decrease after sunset for a period of time. After 18:00, the temperature difference in the suburbs begins to increase, making UHII reach the maximum at night, which reflects the law that the higher the building compactness, the stronger the UHI effect.
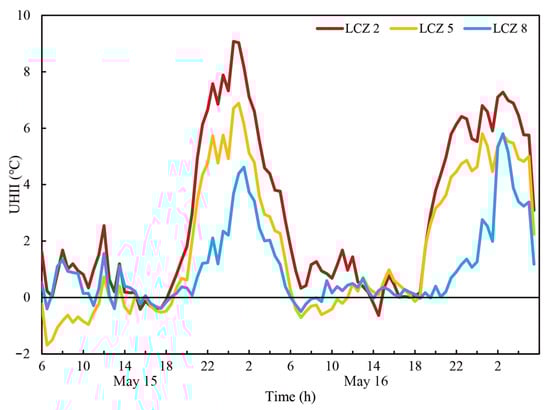
Figure 7.
LCZs 2, 5, and 8: hourly UHII diagrams.
4.2.2. Average Heat Island Intensity
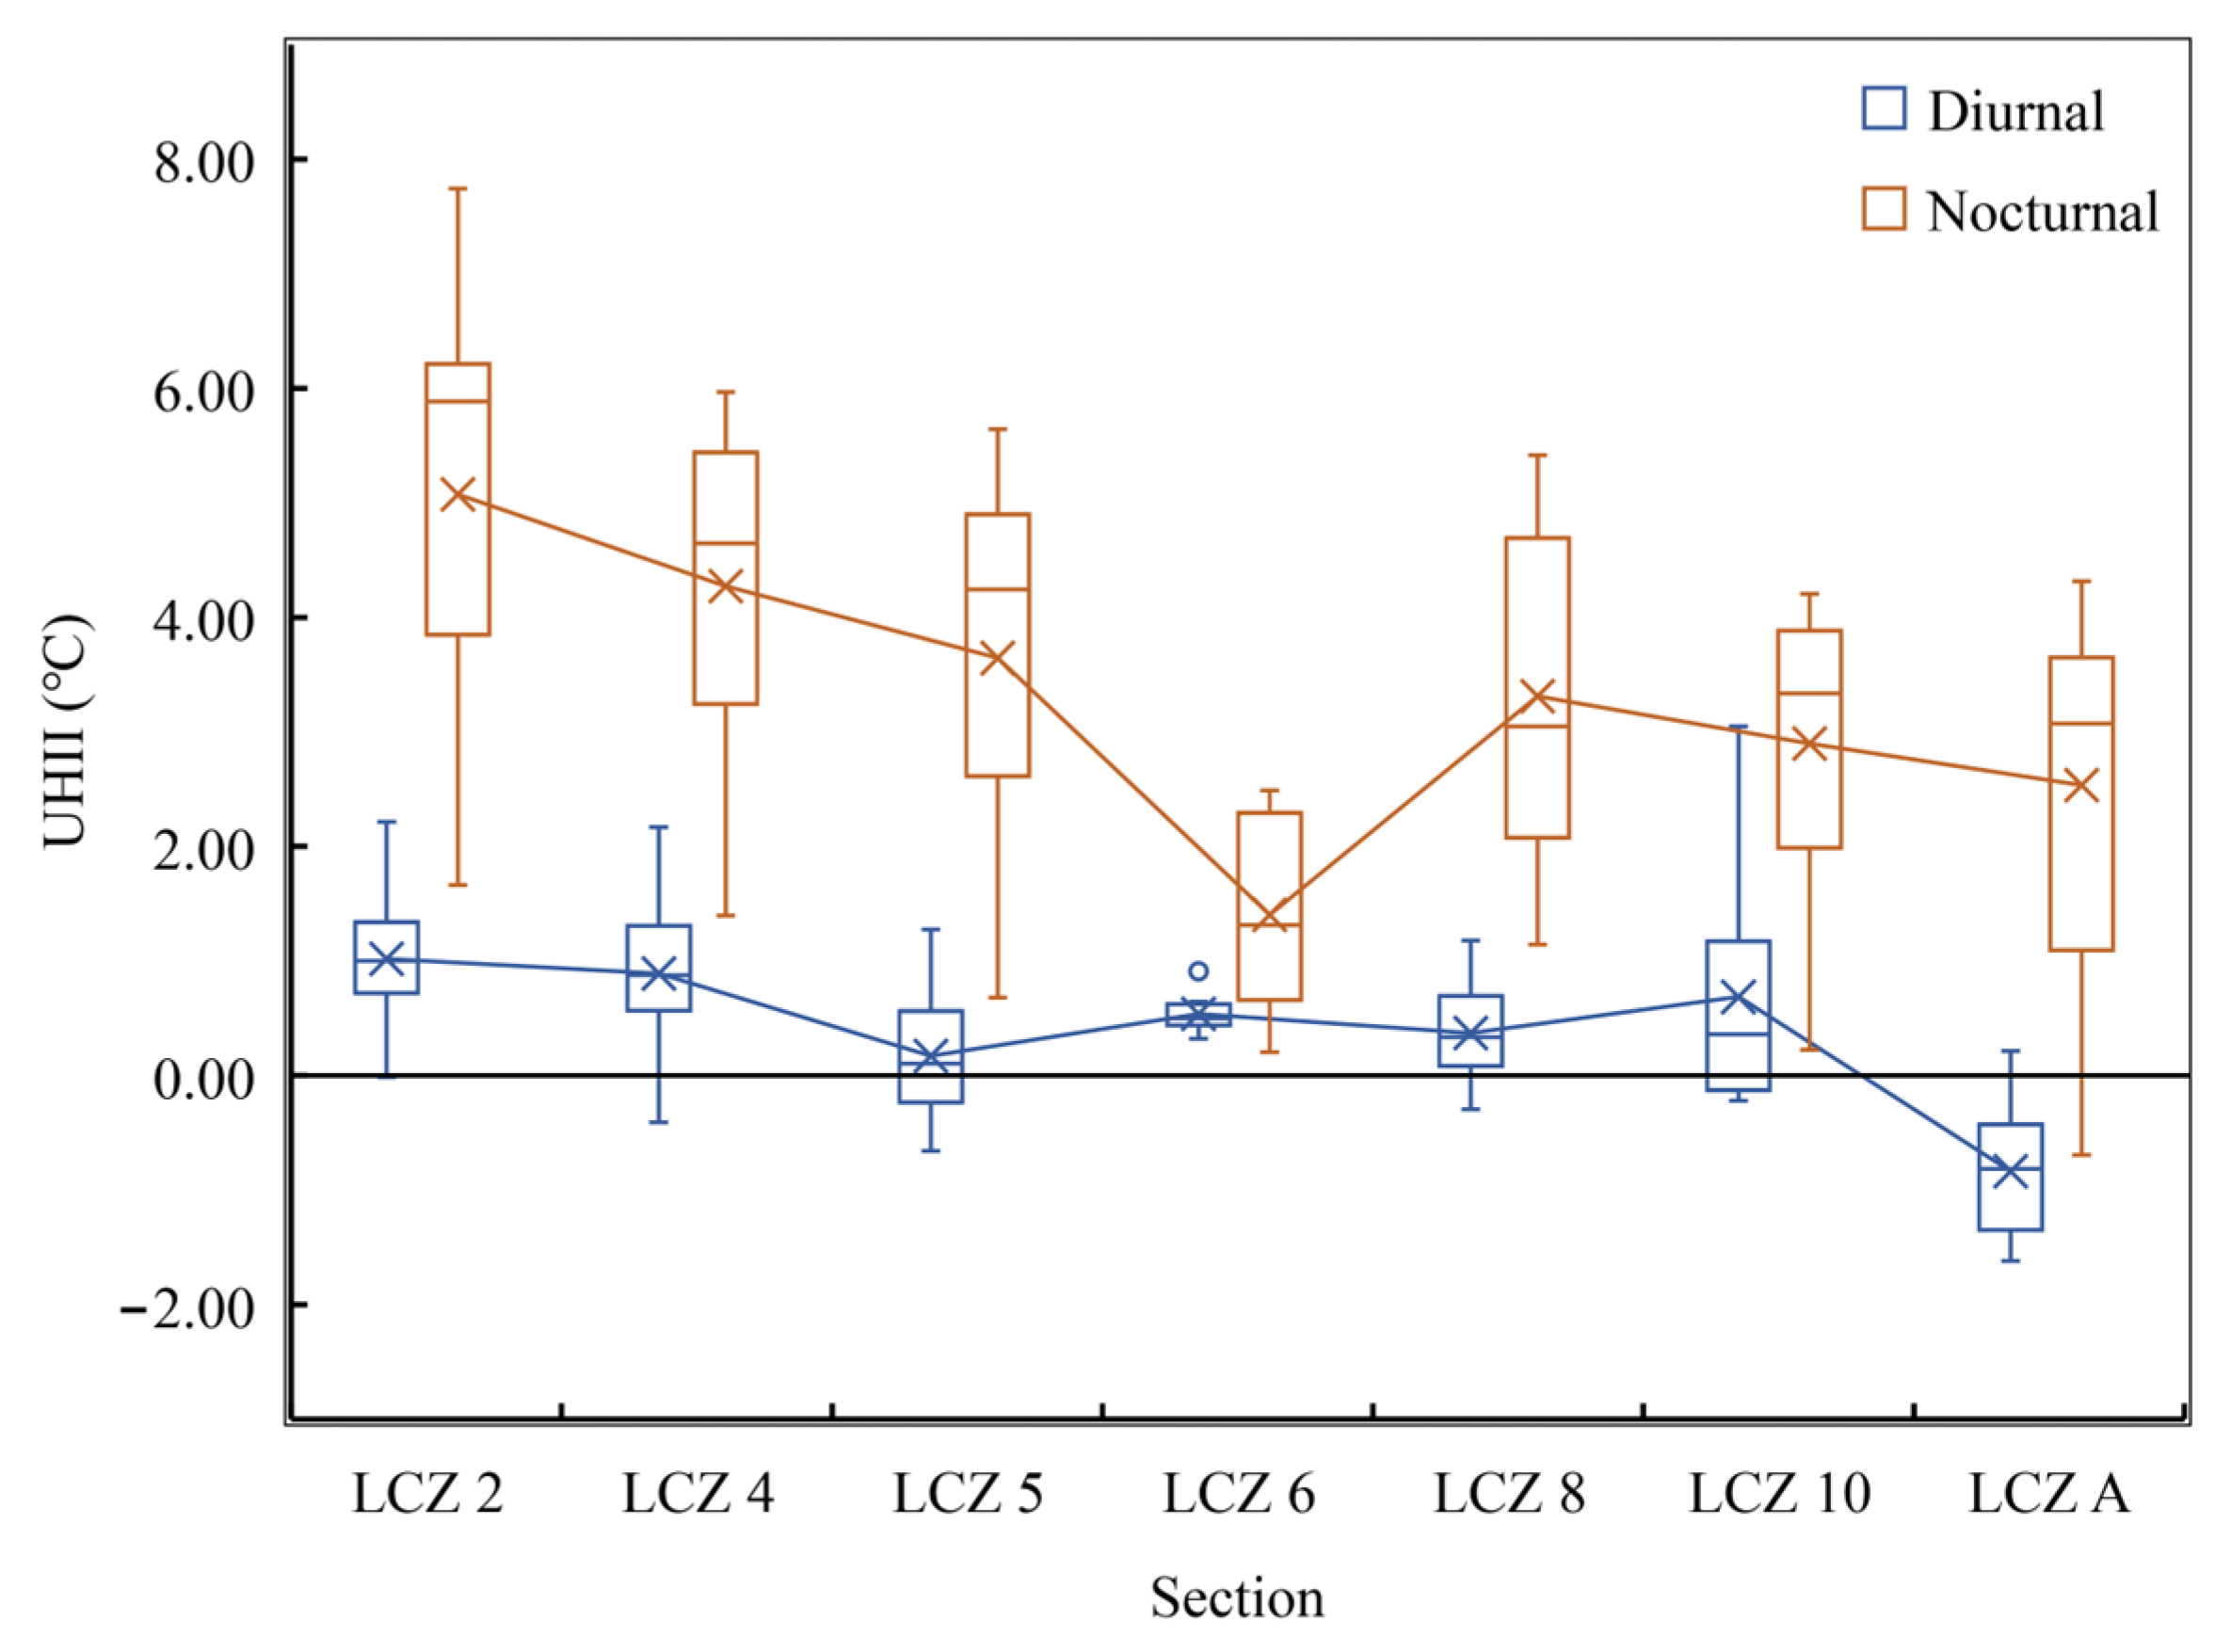
From the diurnal variation in UHII, it can be seen that the UHI effect is generally significant 2 h before and after 0:00, and the UCI effect is generally significant 2 h before and after 12:00. Therefore, the average UHII was analyzed at 10:00–14:00 during the day and 22:00–2:00 at night. The box plots of the average UHII of each LCZ plot for 12 typical meteorological days are shown in Figure 8.
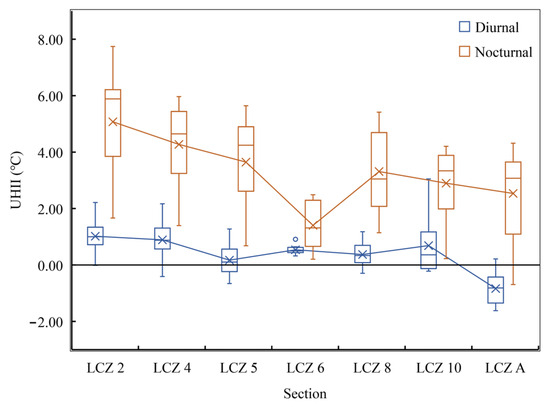
Figure 8.
Average UHII box plot of each LCZ. Circles indicate outliers.
In the daytime, the UHI effect of urban-type plots is not obvious and the difference is small; all its values are less than 1 °C. The maximum UHII of LCZ 10 (industrial heat removal) can reach 3.05 °C, and the overall UHI effect is higher than that of open building areas. The natural area of LCZ A has an obvious UCI effect, which is about −1 °C, indicating that a certain scale of urban forest parks can notably improve the urban thermal environment.
At night, the UHII of each LCZ plot is high and has an obvious difference in the order compact building area > open building area > large low-rise building area and industrial area. The average UHII of LCZ 2 in compact building areas is 5.07 °C, and that of open building areas (LCZ 4, LCZ 5) is 4.27 °C and 3.64 °C, respectively. The average UHII of LCZ 8 and LCZ 10 was lower than 3.3 °C, with LCZ 6 having the lowest average UHII of 1.4 °C. The UHII of LCZ A is also higher at night, which may be related to seasons. Further research can be carried out based on the aspects of vegetation type, ventilation, and layout.
4.3. Analysis of Warming and Cooling Rates
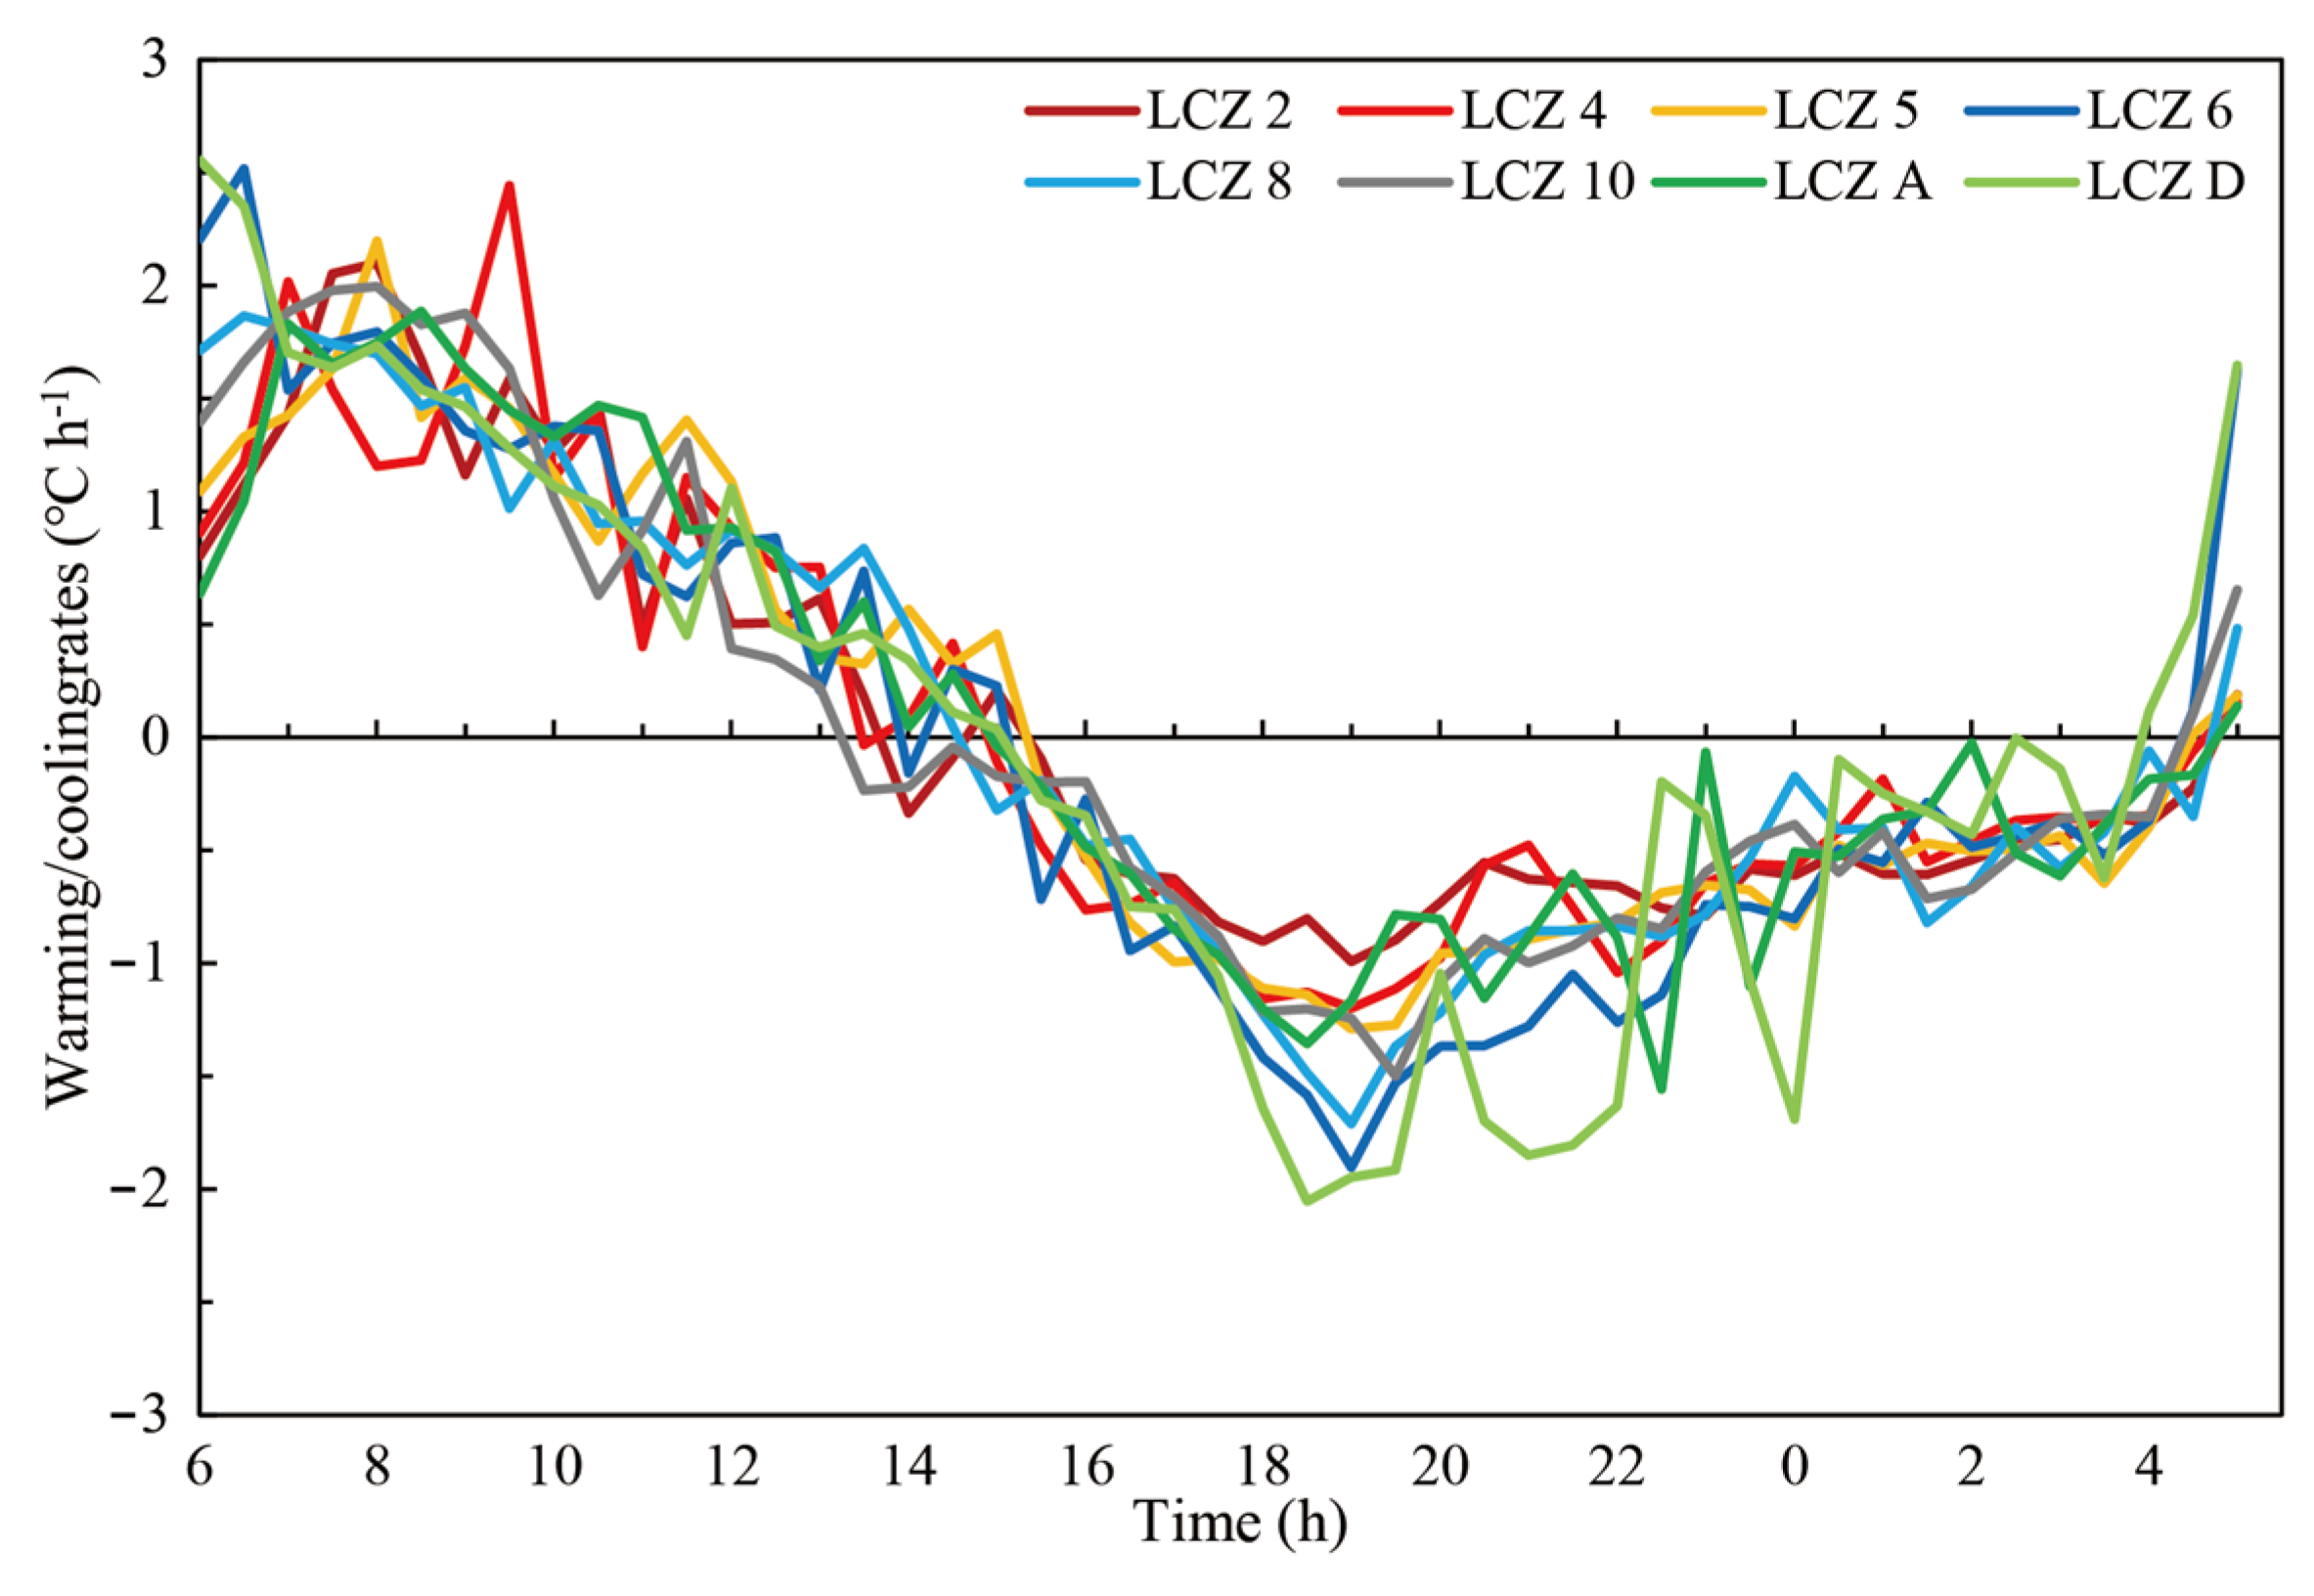
The difference in the UHI effect in different LCZ blocks is essentially caused by the difference in warming and cooling rates caused by the differences in architectural form, underlying surface properties, material structure, and human activities. The average hourly warming/cooling rate changes of the LCZs in 12 typical meteorological days are shown in Figure 9. It can be seen from Figure 9 that the temperature of each LCZ rises from 6:00 to 15:00, and the warming rate continues to rise during 6:00 to 8:00, and the plot heats up rapidly. From 8:00 to 15:00, the warming rate decreases, but it keeps heating up until it reaches the maximum at 15:00. During the period from 15:00 to 5:00 the next day, the temperature of each LCZ decreases, and during the period from 15:00 to 19:00, the cooling rate increases rapidly and the temperature decreases rapidly. From 19:00 to 5:00, the cooling rate gradually decreases to 0, reaching the lowest daily temperature.

Figure 9.
Average hourly temperature warming and cooling rate of each LCZ during typical meteorological days.
There are two periods with great difference in warming/cooling rate in each LCZ block. From 07:00 to 11:00, the warming rate of LCZs 2, 4, and 5 is lower than that of LCZ D, which indicates that the warming rate of the urban LCZ block is lower than that of LCZ D in daytime, which makes the difference in daily maximum temperature small and the intensity of the heat island effect weak in the daytime. From 19:00 to 1:00, the cooling rate of LCZD is obviously higher than that of other LCZ plots, which indicates that the suburban plots have a faster cooling rate at night, forming a UHI effect and gradually increasing. LCZ6 and LCZD have similar heating and cooling rates, which is consistent with the similar daily maximum temperature and daily minimum temperature of the two plots analyzed above.
Figure 9 shows that there is a corresponding relationship between the difference in warming and cooling rates in different blocks and the diurnal variation characteristics of air temperature in each LCZ in Figure 2, which preliminarily explains the diurnal variation law of the UHI effect. However, the mechanism and process of the UHI effect still need to be further discussed through the analysis of energy balance sub-terms.
5. Discussion
5.1. Formation Mechanism of the UCI Effect
To more systematically explain the formation mechanism of the daytime urban cold island (UCI) effect in Shenyang, we introduce the surface energy balance equation. This equation describes the energy exchange process between the surface and the atmosphere, enabling the quantification of the impact of different energy fluxes on surface temperature. The basic form of the surface energy balance equation is as follows:
where is the net radiation, representing the difference between the solar radiation received by the surface and the long-wave radiation emitted by the surface; is the sensible heat flux, representing the heat transferred from the surface to the atmosphere through turbulent processes; is the latent heat flux, representing the heat consumed by surface water evaporation or vegetation transpiration; is the ground heat storage, representing the heat absorbed and stored by surface materials (such as buildings, roads, and soil); is the anthropogenic heat flux, representing the heat generated by human activities (such as transportation, industry, and building energy consumption).
By analyzing Shenyang’s vegetation coverage, building density, and land use patterns, we find that during the daytime, solar radiation is the primary heat source. In areas with higher vegetation coverage (e.g., LCZ A), the transpiration of plants enhances the latent heat flux, consuming a significant amount of heat. This results in relatively lower net radiation flux in these areas, leading to slower temperature increases. Anthropogenic heat emissions are also a significant factor influencing the UCI phenomenon. In urban central areas, industrial production, transportation, and residential activities generate substantial anthropogenic heat, increasing the local sensible heat flux and raising urban temperatures. However, during the daytime, urban smog and building shading reduce solar radiation, partially offsetting the warming effect of anthropogenic heat emissions, thereby moderating the temperature rise in cities to some extent. In contrast, in open areas such as LCZ D, changes in ground heat storage are relatively significant. During the daytime, heat is rapidly transferred underground, and the large permeable area facilitates evaporative cooling, resulting in relatively lower temperatures in these regions.
Combining these factors, the UCI phenomenon forms in specific periods and regions. Through the analysis of the surface energy balance equation, we gain a deeper understanding of the mechanisms behind the UCI phenomenon in Shenyang’s urban heat island effect, providing more scientific theoretical support for further research on urban thermal environment changes.
5.2. Comparison with Previous Studies
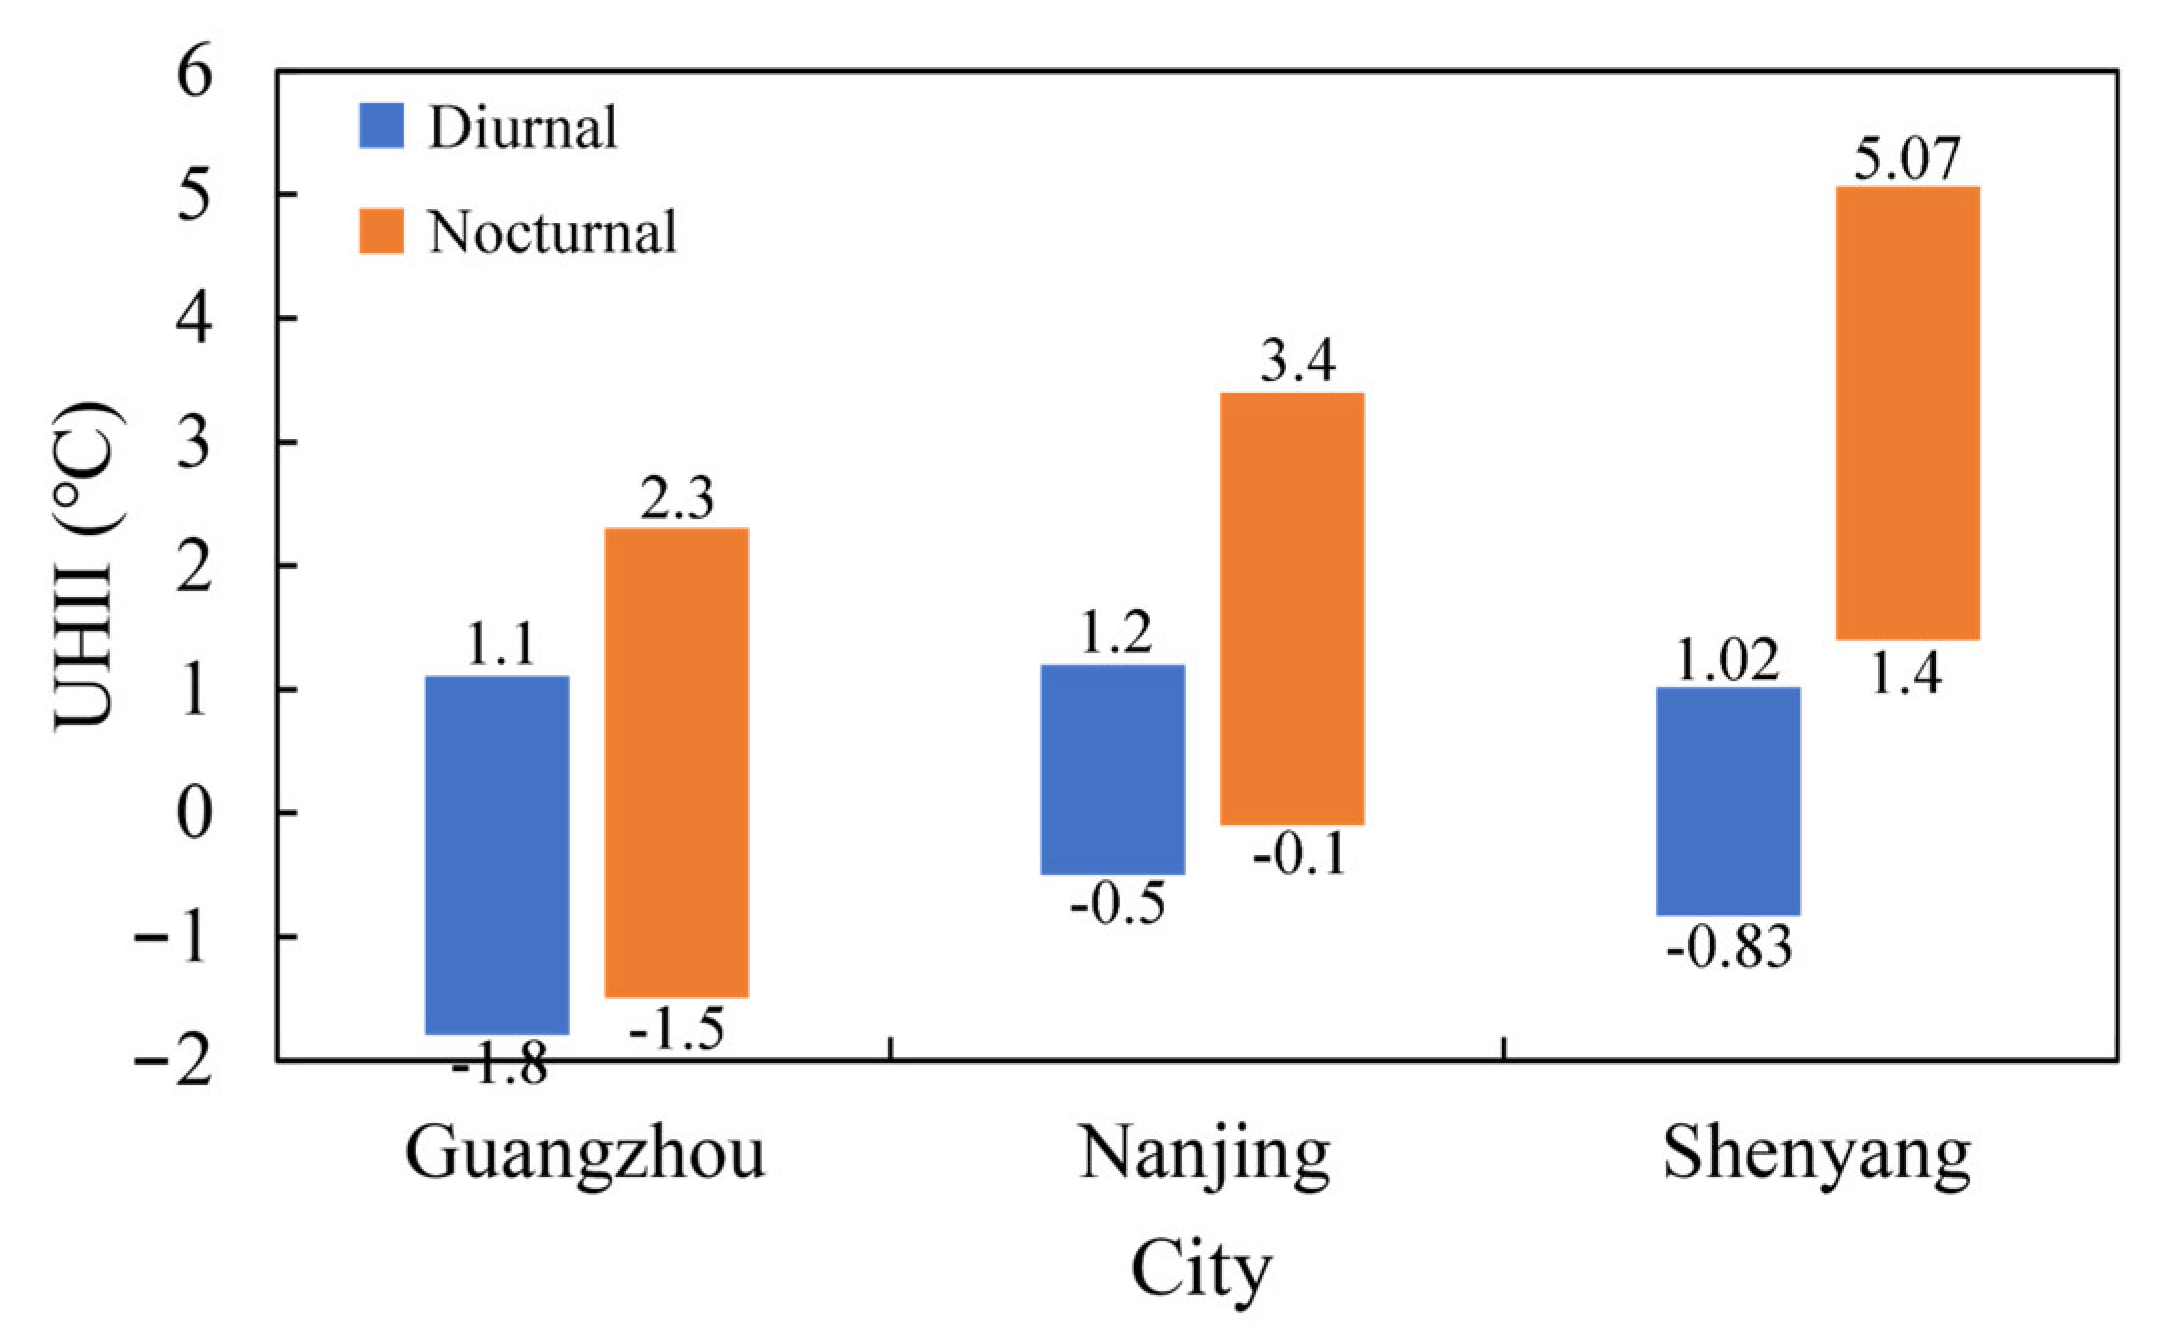
Our research in Shenyang supports the LCZ classification scheme. We compare this study with Yang et al. [63] in Nanjing and Chen et al. [64] in Guangzhou. The indicators related to the degree of urbanization of the three cities are shown in Table 4. The three cities have similar city sizes.
Table 4.
Comparison of urbanization degree of three cities.
In this study, we chose the same fixed-point measurement method as the previous study and screened typical meteorological days with few clouds and weak winds. The study period of Nanjing and Guangzhou is summer, while that of Shenyang is the transitional season. Although the study periods differ, this research primarily focuses on the characteristics of the urban heat island effect across different LCZ types under similar meteorological conditions. Given that Shenyang, Nanjing, and Guangzhou share certain similarities in seasonal climate variations, the comparison of data from different periods still holds reference value. It can reflect both the commonalities and differences in urban heat island effects across these cities. The temperature on typical meteorological days in Guangzhou is about 25–38 °C, which is higher than 6.42–35.34 °C in Shenyang. However, for the temperature difference among different LCZ plots, the three cities show similarity, which is generally small during the day and large at night, and, roughly, the higher the building density in the plot, the higher the temperature.
In terms of the difference between daily maximum temperature and minimum temperature, Nanjing, Guangzhou, and Shenyang show similar patterns; that is, the difference in the daily minimum temperature in LCZ plots is significantly higher than that in maximum temperature. In the study of Nanjing and Guangzhou, the daily maximum temperature difference and minimum temperature difference of LCZ A are both negative, showing the cooling effect [58]. However, in the study conducted in Shenyang, the daily minimum temperature difference in LCZ A exceeds 1 °C. This discrepancy may be attributed to Shenyang’s unique climate and vegetation types. As Shenyang is located in a severe cold region, the vegetation in LCZ A may exhibit distinct characteristics, thereby influencing the heat exchange process. Further in-depth research is needed to explore this phenomenon.
In terms of UHI, the diurnal variation law of UHII in the three cities is similar, which weakens after sunrise, is the weakest at noon, and gradually strengthens after sunset. In the study of Nanjing and Guangzhou, the maximum UHII is reached 3–5 h after sunset; the maximum UHII in Nanjing is 5.2 °C, while the maximum UHII in Guangzhou is higher than 4 °C. In contrast, Shenyang reaches the maximum UHII 3–7 h after sunset, and the maximum can reach 9.08 °C. The time of occurrence of the maximum UHII is more differentiated, and the maximum UHII is much larger than that of Nanjing and Guangzhou.
The average UHII ranges of the three cities are shown in Figure 10, which shows that the daytime UHII of Shenyang city in the transition season is not much different from that of Nanjing and Guangzhou, and the nighttime UHII is much larger than the summer nighttime UHII of Nanjing and Guangzhou. For the differences among different LCZ plots, the three cities show similarity. In the daytime, the UHI effect of urban plots is not obvious and the difference is small. At night, the UHII of each LCZ plot is high and has an obvious difference, in the order of compact building area > open building area > large low-rise building area and industrial area.

Figure 10.
Average UHII range of three cities.
5.3. Limitations and Perspectives
Compared to meteorological station data, field-measured meteorological data from different LCZs can more accurately and finely reflect the microclimate conditions of specific areas. In assessing energy consumption, such data hold irreplaceable significance, whether in revealing regional differences, optimizing building energy simulations, or formulating targeted strategies. In a study by Yang et al. [46], using Nanjing, China, as a case study, the Local Climate Zone (LCZ) scheme was employed to select 10 urban sites and 3 suburban meteorological stations. Hourly temperature and relative humidity were measured continuously over three years to analyze the temperature differences between LCZ sites and suburban areas. The data were then used in building energy consumption simulations to study the impact of neighborhood-scale urban heat islands (UHIs) on the energy demands of residential and office buildings. The results of the study emphasized the importance of developing location-specific climate data for evaluating urban building energy performance.
The meteorological data obtained from different LCZs in this study reveal significant variations in the heat island effect across urban areas, which also leads to considerable differences in energy consumption. While meteorological station data cover a wide area and represent average conditions over larger regions, they fail to capture the subtle climatic differences within different LCZs in the city. Field-measured data can more precisely reflect the impact of microclimates in various LCZs on building energy consumption, avoiding errors caused by using averaged meteorological station data. Furthermore, field-measured LCZ meteorological data can provide more accurate input parameters for simulations, making the results closer to the actual energy consumption of buildings under real microclimatic conditions. Through simulations, the energy consumption characteristics of buildings in different LCZs can be analyzed in depth, offering more targeted recommendations for building energy-efficient design and retrofitting.
However, our study also has some limitations. The measurement period only covered the transitional seasons in Shenyang, which may not fully represent the urban heat island effects across different seasons. Additionally, due to measurement constraints, some thermal environment indicators, such as surface admittance, surface albedo, and anthropogenic heat flux, were not obtained. These limitations may affect a comprehensive understanding of the mechanisms behind urban heat island effects. Future research will extend the measurement period to cover different seasons, improve measurement methods to obtain more comprehensive thermal environment indicators, and apply them in energy consumption simulations. It is vital to thoroughly discern the impacts of different LCZ land uses and covers on building heating and cooling energy consumption, optimize urban land use, improve energy efficiency, and provide references for urban energy planning and policy-making.
6. Conclusions
Although the significant impact of the UHI effect on urban energy demand and building energy consumption is widely recognized, research on quantifying its impact through building energy consumption simulations remains insufficient. To achieve more accurate building energy consumption simulations in different regions, it is necessary to supplement meteorological data such as temperature, both with and without the UHI effect, in order to construct a comprehensive simulation dataset. The studies of LCZ provide meteorological data with and without the UHI effect, helping to explore the thermal characteristics of different LCZ types and apply these data to urban energy consumption and building energy efficiency simulation.
UHI research based on LCZ in severe cold regions is relatively scarce. This study focuses on investigating the UHI effect in Shenyang, a city in a severe cold region, using the LCZ theory to address the gaps in relevant data and analyses for Shenyang. The study validates the applicability of the LCZ theory under different climatic conditions and analyzes the UHI effect across various LCZs within the urban area. Using fixed-point measurement, the air temperature of eight selected LCZ measuring sites in Shenyang was collected from 27 April to 30 June 2024, and the UHII characteristics of LCZs under typical weather conditions were evaluated. The temperature difference between LCZ classes was examined on multiple time scales, and the warming and cooling rates of LCZ classes were evaluated.
The results show that there are significant differences in thermal environment characteristics among different LCZ types in Shenyang, which are closely related to their surface structure and land cover characteristics. Through the analysis of hourly temperature and UHII on typical meteorological days in Shenyang, it is found that the UHI effect is most significant at night, while the UCI phenomenon may occur during the day. This rule is consistent with previous research results, which further verifies the effectiveness of the LCZ classification method. In addition, this study also found that building density and underlying surface properties have an important impact on the formation of the UHI effect. The higher the building density, the smaller the permeable area and the stronger the UHI effect. Comparing the results of this study with those of Nanjing and Guangzhou, it was found that the differences between the different LCZ plots in the three cities showed similarities, but the nighttime UHII in Shenyang was much larger than the summer nighttime UHII in Nanjing and Guangzhou.
The results of this study provide a scientific basis for urban planning and climate change adaptation and further verify the effectiveness of the LCZ classification method in severe cold areas. The climate data with the UHI effect obtained in this study can be applied to urban energy consumption and building energy efficiency simulations. Future research can further explore the characteristics of LCZ thermal environments under different seasons and climatic conditions and the influence of different urban forms on the UHI effect.
Author Contributions
Conceptualization, T.X. and J.L.; methodology, J.L. and N.Y.; software, J.L. and X.L.; validation, T.X., J.L. and F.G.; formal analysis, T.X., J.L. and N.Y.; investigation, J.L., N.Y. and X.L.; resources, J.L.; data curation, T.X. and J.L.; writing—original draft preparation, J.L. and N.Y.; writing—review and editing, T.X., J.L. and N.Y.; visualization, T.X., J.L. and N.Y.; supervision, T.X. and J.L.; project administration, T.X. and F.G.; funding acquisition, T.X. All authors have read and agreed to the published version of the manuscript.
Funding
This work was financially supported by the Liaoning Social Science Planning Fund Project (grant number: L22CGL012), the Fundamental Research Program of the Education Department of Liaoning Province (grant number: LJKQZ2021006), and the Fundamental Research Funds for the Central Universities (grant number: N2311002).
Data Availability Statement
The data presented in this study are available on request from the authors.
Conflicts of Interest
The authors declare no conflicts of interest.
References
- United Nations Report: Carbon Emissions from Buildings and Construction Reach Historic Highs. Available online: https://news.un.org/zh/story/2022/11/1112252/ (accessed on 30 November 2024).
- Singh, M.; Sharston, R. Quantifying the dualistic nature of urban heat Island effect (UHI) on building energy consumption. Energy Build. 2022, 255, 111649. [Google Scholar] [CrossRef]
- Manley, G. On the frequency of snowfall in metropolitan England. Q. J. R. Meteorol. Soc. 1958, 84, 70–72. [Google Scholar] [CrossRef]
- Howard, L. The Climate of London: Deduced from Meteorological Observations; Cambridge University Press: Cambridge, UK, 2012; Volume 1. [Google Scholar]
- Li, X.; Zhou, Y.; Asrar, G.R.; Imhoff, M.; Li, X. The surface urban heat island response to urban expansion: A panel analysis for the conterminous United States. Sci. Total Environ. 2017, 605, 426–435. [Google Scholar] [CrossRef] [PubMed]
- Magli, S.; Lodi, C.; Lombroso, L.; Muscio, A.; Teggi, S. Analysis of the urban heat island effects on building energy consumption. Int. J. Energy Environ. Eng. 2015, 6, 91–99. [Google Scholar] [CrossRef]
- Su, M.A.; Ngarambe, J.; Santamouris, M.; Yun, G.Y. Empirical evidence on the impact of urban overheating on building cooling and heating energy consumption. iScience 2021, 24, 102495. [Google Scholar] [CrossRef]
- Li, X.; Zhou, Y.; Yu, S.; Jia, G.; Li, H.; Li, W. Urban heat island impacts on building energy consumption: A review of approaches and findings. Energy 2019, 174, 407–419. [Google Scholar] [CrossRef]
- Chan, A. Developing a modified typical meteorological year weather file for Hong Kong taking into account the urban heat island effect. Build. Environ. 2011, 46, 2434–2441. [Google Scholar] [CrossRef]
- Hirano, Y.; Fujita, T. Evaluation of the impact of the urban heat island on residential and commercial energy consumption in Tokyo. Energy 2012, 37, 371–383. [Google Scholar] [CrossRef]
- Guattari, C.; Evangelisti, L.; Balaras, C.A. On the assessment of urban heat island phenomenon and its effects on building energy performance: A case study of Rome (Italy). Energy Build. 2018, 158, 605–615. [Google Scholar] [CrossRef]
- Santamouris, M.; Papanikolaou, N.; Livada, I.; Koronakis, I.; Georgakis, C.; Argiriou, A.; Assimakopoulos, D. On the impact of urban climate on the energy consumption of buildings. Sol. Energy 2001, 70, 201–216. [Google Scholar] [CrossRef]
- Ignatius, M.; Wong, N.H.; Jusuf, S.K. The significance of using local predicted temperature for cooling load simulation in the tropics. Energy Build. 2016, 118, 57–69. [Google Scholar] [CrossRef]
- Kolokotroni, M.; Ren, X.; Davies, M.; Mavrogianni, A. London’s urban heat island: Impact on current and future energy consumption in office buildings. Energy Build. 2012, 47, 302–311. [Google Scholar] [CrossRef]
- Zinzi, M.; Carnielo, E. Impact of urban temperatures on energy performance and thermal comfort in residential buildings. The case of Rome, Italy. Energy Build. 2017, 157, 20–29. [Google Scholar] [CrossRef]
- Stewart, I.D.; Oke, T.R. Local climate zones for urban temperature studies. Bull. Am. Meteorol. Soc. 2012, 93, 1879–1900. [Google Scholar] [CrossRef]
- Lowry, W.P. Empirical estimation of urban effects on climate: A problem analysis. J. Appl. Meteorol. Climatol. 1977, 16, 129–135. [Google Scholar] [CrossRef]
- Stewart, I.D. Redefining the Urban Heat Island; University of British Columbia: Vancouver, BC, Canada, 2011. [Google Scholar]
- Stewart, I.D. A systematic review and scientific critique of methodology in modern urban heat island literature. Int. J. Climatol. 2011, 31, 200–217. [Google Scholar] [CrossRef]
- Feng, W.; Liu, J. A literature survey of local climate zone classification: Status, application, and prospect. Buildings 2022, 12, 1693. [Google Scholar] [CrossRef]
- Aslam, A.; Rana, I.A. The use of local climate zones in the urban environment: A systematic review of data sources, methods, and themes. Urban Clim. 2022, 42, 101120. [Google Scholar] [CrossRef]
- Bechtel, B.; Alexander, P.J.; Böhner, J.; Ching, J.; Conrad, O.; Feddema, J.; Mills, G.; See, L.; Stewart, I. Mapping local climate zones for a worldwide database of the form and function of cities. ISPRS Int. J. Geo-Inf. 2015, 4, 199–219. [Google Scholar] [CrossRef]
- Demuzere, M.; Kittner, J.; Generator, B.B.L. A web application to create Local Climate Zone maps. Front. Environ. Sci. 2021, 9, 637455. [Google Scholar] [CrossRef]
- Cai, M.; Ren, C.; Xu, Y.; Lau, K.K.-L.; Wang, R. Investigating the relationship between local climate zone and land surface temperature using an improved WUDAPT methodology—A case study of Yangtze River Delta, China. Urban Clim. 2018, 24, 485–502. [Google Scholar] [CrossRef]
- Yu, W.; Yang, J.; Wu, F.; He, B.; Yu, H.; Ren, J.; Xiao, X.; Xia, J.C. Downscaling mapping method for local climate zones from the perspective of deep learning. Urban Clim. 2023, 49, 101500. [Google Scholar] [CrossRef]
- Middel, A.; Häb, K.; Brazel, A.J.; Martin, C.A.; Guhathakurta, S. Impact of urban form and design on mid-afternoon microclimate in Phoenix Local Climate Zones. Landsc. Urban Plan. 2014, 122, 16–28. [Google Scholar] [CrossRef]
- Yang, J.; Jin, S.; Xiao, X.; Jin, C.; Xia, J.C.; Li, X.; Wang, S. Local climate zone ventilation and urban land surface temperatures: Towards a performance-based and wind-sensitive planning proposal in megacities. Sustain. Cities Soc. 2019, 47, 101487. [Google Scholar] [CrossRef]
- Chen, X.; Xu, Y.; Yang, J.; Wu, Z.; Zhu, H. Remote sensing of urban thermal environments within local climate zones: A case study of two high-density subtropical Chinese cities. Urban Clim. 2020, 31, 100568. [Google Scholar] [CrossRef]
- Shi, Y.; Ren, C.; Lau, K.K.-L.; Ng, E. Investigating the influence of urban land use and landscape pattern on PM2.5 spatial variation using mobile monitoring and WUDAPT. Landsc. Urban Plan. 2019, 189, 15–26. [Google Scholar] [CrossRef]
- Geletič, J.; Lehnert, M.; Dobrovolný, P. Land surface temperature differences within local climate zones, based on two central European cities. Remote Sens. 2016, 8, 788. [Google Scholar] [CrossRef]
- Zhou, X.; Okaze, T.; Ren, C.; Cai, M.; Ishida, Y.; Watanabe, H.; Mochida, A. Evaluation of urban heat islands using local climate zones and the influence of sea-land breeze. Sustain. Cities Soc. 2020, 55, 102060. [Google Scholar] [CrossRef]
- Stewart, I.D.; Oke, T.R.; Krayenhoff, E.S. Evaluation of the ‘local climate zone’ scheme using temperature observations and model simulations. Int. J. Climatol. 2014, 34, 1062–1080. [Google Scholar] [CrossRef]
- Anjos, M.; Targino, A.C.; Krecl, P.; Oukawa, G.Y.; Braga, R.F. Analysis of the urban heat island under different synoptic patterns using local climate zones. Build. Environ. 2020, 185, 107268. [Google Scholar] [CrossRef]
- Dunjić, J.; Milošević, D.; Kojić, M.; Savić, S.; Lužanin, Z.; Šećerov, I.; Arsenović, D. Air humidity characteristics in “local climate zones” of Novi Sad (Serbia) based on long-term data. ISPRS Int. J. Geo-Inf. 2021, 10, 810. [Google Scholar] [CrossRef]
- Alexander, P.J.; Mills, G. Local climate classification and Dublin’s urban heat island. Atmosphere 2014, 5, 755–774. [Google Scholar] [CrossRef]
- Leconte, F.; Bouyer, J.; Claverie, R.; Pétrissans, M. Using Local Climate Zone scheme for UHI assessment: Evaluation of the method using mobile measurements. Build. Environ. 2015, 83, 39–49. [Google Scholar] [CrossRef]
- Kotharkar, R.; Ghosh, A.; Kapoor, S.; Reddy, D.G.K. Approach to local climate zone based energy consumption assessment in an Indian city. Energy Build. 2022, 259, 111835. [Google Scholar] [CrossRef]
- Wang, Z.; Xing, W.; Huang, Y.; Xie, T. Studying the Urban Heat Island Using a Local Climate Zone Scheme. Pol. J. Environ. Stud. 2016, 25, 2609–2616. [Google Scholar] [CrossRef]
- Yang, X.; Yao, L.; Jin, T.; Peng, L.L.; Jiang, Z.; Hu, Z.; Ye, Y. Assessing the thermal behavior of different local climate zones in the Nanjing metropolis, China. Build. Environ. 2018, 137, 171–184. [Google Scholar] [CrossRef]
- Chen, G.; Chen, Y.; Tan, X.; Zhao, L.; Cai, Y.; Li, L. Assessing the urban heat island effect of different local climate zones in Guangzhou, China. Build. Environ. 2023, 244, 110770. [Google Scholar] [CrossRef]
- Bansal, P.; Quan, S.J. Relationships between building characteristics, urban form and building energy use in different local climate zone contexts: An empirical study in Seoul. Energy Build. 2022, 272, 112335. [Google Scholar] [CrossRef]
- Benjamin, K.; Luo, Z.; Wang, X. Crowdsourcing Urban Air Temperature Data for Estimating Urban Heat Island and Building Heating/Cooling Load in London. Energies 2021, 14, 5208. [Google Scholar] [CrossRef]
- Du, R.; Liu, C.-H.; Li, X.-X.; Lin, C.-Y. Effect of local climate zone (LCZ) and building category (BC) classification on the simulation of urban climate and air-conditioning load in Hong Kong. Energy 2023, 271, 127004. [Google Scholar] [CrossRef]
- Verichev, K.; Salazar-Concha, C.; Díaz-López, C.; Carpio, M. The influence of the urban heat island effect on the energy performance of residential buildings in a city with an oceanic climate during the summer period: Case of Valdivia, Chile. Sustain. Cities Soc. 2023, 97, 104766. [Google Scholar] [CrossRef]
- Shi, L.; Luo, Z.; Matthews, W.; Wang, Z.; Li, Y.; Liu, J. Impacts of urban microclimate on summertime sensible and latent energy demand for cooling in residential buildings of Hong Kong. Energy 2019, 189, 116208. [Google Scholar] [CrossRef]
- Yang, X.; Peng, L.L.H.; Jiang, Z.; Chen, Y.; Yao, L.; He, Y.; Xu, T. Impact of urban heat island on energy demand in buildings: Local climate zones in Nanjing. Appl. Energy 2020, 260, 114279. [Google Scholar] [CrossRef]
- Yang, X.; Yao, L.; Peng, L.L.H.; Jiang, Z.; Jin, T.; Zhao, L. Evaluation of a diagnostic equation for the daily maximum urban heat island intensity and its application to building energy simulations. Energy Build. 2019, 193, 160–173. [Google Scholar] [CrossRef]
- Shenyang Bureau of Statistics. 2023 Shenyang Statistical Yearbook; Shenyang Bureau of Statistics: Shenyang, China, 2023.
- Atlas, W. Weather Atlas. Available online: https://www.weather-atlas.com/zh/china/shenyang-climate#temperature (accessed on 20 April 2024).
- Ching, J.; Mills, G.; Bechtel, B.; See, L.; Feddema, J.; Wang, X.; Ren, C.; Brousse, O.; Martilli, A.; Neophytou, M.; et al. WUDAPT: An Urban Weather, Climate, and Environmental Modeling Infrastructure for the Anthropocene. Bull. Am. Meteorol. Soc. 2018, 99, 1907–1924. [Google Scholar] [CrossRef]
- Oke, T.R. Initial Guidance to Obtain Representative Meteorological Observations at Urban Sites; World Meteorological Organization: Geneva, Switzerland, 2004; Volume 81. [Google Scholar]
- China Meteorological Data Service Centre. Available online: https://data.cma.cn/en (accessed on 20 April 2024).
- Oke, T. An algorithmic scheme to estimate hourly heat island magnitude. In Proceedings of the Second Symposium on Urban Environment, Albuquerque, NM, USA, 2–5 November 1998; pp. 80–83. [Google Scholar]
- Oke, T.R. Boundary Layer Climates; Routledge: London, UK, 2002. [Google Scholar]
- Runnalls, K.; Oke, T. Dynamics and controls of the near-surface heat island of Vancouver British, Columbia. Phys. Geogr. 2000, 21, 283–304. [Google Scholar] [CrossRef]
- Skarbit, N.; Stewart, I.D.; Unger, J.; Gál, T. Employing an urban meteorological network to monitor air temperature conditions in the ‘local climate zones’ of Szeged, Hungary. Int. J. Climatol. 2017, 37, 582–596. [Google Scholar] [CrossRef]
- Oke, T.R. City size and the urban heat island. Atmos. Environ. (1967) 1973, 7, 769–779. [Google Scholar] [CrossRef]
- Chieppa, J.; Bush, A.; Mitra, C. Using “Local Climate Zones” to Detect Urban Heat Island on Two Small Cities in Alabama. Earth Interact. 2018, 22, 1–22. [Google Scholar] [CrossRef]
- Sang, J.; Liu, H.; Liu, H.; Zhang, Z. Observational and numerical studies of wintertime urban boundary layer. J. Wind Eng. Ind. Aerodyn. 2000, 87, 243–258. [Google Scholar] [CrossRef]
- Oke, T.R. The energetic basis of the urban heat island. Q. J. R. Meteorol. Soc. 1982, 108, 1–24. [Google Scholar] [CrossRef]
- Steeneveld, G.J.; Koopmans, S.; Heusinkveld, B.G.; van Hove, L.W.A.; Holtslag, A.A.M. Quantifying urban heat island effects and human comfort for cities of variable size and urban morphology in the Netherlands. J. Geophys. Res. Atmos. 2011, 116. [Google Scholar] [CrossRef]
- Theeuwes, N.E.; Steeneveld, G.-J.; Ronda, R.J.; Rotach, M.W.; Holtslag, A.A.M. Cool city mornings by urban heat. Environ. Res. Lett. 2015, 10, 114022. [Google Scholar] [CrossRef]
- Yang, X.; Yao, L.; Jin, T.; Jiang, Z.; Peng, L.; Ye, Y. Temporal and spatial variations of local temperatures in the summer of Nanjing. J. Civ. Environ. Eng. 2019, 41, 160–167+174. [Google Scholar]
- Chen, G.; Li, N.; Cai, Y.; He, M. Analysis of the Characteristics of Heat Island Intensity Based on LCZ in the Summer of Guangzhou. Build. Sci. 2021, 37, 96–104. [Google Scholar] [CrossRef]


Disclaimer/Publisher’s Note: The statements, opinions and data contained in all publications are solely those of the individual author(s) and contributor(s) and not of MDPI and/or the editor(s). MDPI and/or the editor(s) disclaim responsibility for any injury to people or property resulting from any ideas, methods, instructions or products referred to in the content. |
© 2025 by the authors. Licensee MDPI, Basel, Switzerland. This article is an open access article distributed under the terms and conditions of the Creative Commons Attribution (CC BY) license (https://creativecommons.org/licenses/by/4.0/).