Article

Numerical Simulation of Temperature Field Evolution and Distribution Range During Movement of Underground Coal Gasification Working Face

1
Shandong Energy Group Co., Ltd., Jinan 250014, China
2
College of Safety and Environmental Engineering, Shandong University of Science and Technology, Qingdao 266590, China
3
Shandong Energy Power Group Co., Ltd., Jinan 250014, China
*
Author to whom correspondence should be addressed.
Energies 2025, 18(4), 931; https://doi.org/10.3390/en18040931
Submission received: 25 November 2024 / Revised: 19 January 2025 / Accepted: 28 January 2025 / Published: 14 February 2025
(This article belongs to the Section H3: Fossil)

Abstract

:
Studying temperature evolution and distribution range during underground coal gasification is essential to optimize process efficiency, ensure safe and stable operation and reduce environmental impact. In this paper, based on the Liyan Coal Mine underground gasification project, the moving grid setting is used to simulate the moving heat transfer process of the underground coal gasification (UCG) flame working face (FWF). The results showed that the temperature distribution within the coal wall facing the flame is relatively narrow and remains concentrated within a limited range. Temperature distribution curves for T = 100 °C and T = 600 °C initially exhibit a nonlinear increase, reaching a maximum value, followed by a nonlinear decrease, ultimately trending towards a constant value. The maximum temperature influence ranges at ∆T = 10 °C (T = 30 °C) in the roof, left coal pillar, and floor are approximately 13.0 m, 9.0 m, and 10.1 m, respectively. The temperature values at the +1 m and +2 m positions on the roof exhibit a parabolic pattern, with the height and width of the temperature curve gradually increasing. By the end of the operation at t = 190 d, the length range of temperatures exceeding 600 °C at the +1 m position is 73 m, with a maximum temperature of approximately 825 °C, while at the +2 m position it is 31 m, with a maximum temperature of approximately 686 °C.

1. Introduction

Underground coal gasification (UCG) is a new coal in situ chemical mining method which is different from the traditional physical mining. The main principle is to directly convert the in situ coal seam into combustible gas (CO, H2, CH4, etc.) through the coal oxygen heat and chemical action of the underground coal seam. Therefore, it is also called the chemical mining method or fluidization mining method [1,2]. At this stage, UCG is especially suitable for technically and economically non-minable coal seams, such as high ash, high sulfur, low quality, steep inclination, or thin coal seams abandoned by traditional physical mining, and can further improve the coal seam recovery rate [3] and is considered to have broad prospects [4] in clean coal development, hydrogen production [5,6], and carbon dioxide storage [7,8]. The orderly advancement of gasification/flame working face in the UCG process is a prerequisite for the stable operation of UCG. UCG technology mainly includes two types of gasification methods: mine type and well-free type. Among them, the shaftless gasification adopts modern petroleum equipment and drilling technology, and is improved on the CRIP (Controlled Retraction Injection Point) process route. However, due to the narrow gasification channel, it affects the gas output.
The flame working face (FWF) in the underground coal gasifier is the main place for coal oxygen combustion gasification to produce gas. According to the different gas injection conditions in the underground gasifier (including oxygen concentration, gas injection flow, and gas injection pressure), the combustion and gasification intensity of the FWF is different, but the temperature in the oxidation zone and reduction zone of coal oxygen combustion gasification can generally reach about 700 °C~1300 °C [9]. For the coal in the underground gasifier, the high temperature condition of the FWF can preheat the coal to be gasified, resulting in thermal cracking and pyrolysis [10,11] of the coal, which is conducive to the next coal gasification reaction. However, for the surrounding rock of the roof and floor, a high temperature will lead to thermal damage and the fracture of rock [12,13] and reduction of rock strength [14,15], which can very easily cause a series of problems, such as the large-area collapse of overburden rock, excessive development of the fracture zone, blockage of the gasification channel by overburden rock collapse, reduction of gasifier air tightness, gas leakage, and excessive influx of groundwater. Secondly, a key problem is that the FWF of the underground gasifier is moving heat transfer. How does the temperature of the high temperature zone causing the thermal damage of coal and rock evolve in the whole process of the moving heat transfer of the underground gasifier? What is the specific temperature distribution range? What is the temperature range of surrounding coal and rock mass affected by internal high temperature during the operation of the underground gasifier? These are the first problems to be solved for UCG.
Relevant scholars have carried out research on the temperature field distribution of the underground coal gasifier, using methods including theoretical research, model testing, and numerical simulation. Xin et al. [16,17,18] established the mathematical model of boundary heat transfer in an underground gasification goaf, and used mathematical methods such as the Laplace transform to theoretically study the analytical solution of temperature field in coal and rock under given boundary conditions. For the heat conduction problem with a fixed boundary in the air-fuel zone, the analytical solution for the temperature field under variable boundary conditions is given, and the numerical simulation comparison is carried out. Wang et al. [19] also carried out theoretical research work in similar aspects. Model testing is an effective simulation test method to reveal the operation process of an underground gasifier and facilitate data monitoring. Relevant scholars [20,21,22] carried out an indoor simulation test of underground gasification and obtained the distribution law of the temperature field in coal and rock surrounding the underground gasification process. In addition, for the on-site underground gasification tests, due to the lack of effective technology and equipment means, and the difficulty of monitoring, it is difficult to monitor the temperature field in the underground gasifier and surrounding coal and rock, so the numerical simulation method is often used for simulation research. Scholars at home and abroad [18,23,24,25] have carried out this work. In the above simulation, the changes of thermophysical parameters with temperature are considered, and the temperature distribution range in the coal and rock surrounding the goaf is obtained. Amin et al. [26] used COMSOL simulation software to calculate the shape and volume of the UCG combustion cavity, and the results showed that the numerical results agreed well with the field data. In addition, Róg et al. [9] also inversed the temperature value experienced around the gasifier through a borehole sampling test, and inferred that the 700 °C location point is about 1.94 m away from the gasifier boundary. The UCG process is a complex physicochemical reaction process affected by gasification pressure, coal seam temperature, gas concentration, etc. COMSOL Multiphysics is based on the finite element method, which simulates real physical phenomena by solving partial differential equations (single field) or systems of partial differential equations (multiple fields). It mathematically solves the physicochemical phenomena in the process of UCG. COMSOL was used to divide the coal seams of the gasification process under coal more accurately, and the controlling equations of the physical fields in each region were finely investigated.
In the previous numerical simulation research, most of the heat transfer research on the fixed boundary of the hollow section of the underground gasifier was carried out, and the research on the moving heat transfer of the high temperature of the FWF advancing with time was less. Therefore, according to the specific geological conditions of coal and rock and the operation status of the underground gasifier, it is necessary to carry out research on the heat transfer law in the surrounding coal and rock during the moving and heat transfer process of the underground gasifier, master the temperature field distribution evolution and temperature propagation range of the whole operation process, and guide the underground gasifier parameter design, control the underground gasifier operation parameters, reveal the mechanism of the thermal damage and failure of overlying rock, and control the stability of surrounding rock.
In this study, COMSOL Multiphysics numerical simulation software was used to carry out the numerical simulation research on the temperature field distribution and evolution of the whole process of UCG according to the field engineering example, revealing the dynamic evolution law of the high temperature of the FWF in the coal body in front of the gasifier and the surrounding rock of the roof and floor, so as to provide a reference for the operation control of the UCG engineering site.

2. Materials and Methods

2.1. Experimental and Geological Conditions

The underground gasifier of the UCG project of Shandong Luxi Power Generation Co., Ltd. Shandong Province, China is located in the No. 3 coal mining area of Shandong Liyan Mining Co., Ltd. Shandong Province, China. The fourth mining area of coal seam 3 was mined in 2016. At present, only the corner blocks near the wind oxidation zone remain as the UCG area of coal seam 3. Figure 1 is a columnar view of drill holes near Li 87, and the thickness of coal seam 3 is about 8.3 m. The top bedrock includes the siltstone of the top of the Shanxi Formation and Upper Jurassic fine-grained sandstone and siltstone. The thickness of the bedrock is about 28.69 m. The top of the bedrock is quaternary alluvium, with a thickness of about 148.77 m. The direct floor of coal seam 3 is 5.39 m medium-grained sandstone, and below it is 10 m fine sandstone. According to the hydrogeological classification report of the mine, the hydrogeological type of the gasification area is medium, the water yield of the lower Quaternary formation is weak, and the geological structure is simple. The gasification zone is constructed with 20 quaternary exploratory holes, of which only 3 holes produced water in the lower quaternary layer. The maximum water influx in a single hole was 7.6 m3/h with sand flowing out with the water, and then stabilized at 4.5 m3/h, while the rest of the holes were almost waterless. Therefore, the water-richness of the lower Quaternary formation in the gasification zone is weak.
This project uses integrated underground coal gasification technology. Oxygen-enriched water is vaporized as a gasification agent. The controlled combustion/gasification of in situ coal seams, with CO-, H2-, and CH4-based gas, is produced, which is used for power plant blending to generate electricity.

2.2. Model and Parameters

2.2.1. Model Establishment

According to the actual engineering design, COMSOL Multiphysics is used to simulate the operation of the first underground gasifier. The first narrow strip underground gasifier is 10 m wide and 135 m long. The determination of model size should also consider that each boundary should have enough distance to meet the requirements of heat conduction distance. A 30 m protective coal pillar should be reserved at the ignition position of the underground gasifier and a 40 m protective coal pillar should be reserved at the stoppage line. The total length of the model is 205 m. Considering all bedrock roof and floor of coal seam 3, the model size is 205 m × 52.38 m. Considering the residual ash and slag in the floor of the goaf after the coal combustion, and the development of ash and slag hole crack structure, which has a certain blocking effect on the heat transfer of the floor, according to the content of coal seam 3 coal ash in Liyan Coal Mine, the thickness of ash and slag layer in the goaf of this model is about 20% of the coal seam thickness. With the continuous combustion and gasification of coal and the progress of the working face, it is considered that the gas occupies the space of the air combustion area.
The model is established in COMSOL, and the refined free triangulation mesh is used. The mesh generation model is shown in Figure 2.
In Figure 2, the ignition drift is the initial ignition range of the underground gasifier (31 ≤ x ≤ 36, a width of 5 m). After ignition, the FWF of the underground gasifier (a width of 5 m) will move from left to right under the control of gas injection, with a distance of 135 m, reaching the stop production line.

2.2.2. Model Parameters

(1)
Thermal conductivity of coal/Rock
According to the research results of references [24,27], the thermal conductivity of coal and rock changes with the change in temperature. According to the regression analysis, the empirical formula of coal seam thermal conductivity with temperature is as follows.
k c T / k c 0 = 0.7355 e 0.0018 T
where kc(t)—the thermal conductivity coefficient of coal at a certain temperature, W/(m·°C); kc0—the thermal conductivity coefficient of coal at room temperature, W/(m·°C); and T—the heat transfer temperature of coal, °C.
The variation in the thermal conductivity of sandstone with temperature is shown in Figure 3 below.
The empirical formula of sandstone is obtained as follows:
k m T / k m 0 = 0.0007 T / k m 0 + 1
where km(t)—the thermal conductivity coefficient of sandstone at a certain temperature, W/(m·°C); km0—the thermal conductivity of sandstone at room temperature, W/(m·°C); and T—the heat transfer temperature of sandstone, °C.
(2)
Specific heat capacity of coal/Rock
According to reference [28], the specific heat capacity of sandstone at high temperature varies from 890 to 900 J/(kg·°C) from 200 °C to 1000 °C, and the variation range is small. In numerical simulation, the specific heat capacity of sandstone is taken as the average value at each temperature, and the specific heat capacity of sandstone is taken as 950 J/(kg·°C). However, there is little research on the change law of the specific heat capacity of the coal seam with temperature in the literature. The overall law is similar to the change law of coal measures in rock. Similarly, it is assumed that the specific heat capacity of the coal seam is constant, and the value is 1000 J/(kg·°C).
(3)
Other parameters
For other thermophysical parameters, such as density, the variation law with temperature is not uniform, and the variation range is not very large. This paper comprehensively considers the influence of temperature on it, and takes its average value. The average temperature of the underground gasifier stope is set at 1000 °C, the original rock temperature is set at 20 °C, the average axial moving speed is about 0.7 m/d, and the total moving time of the flame working face is about 190 days. See Table 1 for the values of coal and rock thermophysical parameters under normal temperature in the model.

2.2.3. Basic Assumptions and Heat Conduction Equation

For the heat transfer problem of the surrounding rock of underground coal gasification, the following assumptions are firstly introduced:
(1)
The surrounding rock is a homogeneous isotropic body with no heat source inside, and the influence of pore and fissure structure on thermal conductivity is ignored.
(2)
The operation factors of the gasifier are not considered, and it is considered that the gasifier is always in a stable operation state, that is, the moving speed of the flame working face is unchanged.
(3)
The differential equation of the field variable T(x, y, t) of the transient temperature field in the Cartesian coordinate system should be as follows:
ρ c T t = x k x T x + y k y T y
The boundary conditions satisfied are the following: T = T ¯ (on Γ1 boundary), where t—heat transfer time, d; T—heat transfer temperature, °C; ρ—density, kg/m3; and c—specific heat capacity, J/(kg•°C);
The above Equation (1) is a heat balance equation, in which the left term is the heat required for the temperature rise of the micro element. The first two items on the right are the heat transferred into the micro element in the x and y directions. Where the formula is in Γ1, the given temperature T ¯ ( Γ , t ) on the boundary is called the first type of boundary condition, and the forced boundary condition is the given temperature boundary condition.

2.2.4. Mobile Grid Setting

In order to realize the movement of the FWF, a moving grid is set in COMSOL to realize the directional movement of the FWF with time. The grid of the initial position (31 ≤ x ≤ 36) of the FWF (a width of 5 m) of the underground gasifier is set as a moving grid. During the whole heat transfer process, the FWF grid moves in a direction with time. In this paper, the moving speed of the moving grid is set to be the same as that of the FWF, both of which are 0.7 m/d. In the process of moving the grid, the surrounding area will be automatically meshed according to the change in moving grid area.

3. Results

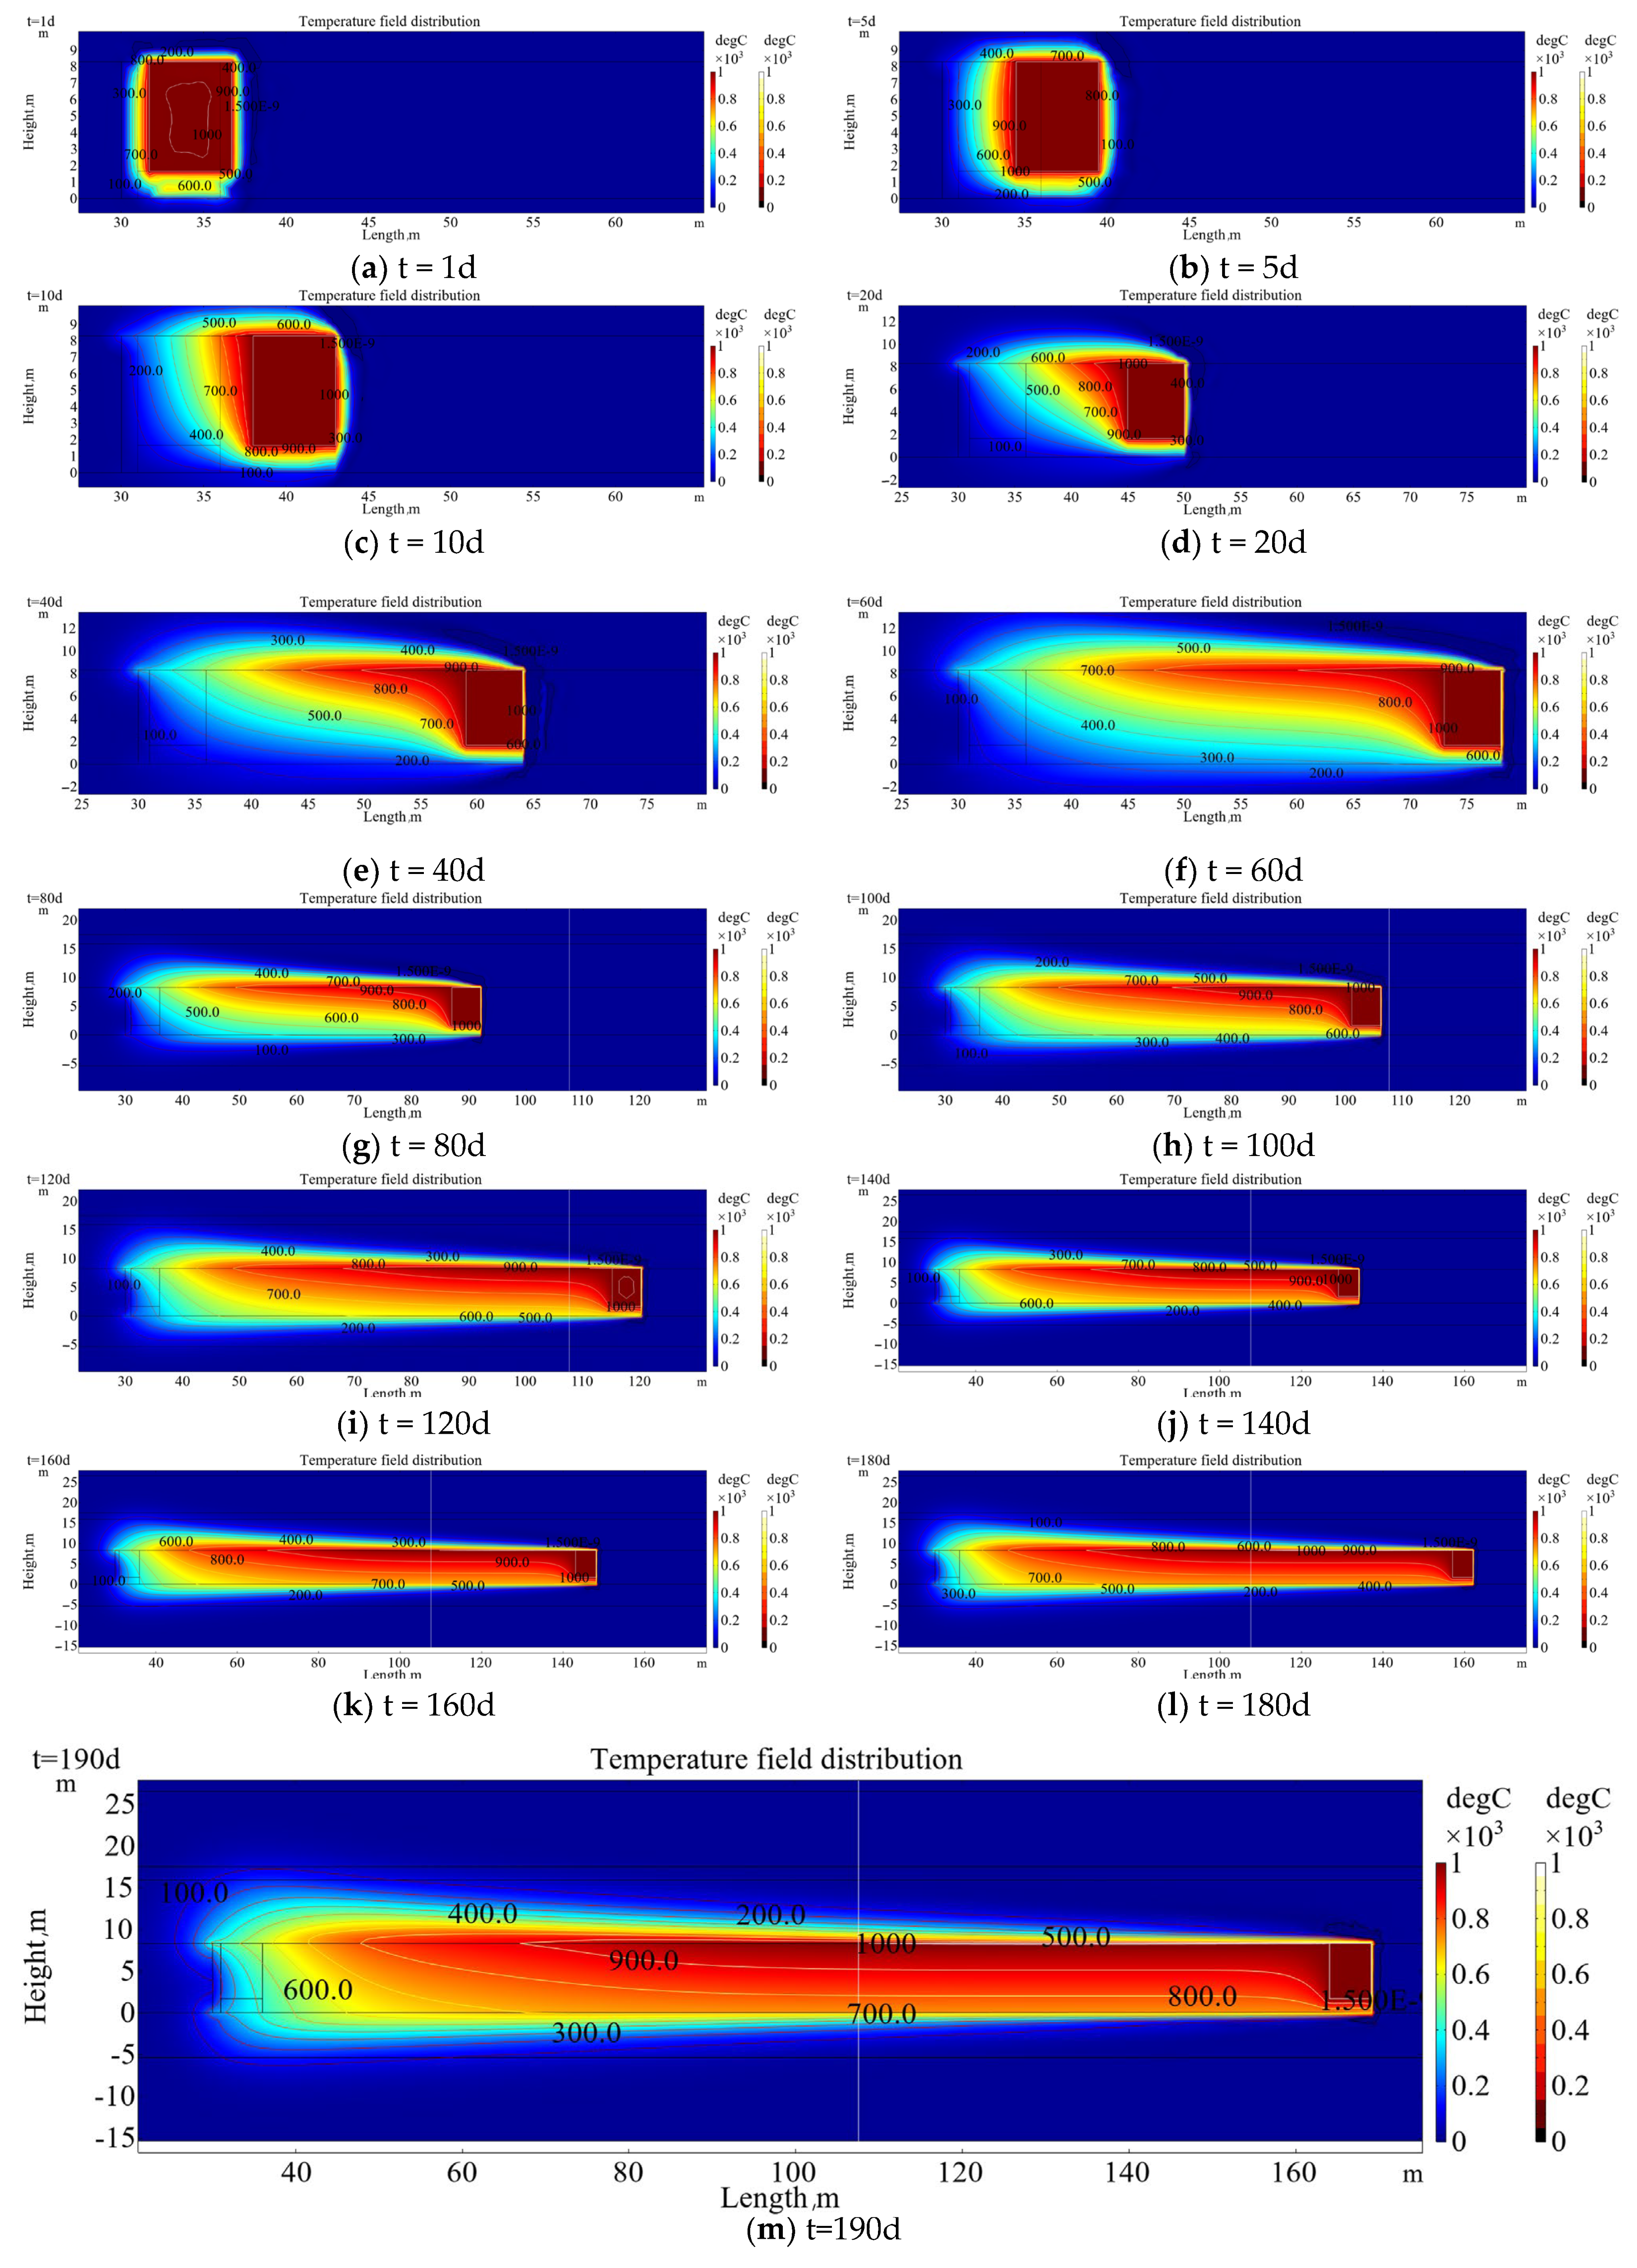
3.1. Evolution Law of Temperature Field with Advancing FWF

Figure 4 shows the temperature field distribution in the gasifier and surrounding rock with the movement of the FWF. It can be seen that Figure 4a shows the temperature field distribution of the underground gasifier after 1 day of ignition and operation. The high temperature is mainly distributed in the range of the FWF, and the temperature of the ash at the bottom of the goaf gradually decreases towards the bottom plate. In the coal wall and roof in front of the FWF, the temperature propagation range is small and has a high temperature gradient.
Figure 4b shows the distribution of the temperature field after 5 days of operation. At this time, the FWF has moved 3.5 m to the right, and the position coordinate of the rightmost coal wall is x = 39.5 m, as shown in Figure 5. At this time, the distribution range of the t = 100 °C isotherm in the coal wall is about 1.26 m, and the distribution range of the t = 600 °C isotherm in the coal wall is about 0.53 m. As shown in Figure 6, the isotherm distribution range of t = 100 °C in the roof of the FWF is about 1.58 m, and the isotherm distribution range of t = 600 °C is about 0.5 m.
It can be seen from Figure 4c–f that with the advance of the FWF, the temperature distribution in the rear air-conditioned area changes significantly. There is a more obvious temperature distribution near the top of the air-conditioned area, and the heat transfer in the top plate is more obvious, mainly because the ash layer at the bottom of the air-conditioned area has a lower heat conductivity coefficient, so the heat transfer from the temperature to the bottom plate rock layer is not obvious. The temperature distribution range of T = 100 °C increases from 2.24 m to 5.19 m, and the temperature distribution range of T = 600 °C increases from 0.74 m to 1.54 m. In the square coal wall in front of the FWF, the temperature distribution range of T = 100 °C decreases from 1.17 m to 0.28 m, and the temperature distribution range of T = 600 °C decreases from 0.49 m to 0.12 m. It can be seen that the temperature distribution range gradually decreases, while the temperature gradient gradually increases. The reduction in the temperature distribution range in the coal wall in front of the FWF is mainly affected by the directional advance of the FWF, and the thermal conductivity coefficient in the coal wall is low. The temperature is not transmitted in the coal wall before the FWF advances, which leads to the rupture of the coal wall and combustion gasification.
According to Figure 4g–m, as the FWF advances, the temperature is gradually conducted in the surrounding rock of the roof and floor and the front coal wall, and the temperature distribution range in the roof is more obvious, while the temperature distribution range in the front coal wall is not obvious, and the temperature gradient is large. Figure 4m shows the distribution of the temperature field after 190 days of operation. At this time, the working face of the FWF has moved 133 m to the right, and the position coordinate of the rightmost coal wall is x = 169 m, as shown in Figure 7. At this time, the distribution range of the t = 100 °C isotherm in the coal wall is about 0.26 m, and the distribution range of the t = 600 °C isotherm in the coal wall is about 0.11 m. As shown in Figure 8, the maximum value of the isotherm distribution range of t = 100 °C in the roof range is about 8.96 m, which is above the initial ignition position. The maximum isotherm distribution range of T = 600 °C is about 2.67 m, which is located at the upper right of the initial ignition position.

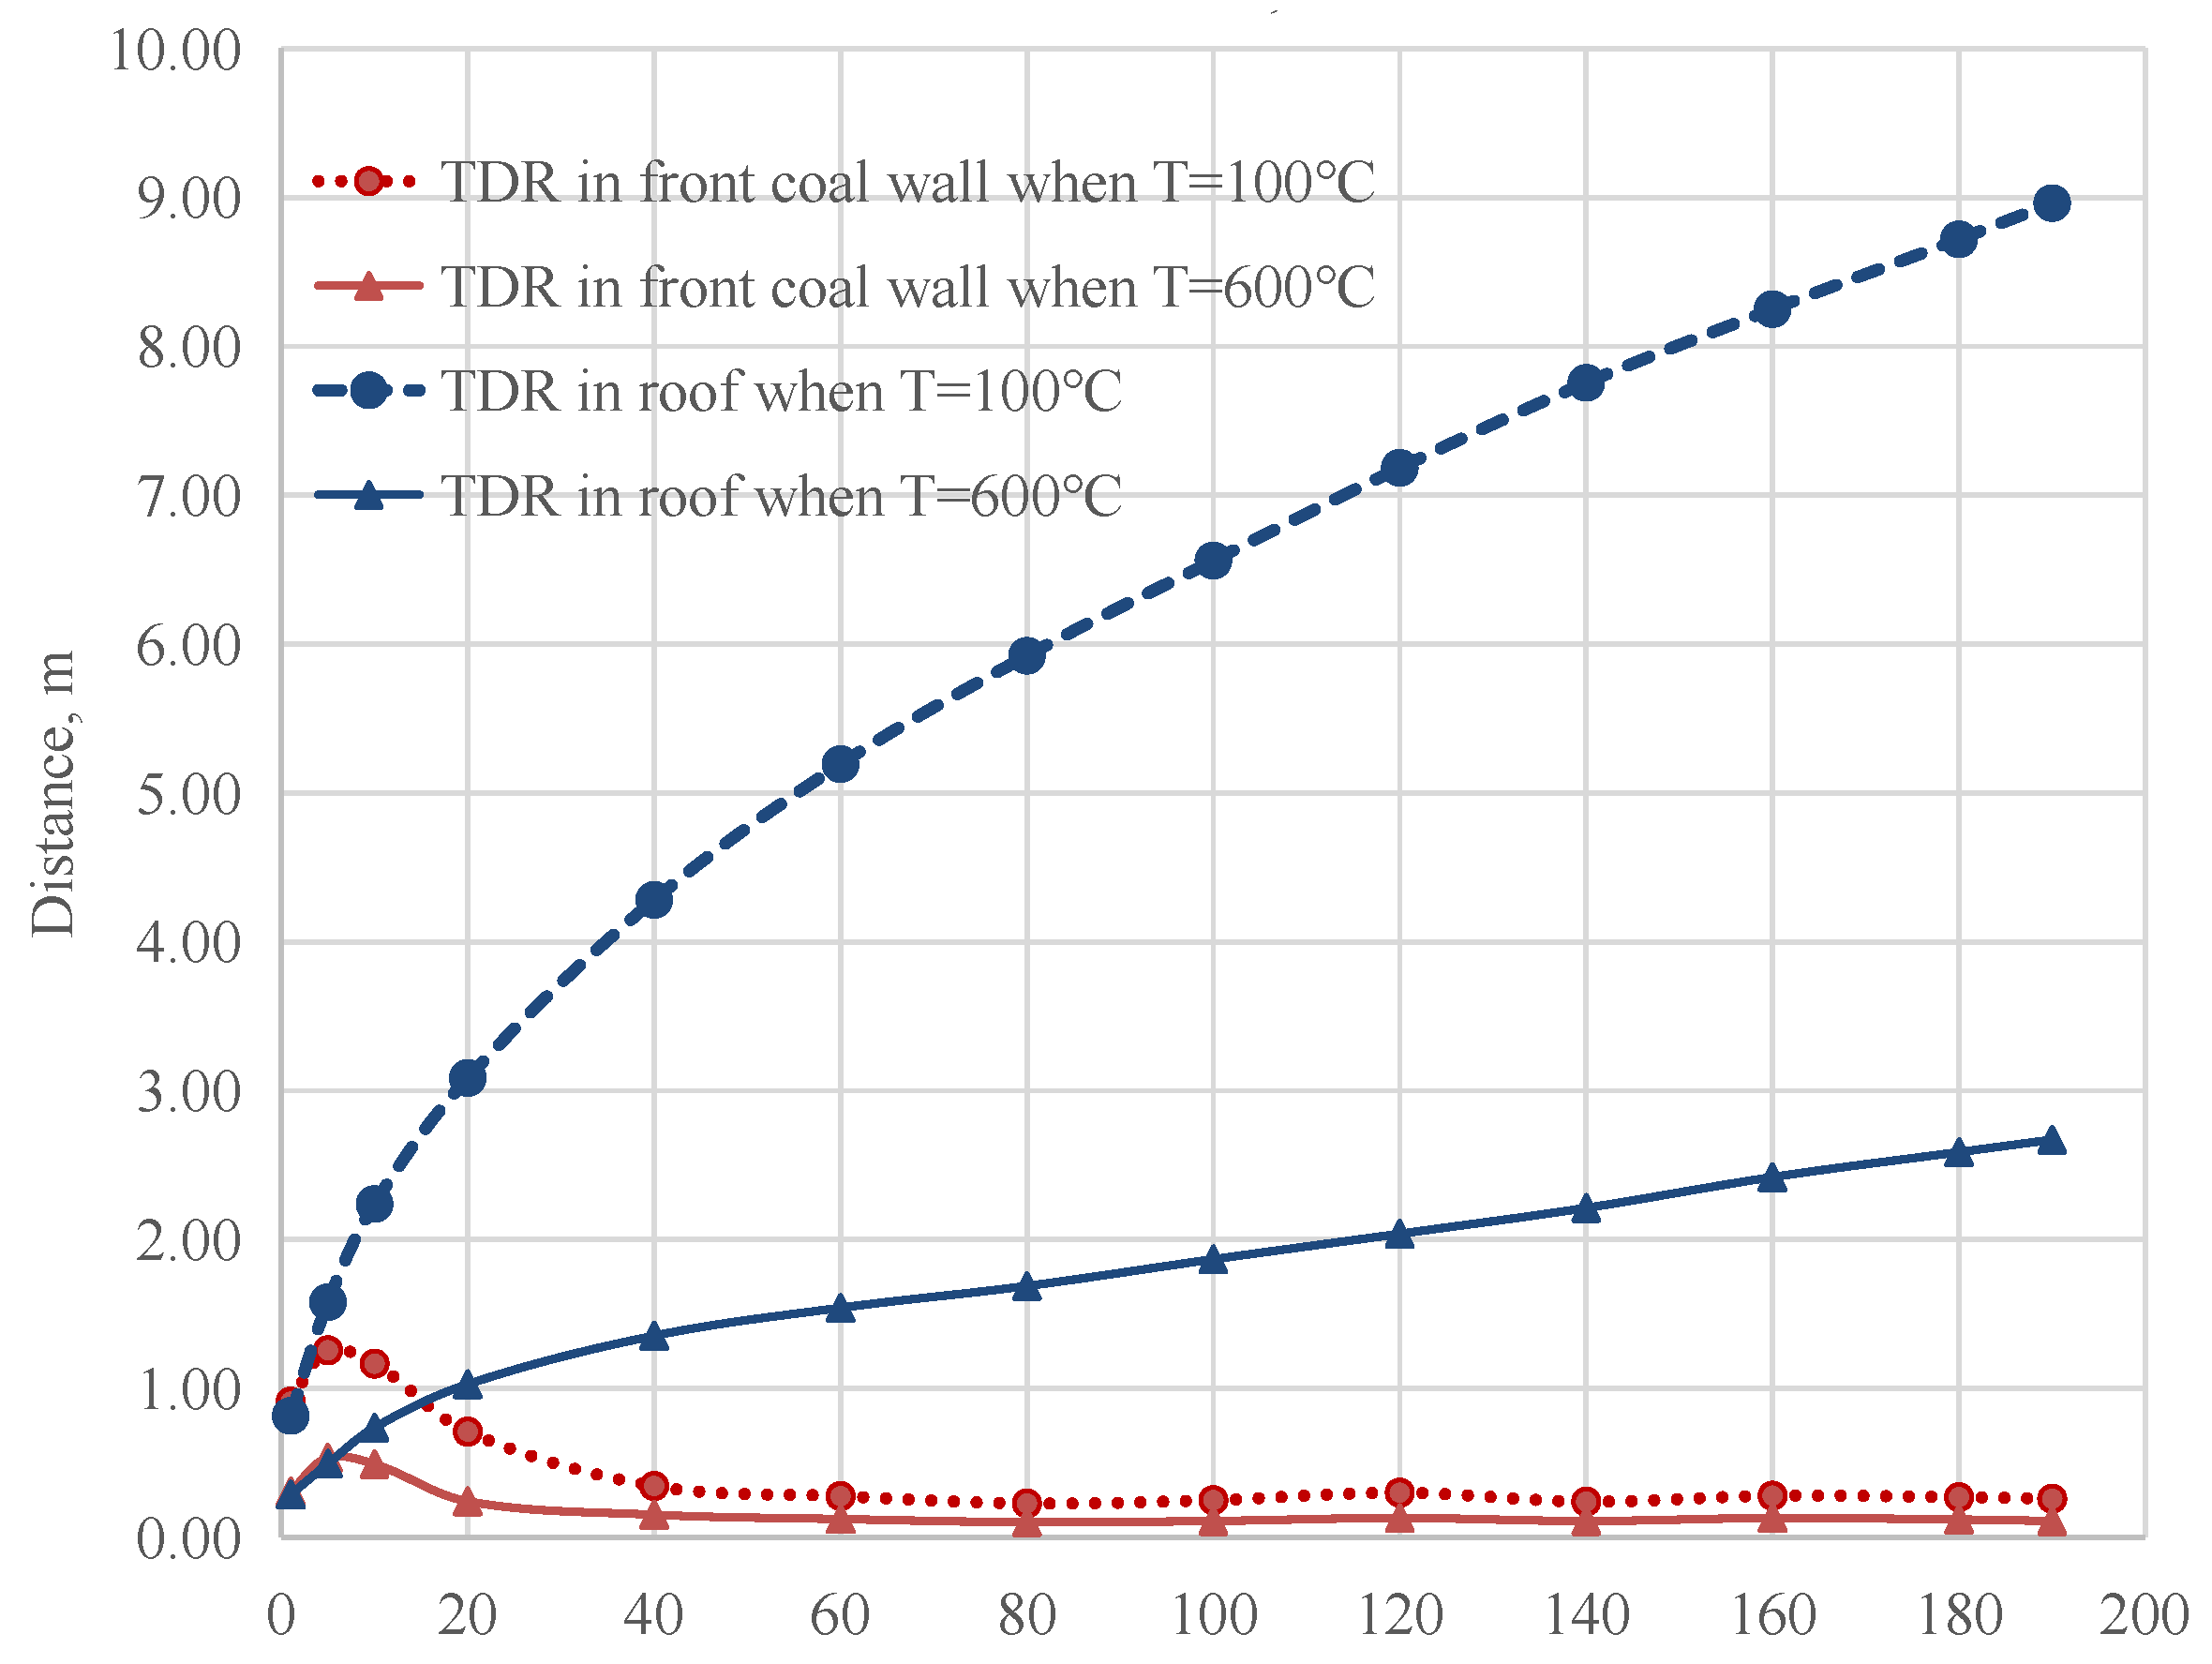
3.2. Variation Law of Temperature Distribution Range in Coal and Rock

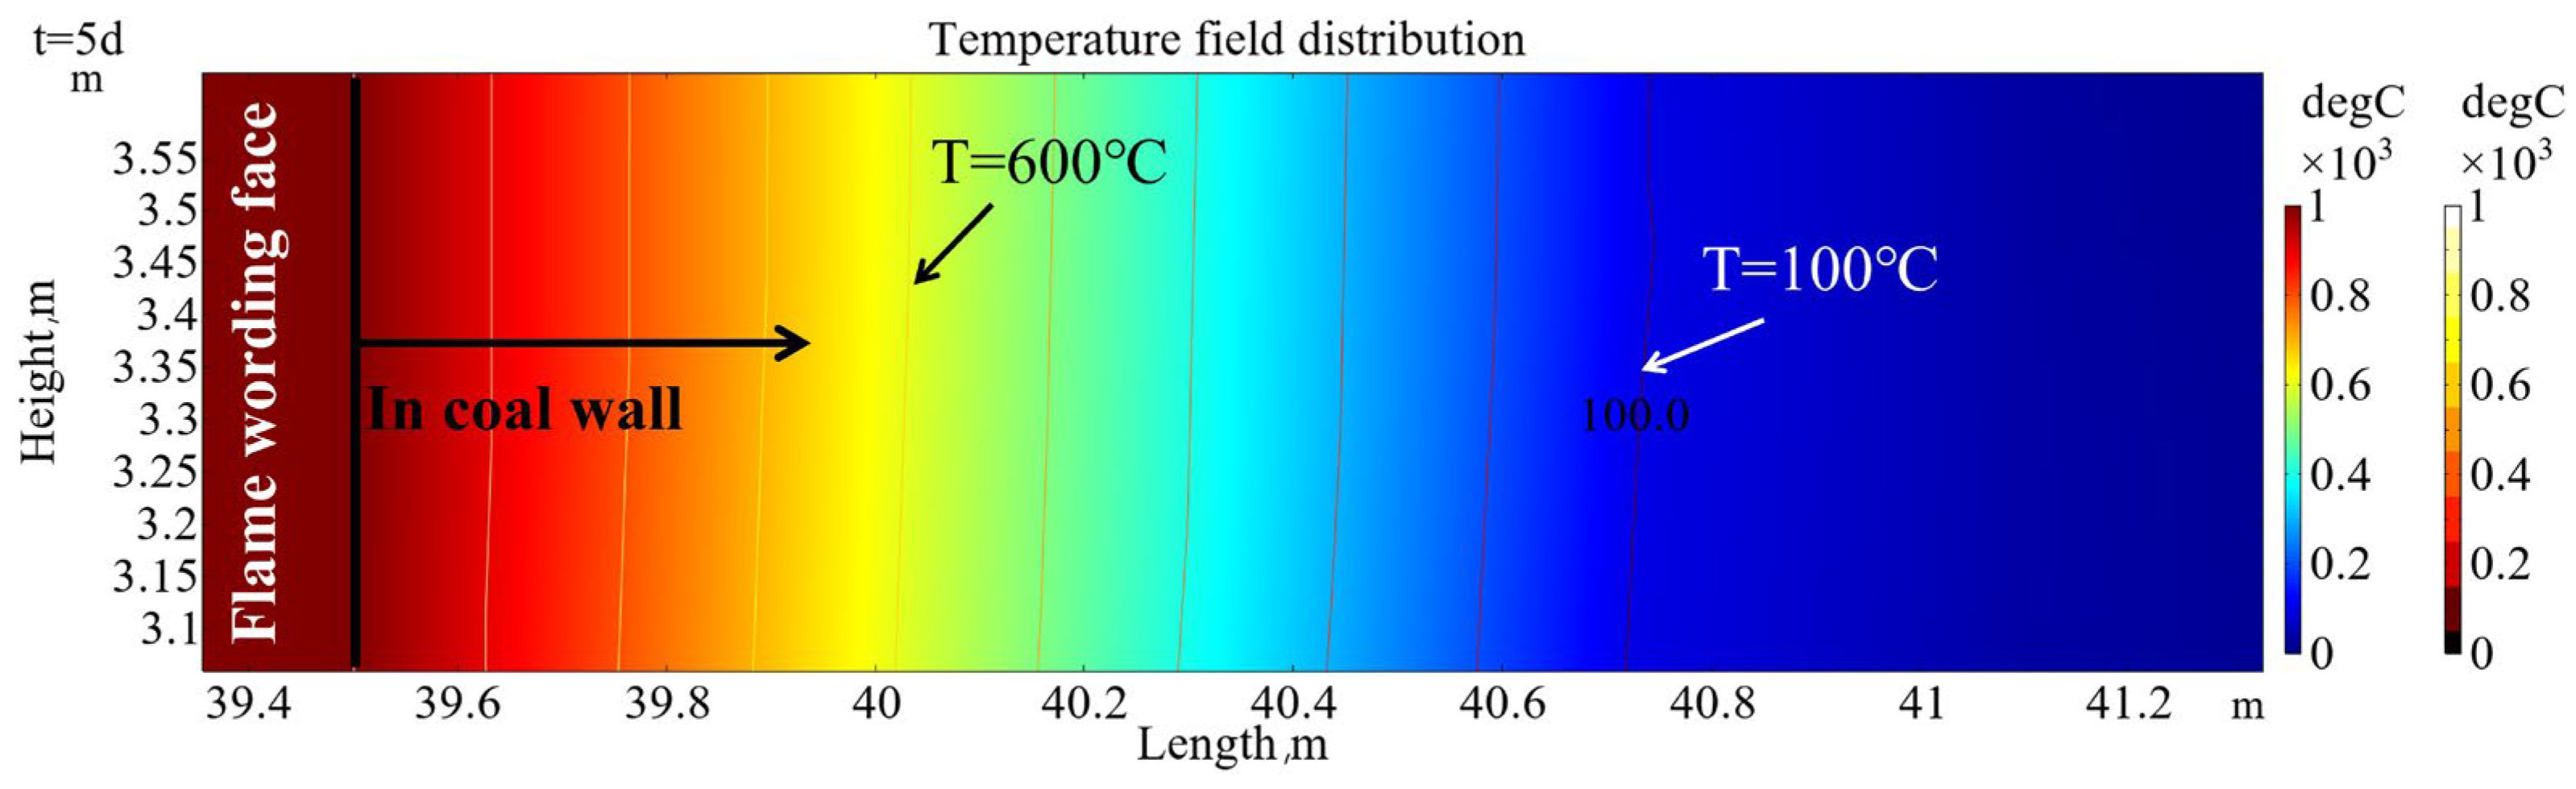
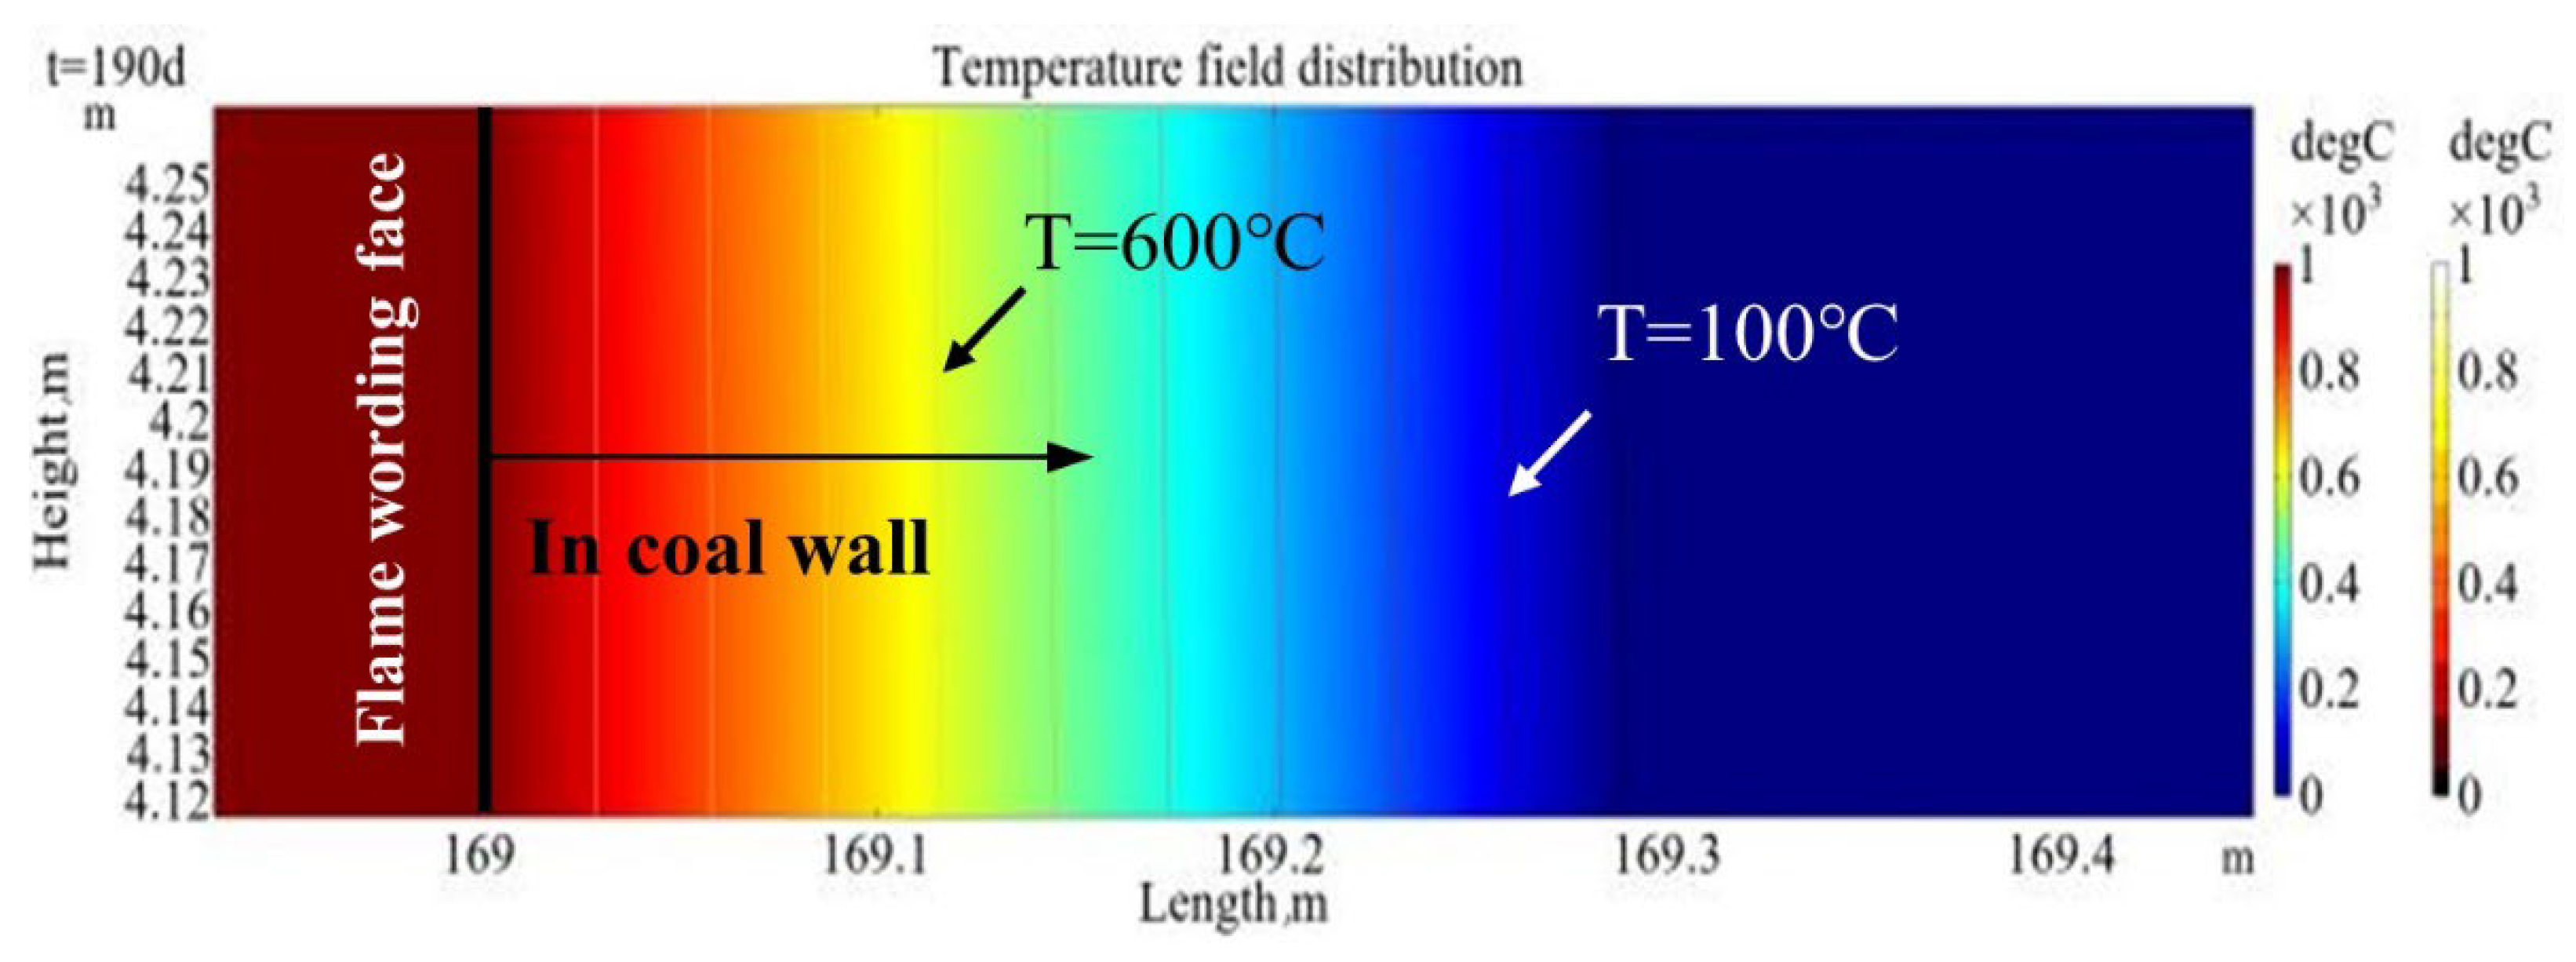
3.2.1. Temperature Distribution Law of T = 100 °C, 600 °C and ∆T = 10 °C

T = 100 °C is the temperature at which water vapor phase transition occurs in coal and rock, and the water vapor phase transition process and steam migration front have a certain impact on the microstructure of coal and rock. In addition, the temperature value of t = 600 °C is generally considered as the threshold temperature for the thermal burning damage of rock [18], at which the microstructure, phase transformation, and strength of rock components change significantly [29], and the coal also has a significant coking reaction at this temperature. In the relevant literature, ∆t = 10 °C is taken as the criterion for judging the temperature propagation range [18], which is of guiding significance for understanding and mastering the propagation and influence range of high temperature in the surrounding coal and rock in the underground gasifier.
Therefore, this paper focuses on the temperature distribution range and variation law of T = 100 °C and T = 600 °C in coal and rock at different times during the whole heat transfer process, which has guiding significance for revealing the micro and macro thermal damage characteristics of coal and rock mass changing with time. At the same time, the temperature distribution range of the final operation time of the underground gasifier (t = 190 d) ∆T = 10 °C (i.e., t = 30 °C) is given. The above scope does not consider the residual heat transfer after the operation of the gasifier.
The temperature distribution range values of T = 100 °C and T = 600 °C in the square coal wall in front of the FWF and in the roof of the goaf with the operation time are counted, as shown in Table 2, and the curves of various values are shown in Figure 9.
It can be seen from Figure 9 that the heat transfer boundary of the top plate of the air-fired area is fixed, and the temperature distribution range of T = 100 °C and T = 600 °C increases throughout the operation of the gasifier. The distribution curve of T = 100 °C is smooth, showing a significant nonlinear increase, and the curve growth rate gradually decreases, especially in the initial stage (0~20 d). The distribution range curve of T = 600 °C shows a trend of nonlinear increase at first and then linear increase. Due to the directional movement of the FWF, the heat conduction boundary of the front coal wall is constantly changing (moving to the right), so the distribution range of temperature in the coal wall is small and basically concentrated in the limited range of the coal wall. The temperature distribution curves of T = 100 °C and T = 600 °C both showed a non-linear increase at first, then reached the maximum, then decreased non-linearly, and finally gradually tended to a constant value, revealing the temperature distribution law of the heat conduction problem in the moving boundary of the coal wall in front of the FWF.
Figure 10 shows the temperature distribution isotherms of T = 30 °C (∆T = 10 °C), 100 °C, and 600 °C at the end of operation time t = 190 d. It can be seen that the T = 600 °C isotherm is basically distributed near the goaf area, and the distribution range is larger in the coal seam roof near the ignition area than in other areas. The overall distribution of T = 100 °C and T = 30 °C isotherms is similar, which is basically a bone cone placed horizontally. It has a large distribution range in the initial ignition area, and the distribution range in the top plate is larger than that in the bottom plate, mainly because the heat transfer in the bottom plate is affected by the low thermal conductivity block of the ash layer. The maximum distribution range of the T = 30 °C isotherm in the roof is about 13.0 m, the maximum distribution range in the left coal pillar is about 9.0 m, and the maximum distribution range in the floor is about 10.1 m.

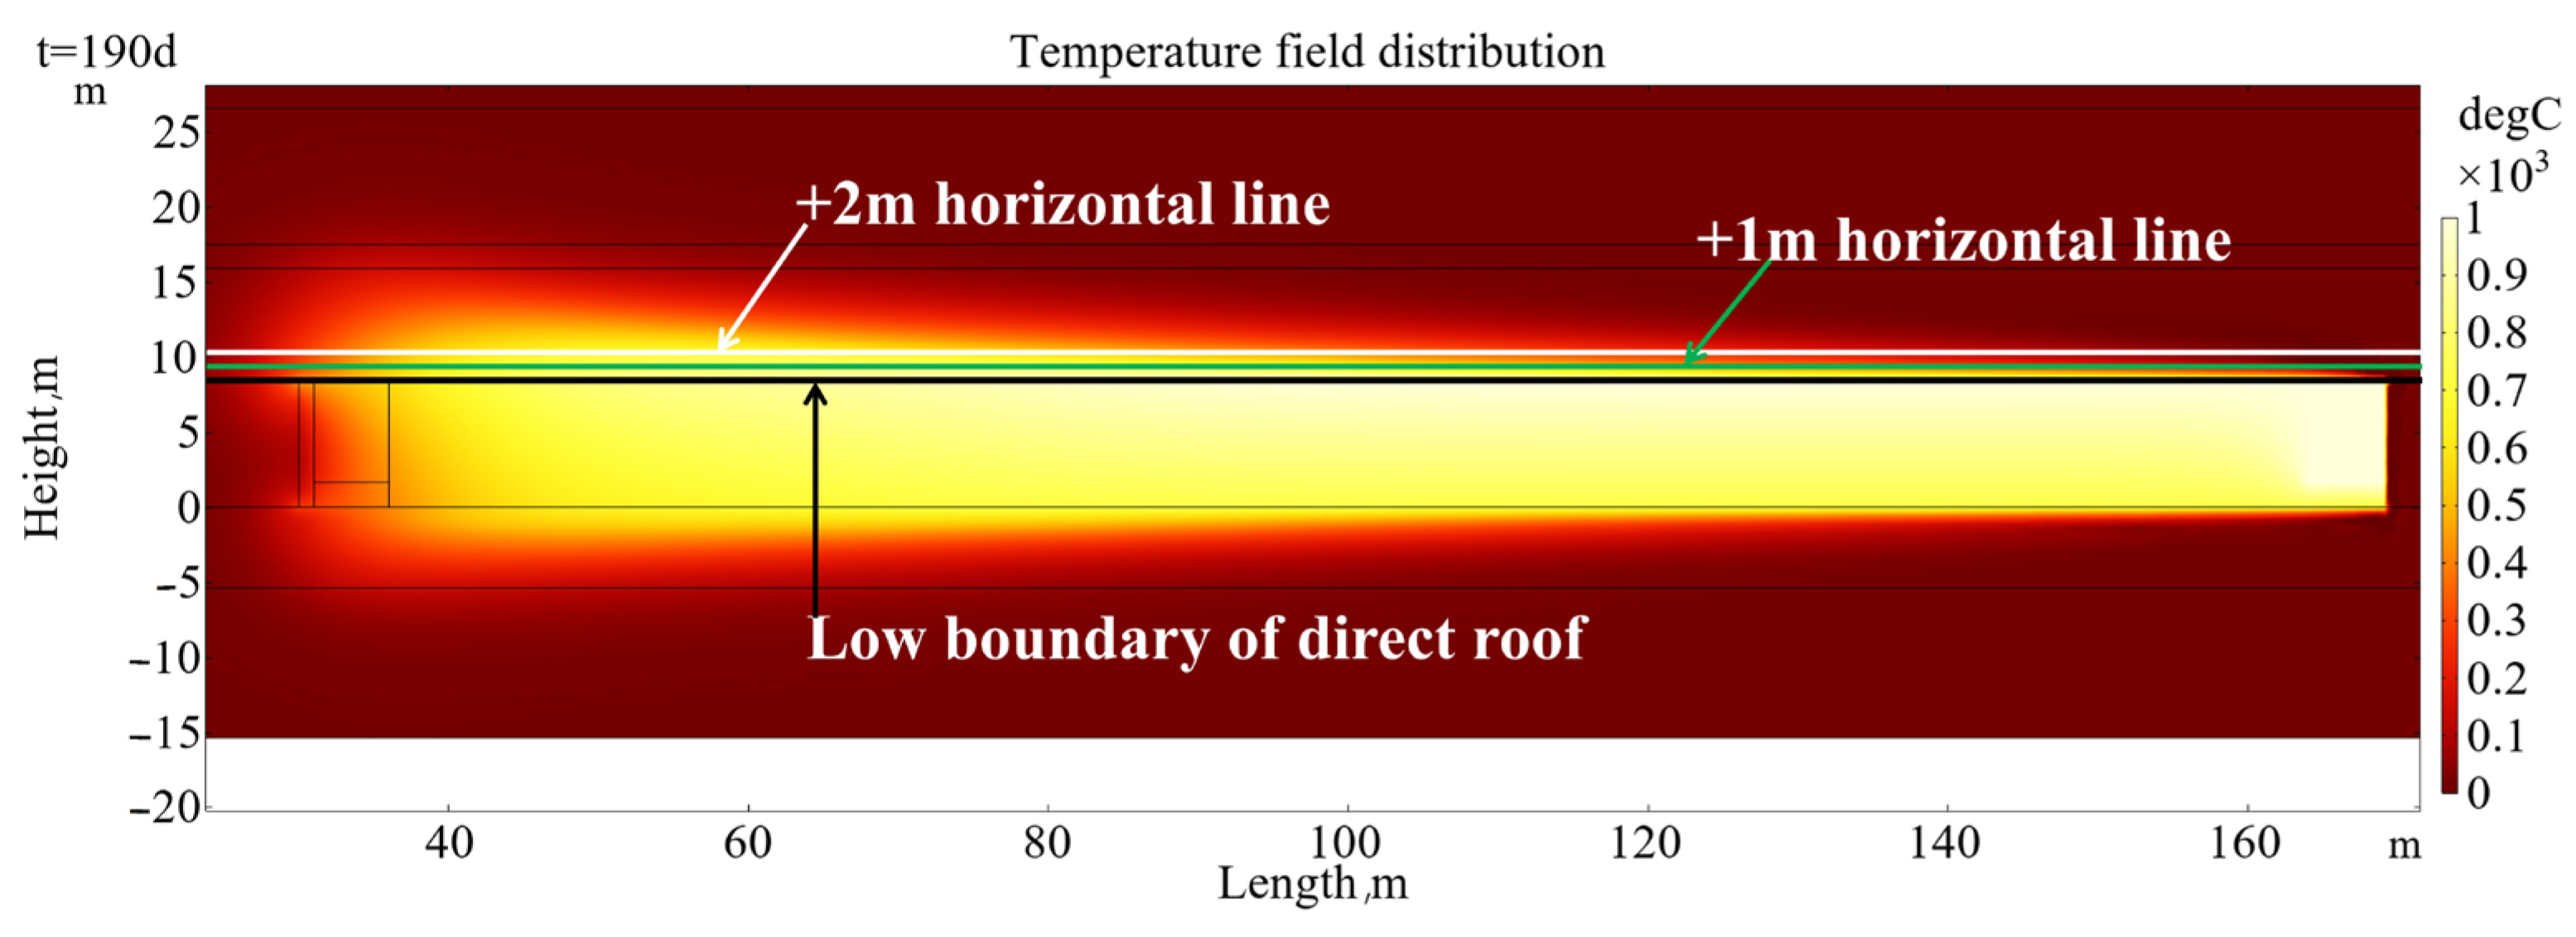
3.2.2. Temperature Distribution Law at the Lower Boundary, +1 m Position, and +2 m Position in Roof

Figure 11 shows the position of the lower boundary, +1 m position, and +2 m position horizontal lines in the roof of the coal seam. The temperature distribution curve of the lower boundary in the roof of the coal seam during the whole heat transfer process is shown in Figure 12. It can be seen that the lower boundary temperature of the roof within the range of the FWF is consistent with the temperature of the FWF (1000 °C), and the boundary temperature of the roof within the front coal wall decreases rapidly, basically maintaining the original rock temperature. The boundary temperature of the roof in the hollow zone decreases nonlinearly with the increase in the distance from the FWF.
Figure 13 shows the temperature distribution curve at the +1 m position in the coal seam roof during the whole heat transfer process. It can be seen that with the increase in time, the temperature value at the +1 m position in the roof is similar to the parabolic shape, and the height and width of the temperature curve gradually increase, indicating that the range affected by temperature and the value of temperature gradually increase. After t = 20 d, the temperature at the +1 m position in the roof will reach the temperature level of t = 600 °C, and with the passage of time, the range of the horizontal range above 600 °C will gradually increase. When the t = 190 d operation ends, the range of the horizontal range above 600 °C is x, the range of the length range is 73 m, and the maximum temperature at the +1 m position is about 825 °C.
Figure 14 shows the temperature distribution curve of the +2 m position in the coal seam roof during the whole heat transfer process. It can be seen that with the increase in time, the temperature value curve at the +2 m position in the roof is similar to the temperature value curve at the +1 m position, which is steep on the left and gentle on the right, similar to the parabola shape. The height and width of the temperature curve gradually increase, indicating that the range affected by temperature and the value of temperature gradually increase. After t = 120 d, the temperature at the +2 m position in the roof will reach the temperature level of t = 600 °C, and with the passage of time, the range of the horizontal range above 600 °C will gradually increase. When the t = 190 d operation ends, the range of the horizontal range above 600 °C is x, the range of the length range is 31 m, and the maximum temperature at the +2 m position is about 686 °C.

4. Conclusions

In this paper, based on the Liyan Coal Mine UCG project, the moving grid setting is used to simulate the moving heat transfer process of the UCG flame working face. The COMSOL moving grid setting can be used to simulate the heat transfer process of the FWF moving and advancing, and reveal the dynamic heat transfer and temperature field dynamic evolution law of the FWF from a high temperature to surrounding coal and rock. The reduction of the temperature distribution range in the coal wall in front of the FWF is mainly affected by the directional advance of the FWF, and the heat conduction coefficient in the coal wall is low. The temperature is too late to transmit in the coal wall; that is, the coal wall is broken and combusted and gasified by the advance of the FWF, which reveals the temperature distribution law of the heat conduction problem in the coal wall in front of the FWF.
(1)
The temperature distribution range curves of T = 100 °C and T = 600 °C in the front coal wall showed a nonlinear increase at first, then reached the maximum, then decreased nonlinearly, and finally gradually tended to a constant value. According to the calculation, the maximum distribution range of the isotherm of ∆T = 10 °C (T = 30 °C) in the roof is about 13.0 m, the maximum distribution range in the left coal pillar is about 9.0 m, and the maximum distribution range in the floor is about 10.1 m.
(2)
At the end of the operation of t = 190 d, the horizontal range of temperature exceeding 600 °C is x, the length range is 73 m, and the maximum temperature that can be reached at the +1 m position is about 825 °C. The temperature curve at the +2 m position in the roof is similar to the temperature curve at the +1 m position, which is in the shape of a parabola with a steep left and a gentle right. The height and width of the temperature curve gradually increase.
(3)
At the end of the operation, the horizontal range of the temperature above 600 °C is x, the length range is 31 m, and the maximum temperature that can be reached at the +2 m position is about 686 °C.

Author Contributions

Conceptualization, W.L. (Wei Li 1) and L.X.; methodology, L.X.; software, M.N.; validation, W.L. (Wei Li 2); formal analysis, J.F. and J.L.; investigation, J.S.; resources, X.W.; data curation, W.C. and Y.M.; writing—original draft preparation, L.X.; writing—review and editing, M.N. All authors have read and agreed to the published version of the manuscript.

Funding

This study was financially supported by the National Natural Science Foundation of China (No. 52374211, No. 52304190), and the Shandong Natural Science Foundation (No. ZR2020ME084, No. ZR2023QE117).

Data Availability Statement

Data are contained within the article.

Conflicts of Interest

The authors declare no conflicts of interest.

References

  1. Perkins, G. Underground coal gasification—Part I: Field demonstrations and process performance. Prog. Energy Combust. Sci. 2018, 67, 158–187. [Google Scholar] [CrossRef]
  2. Lozynskyi, V. Critical review of methods for intensifying the gas generation process in the reaction channel during underground coal gasification (UCG). Min. Miner. Depos. 2023, 17, 67–85. [Google Scholar] [CrossRef]
  3. Xin, L.; Wang, Z.; Wang, G.; Nie, W.; Zhou, G.; Cheng, W.; Xie, J. Technological aspects for underground coal gasification in steeply inclined thin coal seams at Zhongliangshan coal mine in China. Fuel 2017, 191, 486–494. [Google Scholar] [CrossRef]
  4. Perkins, G. Underground coal gasification—Part II: Fundamental phenomena and modeling. Prog. Energy Combust. Sci. 2018, 67, 234–274. [Google Scholar] [CrossRef]
  5. Khadse, A.; Qayyumi, M.; Mahajani, S.; Aghalayam, P. Underground coal gasification: A new clean coal utilization technique for India. Energy 2007, 32, 2061–2071. [Google Scholar] [CrossRef]
  6. Liu, H.; Guo, W.; Liu, S. Comparative techno-economic performance analysis of underground coal gasification and surface coal gasification based coal-to-hydrogen process. Energy 2022, 258, 125001. [Google Scholar] [CrossRef]
  7. Takyi, S.A.; Zhang, Y.; Si, M.; Zeng, F.; Li, Y.; Tontiwachwuthikul, P. Current status and technology development in implementing low carbon emission energy on underground coal gasification (UCG). Front. Energy Res. 2023, 10, 1051417. [Google Scholar] [CrossRef]
  8. Rnmesh, A.; Pkg, B. Kinetic modeling of Indian lignites pyrolysis in the context of underground coal gasification (UCG). Fuel 2021, 283, 118939. [Google Scholar]
  9. Leokadia, R. Vitrinite reflectance as a measure of the range of influence of the temperature of a georeactor on rock mass during underground coal gasification. Fuel 2018, 224, 94–100. [Google Scholar]
  10. Su, C.; Qiu, J.; Wu, Q.; Weng, L. Effects of high temperature on the microstructure and mechanical behavior of hard coal. Int. J. Min. Sci. Technol. 2020, 30, 643–650. [Google Scholar] [CrossRef]
  11. Akbarzadeh, H.; Chalaturnyk, R.J. Structural changes in coal at elevated temperature pertinent to underground coal gasification: A review. Int. J. Coal Geol. 2014, 131, 126–146. [Google Scholar] [CrossRef]
  12. Saik, P.; Berdnyk, M. Mathematical model and methods for solving heat-transfer problem during underground coal gasification. Min. Miner. Depos. 2022, 16, 87–94. [Google Scholar] [CrossRef]
  13. Daggupati, S.; Mandapati, R.N.; Mahajani, S.M.; Ganesh, A.; Mathur, D.K.; Sharma, R.K.; Aghalayam, P. Laboratory studies on combustion cavity growth in lignite coal blocks in the context of underground coal gasification. Energy 2010, 35, 2374–2386. [Google Scholar] [CrossRef]
  14. Luo, J.A.; He, J. Mechanical Characteristics of Sandstone under High Temperature and Cyclic Loading in Underground Coal Gasification. Minerals 2022, 12, 1313. [Google Scholar] [CrossRef]
  15. Li, M.; Wang, D.; Shao, Z. Experimental study on changes of pore structure and mechanical properties of sandstone after high-temperature treatment using nuclear magnetic resonance. Eng. Geol. 2020, 275, 105739. [Google Scholar] [CrossRef]
  16. Xin, L.; Wang, Z.; Huang, W.; Kang, G.; Lu, X.; Zhang, P.; Wang, J. Temperature field distribution of burnt surrounding rock in UCG stope. Int. J. Min. Sci. Technol. 2014, 24, 573–580. [Google Scholar] [CrossRef]
  17. Xin, L.; Cheng, W.M.; Xie, J.; Liu, W.T.; Xu, M. Theoretical research on heat transfer law during underground coal gasification channel extension process. Int. J. Heat Mass Transf. 2019, 142, 118409. [Google Scholar] [CrossRef]
  18. Xin, L. Study on the Overling Strata Movement by UCG Mining in Matigou Coal Mine. Ph.D. Thesis, China University of Mining and Technology, Xuzhou, China, 2014. (In Chinese). [Google Scholar]
  19. Wang, J.; Wang, Z.; Xin, L.; Xu, Z.; Gui, J.; Lu, X. Temperature field distribution and parametric study in underground coal gasification stope. Int. J. Therm. Sci. 2017, 111, 66–77. [Google Scholar] [CrossRef]
  20. Wang, Z.; Wei, Y.; Hou, T.; Jin, Y.; Wang, C.; Liang, J. Large-scale laboratory study on the evolution law of temperature fields in the context of underground coal gasification. Chin. J. Chem. Eng. 2020, 28, 3126–3135. [Google Scholar] [CrossRef]
  21. Su, F.-Q.; Zhang, T.; Wu, J.-B.; Deng, Q.-C.; Hamanaka, A.; Yu, Y.-H.; Dai, M.-J.; He, X.-L.; Yang, J.-N. Energy recovery evaluation and temperature field research of underground coal gasification under different oxygen concentrations. Fuel 2022, 329, 125389. [Google Scholar] [CrossRef]
  22. Yang, L. Three-Dimensional Unstable Non-linear Numerical Analysis of the Underground Coal Gasification with Free Channel. Energy Sources Part A Recovery Util. Environ. Eff. 2006, 28, 1519–1531. [Google Scholar] [CrossRef]
  23. Liu, X.; Guo, G.; Li, H. Thermo-mechanical coupling numerical simulation method under high temperature heterogeneous rock and application in underground coal gasification. Energy Explor. Exploit. 2020, 38, 1118–1139. [Google Scholar] [CrossRef]
  24. Liu, X.; Guo, G.; Li, H. Study on the propagation law of temperature field in surrounding rock of underground coal gasification (UCG) combustion cavity based on dynamic thermal parameters. Results Phys. 2019, 12, 1956–1963. [Google Scholar] [CrossRef]
  25. Tian, H. Development of a Thermo-Mechanical Model for Rocks Exposed to High Temperatures During Underground Coal Gasification. Ph.D. Thesis, RWTH Aachen University, Aachen, Germany, 2013. [Google Scholar]
  26. Jowkar, A.; Sereshki, F.; Najafi, M. A new model for evaluation of cavity shape and volume during Underground Coal Gasification process. Energy 2018, 148, 756–765. [Google Scholar] [CrossRef]
  27. Wan, Z. Study on Thermal-Mechanical Coupling Process of Heterogeneous Rock Mass and Channel’s Stability of Underground Coal Gasification. Ph.D. Thesis, China University of Science and Technology, Xuzhou, China, 2006. [Google Scholar]
  28. Lu, Y.; Wang, L.; Tang, F.; He, Y. Fracture evolution of overlying strata over combustion cavity under thermal-mechanical interaction during underground coal gasification. J. China Coal Soc. 2012, 37, 1292–1298. (In Chinese) [Google Scholar]
  29. Zhang, L.; Mao, X.; Liu, R.; Li, Y.; Yin, H. Meso-structure and fracture mechanism of mudstone at high temperature. Int. J. Min. Sci. Technol. 2014, 24, 433–439. [Google Scholar] [CrossRef]
Figure 1. Borehole column diagram of Li 87.
Energies 18 00931 g001
Figure 2. Underground coal gasification mining model.
Energies 18 00931 g002
Figure 3. Variation in heat conductivity ratio km(T)/kmo of sandstone with temperature (taking siltstone as an example).
Energies 18 00931 g003
Figure 4. Distribution law of temperature field at different times, (a) t = 1 d, (b) t = 5 d, (c) t = 10 d, (d) t = 20 d, (e) t = 40 d, (f) t = 60 d, (g) t = 80 d, (h) t = 100 d, (i) t = 120 d, (j) t = 140 d, (k) t = 160 d, (l) t = 180 d, (m) t = 190 d.
Energies 18 00931 g004
Figure 5. Distribution range of temperature field in the coal wall, t = 5 d.
Energies 18 00931 g005
Figure 6. Distribution range of temperature field in the coal roof, t = 5 d.
Energies 18 00931 g006
Figure 7. Distribution range of temperature field in coal wall, t = 190 d.
Energies 18 00931 g007
Figure 8. Distribution range of temperature field in coal roof, t = 190 d.
Energies 18 00931 g008
Figure 9. Temperature distribution ranges (TDR) in front coal wall and roof when T = 100 °C and T = 600 °C.
Energies 18 00931 g009
Figure 10. Temperature distribution isotherms of T = 30 °C, 100 °C, and 600 °C at the end of gasifier operation time t = 190 d.
Energies 18 00931 g010
Figure 11. Location map of the low boundary of direct roof, +1 m position, and +2 m position horizontal line inside the direct roof.
Energies 18 00931 g011
Figure 12. Temperature distribution at the lower boundary of the coal seam roof.
Energies 18 00931 g012
Figure 13. Temperature field distribution at the +1 m position inside the direct roof.
Energies 18 00931 g013
Figure 14. Temperature field distribution at the +2 m position inside the direct roof.
Energies 18 00931 g014
Table 1. Selected thermal physical and mechanical parameters of coal and rock at room temperature.
Coal Rock CategoryThermal Conductivity, W/(m•°C)Density
kg/m3
Constant Pressure Specific Heat Capacity J/(kg•°C)
Coal seam 30.6514501000
Siltstone1.562300920
Medium-grained sandstone1.362350900
Fine-grained sandstone1.422350910
Ash layer0.178963900
Coal gas0.0251.1510
Table 2. Temperature distribution range of T = 100 °C and T = 600 °C in the front coal wall and roof.
In Front of Coal Wall/mIn Roof/m
Time/dT = 100 °CT = 600 °CT = 100 °CT = 600 °C
10.91 0.31 0.82 0.29
51.26 0.53 1.58 0.50
101.17 0.49 2.24 0.74
200.71 0.24 3.09 1.03
400.34 0.15 4.28 1.35
600.28 0.12 5.19 1.54
800.23 0.10 5.92 1.69
1000.25 0.11 6.56 1.87
1200.30 0.13 7.18 2.04
1400.24 0.11 7.76 2.21
1600.28 0.13 8.25 2.42
1800.27 0.12 8.72 2.59
1900.26 0.11 8.96 2.67
Disclaimer/Publisher’s Note: The statements, opinions and data contained in all publications are solely those of the individual author(s) and contributor(s) and not of MDPI and/or the editor(s). MDPI and/or the editor(s) disclaim responsibility for any injury to people or property resulting from any ideas, methods, instructions or products referred to in the content.

