Article

Study on Pore Structure of Tectonically Deformed Coals by Carbon Dioxide Adsorption and Nitrogen Adsorption Methods

1
Key Laboratory of Coalbed Methane Resources and Reservoir Formation Process, China University of Mining and Technology, Ministry of Education, Xuzhou 221008, China
2
School of Resources and Geosciences, China University of Mining and Technology, Xuzhou 221116, China
3
The Third Exploration Team of Anhui Coalfield Geology Bureau, Suzhou 234000, China
4
Anhui Transport Consulting & Design Institute Co., Ltd., Hefei 230088, China
5
National Engineering Research Center of Coal Preparation and Purification, China University of Mining and Technology, Xuzhou 221116, China
6
Department of Civil and Architectural Engineering and Construction Management, University of Wyoming, Laramie, WY 82071, USA
*
Author to whom correspondence should be addressed.
Energies 2025, 18(4), 887; https://doi.org/10.3390/en18040887
Submission received: 5 January 2025 / Revised: 7 February 2025 / Accepted: 10 February 2025 / Published: 13 February 2025
(This article belongs to the Collection Feature Papers in Carbon Capture, Utilization, and Storage)

Abstract

:
The study of pore characteristics in tectonic coal is essential for a deeper understanding of gas diffusion, seepage, and other transport processes within coal seams, and plays a crucial role in the development of coalbed methane resources. Based on low-temperature N2 and CO2 adsorption experiments, this study investigated the pore structure characteristics of four tectonic coal samples collected from the Hegang and Jixi basins in China. The results show that the mylonitic coal sample exhibits a clear capillary condensation and evaporation phenomenon around a relative pressure (P/P0) of 0.5. The degree of tectonic deformation in coal has a significant impact on its pore characteristics. As the degree of deformation increases, both the pore volume and specific surface area of the coal gradually increase. The pore volume and specific surface area of micropores are primarily concentrated in pores with diameters of 0.5–0.7 nm and 0.8–0.9 nm, while those of mesopores are mainly distributed in pores with diameters of 2.3–6.2 nm. The proportion of pore volume and specific surface area contributed by micropores is much greater than that of mesopores. The fractal dimension is positively correlated with the degree of tectonic deformation in coal. As the fractal dimension increases, the average pore diameter decreases, closely tied to the destruction and reconstruction of the coal’s pore structure under tectonic stress. These findings will contribute to a deeper understanding of the pore structure characteristics of tectonic coal and effectively advance coalbed methane development.

1. Introduction

Tectonic coal is widely developed in China, particularly in areas of intense tectonic deformation and tectonic stress concentration, such as the Hegang Basin and Jixi Basin. Coal that has undergone modification due to tectonic stress of varying intensities exhibits characteristics such as complex pore structures, poor permeability, weakened structural strength, and high gas content [1]. These factors significantly limit the development of coalbed methane resources. Under different levels of tectonic stress, the macroscopic coal structure and microscopic macromolecular structure can undergo varying degrees of damage, deformation, and even reorganization. This leads to changes in the internal pore structure of the coal, which, to some extent, manifests as differences in the coal’s methane adsorption and desorption characteristics [2,3,4,5,6]. Studying the pore system of coal is a crucial prerequisite for understanding the mechanisms of gas adsorption, desorption, diffusion, and seepage within coal reservoirs [7,8].
Tectonic coal refers to coal that has undergone tectonic stress. Numerous scholars have conducted research on the classification of tectonic coal types. Most studies classify tectonic coal into different types based on macroscopic or microscopic fracture characteristics, while some researchers have approached the issue from the perspective of the coal’s optical properties [9,10,11]. Based on the macroscopic fragmentation degree of the coal body, tectonic coal can be classified according to the degree of deformation and damage, ranging from cataclastic coal with slightly fragmented structure, clear layering, and larger block-like coal to granular coal with relatively fragmented structure in medium-sized particles or small pieces, and finally to mylonitic coal with an almost completely fragmented and powdery structure [12,13].
A variety of techniques are available for studying the pore characteristics of pore-rich materials like coal, with gas adsorption, fluid intrusion, and image analysis being among the most widely used methods. Among these, gas adsorption is widely used for characterizing pore features such as pore size distribution and specific surface area of coal, due to its low testing cost, high accuracy, and the flexibility to adjust the measurement range by changing the type of adsorbate gas [14,15]. The principle of gas adsorption for characterizing pore features is primarily based on the volumetric exchange of gas molecules and the capillary condensation phenomena occurring within the pores [16]. Commonly used adsorbate gases include methane, ethane, argon, carbon dioxide, nitrogen, and water vapor, with carbon dioxide and nitrogen [14,16,17,18,19]. Apart from gas adsorption methods, techniques like Small-Angle X-ray Scattering (SAXS), μCT, Micro-CT, Mercury Intrusion Porosimetry (MIP), Nuclear Magnetic Resonance (NMR), Transmission Electron Microscopy (TEM), and Scanning Electron Microscopy (SEM) are also commonly used to investigate the pore characteristics of coal and other porous media [14,15,18,20,21,22,23,24,25,26].
Four coal samples with varying degrees of tectonic deformation, located in the Hegang and Jixi mining areas, were selected to conduct low-temperature N2 adsorption and CO2 adsorption experiments, and the differences in pore structure characteristics of coal samples were analyzed. Building on the findings of the low-temperature N2 adsorption experiments, the FHH (Frenkel–Halsey–Hill) fractal model was employed to investigate the fractal characteristics of the coal pores. Finally, the relationship between gas adsorption capacity, pore parameters, and the fractal dimension in coal was discussed. These research findings preliminarily demonstrate the fundamental changes in the pore structure characteristics of coal as the degree of tectonic deformation increases. They lay the groundwork for further studies on processes such as methane diffusion and seepage in tectonically deformed coal seams, providing valuable insights for the safe and efficient development of coal and coalbed methane resources.

2. Samples and Experimental Methods

2.1. Geological Background and Sample Selection

The Hegang Basin and Jixi Basin have both undergone significant tectonic activities, resulting in complex geological structures. Since its formation, the Hegang Basin has mainly experienced NW-SE compression during the Yanshan period (135–65 Ma), NW-SE extension during the early Himalayan period (65–23 Ma), and NW-SE compression again during the late Himalayan period to the present day (23–0 Ma). Due to multiple complex tectonic events in various directions, the basin exhibits weak folding structures, but faults of various orientations are well developed and densely distributed (Figure 1a,b).
The Jixi Basin originated in the Late Jurassic, approximately 163 million years ago, and has since experienced tectonic movements during the Middle and Late Yanshan periods, as well as the Himalayan period. The directions of the tectonic stress fields varied during these different tectonic phases, resulting in the development of fault structures within the basin, characterized by a large number of faults, multiple tectonic events, and mutual intersection. The Pingma Fault, located in the central part of the basin, divides it into two subsiding areas, with well-developed fault and fold structures throughout the region (Figure 1a,c).
Four samples with different degrees of tectonic deformation were selected for this experiment. The background information of the samples is shown in Table 1. Sample 1-AN11 was taken from the No. 11 coal seam of the Xing’an Coal Mine in the Hegang Basin and is classified as mylonitic coal, with the highest degree of tectonic deformation. The coal structure is almost completely fragmented, and mylonitic coal is essentially a powdery particulate material. Sample 2-YX15 was taken from the No. 15 coal seam of the Yixin Coal Mine in the Hegang Basin and is classified as granular coal. The coal structure is relatively fragmented, the layering is almost invisible, and it can be crushed into granules by hand. Sample 3-PG14 and sample 4-CS3 were taken from the No. 14 coal seam of the Pinggang Coal Mine and the No. 3 coal seam of the Chengshan Coal Mine in the Jixi Basin, respectively. Both are classified as cataclastic coal with the least degree of tectonic deformation. The coal structure is less fragmented, the layering is clearer, and they can hardly be broken by hand.

2.2. Methods

2.2.1. Low-Temperature N2 Adsorption

In this study, a fully automated specific surface area and porosity analyzer (NO-VA4200e, Quantachrome, Boynton Beach, FL, USA) was used to carry out low-temperature N2 adsorption experiments. By varying the pressure conditions, the amount of nitrogen adsorbed and desorbed by the samples was measured and recorded. The adsorption–desorption isotherms were then plotted and analyzed, allowing for the characterization of key pore parameters such as pore size, pore volume, and specific surface area.
At the start of the experiment, the pre-prepared coal powder sample (processed into 35–80 mesh using a crusher and sieves) was loaded into a sample tube, weighed, and recorded. After removing the sealing nut from the degassing station port, the sample tube was securely connected. Then, the heating sleeve was placed over the lower end of the sample tube. The sample was subjected to pretreatment under high-temperature and vacuum conditions. After completing the pretreatment and allowing the sample tube to cool, the heating sleeve was repositioned. The sample tube was then removed, and the sealing nut was securely tightened. It was important to weigh the sample both before and after pretreatment. Next, the pretreated sample tube was weighed and recorded, then connected to the interface on the analysis station. Liquid nitrogen was poured into a clean and dry Dewar flask until it was about 1/4 from the flask’s mouth, and the flask was placed on the elevator platform of the analysis station. Once the parameters were set, the experiment was initiated. After the experiment, the sample tube was removed, and the sealing nut was tightened.
Based on the low-temperature N2 adsorption process in coal, as the relative pressure increases, gas molecules condense within pores of specific size ranges, a phenomenon known as capillary condensation. The maximum pore diameter at which capillary condensation occurs can be calculated using the Kelvin equation:
rk = −2γVm cosφ/R·T·ln x
where rk is the maximum pore radius for capillary condensation; γ is the surface tension of liquid nitrogen, 8.85 × 10⁻³ N/m; the molar volume is Vm, 3.465 × 10⁻⁵ m3; the temperature is 77.3 K; the contact angle φ is 0°; R = 8.15 J/(K·mol); and x is the relative pressure.
Based on existing research, coal is a typical medium with a porous system [2]. The fractal dimension, an index used to describe the shape and structural complexity of fractal objects, is commonly employed to characterize the pore features of coal [27,28,29,30]. In this study, the widely applied FHH (Frenkel–Halsey–Hill) model, which considers a single gas adsorption isotherm, was selected. It can be calculated using the following method:
ln(V/Vm) = Aln[ln(P0/P)] + C
In the equation, Vm is the volume of adsorbed gas in the monolayer; P represents the equilibrium pressure of the gas, in MPa; V represents the volume of gas adsorbed at equilibrium pressure, in cm3/g; P represents the equilibrium pressure of the gas, in MPa; P0 refers to the saturated vapor pressure of the gas, in MPa; and A is the linear relationship coefficient between lnV and ln(ln(P0/P)), its magnitude being primarily influenced by the fractal dimension of the pores and the gas adsorption characteristics.
The fractal dimension D is determined by the value of parameter A. Generally, when the relative pressure is within a low range (P/P0 < 0.5), the adsorption of gas molecules by the pores primarily relies on van der Waals forces at the gas-solid interface. Under these conditions, the fractal dimension D and parameter A can be expressed as follows:
A = (D − 3)/3
In the equation, D denotes the fractal dimension of the pores.
When the relative pressure is high (P/P0 > 0.5), gas adsorption in the pores may exhibit capillary condensation. Under these conditions, the relationship between the fractal dimension D and parameter A is expressed as follows:
A = D − 3

2.2.2. CO2 Adsorption Experiment

Similarly to the low-temperature N2 adsorption experiment, the CO2 adsorption experiment involved analyzing the pore structure characteristics of the sample by measuring the amount of CO2 gas adsorbed at different relative pressures (P/P0). The experiment was conducted using an ASAP2020HD88 fully automatic gas adsorption analyzer (Micromeritics, Norcross, GA, USA).
The sample was prepared as 35–80 mesh powdered coal and underwent pretreatment (heating and degassing) to remove moisture and other impurities. The sample was weighed before and after pretreatment, and the weights were recorded. The sample tube containing the pretreated sample was connected to the analysis station interface. Liquid CO2 was poured into a Dewar flask, which was then placed on the elevator platform of the analysis station. After setting the experimental parameters, the experiment was initiated. Once the experiment was completed, the sample tube was removed, and the software, computer, and main unit were sequentially shut down. Throughout the adsorption process, the sample was maintained at the temperature of liquid CO2.

3. Results

3.1. Adsorption and Desorption Characteristics

Based on the IUPAC classification method for pores, pores with diameters smaller than 2 nm are classified as micropores, those with diameters ranging from 2 to 50 nm as mesopores, and pores with diameters greater than 50 nm as macropores [31]. Different technical methods exhibit varying advantages in terms of the pore size range they are most suitable for when conducting porosity tests on porous media. When testing the pore characteristics of porous media, different experimental methods are suited for different pore size ranges. Because CO2 molecules are smaller than N2 molecules, and CO2 adsorption in micropores primarily involves both physical and chemical adsorption, whereas N2 adsorption typically only involves physical adsorption, CO2 adsorption experiments are more suitable for accurately measuring micropores with smaller pore sizes (<2 nm) in materials. In contrast, low-temperature N2 adsorption experiments are better suited for measuring mesopores with pore sizes ranging from 2 to 50 nm in the material [32]. According to the IUPAC classification of adsorption isotherms, both low-temperature N2 and CO2 adsorption processes exhibit a gradual increase in adsorption as relative pressure increases, and thus both, belong to Type II, which corresponds to the transition from monolayer to multilayer adsorption.

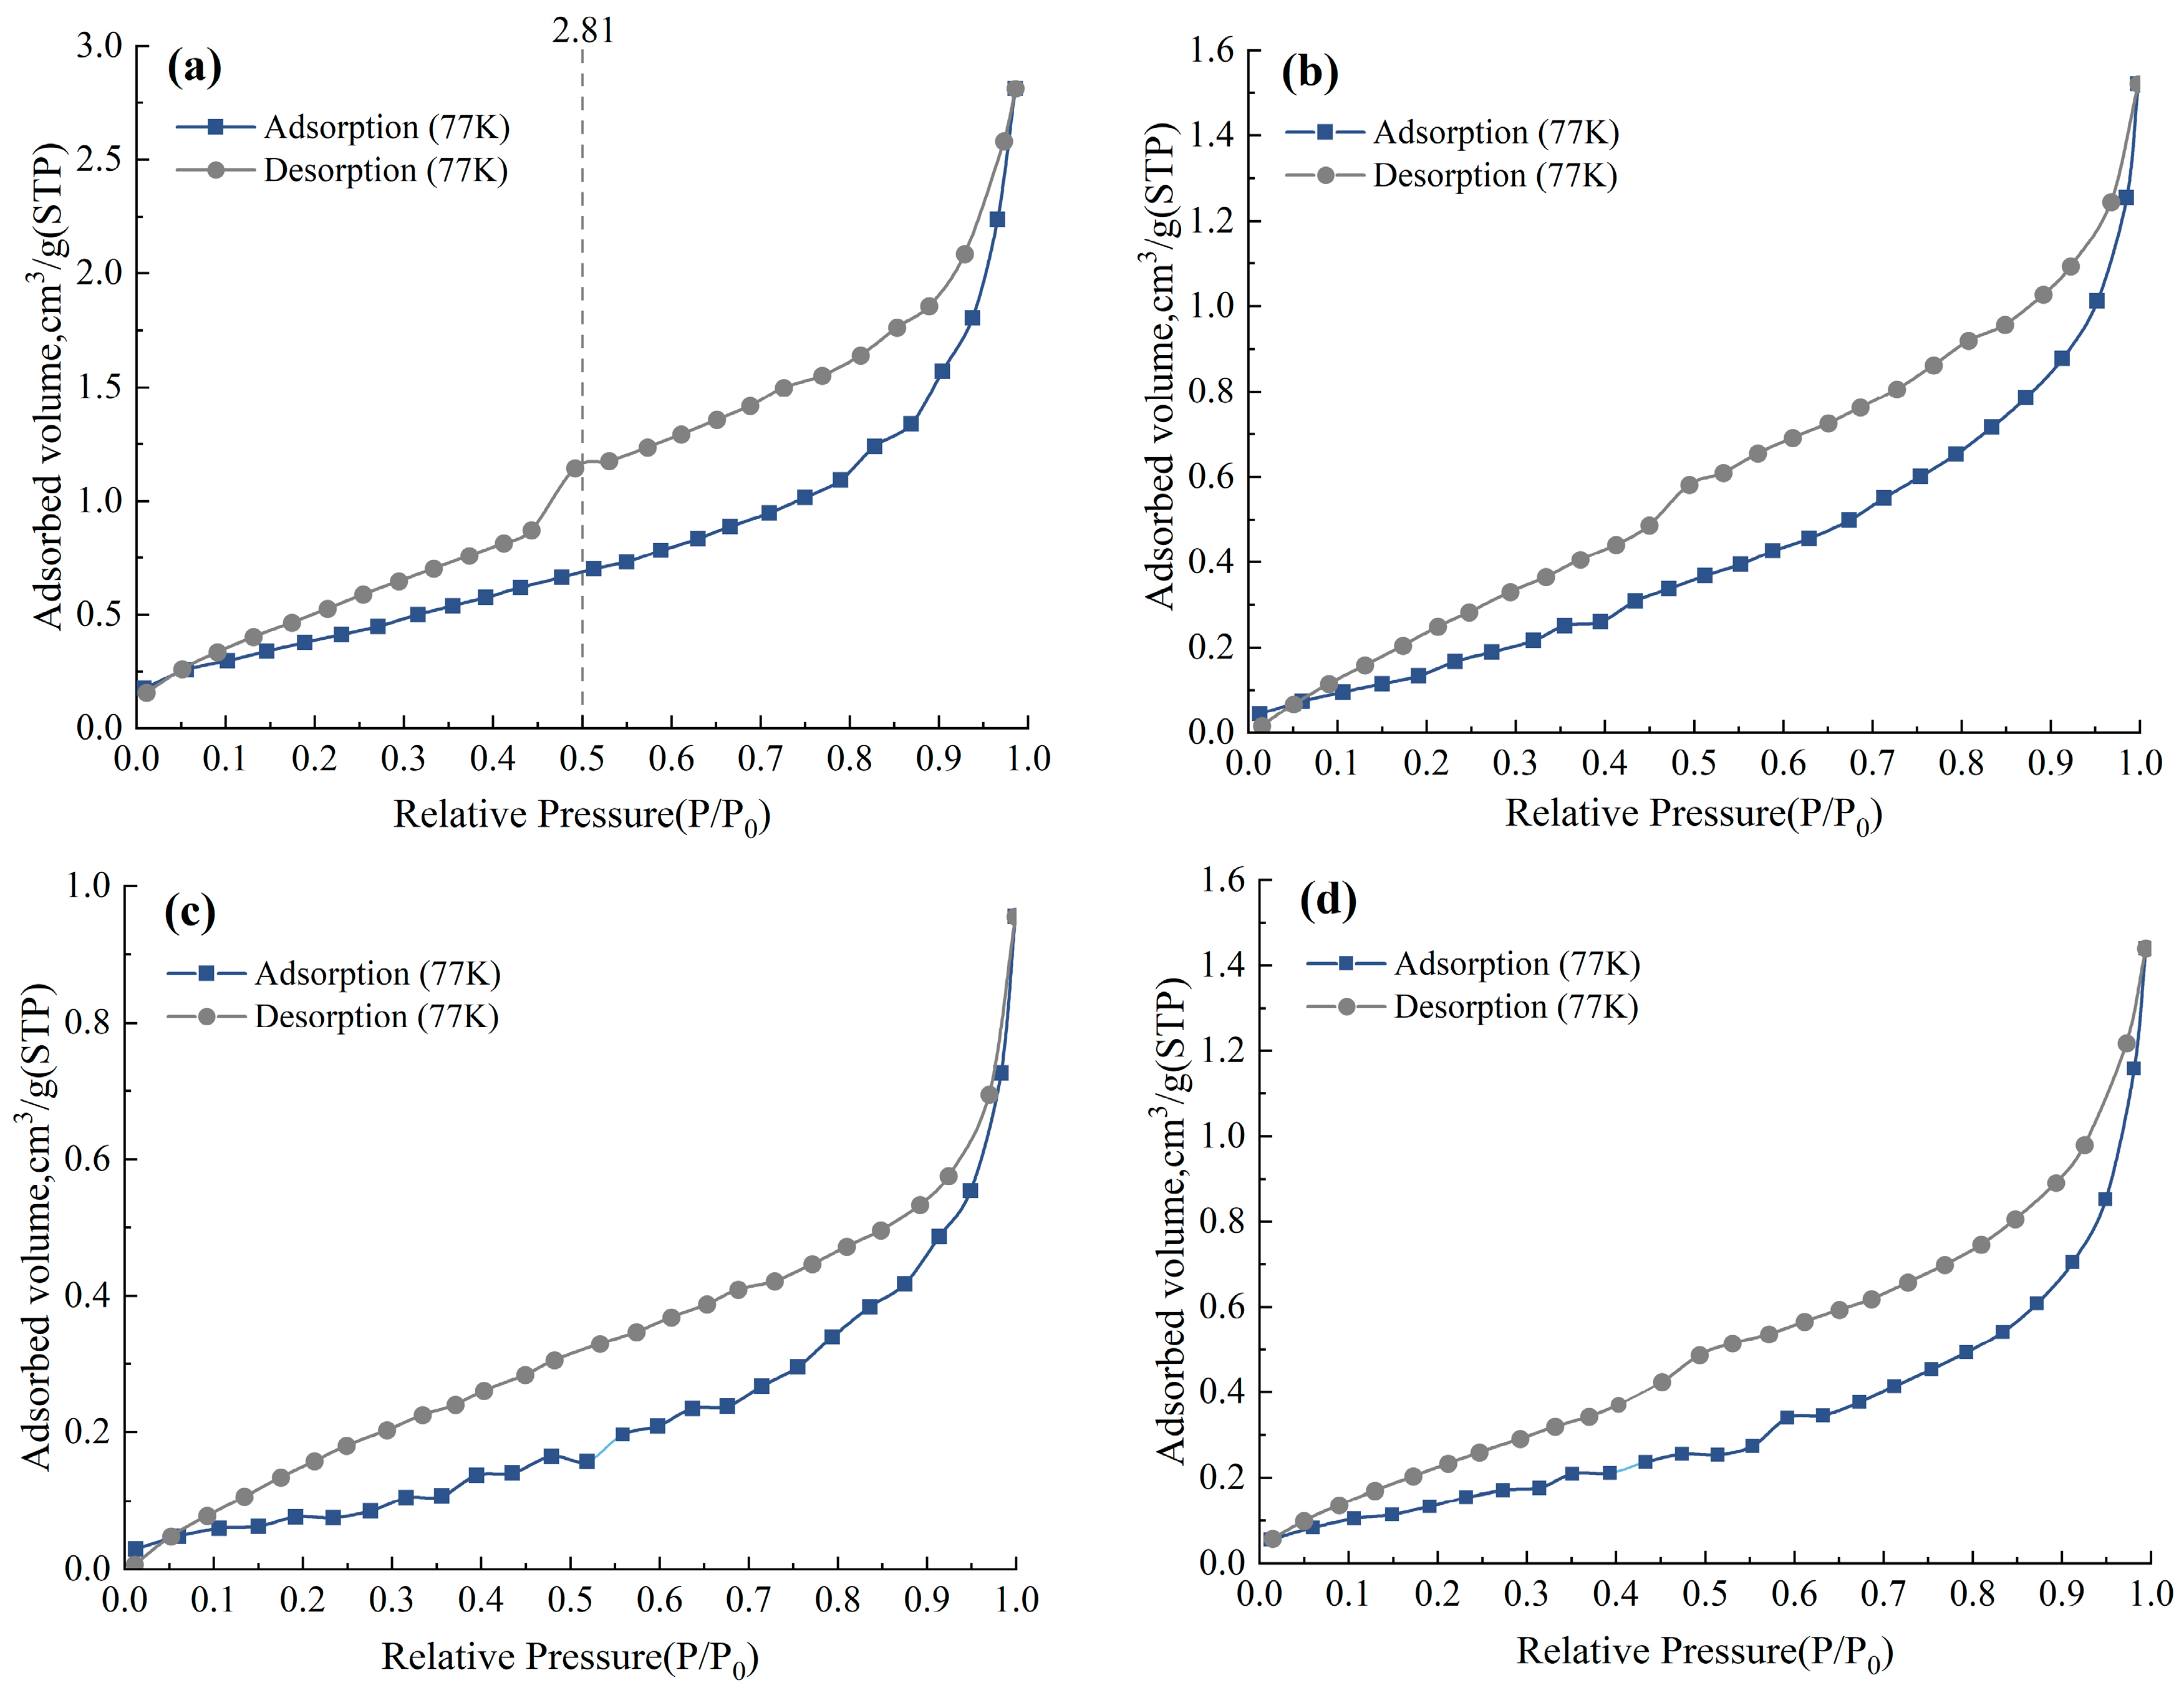
3.1.1. Mesoporous Adsorption and Desorption Characteristics

As illustrated in Figure 2, the low-temperature N2 adsorption–desorption curves of the four samples all exhibit an inverted “S” shape, with an overall similar trend, yet subtle differences still exist. At lower relative pressures (P/P0 < 0.3), the adsorption–desorption curves show a slight upward convexity, with the gas adsorption volume increasing as the relative pressure rises. The rate of increase is slightly variable, though not significantly so. Under these pressure conditions, gas molecules adsorb on the pore surface in a monolayer form. At higher relative pressure conditions (0.7 < P/P0 < 1), the adsorption–desorption curves show a downward concave shape, with the gas adsorption volume increasing as the relative pressure rises, and the rate of increase becoming progressively faster. As the relative pressure (P/P0) approaches the saturation vapor pressure (P/P0 = 1), the adsorption–desorption curve becomes nearly vertical, indicating no adsorption saturation phenomenon. At relative pressures between 0.3 and 0.7 (0.3 < P/P0 < 0.7), the adsorption capacity exhibits an approximate linear relationship with the relative pressure, increasing uniformly as the relative pressure rises.
Among the four experimental samples selected, only sample 1-AN11 exhibits a distinct inflection point (P/P0 = 0.5) on its N2 desorption curve. At this point, when the relative pressure decreases to 0.5, the N2 adsorption in sample 1-AN11 rapidly decreases, while the desorption volume increases sharply. This indicates that during the low-temperature N2 adsorption process, as the relative pressure increases, not only do N2 molecules transition from monolayer adsorption to multilayer adsorption, but also, when the relative pressure reaches the condensation pressure corresponding to the Kelvin radius of the pores, capillary condensation occurs [33]. As the relative pressure continues to decrease, the previously adsorbed N2 molecules begin to desorb, and when the relative pressure drops to the evaporation pressure, the condensed N2 molecules on the pore surface are suddenly released, causing a rapid reduction in N2 adsorption [34,35]. In Figure 2a, at the relative pressure P/P0 = 0.5, the pore diameter corresponding to this inflection point is calculated to be 2.81 nm based on the Kelvin equation.
Different types of materials yield distinct adsorption isotherm patterns when analyzed using gas adsorption methods. In 2015, the International Union of Pure and Applied Chemistry (IUPAC) updated the classification of adsorption hysteresis loops originally defined in 1985, expanding from four types (H1, H2(a), H3, and H4) to six types: H1, H2(a), H2(b), H3, H4, and H5 [31]. As shown in Figure 2a–d, the adsorption–desorption curves of the four tectonic coal samples exhibit similar adsorption hysteresis loop types. They all diverge at a relative pressure of (P/P0 = 1.0) and reconverge at approximately (P/P0 = 0.1). Therefore, they are all classified as H3-type adsorption hysteresis loops.

3.1.2. Microporous Adsorption Characteristics

Unlike the low-temperature N2 adsorption experiment, the CO2 adsorption isotherms of all four samples exhibit an upward convex shape (Figure 3). The CO2 adsorption capacity increases steadily with rising relative pressure, while the rate of increase gradually decreases. Notably, the maximum CO2 adsorption capacity was not reached by the end of the experiment. Among them, the 1-AN11 sample (mylonitic coal), which exhibits the highest degree of tectonic deformation, shows the greatest CO2 adsorption capacity, while the 4-CS3 sample (cataclastic coal), with the lowest degree of tectonic deformation, shows the smallest CO2 adsorption capacity. Figure 2 and Figure 3 clearly illustrate that the CO2 adsorption capacities of the four samples are significantly higher than their N2 adsorption capacities.

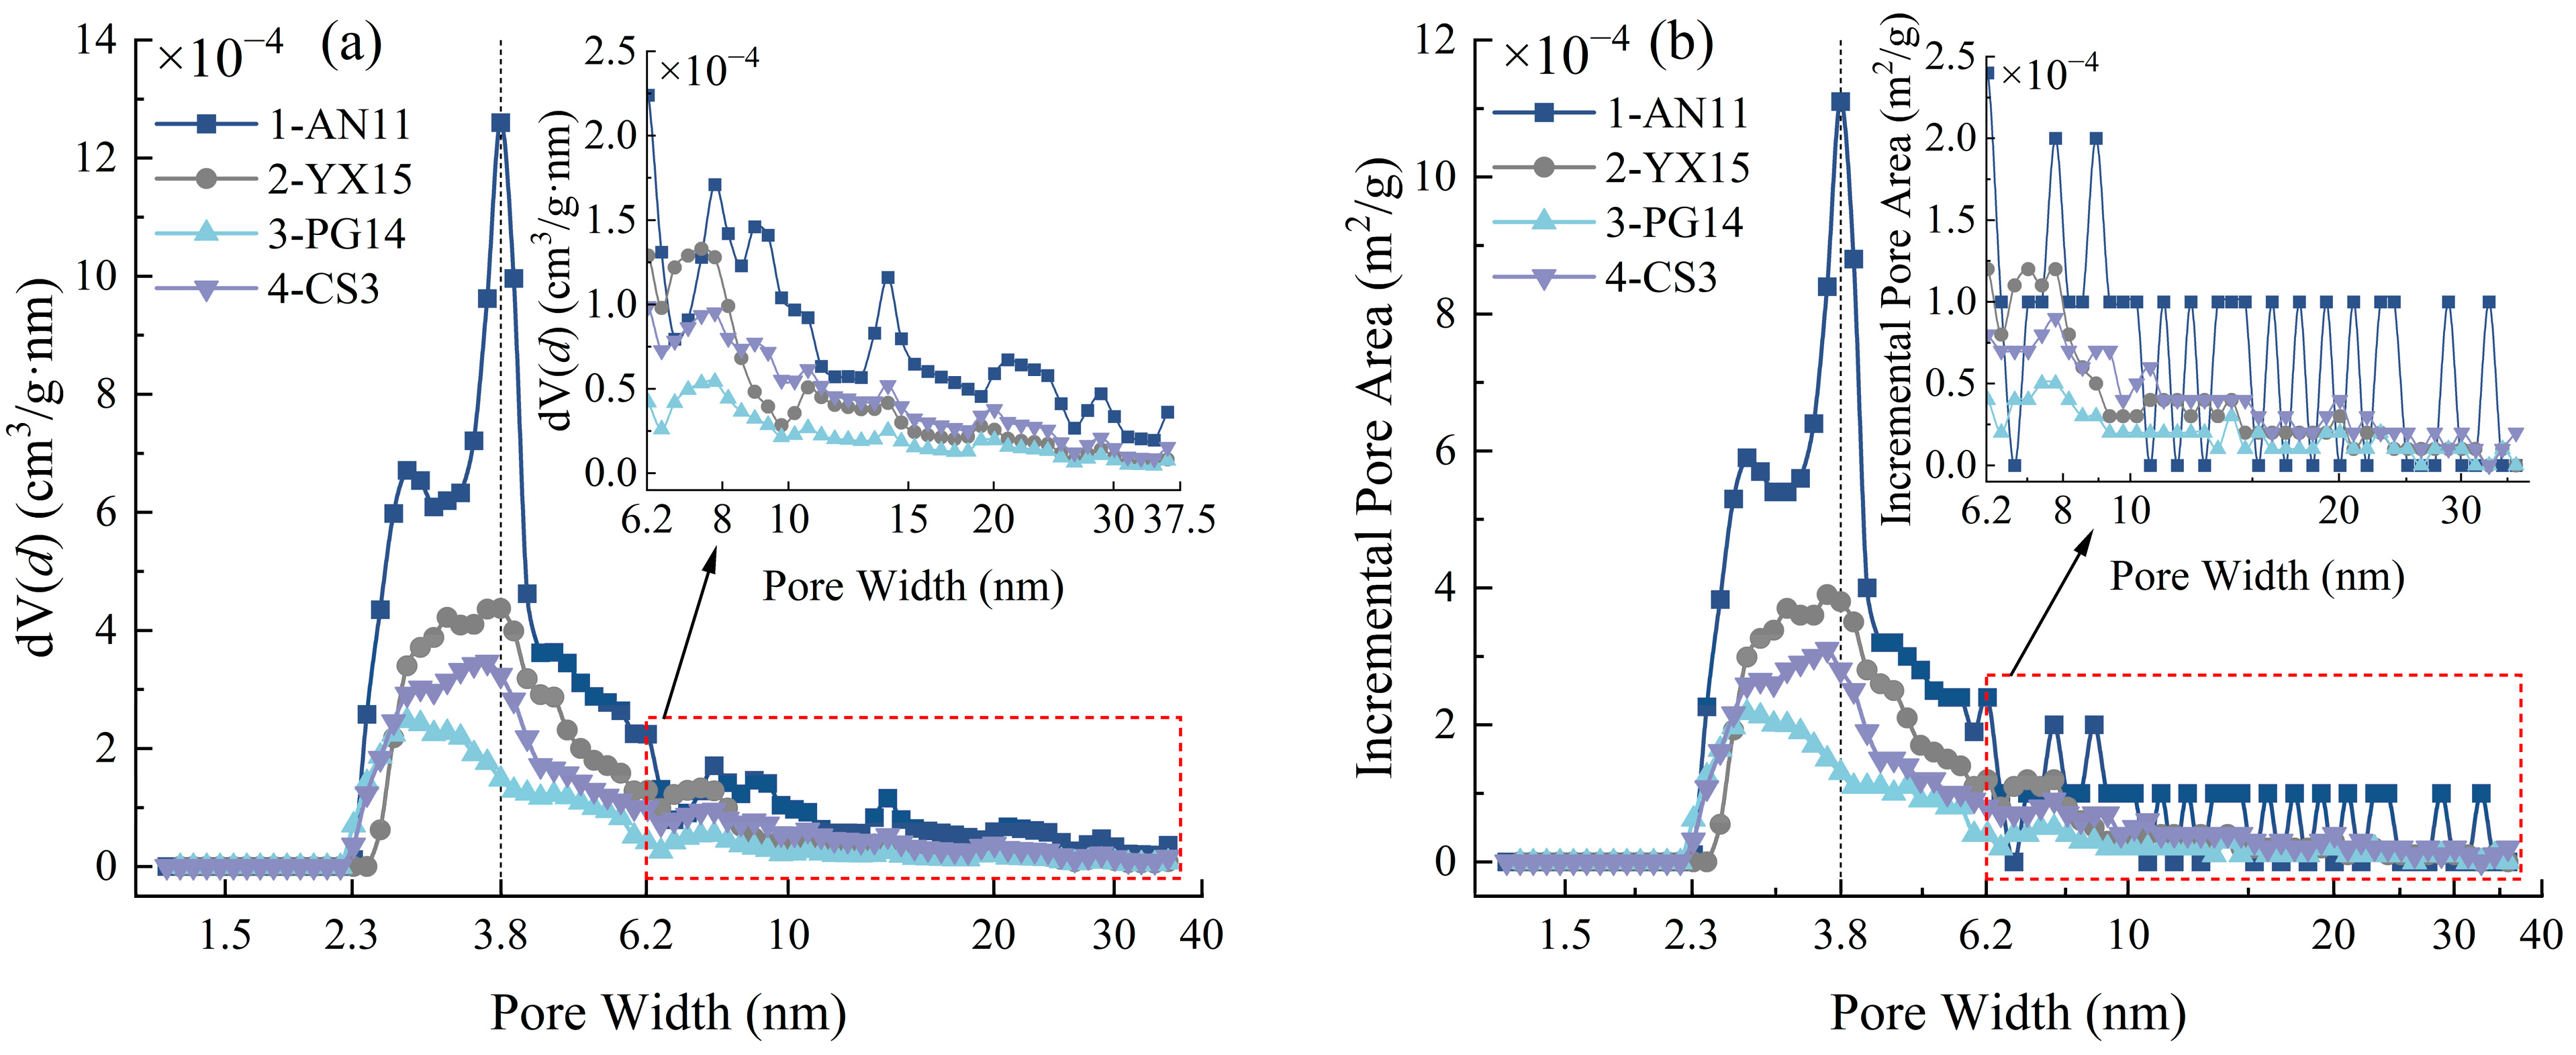
3.2. Pore Distribution

Based on the data from low-temperature N2 adsorption and CO2 adsorption experiments, the DFT (Density Functional Theory) model was used to calculate and analyze the pore volume, pore-specific surface area, and pore size distribution of micropores (<2 nm) and mesopores (2–50 nm) in the four tectonic coal samples.
Figure 4a,b show the distribution of micropore volume and pore-specific surface area across different pore sizes. As the pore diameter increases, the pore volume and pore-specific surface area of all samples exhibit an “increase–decrease–increase–decrease” M-shaped bimodal distribution. The two peaks of the M-shaped curve indicate that within these pore diameter ranges, both the micropore volume and pore-specific surface area are relatively high, meaning the micropores are primarily concentrated within these two ranges: 0.5–0.7 nm and 0.8–0.9 nm. Among them, the pore diameter range of 0.5–0.7 nm has the largest proportion of pores. Based on the height of the curves for each sample, the 1-AN11 sample (mylonitic coal), which has the highest degree of tectonic deformation, shows the largest pore volume and pore-specific surface area, while the 4-CS3 sample (cataclastic coal), with the least tectonic deformation, exhibits the smallest pore volume and pore-specific surface area.
As shown in Figure 5a,b, the distribution of mesopore volume and pore-specific surface area across different pore sizes in the four experimental samples is presented. As the pore diameter increases, the mesopore volume and pore-specific surface area of all samples exhibit the same trend, showing a unimodal distribution with an “increase–decrease” pattern. The mesopores are primarily distributed between 2.3 nm and 6.2 nm. Based on the order of the curve heights in the figure, it is evident that the mesopore volume and pore-specific surface area of the 1-AN11 (mylonitic coal) sample, which exhibits the highest degree of tectonic metamorphism, remain the largest among the four samples, while the 3-PG14 (cataclastic coal) sample, with a relatively lower degree of tectonic deformation, shows the smallest values.
By comparing the vertical axes of Figure 4 and Figure 5, it can be observed that the pore volume and pore-specific surface area of micropores differ by two orders of magnitude, while the pore volume and pore-specific surface area of mesopores are on the same order of magnitude, but both are much smaller than those of micropores. This indicates that the total pore volume and pore-specific surface area of the four samples primarily come from micropores, as also demonstrated in Figure 6.
According to Table 2 and Figure 6a, the total pore volume of the coal samples, from largest to smallest, has the following order: mylonitic coal (1-AN11), granulitic coal (2-YX15), cataclastic coal 2 (3-PG14), and cataclastic coal 1 (4-CS3). Similarly, the pore volumes of micropores and mesopores also generally follow this order: mylonitic coal > granulitic coal > cataclastic coal. In other words, as the coal structure undergoes deformation and damage under tectonic stress, the internal pore volume of the coal correspondingly increases [36].
As shown in Figure 6b, the specific surface area of the pores in coal exhibits the same trend as the pore volume. The total pore-specific surface area, as well as the specific surface area of both micropores and mesopores, increases with the degree of tectonic deformation in coal. Although both micropore and mesopore specific surface areas increase with the degree of tectonic deformation, the increase in mesopores is slightly more significant, causing the micropore-specific surface area to account for a smaller portion of the total pore surface area, while the contribution of mesopores to the total surface area shows a slight rise.

4. Discussion

4.1. Study on the Evolution Characteristics and Formation Mechanism of Pore Structures in Tectonic Coals

The differences among coals with varying degrees of tectonic deformation are primarily manifested microscopically through variations in their pore characteristics [37]. Although both 3-PG14 (cataclastic coal 2) and 4-CS3 (cataclastic coal 1) are classified as cataclastic coals within tectonically deformed coal, differences in factors such as the intensity and direction of tectonic stress, original coal formation conditions, coal quality, and the development of fracture systems in the coal lead to variations in the proportion of mesopores and micropores. As the degree of structural deformation in coal increases, the pore volumes of both micropores and mesopores gradually increase. However, due to the different rates of increase, their proportions within the total pore volume change differently. The proportion of micropore volume in the total pore volume slightly decreases, while the proportion of mesopore volume gradually increases.
The structural deformation of coal refers to the process in which tectonic stress acts on the coal body, causing changes in its shape, structure, and pore characteristics [38]. Under the action of tectonic stress, micropores and mesopores in coal can transform into each other, and their formation and evolution process can be divided into two types: physical process and chemical process [37,39,40]. This physical process mainly involves the potential cutting or tearing of coal pore structural units containing micropores and mesopores under tectonic stress, along with possible structural changes like shrinkage or expansion. In this process, the micropores and mesopores in the original pore structure units are destroyed, and some substances are precipitated and migrated, thus forming new pore structure units with different micropores and mesopores from the original pore structure. Aromatic layers are a key component of the organic matter in coal. During the coalification process, macromolecules such as aromatic layers aggregate under physical and chemical influences, forming complex structures of micropores and mesopores [41]. The chemical process of the formation and evolution of micropores and mesopores during the deformation of coal structures refers to the structural stress breaking the weak chemical bonds between molecular structure branches, aromatic rings, etc., in the original pores, causing some large molecular structures to fall off, generating gaseous and liquid substances, or re-stacking and aggregating together to form new pore structures.

4.2. Fractal Characteristics of Pores

The fractal dimension, as an indicator of the irregularity of a shape, the complexity of its structure, and the efficiency of space occupation, is commonly used to characterize the irregularity of pore shapes and the complexity of pore structures within coal [42]. Based on the FHH fractal theory, the fractal dimension of pores is positively correlated with the irregularity of their geometric shape and the complexity of the pore structure. In other words, a larger fractal dimension indicates more irregular pore shapes and more complex pore structures [43,44]. If the fractal dimension of the pores is between 2 and 3, it indicates that the pore structure exhibits strong fractal characteristics. Conversely, if the fractal dimension falls outside this range, the pore structure lacks fractal features. Specifically, when the fractal dimension is close to 2, it suggests that the pore structure is simple with smooth surfaces. When the fractal dimension approaches 3, it indicates that the pore geometry is highly irregular and the pore structure is complex [45,46].
According to the FHH fractal theory, the low-temperature N2 adsorption experimental data were divided into two groups based on the relative pressure P/P0 = 0.5: the low-pressure segment (P/P0 < 0.5) and the high-pressure segment (P/P0 > 0.5). The fractal dimensions obtained through fitting are denoted as D1 and D2 (Table 2).
The calculation results are shown in Table 2, the determination coefficient R2 of the data fitting for the four samples is greater than 0.85, indicating a high degree of goodness of fit and reliable fitting results. Moreover, except for the fractal dimension D1 of the 2-YX15 sample in the low-pressure segment, which falls outside the valid range of 2–3, the fractal dimensions of all other samples are within the valid range, indicating that the pores in all four tectonically deformed coal samples exhibit clear fractal characteristics. As shown in Figure 7, the fractal dimension D1 in the low-pressure segment is consistently lower than the fractal dimension D2 in the high-pressure segment. After removing outliers, D1 in the low-pressure segment gradually increases with the degree of structural deformation in the coal samples, while D2 in the high-pressure segment exhibits no clear pattern. Therefore, the fractal dimension (D1) in the low relative pressure range (P/P0 < 0.5) is selected for further discussion (Table 3).
Since the fractal dimension of the 2-YX15 sample is anomalous, it is highlighted separately. As shown in Figure 8a–c, the pore area, pore volume, and gas adsorption capacity all show a positive correlation with the fractal dimension. This is because the fractal dimension is positively correlated with the degree of structural deformation in coal. As the degree of deformation increases, both the pore specific surface area and pore volume in coal also increase [15]. An increase in pore specific surface area and volume creates more adsorption sites for gas molecules, thus improving the adsorption capacity.
As shown in Figure 8d, the average pore width decreases as the fractal dimension increases. The average pore width generally refers to the ratio of the total pore width to the total number of pores. As the degree of structural deformation in the coal increases, although the proportion of micropores in the overall pore volume and pore area decreases, the number of micropores continues to increase, and the rate of increase is much faster than that of mesopores. As a result, the average pore width gradually decreases with the increase in the fractal dimension of the coal pores.

5. Conclusions

Through low-temperature N2 and CO2 adsorption experiments, an investigation was conducted on the pore properties of coal samples with different structural deformation extents. A detailed analysis was conducted on the impact of the structural deformation evolution process of coal on its internal pore distribution and fractal characteristics. Based on the analysis, the conclusions are as follows:
(1)
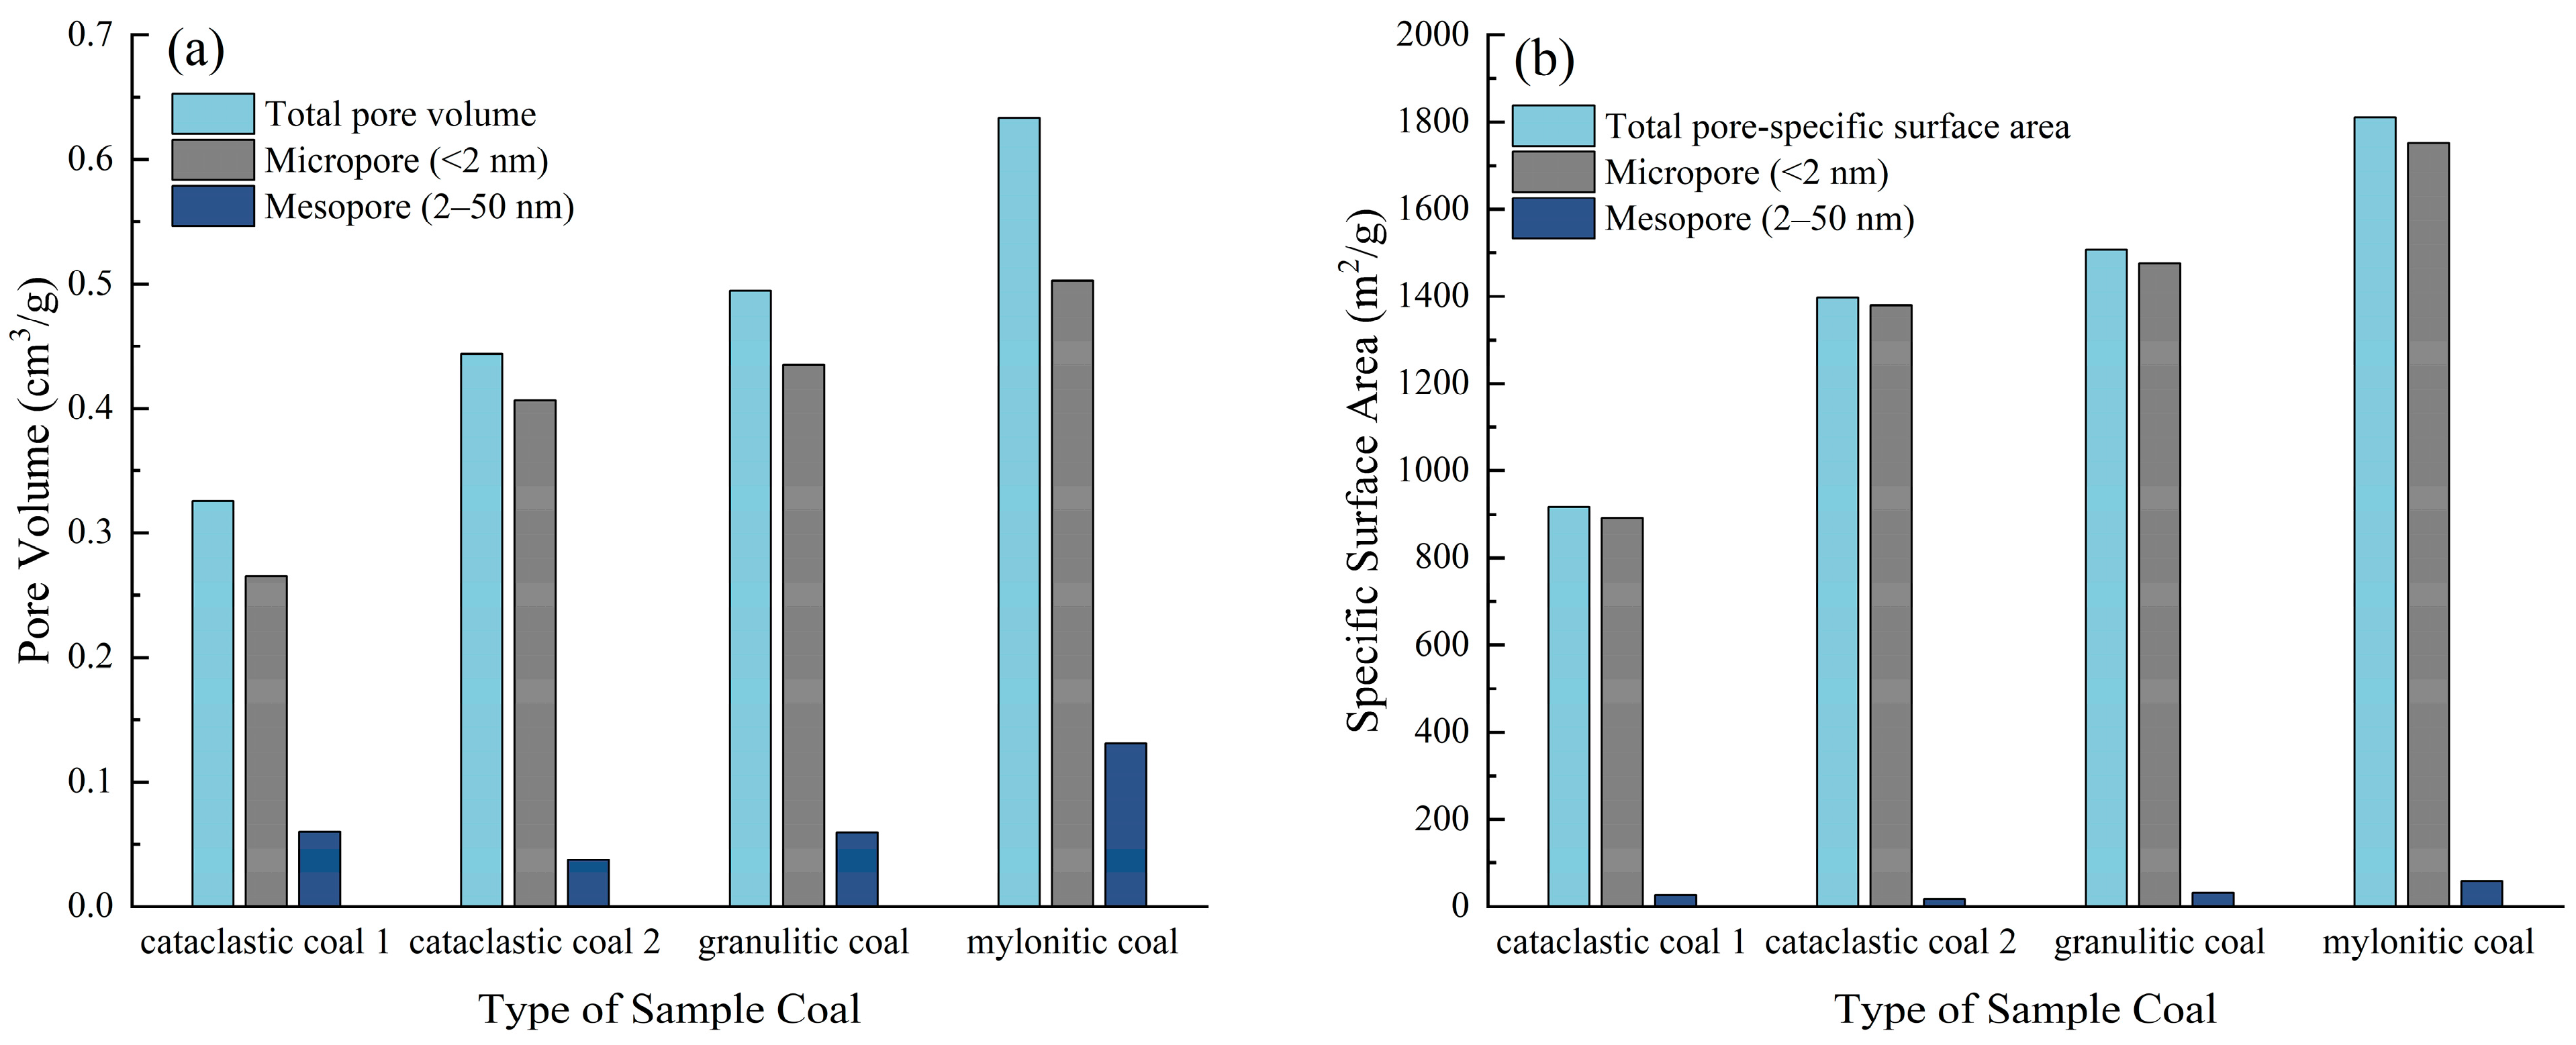
The adsorption of N2 and CO2 gases by the four tectonically deformed coal samples is primarily physical adsorption. The low-temperature N2 adsorption–desorption isotherms of these samples all fall under the H3 type according to the IUPAC classification. The degree of structural deformation in coal has a significant impact on its pore characteristics. As the degree of deformation increases, both the pore volume and specific surface area of the coal continue to grow, with the increase in micropore volume and specific surface area being slightly slower than that of mesopores. This is closely related to the destruction and reorganization of the pore structure under tectonic stress.
(2)
The degree of structural deformation in coal affects the pore fractal dimension, and a positive correlation exists between the two when the relative pressure is low (P/P0 < 0.5). At a relative pressure of P/P0 < 0.5, as the fractal dimension increases, the pore volume, specific surface area, and gas adsorption capacity of coal gradually increase, while the average pore size of the coal pores gradually decreases with the increase in the fractal dimension.

Author Contributions

J.Z., writing—original draft preparation, methodology; H.H., writing—review and editing, supervision, funding acquisition; W.Z., writing—original draft preparation, L.S., data curation; Z.H., Conceptualization, formal analysis. All authors have read and agreed to the published version of the manuscript.

Funding

This research was supported by the following: National Natural Science Foundation of China (42030810), the Fundamental Research Funds for the Central Universities (2019XKQYMS57), Mining fissure field characteristics in high gas working panels in Jixi mining area and its influence on gas control (2021060117), Investigating the Mechanisms and Mitigation of Well Instability and Gas Plugging in Gob Gas Ventholes within High Mining Height Panels in the Huaibei Mining Area (2024060107). Research on basic theory and technology of gas control in large-scale area of high methane mine (No. 2024220169).

Data Availability Statement

The original contributions presented in the study are included in the article, further inquiries can be directed to the corresponding author.

Conflicts of Interest

Author Wenbing Zhou was employed by the company Anhui Transport Consulting & Design Institute Co., Ltd. The remaining authors declare that the research was conducted in the absence of any commercial or financial relationships that could be construed as a potential conflict of interest.

References

  1. Lu, S.; Wang, C.F.; Liu, Q.Q.; Zhang, Y.L.; Liu, J.; Sa, Z.Y.; Wang, L. Numerical assessment of the energy instability of gas outburst of deformed and normal coal combinations during mining. Process Saf. Environ. Prot. 2019, 132, 351–366. [Google Scholar] [CrossRef]
  2. Ju, Y.; Li, X. New research progress on the ultrastructure of tectonically deformed coals. Prog. Nat. Sci. Mater. Int. 2009, 19, 1455–1466. [Google Scholar] [CrossRef]
  3. Lu, S.; Li, L.; Cheng, Y.; Sa, Z.; Zhang, Y.; Yang, N. Mechanical failure mechanisms and forms of normal and deformed coal combination containing gas: Model development and analysis. Eng. Fail. Anal. 2017, 80, 241–252. [Google Scholar] [CrossRef]
  4. Pan, J.; Wang, S.; Ju, Y.; Hou, Q.; Niu, Q.; Wang, K.; Li, M.; Shi, X. Quantitative study of the macromolecular structures of tectonically deformed coal using high-resolution transmission electron microscopy. J. Nat. Gas Sci. Eng. 2015, 27, 1852–1862. [Google Scholar] [CrossRef]
  5. Qu, Z.; Wang, G.G.X.; Jiang, B.; Rudolph, V.; Dou, X.; Lit, M. Experimental Study on the Porous Structure and Compressibility of Tectonized Coals. Energy Fuels 2010, 24, 2964–2973. [Google Scholar] [CrossRef]
  6. Wang, Z.Y.; Cheng, Y.P.; Zhang, K.Z.; Hao, C.M.; Wang, L.; Li, W.; Hu, B. Characteristics of microscopic pore structure and fractal dimension of bituminous coal by cyclic gas adsorption/desorption: An experimental study. Fuel 2018, 232, 495–505. [Google Scholar] [CrossRef]
  7. Clarkson, C.R.; Bustin, R.M. The effect of pore structure and gas pressure upon the transport properties of coal: A laboratory and modeling study. 2. Adsorption rate modeling. Fuel 1999, 78, 1345–1362. [Google Scholar] [CrossRef]
  8. Liu, Y.Y.; Wilcox, J. Effects of Surface Heterogeneity on the Adsorption of CO2 in Microporous Carbons. Environ. Sci. Technol. 2012, 46, 1940–1947. [Google Scholar] [CrossRef]
  9. Cao, Y.X.; Mitchell, G.D.; Davis, A.; Wang, D.M. Deformation metamorphism of bituminous and anthracite coals from China. Int. J. Coal Geol. 2000, 43, 227–242. [Google Scholar] [CrossRef]
  10. Godyn, K. Structurally altered hard coal in the areas of tectonic disturbances—An initial attempt at classification. Arch. Min. Sci. 2016, 61, 677–694. [Google Scholar] [CrossRef]
  11. Ju, Y.W.; Jiang, B.; Hou, Q.L.; Wang, G.L. Relationship between nanoscale deformation of coal structure and metamorphic-deformed environments. Chin. Sci. Bull. 2005, 50, 1784–1795. [Google Scholar] [CrossRef]
  12. Ju, Y.W.; Jiang, B.; Hou, Q.L.; Tan, Y.J.; Wang, G.L.; Xiao, W.J. Behavior and mechanism of the adsorption/desorption of tectonically deformed coals. Chin. Sci. Bull. 2009, 54, 88–94. [Google Scholar] [CrossRef]
  13. Pan, J.N.; Hou, Q.L.; Ju, Y.W.; Bai, H.L.; Zhao, Y.Q. Coalbed methane sorption related to coal deformation structures at different temperatures and pressures. Fuel 2012, 102, 760–765. [Google Scholar] [CrossRef]
  14. Okolo, G.N.; Everson, R.C.; Neomagus, H.W.; Roberts, M.J.; Sakurovs, R. Comparing the porosity and surface areas of coal as measured by gas adsorption, mercury intrusion and SAXS techniques. Fuel 2015, 141, 293–304. [Google Scholar] [CrossRef]
  15. Zhang, N.; Wang, S.D.; Wu, J.Q.; Li, Z.; Wang, X.Y. Full-Scale Pore Structure Characterization and Its Impact on Methane Adsorption Capacity and Seepage Capability: Differences between Shallow and Deep Coal from the Tiefa Basin in Northeastern China. Fractal Fract. 2024, 8, 48. [Google Scholar] [CrossRef]
  16. Kruk, M.; Jaroniec, M. Gas adsorption characterization of ordered organic-inorganic nanocomposite materials. Chem. Mater. 2001, 13, 3169–3183. [Google Scholar] [CrossRef]
  17. Clarkson, C.; Bustin, R. The effect of pore structure and gas pressure upon the transport properties of coal: A laboratory and modeling study. 1. Isotherms and pore volume distributions. Fuel 1999, 78, 1333–1344. [Google Scholar] [CrossRef]
  18. Wang, T.; Deng, Z.; Hu, H.Y.; Ding, R.; Tian, F.H.; Zhang, T.; Ma, Z.R.; Wang, D.X. Pore structure of deep coal of different ranks and its effect on coalbed methane adsorption. Int. J. Hydrogen Energy 2024, 59, 144–158. [Google Scholar] [CrossRef]
  19. Yao, Y.; Liu, D.; Tang, D.; Tang, S.; Huang, W. Fractal characterization of adsorption-pores of coals from North China: An investigation on CH4 adsorption capacity of coals. Int. J. Coal Geol. 2008, 73, 27–42. [Google Scholar] [CrossRef]
  20. Huang, H.Z.; Sun, Y.T.; Chang, X.T.; Wu, Z.Q.; Li, M.; Qu, S.L. Experimental Investigation of Pore Characteristics and Permeability in Coal-Measure Sandstones in Jixi Basin, China. Energ. 2022, 15, 5898. [Google Scholar] [CrossRef]
  21. Nakagawa, T.; Komaki, I.; Sakawa, M.; Nishikawa, K. Small angle X-ray scattering study on change of fractal property of Witbank coal with heat treatment. Fuel 2000, 79, 1341–1346. [Google Scholar] [CrossRef]
  22. Rexer, T.; Mathia, E.; Aplin, A.; Thomas, K. High-pressure methane adsorption and characterization of pores in Posidonia shales and isolated kerogens. Abstr. Pap. Am. Chem. Soc. 2019, 258, 2886–2901. [Google Scholar] [CrossRef]
  23. Yao, Y.; Liu, D.; Che, Y.; Tang, D.; Tang, S.; Huang, W. Non-destructive characterization of coal samples from China using microfocus X-ray computed tomography. Int. J. Coal Geol. 2009, 80, 113–123. [Google Scholar] [CrossRef]
  24. Yin, T.; Liu, D.; Cai, Y.; Zhou, Y.; Yao, Y. Size distribution and fractal characteristics of coal pores through nuclear magnetic resonance cryoporometry. Energy Fuels 2017, 31, 7746–7757. [Google Scholar] [CrossRef]
  25. Zhao, Y.; Zhu, G.; Dong, Y.; Danesh, N.N.; Chen, Z.; Zhang, T. Comparison of low-field NMR and microfocus X-ray computed tomography in fractal characterization of pores in artificial cores. Fuel 2017, 210, 217–226. [Google Scholar] [CrossRef]
  26. Zhou, S.D.; Liu, D.M.; Cai, Y.D.; Yao, Y.B.; Che, Y.; Liu, Z.H. Multi-scale fractal characterizations of lignite, subbituminous and high-volatile bituminous coals pores by mercury intrusion porosimetry. J. Nat. Gas Sci. Eng. 2017, 44, 338–350. [Google Scholar] [CrossRef]
  27. Mangi, H.N.; Yan, D.T.; Hameed, N.; Ashraf, U.; Rajper, R.H. Pore structure characteristics and fractal dimension analysis of low rank coal in the Lower Indus Basin, SE Pakistan. J. Nat. Gas Sci. Eng. 2020, 77, 103231. [Google Scholar] [CrossRef]
  28. Paul, N.; Mohammad, A.; Keka, O. Integrated fractal description of nanopore structure and its effect on CH4 adsorption on Jharia coals, India. Fuel 2018, 232, 190–204. [Google Scholar]
  29. Pfeifer, P.; Wu, Y.J.; Cole, M.W.; Krim, J. Multilayer adsorption on a fractally rough surface. Phys. Rev. Lett. 1989, 62, 1997–2000. [Google Scholar] [CrossRef] [PubMed]
  30. Song, B.B.; Zhai, X.W.; Ma, T.; Wang, B.; Hao, L.; Zhou, Y.J. Effect of water immersion on pore structure of bituminous coal with different metamorphic degrees. Energy 2023, 274, 127449. [Google Scholar] [CrossRef]
  31. Thommes, M.; Kaneko, K.; Neimark, A.V.; Olivier, J.P.; Rodriguez-Reinoso, F.; Rouquerol, J.; Sing, K.S.W. Physisorption of gases, with special reference to the evaluation of surface area and pore size distribution (IUPAC Technical Report). Pure Appl. Chem. 2015, 87, 1051–1069. [Google Scholar] [CrossRef]
  32. Li, H.J.; Zeng, Q.; Kang, J.H.; Cheng, G.; Cheng, J.W.; Wang, S.C. A Comparative Investigation of the Adsorption Characteristics of CO2, O2 and N2 in Different Ranks of Coal. Sustainability 2023, 15, 8075. [Google Scholar] [CrossRef]
  33. Hong, L.; Wang, W.J.; Gao, D.M.; Liu, W.T. Critical pore size for micropore filling in coal samples with different rank coals. PLoS ONE 2022, 17, e0264225. [Google Scholar] [CrossRef] [PubMed]
  34. Deinert, M.R.; Parlange, J.Y. Effect of pore structure on capillary condensation in a porous medium. Phys. Rev. E 2009, 79, 021202. [Google Scholar] [CrossRef]
  35. Qi, L.L.; Tang, X.; Wang, Z.F.; Peng, X.S. Pore characterization of different types of coal from coal and gas outburst disaster sites using low temperature nitrogen adsorption approach. Int. J. Min. Sci. Technol. 2017, 27, 371–377. [Google Scholar] [CrossRef]
  36. Wang, L.; Long, Z. Evolutions of CO2 Adsorption and Nanopore Development Characteristics during Coal Structure Deformation. Appl. Sci. 2020, 10, 4997. [Google Scholar] [CrossRef]
  37. Li, W.; Liu, H.F.; Song, X.X. Multifractal analysis of Hg pore size distributions of tectonically deformed coals. Int. J. Coal Geol. 2015, 144, 138–152. [Google Scholar] [CrossRef]
  38. Yao, H.F.; Kang, Z.Q.; Li, W. Deformation and reservoir properties of tectonically deformed coals. Pet. Explor. Dev. 2014, 41, 460–467. [Google Scholar] [CrossRef]
  39. Cao, D.Y.; Li, X.M.; Zhang, S.R. Influence of tectonic stress on coalification: Stress degradation mechanism and stress polycondensation mechanism. Sci. China Ser. D Earth Sci. 2007, 50, 43–54. [Google Scholar] [CrossRef]
  40. Ju, Y.; Luxbacher, K.; Li, X.; Wang, G.; Yan, Z.; Wei, M.; Yu, L. Micro-structural evolution and their effects on physical properties in different types of tectonically deformed coals. Int. J. Coal Sci. Technol. 2014, 1, 364–375. [Google Scholar] [CrossRef]
  41. Wang, C.Y.; Xing, Y.W.; Shi, K.Y.; Wang, S.W.; Xia, Y.C.; Li, J.H.; Gui, X.H. Chemical Structure Characteristics and Model Construction of Coal with Three Kinds of Coalification Degrees. ACS Omega 2023, 9, 1881–1893. [Google Scholar] [CrossRef] [PubMed]
  42. Chen, X.; Ma, R.; Wu, J.; Sun, J. Fractal Analysis of Coal Pore Structure Based on Computed Tomography and Fluid Intrusions. Fractal Fract. 2023, 7, 439. [Google Scholar] [CrossRef]
  43. Li, Z.B.; Ren, T.; Li, X.C.; Qiao, M.; Yang, X.H.; Tan, L.H.; Nie, B.S. Multi-scale pore fractal characteristics of differently ranked coal and its impact on gas adsorption. Int. J. Min. Sci. Technol. 2023, 33, 389–401. [Google Scholar] [CrossRef]
  44. Zhang, J.J.; Hu, Y.B. Comparative Evaluation of Pore Structure Heterogeneity in Low-Permeability Tight Sandstones Using Different Fractal Models Based on NMR Technology: A Case Study of Benxi Formation in the Central Ordos Basin. Energy Fuels 2020, 34, 13924–13942. [Google Scholar] [CrossRef]
  45. Zhang, N.; Guo, S.H.; Wang, S.D.; Tong, Y.Z.; Li, Z.; Wu, J.Q. Fractal and Multifractal Characteristics on Pore Structure of Coal-Based Sedimentary Rocks Using Nuclear Magnetic Resonance. SPE J. 2024, 29, 2624–2637. [Google Scholar] [CrossRef]
  46. Zhang, H.M.; Guo, L.; Wu, Z.Y.; Ma, J.B. Pore-throat structure, fractal characteristics and permeability prediction of tight sandstone: The Yanchang Formation, Southeast Ordos Basin. Sci. Rep. 2024, 14, 27913. [Google Scholar] [CrossRef]
Figure 1. Location map of the study area: (a) outline map of Heilongjiang Province; (b) regional geological structure map of the Hegang Basin; (c) regional geological structure map of the Jixi Basin.
Energies 18 00887 g001
Figure 2. N2 adsorption–desorption curves: (a) 1-AN11; (b) 2-YX15; (c) 3-PG14; (d) 4-CS3.
Energies 18 00887 g002
Figure 3. Adsorption curves of CO2.
Energies 18 00887 g003
Figure 4. Pore structure of micropores: (a) pore volume; (b) specific surface area.
Energies 18 00887 g004
Figure 5. Pore structure of mesopores: (a) pore volume; (b) specific surface area.
Energies 18 00887 g005
Figure 6. The pore structure characteristics of tectonically deformed coal: (a) pore volume; (b) pore specific surface area.
Energies 18 00887 g006
Figure 7. The relationship between tectonic deformation degree and fractal dimension.
Energies 18 00887 g007
Figure 8. The relationship between pore characteristics of tectonically deformed coal and fractal dimension: (a) the fractal dimension and the pore specific surface area; (b) the fractal dimension and the pore volume; (c) the fractal dimension and the adsorption volume; (d) the fractal dimension and the average pore width.
Energies 18 00887 g008
Table 1. Sample information.
Sample No.BasinMining AreaSampling Depth (m)Visible Coal Thickness/(m)Tectonically Deformed Coal Types
1-AN11HegangXing’an7651.5mylonitic coal
2-YX15Yixin6001.5granulitic coal
3-PG14JixiPinggang9001.6cataclastic coal
4-CS3Chengshan7201.5cataclastic coal
Table 2. Fractal dimension of structural coal pore based on FHH fractal model.
Sample No.Sample TypeLow-Pressure SegmentHigh-Pressure Segment
A1D1R2A2D2R2
1-AN11mylonitic coal−0.7162.2840.999−0.3712.6290.991
2-YX15granulitic coal−1.1691.8310.998−0.2522.7480.893
3-PG14cataclastic coal−0.9232.0770.984−0.2752.7250.858
4-CS3cataclastic coal−0.8652.1350.995−0.3662.6340.957
Table 3. Pore characteristic parameter of low-temperature N2 adsorption experiment.
Sample No.Sample TypePore AreaPore VolumeAverage Pore WidthAdsorption VolumeFractal Dimension (D1)
(m2/g)(cm3/g)(nm)(cm3/g)
1-AN11mylonitic coal1.5250.00430011.40982.8192.284
2-YX15granulitic coal0.7540.00235412.48411.5221.831
3-PG14cataclastic coal0.2880.00147820.53160.9552.077
4-CS3cataclastic coal0.6100.00222814.60021.4402.135
Disclaimer/Publisher’s Note: The statements, opinions and data contained in all publications are solely those of the individual author(s) and contributor(s) and not of MDPI and/or the editor(s). MDPI and/or the editor(s) disclaim responsibility for any injury to people or property resulting from any ideas, methods, instructions or products referred to in the content.

