Article

Artificial Intelligence-Driven Approach to Optimizing Boiler Power Generation Efficiency: The Advanced Boiler Combustion Control Model

1
Graduate Institute of Ferrous and Eco Materials Technology, Pohang University of Science and Technology (POSTECH), Pohang 37673, Republic of Korea
2
Energy Technology Section, Investment and Engineering Department, Pohang Iron and Steel Company (POSCO), Pohang 37754, Republic of Korea
3
Department of Industrial and Management Engineering, Pohang University of Science and Technology (POSTECH), Pohang 37673, Republic of Korea
*
Author to whom correspondence should be addressed.
Energies 2025, 18(4), 820; https://doi.org/10.3390/en18040820
Submission received: 27 December 2024 / Revised: 1 February 2025 / Accepted: 7 February 2025 / Published: 10 February 2025
(This article belongs to the Special Issue Optimization of Efficient Clean Combustion Technology)

Abstract

:
The by-product gases generated during steel manufacturing processes, including blast furnace gas, coke oven gas, and Linz–Donawitz gas, exhibit considerable variability in composition and supply. Consequently, achieving stable combustion control of these gases is critical for improving boiler efficiency. This study developed the advanced boiler combustion control model (ABCCM) by combining the random forest (RF) and classification and regression tree (CART) algorithms to optimize the combustion of steam power boilers using steel by-product gases. The ABCCM derives optimal combustion patterns in real time using the RF algorithm and minimizes fuel consumption through the CART algorithm, thereby optimizing the overall gross heat rate. The results demonstrate that the ABCCM achieves a 0.86% improvement in combustion efficiency and a 1.7% increase in power generation efficiency compared to manual control methods. Moreover, the model reduces the gross heat rate by 58.3 kcal/kWh, which translates into an estimated annual energy cost saving of USD 89.6 K. These improvements contribute considerably to reducing carbon emissions, with the ABCCM being able to optimize fuel utilization and minimize excess air supply, thus enhancing the overall sustainability of steelmaking operations. This study underscores the potential of the ABCCM to extend beyond the steel industry.

1. Introduction

1.1. Study Background

1.1.1. Global Climate Crisis and Carbon Reduction Efforts in Steel Mills

The steel industry is an essential component of modern society, supplying key materials to various sectors. However, as the climate crisis intensifies, reducing carbon emissions has emerged as a critical task in the face of environmental and economic pressures. As one of the top three global carbon-emitting industries, the steel industry faces increasing decarbonization demands, being required to cut persistent emissions while maintaining competitiveness [1]. As of 2022, it accounted for approximately 29% of global manufacturing CO2 emissions, emitting 1.4 tons of CO2 per ton of crude steel produced, totaling approximately 2.6 billion tons of CO2 annually [2]. Whereas most steel mills aim to achieve carbon neutrality by 2050, they face technological challenges. With increased carbon regulations, such as the EU’s Carbon Border Adjustment Mechanism and the US–EU Global Agreement on Sustainable Steel and Aluminum, the Korean steel industry, which had a 13.5% export share to the EU as of 2023, is also facing a crisis [3]. Technologies with practically zero emissions for steel production are still in their early development stages and are often more expensive than conventional methods [1].
Since 2010, domestic steelmakers have seen considerable increases in greenhouse gas emissions owing to the expansion of blast furnaces. Moreover, among all industries, the steel sector emits the most greenhouse gases. In 2018 alone, it released approximately 101 million tons of CO2, accounting for 39.0% of total industrial emissions and 13.1% of the nation’s overall emissions [4]. The carbon neutrality strategy for the steel sector aims to replace existing blast furnaces with hydrogen-based steelmaking facilities by 2050. However, as hydrogen-based steelmaking is not expected to become commercially viable until after 2040, transitional “bridging” methods that can be implemented in the short term, such as expanding electric arc furnace steel production, increasing steel scrap recycling, adopting top and bottom blown converters, and reducing coke consumption through fuel substitution, are required. Efforts to enhance the efficiency of existing carbon-intensive processes to achieve realistic reductions are also required [5]. For now, maximizing the use of by-product gases from blast furnaces and coke ovens to improve power plant efficiency and reduce carbon emissions offers a practical solution.

1.1.2. Improving Energy Efficiency Through By-Product Gases in Integrated Steel Mills

Steel production methods can be grouped into three main categories based on the type of fuel used, energy consumption, and production capacity. The blast furnace-basic oxygen furnace (BF-BOF) method involves melting iron ore and coke in a blast furnace and converting it into steel in a basic oxygen furnace [6]. This process generates by-product gases, such as blast furnace gas, coke oven gas, and Linz–Donawitz gas, but is associated with high energy consumption and considerable carbon dioxide emissions. The electric arc furnace (EAF) method uses electricity as the main energy source to melt scrap steel. It is highly energy-efficient, produces lower carbon emissions, and is considered to be environmentally friendly [7]. The direct reduced iron (DRI) method reduces iron ore directly using natural gas or hydrogen, offering reduced reliance on coal, enabling high-quality steel production, and lowering carbon dioxide emissions [8]. Additionally, the open-hearth furnace (OHF) method, which heats a mixture of iron ore and coke using coal as the primary energy source, exhibits extremely low energy efficiency but is rarely used in modern steel production [9]. Table 1 provides a summary of these production methods in the steel industry.
In general, steel manufacturers produce large volumes of by-product gases during the steel production process. The primary by-product gases include blast furnace gas (BFG: generated in blast furnaces), Linz–Donawitz gas (LDG: produced in converters), and coke oven gas (COG: generated during the coke manufacturing process). The composition, calorific value, and production volume of these by-product gases vary with differing steel mill operating conditions.
However, these gases are valuable and can be recycled to reduce costs and protect the environment. BFG, in particular, has approximately 20 times the flow rate of other by-product gases and can be used as a fuel for self-generation [10]. However, when BFG is used as a standalone fuel, its relatively low calorific value and slow combustion rate can reduce the boiler’s thermal output. Conversely, COG, with its high calorific value, can enhance combustion efficiency and stabilize combustion when mixed with BFG [11]. Table 2 presents the detailed compositions, calorific values, and production volumes of these by-product gases [5].
Most steel mills continue to recycle these by-product gases generated during the steelmaking process to improve their energy efficiency and minimize their environmental impact [12]. These gases contain sufficient energy for use as fuels, so 99% of them are recovered and either directly reused in the steelmaking process or transferred to power generation facilities within the steel mills to produce electricity [13]. In Korea, companies P and H operate blast furnace-converter-coke oven processes and use by-product gases as process or power plant fuels [4].
BFG can be recycled for power generation, hot blast preheating, and as an industrial heat source, processed through dust removal and gas scrubbing. COG can be used for power generation and as a chemical feedstock, requiring desulfurization and tar removal owing to its tar and sulfur content. LDG can be used for power generation and heat recovery but requires dust and CO removal. Each gas is used and processed to enhance recycling and treatment efficiency, addressing problems such as calorific value limitations, impurity content, and compositional variability. Table 3 summarizes the production processes, key characteristics, recycling and treatment methods, and major challenges associated with by-product gases generated during the steel manufacturing process.
The efficiency of using by-product gases can be evaluated using power generation performance indicators such as generation efficiency, which represents the percentage of the total energy (calories) contained in by-product gas fuels that is converted into electricity, comprehensively reflecting the combined efficiency of the boiler and steam turbine. Whereas the efficiency of steam turbines is limited by the supplier’s design philosophy and cannot be improved without additional investment, boilers can be dramatically affected by the calorific value and flow rate of the by-product gases, which vary enormously depending on the operating conditions. Accordingly, steel mills actively pursue efforts to improve their boiler efficiency.

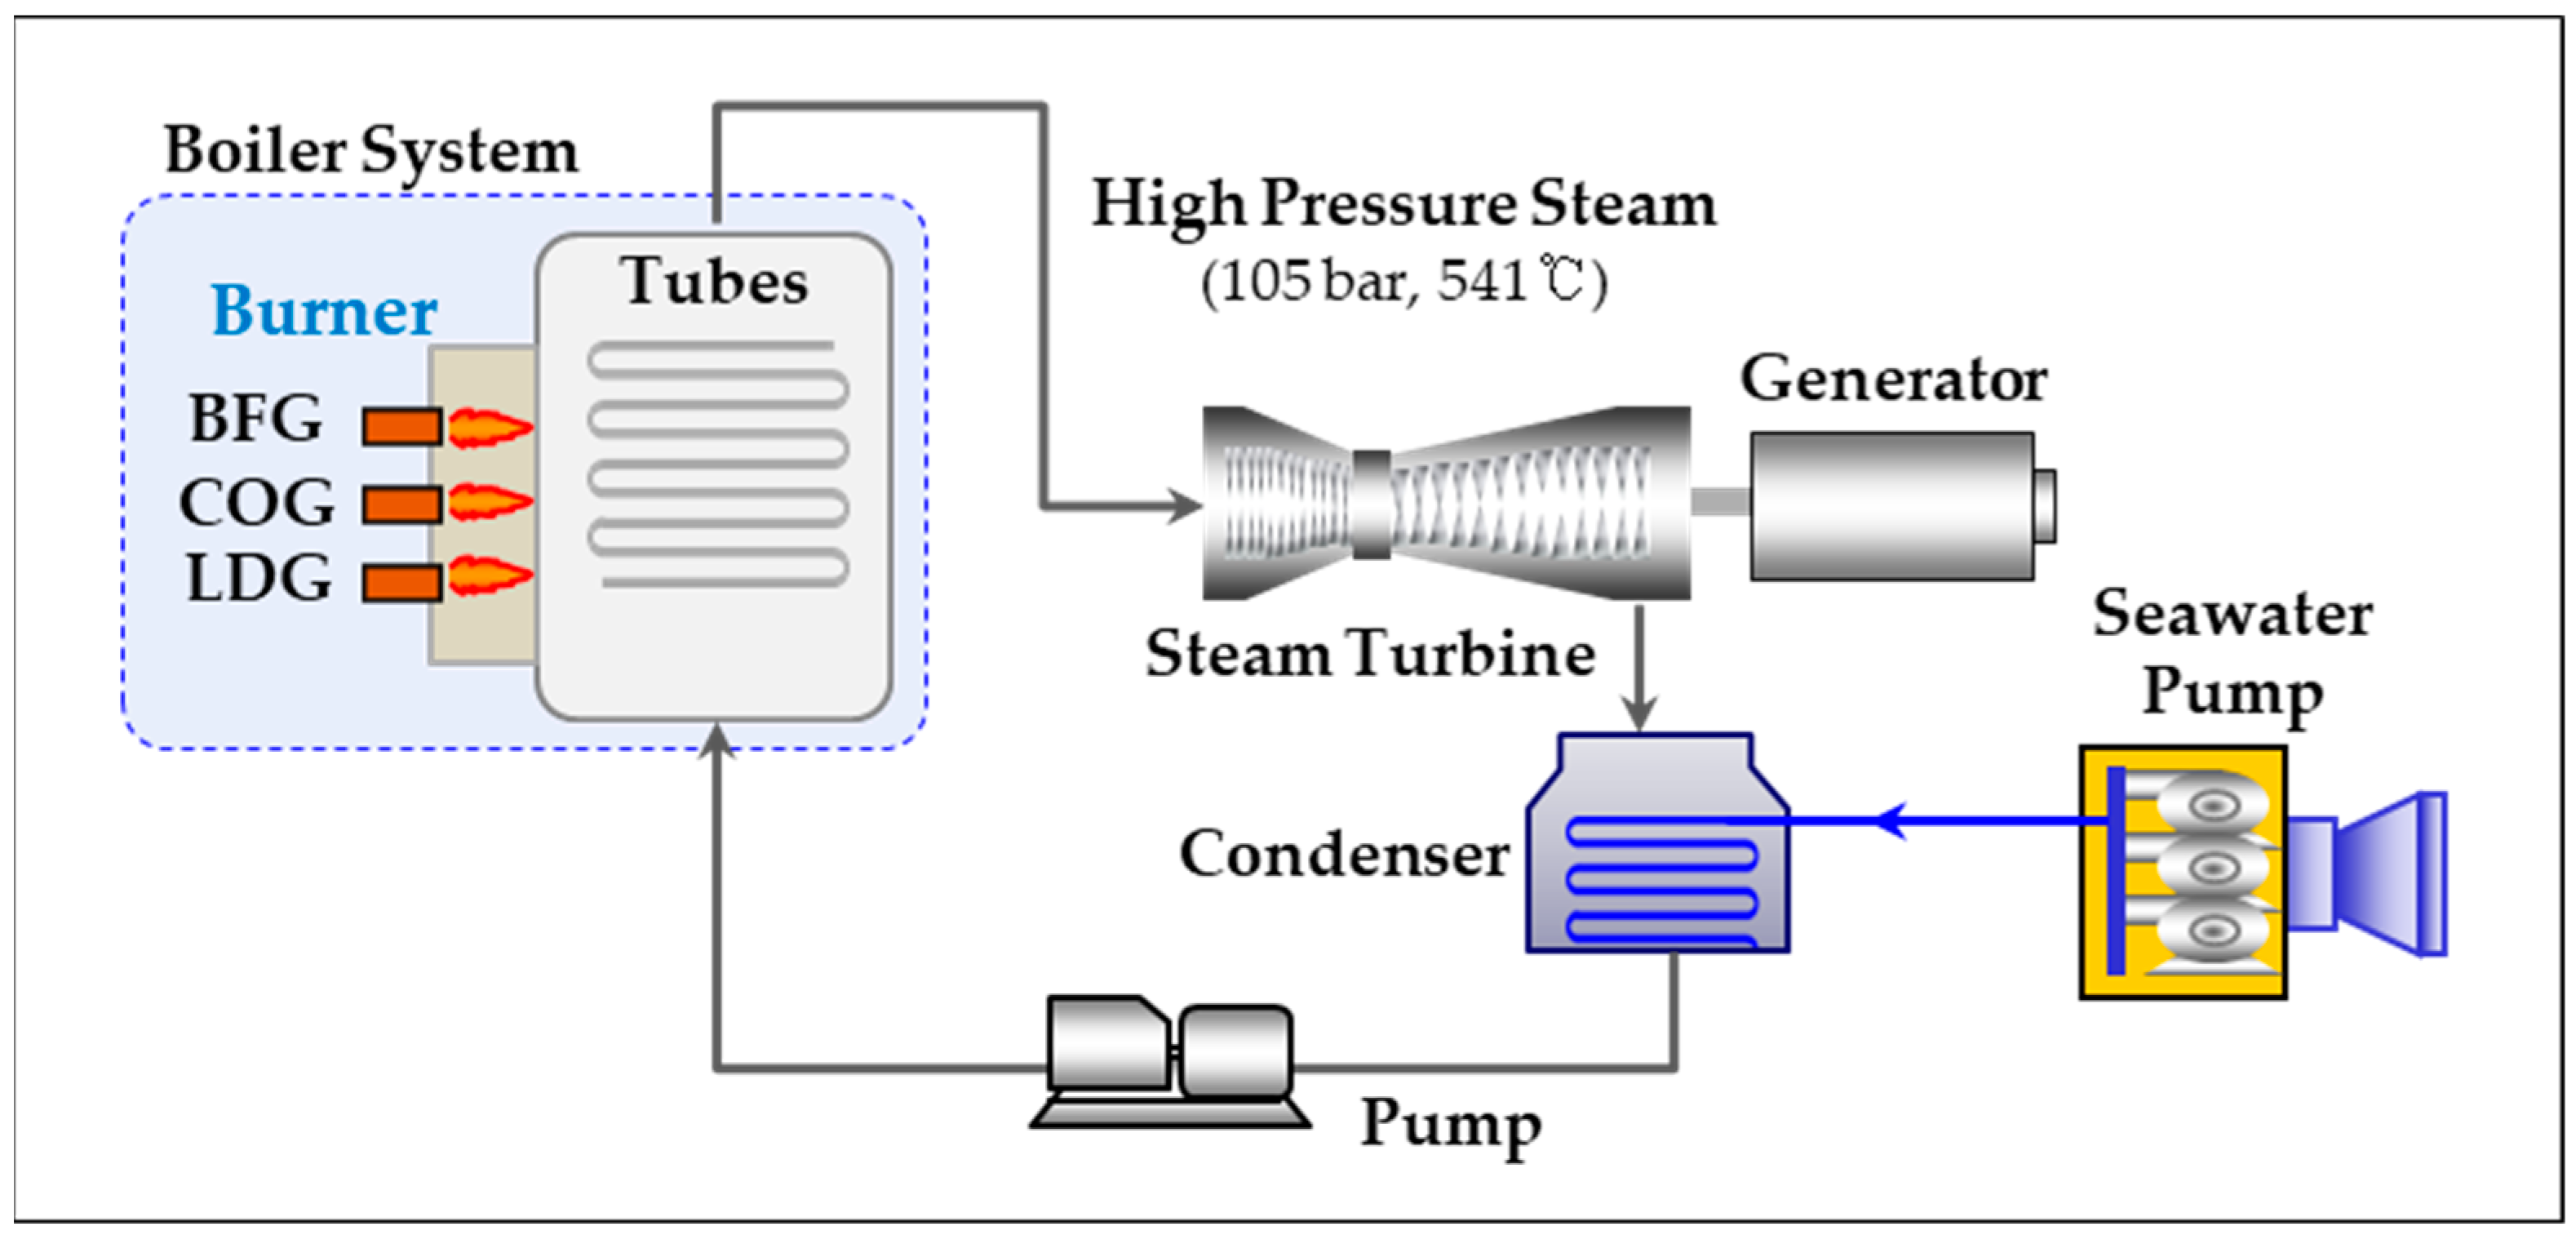
1.1.3. Status of By-Product Gas Power Generation and Features of Steam Power Boilers at Company P

Company P operates a total of 21 generators using by-product gases. At the P site, there are ten generators, including six steam power units and four combined-cycle units. The K site has 11 generators, comprising nine steam power units and two combined-cycle units. As shown in Figure 1, steam power generation involves using by-product gases as fuel, generating steam from the combustion heat, and producing electricity by driving a steam turbine. Combined-cycle power generation integrates the gas turbine with steam power. By-product gases are then used to drive the gas turbine for the first stage of generation, with the discharged heat generating steam in a heat recovery steam generator for the second stage of generation via a steam turbine [14].
In 2021, the total power consumption of Company P’s steel mills in Pohang and Gwangyang was approximately 25 TWh, equivalent to the output of three nuclear reactors combined. Considering that South Korea’s renewable energy generation in 2021 was approximately 39.1 TWh, the annual power consumption of Company P accounts for approximately two-thirds of the nation’s annual renewable energy production. However, Company P produces 85% of the power consumed in its steel mills—equivalent to 21.2 TWh—through self-generation. Of this, 63% comes from by-product gas power generation, whereas the remaining 22% is generated using liquefied natural gas (LNG). The power purchased from the Korea Electric Power Corporation amounts to only 3.8 TWh [15]. However, industrial electricity prices have been continuously rising, with an 84% increase over the past three years as of 2024. At KRW 176.81 per kWh as of October 2024, purchasing 3.8 TWh in total results in an annual electricity cost of approximately KRW 671.8 billion. Moreover, further increases can be expected owing to low-carbon energy transition policies. Consequently, maximizing self-generation efficiency is crucial to minimizing electricity costs. Even a 1% improvement in generation efficiency would enable the additional production of 162,988 MWh annually, translating to an expected cost saving of KRW 28.8 billion. Consequently, steel mills need to closely analyze the factors affecting their generation efficiency and actively implement improvements to reduce costs.
Elwardany emphasized that energy and exergy analyses are crucial for optimizing the efficiency of steam boilers [16]. He proposed strategies to improve boiler performance by minimizing irreversibilities in the combustion zone and heat exchanger surfaces. This approach is particularly effective for high-pressure boilers, such as ultra-supercritical designs, and suggests potential for thermodynamic improvements when integrated with by-product gases in Company P’s thermal power generation systems.
Each steam power generator is equipped with one boiler system, comprising 9–12 burners tailored to the generation capacity to produce high-temperature and high-pressure steam. Boiler #8 for steam power generation at the P site comprises nine burners. Table 4 shows the key specifications of Boiler #8. The efficiency of the steam turbine is 45%, and the boiler efficiency is approximately 80%, resulting in a plant-wide overall efficiency of 35% as designed.
One of the key challenges for improving the boiler system efficiency is maintaining stable burner combustion suitable for various output conditions [17,18]. To address this, ongoing research and efforts to improve fuel mixing ratios and combustion technology have been conducted [10]. Theoretically, a single large burner could handle combustion; however, it could have limitations in preventing flame deflection or local overheating during certain situations, such as the startup and low-output operations caused by output fluctuations. Accordingly, multiple smaller burners are used, allowing for individual control of each burner’s combustion state. This method ensures uniform flame distribution within the large boiler, prevents localized temperature rises, and minimizes energy losses. In large domestic by-product gas power plants, a single boiler has a typical output of approximately 100 MW, and combustion is managed using nine burners, each of which has a heat output of approximately 12–15 MW. Figure 2 illustrates the structure of such boilers.

1.2. Problem Statement and Research Objectives

The steam power generation system at Company P faces a constant fuel shortage relative to its generation capacity, as it is deprioritized in favor of the more efficient combined-cycle generation in the by-product gas supply hierarchy. The by-product gas supply is managed by the Utility Control Center (UCC), which allocates utilities across the entire steel mill. Currently, Steam Power Unit 6’s Boiler #8 operates using manual control based on the operators’ experience, relying on the UCC-distributed by-product gas. This approach has resulted in inconsistent combustion efficiency and performance deviations [19], leading to incomplete and imbalanced combustion, reduced generation efficiency, and higher electricity costs. The supply of by-product gases is highly variable depending on the operation of preceding processes and external conditions, necessitating complex combustion control. Moreover, the operators can arbitrarily select from any of the nine burners, each of which supports 2–3 primary fuels.
The structure of a single burner is shown in Figure 3. By-product gases, such as BFG, COG, and LDG, can be selectively supplied via the fuel inlet as needed. Each fuel differs in composition and calorific value, allowing appropriate blending and supply based on combustion conditions. The fuel is supplied to the combustion chamber, where the heat generated during combustion is transferred to the boiler. Moreover, the burner receives external air through an oxygen inlet to adjust the oxygen concentration during the combustion process. This maintains optimal combustion conditions, enhances combustion efficiency, and minimizes the generation of harmful substances such as CO and NOx.
If the oxygen concentration is too low during the combustion process, incomplete combustion can occur, producing harmful substances (such as carbon monoxide). Conversely, if the oxygen concentration is too high—although it prevents incomplete combustion and protects the boiler from explosions—it can lead to excessive fuel consumption and increased heat loss. Consequently, maintaining an optimal oxygen concentration is crucial [20]. Boiler #8 defines the optimal oxygen concentration range to be 1–2%. However, current manual control methods that rely on operators can struggle to maintain these conditions.
Figure 4 shows that manual control based on experience frequently deviates from the appropriate oxygen concentration range of 1–2%. Moreover, data collected over four months indicate that approximately 64% of the measurements fell outside the normal range, making it difficult to maintain balance during the combustion process. This led to increased combustion-specific energy consumption, which in turn reduced the boiler and power generation efficiency.
The aim of this study is to develop the advanced boiler combustion control model (ABCCM) to address the problems of reduced combustion efficiency and operational stability in the steam power boilers at Company P. To achieve this, the ABCCM was developed as a combustion control system to reflect the variability of by-product gases in real time.
The term “advanced” in ABCCM is emphasized to highlight the shift from traditional manual control methods to automated combustion control processes. Conventional methods rely on operator experience and manual judgment, resulting in inconsistent combustion conditions and efficiency. Moreover, these methods were designed based on static or historical data, failing to account for real-time fluctuations in by-product gas composition and supply rates. Specifically, traditional systems rely on operator experience and judgment to adjust combustion patterns, leading to a lack of consistency and reproducibility. System performance is thus highly dependent on operator skill.
To overcome these limitations, the ABCCM was developed. The ABCCM conducts real-time analysis of by-product gas components, flow rate, calorific value, and pressure to perform immediate combustion control. By combining the random forest (RF) and classification and regression tree (CART) algorithms, the ABCCM can handle nonlinear interactions and derive optimal combustion patterns. It was designed to minimize operator intervention, realizing automated combustion control.
Wang et al. applied the twin delayed deep deterministic policy gradient (TD3) method to optimize coal boiler combustion, achieving NOx emission reduction and efficiency improvements while adhering to constraints such as wall temperature [21]. This data-driven approach highlighted the importance of real-time control in enhancing combustion efficiency and maintaining stable combustion conditions in complex operational environments, such as those involving variability in by-product gases. Moreover, it underscored the need to develop the proposed ABCCM.
Smart boiler control technology has been evolving with a focus on real-time data-driven optimization, automation, and carbon emission reduction, using artificial intelligence (AI), the Internet of Things (IoT), and big data. Based on these technological trends, the ABCCM employed the RF and CART algorithms to analyze volatile fuels, such as by-product gases, in real time and propose optimal combustion conditions. Compared to other methods, the ABCCM could enhance reliability by analyzing real-time data of key variables in by-product gases (BFG, LDG, COG), providing guidance for the optimal combustion states of each burner. Moreover, it aims to minimize operational variability by transitioning from conventional methods reliant on operator experience to an automated control system that reduces the need for human intervention.
As an additional benefit, the proposed model could suppress heat losses caused by excessive oxygen supply and prevent energy losses owing to incomplete combustion, thereby maintaining consistent combustion efficiency. Ultimately, the results of this study can be expected to improve power generation efficiency, reduce operational costs through energy savings, and contribute to carbon emission reductions.

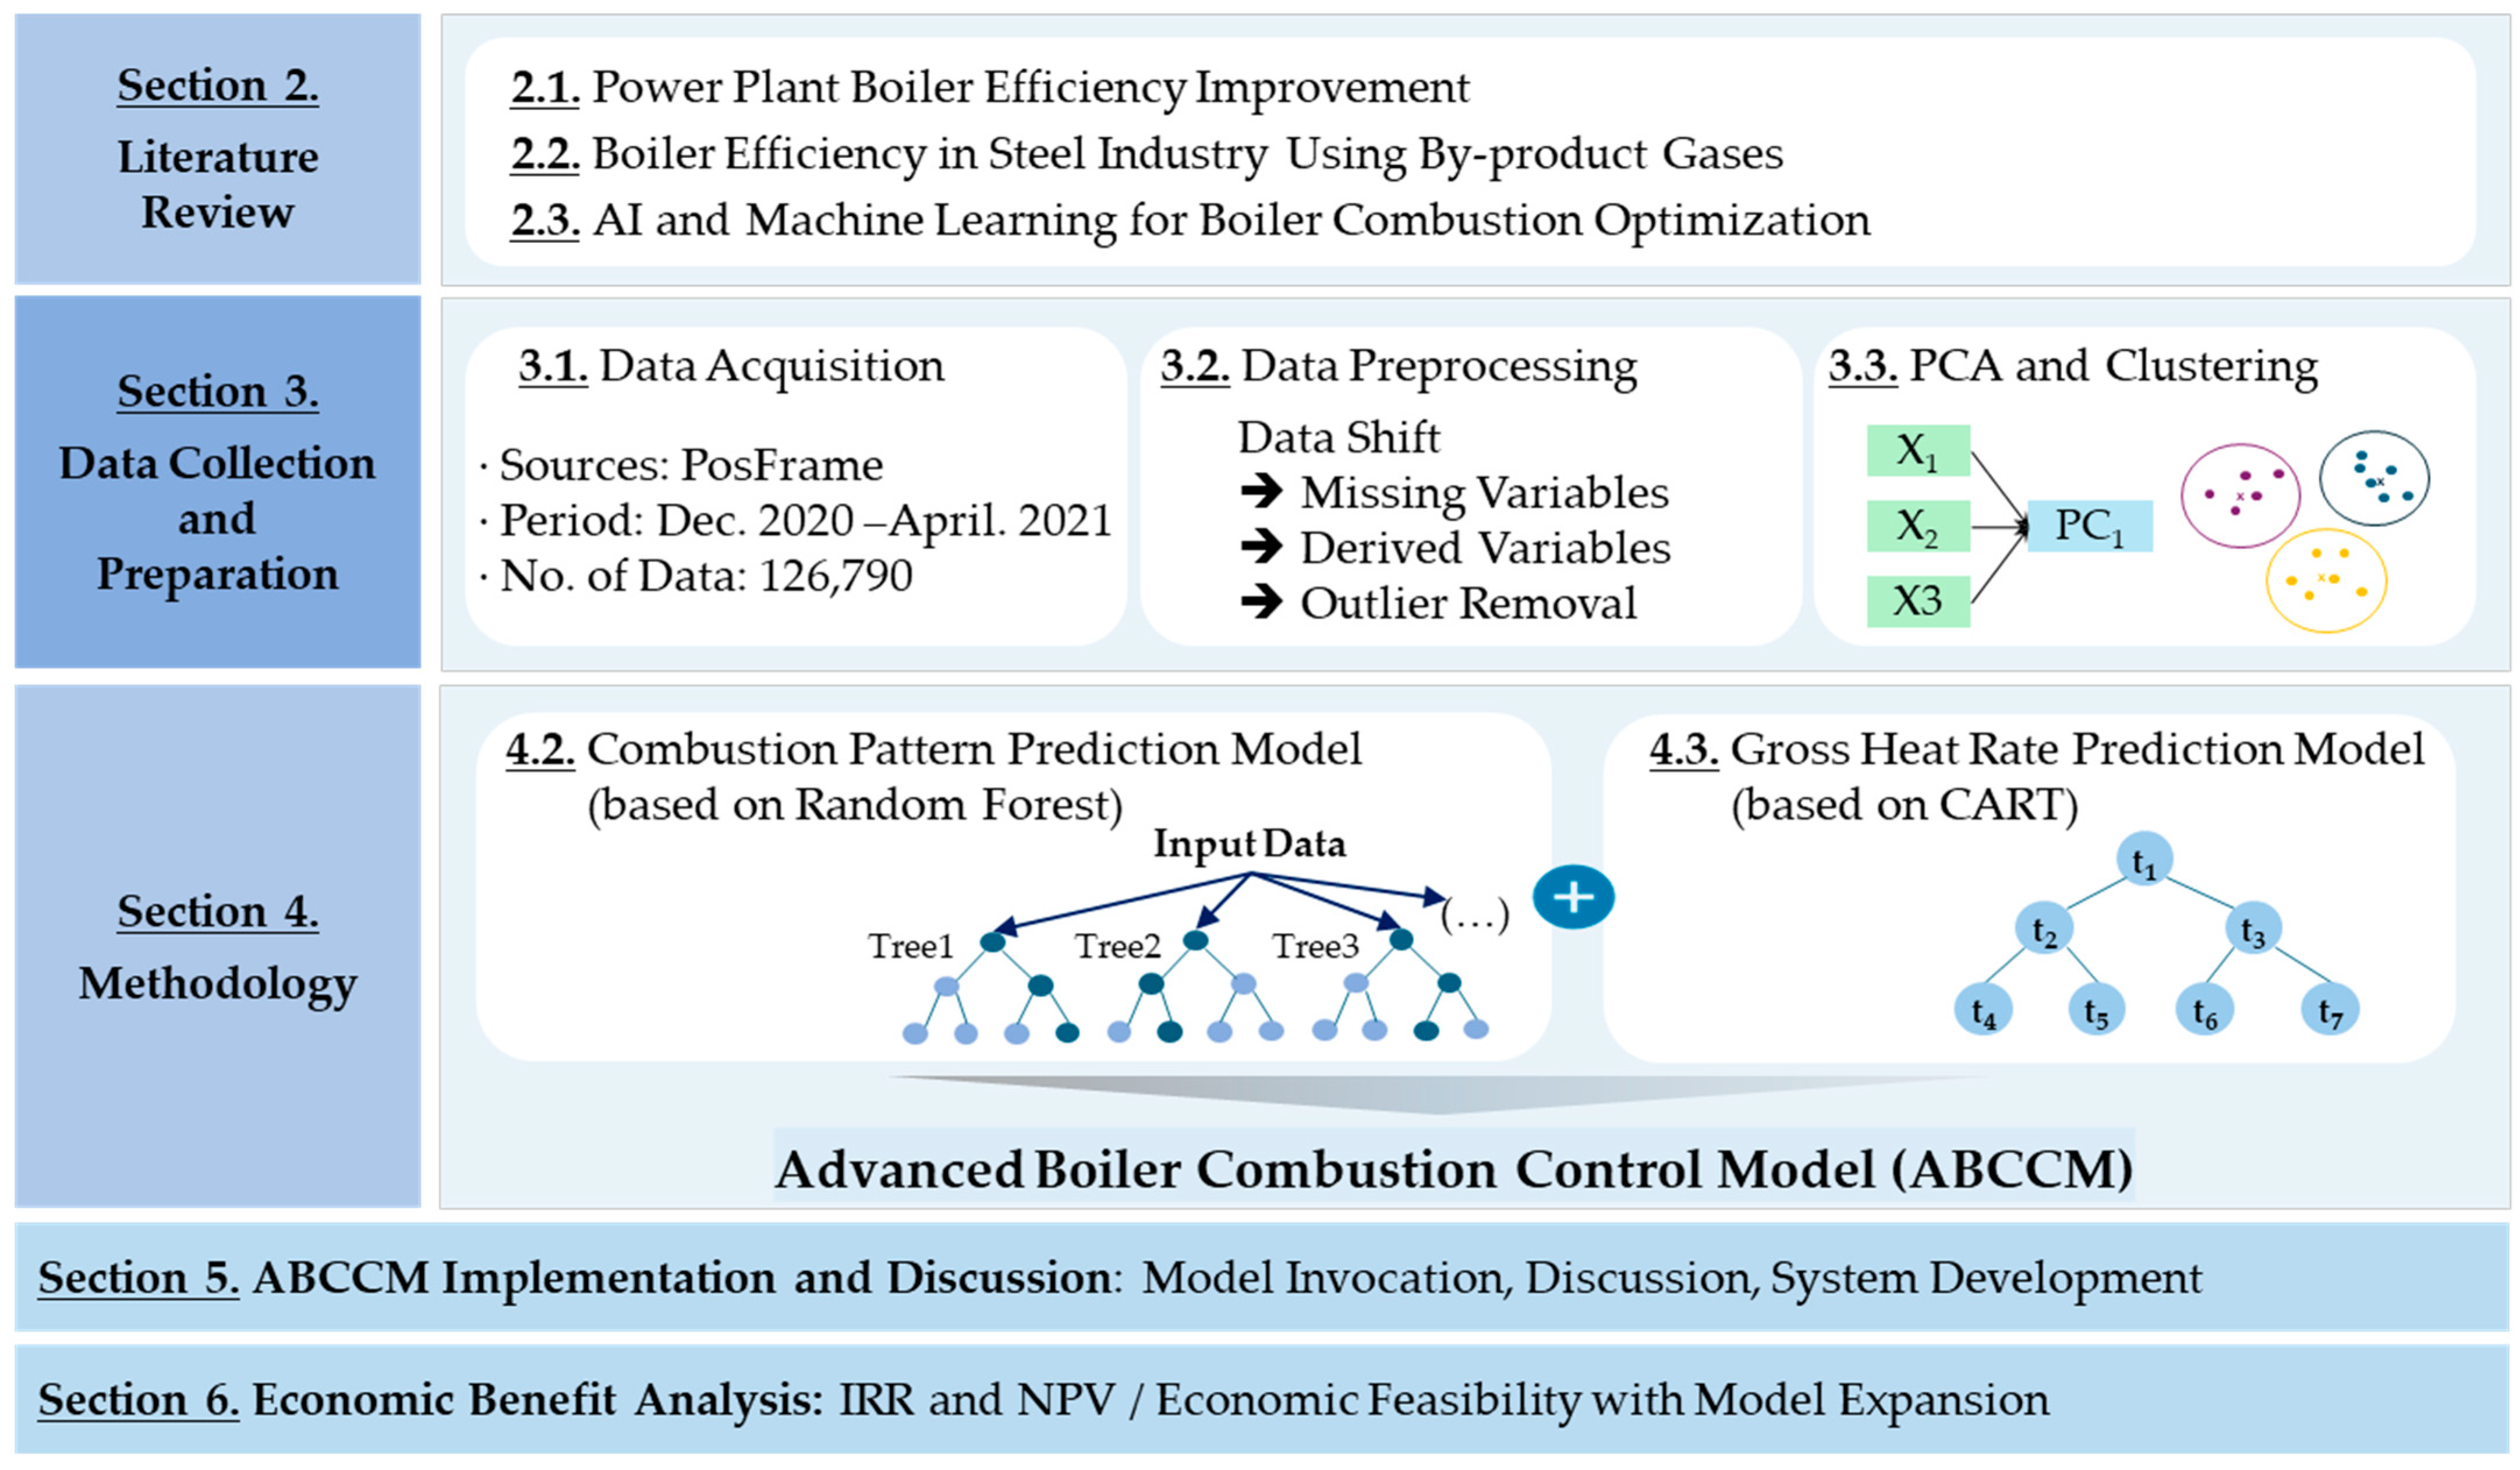
1.3. Research Process

This paper is structured as follows: Section 2 reviews prior studies on improving power boiler efficiency, utilization of by-product gases in the steel industry, and AI-based boiler combustion optimization, presenting recent research trends and highlighting the differences between this study and existing research. Section 3 details the collection and preprocessing of 126,790 data points gathered from Company P’s real-time operational data (PosFrame) between December 2020 and April 2021. The data preprocessing procedure included handling missing and outlier values, variable transformations, and standardization. Principal component analysis (PCA) and clustering were performed to construct a dataset for model training. Section 4 describes the design of the ABCCM, which combined a combustion pattern model based on the RF algorithm with a gross heat rate prediction model based on the CART algorithm. Section 5 evaluates the ABCCM’s performance by applying it to Company P’s real-time operational environment. The results of the combustion pattern adjustments and gross heat rate predictions were analyzed in real time to demonstrate energy savings and improved combustion efficiency. Section 6 analyzes the economic effects of implementing the ABCCM by evaluating Company P’s internal rate of return (IRR) and net present value (NPV). The possibility of expanding the model to Company P’s entire power generation system is also discussed. The research process is illustrated in Figure 5.

2. Literature Review

This study reviewed major prior research related to improving the performance of power boiler facilities and synthesized existing studies on combustion efficiency prediction and efficiency improvement using AI, discussing this study’s unique contributions.

2.1. Studies on Performance and Efficiency Improvement of Power Boilers

Various studies have been conducted to enhance the performance and combustion efficiency of coal-fired power plant boilers. Wu et al. developed an optimization model using support vector regression to minimize NOx emissions and unburned carbon in coal-fired boilers [22]. Zhao et al. developed a control-oriented model for coal-fired power plant boilers to design an economical low-NOx combustion controller, proposing two boiler combustion models for this purpose [23]. Rahat et al. studied the optimization of coal combustion systems using a data-driven multi-objective optimization method to simultaneously reduce NOx emissions and improve efficiency. They proposed an adaptive optimization solution for varying load requirements using data from the Jianbi Power Plant, quantifying prediction uncertainties [24]. Zhu et al. investigated a closed-loop combustion optimization method to improve the efficiency of coal-fired boilers and reduce pollutant emissions. The study emphasized adaptability to load changes and discussed applicability to other types of boilers [17]. Sinha et al. developed a data-driven predictive maintenance system called dClink to predict and detect clinker formation in a 500 MW coal-fired circulating fluidized bed boiler, considerably enhancing the boiler safety and efficiency [25]. Wu et al. developed a Gaussian kernel and long short-term memory (LSTM)-based neural network prediction model to predict and optimize NOx emissions and heat exchange performance in coal-fired boilers. The model outperformed existing prediction models and presented effective tuning methods, even under incomplete data conditions [26]. Xu et al. proposed a data-driven evolutionary optimization and improved case-based reasoning method for combustion optimization in 1000 MW coal-fired boilers [27].

2.2. Studies on Performance and Efficiency Improvement of Self-Generation Boilers

Several studies have been conducted to ensure the stable supply of by-product gases and improve the efficiency of self-generation boilers in steel plants. de Oliveira Junior et al. proposed an improved mixed integer linear programming (MILP) model for multi-period optimization of by-product gas supply systems in steel manufacturing processes. This model ensured stable process operations by considering gas holder level management and penalties for burner switching while incorporating minimum and maximum fuel flows for the burners [28]. Zhao et al. proposed a data-driven predictive optimization (DPO) method for real-time optimization of by-product gas systems, contributing to improved boiler efficiency [29]. Zeng et al. developed a multi-period MILP model for the optimal allocation of by-product gases, steam, and electricity in the steel industry, demonstrating a potential 6% reduction in operating costs [30]. Kim and Lee emphasized the need for additional boiler calculation models that could consider the impact of combustion efficiency and fuel characteristics on steam generation efficiency to analyze the efficiency of steam power plants using by-product gases [31]. Szega and Czyż integrated the EN 12952-15 standards [32] with advanced data validation techniques to analyze efficiency under various fuel compositions and heat loads, improve the boiler performance and energy efficiency, and study the precise energy balance [33]. Lee et al. proposed a combustion control model using partial least squares regression (PLSR) to improve the combustion efficiency of boilers in self-generation facilities in the steel industry. Their study was noteworthy in that it optimized boiler efficiency by analyzing combustion conditions in real time based on O2 and CO concentrations [34].
Majeed et al. numerically analyzed the boundary layer flow and heat transfer characteristics of 3D magnetohydrodynamic (MHD) radiative Eyring–Powell nanofluids, investigating the effects of various physical parameters, such as the magnetic field strength, slip parameters, and Brownian motion [35]. Feng et al. studied the combustion mechanisms and reaction kinetics of cellulose using ReaxFF-based molecular dynamics simulations [36]. This research contributed to the design of materials aimed at enhancing fire resistance. Iliev et al. formulated the electrochemical conversion, heat, and mass transfer processes in their modeling study of solid oxide fuel cells [37]. Their study demonstrated the feasibility of efficiently using high-temperature fuel cells powered by petrochemical production waste to supply heat and electricity. Neves et al. performed a numerical analysis of combustion processes in a gasifier using various reaction mechanisms [38]. Their results showed that the velocity and turbulence peaked during the early stages, the temperature then stabilized, and the mass fraction of reaction products reached its maximum in the lower regions of the gasifier. Mondal et al. investigated optimal platinum catalyst coating strategies for hydrogen-air combustion, highlighting the potential for improving catalyst efficiency and reducing costs [39].

2.3. Studies on Boiler Combustion Optimization Using ML and AI

Research on improving boiler combustion efficiency using AI has been actively conducted. Liu and Bansal proposed an integrated approach combining multi-objective optimization techniques and computational fluid dynamics (CFD) to improve the combustion efficiency in coal-fired power plant boilers [40]. Tang et al. proposed a soft-sensing method combining a backpropagation neural network (BPNN) and genetic algorithm (GA) to predict the oxygen content in flue gas at power plants, successfully improving the model accuracy [41]. Safdarnejad et al. used a dynamic nonlinear autoregressive with exogenous inputs (NARX) model to effectively predict and optimize NOx and CO emissions in coal-fired power plants, demonstrating a higher potential for emission reduction compared to static models [42]. Shi et al. developed and evaluated an AI-based methodology combining artificial neural networks (ANNs) and GAs for combustion optimization in 660 MW ultra-supercritical coal boilers. This methodology used historical operational data and CFD simulations to enhance boiler thermal efficiency and reduce NOx emissions [43]. Fedorov et al. proposed the development of a digital twin platform for clean energy technologies, exploring methods to optimize fuel efficiency using the numerical modeling of combustion processes and machine learning (ML) techniques. Specifically, the RF algorithm was employed to improve the predictive accuracy of combustor operations and evaluate the feasibility of low-emission combustion technologies [44]. Kovalnogov et al. developed a mathematical model applying the RF algorithm to enhance the fuel combustion efficiency, demonstrating its potential to contribute to reducing power plant emissions [45]. Butakov et al. developed a convolutional autoencoder model to detect energy-efficient and environmentally friendly combustion modes in large power plants. Their model automatically identified abnormal combustion modes, improving the stability and efficiency of the combustion process [46]. Nemitallah et al. conducted a study using AI tools to monitor, predict, control, and optimize gas-fueled boiler systems. They applied various AI techniques to improve the balance between efficiency and NOx emissions, demonstrating that AI-based models could enhance the boiler performance considerably [47]. Ronquillo-Lomeli and García-Moreno developed an algorithm using statistical analysis and AI techniques for flame classification in oil-fired boilers. Their algorithm effectively monitored the combustion conditions in real time and improved the fuel efficiency [48].

2.4. Recent Advances in the Application of AI for Industrial Optimization

Priya et al. proposed carbon capture technologies using AI to address climate change [49]. They analyzed ML, deep learning (DL), and hybrid technology case studies, as well as the roles of AI tools, frameworks, and mathematical models. Additionally, they explored patent trends in AI-based carbon capture, highlighting its potential contribution to climate change mitigation and the achievement of Sustainable Development Goal (SDG) 13 (Climate Action). Nemitallah et al. reviewed data-driven approaches leveraging AI and ML for optimizing boiler performance and reducing emissions [47]. They analyzed case studies involving various AI techniques, such as ANNs, GAs, and fuzzy logic (FL). The study concluded that AI was a promising tool for enhancing boiler efficiency and minimizing emissions at minimal cost; however, limitations in data reliability were identified as a challenge. Shin et al. studied an intelligent combustion control system using the IoT and AI to improve the operation of waste-to-energy (WtE) facilities [50]. When applied to the “G” WtE facility in Gyeonggi Province, the system achieved stable data collection and demonstrated improvements in power generation and reductions in CO and NOx emissions. Chen et al. proposed a novel combustion diagnostic technology using the RF algorithm to improve combustion diagnostics [51]. The study demonstrated that analyzing flame images could accurately identify fuel types and reaction conditions, highlighting the importance of this approach. Olawade et al. explored the connection between AI and achieving net-zero goals, analyzing AI’s potential impact on sustainable development and climate change mitigation [52]. They also identified challenges such as data quality, energy consumption, and fairness as limitations. Bounaceur et al. proposed using hydrogen-blended fuels to decarbonize gas turbine fuels [53]. Their study developed an ML model to predict the auto-ignition temperature and auto-ignition delay of hydrogen, natural gas, and syngas blends. The final model was applied to analyze the risk of auto-ignition within pipelines during gas turbine fuel supply. Teimoori et al. proposed an optimized recommendation system for static and mobile charging services within an Internet of Vehicles (IoV) framework to enhance electric vehicle (EV) user satisfaction and charging efficiency [54]. Through theoretical analysis and evaluation, the system effectively optimized EV recommendations within designated regions. Bhattacharya et al. proposed using an ML-based ANN algorithm instead of high-resolution computational fluid dynamics models to predict and analyze the combustion process of internal combustion engines [55]. Their approach optimized the predictive accuracy using multiphysics, heat transfer, and chemical reaction data. Wang et al. analyzed the correlations among key parameters in the post-combustion carbon capture process and proposed process optimizations [56]. Using multi-year data from Canada’s CETRi, they applied a decision forest model, achieving high predictive accuracy. Marinković et al. proposed leveraging and strengthening the integration of digital twin technology and ML to potentially enhance the system-wide performance throughout the entire lifecycle of EV components, from application to disposal [57].

2.5. Limitations of Previous Research

These prior studies have made important contributions to improving the boiler performance and combustion efficiency in coal-fired power plants and the steel industry. Solutions have been proposed to enhance efficiency using optimization techniques such as MILP and DPO, as well as AI-based models. However, most of these studies have been limited to specific conditions and failed to adequately reflect the variability of real-time operational data. Moreover, they had limited capabilities to handle unstructured data and variability in fuel properties occurring in real time. They also lacked flexibility in fuel substitution and struggled to account for the complexity of variables present in actual operational environments. In particular, studies like that by Lee et al., which aimed to improve the boiler efficiency in steam power generation using by-product gases, were similar in purpose but focused on predicting the flue gas measured at the boilers downstream. This approach was limited in providing optimal burner operational strategies based on all by-product gas fuel conditions [34]. The limitations of the prior studies analyzed are summarized in Table 5.
This study aims to develop the ABCCM, an optimal operational model for boiler burners, by incorporating the fuel conditions, including by-product gas composition changes. This enables efficient and stable combustion control under various gas conditions. This approach contributes to overall boiler system performance improvement and provides differentiated outcomes by maximizing real-world operational efficiency. The ABCCM developed in this study offers several major advantages over previous research:
  • Real-time data processing and variability management: Unlike traditional studies that rely on static data-based optimization, the ABCCM manages key variables based on real-time data, effectively addressing variability in operations.
  • ML-based combustion optimization: In contrast to existing studies that use single algorithms, the ABCCM combines the RF and CART algorithms to simultaneously enhance combustion efficiency and prediction accuracy.
  • Efficient use of by-product gases: Previous studies often failed to account for variations in the composition and supply of by-product gases, limiting fuel efficiency. The ABCCM effectively incorporates changes in the mixing ratios and compositions of by-product gases, such as BFG, COG, and LDG, contributing to energy efficiency and cost savings.
  • Carbon emission reduction and sustainability: By optimizing the oxygen supply and minimizing fuel waste, the ABCCM reduces carbon emissions, supporting the carbon neutrality goals of the steel industry.
The ABCCM demonstrates improvements over existing studies in areas such as real-time data utilization, ML-based optimization, efficient use of by-product gases, and carbon emission reduction. Its contributions are expected to enhance sustainability in the steel industry as well as in other energy-intensive industries.

3. Data Collection and Preparation

3.1. Data Acquisition

The data used in this study were collected based on real-time operational data from Boiler #8 of the steam power generation system at Company P and by-product gas combustion data. The real-time data were sampled at intervals of 1 s or 15 s using the sensor network within the power plant, and all collected data were automatically transmitted and stored on the power plant’s central server, where they were aggregated every 1 min. The data collection period was set from 24 December 2020, to 23 April 2021, and a total of 172,804 data points were extracted and recorded in Excel.
The data collected in this study comprised 54 variables, categorized into three main groups, that is, Fuel, Combustion, and Power Generation. Each category was detailed as follows:
  • Fuel data: This category included 16 variables that evaluated the physical properties and energy performance of the by-product gases (BFG, COG, LDG), such as the pressure, calorific value, and flow rate.
  • Combustion data: Comprising 31 variables, this category encompassed the combustion state within the boiler, including the oxygen concentration, NOx concentration, and other relevant parameters.
  • Power Generation data: This category comprised seven variables related to energy management and performance evaluation in the power plants, including the active power, reactive power, power consumption, current, and voltage.
The Fuel data include variables representing the physical properties of the by-product gases (BFG, COG, and LDG) used in the power plant and those that impact the combustion process. It comprises a total of 16 variables, including the calorific value, pressure, flow rate, and temperature of the by-product gases. This information provides fundamental data critical for evaluating the energy performance of fuels and analyzing the combustion efficiency.
BFG is the most commonly used by-product gas, characterized by its low calorific value (750–1000 kcal/Nm3) [58]. COG, with its relatively high calorific value (4000–5000 kcal/Nm3), can contribute to improved power generation efficiency by maintaining stable combustion temperatures and enabling efficient combustion when mixed with BFG [59]. Experimental data show that when the COG ratio is maintained between 20–30%, the oxygen concentration stabilizes at an average of 1.8%, minimizing incomplete combustion. However, if the COG ratio falls below 20%, the combustion temperatures become unstable, leading to excessive oxygen supply, heat loss, and decreased efficiency. Conversely, when the COG ratio exceeds 30%, the temperature within the combustion chamber increases excessively, resulting in increased NOx emissions and reduced combustion stability [59]. LDG, with its moderate calorific value (approximately 2000 kcal/Nm3), is classified as a less efficient fuel compared to BFG [60]. When the LDG ratio falls below 40%, the combustion temperatures become unstable, and excessive oxygen supply leads to heat loss.
The Combustion data comprise 31 variables, 27 of which represent the combustion state information of the nine burners, including whether the by-product gases are burned in Zones A–C and Rows 1–3. The remaining four variables include items such as low-pressure steam, oxygen concentration (O2) in the exhaust gas, and NOx concentration. The combustion efficiency is highest when the oxygen concentration is maintained within the range of 1–2%. Excessive oxygen supply tends to increase the heat loss and fuel consumption. The NOx concentration decreases as the COG ratio increases, whereas the use of BFG alone increases the NOx concentration. However, the NOx concentration exhibits a decreasing trend when mixed with LDG.
The Power Generation data relate to data associated with electricity generated by the power plant, comprising seven variables. These include the active power, reactive power, power consumption, current, voltage, and output. These data are used to evaluate the power production and consumption performance in the power plant and provide information necessary for energy management. Table 6 presents a list of the data collected for this study.

3.2. Data Preprocessing

The data used in this study were real-time data collected to optimize the combustion patterns of the steam power generation boiler system, using the PosFrame framework developed by Company P. PosFrame refers to a common hardware and software environment that provides operational, quality, and equipment data, enabling macro- and micro-data retrieval, correlation analysis, and AI-based analysis [61]. The data collected from field equipment were stored in the PLC and DAQ servers in the operations room, transferred via P/C and HMI, and ultimately stored and extracted in the cloud through the PosFrame manufacturing execution system (MES) for long-term storage, analysis, and utilization. The data stored in the MES were designated as categorical regardless of their attributes, so conversion to numerical data were necessary. Based on the Knowledge Discovery in Database (KDD) analysis methodology, preprocessing was conducted following the steps outlined below to develop a reliable model [62].
Figure 6 illustrates the data collected for this study and the data preprocessing procedure. At each stage, the processes were implemented to ensure the consistency, accuracy, and quality of the data, which served as an essential foundation for improving the performance of the subsequent analysis model.

3.2.1. Data Shift and Missing Value Processing

First, the names and classes of each variable in the raw data were standardized for consistency. This process sought to enhance data readability and facilitate analysis by correcting misdefined or duplicated variable names in the original data and appropriately designating the class of each variable. Variable names extracted from the raw data were often incomprehensible, so they were renamed for better clarity. Apart from the date, the attributes of the 53 remaining items were converted from categorical to numeric data. Table 7 shows examples of the variable names from the raw data and their attribute modifications.
Second, data shifting was conducted to efficiently train the burner combustion patterns. Both forward and backward shifts were performed by one step each to enhance the correlation between time-series data during training and improve prediction performance for variability trends. After this process, the data were consolidated, resulting in an increase from 54 variables to 107 variables, with a total of 172,871 data points.
Third, missing values were handled. Removing missing values is a crucial process in improving the completeness of datasets and enhancing the performance of ML models [63]. Sensor data from the power plant were collected in real-time, although missing values could occur owing to sensor errors or data loss. In this study, the primary variables of combustion status and oxygen concentration (O2 sensor) were prioritized for handling. In principle, missing data were removed; however, in cases where at least one valid sensor reading for the oxygen concentration existed, the missing values were replaced with the average values. This process eliminated 11,581 missing values, resulting in a final dataset of 161,290 data points for analysis.

3.2.2. Derived Variables and Outlier Processing

Next, the variables essential for analysis were selected by distinguishing between direct variables and derived variables from the collected raw data. Direct variables included fuel characteristics such as the flow rate, temperature, and pressure of by-product gases (BFG, COG, and LDG), whereas derived variables included variables representing the combustion efficiency. During the variable selection process, the importance and relevance of each variable were considered to efficiently use only the information necessary for analysis. The selected variables played a critical role in predicting and optimizing the combustion patterns.
Table 8 lists a total of six derived variables. After generating the derived variables, the variables used in the calculation formulas were excluded as they were no longer key factors. Additionally, certain factors, such as the continuous COG burners that could not be controlled, were excluded. Through this process, the number of variables was reduced from 107 to 67.
Finally, outliers in the data were handled. Outlier removal is a process that improves data quality by eliminating abnormally high or low values. Outliers can result from sensor errors or environmental factors, which can negatively impact the analysis accuracy [63,64]. Outliers based on the statistical characteristics of the data were identified using the interquartile range or Z-score when the observed data did not follow a normal distribution, and they were either replaced with threshold values or removed [65].
In this study, outliers were removed during model training if they met the outlier criteria. Any outliers that occurred during model prediction were replaced with the most recent valid data to maintain consistency in predictions. Additionally, in cases where no recent valid data existed owing to equipment downtime or system failures, the model execution was designed to handle exceptions to prevent inaccurate predictions. Criteria for identifying outliers were established for 11 variables by setting the upper and lower bounds. For example, generator outputs below 30 were excluded, gross heat rate values were considered valid only if they ranged between 500 and 7000, and the lower bounds for key factors were set to 0. Subsequently, values exceeding 5 sigma based on the Z-score criterion were excluded.
Figure 7 illustrates the changes in key variables before and after outlier processing. Before processing, the outliers were detected in variables such as the output and COG line pressure, with the data distribution being widely spread. After processing, the outliers were either removed or replaced, resulting in a more uniform data distribution with narrowed median and interquartile ranges, stabilizing the dataset. After processing the outliers, missing values were removed once again, reducing the final dataset size from 161,290 to 126,790 data points.
For the development of the ABCCM model, this study used data collected from 54 sensors installed in the boiler system of a power plant operated by Company P to ensure stable operation. Although the sensor specifications varied, one of the critical sensors for this modeling, that is, the BFG flow sensor (ADDITEL, Brea, CA, USA), was the SIEMENS STD920 model. The sensor specifications differed based on the installation location’s temperature and pressure functions; the specifications, inspection, and calibration intervals of key devices are presented in Table 9. The calibration intervals for the instruments ranged from 90 to 1460 days, depending on the type, and if the management criteria were exceeded, verification and recalibration were performed within the calibration period to ensure measurement stability. The collected data were processed through data preprocessing steps, including the removal of missing values and outliers (using the Z-score method), to ensure data quality.

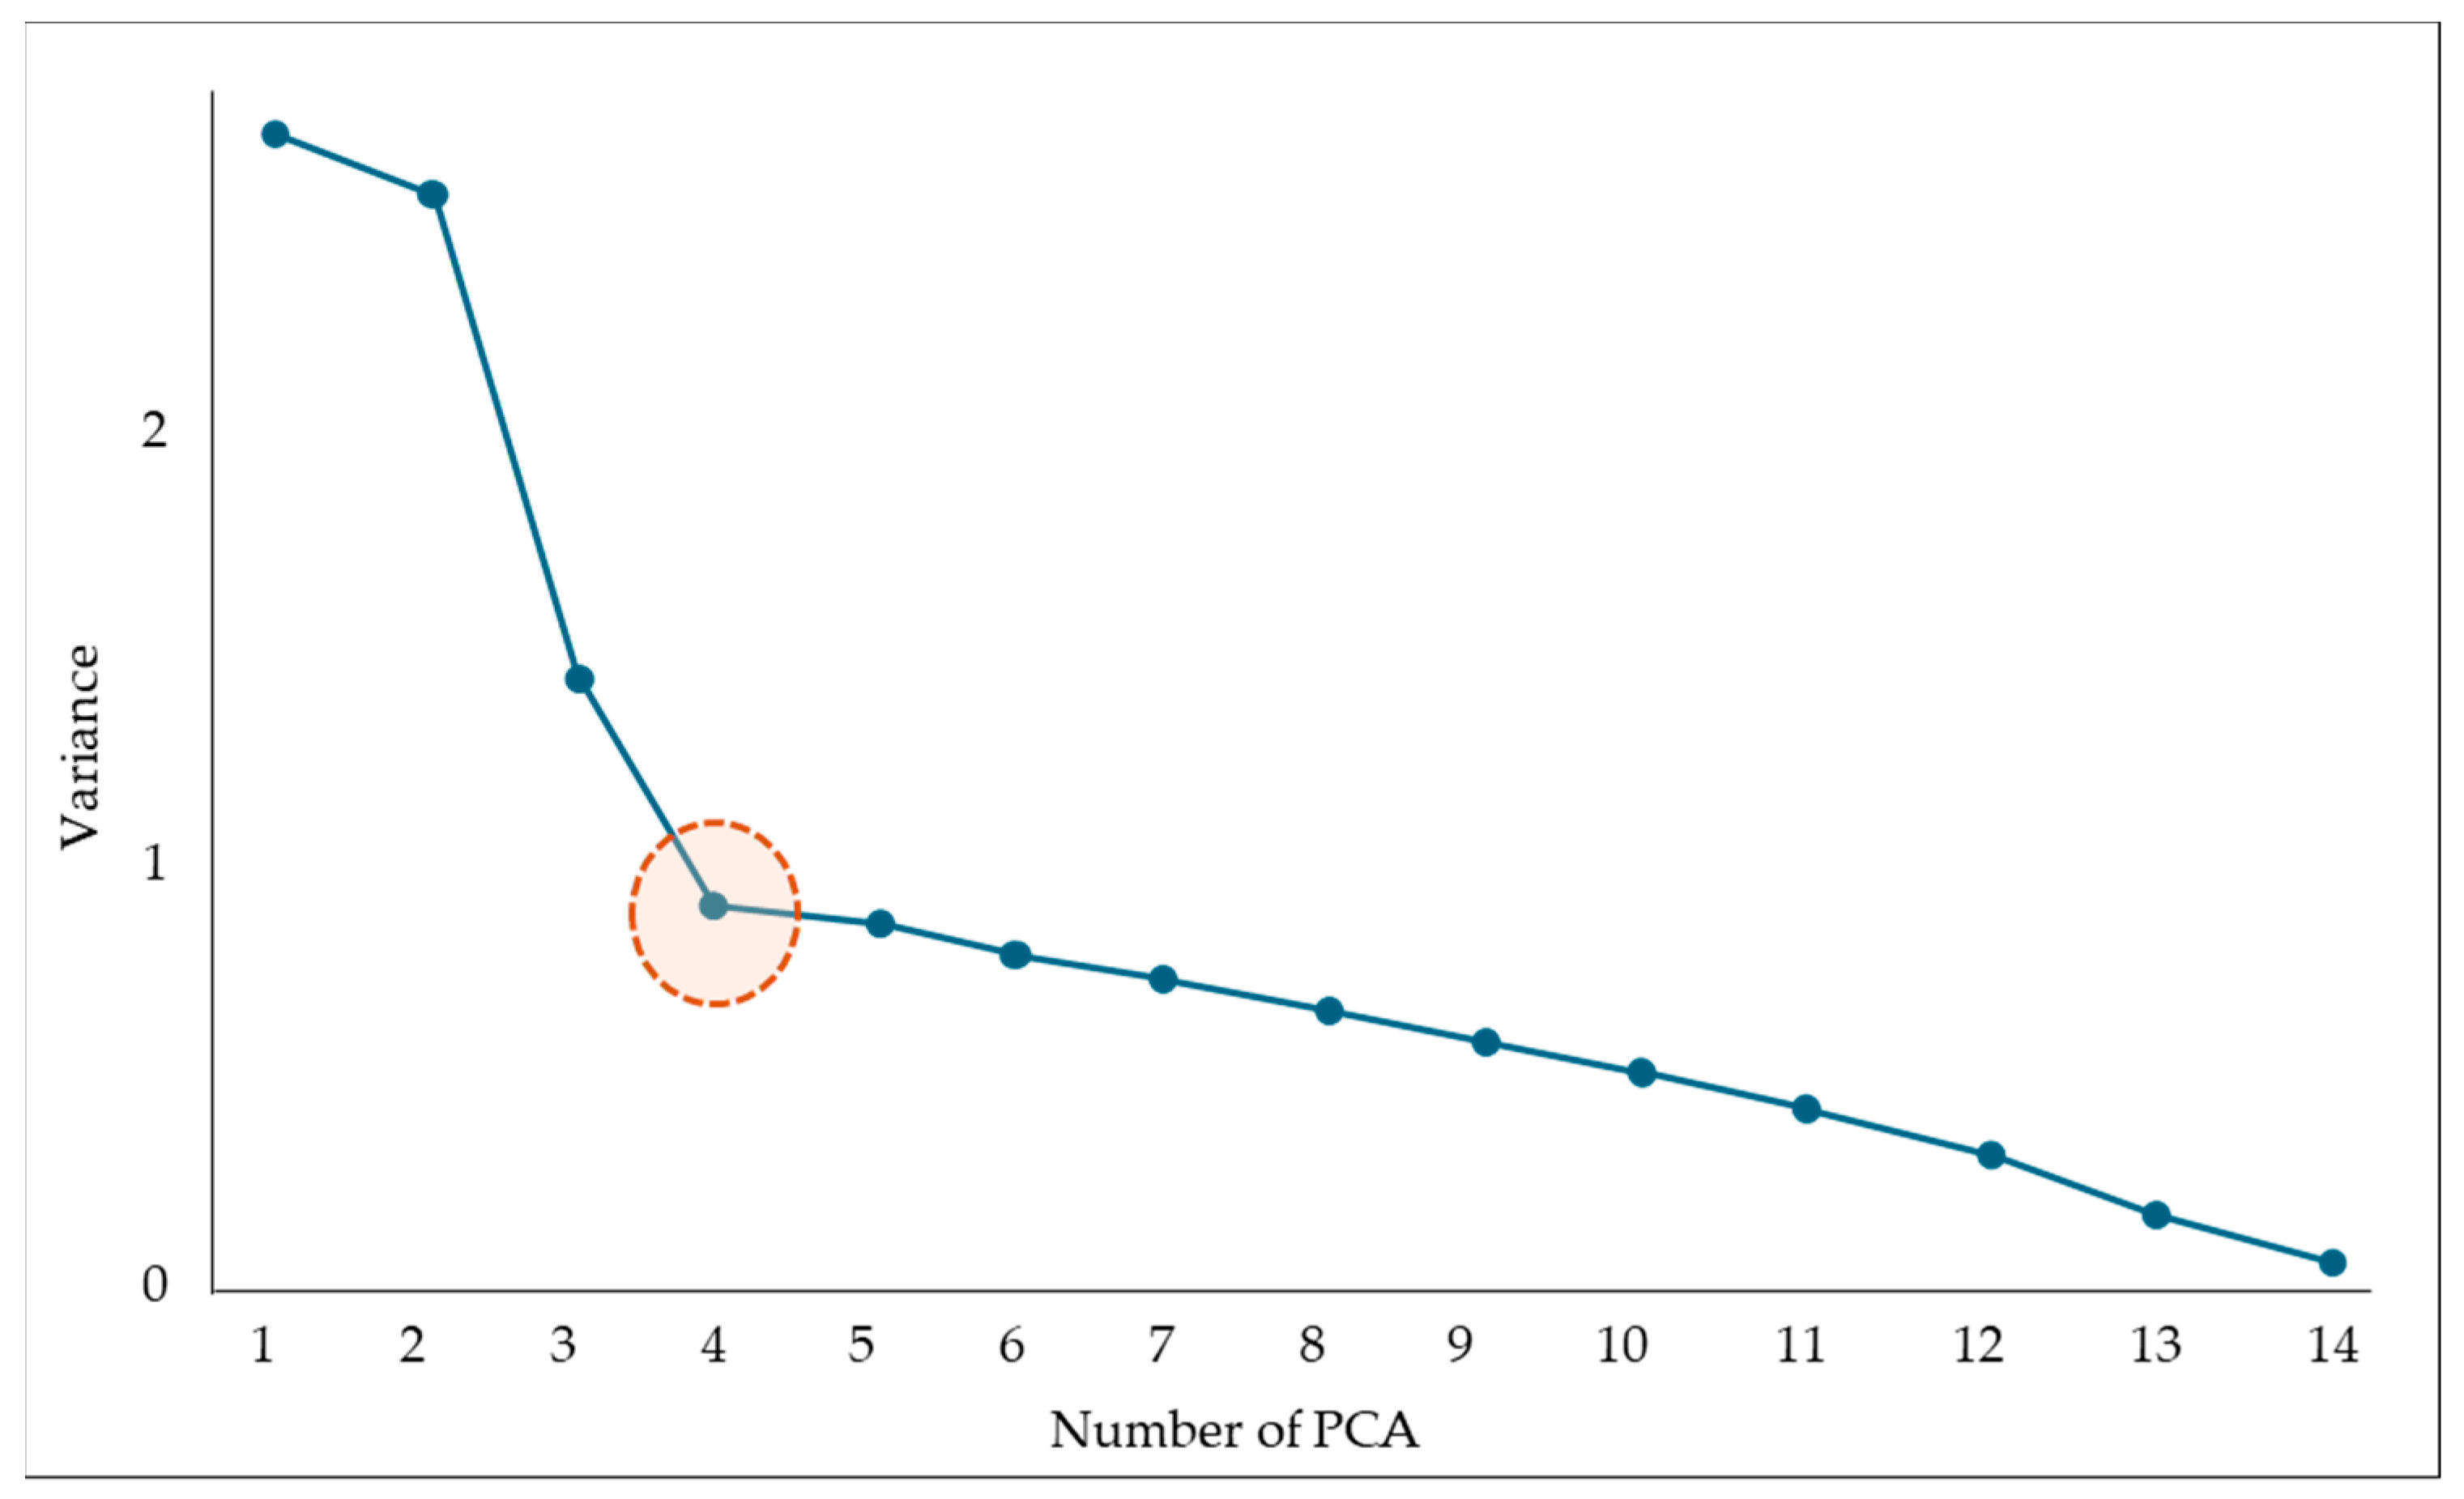
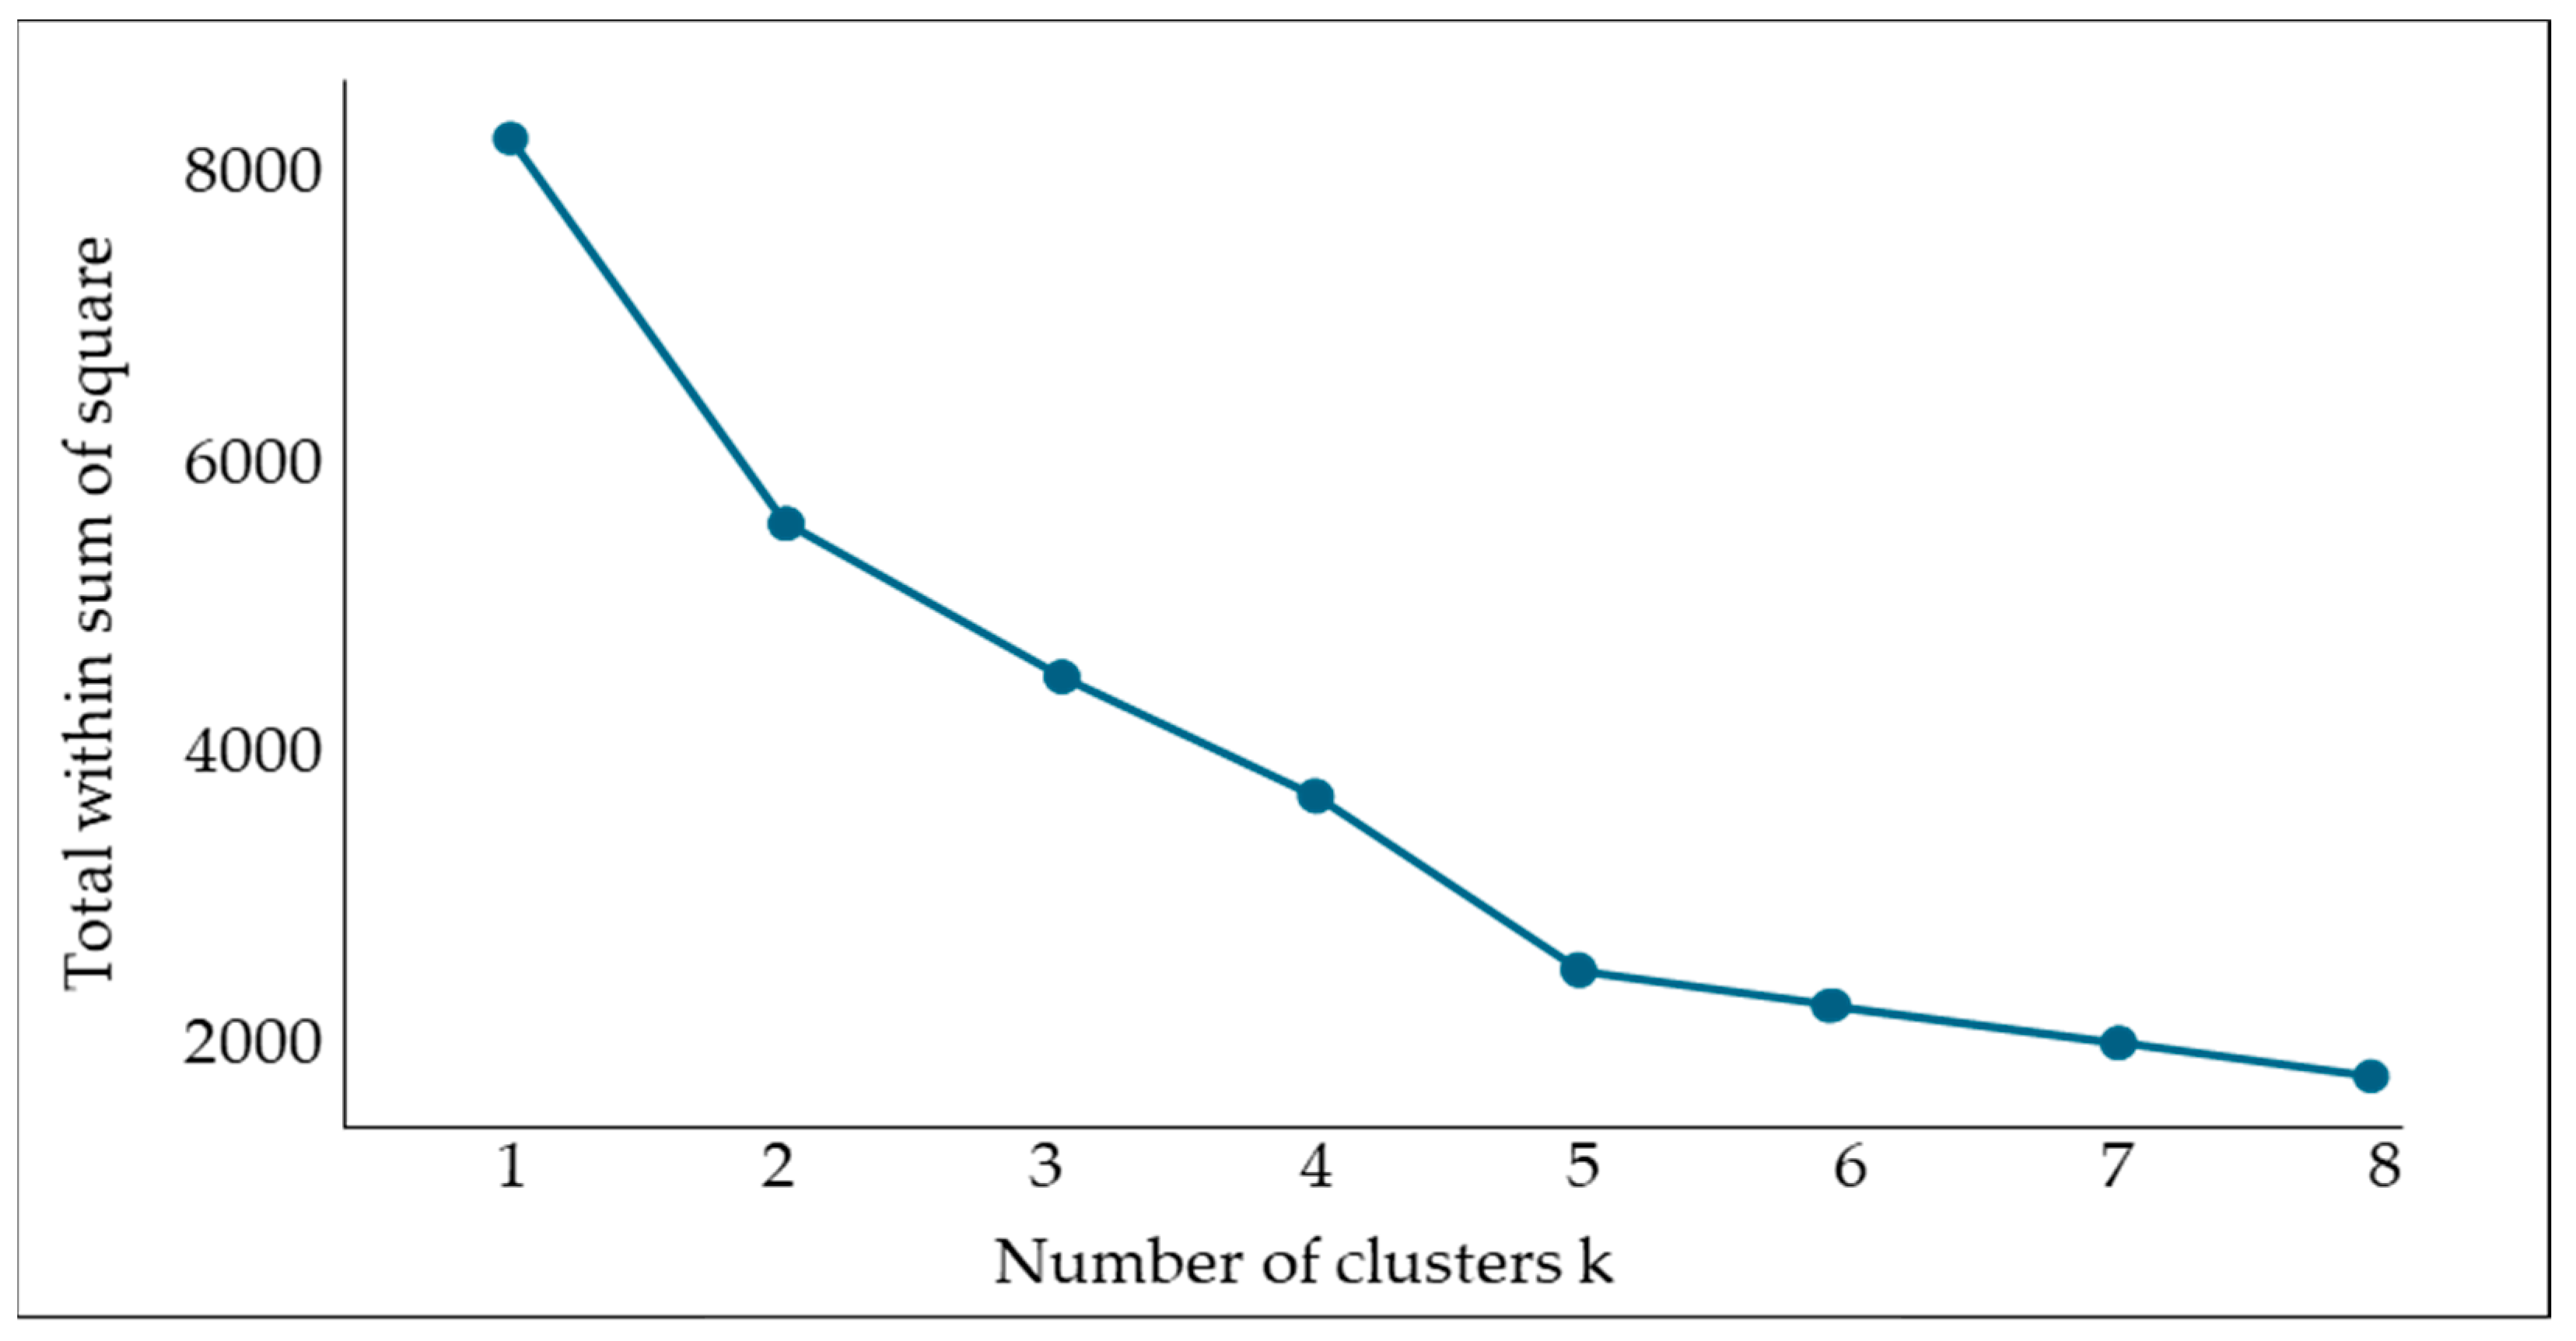
3.3. Data Scaling (PCA and Clustering)

We then performed PCA and clustering to enable efficient data analysis and dimensionality reduction prior to the model development. PCA reduced the dimensionality of high-dimensional data while preserving its variance as much as possible, identifying the primary components of the data and analyzing the correlations among the original variables. This aided in understanding the data structure [66]. By reducing dimensionality and preserving critical information, PCA minimized the complexity of the model training process.
Before conducting PCA, a standardization process was performed to normalize the data and ensure correct principal component extraction. Through this process, 14 original variables were standardized to have a mean of 0 and a standard deviation of 1, and the number of principal components was reduced to 4 using a scree plot. Figure 8 illustrates the elbow point in the scree plot for the 14 selected PCA components, showing that the point at which the eigenvalues rapidly decreased and then leveled off to be 4. Beyond this point, the principal components offered minimal contribution to explaining the variance of the data, confirming the selection of four principal components.
Table 10 summarizes the PCA results. Each of PC1–PC4 represents the proportion of total data variance explained, accounting for over 55% of the total variance. Based on the four principal components derived from the PCA, clustering analysis was then performed on the data. Clustering is a data analysis technique that groups samples into clusters based on their similarity or distance metrics [67]. Noisy high-dimensional data can distort clustering; consequently, the data reduced via PCA were used to enable clearer distinctions between the clusters and facilitate pattern analysis. Clustering methods include hierarchical methods, which do not predefine the number of clusters, and non-hierarchical methods, which require specifying the number of clusters. Among non-hierarchical methods, k-means clustering partitions the data into clusters based on a predefined number of classes (k). Each sample is assigned to the nearest center, and the center is updated as the average of each class’s samples, the process being repeated until convergence [67].
In this study, k-means clustering was used, grouping the data to minimize total within-cluster variance (total within sum of squares). The optimal number of clusters was determined using a scree plot, which revealed that dividing the data into eight clusters proved to be the most appropriate choice, that is, beyond eight clusters, the total within-cluster variance did not notably decrease. Each cluster grouped data with similar operational conditions, contributing to the identification of key combustion patterns for future model development. Figure 9 demonstrates the effectiveness of dividing the data into eight clusters in reducing the variance using the scree plot.
Data with similar operational conditions were effectively grouped through the clustering process, providing a foundation for developing sophisticated combustion control models that reflected cluster-specific patterns during the model training process.

4. Methodology

The ABCCM comprises an optimal combustion pattern prediction model using the RF algorithm and a gross heat rate prediction model using the CART algorithm. The integration of these two algorithms leverages their respective strengths. The RF algorithm accurately predicts the optimal combustion patterns based on the mixing ratios and properties of the by-product gases, whereas the CART algorithm evaluates and adjusts the energy efficiency in real time based on the gross heat rate. This enables precise control and optimization of the boiler performance under varying operating conditions. The combination of the RF and CART algorithms forms a feedback loop that continuously improves the combustion efficiency. Based on the optimal combustion patterns provided by the RF algorithm, the CART algorithm evaluates their impact on the energy efficiency of the power plant in real time and delivers optimized results. This iterative process continuously adjusts the combustion conditions and operational efficiency, minimizing the energy loss and optimizing the fuel consumption. Additionally, the CART algorithm accounts for external factors, such as the variability in the fuel supply, enabling it to maintain optimal combustion patterns under changing conditions.
The ABCCM operates by sequentially invoking the optimal combustion pattern prediction model and the gross heat rate prediction model, with the final predictive pattern proposed through an execution script. It allows for more precise and efficient combustion control compared to traditional single-model control methods, contributing to maximizing the boiler performance and overall power plant efficiency. This combined model is outlined in Figure 10.

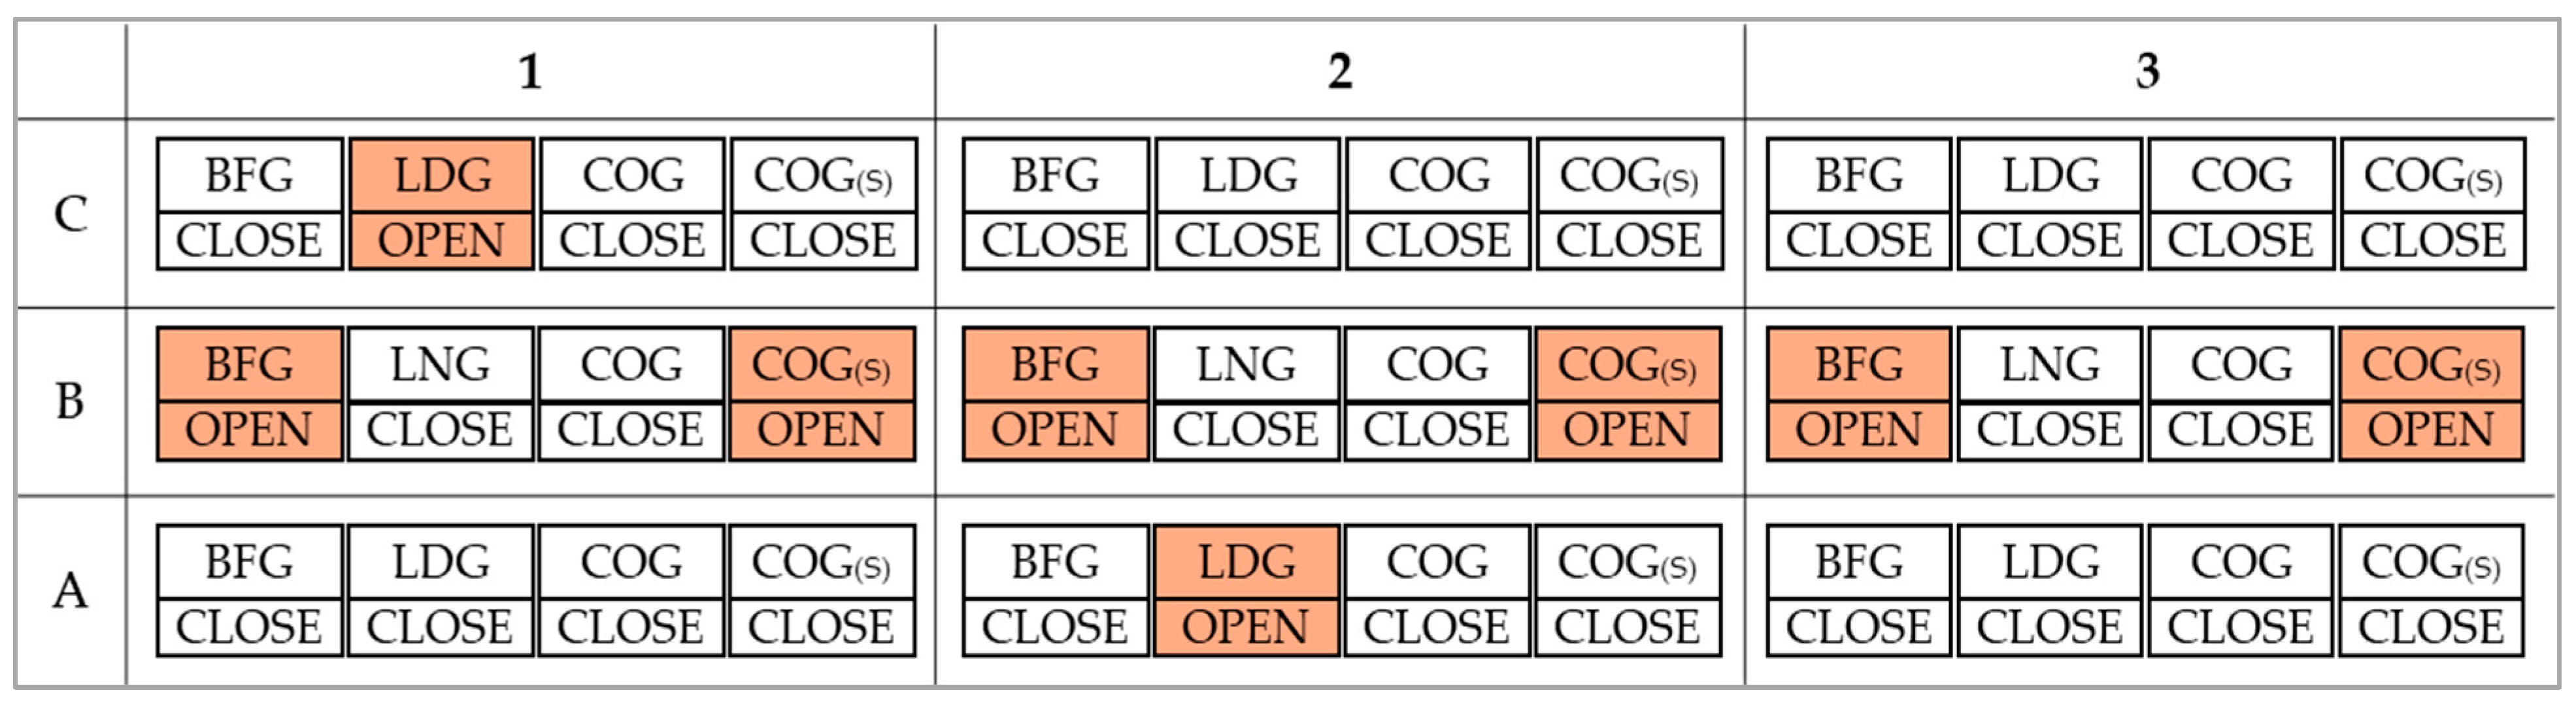
4.1. Introduction to Boiler Burner Operation and Relationship with Gross Heat Rate

The high calorific values and greater air requirements of COG and LDG make it impossible to co-fire these two gases together. However, low-calorific BFG can be co-fired with LDG or COG, with a COG stabilizer used for ignition. When the boiler is cooled at the time of initial ignition, combustion is not possible with BFG alone, so the COG is kept continuously ignited on-site. Figure 11 shows the configuration of the nine burners arranged in rows and columns from A1 to C3, illustrating an actual operational scenario whereby LDG was selected for burner C1, BFG for burners B1–B3, and LDG for burner A2.
Frequent switching of the burners can negatively impact the combustion efficiency; consequently, the burners are generally operated without replacement. However, under certain circumstances, burner replacement is unavoidable. The first situation involves fuel replacement owing to fluctuations in the gas supply. If the gas supply is insufficient owing to blast furnace maintenance or increases because of malfunctions in other power generation facilities, the fuel is replaced following instructions from the UCC. Although operations maintain a turbine inlet temperature of 540 °C, if additional fuel usage instructed by the UCC risks surpassing this temperature, thereby jeopardizing equipment integrity, combustion is curtailed regardless of the instructions.
The second situation involves fuel replacement for pressure regulation. When the LDG pressure increases when eight out of nine burners are in operation, the on/off valve of the idle burner is opened to reduce the LDG pressure, stabilize the fuel supply, and induce a temperature increase. During this process, the total LDG flow rate remains constant, but the additional burner is operated to relieve excessive pressure. The LDG pressure must not exceed 400 kg/cm2, as exceeding this limit could negatively impact equipment stability. Stable operation of the boiler burners enhances their combustion efficiency and reduces their gross heat rate. The lower gross heat rates contribute to increased power generation efficiency. Equation (1) represents the overall efficiency of the power plant [68].
%   E f f .   o f   P o w e r   P l a n t = %   E f f .   o f   S t e a m   T u r b i n e   ×   % E f f .   o f   B o i l e r   × 1 100
Here, the steam turbine efficiency is typically reduced considerably (to below 50%) by condenser losses, whereas the boiler efficiency is approximately 80–90%, resulting in an overall power plant efficiency slightly more than 40% [69]. To calculate the overall efficiency more accurately, an approach based on the gross heat rate through the in-out method can be used. Equation (2) represents the relationship between the power generation efficiency and gross heat rate [70].
%   E f f .   o f   P o w e r   P l a n t   =   860 G r o s s   H e a t   R a t e × 100
Here, the gross heat rate is the sum of unit consumption for the power, fuel, and cooling water, expressed in kcal/kWh. A smaller value indicates higher efficiency, as it represents the heat consumed to produce 1 kWh of electricity. The constant 860 is used to convert 1 kWh into energy units, signifying that 1 kWh = 860 kcal. The formulas for power consumption, fuel, and seawater unit rates are presented in Equations (3)–(5), respectively [71,72,73].
P o w e r   C o n s u m p t i o n   U n i t   R a t e = P o w e r   C o n s u m p t i o n × 2230   K c a l O u t p u t × 1000
Moreover, the power consumption includes the energy used by the auxiliary equipment and control systems within the power plant, aside from the power generation itself [71]. A lower power consumption-to-output ratio indicates more efficient operations. This serves as an important metric for optimizing the auxiliary systems and reducing the energy losses within the system. The fuel unit rate can be determined by the type of fuel source and its energy content and is one of the critical factors influencing the power generation efficiency. However, variations in the flow rate of by-product gases can cause problems, such as degraded flame quality and flame loss within the combustion chamber, reducing the power plant’s stability and increasing the fuel unit rate considerably. Consequently, the stable supply of by-product gases and optimized combustion are essential factors in reducing the fuel unit rate [74]. The formula for calculating the specific fuel consumption can be expressed as follows [72]:
F u e l   U n i t   R a t e = B F G   F l o w   R a t e × B F G   F l o w   R a t e + C O G   F l o w   R a t e × C O G   C a l o r i f i c   V a l u e + L D G   F l o w   R a t e × L D G   C a l o r i f i c   V a l u e O u t p u t × 1000
Although the cooling water unit rate has a minor effect compared to the power consumption unit rate or fuel unit rate, it remains a non-negligible variable, particularly when considering the impact of the seawater flow rate and cooling efficiency on the thermal management and condenser efficiency of power plants. If the seawater flow rate is not optimized, it can lead to increased heat loss in the condenser, reducing the overall efficiency. The formula for calculating the seawater unit rate can be expressed as follows [73]:
C o o l i n g   W a t e r   U n i t   R a t e = S e a w a t e r   F l o w   R a t e × 140 × 2.5 × 60 O u t p u t × 1000

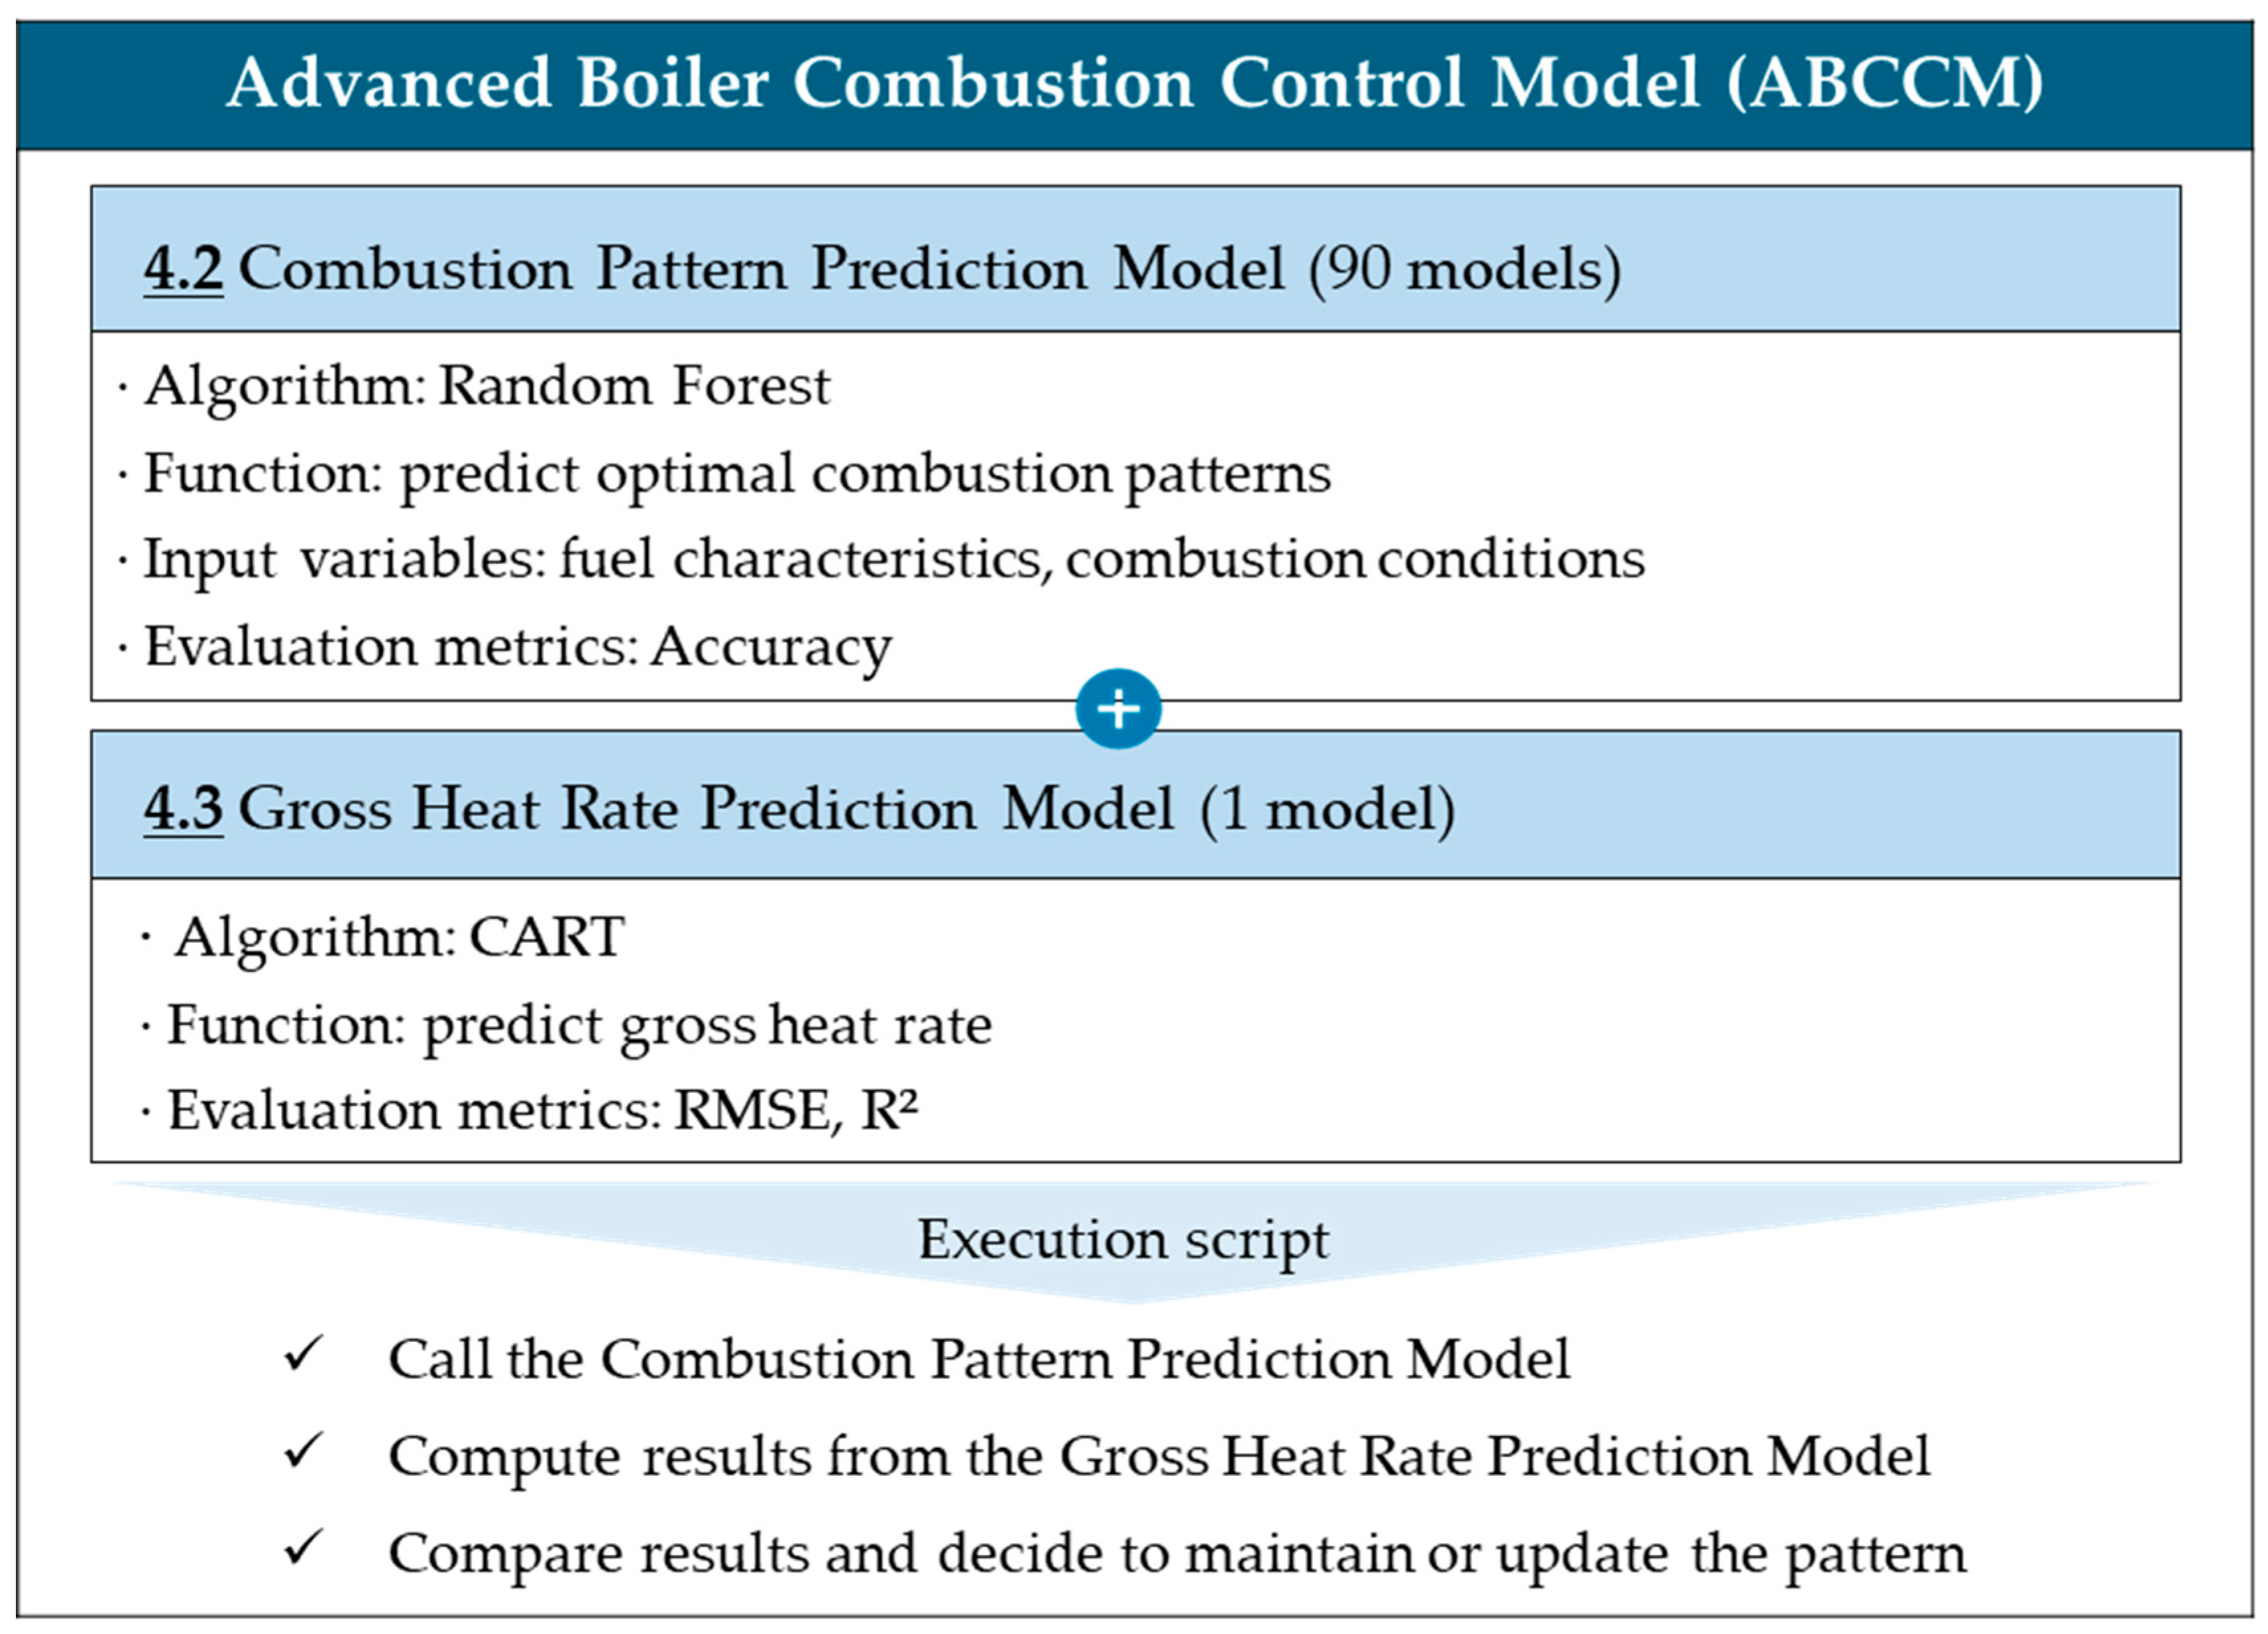
4.2. Optimal Combustion Pattern Prediction Model

4.2.1. Model Selection for Optimal Combustion Pattern Prediction

Considering the characteristics of the combustion data, the logistic regression (LR), CART, and RF algorithms were selected as candidates for the optimal combustion pattern prediction model. The data for optimal combustion pattern prediction comprise primarily structured numerical data, such as the flow rate, calorific value, and pressure of by-product gases, as well as boiler operating conditions, for example, the O2 and NOx concentrations, which exhibit dynamic changes over time. These data involve complex interactions among variables and non-linear relationships, requiring algorithms capable of handling such complexities.
The LR algorithm is suitable when the data exhibit linear trends and offers the advantage of a simple and clear interpretation of relationships between variables. It is useful during the initial analytical phase for identifying basic patterns in the data. By contrast, the CART algorithm provides flexibility in handling non-linear relationships and interactions among variables. It visually represents the relationships between the combustion conditions and efficiency through its tree structure. It is particularly effective in identifying the importance of key variables under combustion conditions.
The RF algorithm combines multiple decision trees to handle complex non-linear relationships, prevent overfitting, and enhance the generalization performance [75]. It also offers robust and reliable predictions even with noisy and complex data structures. The RF algorithm quantitatively evaluates variable importance, providing critical information for deriving optimal combustion patterns. These algorithm characteristics align with the properties of the combustion data, including the non-linear interactions of by-product gas mixing ratios, combustion conditions, and dynamic changes over time. Consequently, the RF algorithm, known for its stability and high predictive performance with complex data, was adopted. The strengths and weaknesses of each of the algorithms discussed above are summarized in Table 11.
This study emphasizes the importance of handling the complex nonlinear interactions between the composition of steelmaking by-product gas and combustion conditions and optimizing the combustion conditions in real time. The RF and CART algorithms fulfill these requirements in terms of combustion data characteristics, stability, computational efficiency, and data adaptability. Compared to other ML models, DL can provide high accuracy but lacks interpretability and can be susceptible to overfitting, whereas the RF and CART algorithms excel in understanding and explaining results. The support vector machine algorithm excels in high-dimensional data but can be inefficient when handling large and unstructured data [76]. Boosting algorithms, such as the XGBoost and LightGBM algorithms, are renowned for their high predictive accuracy [77,78]. However, the ensemble nature of these models can make it difficult to interpret the underlying decision-making process [79]. Deep neural networks, although powerful in handling large and complex datasets, can suffer from high computational costs, limiting their applicability in real-time systems. Moreover, neural networks can be prone to overfitting, necessitating regularization techniques to improve their generalization abilities. Consequently, the combination of the RF and CART algorithms proved to be the optimal choice for meeting the research requirements in environments that require handling complex interactions between the fuel characteristics and combustion conditions and performing real-time optimization. In particular, the RF algorithm, which uses ensemble techniques, exhibits excellent performance in preventing overfitting and provides stable performance even with data under highly variable operating conditions [75].
Additionally, it provides robust resilience to noise in the Combustion data, improving the reliability of its predictions. Finally, the RF algorithm supports parallel processing for handling large datasets, making it highly suitable for real-time data analysis [80]. The RF algorithm randomly extracts n samples with replacements from the original data, and multiple decision-tree learners are trained simultaneously. Whereas decision trees use all the provided features for node splitting, the RF algorithm randomly selects a subset of features equal to the square root of the total features for each split. For classification algorithms, each split seeks to minimize the Gini impurity or entropy, and for regression, the optimal split point minimizes the mean squared error.

4.2.2. Modeling

Modeling is the process of applying algorithms after data preprocessing and analysis to generalize the data patterns. The primary concept of modeling is to analyze the characteristics of the preprocessed dataset to explore and select ML models that align with the research objectives [34]. This also includes the training and evaluation of the model using training and test datasets and selecting the highest-performing model.
In this study, considering the potential external burner environmental factors, a total of 96 combustion pattern models were generated using the RF algorithm. To achieve this, Company P’s Workbench analysis tool was used, enabling integrated analysis across the data preprocessing, modeling, and evaluation processes. The overall modeling process is illustrated in Figure 12.

4.2.3. RF Model Training and Hyper Parameters

The model training process in this study used approximately four months of data, from December 2020 to March 2021. Multiple stages of data preprocessing and quality improvement were performed to enhance the accuracy of the modeling process. First, clustering analysis was conducted to derive eight clusters that reflected the characteristics and similarities within the data, and stratification was applied to each cluster to optimize the data quality and characteristics. This ensured that similar data characteristics were maintained within each group, allowing variability among the data to be more effectively reflected during the model training process.
The gross heat rate was set as the dependent variable for selecting the optimal combustion patterns, as it serves as a key metric for evaluating the combustion efficiency. To enhance the quality of the training dataset, only the top 40% of the data within the gross heat rate of each cluster were selected for training. This approach allowed the model to focus more on the optimal combustion patterns while minimizing biases caused by inefficient data. After selecting the top 40% of data for each of the eight stratified clusters, the data were recombined into a single dataset to form the final training dataset. Subsequently, the RF algorithm was applied to model the optimal combustion patterns for each type of by-product gas.
During the training of the final RF algorithm, the entire dataset was split in an 80:20 ratio, with 80% being used as the training dataset and the remaining 20% being used as the test dataset to validate the model’s predictive performance. Additionally, hyper parameter optimization was conducted to maximize the model’s performance. To minimize the risk of overfitting in the RF algorithm, pruning was applied by setting the maximum tree depth to ten. This contributed to ensuring consistency in the combustion pattern predictions.
Hyper parameters are parameters set during the training of ML models, which influence the structure or the model’s learning method [80]. They control the training process, and appropriate hyper parameter settings play a crucial role in enhancing the model performance and preventing problems such as overfitting or underfitting [81]. A total of 100 decision trees were combined for training, with each tree predicting the combustion states and ultimately deriving the most frequent combustion patterns to recommend the optimal burner combination to the operator.
In this study, hyper parameter tuning for the model was conducted using the PosFrame tool developed by Company P [61]. PosFrame is a framework that constrains the range of tunable parameters depending on the packages used by its components and supports a block-coding approach to efficiently apply frequently used functions. During the hyper parameter tuning process for the RF and CART algorithms, the complexity parameter (CP) was used to adjust the model complexity, designed to prevent overfitting and improve the prediction accuracy. For the RF algorithm, hyper parameter tuning involved limiting the maximum depth of the trees to ten and setting the number of trees to 100. This approach sought to reduce model complexity, prevent overfitting, and optimize both the stability and predictive performance.
Additionally, sensitivity analysis was conducted to evaluate the impact of the hyper parameters on the model performance. During this process, parameter exploration was conducted using repeated grid search and repeated random search techniques for each algorithm component, with the optimization goal set to maximize accuracy. The search range was defined for each hyper parameter, and the performance of various parameter combinations derived during the search process was compared. After completing all searches, the optimal maximum depth for the model was selected based on the accuracy results for each hyper parameter combination. Notably, during the random search, the model was trained to a maximum depth of 20, as supported by the components, and the predictive performance on both the training and test datasets was compared to determine the appropriate model configuration. This systematic and iterative tuning approach contributed to optimizing the generalization performance and predictive accuracy of the RF algorithm.
The combustion patterns for each by-product gas were then broadly classified into the General, Valve OFF, and Gas OFF models based on the burner operating conditions, and optimized combustion patterns were proposed for each condition. In most cases, operations were conducted in the general state, but the models could be separately created based on the valve ON/OFF conditions or gas ON/OFF conditions of each by-product gas to improve the model consistency. Consequently, 96 optimal combustion pattern prediction models were developed.

4.2.4. Testing the Optimal Combustion Pattern Prediction Model

The performance of the pattern classification models was evaluated through accuracy and error rates. As shown in Table 12, the classification models for the BFG, COG, and LDG achieved the best accuracy rates in both the training and testing datasets. The test dataset for BFG pattern classification recorded an accuracy of 99.6471%, demonstrating remarkably high prediction accuracy. Similarly, the COG pattern classification recorded an accuracy of 99.8765%, further proving the excellent predictive performance of the model. These performance evaluation results demonstrated that the developed combustion pattern model could deliver stable performance across various gas types (BFG, COG, and LDG) and mixed patterns, with a level of accuracy suitable for real-time prediction and control.

4.3. Gross Heat Rate Prediction Model

4.3.1. Model Selection for Gross Heat Rate Prediction

For the gross heat rate prediction model, the CART algorithm was adopted owing to its ability to support rapid and intuitive decision-making based on clear rules. The CART algorithm is a decision-tree-based algorithm that performs regression or classification tasks by hierarchically partitioning the data. It has the advantage of being easily interpretable and generating intuitive rule-based models, making it advantageous for developing systems that provide real-time feedback on the differences between predicted and actual values, enabling operators to respond quickly [82]. In this study, regression was used to predict the gross heat rate based on the continuous data characteristics. Whereas classification trees determine classes by majority voting, regression trees define the value of the regression function by using the mean of the y-values in each subregion as a constant.
The RF algorithm was used in the earlier combustion pattern prediction model. It is an ensemble method that trains multiple decision trees in parallel and combines their predictions, making it suitable for handling complex interactions among numerous variables. However, the RF algorithm has drawbacks, such as its poor interpretation and extended training times owing to the creation of hundreds of trees. Consequently, the CART algorithm, which is easier to interpret and provides real-time feedback, was chosen for the gross heat rate predictions. By appropriately selecting and combining algorithms for each objective, we sought to enhance the overall efficiency and accuracy of the system.

4.3.2. Modeling

To develop the gross heat rate prediction model, the CART algorithm was applied to 67 preprocessed variables. Similar to the combustion pattern prediction model, modeling was conducted using the Workbench analysis tool; the overall process is illustrated in Figure 13.
Data sampling was conducted randomly, and fine-tuning was performed using repeated cross-validation. A total of seven CPs were set, and cross-validation-based training was conducted to prevent overfitting. After the model training, evaluation metrics such as the cross-validation average accuracy for each CP value were compared, and the final tree was created and evaluated at the optimal CP value.

4.3.3. CART Model Training

The model training process in this study used approximately four months of data from December 2020 to March 2021, with the training and test datasets split in a 7:3 ratio. To reduce overfitting, repeated cross-validation was applied. The training dataset was divided into three folds, with each fold being used as a validation dataset once, whereas the other two folds were used as the training dataset. This process was repeated three times to ensure the stability of the model’s performance. k-fold cross-validation is a single cross-validation method, whereas repeated cross-validation determines not only the number of folds but also the number of repetitions, splitting the data differently in each repetition. This makes the model’s performance evaluation more stable and reliable.
In this study, hyper parameter tuning of the CART algorithm was conducted to determine the optimal CP. The CP is a critical hyper parameter that controls the size and complexity of the decision tree. Smaller CP values result in deeper and more complex trees, allowing the model to fit the training data more precisely but increasing the risk of overfitting. Conversely, larger CP values lead to simpler trees, which can prevent overfitting but may increase the risk of underfitting. To identify the optimal CP value, sensitivity analysis was performed using seven candidate values ranging from 0.00000001 to 0.01. Additionally, repeated cross-validation was applied to ensure the stability and reliability of the CART algorithm. By splitting the data differently for training and validation in each iteration, the model’s performance could be evaluated across diverse data distributions. This process enabled the selection of the optimal CP value that prevented overfitting while achieving high predictive performance on the test data. This hyper parameter tuning approach maximized the generalization performance of the model and enhanced its practical applicability.
The detailed training decisions are summarized in Table 13. The optimal parameters for each CP value were selected after training.

4.3.4. Testing the Gross Heat Rate Prediction Model

Next, we evaluated the performance of the gross heat rate prediction model for seven CP values using various metrics such as the root mean squared error (RMSE), R2, and mean absolute error (MAE) to select the optimal model [83]. The RMSE represents the average square root error between the predicted and observed values, expressed as shown in Equation (6) [83]. A relatively low RMSE value indicates that the model makes predictions close to the actual data.
RMSE = 1 n i = 1 n Y i Y ^ i 2 ,
where n denotes the number of predictions, Yi denotes the observed values, and Y ^ i denotes the predicted values.
Next, R2 measures how well the model explains the variability in the actual data, expressed as shown in Equation (7) [83]. A high R2 value indicates that the model explains the data well.
R 2 = 1 S S R T S S
where SSR denotes the sum of squares of residuals, and TSS denotes the total sum of squares.
Equation (8) defines the MAE, which represents the average absolute error between the predicted and observed values [83]. A lower MAE value also indicates better predictive performance of the model.
MAE = 1 n i = 1 n Y i Y ^ i
In this study, to ensure the reliability and consistency of the performance metrics, not only RMSE, R2, and MAE were analyzed, but also their standard deviations (RMSESD, R2SD, MAESD). The results are summarized in Table 14. These standard deviation metrics represent the statistical variability of each performance indicator and play a crucial role in evaluating the predictive stability of the model. A comprehensive review of the predictive performance metrics and their standard deviations revealed that the model with a CP value of 1.00 × 10⁻⁷ exhibited the lowest RMSE (37.01627), the highest R2 (0.95297), and minimized standard deviation values. Specifically, the RMSESD (0.46905), R2SD (0.00121), and MAESD (0.14664) were remarkably low, indicating that this model achieved an optimal balance between predictive accuracy and stability. This suggests that the model maintained generalization performance without overfitting on both the training and test datasets.
Further analysis of statistical confidence intervals quantified the uncertainty of each performance metric. Based on the mean and standard deviation of the RMSE, R2, and MAE metrics, the 95% confidence intervals were calculated, confirming that the selected model maintained statistically significant stability. These analyses enhance the model’s reliability and increase its practical applicability. Table 14 provides a detailed summary of the performance evaluation results of the comprehensive unit prediction model for various CP values.
Table 14 shows that the model with a CP value of 1.00 × 10⁻⁷ achieved the lowest RMSE of 37.01627, highest R2 of 0.95297, and minimized the standard deviation of performance metrics, indicating an optimal balance between its prediction accuracy and stability. Accordingly, this model was selected as the optimal model for predicting the gross heat efficiency. The total dataset of 126,790 data points (70% of which were used for training and 30% for testing) was used to validate the final model, the performance evaluation results of which are summarized in Table 15.

5. Results: ABCCM Implementation and Discussion

The ABCCM was implemented by integrating 96 individual models for optimal combustion pattern prediction with one model for gross heat rate prediction to determine whether to adjust the final combustion pattern. These models comprised combustion pattern models tailored to the by-product gas types, mixed pattern models reflecting the state of mixed gases, and a gross heat rate prediction model that could evaluate the power generation efficiency based on the combustion pattern results. Each model suggested the operational status of the burners based on the composition of the real-time fuel supply and combustion conditions, maintaining a balance between the combustion efficiency and energy consumption. These models operated complementarily rather than independently, that is, the combustion pattern models proposed optimal burner operational patterns based on the composition and mixing state of the by-product gases, whereas the gross heat rate prediction model analyzed the impact of these patterns on the energy efficiency.

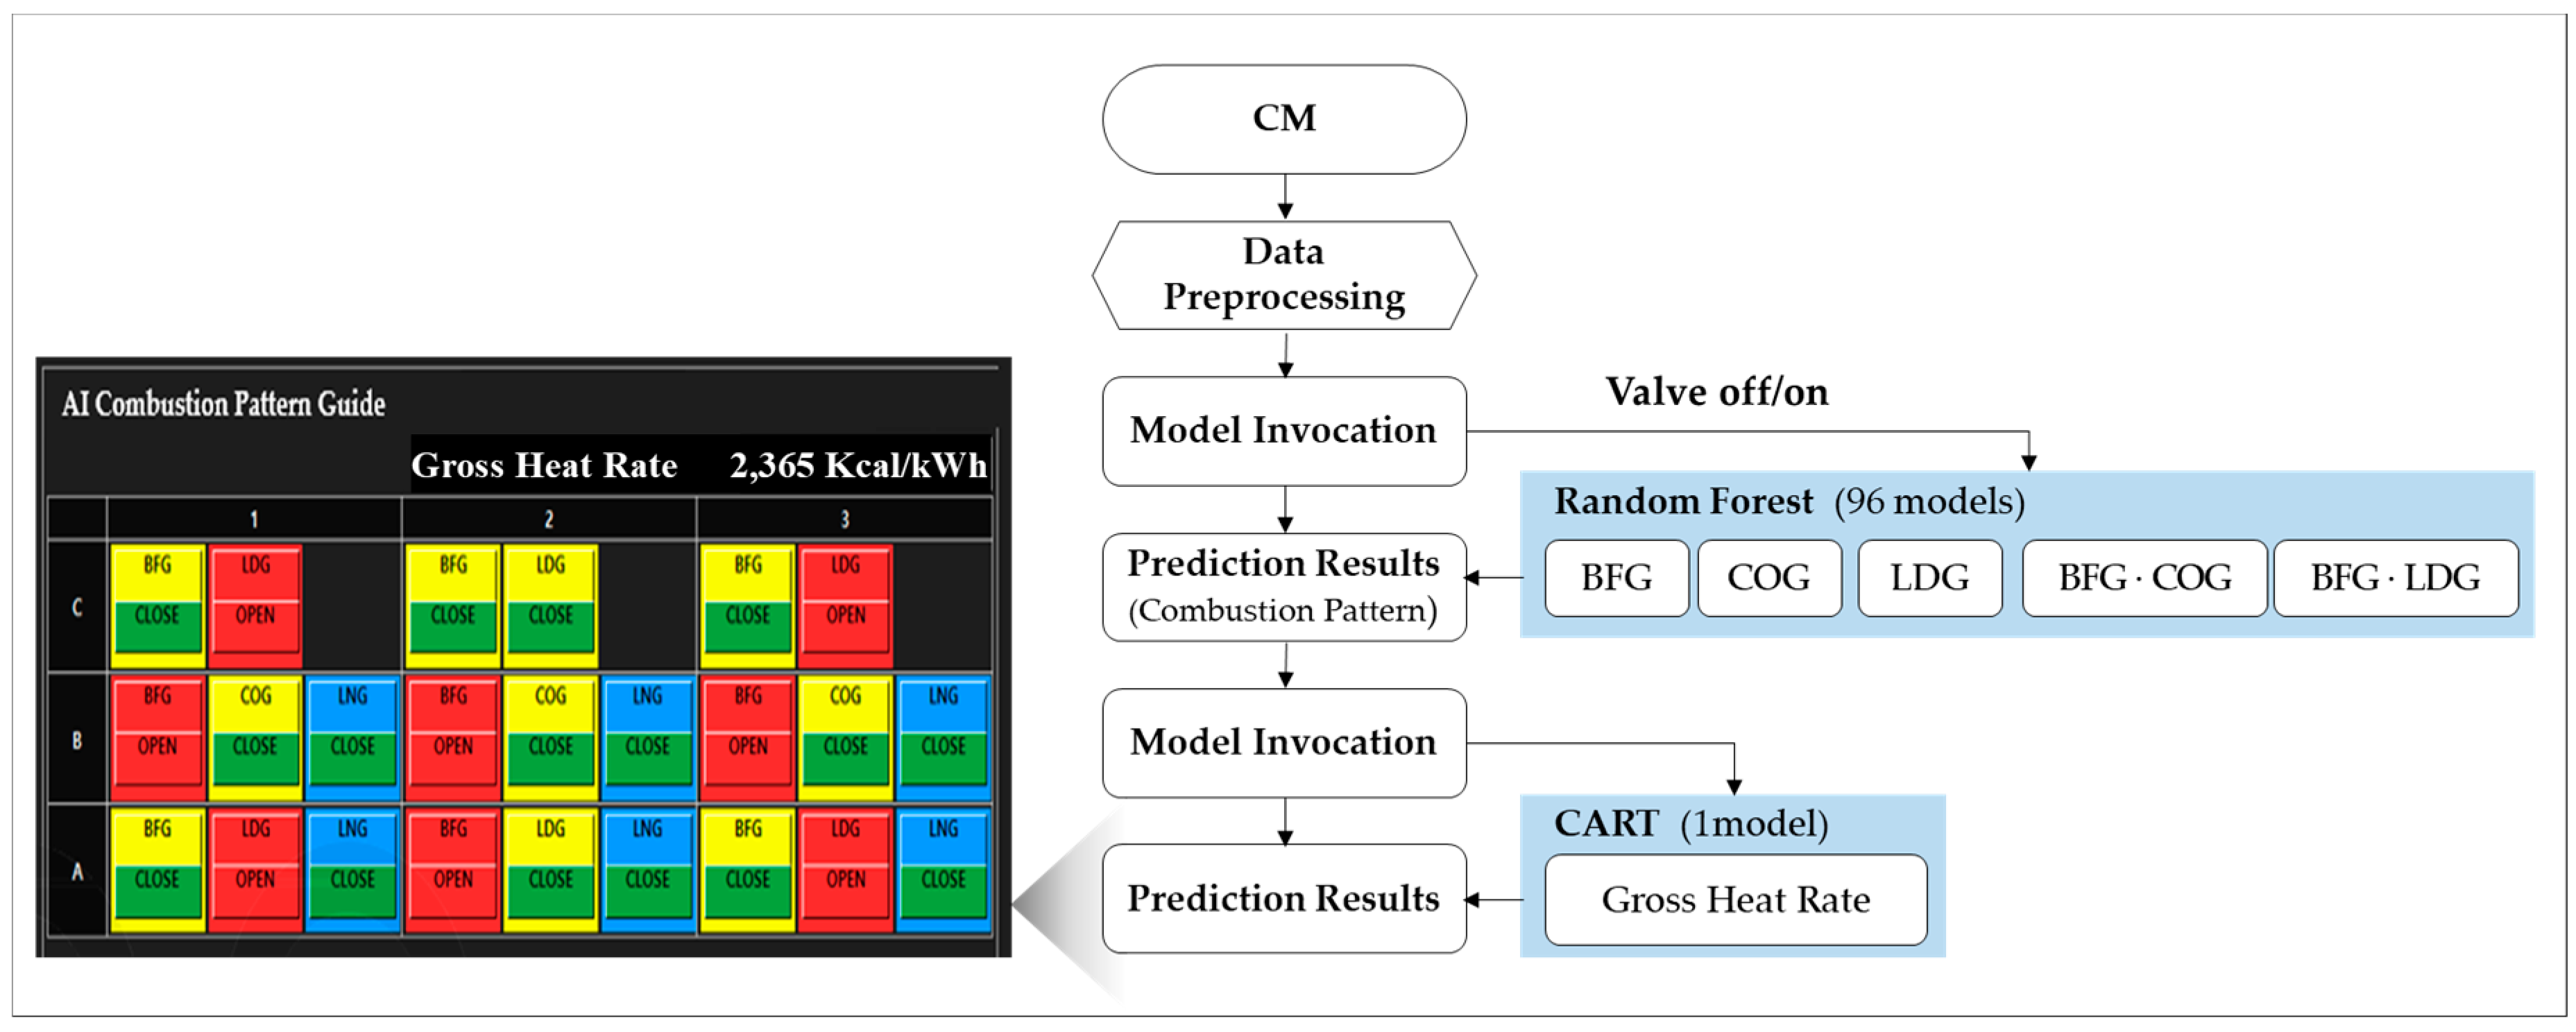
5.1. Implementation Set-Up of the ABCCM (Model Execution)

The implementation of the proposed ABCCM applied a power-of-two approach to numerically represent the positions of the nine burners. This method assigned each burner’s operational state (open or closed) as 1 or 0, respectively, and assigned a unique power-of-two value to each burner position, efficiently converting all combinations into a unique numerical value. This approach allowed for quick identification, storage, and calculation of the burner combinations for specific combustion patterns. Table 16 provides an example of converting the BFG combustion patterns using the power-of-two method. For instance, if Burner A1 was active, it was assigned a value of 256, whereas A2 and A3 were assigned values of 128 and 64, respectively. Similarly, these values were added when the burners were active and omitted when they were inactive. This method represented all combinations as unique numerical values, which could be defined as a derived variable for analyzing and controlling the combustion patterns.
Figure 14a illustrates the nine burner positions converted into power-of-two values. Each burner—from A1 to C3—was assigned a unique value, with the combinations representing the combustion state as a unique numerical value. This approach maximized efficiency in analyzing and storing combustion patterns by summarizing all possible burner states into a single numerical value. Figure 14b shows an example where the BFG pattern value was 384 and the COG pattern value was 1, visually representing the operational status of each burner. In this case, the BFG was active on A1 and A2, whereas the COG was active only on C3. This method allowed quick interpretation of the burner positions and operational status based on specific pattern values, facilitating real-time monitoring and control of the combustion process.
The overall configuration of the ABCCM featured a cyclic structure that automatically invoked the model based on real-time data and provided immediate feedback, thus helping to optimize the combustion efficiency while ensuring operational stability and efficiency.
Figure 15 illustrates the overall model implementation process. First, data is regularly collected via the Configuration Manager (CM). During this process, variables such as the VALVE_OFF status are transmitted, serving as critical input variables for model invocation. After data collection, the model execution script is activated, during which data are stored in PosFrame and managed in real time. During data extraction, real-time data collected by the CM are retrieved via a script. The model is invoked based on various fuel patterns (such as BFG, COG, and LDG). The invocation path of the model varies based on the VALVE_OFF status, enabling predictions tailored to different combustion scenarios. If VALVE_OFF is active, the model is invoked differently than the standard combustion pattern, whereas the general prediction pattern is used when it is inactive. Once the model is invoked, the prediction results are generated. During the prediction process, optimal combustion patterns are derived based on real-time combustion pattern data, and if the predicted values deviate from historical patterns, an automatically adjusted pattern is applied. This approach plays a critical role in maintaining the stable operation of the power generation facilities. Finally, the gross heat rate prediction model is invoked to determine whether the adjusted pattern should be guided in the system based on changes in the gross heat rate.

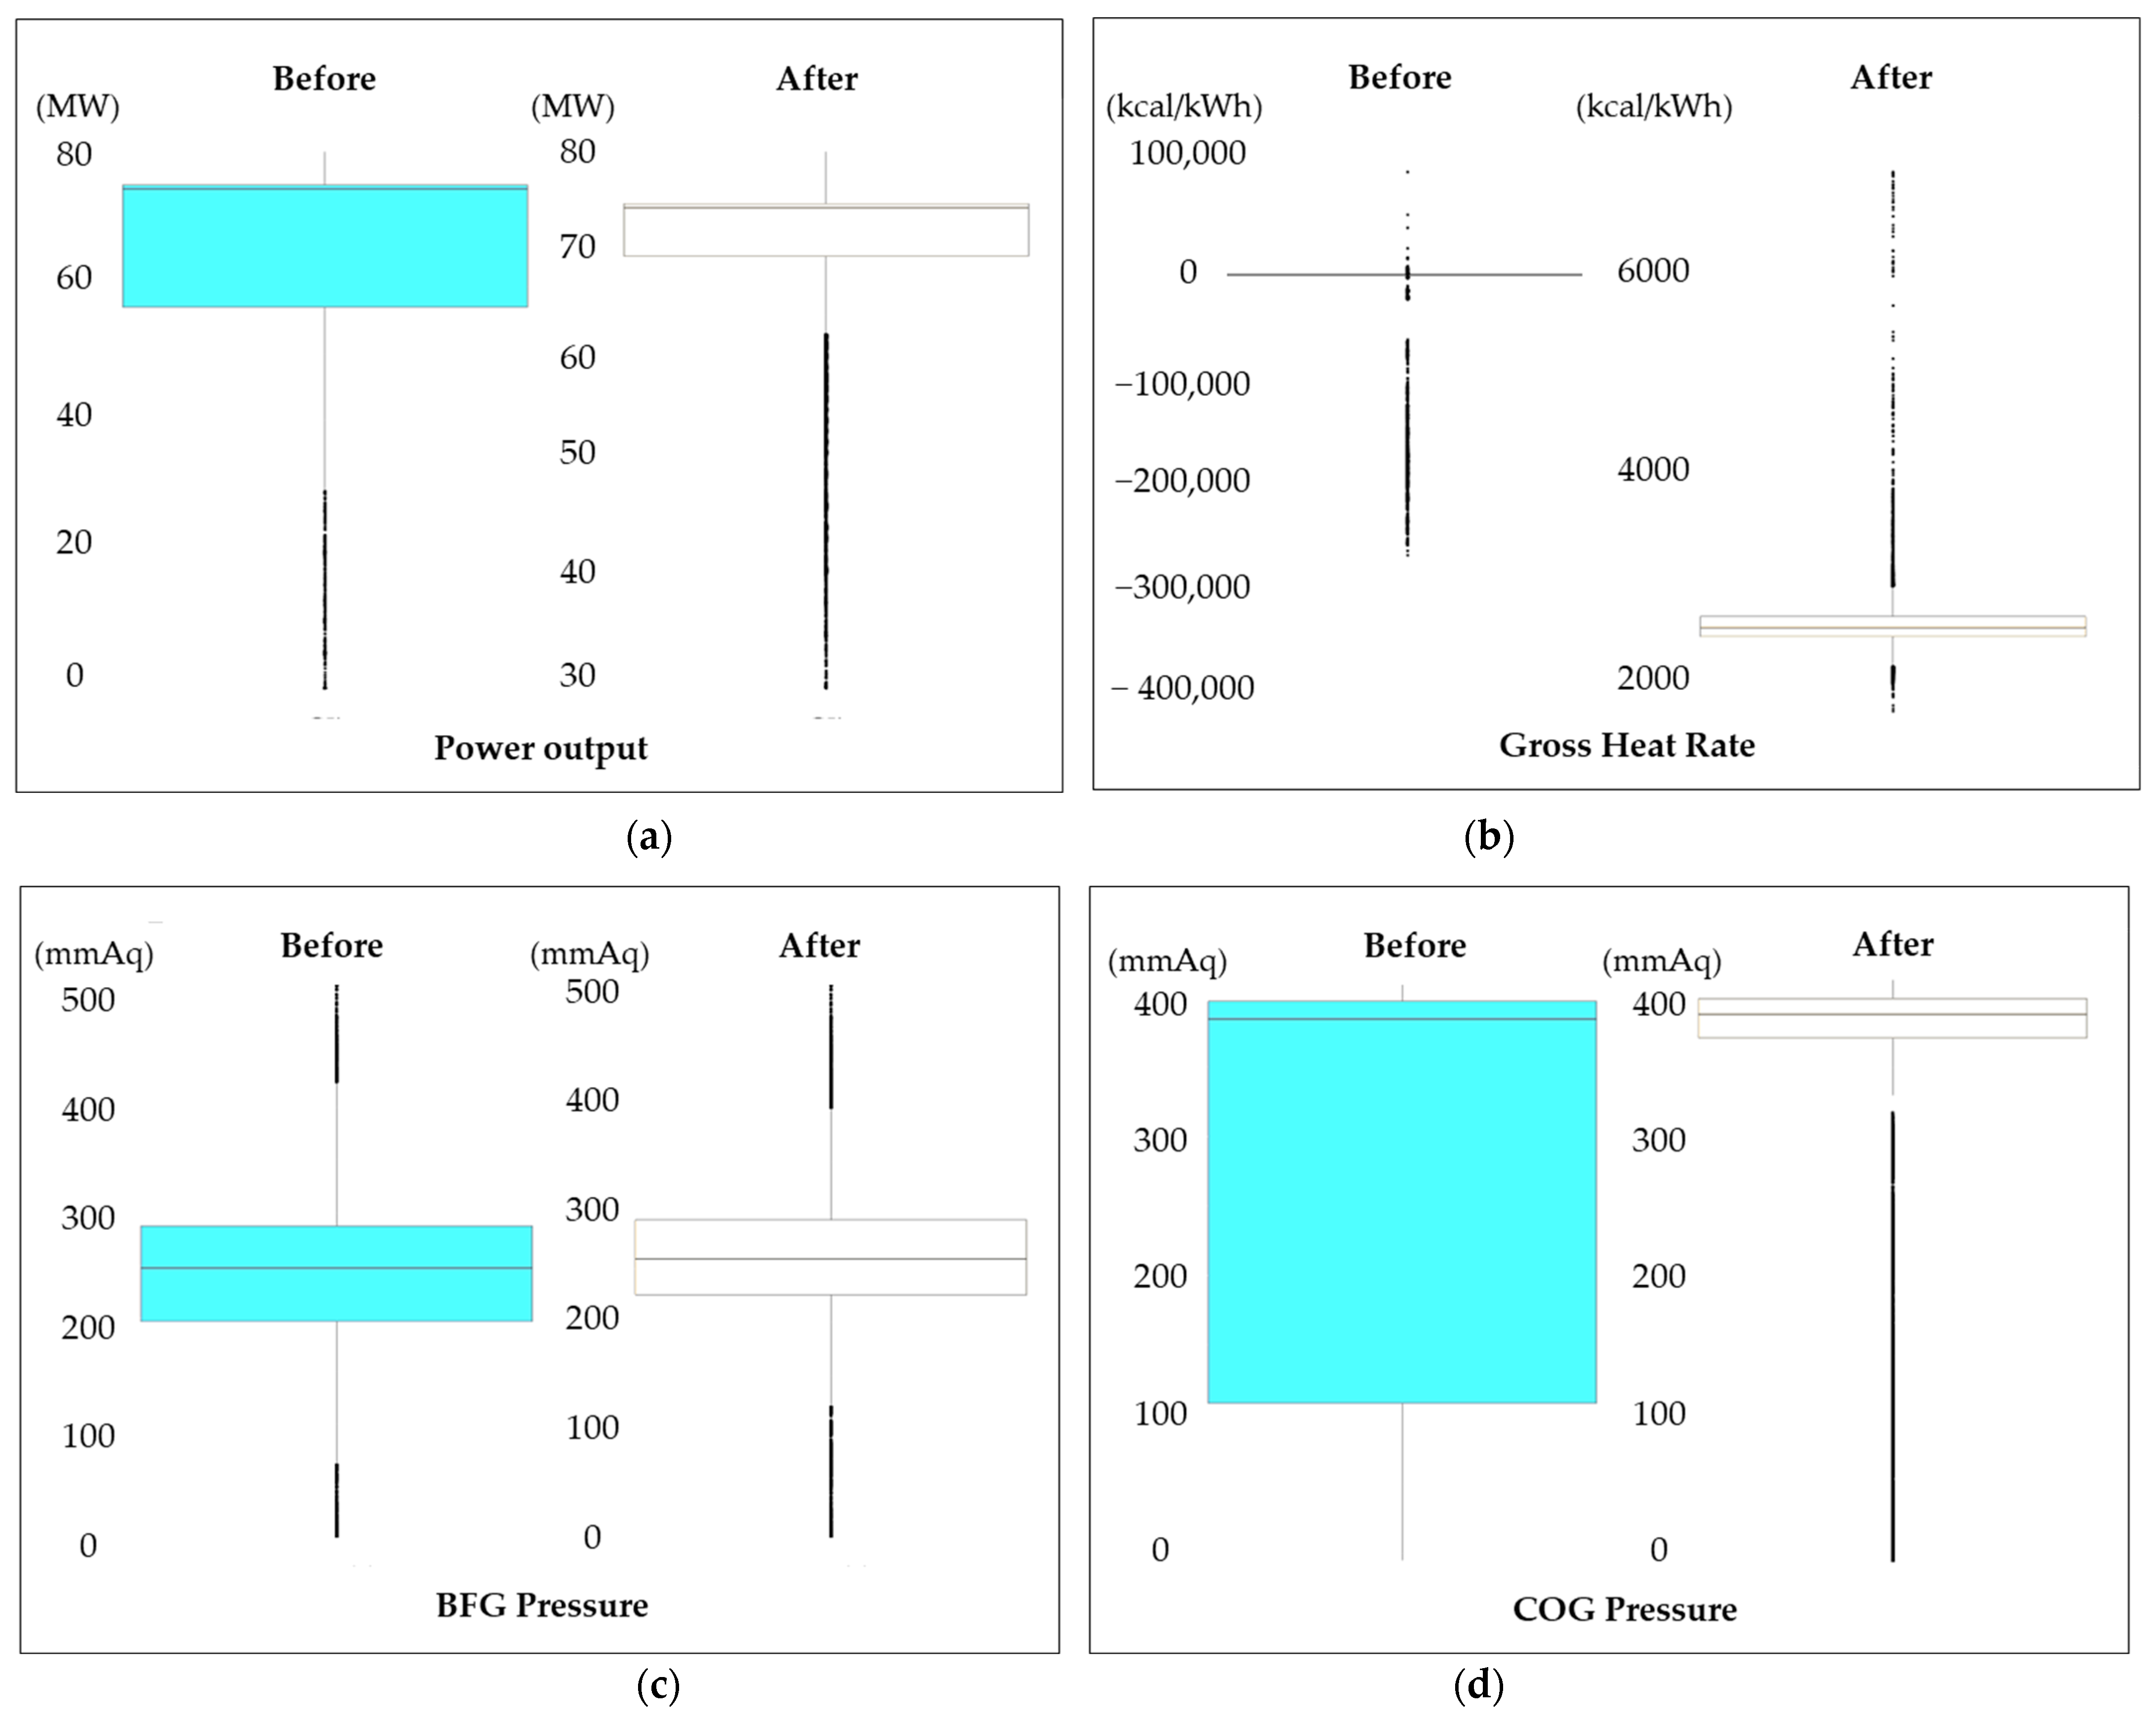
5.2. Implementation Results of the ABCCM (Test Results)

The ABCCM test results showed that the system analyzed six prediction values at 5-min intervals in real time. If all six consecutive predictions differed from the current pattern, a guide to switch to the predicted pattern was provided; if even one of the six predictions was inconsistent, the guide retained the current pattern. Additionally, if the predicted pattern differed from the current pattern but the gross heat rate deviation was within 10, the current pattern was maintained. This feedback mechanism prevented excessive pattern changes and ensured stable efficiency. Table 17 shows the six prediction values measured at 5-min intervals, the difference from the current operational pattern, and the model’s prediction results.
The results of the current and predicted patterns from Table 17, represented by the burner positions for each by-product gas, are shown in Figure 16. For the LDG, the second predicted pattern out of six 5-min interval predictions shifted to 30, suggesting that the current pattern should be maintained. For the BFG, because the model predicted the 440 patterns consistently for all six predictions, guidance to switch to the predicted pattern was provided. Moreover, as the gross heat rate difference exceeded 10, the system determined that switching to the predicted pattern aligned with the model’s operating principles.
The ABCCM results, as shown in Figure 16c, demonstrate the optimized gross heat rate-based combustion pattern compared to the manually determined combustion pattern, as shown in Figure 16a. These results indicate a considerable improvement in the combustion efficiency and consistency. A detailed comparison and the implications of these results are discussed further in Section 5.3.
This study proposed a method to optimize the combustion in steam power plant boilers using by-product gases from the steelmaking process by transitioning from operator-dependent manual control to AI-based combustion control pattern models applied in real time to maximize the combustion efficiency. The implications of the results are discussed below.

5.3. Discussion

Figure 16a,b compare the combustion patterns determined by the operator’s judgment and those proposed by the optimal combustion pattern prediction model, respectively. The model proposed combustion patterns differing from the operator’s selections for both the BFG and LDG. For the BFG, the model consistently predicted the same pattern for six consecutive prediction cycles, whereas for the LDG, one out of the six predictions differed from the predicted result.
Based on the model execution script, the BFG combustion followed the predicted pattern, whereas the LDG maintained the current pattern. In cases where the gross heat rate difference was ten or more compared to the operator’s selected pattern, the combustion pattern was changed. Conversely, when the difference was below 10, the system guided the maintenance of the current pattern to prevent frequent pattern changes. This execution script served as a key explanation of the ABCCM’s operating principles and features, proving it to be an optimization system that could balance combustion efficiency and stability.
The ABCCM developed in this study successfully derived optimal combustion patterns by reflecting the variability of by-product gases in real time. Compared to the manual control system, the ABCCM demonstrated superior performance in terms of combustion and power generation efficiency, economic benefits, environmental contributions, and operational aspects. The generation efficiency increased by approximately 0.86% from 35.23% to 36.09%. This could be attributed to the reduced heat loss caused by the appropriate distribution of the high COG combustion temperature through the mixture of the COG and BFG. The gross heat rate decreased by an average of 58.3 kcal/kWh, resulting in annual energy cost savings of approximately USD 89.6 K. Additionally, combustion optimization contributed to reduced carbon emissions and enhanced environmental sustainability.
Real-time data-based optimization and automated control dramatically improved the operational convenience and stability by minimizing operator intervention and addressed the inconsistency problems associated with traditional manual control systems. These changes suggest potential to expand this approach to various thermal power generation systems.
Table 18 presents a comparative analysis of the energy savings and efficiency improvements achieved by the manual control system and ABCCM for different scenarios. The ABCCM has the potential to make a considerable contribution to achieving carbon neutrality in the steel industry by optimizing fuel efficiency, managing carbon emissions, and maximizing the use of by-product gases. By leveraging real-time data, it reduces fuel waste, ensures complete combustion, and efficiently utilizes by-product gases, thereby lowering dependency on fossil fuels. Moreover, the automated combustion control enables consistent operation and effective emission management. The model is also suitable for integration with carbon capture, utilization, and storage systems and the use of low-carbon fuels, such as biogas and hydrogen, thereby enhancing sustainability.
Additionally, real-time data monitoring allows for the quantitative assessment of carbon emissions, suggesting that the ABCCM could contribute to the steel industry as well as to various energy-intensive industries in realizing carbon neutrality. The ABCCM has enormous potential for application in energy-intensive industries requiring efficient energy management and data analysis of highly variable fuels such as by-product gases. In the petrochemical industry, it can be used to optimize the fuel efficiency and reduce the energy consumption by managing the composition and calorific fluctuations of gas mixtures (such as flare gas and refinery gas). In the power generation industry, including thermal power plants and combined-cycle power plants, it can be applied to optimize the combustion efficiency in power plants using various fuels such as coal, biomass, and LNG.
In particular, it can contribute to managing abnormal fuel characteristics in WtE power plants. Moreover, in the cement industry, it can improve the energy efficiency by optimizing the combustion in processes that use waste heat or highly variable fuels. In the glass and metal smelting industries, where high-temperature manufacturing processes require considerable fuel consumption, the ABCCM can be used to achieve optimal combustion and improve production efficiency. In the waste management industry, the ABCCM can enable efficient combustion control in situations where the characteristics of gases used as fuel during incineration are inconsistent. To achieve this, data collection and model training for the specific characteristics of each industry’s fuels, integration of IoT and cloud-based data processing systems, and simulations for process optimization are required. Through these technological adaptations, the ABCCM can be expected to provide economic and environmental benefits such as reduced energy consumption, reduced carbon emissions, and improved operational safety, contributing to increased efficiency and sustainability in the various industries.
Finally, compared to the prior study by Lee et al. [34], this study incorporated advances and extensions in several aspects. First, there was a considerable difference in the accuracy and reliability of the model. Whereas the previous study focused primarily on predicting the O2 in combustion flue gas, this study adopted a comprehensive approach by considering all variables required for optimizing the combustion efficiency. Notably, the RF algorithm effectively handled the correlations among multiple variables and enhanced the prediction model reliability. The proposed model provided higher predictive accuracy and reliability compared to the PLSR algorithm used in the previous study. Additionally, there was a clear distinction in practical applicability.
Whereas previous studies were limited to theoretical modeling, simulations, and field tests, this study applied the model to actual power plant boilers in steel plants, extending to the development of guidance screens, thereby achieving tangible efficiency improvements.

5.4. System Development

This section describes the system architecture of the ABCCM proposed in this study. The ABCCM was developed on a server-based platform called PosFrame. The integrated architecture proposed in this study was designed to develop, train, and execute the ABCCM within the energy MES of PosFrame. Operational data for the model was collected from external sources such as the object linking and embedding (OLE) for process control (OPC) and distributed control system (DCS) protocols. Based on this data, model development and training were performed in the analysis workbench, involving processes such as data preprocessing, classification analysis, and regression analysis. During the execution phase, the results generated through classification and regression predictions in the execution analysis workbench were transmitted to the MES. These results were used for various operational functions, including boiler combustion monitoring, combustion guidance, and optimization simulations.
By leveraging real-time data processing and automated combustion control, the ABCCM supports optimized operations in real-time environments. Figure 17 illustrates the system architecture of the ABCCM development process, encompassing data collection using the PosFrame to model deployment.
The development and training of the ABCCM model were conducted within a workbench environment provided by Company P’s PosFrame [61]. This workbench is a proprietary platform developed by Company P to integrate IoT, big data, and AI technologies for real-time data acquisition, analysis, and control. Programming was executed using a block-coding interface based on the R language. Owing to security restrictions on accessing plant facility information, the available programs and data were limited. Consequently, the tools available for constructing real-time guidance systems were restricted. For this reason, a block-coding approach was adopted for model development. The data analysis infrastructure supported Oracle and PostgreSQL databases and operated on a 64-bit x86_64-redhat-linux-gnu operating system. Development was facilitated by an integrated development environment (IDE) with a drag-and-drop interface, which also allowed for direct R script writing. The hardware included a System x3650 M5 server (Lenovo, Shenzhen, China), providing the computational resources necessary for model development and training. The specifications of the PosFrame environment and hardware used for the ABCCM development in this study are summarized in Table 19.
The ABCCM exhibited a latency of approximately 8–10 s, representing the time required for the model to process the input data and produce outputs [84]. In a throughput test, the model successfully processed a massive dataset encompassing 172,800 rows and 54 columns, accumulated over a four-month span. This outcome highlights the model’s ability to effectively manage real-time operations and analyze extensive datasets concurrently.
During the testing process, the differences between the actual burner operation and AI-based guidance were minimal, suggesting potential for the system to achieve fully automated control in the long term. However, in real-world operations, concerns (such as operator unease during the initial implementation stage) were raised, which need to be addressed in future work.

6. Economic Benefits Analysis

The financial benefits resulting from the gross heat rate improvements through combustion pattern optimization were evaluated by reviewing the IRR and NPV [85]. For the analysis, the effects prior to model implementation were calculated using the average power generation efficiency data from November 2020 to October 2021, with the quantitative effects after model implementation being based on data from November 2021 to October 2022.
Table 20 presents a comparison of changes in the gross heat rate and power plant efficiency before and after the implementation of the ABCCM. The findings demonstrate considerable improvements in these two key performance indicators with the application of the ABCCM. First, the gross heat rate, which represents the amount of heat required to generate 1 kWh of electricity, serves as an indirect measure of the fuel consumption efficiency. Before the implementation of the ABCCM, the manual operation yielded a gross heat rate of 2441.0 kcal/kWh. However, after applying the model, this value decreased to 2382.7 kcal/kWh, indicating a reduction of 58.3 kcal/kWh. This reduction represents improved combustion efficiency and reduced energy waste. Moreover, when converted into power generation efficiency using Equation (2), the efficiency improved from 35.23% to 36.09%, reflecting a 0.86% increase. The improvement in the gross heat rate before and after the ABCCM implementation is detailed in Table 20.
After discussions with the operations department, a contribution rate of 5% was applied. This was not implemented as control logic but was considered as guidance, acknowledging that the final operator’s manual operation methods remained unchanged.
The total investment for system development amounted to USD 147.4 K. The investment evaluation of this study calculated an IRR of 60.8%, with a depreciation period of 15 years and a corporate tax rate of 27.5%. The NPV was calculated to be USD 542 K, with a discount rate of 9.8% applied. The high IRR evident in this case can be primarily attributed to the characteristics of by-product gases and the initial investment cost structure. By-product gases, a by-product of the steelmaking process, exhibit near-zero fuel costs, allowing for the substitution of costly external power purchases with increased power generation efficiency. This direct correlation between combustion efficiency improvements and cost reductions is a key driver of the high IRR. Moreover, from an initial investment perspective, this project did not require substantial capital expenditure on equipment; costs were limited to the development of control software and the construction of optimization models. This low-cost approach to achieving considerable efficiency gains enabled a high return on investment.
The financial benefits were calculated by converting the gross heat rate improvement into power generation efficiency using Equation (2). These improvements in the power generation efficiency enabled additional power production, which could be interpreted as offsetting the purchased power. The gross heat rate improved from 2441 to 2383 kcal/kWh, and the average power generation efficiency in 2022 increased to 36.09% compared to 35.23% in 2021, reflecting a 0.86 percentage point improvement. This efficiency increase could be attributed to the combustion efficiency optimization and AI-based combustion pattern guidance. To calculate the cost savings in power generation, a formula considering the cumulative 2021 power generation of 562,418,000 kWh and the efficiency improvement rate was used. The unit cost of electricity was set at 0.13 USD/kWh, with a contribution coefficient of 0.05 applied. Consequently, an annual power cost saving of approximately USD 89.6 K was achieved. This exceeded Company P’s internal hurdle rate of 9.8%, indicating sufficient economic benefits. Table 21 summarizes these cost savings and the calculated IRR.
The KRW presented in Table 21 refers to the Korean Won (₩), the official currency of South Korea, and was used as the base unit for calculating the energy costs, investment costs, and economic benefits, as mentioned in this study. Here, the cost reduction effects and economic profitability were analyzed using the KRW before being converted to USD for international comparison.
The formulas for the power cost savings, which were incorporated as revenue in the economic analysis, are detailed in Table 22. Currently, Company P has successfully applied the algorithm to four of its 15 steam power generation facilities, and if it is extended to the remaining 11 facilities, annual energy cost savings of approximately USD 986 K could be expected. Moreover, by-product gas-based generation has a relatively lower emission factor compared to coal-fired power, offering environmental benefits through reduced carbon emissions.

7. Conclusions

7.1. Summary and Contributions

This study developed an AI-based combustion control pattern model and derived the optimal algorithm for optimizing the combustion of steam power plant boilers using steel by-product gases.
The ABCCM proposed in this study evaluated the potential for optimizing combustion efficiency in steam boilers using by-product gases. The findings can be summarized as follows:
  • Energy efficiency improvement: The ABCCM improved combustion efficiency by 0.86% compared to manual control methods, resulting in a 1.7% increase in power generation efficiency. Additionally, the gross heat rate decreased by 58.3 kcal/kWh, leading to reduced fuel consumption and improved energy efficiency.
  • Economic impact: The improvement in combustion efficiency achieved annual energy cost savings of approximately USD 89.6 K, providing considerable evidence of operational cost reductions and enhanced profitability in the steel industry.
  • Carbon emission reduction: The optimization of by-product gas combustion had enormous environmental benefits, primarily in the form of reduced carbon emissions. By preventing incomplete combustion and excessive oxygen supply, the system offers practical data supporting carbon neutrality goals.
  • Effectiveness of ML-based optimization: By combining the RF and CART algorithms, the ABCCM simultaneously improved the model prediction accuracy and combustion efficiency, demonstrating the feasibility of automated, real-time combustion control based on data-driven insights.
  • Versatility in industrial applications: Beyond the steel industry, the ABCCM has potential applications in other energy-intensive sectors, such as the power plant, cement production, and petrochemical sectors, setting itself apart from prior research that was limited to specific industries or conditions.
The study results confirmed the practical applicability of the combustion control pattern model developed for the steam power plant boilers at Company P. By optimizing the combustion patterns in real time, the model not only reduced the energy consumption and improved the combustion efficiency but also ensured the consistent maintenance of combustion states and reduced operator performance variations. Moreover, the proposed model could accurately identify trends in the combustion states based on the fuel mixing ratios and oxygen concentrations, rather than focusing solely on the absolute efficiency values.
This study demonstrated the potential of AI and ML in the steel industry to optimize combustion, reduce time, lower costs, and provide environmental benefits. First, by using the RF and CART algorithms, we could achieve real-time analysis of the combustion characteristics of steelmaking by-product gases and optimize combustion efficiency by adjusting the oxygen concentration and fuel mixture ratios. Moreover, we validated the performance of the model by comparing it with existing manual control methods.
Second, in terms of time reduction, AI dramatically reduced the time required to solve problems and adjust systems by processing sensor data in real time and immediately generating optimized control commands. Moreover, the automation of repetitive processes increased operational efficiency and reduced operating time. Consequently, AI-based systems can evaluate combustion conditions in real time and calculate the optimal fuel inputs and air ratios, enabling rapid and accurate decision-making.
Third, in terms of cost reduction, we achieved annual energy cost savings of approximately USD 89.6 K by reducing the gross heat rate by 58.3 kcal/kWh. Additionally, we demonstrated the ability to reduce dependence on high-cost fuels by optimizing the mixture of the by-product gas and LNG. AI-based control minimizes operator intervention, reducing operating and maintenance costs, and extends equipment life by reducing equipment overload through optimized combustion patterns. Using LNG and other energy sources improves self-generation efficiency and provides financial benefits. A 1% increase in generation efficiency through LNG utilization results in an additional 162,988 MWh of electricity generation annually, leading to a cost reduction of 28.8 billion won. Additionally, self-generation based on LNG can replace the purchase of electricity from Korea Electric Power Corporation, resulting in annual cost savings of approximately KRW 67.18 billion.
Fourth, the combined use of the by-product gas and LNG provides environmental benefits such as improved air quality. Environmentally, the mixed use of LNG and by-product gases can reduce carbon emission factors and ensure stable power generation, contributing to achieving the goals of low-carbon policies and energy cost savings.

7.2. Limitations and Future Work

Although the combustion control model developed in this study was designed to respond to the variability of steel by-product gases in real time, its scalability and applicability to systems using other types of fuel were not fully examined. Further evaluation of the model’s applicability to other fuel types and its performance under variable fuel conditions across diverse industrial processes is necessary.
Although the RF algorithm demonstrated excellent predictive performance, it does have limitations in fully capturing high-dimensional data or nonlinear characteristics [86]. Future studies should explore advanced AI techniques, such as DL or reinforcement learning, to enhance the model performance in more complex combustion environments [87]. In particular, adaptive models capable of effectively responding to long-term changes in combustion patterns and abnormal conditions are needed.
Although the model was applied to a specific boiler system at Company P, system-wide and environmental variables at other facilities or power plants were not sufficiently considered. Changes in the number of burners require re-establishing the logic, and broader validation studies using diverse real-time data across various operational environments are needed to verify the model performance. The data used in the study were collected over a limited period, potentially lacking sufficient reflection of seasonal factors or sudden external shocks. Consequently, it is necessary to evaluate the model’s durability using long-term data and improve the optimization algorithm’s performance based on environmental changes. The current guidance-based system can be ineffective if operators do not actively monitor the screen. Problems such as overly complex and cluttered screens have been identified, and the system needs to evolve beyond guidance to include control functionalities. In practice, operators often do not actively use the system, highlighting the need for improvements. After applying the ABCCM model, improvements in the gross heat rate and power plant efficiency compared to manual operations were evident. Consequently, the expected benefits of full automation can be expected to be significant.
To overcome these limitations, further technological advances are required.
  • Enhancing system performance for industrial efficiency: Future research should focus on optimizing system performance across its entire lifecycle through the integration of digital twin and ML technologies [57]. A critical aspect of this research involved improving predictive capabilities by accounting for the fluctuating nature of fuel characteristics under diverse fuel types and operating conditions. Moreover, the applicability and scalability of the ABCCM should be assessed using long-term data, while the model’s robustness and reliability must be validated.
  • Adopting advanced AI techniques and automation: To enhance the adaptability and predictive performance of the ABCCM model, it is necessary to introduce advanced AI technologies. Advanced AI techniques, such as DL and reinforcement learning, can provide effective solutions for complex combustion environments. Moreover, to reduce the operator burden and enhance combustion optimization, it is necessary to build a fully automated control system capable of operating without operator intervention, going beyond guidance functionality. To this end, it is necessary to advance toward automation and real-time monitoring of combustion control by using advanced technologies such as AI, IoT, and big data.
  • Addressing environmentally friendly steelmaking processes and carbon neutrality: It is necessary to develop models that reflect the combustion environment and fuel characteristics of environmentally friendly steelmaking processes such as hydrogen-based direct reduction. Optimization studies are also needed to improve the energy efficiency and reduce the operating costs in electric arc furnace-based steelmaking processes. Moreover, as the reduction of by-product gas generation in processes such as blast furnaces and converters is expected owing to the reduction in these processes, research is needed to address this problem and prepare for the phased closure of existing thermal power plants. In particular, the possibility of converting to hydrogen co-firing technology for steam turbines should be explored to minimize carbon emissions and maximize energy efficiency.
  • Extensive field research: To strengthen the applicability of the ABCCM, extensive field research is required in various steel production processes and power generation facilities. Accordingly, the economic and environmental effects should be quantitatively verified and developed into sustainable technology solutions. Field research will play a key role in proving the universality of the model and confirming its applicability in various industrial environments.
This study contributed to the optimization of combustion using steelmaking by-product gases, although the effectiveness and sustainability of the model need to be strengthened through further research on other fuels and environmental conditions, the introduction of advanced AI technologies, the addressing of environmentally friendly steelmaking processes, and extensive field research. Accordingly, it should be possible to provide a universal solution that can simultaneously achieve ambitious carbon neutrality goals and energy savings.

Author Contributions

Conceptualization, K.-J.L., S.-W.C. and E.-B.L.; methodology, K.-J.L. and S.-W.C.; validation, K.-J.L. and S.-W.C.; formal analysis, K.-J.L. and S.-W.C.; investigation, K.-J.L. and S.-W.C.; resources, K.-J.L. and E.-B.L.; data curation, K.-J.L. and S.-W.C.; writing—original draft preparation, K.-J.L.; writing—review and editing, K.-J.L. and S.-W.C.; visualization, K.-J.L. and S.-W.C.; supervision, E.-B.L.; project administration, E.-B.L.; funding acquisition, E.-B.L. All authors have read and agreed to the published version of the manuscript.

Funding

This research was sponsored by the Korea Ministry of Trade Industry and Energy (MOTIE) and the Korea Evaluation Institute of Industrial Technology (KEIT) through the Technology Innovation Program funding for “Development of optimization technology for pipe-cable auto-routing design linked to carbon reduction model” project (Grant No. RS-2022-00143619).

Data Availability Statement

The original contributions presented in the study are included in the article, further inquiries can be directed to the corresponding author.

Acknowledgments

The authors would like to give special thanks to Chae-Young Kim (the Master course student at Pohang University of Science and Technology) for their technical support of this study. The views expressed in this paper are solely those of the authors and do not represent those of any official organization or research sponsor.

Conflicts of Interest

Author Kyu-Jeong Lee was employed by the company Pohang Iron and Steel Company (POSCO). The remaining authors declare that the research was conducted in the absence of any commercial or financial relationships that could be construed as a potential conflict of interest.

Abbreviations

The following abbreviations and parameters are used in this paper:
ABCCMAdvanced Boiler Combustion Control Model
BFGBlast furnace gas
BOPBalance of plant
CARTClassification and regression tree
CMConfiguration Manager
COGCoke oven gas
CPComplexity parameter
H/RHeat rate
KDDKnowledge Discovery in Database
LDGLinz–Donawiz converter gas
LNGLiquefied natural gas
LRLogistic regression
MAEMean absolute error
MESManufacturing execution system
MLMachine learning
PLSRPartial least squares regression
UCCUtility control center

References

  1. The International Energy Agency (IEA). Emissions Measurement and Data Collection for a Net Zero Steel Industry. Available online: https://www.iea.org/reports/emissions-measurement-and-data-collection-for-a-net-zero-steel-industry (accessed on 24 September 2024).
  2. The International Energy Agency (IEA). Net Zero Road Map A Global Pathway to Keep the 1.5 °C Goal in Reach. Available online: https://www.iea.org/reports/net-zero-roadmap-a-global-pathway-to-keep-the-15-0c-goal-in-reach (accessed on 12 September 2024).
  3. Lee, J.-Y.T.; Tak, E.M.; Kim, J.H. The Impact of the EU’s Carbon Border Adjustment Mechanism on the Korean Steel Trade, with Implications for Policy; KIET: Sejong, Republic of Korea, 2024. [Google Scholar] [CrossRef]
  4. Solutions for Our Climate. The South Korean Steel Industry and Carbon Neutrality. Available online: https://forourclimate.org/research/426 (accessed on 21 October 2024).
  5. Kang, B.-U. Scenario Analysis of Iron and Steel Production Process for Carbon Neutrality; KEEI: Seoul, Republic of Korea, 2022; Available online: https://www.keei.re.kr/board.es?mid=a20102000000&bid=0028 (accessed on 27 September 2024).
  6. Kumar, B.; Roy, G.G.; Sen, P.K. Comparative exergy analysis between rotary hearth furnace-electric arc furnace and blast furnace-basic oxygen furnace steelmaking routes. Energy Clim. Chang. 2020, 1, 100016. [Google Scholar] [CrossRef]
  7. Teo, P.T.; Zakaria, S.K.; Salleh, S.Z.; Taib, M.A.A.; Mohd Sharif, N.; Abu Seman, A.; Mohamed, J.J.; Yusoff, M.; Yusoff, A.H.; Mohamad, M. Assessment of electric arc furnace (EAF) steel slag waste’s recycling options into value added green products: A review. Metals 2020, 10, 1347. [Google Scholar] [CrossRef]
  8. Nduagu, E.I.; Yadav, D.; Bhardwaj, N.; Elango, S.; Biswas, T.; Banerjee, R.; Rajagopalan, S. Comparative life cycle assessment of natural gas and coal-based directly reduced iron (DRI) production: A case study for India. J. Clean. Prod. 2022, 347, 131196. [Google Scholar] [CrossRef]
  9. DePree, P.J.; Ferry, C.T. Mitigation of expansive electric arc furnace slag in brownfield redevelopment. In Proceedings of the GeoCongress 2008: Geosustainability and Geohazard Mitigation, New Orleans, LA, USA, 9 March 2008; pp. 271–278. [Google Scholar] [CrossRef]
  10. Uribe-Soto, W.; Portha, J.-F.; Commenge, J.-M.; Falk, L. A review of thermochemical processes and technologies to use steelworks off-gases. Renew. Sustain. Energy Rev. 2017, 74, 809–823. [Google Scholar] [CrossRef]
  11. Hou, S.S.; Chen, C.H.; Chang, C.Y.; Wu, C.W.; Ou, J.J.; Lin, T.H. Firing blast furnace gas without support fuel in steel mill boilers. Energy Convers. Manag. 2011, 52, 2758–2767. [Google Scholar] [CrossRef]
  12. World Steel Association. Energy Use in the Steel Industry. Available online: https://worldsteel.org/wp-content/uploads/Fact-sheet-energy-in-the-steel-industry-2021-1.pdf (accessed on 26 October 2024).
  13. Branca, T.A.; Colla, V.; Algermissen, D.; Granbom, H.; Martini, U.; Morillon, A.; Pietruck, R.; Rosendahl, S. Reuse and recycling of by-products in the steel sector: Recent achievements paving the way to circular economy and industrial symbiosis in Europe. Metals 2020, 10, 345. [Google Scholar] [CrossRef]
  14. Kamran, M. Fundamentals of Smart Grid Systems; Elsevier: Amsterdam, The Netherlands, 2022. [Google Scholar] [CrossRef]
  15. POSCO. Great Conversion to Low-Carbon Eco-Friendly Steelmaking Process. Available online: http://product.posco.com/homepage/product/eng/jsp/news/s91w4000120v.jsp?SEQ=526 (accessed on 17 November 2024).
  16. Elwardany, M. Enhancing steam boiler efficiency through comprehensive energy and exergy analysis: A review. Process Saf. Environ. Prot. 2024, 184, 1222–1250. [Google Scholar] [CrossRef]
  17. Zhu, C.; Huang, P.; Li, Y. Closed-loop combustion optimization based on dynamic and adaptive models with application to a coal-fired boiler. Energies 2022, 15, 5289. [Google Scholar] [CrossRef]
  18. Jin, Y.; Sun, Y.; Zhang, Y.; Jiang, Z. Research on air distribution control strategy of supercritical boiler. Energies 2022, 16, 458. [Google Scholar] [CrossRef]
  19. Li, S.; Wang, Y. Performance assessment of a boiler combustion process control system based on a data-driven approach. Processes 2018, 6, 200. [Google Scholar] [CrossRef]
  20. Lee, T.; Han, E.; Moon, U.-C.; Lee, K.Y. Supplementary control of air–fuel ratio using dynamic matrix control for thermal power plant emission. Energies 2020, 13, 226. [Google Scholar] [CrossRef]
  21. Wang, Z.; Xue, W.; Li, K.; Tang, Z.; Liu, Y.; Zhang, F.; Cao, S.; Peng, X.; Wu, E.Q.; Zhou, H. Dynamic combustion optimization of a pulverized coal boiler considering the wall temperature constraints: A deep reinforcement learning-based framework. Appl. Therm. Eng. 2025, 259, 124923. [Google Scholar] [CrossRef]
  22. Wu, F.; Zhou, H.; Zhao, J.-P.; Cen, K.-F. A comparative study of the multi-objective optimization algorithms for coal-fired boilers. Expert Syst. Appl. 2011, 38, 7179–7185. [Google Scholar] [CrossRef]
  23. Zhao, H.; Shen, J.; Li, Y.; Bentsman, J. Coal-fired utility boiler modelling for advanced economical low-NOx combustion controller design. Control. Eng. Pract. 2017, 58, 127–141. [Google Scholar] [CrossRef]
  24. Rahat, A.A.M.; Wang, C.; Everson, R.M.; Fieldsend, J.E. Data-driven multi-objective optimisation of coal-fired boiler combustion systems. Appl. Energy 2018, 229, 446–458. [Google Scholar] [CrossRef]
  25. Sinha, A.; Das, D.; Palavalasa, S.K. dClink: A data-driven based clinkering prediction framework with automatic feature selection capability in 500 MW coal-fired boilers. Energy 2023, 276, 127448. [Google Scholar] [CrossRef]
  26. Wu, Y.; Wang, Z.; Shi, C.; Jin, X.; Xu, Z. A novel data-driven approach for coal-fired boiler under deep peak shaving to predict and optimize NOx emission and heat exchange performance. Energy 2024, 304, 132106. [Google Scholar] [CrossRef]
  27. Xu, W.; Poh, K.; Song, S.; Huang, Y. Research on reducing pollutant, improving efficiency and enhancing running safety for 1000 MW coal-fired boiler based on data-driven evolutionary optimization and online retrieval method. Appl. Energy 2025, 377, 123958. [Google Scholar] [CrossRef]
  28. de Oliveira Junior, V.B.; Pena, J.G.C.; Salles, J.L.F. An improved plant-wide multiperiod optimization model of a byproduct gas supply system in the iron and steel-making process. Appl. Energy 2016, 164, 462–474. [Google Scholar] [CrossRef]
  29. Zhao, J.; Sheng, C.; Wang, W.; Pedrycz, W.; Liu, Q. Data-based predictive optimization for byproduct gas system in steel industry. IEEE Trans. Autom. Sci. Eng. 2017, 14, 1761–1770. [Google Scholar] [CrossRef]
  30. Zeng, Y.; Xiao, X.; Li, J.; Sun, L.; Floudas, C.A.; Li, H. A novel multi-period mixed-integer linear optimization model for optimal distribution of byproduct gases, steam and power in an iron and steel plant. Energy 2018, 143, 881–899. [Google Scholar] [CrossRef]
  31. Kim, Y.-K.; Lee, E.-B. Optimization simulation, using steel plant off-gas for power generation: A life-cycle cost analysis approach. Energies 2018, 11, 2884. [Google Scholar] [CrossRef]
  32. EN 12952-15; Water-Tube Boilers and Auxiliary Installations—Part 15: Acceptance Tests. European Committee for Standardization: Brussels, Belgium, 2003.
  33. Szega, M.; Czyż, T. Problems of calculation the energy efficiency of a dual-fuel steam boiler fired with industrial waste gases. Energy 2019, 178, 134–144. [Google Scholar] [CrossRef]
  34. Lee, S.-M.; Choi, S.-W.; Lee, E.-B. Prediction modeling of flue gas control for combustion efficiency optimization for steel mill power plant boilers based on partial least squares regression (PLSR). Energies 2023, 16, 6907. [Google Scholar] [CrossRef]
  35. Majeed, A.; Ali, P.; Mir, A.; Alshammari, B.M.; Kolsi, L. Three-stage Lobatto analysis on hydrodynamic Eyring-powell flow of nanofluid: Impact of viscous dissipation, thermal radiation, and wall slip dynamics. J. Radiat. Res. Appl. Sci. 2024, 17, 101207. [Google Scholar] [CrossRef]
  36. Feng, Y.; Hao, H.; Chow, C.L.; Lau, D. Exploring reaction mechanisms and kinetics of cellulose combustion via ReaxFF molecular dynamics simulations. Chem. Eng. J. 2024, 488, 151023. [Google Scholar] [CrossRef]
  37. Iliev, I.K.; Filimonova, A.A.; Chichirov, A.A.; Chichirova, N.D.; Kangalov, P.G. Computational and Experimental Research on the Influence of Supplied Gas Fuel Mixture on High-Temperature Fuel Cell Performance Characteristics. Energies 2024, 17, 2452. [Google Scholar] [CrossRef]
  38. Neves, F.; Soares, A.A.; Rouboa, A. A Comparison of Different Biomass Combustion Mechanisms in the Transient State. Energies 2024, 17, 2092. [Google Scholar] [CrossRef]
  39. Mondal, M.N.A.; Karimi, N.; Jackson, S.D.; Paul, M.C. Enhancing the performance of catalysts in turbulent premixed fuel-lean hydrogen/air combustion. Chem. Eng. Sci. 2025, 301, 120747. [Google Scholar] [CrossRef]
  40. Liu, X.; Bansal, R.C. Integrating multi-objective optimization with computational fluid dynamics to optimize boiler combustion process of a coal fired power plant. Appl. Energy 2014, 130, 658–669. [Google Scholar] [CrossRef]
  41. Tang, Z.; Zhang, H.; Yang, H. Artificial neural networks model for predicting oxygen content in flue gas of power plant. In Proceedings of the 2017 29th Chinese Control and Decision Conference (CCDC), Chongqing, China, 28–30 May 2017; IEEE: New York, NY, USA, 2017; pp. 1379–1382. [Google Scholar] [CrossRef]
  42. Safdarnejad, S.M.; Tuttle, J.F.; Powell, K.M. Dynamic modeling and optimization of a coal-fired utility boiler to forecast and minimize NOx and CO emissions simultaneously. Comput. Chem. Eng. 2019, 124, 62–79. [Google Scholar] [CrossRef]
  43. Shi, Y.; Zhong, W.; Chen, X.; Yu, A.B.; Li, J. Combustion optimization of ultra supercritical boiler based on artificial intelligence. Energy 2019, 170, 804–817. [Google Scholar] [CrossRef]
  44. Fedorov, R.; Kovalnogov, V.; Generalov, D.; Sapunov, V.; Busygin, S. Predicting the optimal operation of burners based on random forest. In International Conference Artificial Intelligence in Engineering and Science; Springer: Berlin/Heidelberg, Germany, 2022; pp. 383–394. [Google Scholar] [CrossRef]
  45. Kovalnogov, V.; Fedorov, R.; Klyachkin, V.; Generalov, D.; Kuvayskova, Y.; Busygin, S. Applying the random forest method to improve burner efficiency. Mathematics 2022, 10, 2143. [Google Scholar] [CrossRef]
  46. Butakov, E.; Abdurakipov, S. The application of machine learning techniques to detect combustion modes in a pulverised coal boiler. E3S Web Conf. 2023, 459, 07012. [Google Scholar] [CrossRef]
  47. Nemitallah, M.A.; Nabhan, M.A.; Alowaifeer, M.; Haeruman, A.; Alzahrani, F.; Habib, M.A.; Elshafei, M.; Abouheaf, M.I.; Aliyu, M.; Alfarraj, M. Artificial intelligence for control and optimization of boilers’ performance and emissions: A review. J. Clean. Prod. 2023, 417, 138109. [Google Scholar] [CrossRef]
  48. Ronquillo-Lomeli, G.; García-Moreno, A.-I. A machine learning-based approach for flames classification in industrial heavy oil-fire boilers. Expert Syst. Appl. 2024, 238, 122188. [Google Scholar] [CrossRef]
  49. Priya, A.; Devarajan, B.; Alagumalai, A.; Song, H. Artificial intelligence enabled carbon capture: A review. Sci. Total Environ. 2023, 886, 163913. [Google Scholar] [CrossRef] [PubMed]
  50. Shin, D.; Lee, J.; Son, J.; Yun, Y.; Song, Y.; Song, J. Intelligent Combustion Control in Waste-to-Energy Facilities: Enhancing Efficiency and Reducing Emissions Using AI and IoT. Energies 2024, 17, 4634. [Google Scholar] [CrossRef]
  51. Chen, M.; Zou, Z.; Zhou, K.; Liu, D. A novel AI-based combustion diagnostic technology for the identification of chemical source information via flame images: Fuel type and reaction condition. Combust. Flame 2024, 260, 113208. [Google Scholar] [CrossRef]
  52. Olawade, D.B.; Wada, O.Z.; David-Olawade, A.C.; Fapohunda, O.; Ige, A.O.; Ling, J. Artificial intelligence potential for net zero sustainability: Current evidence and prospects. Next Sustain. 2024, 4, 100041. [Google Scholar] [CrossRef]
  53. Bounaceur, R.; Glaude, P.-A.; Fournet, R.; Sirjean, B.; Montagne, P.; Auvray, A.; Impellizzeri, E.; Biehler, P.; Molière, M. Advancing AI modeling for prediction of safety parameters for combustion of hydrogen/syngas/natural gas mixtures. In Turbo Expo: Power for Land, Sea, and Air; American Society of Mechanical Engineers: New York, NY, USA, 2024; p. V002T003A036. [Google Scholar] [CrossRef]
  54. Teimoori, Z.; Yassine, A. User-centric Charging Service Recommendation for Electric Vehicles. In Proceedings of the 2024 IEEE 22nd Mediterranean Electrotechnical Conference (MELECON), Porto, Portugal, 25–27 June 2024; pp. 739–743. [Google Scholar] [CrossRef]
  55. Bhattacharya, A.; Majumdar, P. Artificial intelligence-machine learning algorithms for the simulation of combustion thermal analysis. Heat Transf. Eng. 2024, 45, 176–193. [Google Scholar] [CrossRef]
  56. Wang, X.; Chan, C.W.; Li, T. High accuracy prediction of the post-combustion carbon capture process parameters using the Decision Forest approach. Chem. Eng. Sci. 2024, 290, 119878. [Google Scholar] [CrossRef]
  57. Marinković, D.; Dezső, G.; Milojević, S. Application of machine learning during maintenance and exploitation of electric vehicles. Adv. Eng. Lett. 2024, 3, 132–140. [Google Scholar] [CrossRef]
  58. Zhang, L.; Xie, W.; Ren, Z. Combustion stability analysis for non-standard low-calorific gases: Blast furnace gas and coke oven gas. Fuel 2020, 278, 118216. [Google Scholar] [CrossRef]
  59. Deng, L.; Adams, T.A., II. Techno-economic analysis of coke oven gas and blast furnace gas to methanol process with carbon dioxide capture and utilization. Energy Convers. Manag. 2020, 204, 112315. [Google Scholar] [CrossRef]
  60. Rosado, D.J.M.; Chávez, S.B.R.; Gutierrez, J.A.; de Araújo, F.H.M.; de Carvalho, J.A., Jr.; Mendiburu, A.Z. Energetic analysis of reheating furnaces in the combustion of coke oven gas, Linz-Donawitz gas and blast furnace gas in the steel industry. Appl. Therm. Eng. 2020, 169, 114905. [Google Scholar] [CrossRef]
  61. POSCO. PosFrame. Available online: http://psmartfatory.posco.co.kr (accessed on 28 November 2024).
  62. Chakraborty, S.; Islam, S.H.; Samanta, D. Introduction to data mining and knowledge discovery. In Data Classification and Incremental Clustering in Data Mining and Machine Learning; Springer International Publishing: Cham, Switzerland, 2022; pp. 1–22. [Google Scholar] [CrossRef]
  63. Lee, H.; Yun, S. Strategies for imputing missing values and removing outliers in the dataset for machine learning-based construction cost prediction. Buildings 2024, 14, 933. [Google Scholar] [CrossRef]
  64. Gaddam, A.; Wilkin, T.; Angelova, M.; Gaddam, J. Detecting sensor faults, anomalies and outliers in the Internet of Things: A survey on the challenges and solutions. Electronics 2020, 9, 511. [Google Scholar] [CrossRef]
  65. Dastjerdy, B.; Saeidi, A.; Heidarzadeh, S. Review of applicable outlier detection methods to treat geomechanical data. Geotechnics 2023, 3, 375–396. [Google Scholar] [CrossRef]
  66. Ossai, C.I. A data-driven machine learning approach for corrosion risk assessment—A comparative study. Big Data Cogn. Comput. 2019, 3, 28. [Google Scholar] [CrossRef]
  67. Li, H. Clustering. In Machine Learning Methods; Springer Nature: Singapore, 2024; pp. 293–309. [Google Scholar] [CrossRef]
  68. Kim, H.-Y.; Kim, B.-C.; Byun, S.-H. A study on efficiency improvement by fine tuning of power plant control. Trans. Korean Inst. Electr. Eng. 2012, 61, 1496–1501. [Google Scholar] [CrossRef]
  69. Climate Technology Centre and Network (CTCN). Reducing CO2 Emissions by Improving the Efficiency of the Existing Coal-Fired Power Plant Fleet. Available online: https://www.ctc-n.org/resources/reducing-carbon-dioxide-co2-emissions-improving-efficiency-existing-coal-fired-power-plant/ (accessed on 16 December 2024).
  70. Mrzljak, V. Low power steam turbine energy efficiency and losses during the developed power variation. Teh. Glas. 2018, 12, 174–180. [Google Scholar] [CrossRef]
  71. Büchs, J.; Zoels, B. Evaluation of maximum to specific power consumption ratio in shaking bioreactors. J. Chem. Eng. Jpn. 2001, 34, 647–653. [Google Scholar] [CrossRef]
  72. Wilson, D. The design of a low specific fuel consumption turbocompound engine. SAE Trans. 1986, 95, 445–459. Available online: https://www.jstor.org/stable/44721670 (accessed on 29 October 2024).
  73. Li, M. Reducing specific energy consumption of seawater desalination: Staged RO or RO-PRO? Desalination 2017, 422, 124–133. [Google Scholar] [CrossRef]
  74. Chen, L.; Xu, Y.; Tian, S.; Lu, H. Numerical simulation study of combustion under different excess air factors in a flow pulverized coal burner. Processes 2024, 12, 1607. [Google Scholar] [CrossRef]
  75. Ou, H.; Yao, Y.; He, Y. Missing data imputation method combining random forest and generative adversarial imputation network. Sensors 2024, 24, 1112. [Google Scholar] [CrossRef] [PubMed]
  76. Bansal, M.; Goyal, A.; Choudhary, A. A comparative analysis of K-nearest neighbor, genetic, support vector machine, decision tree, and long short term memory algorithms in machine learning. Decis. Anal. J. 2022, 3, 100071. [Google Scholar] [CrossRef]
  77. Asselman, A.; Khaldi, M.; Aammou, S. Enhancing the prediction of student performance based on the machine learning XGBoost algorithm. Interact. Learn. Environ. 2023, 31, 3360–3379. [Google Scholar] [CrossRef]
  78. Li, S.; Jin, N.; Dogani, A.; Yang, Y.; Zhang, M.; Gu, X. Enhancing LightGBM for Industrial Fault Warning: An Innovative Hybrid Algorithm. Processes 2024, 12, 221. [Google Scholar] [CrossRef]
  79. DeVore, R.; Hanin, B.; Petrova, G. Neural network approximation. Acta Numer. 2021, 30, 327–444. [Google Scholar] [CrossRef]
  80. Kamwa, I.; Samantaray, S.R.; Joos, G. Catastrophe predictors from ensemble decision-tree learning of wide-area severity indices. IEEE Trans. Smart Grid 2010, 1, 144–158. [Google Scholar] [CrossRef]
  81. Choi, S.-W.; Lee, E.-B. Contractor’s risk analysis of engineering procurement and construction (EPC) contracts using ontological semantic model and Bi-long short-term memory (LSTM) technology. Sustainability 2022, 14, 6938. [Google Scholar] [CrossRef]
  82. Priyam, A.; Abhijeeta, G.R.; Rathee, A.; Srivastava, S. Comparative analysis of decision tree classification algorithms. Int. J. Curr. Eng. Technol. 2013, 3, 334–337. [Google Scholar]
  83. Tatachar, A.V. Comparative assessment of regression models based on model evaluation metrics. Int. J. Innov. Technol. Explor. Eng. 2021, 8, 853–860. [Google Scholar]
  84. Wang, L. Low-latency, high-throughput load balancing algorithms. J. Comput. Technol. Appl. Math. 2024, 1, 1–9. [Google Scholar] [CrossRef]
  85. Weber, T.A. On the (non-)equivalence of IRR and NPV. J. Math. Econ. 2014, 52, 25–39. [Google Scholar] [CrossRef]
  86. Ratnasingam, S.; Muñoz-Lopez, J. Distance correlation-based feature selection in random forest. Entropy 2023, 25, 1250. [Google Scholar] [CrossRef] [PubMed]
  87. Ma, Z.; Cui, S.; Joe, I. An enhanced proximal policy optimization-based reinforcement learning method with random forest for hyperparameter optimization. Appl. Sci. 2022, 12, 7006. [Google Scholar] [CrossRef]
Figure 1. Steam power generation process at Company P.
Energies 18 00820 g001
Figure 2. Overall structure of Boiler #8 for steam power generation at Company P. (a) Three-dimensional view of the entire boiler exterior; (b) configuration of the nine burners; (c) nozzle positions for each by-product gas—BFG (B), COG (C(s)), LDG (L)—in the nine burners.
Energies 18 00820 g002
Figure 3. Structure of a steam power burner using by-product gases. (a) Side view of a single burner; (b) front view showing the internal nozzle configuration of the burner.
Energies 18 00820 g003
Figure 4. Average oxygen concentration measured at the downstream boilers.
Energies 18 00820 g004
Figure 5. Research process.
Energies 18 00820 g005
Figure 6. Data preprocessing and data selection processes.
Energies 18 00820 g006
Figure 7. Box plot of key variables before and after outlier removal, showing the median values and data distribution. (a) Output; (b) gross heat rate; (c) BFG pressure; (d) COG pressure.
Energies 18 00820 g007
Figure 8. Scree plot to determine the number of principal components.
Energies 18 00820 g008
Figure 9. Results of the scree plot and cluster plot.
Energies 18 00820 g009
Figure 10. Structure of the advanced boiler combustion control model (ABCCM).
Energies 18 00820 g010
Figure 11. Example of boiler burner operation for Boiler #8 at Company P. Cells highlighted in orange indicate that the corresponding fuel (e.g., BFG, LDG, COG) is in an active (OPEN) state for each burner.
Energies 18 00820 g011
Figure 12. Flowchart of the RF algorithm used in developing the optimal combustion pattern prediction model.
Energies 18 00820 g012
Figure 13. Flowchart of the CART algorithm used in this study.
Energies 18 00820 g013
Figure 14. Burner identification by by-product gas types. (a) Representation of nine burner positions using the power-of-two value; (b) example of burner positions for combusting by-product gases, the blue highlights indicate activated burners in the BFG and COG patterns.
Energies 18 00820 g014
Figure 15. ABCCM implementation process. The red color indicates burners that are currently in combustion, while the yellow/blue mix indicates that the burner valves are in the locked position.
Energies 18 00820 g015
Figure 16. Burner operation positions before/after application of the ABCCM, the colors distinguish each pattern, or indicate the status of specific burner locations. (a) Combustion pattern under manual operation by the operator; (b) combustion pattern proposed by the optimal combustion pattern prediction model; (c) final combustion pattern considering gross heat rate after application of the ABCCM.
Energies 18 00820 g016
Figure 17. An integrated environment for machine-learning-based ABCCM model development using high-frequency data from PosFrame. 1 MES: Manufacturing Execution System. 2 OPC: OLE for Process Control. 3 DCS: Distributed Control System.
Energies 18 00820 g017
Table 1. Steel production methods based on fuel, energy consumption, and production capacity.
Production MethodPrimary Energy SourceEnergy
Consumption (GJ/ton) 1
Features
BF-BOFBFG, COG, LDG19–22Suitable for large-scale production, high CO2 emissions.
EAFElectricity, natural gas2–6High energy efficiency, uses recycled steel
DRINatural gas, hydrogen10–14Low-carbon technology, enables high-quality steel production
OHF
(Traditional Method)
CoalVery HighLow efficiency, rarely used in modern times
1 GJ/Ton: Gigajoule per metric ton, a unit used to represent energy consumption in steel production. This unit measures the amount of energy required to produce one metric ton of steel through a specific process.
Table 2. Composition and calorific values of by-product gases in the steel industry.
By-Product GasComponent (%)Calorific Value
(kcal/Nm3)
Production Volume
(Nm3/tHM)
CO2COCH4H2N2Etc.
BFG20.720.0-3.254.1-750–10001400–1600
COG3.18.426.656.42.32.04000–5000300–350
LDG17.864.2-2.015.9-200080–100
Table 3. Recycling and treatment methods of by-product gases generated during the steel manufacturing process.
By-Product GasProduction ProcessKey CharacteristicsRecycling MethodsTreatment MethodsKey Challenges
BFGBlast furnace—melting iron ore and cokeLow calorific value, high nitrogen, and carbon dioxide contentPower generation, hot blast preheating, industrial heat sourceDust removal, gas scrubbingLow calorific value, high impurity content
COGCoke oven—producing coke from coalHigh calorific value, contains tar and sulfurPower generation, chemical feedstock (ammonia, methanol)Desulfurization, tar removalHigh tar content, mandatory desulfurization
LDGBasic oxygen furnace (BOF)—converting molten iron to steelMedium calorific value, high CO contentPower generation, heat recoveryDust and CO removalVariable gas composition, CO management
Table 4. Specifications of Boiler #8 for steam power generation at Company P.
CategoryDetailUnit
ManufacturerBHI-
Year of initial installation/modernization1981/2020Year
Power generation capacity75MW
Boiler capacity240Ton/Hour
Low-pressure steam capacity70Ton/Hour
Design efficiency35%
Fuel usedBFG, COG, LDG, LNG-
Burner typeCombination combustion-
No. of burners9ea
Table 5. Summary of limitations in prior research.
CategoryMain ContentLimitation
Studies on performance and efficiency improvement of power boilersVarious data-driven and optimization techniques were applied to improve the performance and combustion efficiency of power boilersLimited ability to handle data variability and uncertainties arising in real-time operational environments
Studies on self-generation in steel plants using by-product gasesResearch aimed at managing the variability of by-product gases and maximizing the efficiency of self-generation boilers in steel plantsHigh variability in the composition and supply of by-product gases makes stable model application in actual operational environments difficult
Studies on boiler combustion optimization using machine learning and AIResearch using AI techniques to improve boiler combustion efficiency and achieve emission reductionsDependence on large-scale data for model training and validation, low interpretability of AI models, and limited reliability and applicability in industrial settings
Table 6. Four months of collected data across three categories and 54 variables.
CategoryClassFeaturesNumber of Data
Fuel (16)BFG (6)Pressure, calorific value 1, calorific value 2, calorific value 3, calorific value 4, flow rate1,036,824
COG (3)Pressure, calorific value, flow rate518,412
LDG (3)Pressure, calorific value, flow rate518,412
LNG (3)Pressure, calorific value, flow rate518,412
Others (1)Seawater flow rate172,804
Combustion (31)BFG (9)A1, A2, A3, B1, B2, B3, C1, C2, C31,555,236
COG (3)B1, B2, B3518,412
COG(S) (9)A1, A2, A3, B1, B2, B3, C1, C2, C31,555,236
LDG (6)A1, A2, A3, C1, C2, C31,036,824
Others (4)O2 Concentration 1, O2 Conc. 2, O2 Conc. 3, NOx Conc.691,216
Power
Generation (7)
Power (5)Reactive power consumption, active power consumption, power consumption a, power consumption b, output power864,020
Output (2)output current, output voltage, output345,608
Total9,331,416
Table 7. Examples of variable name and type modifications.
Raw DataChange of Variable NameData Type
FCS01056GWQ-001.PVPowerCategorical → Numeric
FCS0105.8BPI-011.PVCOG pressure
FCS0105.8BPI-012.PVLDG pressure
Table 8. Examples of derived variable generation and calculation formulas for data preprocessing.
Derived VariablesCalculation
LNG flow rateFlow rate A + Flow rate B
BFG calorific valueHolder 1 + Holder 4 + 3BF + 4BF/4
Fuel heat rate (A)Flow rate × Heat quantity/Power/1000
Power consumption heat rate (B) (Power consumption A + Power consumption B) × 2230)/Power
Cooling water heat rate (C)Seawater flow rate × 140 × 2.5 × 60/Power/1000
Gross heat rateA + B + C
Table 9. Sensor models and calibration intervals used in this study.
CategoryManagement
Criteria (Unit)
Manufacturer
(Model)
Calibration Interval (h)
BFG flow transmitterSEQ (mA)ADDITEL (ADT-761)1095
COG flow transmitterSEQ (mA)ADDITEL (ADT-761)1095
LDG flow transmitterSEQ (mA)ADDITEL (ADT-761)1095
Table 10. Summary of the PCA results.
CategoryStandard
Deviation
Proportion of
Variance
Cumulative
Proportion
Selection
PC11.64919.42%19.42%
PC21.60018.30%37.72%
PC31.20010.29%48.01%
PC41.0247.49%55.50%
PC51.0077.24%62.74%
PC60.9816.88%69.61%
PC140.2450.43%100%
Table 11. Advantages and disadvantages of the LR, CART, and RF algorithms.
AlgorithmAdvantagesDisadvantages
Logistic Regression
(LR)
Easy to interpret and computationally efficient; provides probabilistic predictionsLimited to linear relationships; sensitive to multicollinearity
CARTInterpretable and handles nonlinear relationships;
identifies important variables
Prone to overfitting;
unstable with small datasets
Random Forest
(RF)
High accuracy and reduces overfitting; evaluates variable importanceComplex and less interpretable;
high computational cost
Table 12. Performance evaluation of combustion pattern prediction models using the RF algorithm.
CategoryAccuracy of Pattern (%)
BFGCOGLDGBFG, COGBFG, LDG
Training dataset99.941510099.970799.982999.9362
Test dataset99.647199.804699.765399.78599.7448
Table 13. Detailed decisions for training.
CategoryNeural Network
Data input67 variables
Dependent variableGross heat rate
Training dataset70%
HyperparameterRepeated cross-validation (Fold 3, Repeat 3)
Complexity parameter0.00000001, 0.0000001, 0.000001, 0.00001, 0.0001, 0.001, 0.01
Table 14. Performance evaluation of gross heat rate prediction models for different CP values.
CPRMSER2MAEModel Select
1.00 × 10−837.016280.9529725.53985
1.00 × 10−737.016270.9529725.53983*✓
0.00000137.042040.9529025.57579
0.0000138.791540.9482827.35463
0.000146.760340.9247634.09299
0.00162.640280.8649446.15539
0.0185.638100.7475562.26553
CPRMSESDR2SDMAESDModel Select
1.00 × 10−80.469040.001210.14661
1.00 × 10−70.469050.001210.14664*✓
0.0000010.474970.001230.15426
0.000010.394970.001120.10449
0.00010.486150.001740.30794
0.0010.814710.003430.45590
0.011.209410.007140.77237
*✓: selected model for the gross heat rate prediction.
Table 15. Performance evaluation of the gross heat rate prediction model using the CART algorithm.
CategoryNo. of DataRMSER2MAE
Training dataset88,75422.4236898.26915.25892
Testing dataset38,03633.4522096.18023.61632
Table 16. Conversion method of burner combinations using powers of two (example for BFG).
Derived VariableCalculations
BFG patternBFG Combustion A1 × 256 + BFG Combustion A2 × 128 BFG Combustion A3 × 64 + BFG Combustion B1 × 32 + BFG Combustion B2 × 16 + BFG Combustion B3 × 8 + BFG Combustion C1 × 4 + BFG Combustion C2 × 2 + BFG Combustion C3 × 1
Table 17. Example of the current and predicted patterns of the optimal combustion pattern model.
TimePresent PatternPrediction Pattern
LDGCOGBFGGross H/RLDGCOGBFGGross H/R
130044123683104402343
230044124043004402400
330044123783104402376
430044124273104402422
530044124133104402394
630044123823104402370
Result---23953004402384
Table 18. Comparative study on energy efficiency and savings between manual control and the ABCCM.
CategoryManual ControlABCCM ImplementationImprovement
Combustion efficiencyLack of consistency, reliant on operator experienceProvides automated optimal combustion patternsImproved combustion efficiency by 0.86%
Power generation efficiencyAverage 35.23%Average 36.09%Increased by approximately 0.86 percentage points
Gross heat rateApproximately 4100 kcal/kWhApproximately 4041.7 kcal/kWhDecreased by an average of 58.3 kcal/kWh
Energy cost savingsLimited efficiency improvementAnnual savings of approximately USD 89.6 KReduced energy costs
Carbon emission reductionLimited by incomplete combustion and variabilityReduced emissions through efficient combustion, reduced carbon emissions owing to reduced fuel consumptionReduced fuel consumption leading to reduced carbon emissions
Real-time responseDifficulty in reflecting real-time data through manual adjustmentsReal-time data-based optimization possibleIncreased operational efficiency and stability
Operational convenienceRequires high operator skillMinimized operator intervention through automationImproved operational consistency and convenience
Table 19. Development environment of the ABCCM.
CategorySpecification
PlatformPosFrame, Workbench 2024
Programming languageBlock coding based on R language
Programming language versionR version 3.3.3 (6 March 2017) to R version 3.4.0
Operating systemx86_64-redhat-linux-gnu (64-bit)
IDE (1)Drag-and-drop interface with support for custom R scripting
HardwareSystem ×3650 M5
DatabaseOracle 12C_R1, PostgreSQL 9.3, PosFrame supported
1 IDE: Integrated Development Environment.
Table 20. Comparison in gross heat rate and power generation efficiency before and after application of the ABCCM.
CategoryBefore
(Manual Operation)
After
(ABCCM)
Difference
Heat gross rate (kcal/kWh)2441.02382.758.3
Efficiency of power plant (%)35.2336.090.86
Table 21. Cost and IRR calculation of the system benefit.
CategoryValue
IRR (%)60.8
NPV (USD 1)542 K
Heat gross rate improvement (kcal/kWh)58.3
Difference in efficiency (%)0.86
Additional power generation (kWh)1570
Power unit price (USD/kW)0.13
Power cost saving (USD/Year)89.6 K
Investment cost (USD)147.4 K
Corporate tax (%)27.5
Discount rate (%)9.8
Research contribution rate (%)5
1 The exchange rate (USD/KRW): KRW 1357 as of 2024 average (source: Exchange Rates UK).
Table 22. Cost and IRR calculation for power cost-saving benefit.
CategoryCalculation
Power cost savingAdditional power generation (1570 × 8760) × Power unit price (0.13) × Research contribution rate (0.05) = USD 89.6 K/year
Disclaimer/Publisher’s Note: The statements, opinions and data contained in all publications are solely those of the individual author(s) and contributor(s) and not of MDPI and/or the editor(s). MDPI and/or the editor(s) disclaim responsibility for any injury to people or property resulting from any ideas, methods, instructions or products referred to in the content.

