Article

Laboratory-Scale Natural Gas Hydrate Extraction Numerical Simulation Under Phase Transition Effect

1
State Key Laboratory of Offshore Natural Gas Hydrate, China National Offshore Oil Corporation, Beijing 100028, China
2
Research Institute of China National Offshore Oil Cooperation, China National Offshore Oil Corporation, Beijing 100028, China
3
School of Petroleum Engineering, China University of Petroleum (East China), Qingdao 266580, China
*
Authors to whom correspondence should be addressed.
Energies 2025, 18(3), 755; https://doi.org/10.3390/en18030755
Submission received: 28 December 2024 / Revised: 15 January 2025 / Accepted: 24 January 2025 / Published: 6 February 2025
(This article belongs to the Special Issue Subsurface Energy and Environmental Protection 2024)

Abstract

:
Phase transition in gas hydrate reservoirs has a significant effect on the fluid flow dynamic when performing test production, which should be carefully studied. This study systematically investigates the phase transition characteristics of natural gas hydrates during the depressurization extraction process through laboratory-scale numerical simulations. First, a laboratory-scale numerical simulation model is established with dimensions of 1 m × 1 m × 1 m. In the simulation, the nanoscale and microscale effect on phase transition is considered. Then, the analysis of how different sediment types and their properties affecting gas production dynamics is presented. The results show that hydrate dissociation and formation are significantly influenced by factors such as the pore scale, salinity, and water content. In particular, montmorillonite had the most significant effect, leading to a 525.25% increase in gas production, while the impact of silty soil was relatively smaller. The increase in salinity inhibited hydrate formation but promoted dissociation, resulting in a significant increase in gas production, especially when the salinity reached to 3.5%, where gas production increased by 590.21%. An increase in water content led to a significant decrease in production. Through monitoring temperature and pressure changes during the extraction process, the different physical fields are analyzed, providing important theoretical support and practical guidance for the efficient extraction of natural gas hydrates.

1. Introduction

Natural gas hydrates (NGHs), recognized as a highly promising clean energy resource, are considered an ideal alternative to traditional fossil fuels due to their abundant reserves and high-energy density [1]. Comprised primarily of methane, NGHs are mainly found in deep-sea sediments and permafrost regions and are often referred to as “methane hydrates” or “combustible ice”. Under specific high-pressure and low-temperature conditions, the hydrate structures remain stable. However, when environmental conditions change, significant amounts of CO2 are released, making NGHs a key focus of future energy development that is clean [2,3]. In recent years, countries such as China, Japan, and the United States have made remarkable progress in the experimental extraction of natural gas hydrates. Notably, China achieved stable gas production in the Shenhu area of the South China Sea, marking a significant technological breakthrough in this field [4].
Extraction technologies for NGHs mainly include depressurization, thermal stimulation, chemical inhibition, and CO2 replacement [5,6]. Among these, the depressurization method is the most widely applied due to its economic efficiency and operational simplicity. This method reduces reservoir pressure, causing the hydrates to decompose into methane and water. During the trial production in the Shenhu area, the depressurization method was successfully employed, combined with a single-well and horizontal-well system to achieve continuous and stable gas production. This advancement has significantly propelled the commercialization of natural gas hydrates [7]. However, the reservoirs in the Shenhu area of the South China Sea have low permeability, mainly consisting of mud-rich silty sand, which restricts gas flow and limits the efficiency of traditional single-well depressurization. Therefore, researchers have proposed various measures to increase production, including hydraulic fracturing, thermal injection combined with depressurization, and multi-lateral wells, to enhance gas flow and improve production efficiency [8]. Studies show that multi-stage fracturing significantly improves gas flow characteristics in the reservoir and enhances production efficiency [8]. All of the above production methods need consideration for the phase transition, which always affect the flow characteristic in formation. The phase change mechanism plays an important role in the gas production efficiency during hydrate extraction. The phase change process is controlled by temperature and pressure changes, which influence the formation pore structure and permeability [9]. In the trial extraction in the Shenhu area, numerical simulations were used to strictly control temperature and pressure variations, optimizing well placement to ensure stable gas production [10,11,12,13,14]. Furthermore, the multiphase flow phenomena generated during phase change further complicate extraction, as gas, water, and residual hydrates form a multiphase flow system after hydrate decomposition [15]. To improve gas production efficiency in low-permeability reservoirs, thermal injection has also been applied in trial extractions. Thermal injection involves injecting hot water or steam to raise the reservoir temperature, accelerating hydrate decomposition. However, the thermal injection effect is limited in the low-permeability reservoirs of the Shenhu area [16]. By combining thermal injection with horizontal well technology, the depressurization range can be expanded, improving gas production efficiency [17]. The phase change may affect subsurface instability, which will affect the production results [18,19].
As phase transition is significant for flow dynamic analysis, its mechanisms have been widely studied by experimental and simulation methods [20]. In porous media, the microscopic phase change process of natural gas hydrates significantly affects their mass transfer properties and gas–water migration behavior. The phase change of hydrates involves processes such as formation, decomposition, and regeneration, which are regulated by temperature, pressure, pore characteristics, and wettability [21]. Nano- or microstructures during microscopic phase changes play a significant role in regulating hydrate stability and mass transfer rates [22]. Research analyzing the pore structure of the Shenhu area in the South China Sea has shown that hydrates are often encapsulated in fine-grained sediments, and during decomposition, nanostructures form in the pore space, facilitating gas migration and increasing gas production efficiency [23]. Therefore, applying nanopore and micropore technologies to hydrate extraction could increase the storage and flow rates of methane and enhance overall extraction efficiency. The generation and evolution of nanopores and micropores play a critical role in the mass transfer process during the dissociation of gas hydrates. These nanobubbles locally increase gas concentration and pressure, promoting methane release and the further dissociation of hydrates. Studies have shown that nanobubbles can accelerate the nucleation process by controlling changes in the crystal lattice structure during hydrate formation and dissociation, thus enhancing the phase transition rate of hydrates [24]. During the formation of hydrates, nanobubbles act as templates for nucleation and growth. Research has found that the smaller the size of the nanobubbles, the shorter the nucleation time and the higher the nucleation rate of the hydrate, providing theoretical support for improving the efficiency of hydrate formation [22,24]. The natural gas hydrate reservoirs in the Shenhu area of the South China Sea have unique microstructural and phase transition characteristics. The formations in this area are primarily composed of muddy silt, with strong methane adsorption properties and a distinctive pore structure. The complex physical environment further complicates the mass transfer process during the gas–water phase transition [25]. A study reviewing the phase transition and seepage mechanisms of hydrate extraction in the South China Sea points out that the phase transition process in this reservoir is controlled by the combined action of multiple factors, exhibiting strong methane adsorption properties and abrupt changes in absolute permeability [21]. CT imaging technology shows that hydrates are primarily distributed within the foraminifera shells in the sediments and form blockage phenomena in the pore throat spaces. This microstructure restricts the flow of gas and water, significantly reducing the overall permeability of the reservoir. Furthermore, since the hydrates do not completely occupy the pore space, small amounts of gas and water remain in the reservoir. These residual gases and water are mainly located inside and on the surface of hydrate particles [26]. This complex micro-storage structure has a significant impact on the seepage behavior during the extraction process. The role of nanobubbles in the formation and dissociation of natural gas hydrates has gained widespread attention. Studies have shown that the generation of nanobubbles can significantly alter the mass transfer path of hydrates, increasing the methane release rate during dissociation, thereby boosting production during extraction [21,22].
Numerical simulation technology provides an indispensable tool in natural gas hydrate formation flow behavior and hydrate decomposition mechanisms [27,28,29,30]. Depressurization is considered one of the most economical and efficient methods for hydrate extraction, especially with the significant results achieved in the trial extraction in the Shenhu area. However, due to the complexity of natural gas hydrate reservoirs, depressurization efficiency is influenced by factors such as permeability, pore structure, and saturation. Numerical simulation technology is widely used in the sensitivity analysis of various parameters during depressurization extraction to assess how extraction plans impact gas production efficiency. For instance, simulations have shown that the presence of cap layers can promote hydrate decomposition and increase gas production, while optimizing depressurization amplitude and speed can further improve extraction efficiency [31]. These simulation results provide crucial support for designing actual extraction plans and predicting gas-to-water production rates during depressurization. The depressurization decomposition process in porous media has also been a key focus of numerical simulations. Studies show that hydrate saturation, permeability, and back pressure during extraction directly affect efficiency. Lower back pressure helps extend the high gas production phase, but excessive back pressure reduction may lead to secondary hydrate formation, which affects the long-term stability of extraction [32]. These simulation experiments adjust various experimental parameters, providing references for parameter optimization and risk assessment in actual extraction. In addition to depressurization, thermal coupling technology in hydrate extraction has been gradually gaining attention. This method accelerates hydrate decomposition by injecting heat into the reservoir, making it particularly useful for low-permeability reservoirs. However, the efficiency of thermal coupling is affected by thermal conductivity, injection temperature, and rate. Numerical simulation studies indicate that higher injection temperatures and lower injection rates help improve accumulated gas production, but due to energy consumption, thermal injection is generally used as an auxiliary method to depressurization. This auxiliary extraction design broadens the application of numerical simulations across different extraction strategies. Simulation results show that the decomposition rate and thickness of hydrates vary significantly under different geological conditions [33,34]. The multi-field coupled simulation effectively predicts and evaluates the dissociation potential of hydrates under different extraction environments, thereby optimizing extraction methods and parameter settings for hydrate reservoirs. It is important to improve model accuracy to adapt to different geological conditions, developing more efficient multi-field coupled algorithms to integrate interactions between physical fields and optimizing extraction parameters and methods based on field trial data. It is foreseeable that numerical simulations in the phase change and extraction process of natural gas hydrates will provide more comprehensive technical support and theoretical foundations for global clean energy development.
Until now, the micro-phase transition process of natural gas hydrates in porous media is a complex mass and heat transfer process controlled by multiple factors, such as nanobubbles, pore structure, and medium properties. While the influence mechanism of micro-phase transition on gas–water migration has gradually become clearer, its specific performance under different reservoir conditions still requires further research. With the continuous advancement of experimental techniques and simulation methods, in-depth research into the micro-phase transition process of natural gas hydrates will provide a theoretical foundation and technical support for the efficient extraction of resources. In this paper, the phase transition model is first described and analyzed; then, the mathematical model is established for flow in porous media considering gas hydrate phase transition. Finally, the numerical simulation model is developed to analyze the phase equilibrium effect on gas production.

2. Model Analysis

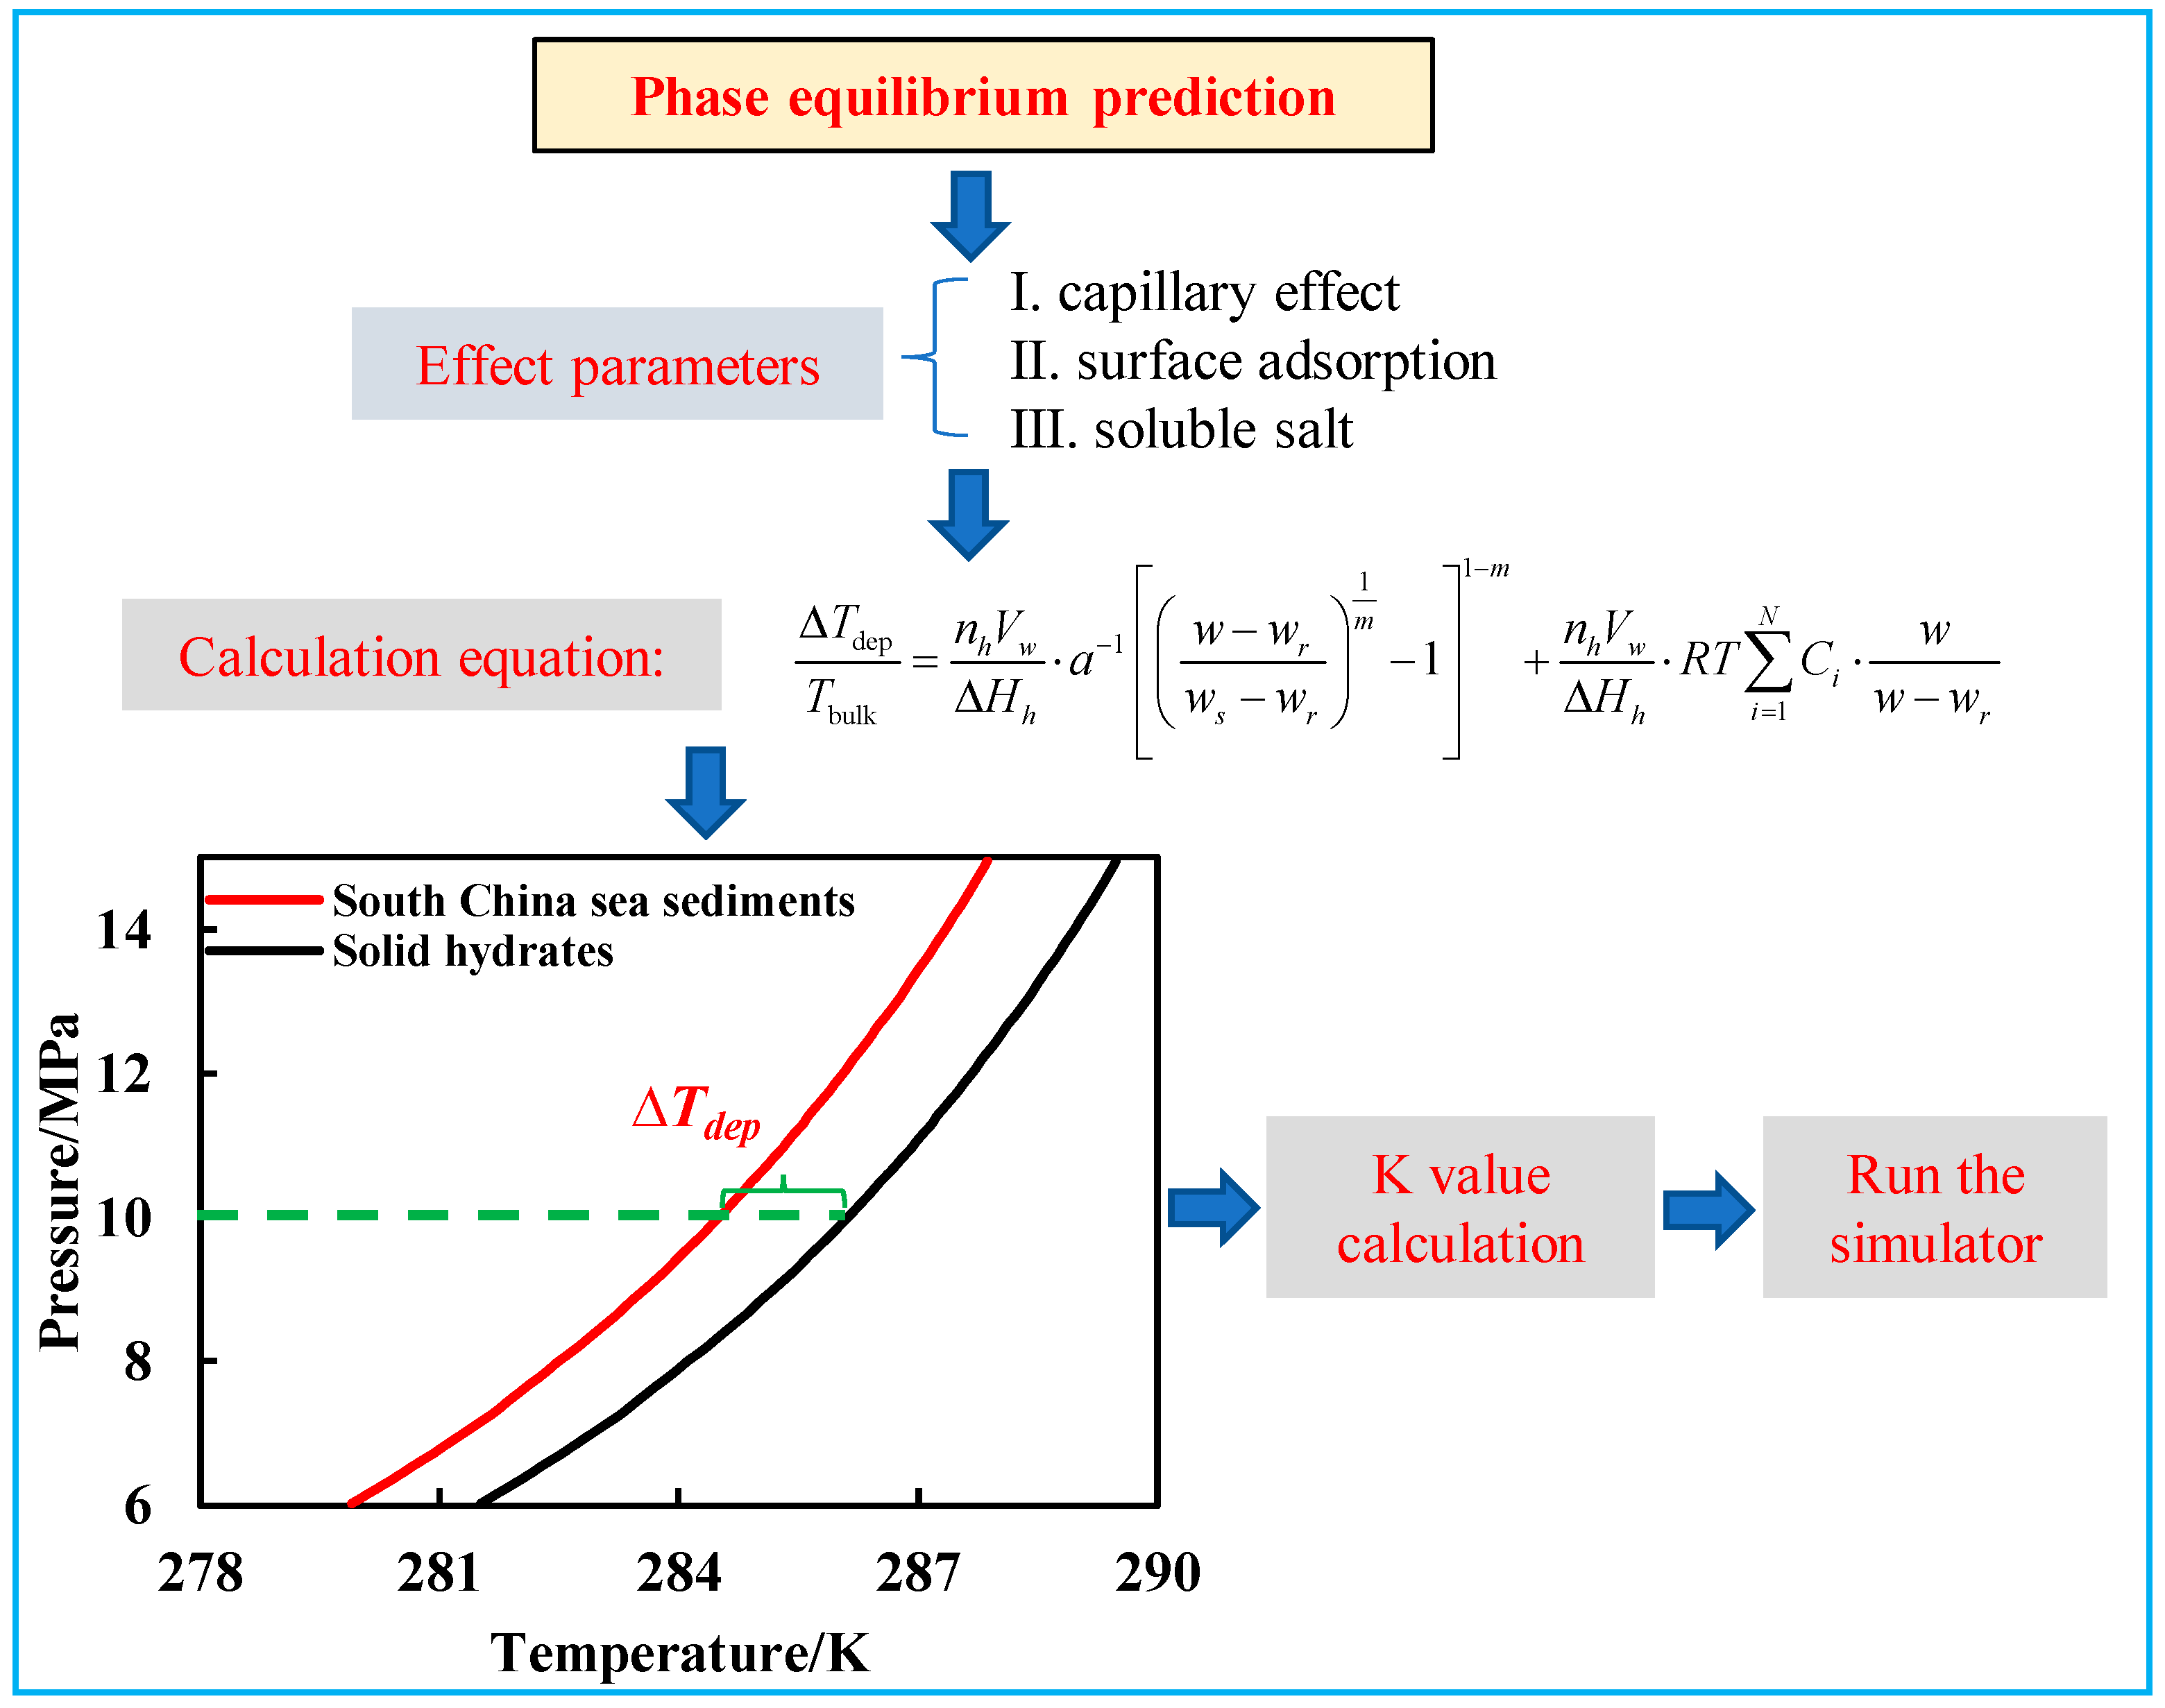
2.1. Phase Transition Model

As the formation in the Shenhu area of the South China Sea has low permeability and consists of mud-rich silty sand, the phase equilibrium prediction is limited when considering the clayey–silty sediments. Nanopores and micropores exist in the sediments. In the simulation, the nanoscale and microscale effect on phase transition should be considered. Most studies on the phase equilibria of hydrates focused on bulk water with or without salts and inhibitors and ignored the microscale effect caused by the mixture of nanopores and micropores. Thus, some key parameters should be carefully considered when calculating the phase transition pressure and temperature. The parameters include the capillary effect, surface adsorption, and soluble salt. Figure 1 shows the phase equilibrium prediction workflow considering capillary effect, surface adsorption, and soluble salt. First, the Δ T dep (the hydrate dissociation temperature depression) is calculated using the equation proposed by Liu et al. (2022) [35]. Then, the phase equilibrium curve considering clayey–silty sediment can be drawn based on the solid hydrate (which is always known) phase equilibrium curve. Then, the K value in simulaor can be calculated, and the simulator can be run.

2.2. Mathematical Model Development

2.2.1. Kinetic Model for Natural Gas Hydrate Formation

The formation and decomposition of hydrates is a reversible reaction involving methane and water. The process of hydrate decomposition and formation can be described as [30,36]:
C H 4 g + n H 2 O l C H 4 · H 2 O s ± h e a t
The Kim–Bishnoi model is generally used to describe the decomposition kinetics of hydrates:
d c h d d t = k d A d p e p g
The decomposition rate constant k d is defined as follows:
k d = k d 0 exp e R T
The definition is as follows:
A d = φ 2 A H S S w S h
λ d = k d 0 A H S ρ w ρ h
The decomposition kinetics of hydrates can be expressed as follows:
d c h d d t = λ d φ ρ w S w φ ρ h S h p e exp E R T 1 1 K p , T
The formation rate of hydrates is as follows:
d c h f d t = k f A f p g p e
k f is defined as follows:
k f = k f 0 exp E R T
The definition is as follows:
A f = φ 2 A H S S w S h
λ f 0 = k f 0 A H S ρ w
The kinetics model for hydrate formation can be expressed as follows:
d c h d d t = λ f 0 φ ρ w S w 1 + φ S h p e exp E R T 1 k p , T 1

2.2.2. The Law of Conservation of Mass Equation

The reaction process of hydrates follows the law of conservation of mass. The fundamental relational equation of the conservation law can be expressed as follows [30,36]:
M k t + · F k = q k
The mass conservation equations for each component are described as follows:
M-thane:
φ ρ g S g t = · ρ g v g + m g + q g
Water:
φ ρ w S w t = · ρ w v w + m w + q w
Hydrate:
φ ρ h S h t = m h

2.2.3. Conservation of Energy Equation

The reaction process of hydrates also follows the law of conservation of energy, which can be expressed as follows [36]:
· λ c T · ρ g v g r H g + ρ w v w r H w + q g H g + q w H w + q H = t 1 φ ρ s H s + φ S H ρ H H H + S w ρ w H w + S g ρ g H g
Effective thermal conductivity is described based on the volume-averaging method [36]:
λ c = λ s 1 φ + φ λ h H h + λ g H g + λ w H w

2.2.4. The Relationship Between Porosity and Permeability

As gas hydrates decompose, the effective porosity and permeability of the hydrate reservoir change instantaneously. The effective permeability of the reservoir varies with changes in porosity. In this paper, the relationship between effective permeability and porosity changes is based on the Carman–Kozeny model:
k = k 0 φ φ 0 ε 1 φ 0 1 φ 2

2.2.5. Relative Permeability Model

Relative permeability model and capillary pressure model are as follows [36]:
k r w = S w S w c 1 S w c ε 1
k r g = S g S r g 1 S w c ε 2
P c a p = P 0 S 1 λ 1 λ
Among them are:
S = S S w c 1 S w c , S w = S w 1 S h

2.2.6. Equation of State

The stability or equilibrium of gas hydrates in porous media mainly depends on pressure, temperature, the composition of coexisting phases, and the characteristics of sediments. In this study, the phase equilibrium of hydrates is determined based on the K-value, which is calculated from the three-phase-equilibrium-measured data from pressure and temperature, using thermodynamic models such as the Peng–Robinson Equation of State (PR-EOS). In addition, the K(p,T) value in the above equation is the reaction equilibrium K value, which is expressed as the following relation in CMG software:
K ( p , T ) = ( k 1 / p + k 2 × p + k 3 ) × e ( k 4 / ( T k 5 ) )
where k1, k2, k3, k4, and k5 are fitting parameters.

2.3. Numerical Model Description

A numerical simulation model for gas production dynamics of different sediments at the laboratory scale was established. The 1 m × 1 m × 1 m numerical simulation model was created, as shown in Figure 2, to monitor temperature and pressure during the extraction process and achieve laboratory-scale numerical simulation.

3. Results and Discussion

Under the 1 m × 1 m × 1 m numerical simulation model established based on the geological parameters, the phase equilibrium curves of three homogeneous sediments—montmorillonite, kaolin, and silty sand—along with South China Sea sediments were studied, with water saturation controlled at 0.3 and salinity at 1.5%. The dynamics of gas production were studied by separately investigating the South China Sea sediments, controlling salinity at 1.5%, and examining gas production dynamics at different water contents. Additionally, the gas production dynamics of South China Sea sediments were studied by controlling the water content and investigating different salinities. Numerical simulations of single-well depressurization extraction were conducted to study the effects of capillary forces, surface adsorption, and the inhibiting effect of salinity on hydrate formation at the laboratory scale.

3.1. Gas Production Dynamics of Different Sediments with a Fixed Water Content of 0.3 and Salinity of 1.5%

As shown in Figure 3 and Figure 4, the temperature and pressure of different homogeneous sediments and South China Sea Shenhu area hydrate sediments (referred to as South China Sea sediments) at the laboratory scale decreased sharply within the first 2 h, followed by a slowed decline between 2 and 24 h over time. The saturation distribution shows a uniform decrease over time.
From Table 1, at the laboratory scale, with a water content of 0.3 and salinity of 1.5%, the phase equilibrium of different sediments showed the following results: Compared to solid hydrates, the phase equilibrium temperature of the different sediments was lower, with the effect being as follows: montmorillonite > South China Sea sediments > kaolinite > silty sand. Montmorillonite had the most significant effect of 2.4 K, followed by South China Sea sediments with a cooling of 1.617 K, kaolin with a cooling of 0.885 K, and silty sand with the least cooling effect of 0.690 K.
As shown in Figure 5, compared to solid hydrates, the cumulative gas production of different sediments increased. The increase in gas production followed this order: montmorillonite > South China Sea sediments > kaolinite > silty sand. Montmorillonite showed the highest increase of 525.25%, while silty sand showed the lowest increase at 101.26%.

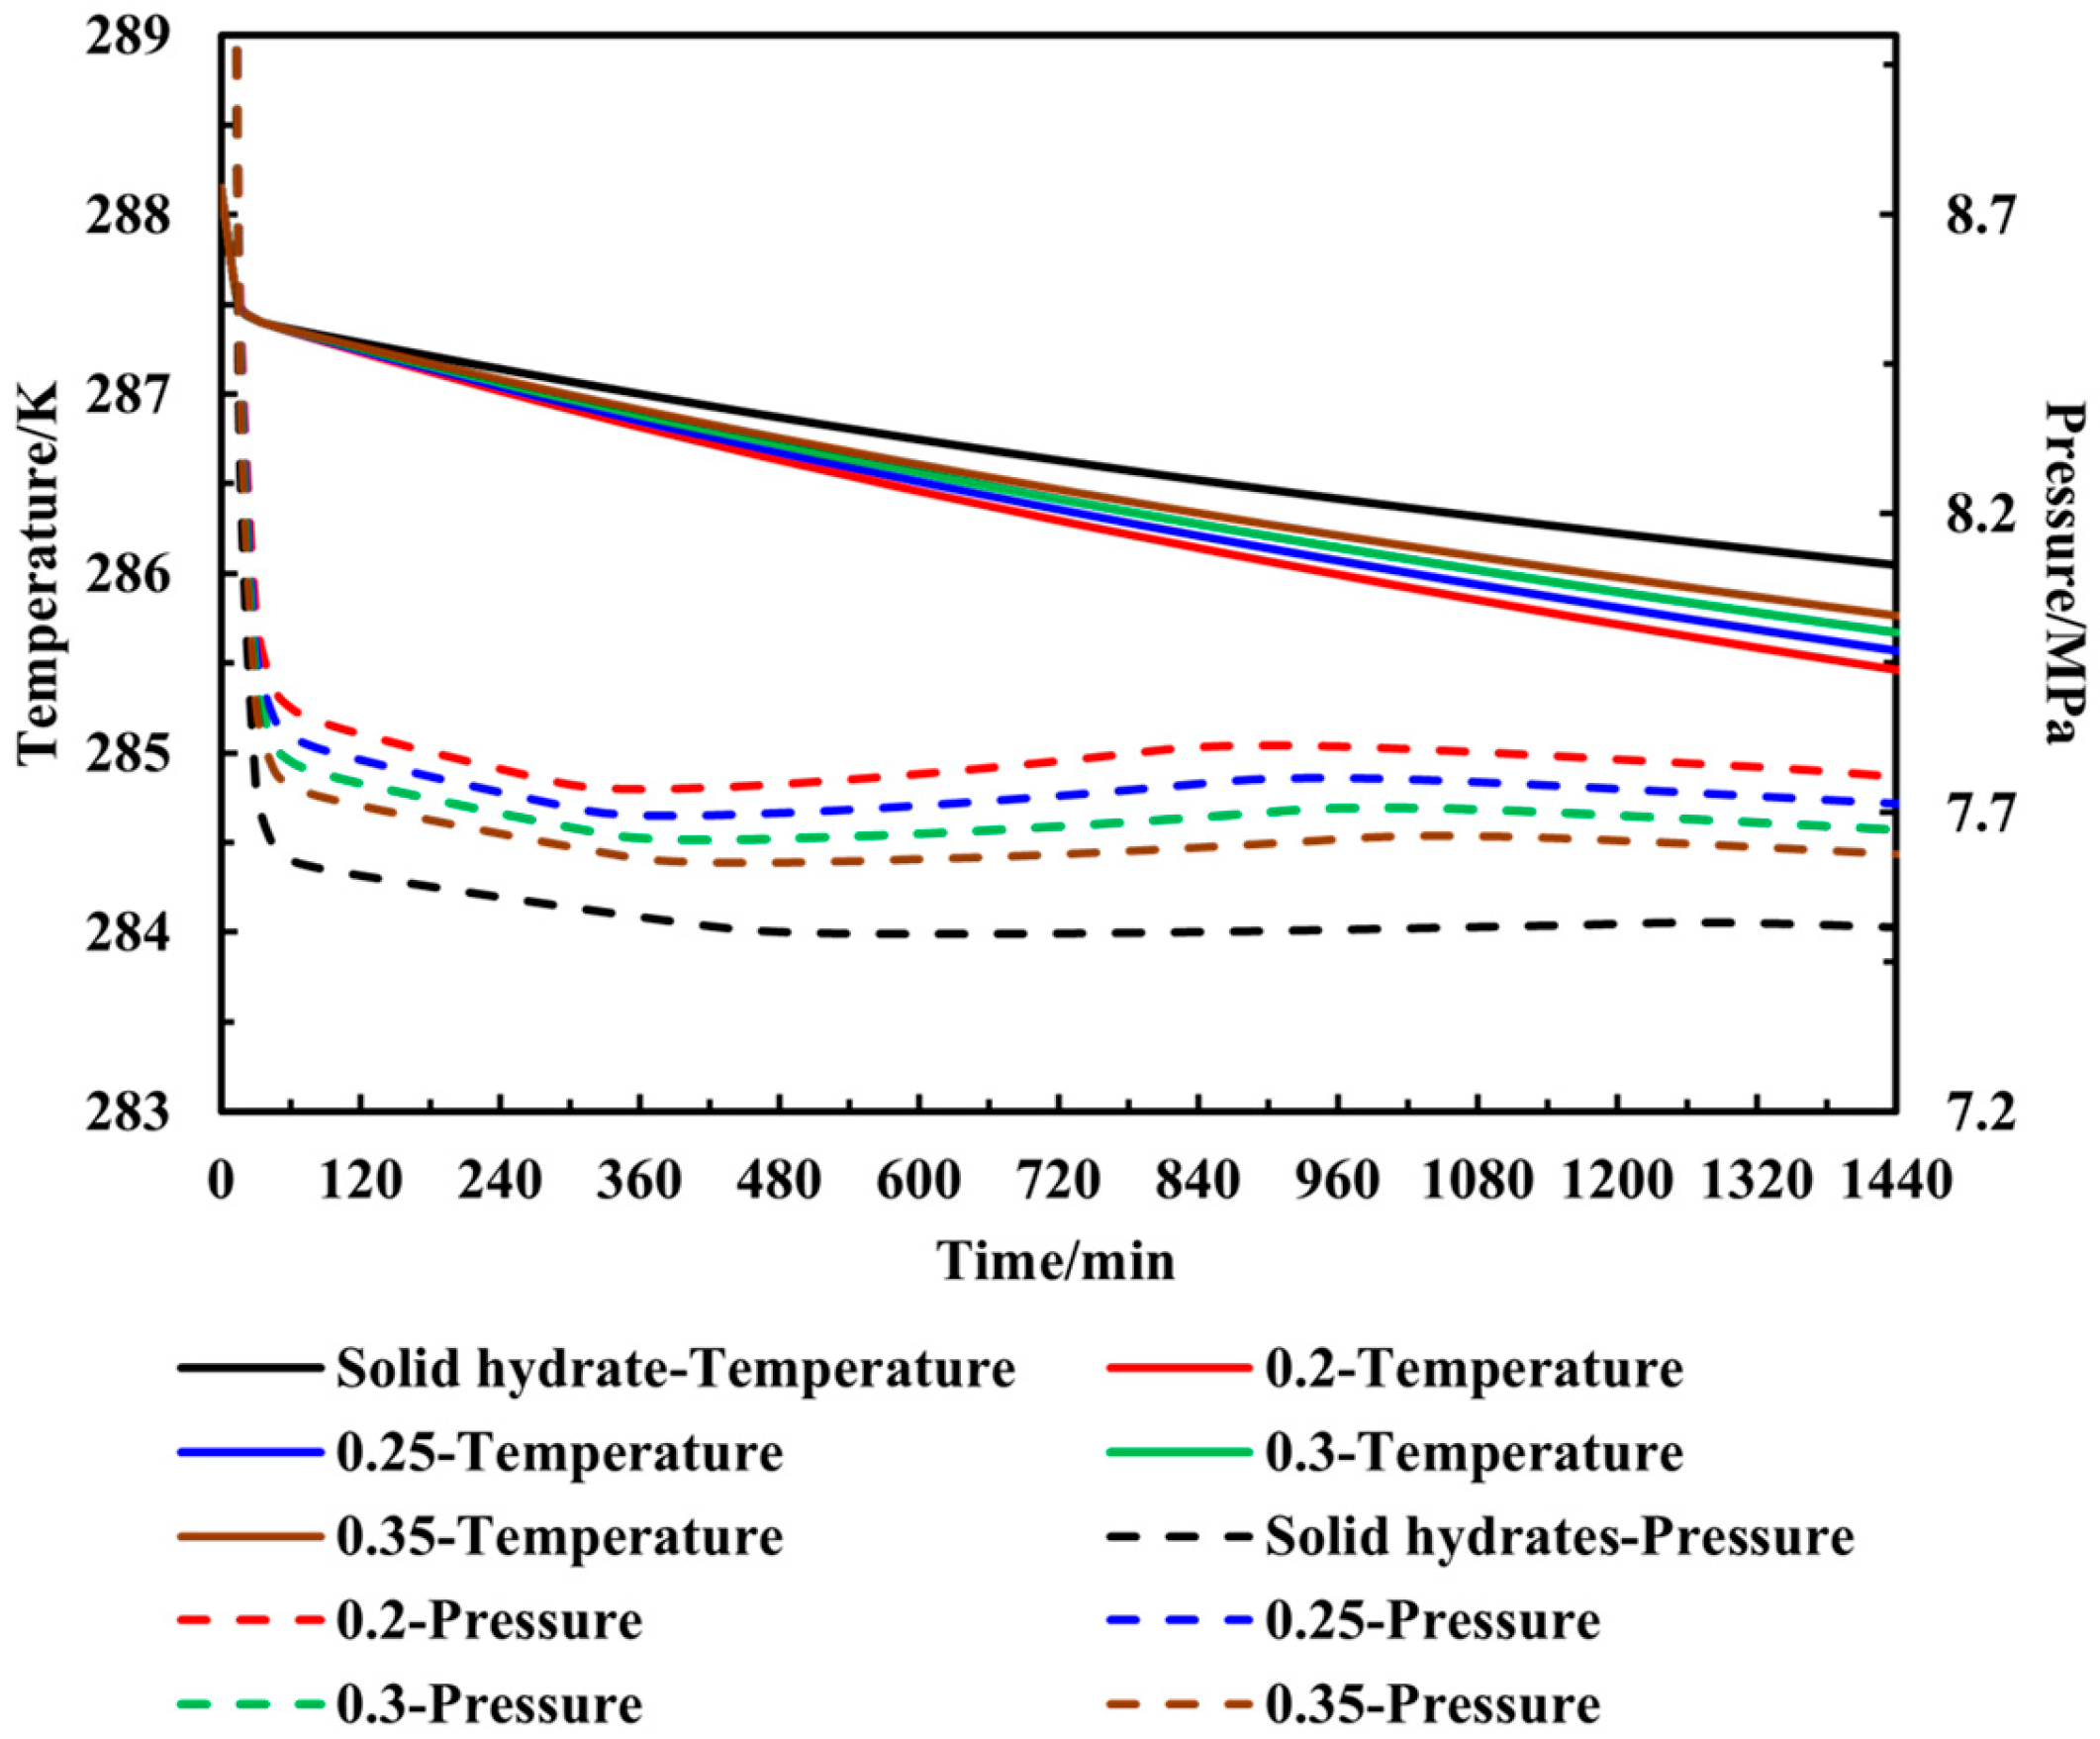
3.2. Gas Production Dynamics of Sediments with Fixed Salinity of 1.5% Under Different Water Contents

As shown in Figure 6 and Figure 7, with a fixed salinity of 1.5%, the temperature and pressure changes of South China Sea sediments under different water contents showed a sharp decrease in the first 2 h, followed by a slow decline between 2 and 24 h.
From Table 2, with a fixed salinity of 1.5%, compared to solid hydrates, the phase equilibrium temperature decreased more with lower water content. If the initial water content of the system is relatively high, this effect becomes less significant. When the initial water content is low, adsorption sites may be occupied by impurities, significantly reducing the adsorption of water molecules. This severely hinders hydrate formation, leading to a significant decrease in phase equilibrium temperature.
From Figure 8 with a fixed salinity of 1.5%, compared to solid hydrates, the gas production increased with lower water content. When the water content was 0.2, gas production increased by 611.58%, and when the water content was 0.35, it increased by 200.88%. The analysis indicates that the low initial water content reduces the capillary surface tension, which in turn lowers the activity of water and diminishes the resistance effect, thus enhancing gas production.

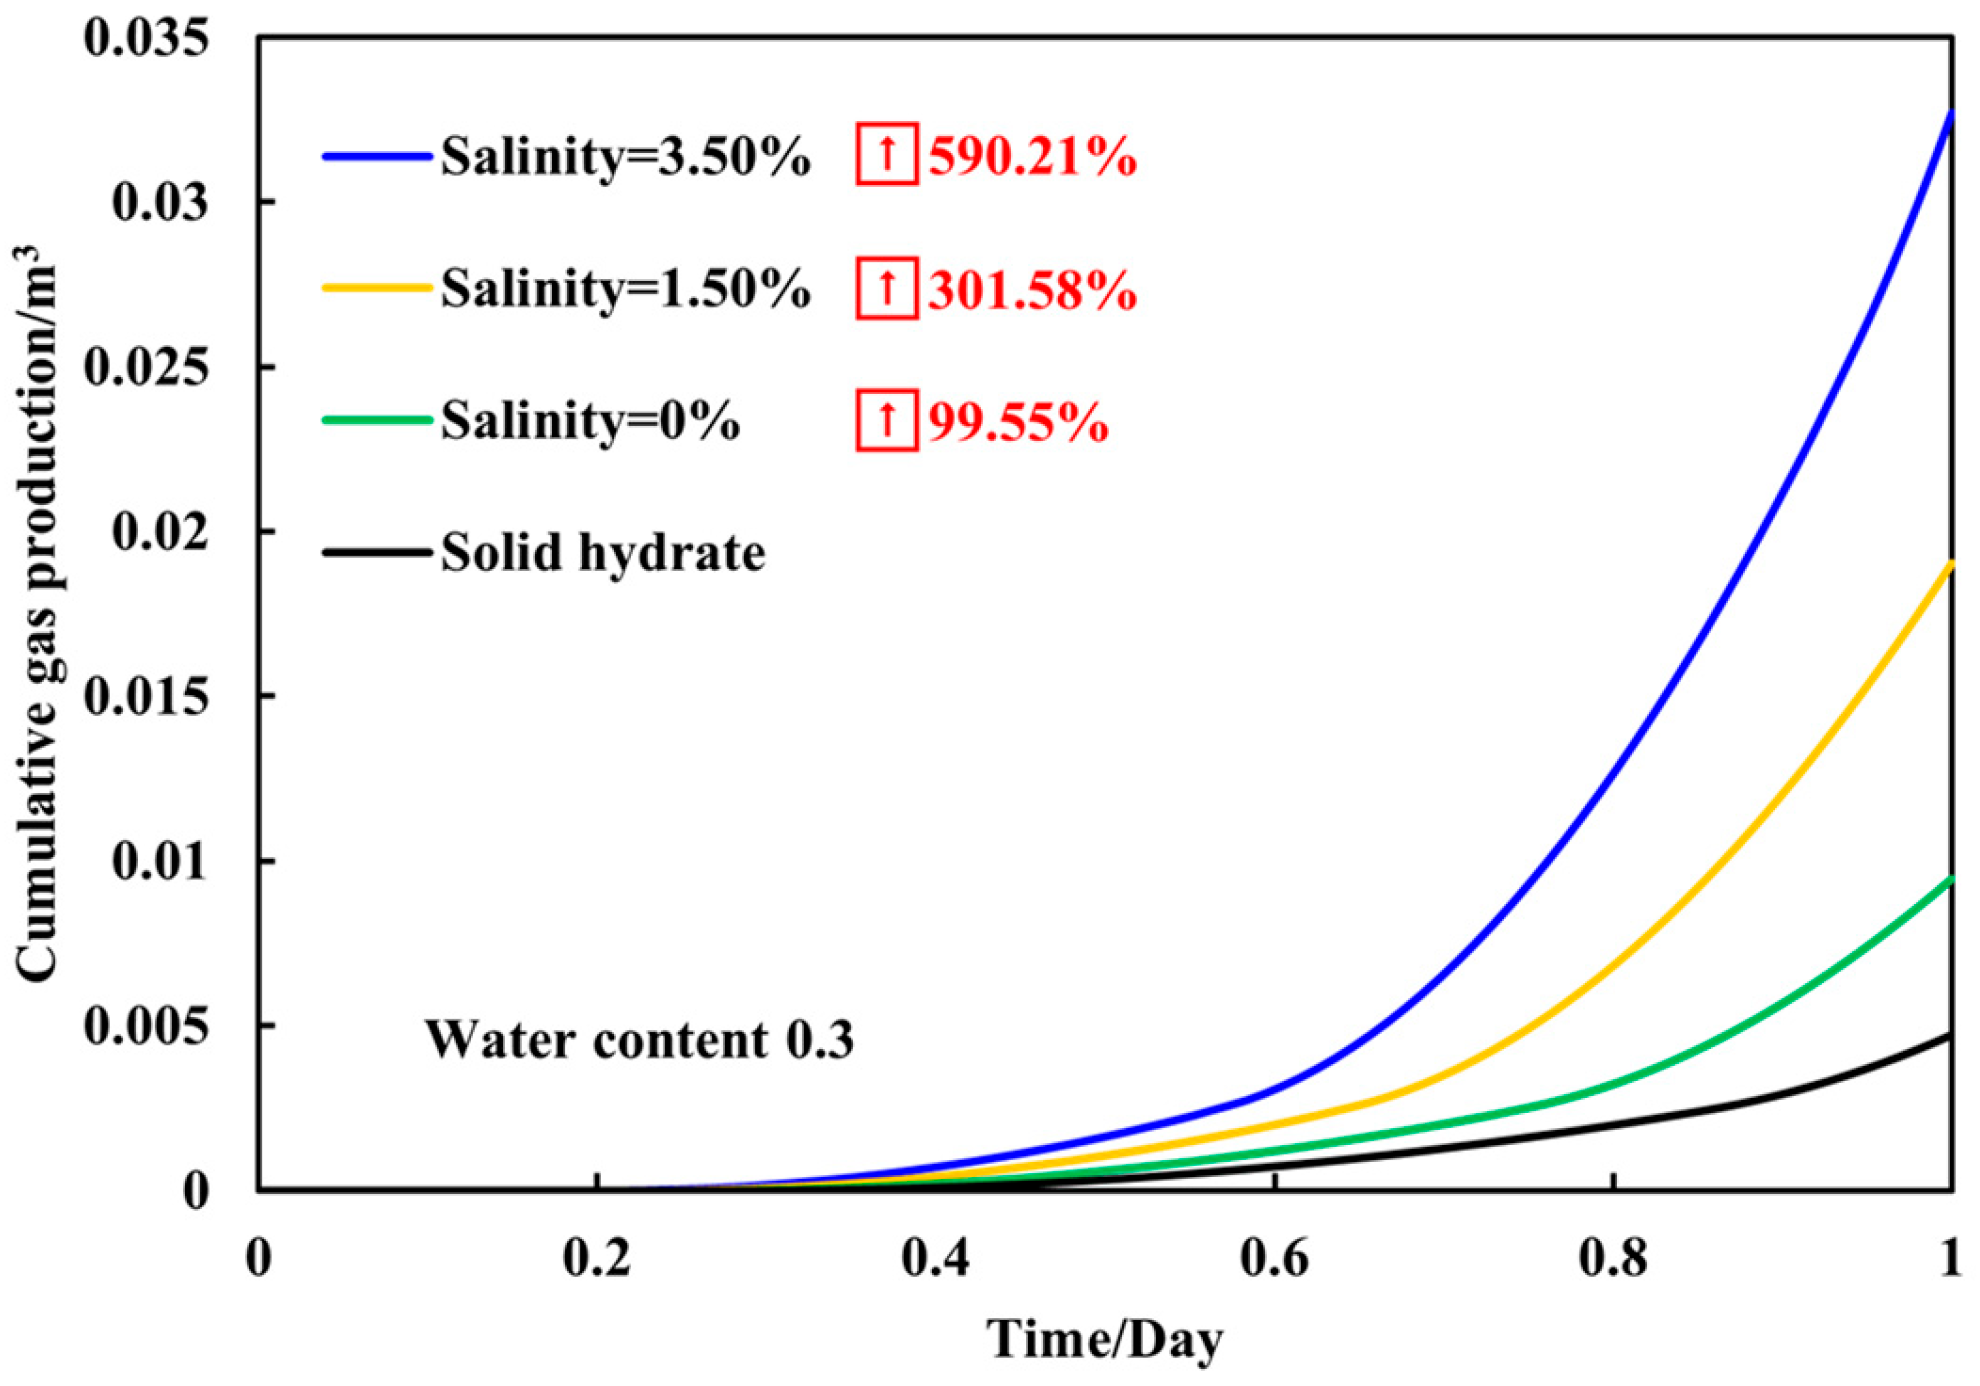
3.3. Gas Production Dynamics of Sediments with a Fixed Water Content of 0.3 Under Different Salinities

As shown in Figure 9 and Figure 10, when the water content is fixed at 0.3, varying the salinity causes the temperature and pressure changes of South China Sea sediments to show a sharp decrease in the first 2 h, followed by a slowed decline between 2 and 24 h. The saturation distribution shows a uniform decrease over time.
From Table 3, when the water content is fixed at 0.3, compared to solid hydrates, the larger the salinity, the greater the change in phase equilibrium temperature. Specifically, when the salinity is 3.5%, the temperature changes by 2.582 K, while at 0% salinity, the temperature change is only 0.681 K.
As shown in Figure 11, compared to solid hydrates, the gas production increases with higher salinity. When the salinity is 3.5%, the gas production increases by 590.21%, while at 0% salinity, the gas production increases by 99.55%. The increase in gas production and the enhanced effect of phase equilibrium temperature decrease can be explained by the ionic effect induced by the dissociation of salts in aqueous solution. This disrupts the original ionization equilibrium, leading to a decrease in the hydrate formation temperature, weakening its stability, and making it more prone to dissociation.

4. Conclusions

This study investigates the implementation of gas hydrate cross-scale phase transition characteristics in numerical simulations of gas hydrate depressurization extraction, focusing primarily on laboratory-scale numerical simulations. A 1 m × 1 m × 1 m numerical simulation model is established. The temperature and pressure during the extraction process were monitored to achieve laboratory-scale simulations. Different sediment types exhibited significant differences in cooling and gas production. Montmorillonite had the most significant effect and cumulative gas production, with a cooling effect of 2.4 K and a 525.25% increase in gas production. In contrast, the impact of silty sand was relatively smaller, with only a 0.69 K decrease in temperature and a 101.26% increase in gas production, indicating that sediment type is a key factor affecting hydrate dissociation and gas production efficiency. Salinity plays a regulatory role in hydrate formation and dissociation. Under fixed water content conditions, as salinity increases, hydrate formation is suppressed, and dissociation becomes more likely, resulting in a significant increase in gas production. When the salinity reaches 3.5%, gas production increases by 590.21%. Water content has a significant impact on phase transition temperature and gas production efficiency. Under fixed salinity conditions, different initial water contents significantly affect phase transition temperature and gas production efficiency. With lower water content, the phase transition temperature of hydrates decreases significantly, and the increase in gas production is more pronounced, in line with phase equilibrium laws. This trend is consistent with the field model results, further validating the reliability of the laboratory model.

Author Contributions

Conceptualization, Formal analysis, Writing—original draft, Q.F.; Methodology, Formal analysis, Investigation, W.P.; Formal analysis, Data curation, Supervision, M.C.; Methodology, Writing—original draft, Writing—review and editing, Validation, Supervision, Project administration, Funding acquisition, Project administration, Funding acquisition, S.P. All authors have read and agreed to the published version of the manuscript.

Funding

This study was funded by Research on Cross-scale Phase Transition Characteristics and Numerical Simulation Methods for Depressurization Development of Natural Gas Hydrates (KJQZ-2023-2003) and is supported by the National Natural Science Foundation of China (52474076).

Institutional Review Board Statement

Not applicable.

Informed Consent Statement

Not applicable.

Data Availability Statement

The data presented in this study are available upon request from the corresponding author.

Conflicts of Interest

Authors Qiang Fu were employed by the company CNOOC Research Institute. The remaining authors declare that the research was conducted in the absence of any commercial or financial relationships that could be construed as a potential conflict of interest.

Nomenclature

c h ( d ) Hydrate concentration.
k d Hydrate decomposition rate constant.
A d Specific surface area of hydrate per unit volume.
p e Equilibrium pressure.
p g Gas phase pressure.
k d 0 Frequency factor of hydrate decomposition reaction.
E Activation energy.
K ( p , T ) The equilibrium value of hydrates at a certain pressure and temperature.
R Gas constant.
A HS The specific surface area of hydrate particles.
c h ( f ) Concentration of hydrate.
k f Rate constant of hydrate formation.
A f Surface area per unit volume of hydrate.
p e Balance pressure.
p g Vapor pressure.
k f 0 The frequency factor of hydrate formation reaction.
v Flow rate.
m ˙ Mass change caused by hydrate decomposition or formation.
SPhase saturation, with subscripts g, w, and h representing methane, water, and hydrate, respectively.
φ Intrinsic porosity.
q g Gas production rate of the well.
q w Water production rate of the well.
ρ Density.
S Phase saturation.
H The enthalpy of each phase, where the subscripts s, h, g, and w represent the rock skeleton, hydrate, gas, and water.
q h The heat required for the decomposition or formation of hydrates.
λ Thermal conductivity.
k Effective permeability at porosity φ.
k 0 The effective permeability at porosity φ 0 .
λ Experience parameter (generally ranges from 1 to 10).
S wc Bound water saturation.
S rg Bound gas saturation.
ε 1 ,   ε 2 Power-law coefficient.
ε An empirical parameter.
P 0 Initial capillary pressure.
λ Van Genuchten index.
KEquilibrium value of the reaction, controlling the activation of hydrate formation and decomposition reactions; when K > 1, hydrates decompose, and when K < 1, hydrates form.
k 1 k 5 Fitting parameters.

References

  1. Tang, X.Y.; Chen, J.W.; Guo, Y.L.; Liang, F.C.; Wang, C. Development Status of Combustible Ice Mining and Test Production Technologies. Nat. Gas Oil 2020, 38, 7–15. [Google Scholar] [CrossRef]
  2. Wu, S.G.; Wang, J.L. On the China’s successful gas production test from marine gas hydrate reservoirs. Chin. Sci. Bull. 2018, 63, 2–8. [Google Scholar] [CrossRef]
  3. Liu, J.H.; Li, Z.D.; Zhao, J.B. New progress in the study of natural gas hydrate in Shenhu area. Miner. Resour. Geol. 2021, 35, 596–602. [Google Scholar] [CrossRef]
  4. Li, Q.P.; Zhou, S.W.; Zhao, J.F.; Song, Y.; Zhu, J. Research Status and Prospects of Natural Gas Hydrate Exploitation Technology. Chin. Acad. Eng. 2022, 24, 214–224. [Google Scholar] [CrossRef]
  5. Li, Q.; Li, Q.; Cao, H.; Wu, J.; Wang, F.; Wang, Y. The Crack Propagation Behaviour of CO2 Fracturing Fluid in Unconventional Low Permeability Reservoirs: Factor Analysis and Mechanism Revelation. Processes 2025, 13, 159. [Google Scholar] [CrossRef]
  6. Li, Q.; Li, Q.; Wu, J.; Li, X.; Li, H.; Cheng, Y. Wellhead Stability during Development Process of Hydrate Reservoir in the Northern South China Sea: Evolution and Mechanism. Processes 2024, 13, 40. [Google Scholar] [CrossRef]
  7. Du, J.M.; Zhao, Y.G.; Wang, H.; Shen, R.R.; Yin, X.H. Development of Natural Gas Hydrate Extraction and Utilization Technology—A New Direction for Deep-Sea Oil and Gas Exploration. China Resour. Compr. Util. 2023, 41, 86–89. [Google Scholar] [CrossRef]
  8. Xu, J.C.; Sun, W. Numerical simulation of natural gas hydrate production enhancement measures in Shenhu area of South China Sea. In Abstracts of the 12th National Conference on Fluid Mechanics; Intelligent Oil and Gas Field Research Institute, School of Petroleum Engineering, China University of Petroleum (East China): Qingdao, China, 2022; 1p. [Google Scholar]
  9. Qin, X.W.; Lu, C.; Wang, P.K.; Liang, Q.Y. Hydrate phase transition and seepage mechanism during natural gas hydrate production tests in the South China Sea:A review and prospect. Geol. China 2022, 49, 749–769. [Google Scholar] [CrossRef]
  10. Wang, S.L.; Sun, Z.T. Current status and future trends of exploration and pilot production of gas hydrate in the world. Mar. Geol. Front. 2018, 34, 24–32. [Google Scholar] [CrossRef]
  11. Sun, J.S.; Cheng, Y.F.; Qin, X.W.; Sun, Y.H.; Yu, Y.; Wang, Z.Y.; Li, X.; Lu, C.; Qu, Y.Z.; Lu, J.H.; et al. Research Progress on Natural Gas Hydrate Drilling &Production in the South China Sea. Bull. Natl. Nat. Sci. Found. China 2021, 35, 940–951. [Google Scholar] [CrossRef]
  12. Su, P.B.; Liang, J.Q.; Zhang, W.; Liu, F.; Li, T.; Wang, F.; Wang, X. Numerical simulation of gas hydrate migration-accumulation system and trial mining optimization of orebodies in the Shenhu area. Geol. Bull. China 2021, 40, 267–279. [Google Scholar]
  13. Zhang, X.H.; Lu, X.B.; Li, P. A comprehensive review in natural gas hydrate recovery methods. Sci. China Phys. Mech. Astron. 2019, 49, 38–59. [Google Scholar] [CrossRef]
  14. Liu, X.; Zhao, Z.H.; Qiu, Z.C.; Yi, R.; Zhou, X. Current status and considerations of natural gas hydrate exploration and development technology. Committee of China Petroleum Society, Sichuan Petroleum Society, Zhejiang Petroleum Society. In Proceedings of the 2017 National Natural Gas Academic Annual Conference, Hangzhou, China, 19–20 October 2017; China Petroleum Exploration and Development Research Institute: Beijing, China, 2017; 4p. [Google Scholar]
  15. Li, S.D.; Sun, Y.M.; Chen, W.C.; Yu, Z.; Zhou, Z.; Liu, L.; He, J.; Zhang, Z.; Li, X. Analyses of gas production methods and offshore production tests of natural gas hydrates. J. Eng. Geol. 2019, 27, 55–68. [Google Scholar] [CrossRef]
  16. Wang, Y.F. Numerical Simulation Study on Efficient Exploitation Schemes of Shenhu Hydrate Reservoir in South China Sea. Master’s Thesis, Dalian University of Technology, Dalian, China, 2022. [Google Scholar] [CrossRef]
  17. Pang, W.X.; Li, Q.P.; Zhou, S.W. Research and development strategy of natural gas hydrate development. Int. Pet. Econ. 2022, 30, 33–41. [Google Scholar] [CrossRef]
  18. Southeast Sea. Several thoughts on NGH’s exploitation. Int. Pet. Econ. 2017, 25, 19–25. [CrossRef]
  19. Wu, C.Z.; Zhao, K.B.; Sun, C.Q.; Sun, D.; Xu, X.; Chen, X.; Xuan, L. Current Research in Natural Gas Hydrate Production. Bull. Geol. Sci. Technol. 2008, 27, 47–52. [Google Scholar] [CrossRef]
  20. Zhao, W.L. Experimental Study and Numerical Simulation of Gas Production from Natural Gas Hydrate. Master Thesis, China University of Petroleum, Beijing, China, 2010. [Google Scholar]
  21. Xiao, L.K.; Dong, Y.H.; Li, S.D.; Wang, L.; Duan, R.; Fu, Y. Research progresses on the influencing factors of natural gas hydrates phase transition process in porous media. J. Eng. Geol. 2021, 29, 183–196. [Google Scholar] [CrossRef]
  22. Hu, W.F. Molecular Dynamies Study on the Microscopic Characteristics of Natural Gas Hydrate Phase Transformation. Ph.D. Thesis, Dalian University of Technology, Dalian, China, 2021. [Google Scholar] [CrossRef]
  23. Han, H. Study on Pore Permeation Characteristics of Gas Hydrate Reservoir in Shenhu Sea, South China Sea. Master’s Thesis, China University of Petroleum, Beijing, China, 2023. [Google Scholar] [CrossRef]
  24. Zhang, L.X. Study on Phase Transition Micro-characteristic and Gas Replacement Mechanism of Natural Gas Hydrate. Ph.D. Thesis, Dalian University of Technology, Dalian, China, 2019. [Google Scholar] [CrossRef]
  25. Kuang, Y.M. Study of the Effects of Microscopic Phase Transition of Hydrate on Gas-Water Transport in Porous Media. Ph.D. Thesis, Dalian University of Technology, Dalian, China, 2021. [Google Scholar] [CrossRef]
  26. Li, C.F.; Yi, W.Q.; Chen, L.; Gui, B.; Hao, X.; Sun, J.; Zhang, Y.; Liu, L.; Chen, Q.; Zheng, R. Super-resolution CT image recognition of micro-occurrence characteristics of natural gas hydrates from Shenhu area in northern South China Sea. Mar. Geol. Quat. Geol. 2024, 44, 149–159. [Google Scholar] [CrossRef]
  27. He, B. Modeling the Dissociation of Methane Hydrate by Depressurization in Different Scale Cores. Master’s Thesis, Taiyuan University of Technology, Taiyuan, China, 2017. [Google Scholar]
  28. Liu, J.L. Numerical Study on the Optimization Producing Scheme of Hydrate Reservoirs in Shenhu Area. Master’s Thesis, China University of Petroleum (East China), Dongying, China, 2018. [Google Scholar] [CrossRef]
  29. Zhang, L.; He, J.Y.; Wang, H.B.; Cen, X.; Chen, X. Research Progress of Numerical Simulation Technology of Natural Gas Hydrates Production. Sci. Technol. Eng. 2021, 21, 11891–11899. [Google Scholar] [CrossRef]
  30. Cui, W. Numerical Simulation Study on Horizontal Well Depressurization Production of Natural Gas Hydrate. Master’s Thesis, Qilu University of Technology (QLU), Jinan, China, 2022. [Google Scholar] [CrossRef]
  31. Zhou, J.; Gu, J.T.; Xu, H.P.; Wang, Z.; Wang, Q.; Ma, Y. Analysis and numerical simulation of factors affecting natural gas hydrate phase equilibrium. Pet. Eng. Constr. 2021, 47, 48–54. [Google Scholar] [CrossRef]
  32. Li, P.F.; Lei, X.H.; Xu, H.; Xiang, H. A review on researches on factors affecting gas hydrate phase equilibrium. Nat. Gas Chem. Ind. 2012, 37, 12–17. [Google Scholar] [CrossRef]
  33. Wang, S.H.; Song, H.B.; Yan, W. The change of external conditions effects on the phase equilibrium curve of gas hydrate and the thickness of hydrate stability zone. Prog. Geophys. 2005, 20, 761–768. [Google Scholar] [CrossRef]
  34. Chen, Y.; Yan, T.; Sun, X.F.; Qu, J.; Yao, D. Study on influence factors and rules of gas hydrate phase equilibrium based on multiflash software. J. Chengdu Univ. Technol. Sci. Technol. Ed. 2020, 47, 358–366. [Google Scholar] [CrossRef]
  35. Liu, Z.; Wang, Z.; Chen, L.; Chen, L.; Li, X.; Sun, B. Experimental and modeling investigations of hydrate phase equilibria in natural clayey-silty sediments. Chem. Eng. J. 2022, 449, 137557. [Google Scholar] [CrossRef]
  36. Xu, J.; Qin, H.; Li, H.; Lu, C.; Li, S.; Wu, D. Enhanced gas production efficiency of class 1, 2, 3 hydrate reservoirs using hydraulic fracturing technique. Energy 2023, 263, 126003. [Google Scholar] [CrossRef]
Figure 1. Phase equilibrium prediction.
Energies 18 00755 g001
Figure 2. Laboratory-scale numerical simulation model (the colors show different simulation layers).
Energies 18 00755 g002
Figure 3. Changes in simulated pressure, temperature, and hydrate saturation distribution at laboratory scale.
Energies 18 00755 g003
Figure 4. The laboratory-scale simulation monitoring of temperature and pressure changes during the phase transition process.
Energies 18 00755 g004
Figure 5. Gas production of different sediment phase equilibrium curves at laboratory scale with 0.3 water content and 1.50% salinity.
Energies 18 00755 g005
Figure 6. The simulated pressure, temperature, and hydrate distribution changes at a water content of 0.3.
Energies 18 00755 g006
Figure 7. Temperature and pressure changes during phase transition process for different water-contents equilibrium curves at laboratory scale.
Energies 18 00755 g007
Figure 8. The gas production rate of South China Sea sediments with different water contents at a salinity of 1.50% under laboratory-scale conditions.
Energies 18 00755 g008
Figure 9. The simulation of pressure, temperature, and hydrate distribution changes at a salinity of 3.50%.
Energies 18 00755 g009
Figure 10. Temperature and pressure changes in phase transition processes on phase equilibrium curves of different salinities on a laboratory scale.
Energies 18 00755 g010
Figure 11. Methane production at different salinities in South China Sea sediments with water content of 0.3 at laboratory scale.
Energies 18 00755 g011
Table 1. Changes in phase equilibrium pressure and temperature of different sediments at water content of 0.3 and salinity of 1.50%.
Temperature T/KPressure P/MPa
Solid HydrateMontmorilloniteSouth China Sea SedimentsKaoliniteSilt
281.514279.114279.896280.628280.8236.031
282.093279.693280.475281.207281.4026.413
282.693280.293281.075281.807282.0026.842
283.293280.893281.675282.407282.6027.288
283.764281.364282.146282.878283.0737.701
284.321281.921282.703283.435283.6308.178
284.857282.457283.239283.971284.1668.671
285.286282.886283.668284.400284.5959.101
285.779283.379284.161284.893285.0889.626
286.164283.764284.546285.278285.47310.05
286.443284.043284.825285.557285.75210.38
286.721284.321285.103285.835286.03010.72
286.979284.579285.361286.093286.28811.05
287.236284.836285.618286.350286.54511.40
287.493285.093285.875286.607286.80211.74
287.814285.414286.196286.928287.12312.21
288.114285.714286.496287.228287.42312.66
288.521286.121286.903287.635287.83013.28
288.843286.443287.225287.957288.15213.80
289.164286.764287.54288.278288.47314.34
Table 2. Changes in phase equilibrium pressure and temperature of South China Sea sediments at different water contents with salinity of 1.50%.
Temperature T/KPressure P/MPa
Pure WaterWater Content = 0.2Water Content = 0.25Water Content = 0.3Water Content = 0.35
281.514278.875279.4147279.896280.3226.031
282.093279.454279.9937280.475280.9016.413
282.693280.054280.5937281.075281.5016.842
283.293280.654281.1937281.675282.1017.288
283.764281.125281.6647282.146282.5727.701
284.321281.682282.2217282.703283.1298.178
284.857282.218282.7577283.239283.6658.671
285.286282.647283.1867283.668284.0949.101
285.779283.140283.6797284.161284.5879.626
286.164283.525284.0647284.546284.97210.05
286.443283.804284.3437284.825285.25110.38
286.721284.082284.6217285.103285.52910.72
286.979284.340284.8797285.361285.78711.057
287.236284.597285.1367285.618286.04411.407
287.493284.854285.3937285.875286.30111.741
287.814285.175285.7147286.196286.62212.218
288.114285.475286.0147286.496286.92212.66
288.521285.882286.4217286.903287.32913.284
288.843286.204286.7437287.225287.65113.809
289.164286.525287.064287.546287.97214.34
Table 3. Changes in the phase equilibrium pressure and temperature of South China Sea sediments at different salinities with a water content of 0.3.
Temperature T/KPressure P/MPa
Pure waterSalinity = 0%Salinity = 1.5%Salinity = 3.5%
281.514280.833279.89278.9326.031
282.093281.412280.47279.5116.413
282.693282.012281.075280.1116.842
283.293282.612281.675280.7117.288
283.764283.0831282.146281.1827.701
284.321283.640282.703281.7398.178
284.857284.176283.239282.2758.671
285.286284.605283.668282.7049.101
285.779285.098284.161283.1979.626
286.164285.483284.546283.58210.05
286.443285.762284.825283.86110.38
286.721286.040285.103284.13910.72
286.979286.298285.361284.39711.05
287.236286.555285.618284.65411.40
287.493286.812285.875284.91111.74
287.814287.133286.196285.23212.21
288.114287.433286.496285.53212.66
288.521287.840286.903285.93913.28
288.843288.162287.225286.26113.80
289.164288.483287.546286.58214.34
Disclaimer/Publisher’s Note: The statements, opinions and data contained in all publications are solely those of the individual author(s) and contributor(s) and not of MDPI and/or the editor(s). MDPI and/or the editor(s) disclaim responsibility for any injury to people or property resulting from any ideas, methods, instructions or products referred to in the content.

