Article

Study on Surfactants for the Removal of Water from Deliquification Natural Gas Wells to Enhance Production

Oil and Gas Institute e National Research Institute, 31-503 Krakow, ul. Lubicz 25 A, 31-503 Krakow, Poland
*
Author to whom correspondence should be addressed.
Energies 2024, 17(23), 5924; https://doi.org/10.3390/en17235924
Submission received: 6 November 2024 / Revised: 21 November 2024 / Accepted: 22 November 2024 / Published: 26 November 2024
(This article belongs to the Special Issue Subsurface Energy and Environmental Protection 2024)

Abstract

:
A major problem in natural gas production is the waterlogging of gas wells. This problem occurs at the end of a well’s life when the reservoir pressure becomes low and the gas velocity in the well tubing is no longer sufficient to bring the gas-related fluids (water and gas condensate) up to the surface. This causes water to accumulate at the bottom of the gas well, which can seriously reduce or even stop gas production altogether. This paper presents a study of the foaming of reservoir water using foaming sticks with the trade names BioLight 30/380, BioCond 30, BioFoam 30, BioAcid 30/380, and BioCond Plus 30/380. The reservoir waters tested came from near-well separators located at three selected wells that had undergone waterlogging and experienced a decline in natural gas production. They were characterised by varying physical and chemical parameters, especially in terms of mineralisation and oil contaminant content. Laboratory studies on the effect of foaming agents on the effectiveness of foaming and lifting of reservoir water from the well were carried out on a laboratory bench, simulating a natural gas-producing column using surfactant doses in the range of 1.5–5.0 g/m3 and measuring the surface tension of the water, the volume of foam generated as a function of time and the foamed reservoir water. The performance criterion for the choice of surfactant for the test water was its effective lifting in a foam structure from an installation, simulating a waterlogged gas well and minimising the dose of foaming agent introduced into the water. The results obtained from the laboratory tests allowed the selection of effective surfactants in the context of foaming and uplift of reservoir water from wells, where a decline in natural gas production was observed as a result of their waterlogging. In the next stage, well tests were carried out based on laboratory studies to verify their effectiveness under conditions typical for the production site. Tests carried out at natural gas wells showed that the removal of water from the bottom of the well resulted in an increase in natural gas production, ranging from 56.3% to 79.6%. In practice, linking the results of laboratory tests for the type and dosage of foaming agents to the properties of reservoir water and gas production parameters made it possible to identify the types of surfactants and their dosages that improve the production of a given type of natural gas reservoir in an effective manner, resulting in an increase in the degree of depletion of hydrocarbon deposits.

1. Introduction

In the process of natural gas extraction, the reservoir fluid stream brought to the surface contains liquid components in the form of water or condensate in addition to gas. It is common for the volume of water to increase with the duration of the reservoir’s production, and the accumulation of liquid at the bottom of the well is a common cause of decreased gas production from the reservoir. Water accumulation at the bottom of wells occurs when the energy of the gas flowing in the production column is not high enough to lift the liquid particles to the surface. In this event, water builds up at the bottom of the well, limiting production volumes. For wells with low reservoir pressure, fluid accumulating at the bottom can completely stop production [1,2,3]. This occurs when the hydrostatic pressure rises to a sufficiently high level. The hydrostatic pressure of the fluid column, counteracting reservoir pressure, limits the amount of gas production, interferes with interpreting the results of well tests, and makes it difficult to assess the gas-water exponent, etc.
Once fluid accumulation at the bottom of the well is observed, any action to reduce its quantity will increase the rate of gas flow to the well and improve its productivity, contributing to an increase in the lifespan of producing wells [4,5,6,7]. Failure to respond will result in a systematic reduction in gas production until it stops. It is therefore important to seek innovative technologies to improve the extraction of residual gas [8,9].
One technique for dewatering natural gas wells is a method based on the generation of foam in the well, known as foam lift. The foam generated reduces the surface tension of the fluid, thereby reducing the minimum critical velocity of the gas required for flow [10,11,12,13]. A prerequisite is that the deposit has the mechanical energy to mix the gas with water. The resulting foam reduces the density of the fluid and thus reduces the hydrostatic pressure exerted on the bottom of the well and the deposit. The foam is able to flow as a continuous phase at lower gas velocities and carry water out of the well in its structure [14,15]. This helps extend the life of the gas well. In this method, liquid or solid foaming agents can be introduced into the well continuously or in batches [16,17,18,19,20], while their selection and dosage depend on the properties of the extracted reservoir water. It is therefore important to carry out a detailed study of the agents to select them properly for a given reservoir. The proper selection of agents for a given type of reservoir water should also take into account the duration of the foam under gas flow conditions [21]. This is of great importance, as excessive foaming or prolonged foam duration in the gas flow can cause interference with surface equipment and control and measurement systems.
With regard to studies on the effect of surfactants on the fluid lifting effect in vertical wells, many studies have been reported in the literature. These range from gas well experiments [22,23] to model studies of the effect of surfactants (anionic, amphoteric, and cationic) on fluid lift in vertical tubing at different gas and fluid flow rates [24,25]. Although anionic surfactants are excellent foaming agents, there are concerns about their ineffectiveness in conditions of high salinity. In addition to high salinity, harsh conditions, including condensate and high well temperatures, are also likely to retard surfactant foaming. Therefore, foaming agents usually contain two or more types of surfactants in order to produce a more stable foam.
In a gas well, liquid–gas liquid–gas phase interaction, under flow conditions, can take the following forms (Figure 1):
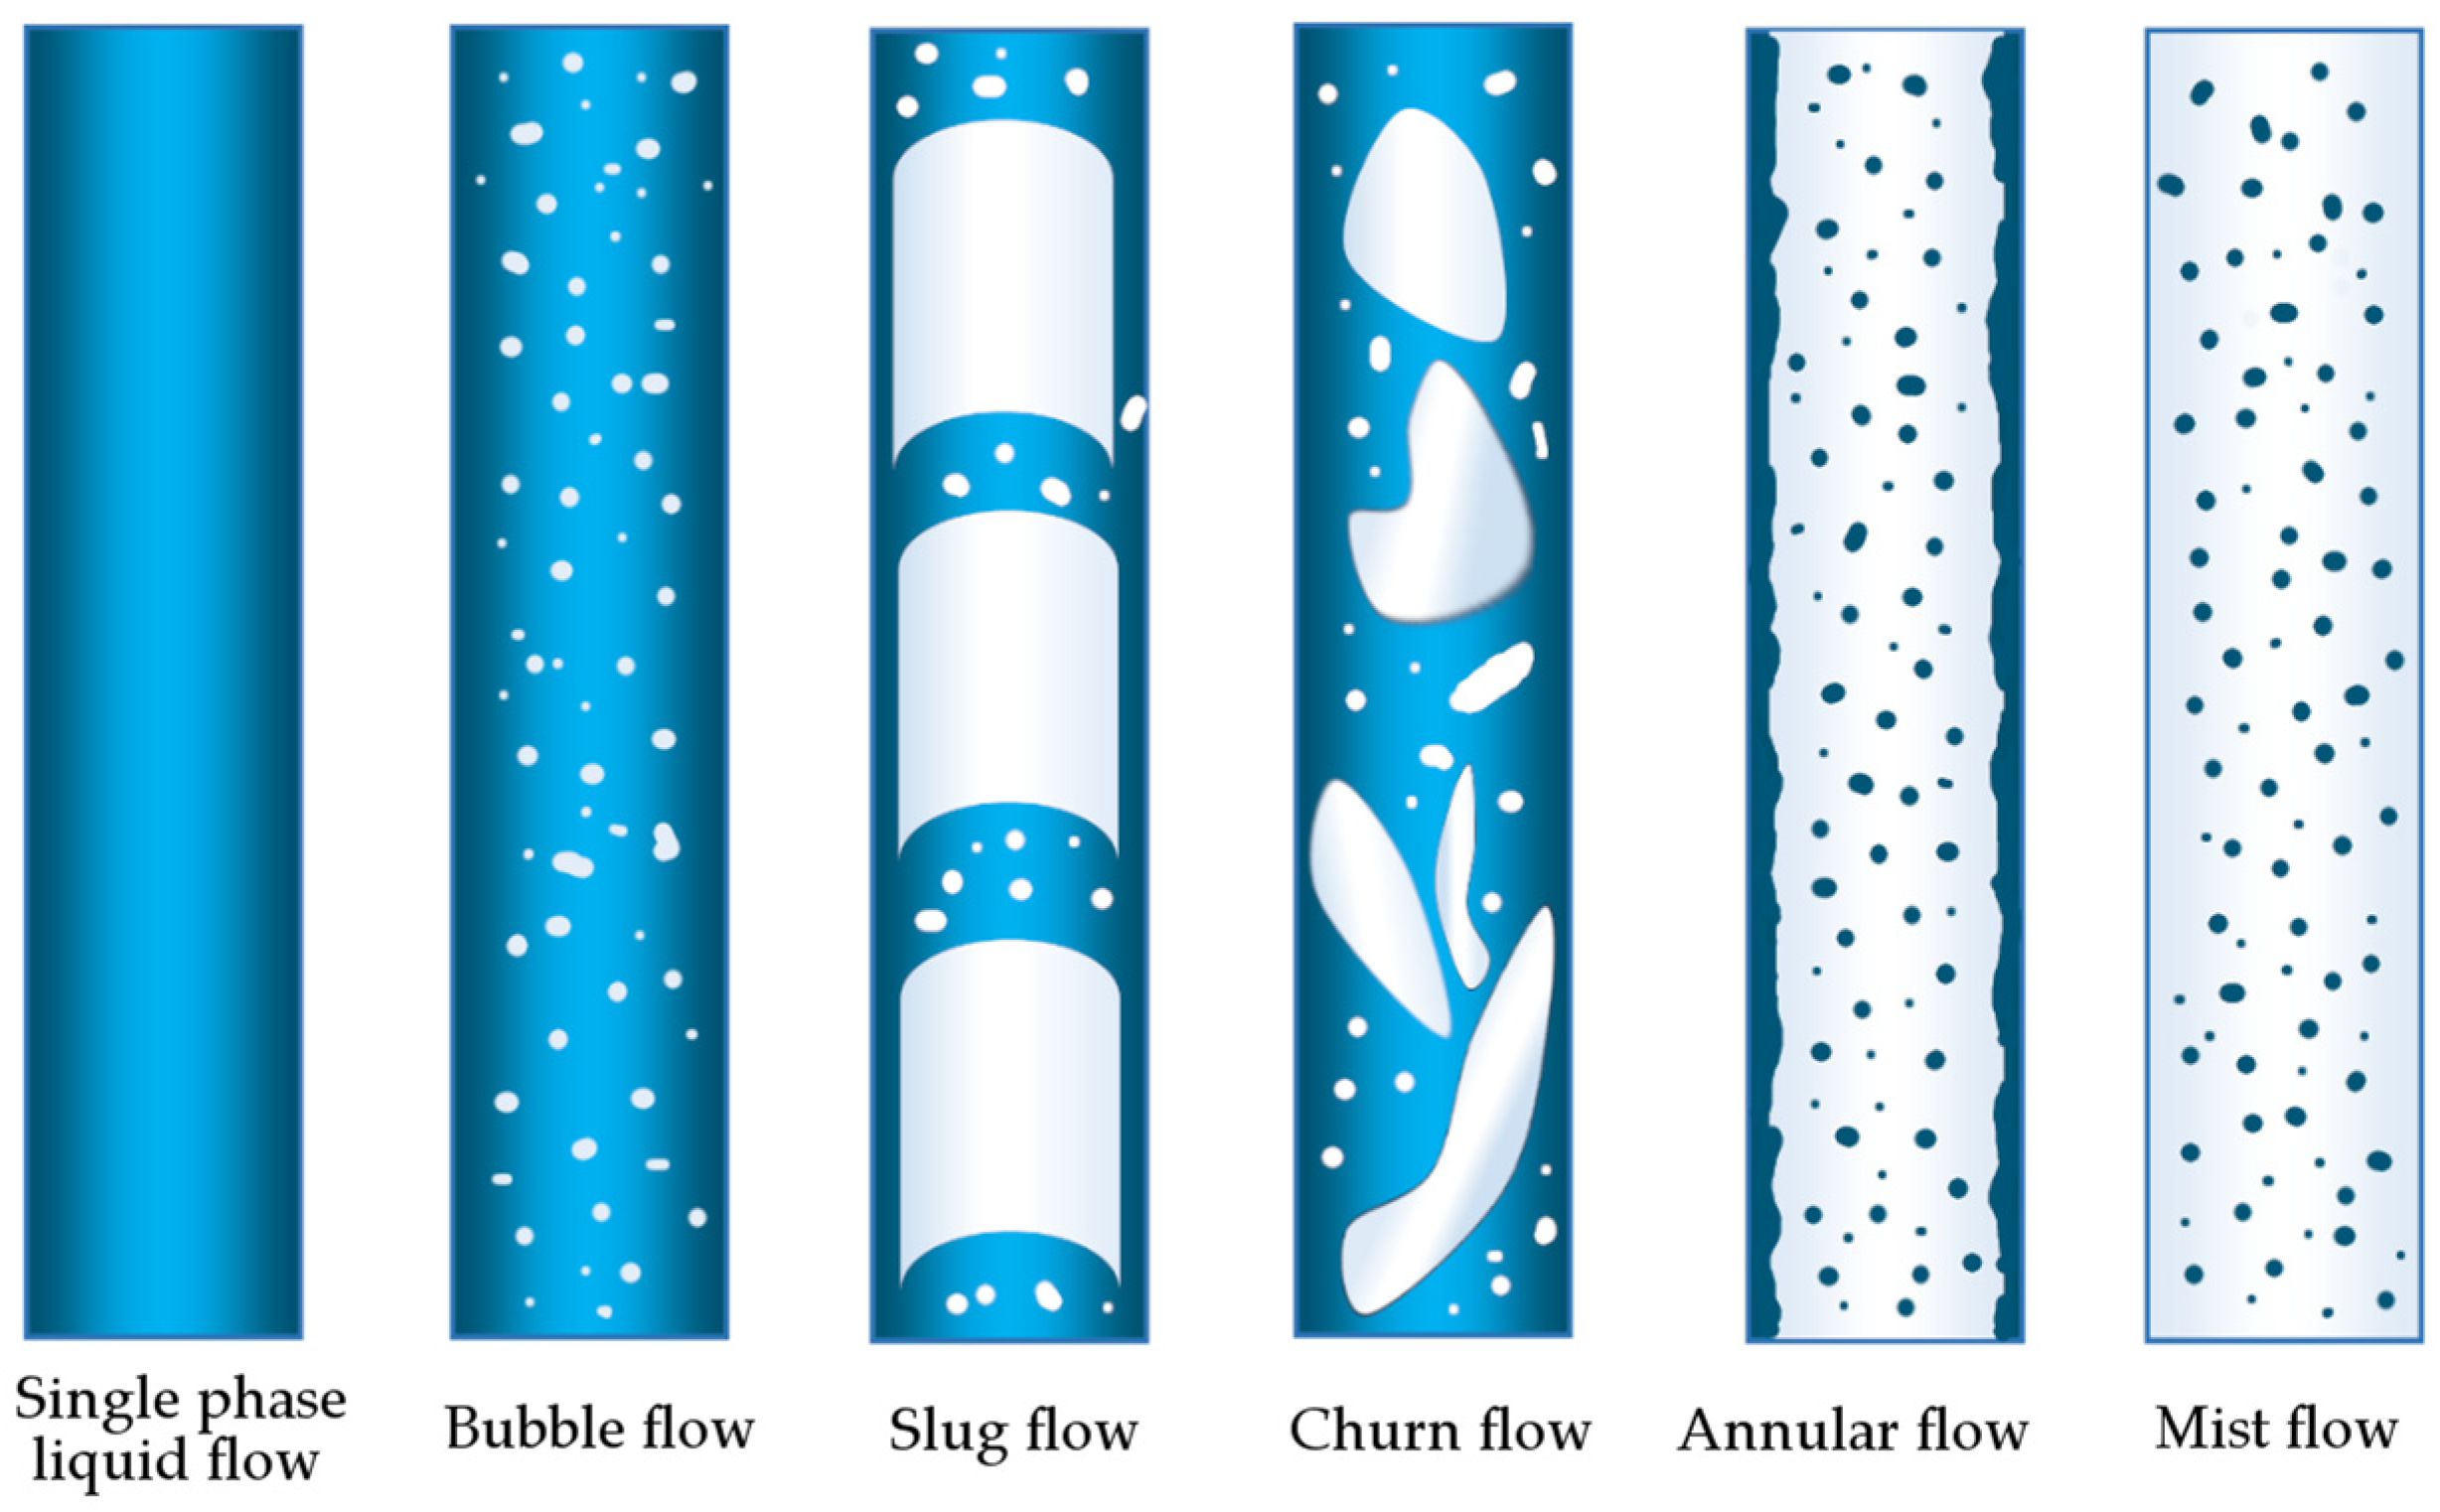
  • annular flow occurring at high gas velocities, where the gas is in a continuous phase, and the liquid is present as dispersed droplets in the gas and a thin film on the pipe wall;
  • mass flow, occurring at lower gas velocities, where the flow changes from a continuous gaseous phase to a continuous liquid phase, implying a transition to a return flow where the liquid film reaches a certain point and starts to flow downwards;
  • slug flow, occurring as the velocity of the gas flow decreases further, during which gas bubbles intermingle with liquid films;
  • bubble flow, occurring at even lower gas flow rates, where the gas is in the form of small bubbles floating in the liquid.
In a gas well, initially at higher gas flow rates, the gas can carry liquid to the surface and an annular flow type can be seen. As the gas flow rate decreases, the stratified flow type changes to a bubbly flow. As a result, the flow becomes irregular and unstable. This phenomenon is called liquid loading, caused by increased hydrostatic pressure in the production pipe, and results in a further decrease in gas flow rate.
It is necessary to restore flow to avoid unstable, turbulent flow and, ultimately, waterlogging of the well. A well-selected foaming agent (surfactant) will raise foam and can often cause foaming, which increases gas flow velocities.
Surfactants mainly affect the transition between annular and effluent flow, which moves downwards with the gas flow rate. When the surfactant concentration is low, this transition is independent of the liquid flow rate and, at low flow rates, the foam has better foaming properties as it is able to stop the decrease in gas velocity and the foam transitioning into the annular flow phase. When the surfactant concentration is high, foam can suppress the flow and there is a direct transition from annular flow to slug flow. The foam also causes large changes in flow morphology. In the transition from annular to mass flow, at low liquid flow rates, the foam that forms breaks up the foam film on the pipe wall and travels in waves up to the top of the column. Finally, at higher agent concentrations, the foam causes the flow to be regular and alternately moves the substrate evenly with slowly upward-moving slugs. The morphology of the liquid film and the entrainment and deposition of droplets at the liquid interface are key to understanding the transition between annular and churned gas-water flow regimes. The addition of surfactants causes a static and dynamic change in surface tension and enables the formation of stable foam [11,25,26].
Conducting laboratory studies on the effectiveness of surfactants in the context of foaming and lifting of reservoir water from an installation simulating a producing well, which has been tested under industrial conditions, has made it possible to identify which agents can effectively improve the exploitation of a particular type of natural gas reservoir, and at what quantities.

2. Materials and Methods

2.1. Materials

The study material consists of formation waters isolated in separators of wells (A, B, C, and D) operating in the Polish Lowlands. These wells are used for production from natural gas reservoirs. For testing, tap water was also used as impurity-free water. The formation waters studied are characterised by varying degrees of mineralisation and content of organic components (Table S1). The pH of the waters was determined at pH 5.5–7.2, and the values of the oxidation-reduction potential (Eh) ranged from −111.6 to +260 mV. The varying content of organic substances is evidenced by the values of such water parameters as COD(Cr), TPH (Total Petroleum Hydrocarbons), and the content of organic substances extracted with dichloromethane. In the formation waters studied, the determined indicators of oxygen demand COD(Cr) (10,160–42,792 mg O2/dm3) and TPH content (2.2–142.0 mg/dm3) testify to the presence of substances with reducing properties. The waters vary considerably in the degree of mineralisation (100,760 to 311,664 mg/dm3) and in the content of organic matter, which was extracted from the waters with dichloromethane in amounts ranging from 6.0 mg/dm3 (well C) to 158 mg/dm3 (well D). The undissolved content of the formation waters studied ranges from 34 to 222 mg/dm3. The determined contents of chlorides, calcium, and magnesium correspond to the degree of mineralisation of the waters. Their highest contents were determined in waters with the highest degree of mineralisation. Different contents of total iron and manganese were determined in the waters studied (Fe: 54.3–157.9 mg/dm3, Mn: 10.2–29.4 mg/dm3).
Natural gas was also taken from the wells under study and analysed chromatographically to determine its composition. The results are shown in Table S2. This gas was used to foam water during laboratory tests.
To perform formation water foaming tests, surfactants in the form of foaming sticks with the following commercial names were used:
  • BioLight 30/380—stick containing ethoxylated C16-18 alcohols as non-ionic surfactants, d (25 °C) = 0.800 g/cm3, held on the water surface;
  • BioFoam 30—stick containing ethoxylated C16-18 alcohols as non-ionic surfactants, d (25 °C) = 1.100 g/cm3;
  • BioCond 30—stick containing non-ionic and amphoteric surfactants, the main ingredient being (2-hydroxy-3-sulfopropyl)dimethyl [3-[(1-oxododecyl)amino]propyl]ammonium hydroxide, d (25 °C) = 1.100 g/cm3, recommended for foaming waters with high condensate content;
  • BioAcid 30/380—stick whose main ingredient is amidosulphonic acid (60%) (non-ionic surfactant) with the addition of a corrosion inhibitor, d (25 °C) = 1.400 g/cm3;
  • BioCond Plus 30/380—non-ionic and amphoteric surfactant-based stick, whose main ingredient is (2-hydroxy-3-sulfopropyl)dimethyl[3-[(1-oxododecyl)amino]propyl]ammonium hydroxide (15%), d (25 °C) = 1.120 g/cm3, recommended for foaming waters with a high hydrocarbon condensate content.
The choice of surfactants for the experiment was based on their commercial availability. The criterion for selecting surfactants was the high foaming of the tested formation waters containing petroleum derivatives (Table S1).

2.2. Methods

2.2.1. Analysis of Formation Waters

Physical and chemical analyses of the selected formation waters were carried out using the following equipment: pH-metre 330i (pH, oxidation-reduction potential), Radwag WAA 220/C/2 analytical balance (dissolved and undissolved substances), and Lambda 365 UV-VIS spectrophotometer (sulphate, iron, manganese). Petroleum contamination (TPH) was determined by solvent extraction with dichloromethane, which was carried out in three runs (20 mL solvent, 15 min). Polar substances were removed by filtration through Florisil-filled Bakerbond columns. The solvent was evaporated in a vacuum rotary evaporator, and the extract was dissolved in 1 mL of dichloromethane and analysed by gas chromatography (GC). Analysis of the extracted petroleum contaminants, including quantification of their total content, was performed on a PerkinElmer Clarus 500 Gas Chromatograph (GC) with an RT-1 capillary column (30 m × 0.53 mm) from Restek. Chromatograph operating parameters: FID detector temperature = 300 °C, PPS injector temperature = 250 °C, carrier gas—helium (15 mL/min), temperature programme: 28 °C—isothermal run for 1 min, 28–250 °C—temperature rise 10 °C/min, 250 °C—isothermal run for 20 min. A set of calibration standards from Tusnovic Instruments was used to quantify total petroleum contaminants (TPH) (certified standard: BAM K010) [27].
Surface tension measurements of water at the boundary with air were carried out using a PAT-1 apparatus from the German company Sinterface Technologies, which is a laboratory tensiometer. This version of the apparatus is mainly designed for analysis of the hanging drop profile of homogeneous liquids. The instrument is computer-controlled using the SINTERFACE software (ver. 8.02, Berlin, Germany). Once the calibration procedure was in place, the solution was analysed and the result was the arithmetic mean of 10 repetitions [28,29].

2.2.2. Natural Gas Analysis

Analysis of the natural gas composition was performed using a Perkin Elmer Clarus 680 GC equipped with a capillary injector with a dosing loop, a furnace chamber (programmable temperature run: 35 °C—isothermal run for 12 min, 35–175 °C—temperature rise of 8 °C/min, 175 °C—isothermal run for 5 min) with an effective cooling system, multi-way valves, a set of capillary columns, a mechanized (temp. 8 °C/min, 175 °C—isothermal run for 5 min) with an effective cooling system, multi-way valves, mechanized (400 °C), a set of capillary columns, gas flow controllers, FID detectors (250 °C)—determination of carbon dioxide and hydrocarbons except methane, and TCD (200 °C)—determination of helium, nitrogen and methane, as well as feed gases (hydrogen, argon, air, nitrogen). The chromatographic system was computer-controlled using Turbo Chrom software (Perkin Elmer, Norwalk, CT, USA), which also allows the collection and processing of analytical data.

2.3. Experimental Procedures

2.3.1. Tests Under Laboratory Conditions

Studies of the effect of foaming agents on the lift of the liquid phase from gas wells were carried out under laboratory conditions on a test rig set up to simulate a gas well. The experimental set-up (Figure 2) consisted of a vertical column 8 m high, with an internal diameter of 7 cm and a wall thickness of 1 cm. The column was fitted at the bottom with a window for the placement of the surfactant to be tested, as well as valves for the introduction of barbotic gas and test water. The test water (0.35 dm3) was fed into the test column using a high-pressure pump. Gas was then connected to the system with a flow rate of 6.5 dm3/min.
The foaming propensity of the liquid was determined by the volume of foam formed during aeration and the rate at which it disappeared. The method of determination involved blowing air through the liquid sample at a constant speed. The test was conducted for 20 min. The temperature in the test column was 20 °C. During the measurement, the volume of foam formed was measured and its rate of disappearance was determined. The volume of foam was read from a graduated receiver, while the volume of water extracted from the system was read from the difference between the recorded levels of water introduced into the test column and the water in the receiver at the end of the test, when the water surface was free of foam.
During formation water foaming tests, carried out successively with surfactant doses of 1.5, 3.0, and 5.0 g/m3, the following measurements were taken: water surface tension, the volume of foam generated as a function of time, and foam formation water. The surfactant dose was selected based on the lowest possible concentration at which water foaming occurs. The upper surfactant concentration could not exceed the critical micellar concentration (CMC), i.e., the concentration above which no further reduction in the surface tension of the solution is achieved.
When the surface tension of a solution is measured as a function of surfactant concentration, a concentration will be reached when no further reduction in surface tension will be obtained. This concentration is known as the critical micelle concentration (CMC) [19].
As a selection criterion for the effectiveness of surfactant for the tested water, its effective lift in the foam structure from a system simulating a waterlogged gas well and the degree of minimisation of the dose of surfactant introduced into the water were chosen.

2.3.2. Tests Under Well Conditions

Surfactants selected on the basis of laboratory tests were used for the dewatering of boreholes operating in natural gas wells. The criterion for the selection of effective surfactants was the effective lifting of formation waters in the form of foam from waterlogged gas wells, while minimising the dose of foam agent introduced.
In the first stage of the testing, research was conducted to determine the time taken for water to be effectively removed from the borehole. For this purpose, surfactants in the form of sticks were introduced sequentially into the gas well, each time monitoring the time taken to lift water in the foam structures as well as the pressure in the borehole. The introduction of the sticks into the well was performed through an airlock mounted on the well head. The stick reached the bottom of the well through gravity, where it began to dissolve in contact with the formation water. This reduced the surface tension of the water, which led to an increase in gas flow, thereby rebuilding the pressure in the well. The borehole held water until the stick dissolved. Depending on the properties of the formation water and the type of stick, it took between 4 and 14 days for the stick in the tested wells to dissolve. During this time, an increase in natural gas production was achieved as well as significant volumes of foamed formation water.
In parallel, monitoring of operational parameters was carried out, based on which the effectiveness of the foaming agents used to improve the exploitation of the natural gas reservoir was established.

3. Results and Discussion

3.1. Laboratory Tests

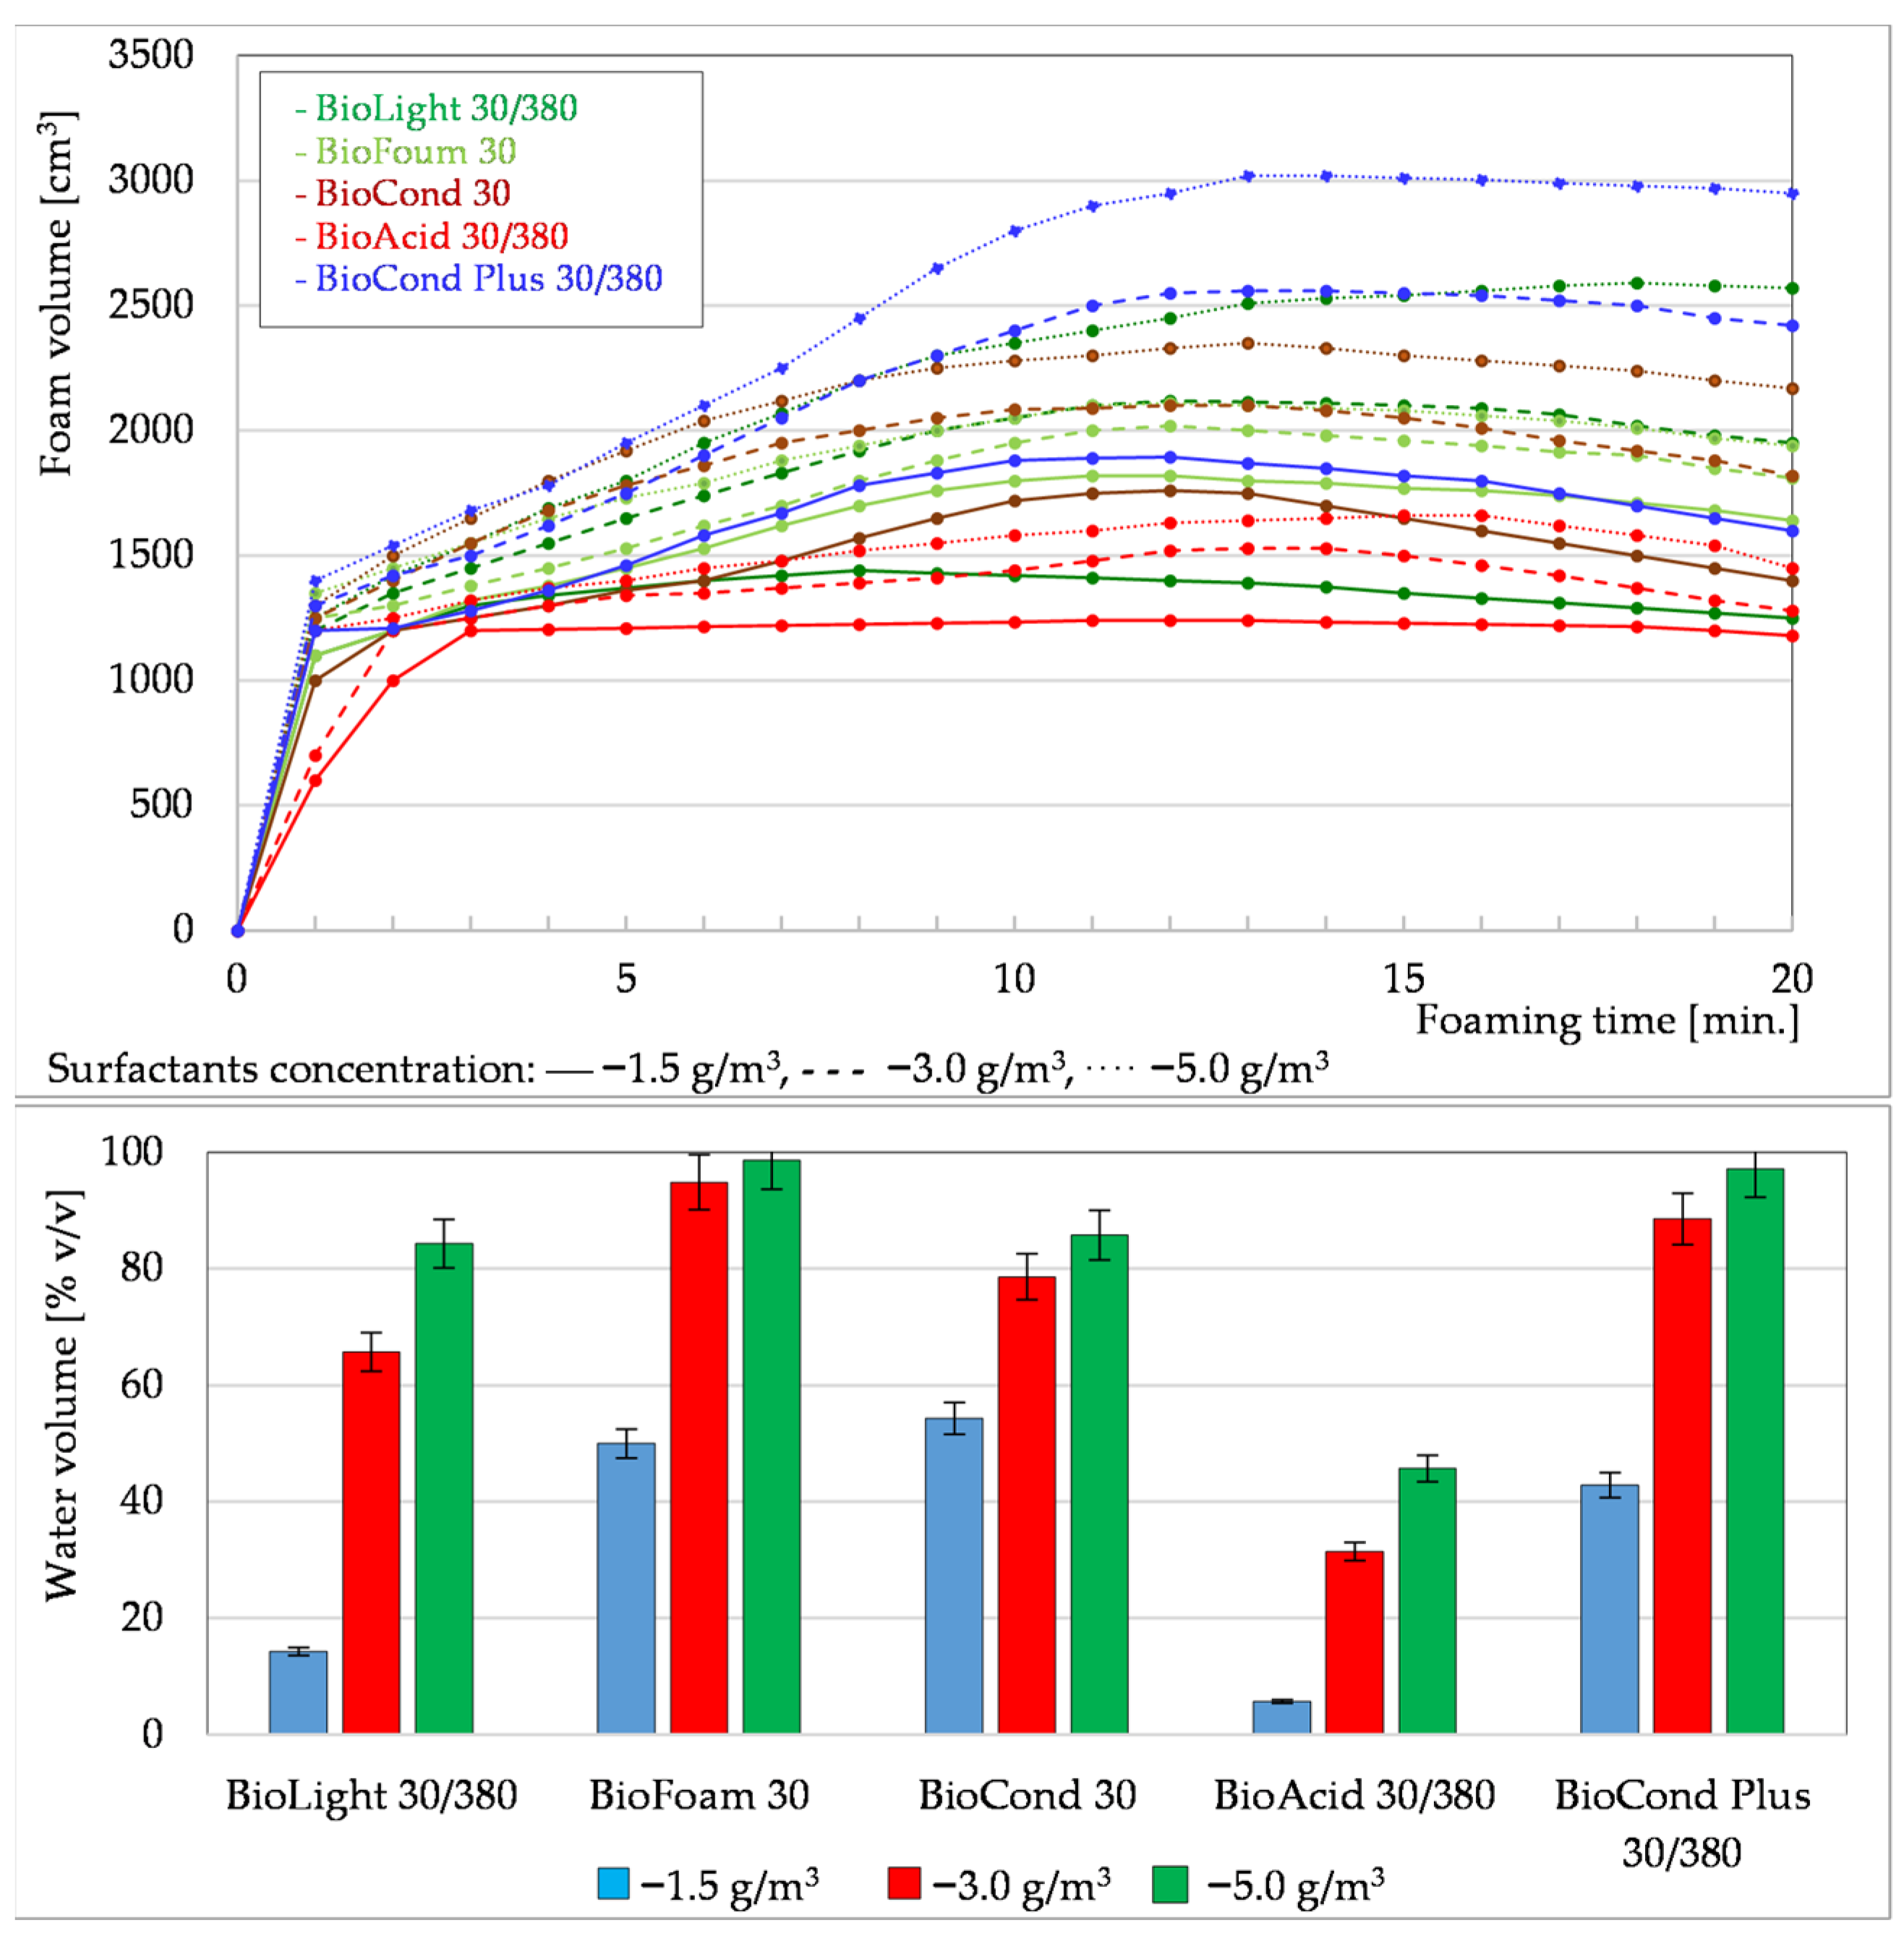
3.1.1. Foaming Tests of Formation Waters Using Surfactants

The results of foaming tests of formation waters taken from wells A, B, C, and D, and domestic water using surfactants (BioLight 30/380, BioFoum 30, BioCond 30, BioAcid 30/380, and BioCond Plus 30/380) are illustrated graphically in Figure 3, Figure 4, Figure 5, Figure 6 and Figure 7. The volumes of water removed from the tested systems, shown in Figure 3, Figure 4, Figure 5, Figure 6 and Figure 7, allowed the tested surfactants to be ranked, according to their effectiveness: BioAcid 30/380 < BioLight 30/380 < BioCond 30 < BioCond Plus 30/380 < BioFoam 30. The surfactants BioCond Plus 30/38 and BioFoam 30 show high foaming potential. The foaming of water using them at concentrations of 3.0 and 5.0 g/m3 resulted in a rapid increase in foam volume over time.
During extraction operations, excessive foaming and prolonged persistence of foam in the gas stream can cause interference with surface equipment and control and measurement systems. Foaming tests carried out on formation water from wells A, B, and C, and tap water, using BioFoum 30 and BioCond Plus 30/380 at a concentration of 1.5 g/m3 showed that, after a 20 min test period, 34.3–68.6% of water was removed from the system simulating a waterlogged well.
Foam removal tests conducted with BioLight 30/380 and BioCond 30 showed that, at doses of 1.5 g/m3, after 20 min of testing, they resulted in the removal of formation water from the system simulating a waterlogged well in the range of 14.3–77.1%. Significantly better formation water removal was achieved with higher foaming agent doses of 3.0 and 5.0 g/m3. The volumes of extracted solutions obtained after 20 min of testing were in the range of 60.0–85.7%. The lifting effect, in a foam structure, of formation waters foamed using the least effective agent, BioAcid 30/380, was negligible, as only 1.4–20.0% by volume of the solution was collected at a dose of 5.0 g/m3, after 20 min of testing (Figure 3, Figure 4 and Figure 5).
Aminosulfonic acid, a component of the BioAcid 30/380 foaming sick, is insoluble in hydrocarbons. The presence of petroleum derivatives in the tested formation waters limits its solubility, which results in slight foaming.
In the case of the foaming agent BioCond Plus 30/380, which showed very good foaming properties for formation water from well B, as also confirmed by the surface tension results of the tested solutions, it is characterised by an extended extinction time of the foam, the structure of which does not contain much water. The volume of water after foam decomposition is lower (at the same foaming agent concentrations, respectively), compared to the foaming agents BioLight 30/380, BioFoam 30 and BioCond 30.
Foaming tests carried out on the formation water from well D to remove it from the well, simulating reservoir conditions at the surfactant doses used, were ineffective. The formation water from well D was very difficult to foam, resulting in no foam of the volume required to leave the column. The formation water taken from the separator of well D had a high oil content (Table S1), which made it difficult to foam with the surfactants used. The literature states [30,31,32] that extreme water parameters, such as high condensate content and high salinity, slow down the foaming agents. Typically, mixtures of different foaming surfactants are used to achieve high performance under these extreme conditions.
Figure 7 shows the foaming efficiency results of domestic water with the tested surfactants. The study was conducted to compare the foaming efficiency of highly mineralised water containing organic substances (formation water) with low-mineralised water. The data presented show that low-mineralised domestic water, free of organic impurities, is much easier to remove in a foam structure from a system simulating a waterlogged gas well.
During the 20 min, test conducted with different surfactants, the recorded water removal effect was dependent on the surfactant concentration of 1.5, 3.0, and 5.0 g/m3, and ranged from 5.7–54.3% by volume; 31.4–94.9% by volume; and 45.7–98.6% by volume.
Due to the complexity of foam formation, its intensity and stability are determined, in particular, by the composition of the continuous liquid phase (type and concentration of surfactant, salinity of formation water, pH, presence of hydrocarbons, etc.) [33,34,35,36,37].

3.1.2. Measurement of Surface Tension of Solutions

In parallel with the formation water foaming tests carried out using selected surfactants, the surface tension of the obtained solutions was also measured. Table 1 shows the surface tension values of the individual surfactant solutions and the tested waters. From the data presented in Table 1, it can be seen that the addition of surfactants to the solutions lowers their surface tension, thereby increasing their foaming potential. This effect was confirmed in studies cited in the literature [38,39]. The surface tension of the studied waters is in the range of 65.8–72.6 mN/m. The introduction of foaming agents to the formation waters resulted in a slight decrease in its volume.

3.1.3. Summary of Foaming Tests Carried Out Under Laboratory Conditions

Summarising the results of the formation water foaming tests carried out under laboratory conditions, it should be stated that high potentials for removal of water from the individual tested gas wells were observed as follows: for formation water from well A—BioLight 30/380 at a concentration of 5.0 g/m3, and BioFoam 30, BioCond 30, and BioCond Plus 30/380 at a concentration of 3.0 g/m3; for formation water from well B—BioLight 30/380, BioFoam 30, BioCond 30, and BioCond Plus 30/380 at concentrations of 3.0–5.0 g/m3; for formation water from well C—BioLight 30/380 and BioCond Plus 30/380 at concentrations of 3.0–5.0 g/m3 (Figure 3, Figure 4, Figure 5 and Figure 6, Table 1).
During its operation, a gas well can experience any or all forms of flow. During laboratory tests of foaming formation water and its subsequent removal from a column simulating a producing well, all types of foaming flow were recorded, depending on the type and concentration of surfactant dissolved in the formation water and the gas flow rate (Figure 8).
At high gas velocities, annular flow occurs, in which the gas is a continuous phase, and the liquid occurs as a layer on the pipe wall and as dispersed droplets in the gas core. Two types of waves occur at the liquid layer boundary. Pulse waves—these are small capillary waves that continuously form and disappear. The second type of waves are rolling waves, which are much larger inertial waves that are continuous around the circumference of the pipe and consistent over a long distance. These waves make the dominant contribution to interfacial friction between the gas and liquid phases and are the largest cause of the entrainment of droplets into the gas core. In annular flow, the liquid film is constantly moving upwards. As the gas velocity decreases, at some point the liquid film starts to move downwards, intermittently. This marks the transition to mass flow. As the gas velocity decreases further, large, aerated waves appear that carry the fluid upwards. Behind these waves, the liquid film first moves upwards, then retreats and flows into the next wave. The morphology of the liquid film in mass flow with these waves is much more irregular than in annular flow, and the liquid film in mass flow contains many bubbles and droplets. At even lower gas flow rates, there is a transition to slug flow, in which large bubbles are interspersed with liquid fragments. As the gas flow rate decreases further, bubble flow occurs, in which dispersed bubbles are present in a continuous liquid phase [40,41].
The surfactant-induced foam formation causes large changes in the flow morphology in the liquid–gas system, as illustrated in Figure 8. When surfactants are added, a large volume of foam is formed, as a result of the strong mixing of the liquid phase in the mass flow and a foam substrate, i.e., a film of foam near the wall is formed (Figure 8A). This substrate is stationary or moves slowly downwards, effectively reducing the surface velocity of the gas, during the transition between annular and mass flow. The liquid is transported upwards together with the foam waves moving across the substrate. The frequency of the waves and the number of foam ligaments formed depend greatly on the flow rate of the liquid. At low gas flow rates, during mass flow, the gas-water flow is almost independent of the liquid flow rate. The film increases its mass, and an increased formation of multiple droplets and bubbles is observed at the interface. Between the resulting waves, the liquid film moves downwards along the wall (Figure 8B). At high gas flow velocity and low liquid flow, the waves present in the system cause a slight mixing of the liquid (Figure 8C). The introduction of surfactant only leads to the formation of a small amount of foam on the crests of these waves. At high flow velocities (Figure 8D) of gas and liquid, the water-gas system exhibits annular flow, and the waves have a much more complex morphology than those occurring at lower flows. They cause bubbles to form at the gas-water interface, leading to the formation of foam at the annular.
A decision to use a technology that involves the creation of foam from the formation water and then removing it from waterlogged gas wells should be preceded by testing under laboratory conditions. Given the multiplicity of types of commercially available surfactants and the unknown nature of their interaction with formation waters of various physical and chemical parameters, such as mineralisation or the presence of hydrocarbons, conducting foaming tests on formation waters from a dewatering well enables their selection for effectiveness. This is in order to select the optimum type and concentration of surfactants for use under field conditions.

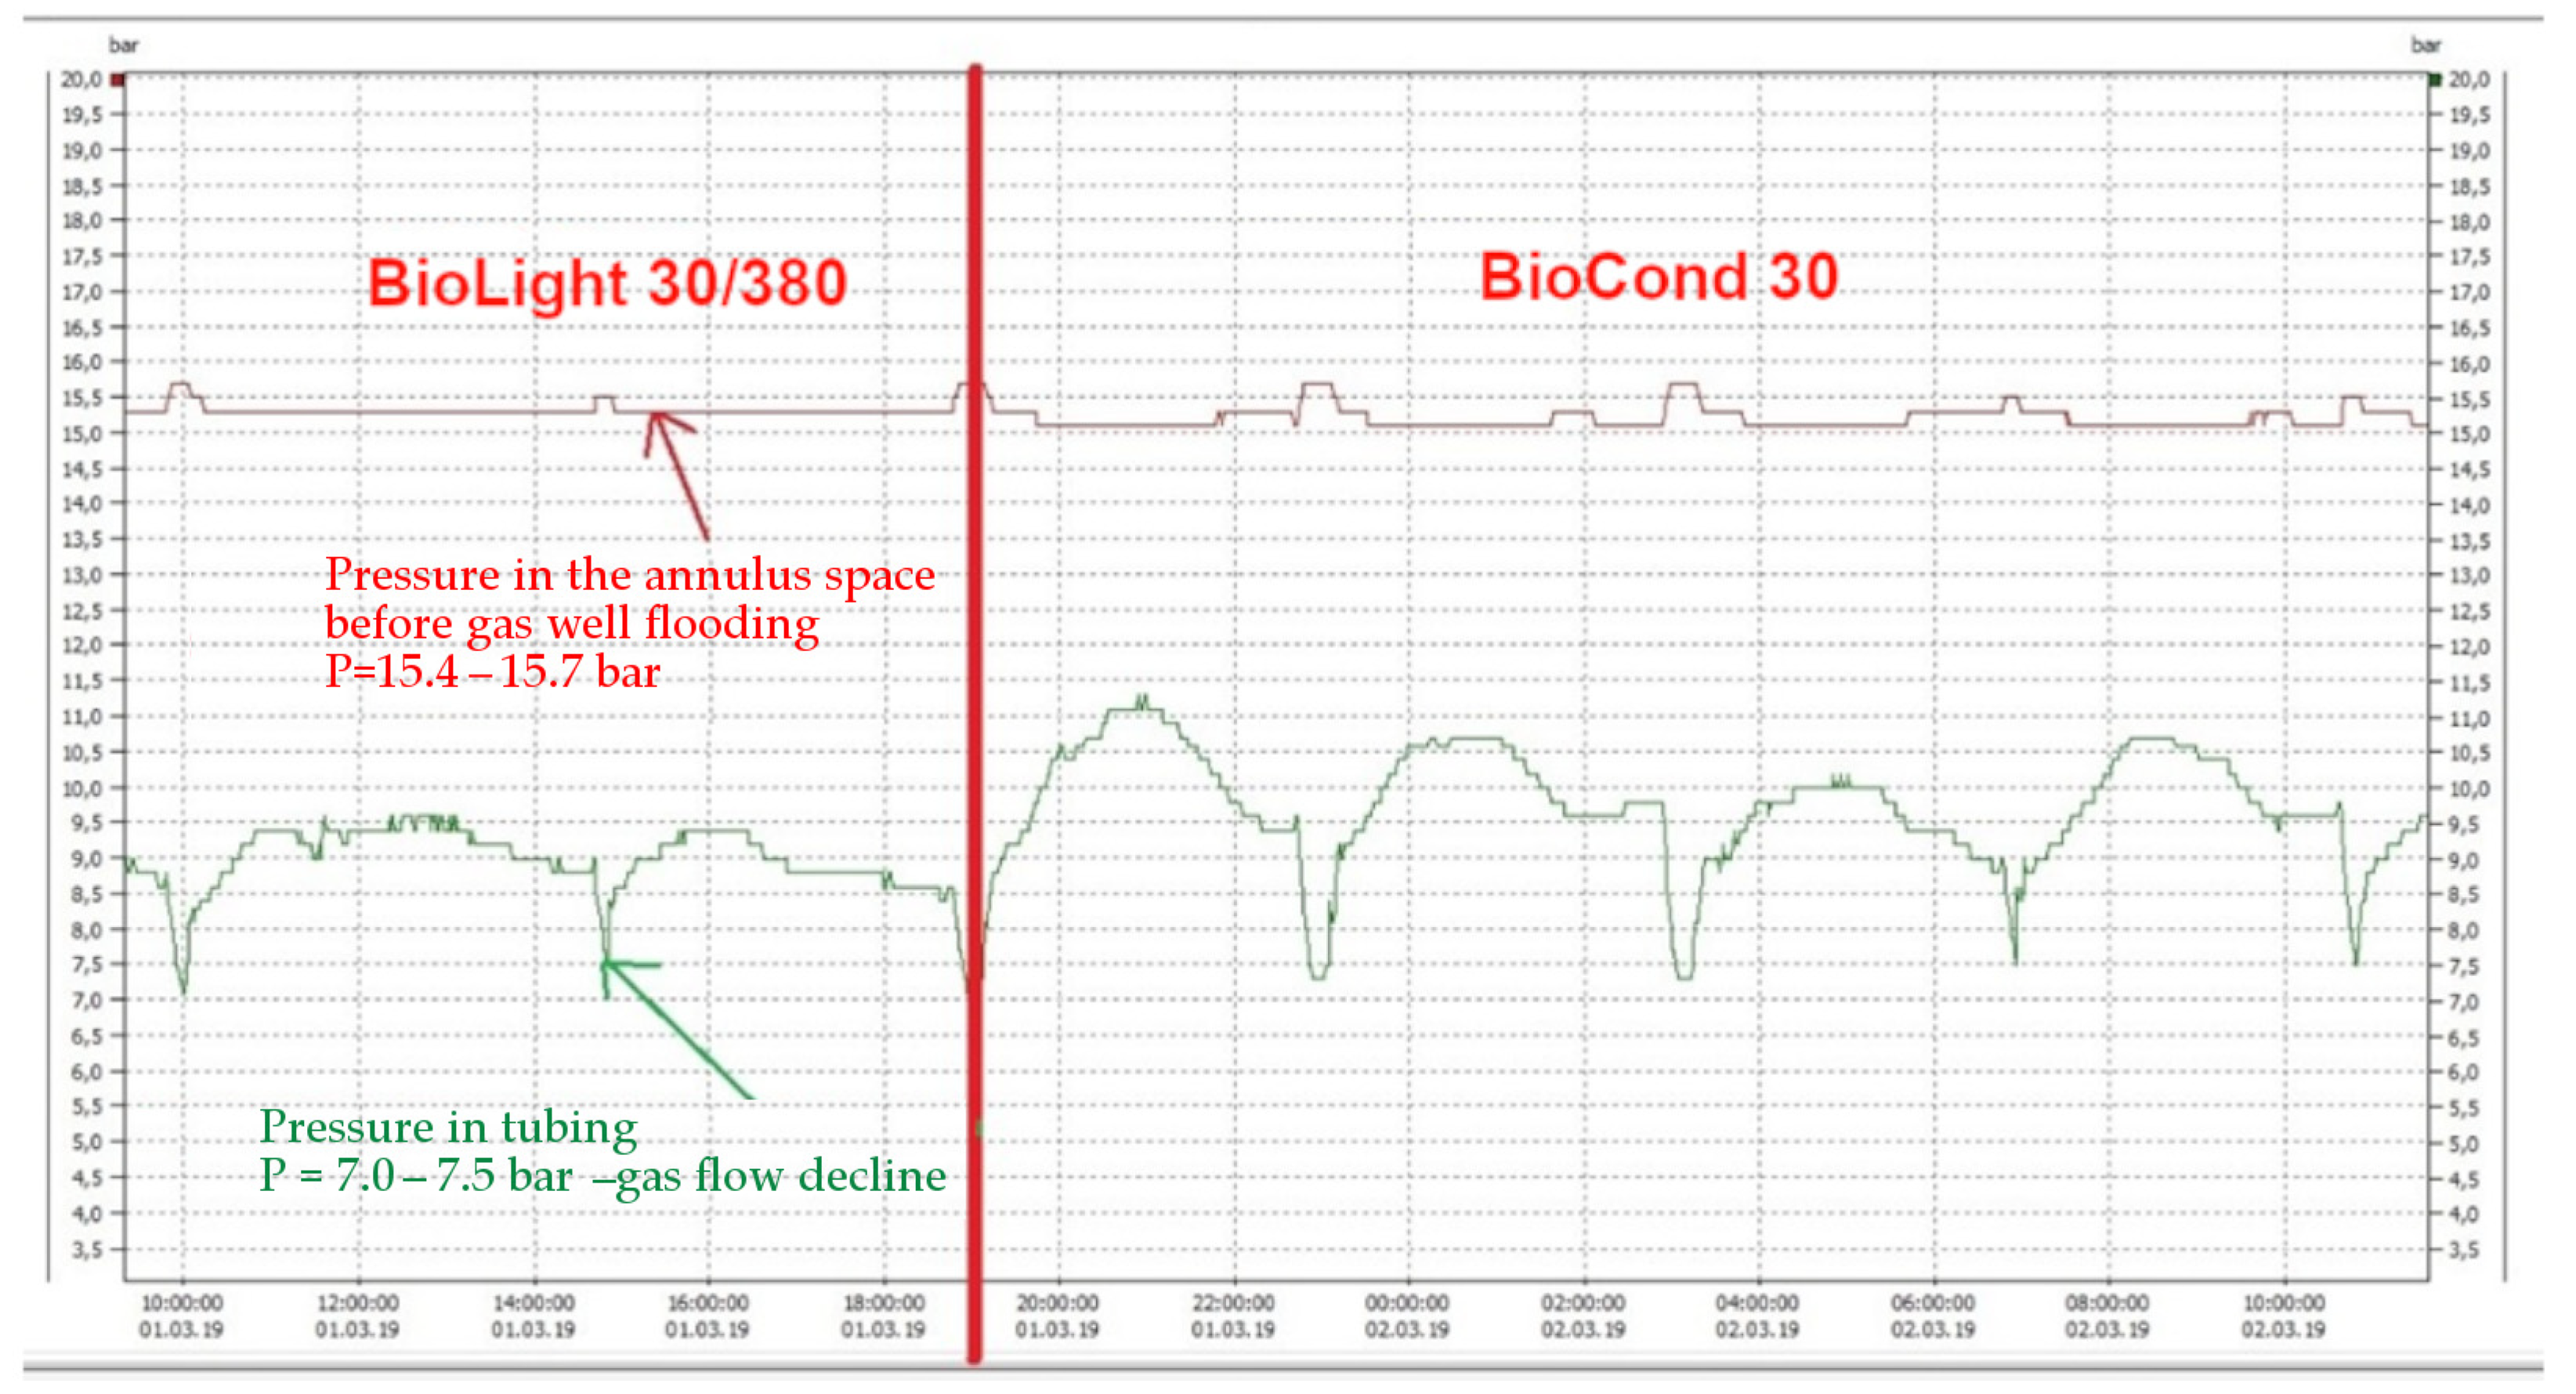
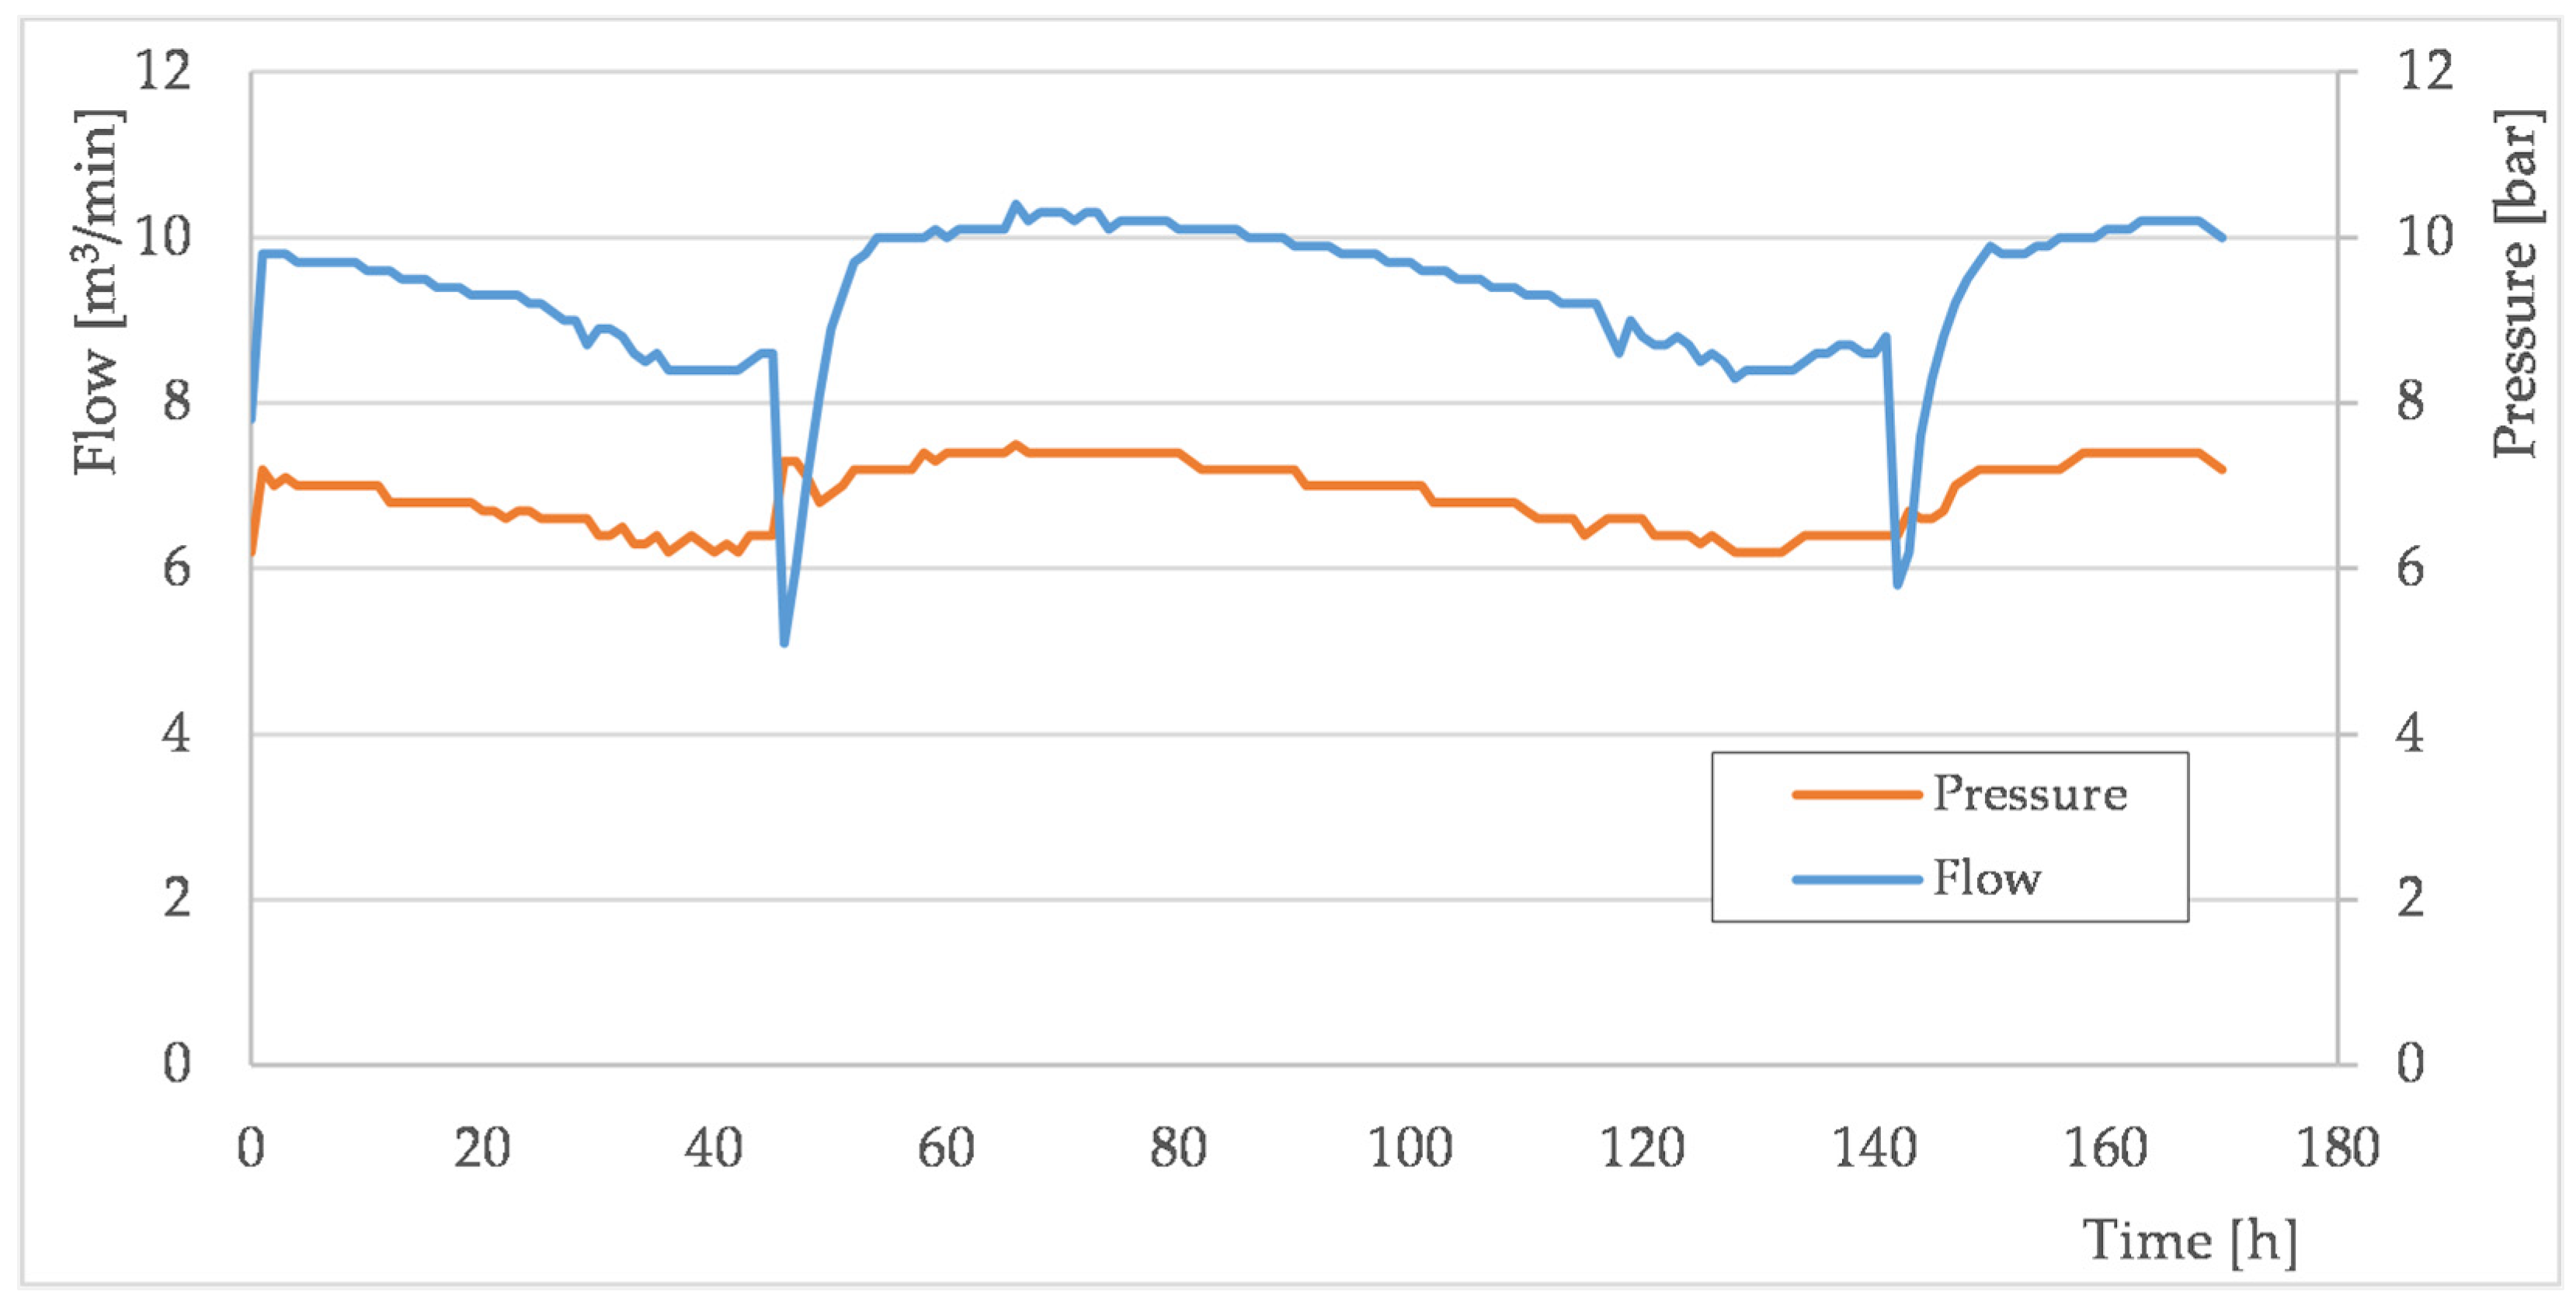
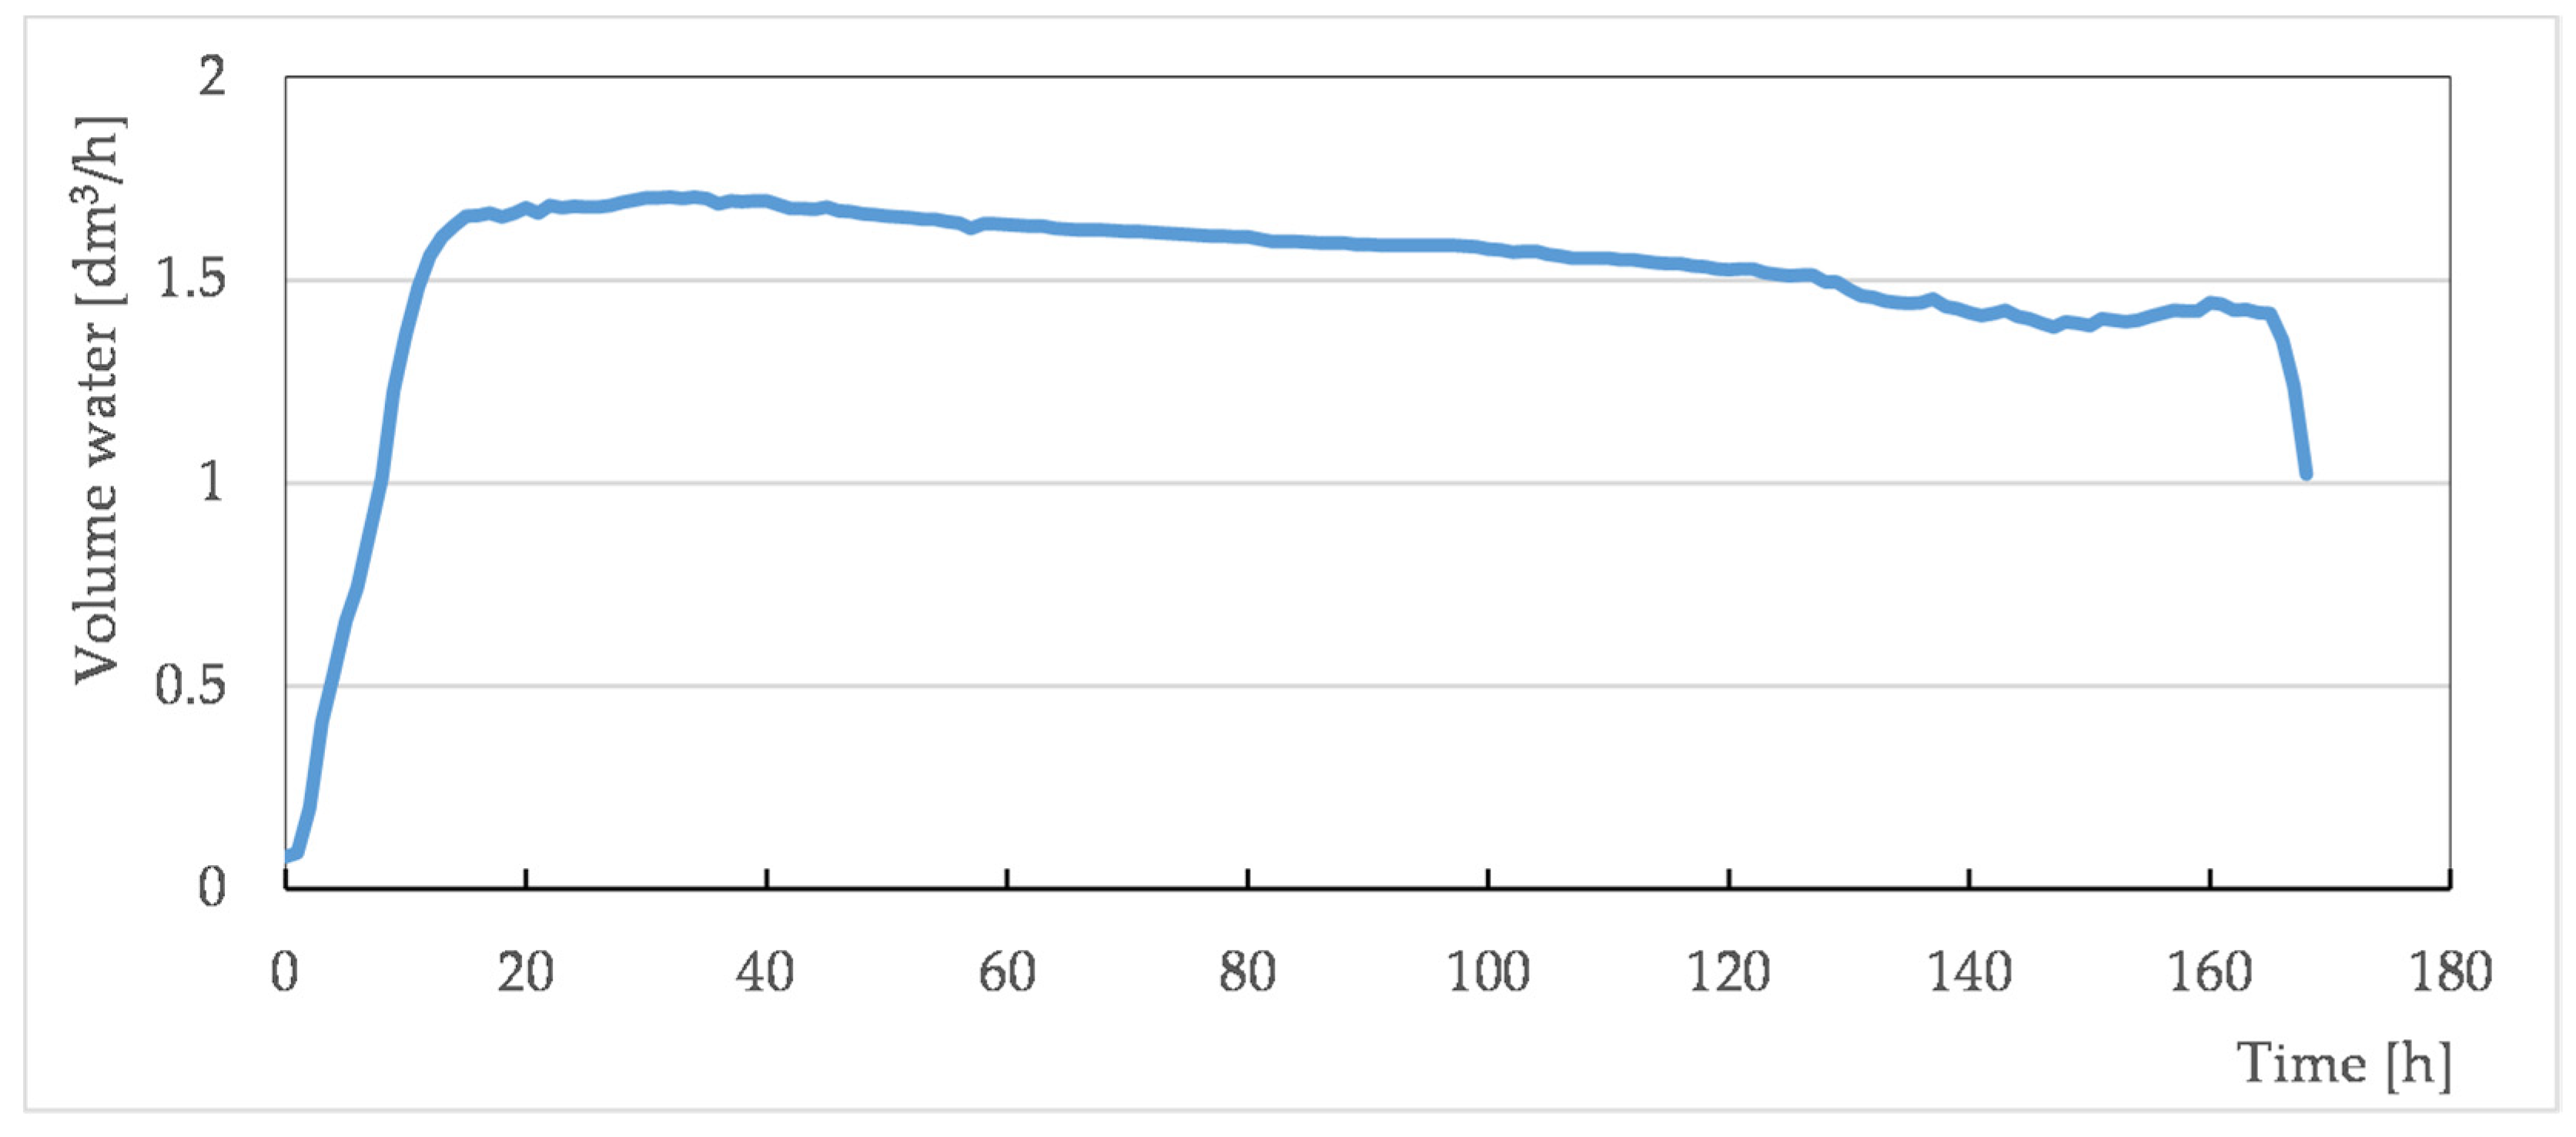
3.2. Well Tests of Formation Water Foaming Using Surfactants

Tests to remove water from waterlogged wells were carried out at natural gas extraction facilities. Surfactants in the form of sticks were introduced into the wells (A, B, and C). The wells were filled with surfactants selected based on laboratory tests: well A—BioFoum 30, well B—BioFoum 30, and well C—BioCond Plus 30/380. Due to the fact that only borehole C was equipped with specialist measuring devices, it was selected for performing preliminary tests of effective water removal from the borehole using two selected foaming sticks. Table S3 shows the parameters of the measuring system. Based on the results of water removal efficiency tests with selected surfactants conducted in a laboratory-simulated production column, the foaming agents BioLight 30/380, BioFoam 30, BioCond 30, and BioCond Plus 30/380 were selected for field testing.
Figure 9 shows an example of a pressure diagram during the subsequent introduction of foaming agents (BioLight 30/380, BioCond 30) into the well.
The tested sticks recovered pressures from 9 bar to 9.6 bar (BioLight 30/380) and up to 11.6 bar (BioCond Plus 30/380). The effect of the BioLight 30/380 stick is reduced after 3.5 h, and that of the BioCond 30 after 4.5 h. Based on the tests carried out, BioFoum 30 and BioCond Plus 30/380 were selected for long-term removal of water from waterlogged wells (Table 2).
Long-term water removal tests from waterlogged wells A and B were carried out using the BioFoum 30 stick, while for well C, the BioCond Plus 30/380 stick was selected as the best. Table 2 summarises selected operational parameters of the wells where water removal tests were carried out. The volumes of water extracted from each well refer to the average daily values obtained during the test.
Figure 10 shows the gas flow and pressure values prevailing in well C during water removal tests using the BioCond Plus 30/380 stick.
Introducing the BioCond Plus 30/380 stick into well C increased the well pressure and gas flow. Figure 10 shows the pressure and gas flow values during the 168 h of the well dewatering process. When a stick was inserted into the well, the pressure increased from 6.2 to 7.4 bar and the gas flow increased from 7.8 m3/min to 10.3 m3/min. The reading from the graph shows a duration of 168 h for the stick. The sharp decreases in gas flow seen on the graph were due to the increased flow of formation water. No pressure changes were recorded during that time. The water leaving the well in a foam structure flowed into the well separator, where the foam decomposed. Figure 11 shows the flow of water in well C when water removal tests were conducted using a BioCond Plus 30/380 stick.
A flow increase was observed in the well 3.5 h after the surfactant was inserted into the well. It was intense during the initial phase, then remained stable as the stick dissolved. After about 168 h of the process, the stick was completely dissolved and the flow of water in the well decreased. In the final phase of dissolution, the flow still persisted for about 6 h but became increasingly weak. Observing the decrease in pressure, operators should decide to insert another stick into the well to further maintain flow.
The introduction of a surfactant, in the form of a BioCond Plus 30/380 stick, into well C resulted in the stable formation of a foam, which was carrying up in its structure the formation water from the bottom of the well. As a result of this process, the flow rate in the well increased from 8.2 to 10.3 m3/min. The use of the BioCond Plus 30/380 stick for dewatering well C increased gas production by about 79.6%, as well as formation water, the volume of which after 168 h of the process was 252 dm3.
During field testing, only well C could be accurately measured for extraction performance. Such measurements were not possible for the other wells where testing was carried out (A and B), but the operators provided estimated production values determined by means of a venture gas metre. The volumes of formation water extracted were read from the separators of the individual wells. These data are summarised in Table 2.
Removal of formation water from gas wells A and B was conducted by foaming them using BioFoum 30 sticks. The process carried out resulted in an increase in natural gas production in well A from 1.29 to 2.29 m3/min, an increase of 56.3%, while well B showed an increase in natural gas production from 2.99 to 4.15 m3/min (72.0%).
The tests showed that the effective duration of work of the stick inserted into well A was 192 h. The removal of formation water from this well yielded an average of 16 m3 of water per day, which corresponds to 128 m3 of water withdrawn from the well over the 192 h of the test, for one foaming stick.
Tests carried out in well B showed a much longer foaming stick working time of 432 h, during which 306 dm3 of formation water was collected (Table 2).
During the exploitation of a natural gas reservoir, a pressure drop and waterlogging of the well occurs in the final phase, reducing gas production. To improve the lift of formation water accumulated in the well and to achieve economically viable hydrocarbon production, foaming agents are used [42]. These substances dissolve in formation water and reduce its surface tension [43], which increases the foaming of the water and brings it to the surface along with the produced gas, preventing the blocking of the well. This increases the lifespan of the reservoir and thus contributes to the volume of gas produced. The selection of the type and number of surfactants to be used should depend on the properties of the formation water to be extracted [44]. Therefore, an important task undertaken in this work was to conduct detailed studies of the foaming of formation waters with foaming agents under laboratory conditions. The proper selection of agents for a given type of formation water also takes into account the duration of the foam under gas flow conditions. This is of great importance, as excessive foaming or prolonged foam duration in the gas flow can cause interference with surface equipment and control and measurement systems.
The removal of formation water from waterlogged wells by foaming using foaming agents selected during laboratory tests under industrial conditions in natural gas wells confirmed their effectiveness. The water removed from the well in the foam structure resulted in an improvement in the well pressure, which in turn increased the flow of natural gas. This effect was obtained after treatments conducted using a foaming stick with the commercial name BioFoam 30 (wells A and B) and a foaming stick with the commercial name BioCond Plus 30/380 (well C).
The criterion for determining the effectiveness of the surfactant was the lifting of formation water from wells in the foam structure and the increase in natural gas production.
Conducting research and field testing on the selection of effective surfactants to lift formation water out of a reservoir result, in practice, in increased hydrocarbon production from gas reservoirs, as evidenced by the research presented in this paper and literature reports [45,46,47,48].
In light of the research carried out, it can be concluded that the intended objective of the work performed has been fully achieved, and that the result translates measurably into an economic effect in terms of an increase in gas production from the reservoir.

4. Conclusions

Waterlogging of gas wells is a major problem in the production of natural gas reservoirs. One way to prevent excessive fluid accumulation is to apply surfactants to the bottom of the well. These agents reduce the surface tension of the liquid, thereby lowering the minimum critical velocity of the gas required for flow. The resulting foam reduces the density of the fluid and thus the hydrostatic pressure exerted on the bottom of the well and the reservoir. The foam is able to flow as a continuous phase at a lower gas velocity and carry water out of the well. This helps to extend the life of the gas well.
Tests carried out on an apparatus simulating a production column provide valuable guidance in the selection of surfactants for dewatering gas wells. Foaming tests carried out on formation waters with different physico-chemical parameters with surfactants made it possible to select the most effective sticks recommended for use under industrial conditions.
Foaming tests carried out under laboratory and then industrial conditions on formation waters from wells A, B, and C showed high foaming efficiencies: for formation waters from wells A and B, BioFoum 30, and for formation water from well C, BioCond Plus30/380.
The surfactant BioAcid 30/380 showed low foaming efficiency for all waters tested.
In parallel to the formation water foaming tests conducted with surfactants, the surface tension of the tested solutions was measured. This showed that the addition of surfactants to the solutions reduces their surface tension, which increases their foaming potential.
The results of laboratory tests on the feasibility of using surfactants to remove formation water from waterlogged wells show their positive impact in terms of increasing the depletion rate of the hydrocarbon reservoir.

Supplementary Materials

The following supporting information can be downloaded at https://www.mdpi.com/article/10.3390/en17235924/s1, Table S1. Physical and chemical parameters of the tested reservoir waters. Table S2. Natural gas components. Table S3. Measurement system parameters.

Author Contributions

Conceptualization, D.K. and T.S.; methodology, D.K., T.S. and D.B.; validation, D.K. and T.S.; formal analysis, D.K. and T.S.; resources, D.K., T.S., D.B. and P.J.; data curation, D.K., T.S., D.B. and P.J.; writing—original draft preparation, D.K. and T.S.; writing—review and editing, D.K. and T.S.; visualisation, D.K., T.S., D.B. and P.J.; supervision, D.K. and T.S. All authors have read and agreed to the published version of the manuscript.

Funding

This research was financially supported by the Polish Ministry of Science and Higher Education within statutory funding for the Oil and Gas Institute-National Research Institute.

Data Availability Statement

All supporting data have been included in this study and are available from the corresponding authors upon request.

Acknowledgments

The authors acknowledge all the participants and administrators in this study.

Conflicts of Interest

The authors declare no conflicts of interest.

References

  1. Beggs, H.D. Production Optimization Using NODALTM Analysis, 2nd ed; OGCI: London, UK, 2003. [Google Scholar]
  2. Adeyemi, G.A.; Ling, K.; Fadairo, A. Experimental investigation of the impact of soybean oil-derived surfactant as a surface-active agent during gas well deliquification. Pet. Res. 2024. [Google Scholar] [CrossRef]
  3. He, X.; Lei, W.; Xu, X.; Xu, J.; Qiu, J.; Dai, W.; Cui, L.; Ma, J.; Shen, Z.; Li, Y. Gas well deliquification in the presence of high content of condensate: From laboratory to field test. In Proceedings of the SPE Middle East Oil & Gas Show and Conference, Event Canceled. 1–28 December 2021; SPE: Denver, CO, USA, 2021; p. D041S050R001. [Google Scholar] [CrossRef]
  4. Szpunar, T.; Budak, P. Ilościowe ujęcie zagadnienia usuwania wody z odwiertów gazowych. Naft.-Gaz 2012, 1, 27–31. [Google Scholar]
  5. Falkowicz, S.; Dubiel, S.; Cicha-Szot, R. Case studies of water shut-off treatments in oil and gas production wells. Miner. Resour. Manag. 2012, 28, 125–136. [Google Scholar] [CrossRef]
  6. Chang, P.; Bai, B. An improved method of gas well deliquification using supersonic nozzle. Int. J. Heat Mass Transf. 2017, 108, 2262–2272. [Google Scholar] [CrossRef]
  7. Kluk, D.; Steliga, T.; Bęben, D. Badania wpływu środków pieniących na skuteczność wynoszenia wody złożowej z odwiertu. Naft.-Gaz 2023, 79, 420–427. [Google Scholar] [CrossRef]
  8. Li, Q.; Wang, Y.; Wang, Y.; San, J.; Li, Q.; Foster, G. Synthetic Process on Hydroxyl-Containing Polydimethylsiloxane as a Thickener in CO2 Fracturing and Thickening Performance Test. Energy Sources Part A Recovery Util. Environ. Eff. 2018, 40, 1137–1143. [Google Scholar] [CrossRef]
  9. Li, Q.; Zhang, C.; Yang, Y.; Ansari, U.; Han, Y.; Li, X.; Cheng, Y. Preliminary Experimental Investigation on Long-Term Fracture Conductivity for Evaluating the Feasibility and Efficiency of Fracturing Operation in Offshore Hydrate-Bearing Sediments. Ocean. Eng. 2023, 281, 114949. [Google Scholar] [CrossRef]
  10. Duangprasert, T.; Sirivat, A.; Siemanond, K.; Wilkes, J.O. Vertical two-phase flow regimes and pressure gradients under the influence of SDS surfactant. Exp. Therm. Fluid Sci. 2008, 32, 808–817. [Google Scholar] [CrossRef]
  11. Van Nimwegen, A.T.; Portela, L.M.; Henkes, R.A.W.M. The effect of surfactants on upward air–water pipe flow at various inclinations. Int. J. Multiph. Flow 2016, 78, 132–147. [Google Scholar] [CrossRef]
  12. Amani, P.; Rudolph, V.; Hurter, S.; Firouzi, M. Sustainable dewatering of unconventional gas wells using engineered multiphase flow dynamics. Fuel 2022, 324, 124675. [Google Scholar] [CrossRef]
  13. Sun, Y.Q.; Zhang, Y.P.; Liu, Q.W.; Fan, Z.Z.; Li, N.; Wei, A.Q. Research progress on new highly efficient foam drainage agents for gas wells (A review). Pet. Chem. 2023, 63, 1119–1131. [Google Scholar] [CrossRef]
  14. Zhang, Z.; Wang, Z.; Gao, Y.; Li, H.; Wang, J.; Sun, B. Experimental study on the effect of surfactants on the characteristics of gas carrying liquid in vertical churn and annular flows. J. Pet. Sci. Eng. 2019, 180, 347–356. [Google Scholar] [CrossRef]
  15. Ajani, A.; Kelkar, M.; Sarica, C.; Pereyra, E. Effect of surfactants on liquid loading in vertical wells. Int. J. Multiph. Flow 2016, 83, 183–201. [Google Scholar] [CrossRef]
  16. Liang, Z.; Wang, F.; Deng, X. A novel technology of combining foam injection and compression to lift liquid in water flooded gas wells. J. Nat. Gas Sci. Eng. 2014, 19, 147–151. [Google Scholar] [CrossRef]
  17. Oyewole, P.O.; Lea, J.F. Artificial lift selection strategy for the life of a gas well with some liquid production. In All Days; SPE: Denver, CO, USA, 2008; p. SPE-115950-MS. [Google Scholar] [CrossRef]
  18. Veeken, K.; Hinai, K.; Shanfari, A.A.; Yamadi, A.; Zadjali, A.; Saidi, A.; Hadhrami, H.; Daraai, T.; Mans, J.; Yousfi, I.; et al. Evaluating performance of foam-assisted lift in sultanate of foman by dedicated field testing. In Proceedings of the Abu Dhabi International Petroleum Exhibition & Conference, Abu Dhabi, United Arab Emirates, 13–16 November 2017; SPE: Abu Dhabi, United Arab Emirates, 2017; p. D021S033R006. [Google Scholar] [CrossRef]
  19. Lea, J.F.; Rowlan, L. Gas Well Deliquification, 3rd ed.; Gulf Drilling Guides; Gulf Professional Publishing: Cambridge, MA, USA, 2019. [Google Scholar]
  20. Martins, A.; Marino, M.; Kerem, M.; Guzman, M. Foam assisted gas lift: The impact of different surfactant delivery methods on oil well performance. In SPE Europec Featured at 81st EAGE Conference and Exhibition; SPE: London, UK, 2019; p. D041S012R002. [Google Scholar] [CrossRef]
  21. Zhang, P.; Guo, D.; Cao, X.; Li, X.; Xia, W.; Peng, W.; Bian, J. Foam stability: The key to inhibiting slug generation in gas–liquid flow. J. Pet. Sci. Eng. 2022, 218, 110969. [Google Scholar] [CrossRef]
  22. Hearn, W. Gas well deliquification. In All Days; SPE: Abu Dhabi, United Arab Emirates, 2010; p. SPE-138672-MS. [Google Scholar] [CrossRef]
  23. Zhou, H.; Qu, C.; Lu, G.; Li, Z.; Wang, X.; Yin, H.; Feng, Y. Deliquification of low-productivity natural gas wells with in situ generated foams and heat. Energy Fuels 2021, 35, 9873–9882. [Google Scholar] [CrossRef]
  24. Seifert, U. Hydrodynamic Lift on bound vesicles. Phys. Rev. Lett. 1999, 83, 876–879. [Google Scholar] [CrossRef]
  25. Gcali, C.; Karami, H.; Pereyra, E.; Sarica, C. Surfactant batch treatment efficiency as an artificial lift method for horizontal gas wells. In Proceedings of the SPE Artificial Lift Conference and Exhibition–Americas, The Woodlands, TX, USA, 28–30 August 2018; SPE: The Woodlands, TX, USA, 2018; p. D012S001R004. [Google Scholar] [CrossRef]
  26. Kawale, D.; Van Nimwegen, A.T.; Portela, L.M.; Van Dijk, M.A.; Henkes, R.A.W.M. The relation between the dynamic surface tension and the foaming behaviour in a sparger setup. Colloids Surf. A Physicochem. Eng. Asp. 2015, 481, 328–336. [Google Scholar] [CrossRef]
  27. Steliga, T.; Jakubowicz, P.; Kapusta, P. Changes in toxicity during treatment of wastewater from oil plant contaminated with petroleum hydrocarbons: Changes in toxicity during treatment of wastewater from oil plant. J. Chem. Technol. Biotechnol. 2015, 90, 1408–1418. [Google Scholar] [CrossRef]
  28. Miller, R.; Liggieri, L. (Eds.) Bubble and Drop Interfaces; CRC Press: Boca Raton, FL, USA, 2011. [Google Scholar] [CrossRef]
  29. Janocha, A. Zmiany napięcia powierzchniowego zasiarczonej wody złożowej na granicy z powietrzem. Naft.-Gaz 2014, 6, 365–369. [Google Scholar]
  30. Han, W.; Fan, J.; Lv, H.; Yan, Y.; Liu, C.; Dong, S. Excellent foaming properties of anionic-zwitterionic-Gemini cationic compound surfactants for gas well deliquification: Experimental and computational investigations. Colloids Surf. A Physicochem. Eng. Asp. 2022, 653, 129944. [Google Scholar] [CrossRef]
  31. Wang, Z.; Song, H. The synthesis of quaternary n-alkyl tropinium cationic surfactants and study on their properties: Effect of temperature, hydrophobic chain length and anions. J. Mol. Struct. 2022, 1268, 133732. [Google Scholar] [CrossRef]
  32. Dong, S.; Fan, J.; Lv, H.; Qiang, T.; Ji, Y.; Han, W. Excellent condensate and salt-resistant foam by anionic-zwitterionic-cationic Gemini surfactants compounds for gas well deliquification. J. Surfact. Deterg. 2024, 27, 135–145. [Google Scholar] [CrossRef]
  33. Xu, Q.; Nakajima, M.; Ichikawa, S.; Nakamura, N.; Roy, P.; Okadome, H.; Shiina, T. Effects of surfactant and electrolyte concentrations on bubble formation and stabilization. J. Colloid Interface Sci. 2009, 332, 208–214. [Google Scholar] [CrossRef] [PubMed]
  34. Singh, R.; Panthi, K.; Weerasooriya, U.; Mohanty, K.K. Multistimuli-responsive foams using an anionic surfactant. Langmuir 2018, 34, 11010–11020. [Google Scholar] [CrossRef]
  35. Emami, H.; Ayatizadeh Tanha, A.; Khaksar Manshad, A.; Mohammadi, A.H. Experimental investigation of foam flooding using anionic and nonionic surfactants: A screening scenario to assess the effects of salinity and pH on foam stability and foam height. ACS Omega 2022, 7, 14832–14847. [Google Scholar] [CrossRef]
  36. Johri, N.; Kadam, S.; Veeken, K.; Prakash, A.; Suvarna, H.; Singh, P.; Daukia, S.; Kadirus, S.; Goswami, A.; Aakash, S. Conquer liquid loading in raageshwari gas field by automated intermittent production and deliquification. In Proceedings of the ADIPEC, Abu Dhabi, United Arab Emirates, 2–5 October 2023; SPE: Abu Dhabi, United Arab Emirates, 2023; p. D021S075R003. [Google Scholar] [CrossRef]
  37. Gao, F.; Dong, S.; Wang, D.; Lv, H.; Han, W. A novel foaming formulation with excellent salt-resistant for foam assisted deliquification of gas wells. J. Dispers. Sci. Technol. 2024, 1–11. [Google Scholar] [CrossRef]
  38. Yakhshi-Tafti, E.; Kumar, R.; Cho, H.J. Measurement of surface interfacial tension as a function of temperature using pendant drop images. Int. J. Optomechatronics 2011, 5, 393–403. [Google Scholar] [CrossRef]
  39. Paswan, B.K.; Kumar, S.; Mahto, V. Evaluation of a soybean oil derived surfactant in the development of oil-in-water (O/W) emulsion drilling mud for shale formation. J. Pet. Sci. Eng. 2022, 217, 110926. [Google Scholar] [CrossRef]
  40. Fadairo, A.; Adeyemi, G.; Ogunkunle, T.; Lawal, O.; Oredeko, O. Modelling minimum flow rate required for unloading liquid in gas wells. In Proceedings of the SPE Nigeria Annual International Conference and Exhibition, Virtual, 11 August 2020; p. D013S004R009. [Google Scholar] [CrossRef]
  41. Zhang, Z.; Xiong, Y.; Pu, H.; Sun, Z. Effect of the variations of thermophysical properties of drilling fluids with temperature on wellbore temperature calculation during drilling. Energy 2021, 214, 119055. [Google Scholar] [CrossRef]
  42. Tavakkoli, M.; Panuganti, S.R.; Khemka, Y.; Valdes, H.; Vargas, F.M. Foam-assisted gas lift: A novel experimental setup to investigate the feasibility of using a commercial surfactant for increasing oil well productivity. J. Pet. Sci. Eng. 2021, 201, 108496. [Google Scholar] [CrossRef]
  43. Cao, Q.; Cao, Q. Effects of Temperature on the properties of the new gel foam. In Advances in Transdisciplinary Engineering; Chen, M., Giorgetti, M., Li, Z., Chen, Z., Jin, B., Agarwal, R.K., Eds.; IOS Press: Amsterdam, The Netherlands, 2022. [Google Scholar] [CrossRef]
  44. Yang, L.; Estrada, L.P. Surfactant adsorbed at the oil-water interface and its elimination. GEP 2015, 3, 40–46. [Google Scholar] [CrossRef]
  45. Kinate, B.B.; Nmegbu, C.G.J.; Amadichuku, N. Investigation of the Impact of Surfactant Concentration on Gas Well Deliquification. In Proceedings of the SPE Nigeria Annual International Conference and Exhibition, Lagos, Nigeria, 31 July–2 August 2023; SPE: Lagos, Nigeria, 2023; p. D031S021R002. [Google Scholar] [CrossRef]
  46. Wang, H.; Liu, J.; Yang, Q.; Wang, Y.; Li, S.; Sun, S.; Hu, S. Study on the influence of the external conditions and internal components on foam performance in gas recovery. Chem. Eng. Sci. 2021, 231, 116279. [Google Scholar] [CrossRef]
  47. Wang, S.; Chen, C.; Yuan, N.; Ma, Y.; Ogbonnaya, O.I.; Shiau, B.; Harwell, J.H. Design of extended surfactant-only EOR formulations for an ultrahigh salinity oil field by using hydrophilic lipophilic deviation (HLD) approach: From laboratory screening to simulation. Fuel 2019, 254, 115698. [Google Scholar] [CrossRef]
  48. Yang, J.; Jovancicevic, V.; Ramachandran, S. Foam for gas well deliquification. Colloids Surf. A Physicochem. Eng. Asp. 2007, 309, 177–181. [Google Scholar] [CrossRef]
Figure 1. Flow patterns for 2-phase 2-phase vertical flow [19].
Energies 17 05924 g001
Figure 2. Scheme of a laboratory stand for foaming of reservoir water tests [7].
Energies 17 05924 g002
Figure 3. Volumes of foam and foamed reservoir water from well A removed using various surfactants in 20 min.
Energies 17 05924 g003
Figure 4. Volumes of foam and foamed reservoir water from well B removed using various surfactants in 20 min.
Energies 17 05924 g004
Figure 5. Volumes of foam and foamed reservoir water from well C removed using various surfactants in 20 min.
Energies 17 05924 g005
Figure 6. Volumes of foam and foamed reservoir water from well D removed using various surfactants in 20 min.
Energies 17 05924 g006
Figure 7. Volumes of foam and foamed tap water using various surfactants in 20 min.
Energies 17 05924 g007
Figure 8. Four vertical gas–liquid liquid–gas flow regimes obtained in laboratory conditions.
Energies 17 05924 g008
Figure 9. Pressure measurement in a gas well C after the introduction of foaming stick.
Energies 17 05924 g009
Figure 10. Gas flow and pressure values prevailing in well C during water removal tests.
Energies 17 05924 g010
Figure 11. Water flow in well C during water removal tests using BioCond Plus 30/380 stick.
Energies 17 05924 g011
Table 1. Surface tension and volume of reservoir water removed from the system depending on the type of foaming stick.
Type of Foaming StickSurfactant Concentration
0 [g/m3]1.5 [g/m3]3.0 [g/m3]5.0 [g/m3]
Surface Tension [mN/m]
Brine from A well
BioLight 30/38065.8 ± 5.563.5 ± 5.462.5 ± 5.461.8 ± 5.3
BioFoam 3065.8 ± 5.562.0 ± 5.461.3 ± 5.360.5 ± 5.2
BioCond 3065.8 ± 5.561.5 ± 5.361.0 ± 5.360.8 ± 5.2
BioAcid 30/38065.8 ± 5.563.1 ± 5.463.0 ± 5.461.0 ± 5.3
BioCond Plus 30/38065.8 ± 5.562.0 ± 5.461.6 ± 5.360.5 ± 5.2
Brine from B well
BioLight 30/38071.8 ± 5.863.5 ± 5.461.8 ± 5.361.6 ± 5.3
BioFoam 3071.8 ± 5.863.6 ± 5.463.0 ± 5.461.0 ± 5.3
BioCond 3071.8 ± 5.863.8 ± 5.463.7 ± 5.461.8 ± 5.4
BioAcid 30/38071.8 ± 5.867.0 ± 5.664.2 ± 5.563.0 ± 5.5
BioCond Plus 30/38071.8 ± 5.862.4 ± 5.360.7 ± 5.259.5 ± 5.1
Brine from C well
BioLight 30/38070.0 ± 5.764.2 ± 5.563.9 ± 5.564.0 ± 5.5
BioFoam 3070.0 ± 5.764.8 ± 5.563.4 ± 5.463.0 ± 5.4
BioCond 3070.0 ± 5.765.2 ± 5.563.6 ± 5.463.0 ± 5.4
BioAcid 30/38070.0 ± 5.765.6 ± 5.663.8 ± 5.463.0 ± 5.4
BioCond Plus 30/38070.0 ± 5.765.0 ± 5.562.2 ± 5.360.0 ± 5.2
Brine from D well
BioLight 30/38071.8 ± 5.865.1 ± 5.564.0 ± 5.463.0 ± 5.4
BioFoam 3071.8 ± 5.863.0 ± 5.462.0 ± 5.361.0 ± 5.3
BioCond 3071.8 ± 5.864.3 ± 5.464.0 ± 5.463.0 ± 5.4
BioAcid 30/38071.8 ± 5.865.2 ± 5.564.0 ± 5.463.5 ± 5.4
BioCond Plus 30/38071.8 ± 5.862.6 ± 5.362.0 ± 5.361.5 ± 5.3
Tap water
BioLight 30/38072.6 ± 5.970.3 ± 5.867.3 ± 5.761.2 ± 5.3
BioFoam 3072.6 ± 5.969.9 ± 5.866.8 ± 5.659.8 ± 5.1
BioCond 3072.6 ± 5.970.0 ± 5.867.0 ± 5.660.3 ± 5.2
BioAcid 30/38072.6 ± 5.970.1 ± 5.867.2 ± 5.760.6 ± 5.2
BioCond Plus 30/38072.6 ± 5.969.5 ± 5.766.2 ± 5.659.2 ± 5.0
Table 2. Summary of operational parameters of wells A, B and C.
ParameterWell AWell BWell CWell A +
BioFoum 30
Well B +
BioFoum 30
Well C +
BioCond Plus 30/380
Pressure [MPa]0.610.620.620.750.810.86
Gas production [m3/min]1.292.998.22.294.1510.3
Water production [dm3/day]1.00.450.08161736
Frequency of dosing surfactant sticks [day]---7187
Disclaimer/Publisher’s Note: The statements, opinions and data contained in all publications are solely those of the individual author(s) and contributor(s) and not of MDPI and/or the editor(s). MDPI and/or the editor(s) disclaim responsibility for any injury to people or property resulting from any ideas, methods, instructions or products referred to in the content.

