


Power Shift: Decarbonization and the New Dynamics of Energy Markets

Abstract
1. Introduction
2. Materials and Methods
3. Wholesale Electricity Markets
- Electricity energy markets—Long-term power purchase agreements, day-ahead markets, and real-time/balancing markets facilitate the buying and selling of electricity for final consumption.
- Reliability/Capacity markets—Capacity obligations are purchased through centralized auctions and bilateral contracts to ensure adequate generation and demand-side resources are available to meet system reliability requirements.
- Ancillary services markets—Grid resources bid or agree on bilateral contracts to provide essential reliability services like frequency regulation, operating reserves, voltage support, and black start.
- Transmission markets—Prices for transmission networks, like access rights, are determined to manage grid congestion and losses efficiently.
3.1. Day-Ahead and Real-Time/Balancing Markets
- Day-Ahead Markets:
- Operate the day before electricity delivery (hence “day-ahead”).
- Participants submit bids to buy or offers to sell electricity for each hour of the next day.
- The system operator matches supply and demand for each hour to determine the market clearing price at the minimum cost, safeguarding system reliability and electricity transmission constraints.
- Provides price signals for generators and load-serving entities to plan their operations and bidding for the next day.
- Results in financial commitments to buy or sell electricity at the day-ahead price.
- Real-Time/Spot Markets:
- Operate in real-time as electricity is delivered, with intervals that can be 5 min.
- The ISO/RTO uses it to balance differences between day-ahead schedules and real-time demand/generation at the minimum cost, safeguarding system reliability and electricity transmission constraints.
- Prices fluctuate minute-to-minute based on actual system conditions.
- Generators are paid the real-time price for any extra electricity produced.
- Load-serving entities pay the real-time price for any extra electricity consumed.
- Provides price signals to incentivize generators to follow dispatch instructions.
- Key Differences:
- Day-ahead prices are based on expected conditions and bids, whereas real-time prices reflect actual conditions.
- Day-ahead markets provide financial certainty, while real-time markets balance physical differences.
- Day-ahead markets have higher trade volumes, while real-time markets ensure reliability.
- Day-ahead prices are generally less volatile than real-time prices.
3.2. Capacity Market
- Market Efficiency: Arguments favoring capacity markets emphasize their ability to ensure sufficient generation capacity to meet peak demand, thereby maintaining grid reliability [55,56,57,58]. Energy-only markets depend on scarcity pricing during high-demand periods to provide the “missing money” needed to support capacity investment. Without effective scarcity pricing, the market fails to incentivize adequate capacity, creating a risk of supply shortages. Conversely, arguments against capacity markets highlight their potential to distort price signals, which can lead to costly overinvestment in unnecessary capacity and contribute to a suppressed price problem, where energy prices are artificially lowered due to capacity payments [57,59,60,61,62].
- Cost to Consumers: Capacity markets are argued to promote long-term price stability and secure supply, benefiting consumers in the long run [55,56,63]. Conversely, some arguments contend that these markets increase consumer costs by compensating generators for potential capacity rather than actual production, which may not always be economically justified [57,59,61,62,64].
- Impact on Renewable Energy: Arguments in favor suggest that capacity markets can facilitate renewable integration by ensuring a reliable backup capacity, supporting the transition to cleaner energy systems [57,58,62,63]. However, opposing arguments warn that capacity markets often favor traditional fossil fuel generators, potentially hindering the transition to renewable energy sources [57,59,61,62,65].
- Complexity of Market Design: Capacity markets are argued to be adaptable, allowing for tailoring to meet specific regional needs and policy goals while stabilizing prices that might otherwise become volatile under scarcity pricing [56,57,66,67]. In contrast, arguments against capacity markets suggest they add unnecessary complexity to electricity markets, creating opportunities for manipulation by market participants [57,62,64,68].
- Impact on Innovation: Some arguments suggest that capacity markets provide revenue certainty, which can encourage investment in new technologies and support innovation [55,59,60]. However, counterarguments claim that capacity markets may stifle innovation by favoring established technologies and existing market structures over more disruptive advancements [57,61,62,68].
3.3. Long-Term Purchase Agreements
3.4. Ancillary Services Market
3.5. Cost Base Centralized Systems
3.6. Transmission Markets
- (a)
- Open-access interconnection lines are essential for interregional power exchanges and market integration. They provide non-discriminatory access to all qualified market participants, usually under regulated tariffs. Examples include the following:
- US interstate transmission lines under FERC Order 888 [84].
- European cross-border interconnectors are regulated by EU Regulation 714/2009 [85].
- Chile’s north-south interconnection system, Sistema Eléctrico Nacional (SEN) [86].
- Australian interstate connectors in the National Electricity Market (NEM) [87].
- (b)
- Dedicated transmission lines (generator lead lines) connect specific generation facilities to the main grid or load centers. Usually funded and owned by the generator, these lines often have limited third-party access. Examples include lines that connect remote renewable projects, large thermal power plants, and mining operations.
- (c)
- Shared access (limited participation) lines serve multiple users under restricted access schemes. Costs for these lines are typically shared among predefined users, and private agreements with possible regulatory oversight often govern them. Examples include shared infrastructure for mining companies or industrial parks.
- (d)
- Hybrid access lines blend dedicated use with open access requirements, where the primary capacity is reserved for an anchor user, but excess capacity is available for others through open access provisions. This often requires regulatory approval and may include compensation mechanisms for the original investor.
- Transmission Market Structures, Financial Instruments vs. Centralized Expansion:
- Examples:
- Chile: The Coordinador Eléctrico Nacional (CEN) [88] centrally plans transmission expansions, applying uniform tariffs across all users.
- Brazil: Transmission is centrally regulated by Agência Nacional de Energia Elétrica (ANEEL) [89], with expansion procured through public auctions.
- Mexico: Centro Nacional de Control de Energía (CENACE) [90] manages grid operations and expansion, using a postage stamp system to allocate transmission costs.
- Key Differences:
- Decentralized Markets: The US and parts of Europe use financial instruments (FTRs/CRRs) to manage congestion, offering flexibility for market participants to hedge against transmission risks.
- Centralized Markets: Chile, Brazil, and Mexico rely on centralized planning with uniform cost distribution and without financial tools for hedging congestion risks.
- System Reliability and Congestion Management:
- Transmission Market Evolution:
4. Decarbonization in Electricity Market and Trends
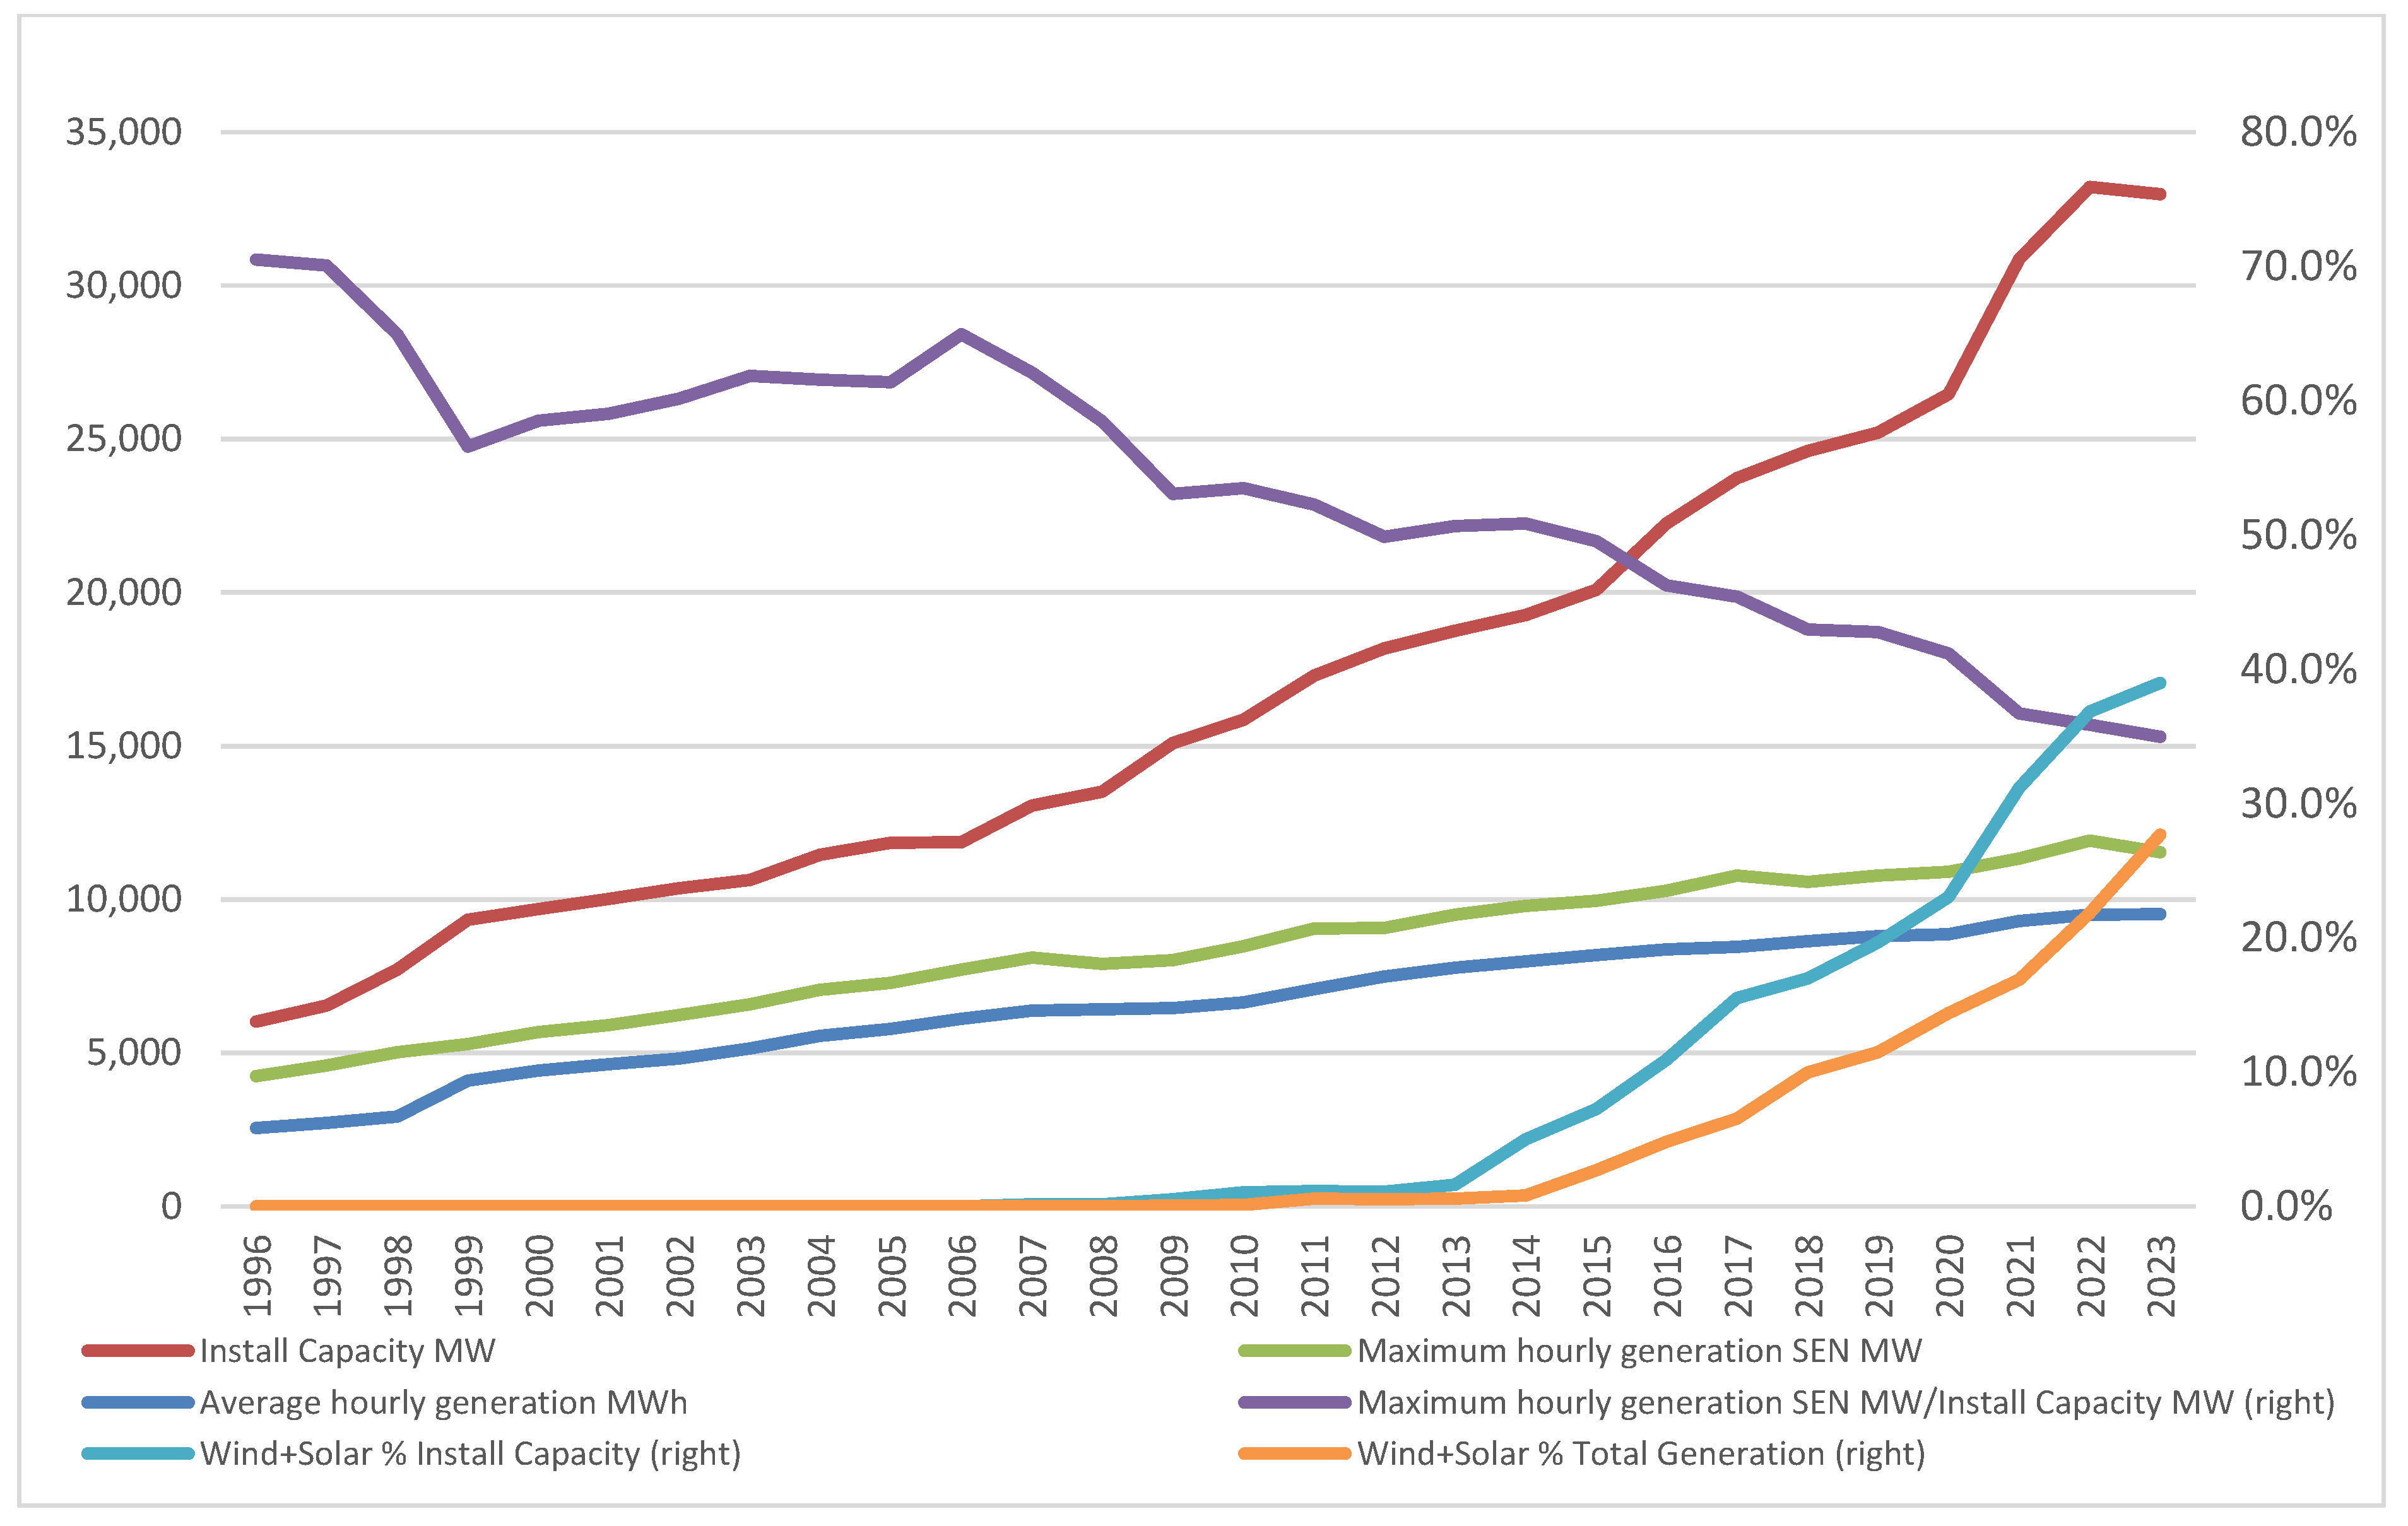
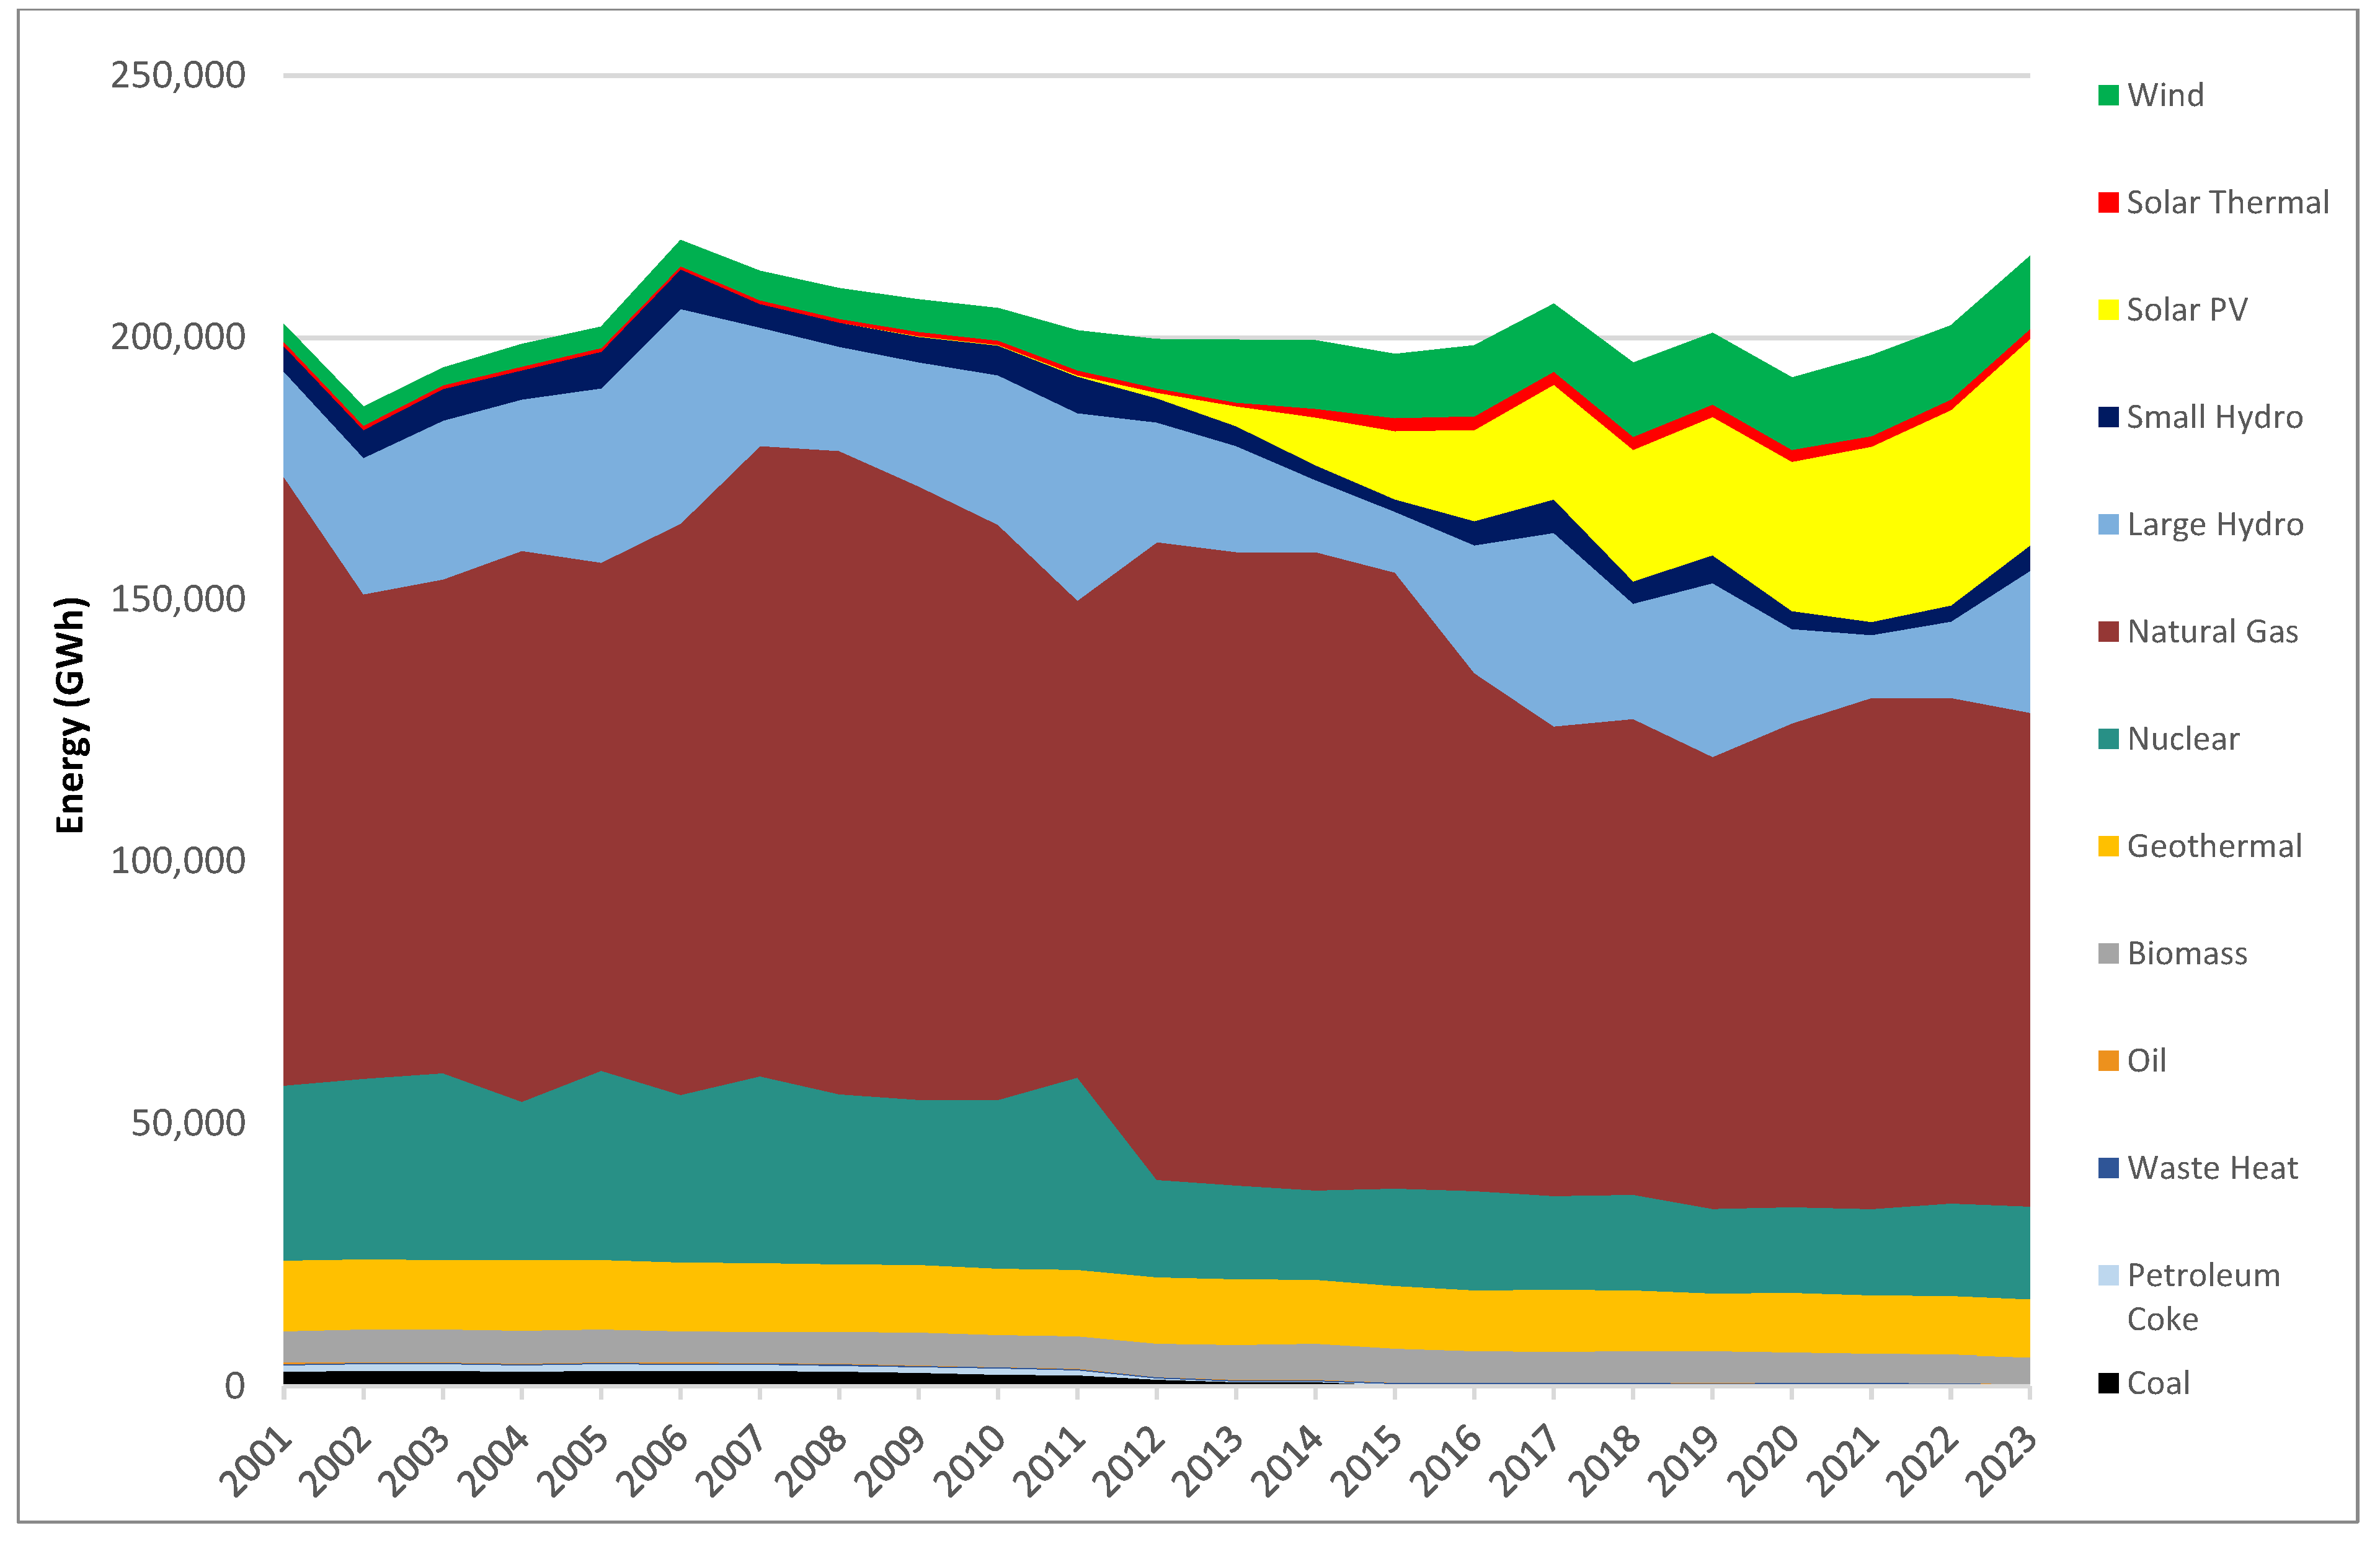
4.1. Larger Capacity and Operating Reserves per GWh
- (a)
- Chile’s Case Study
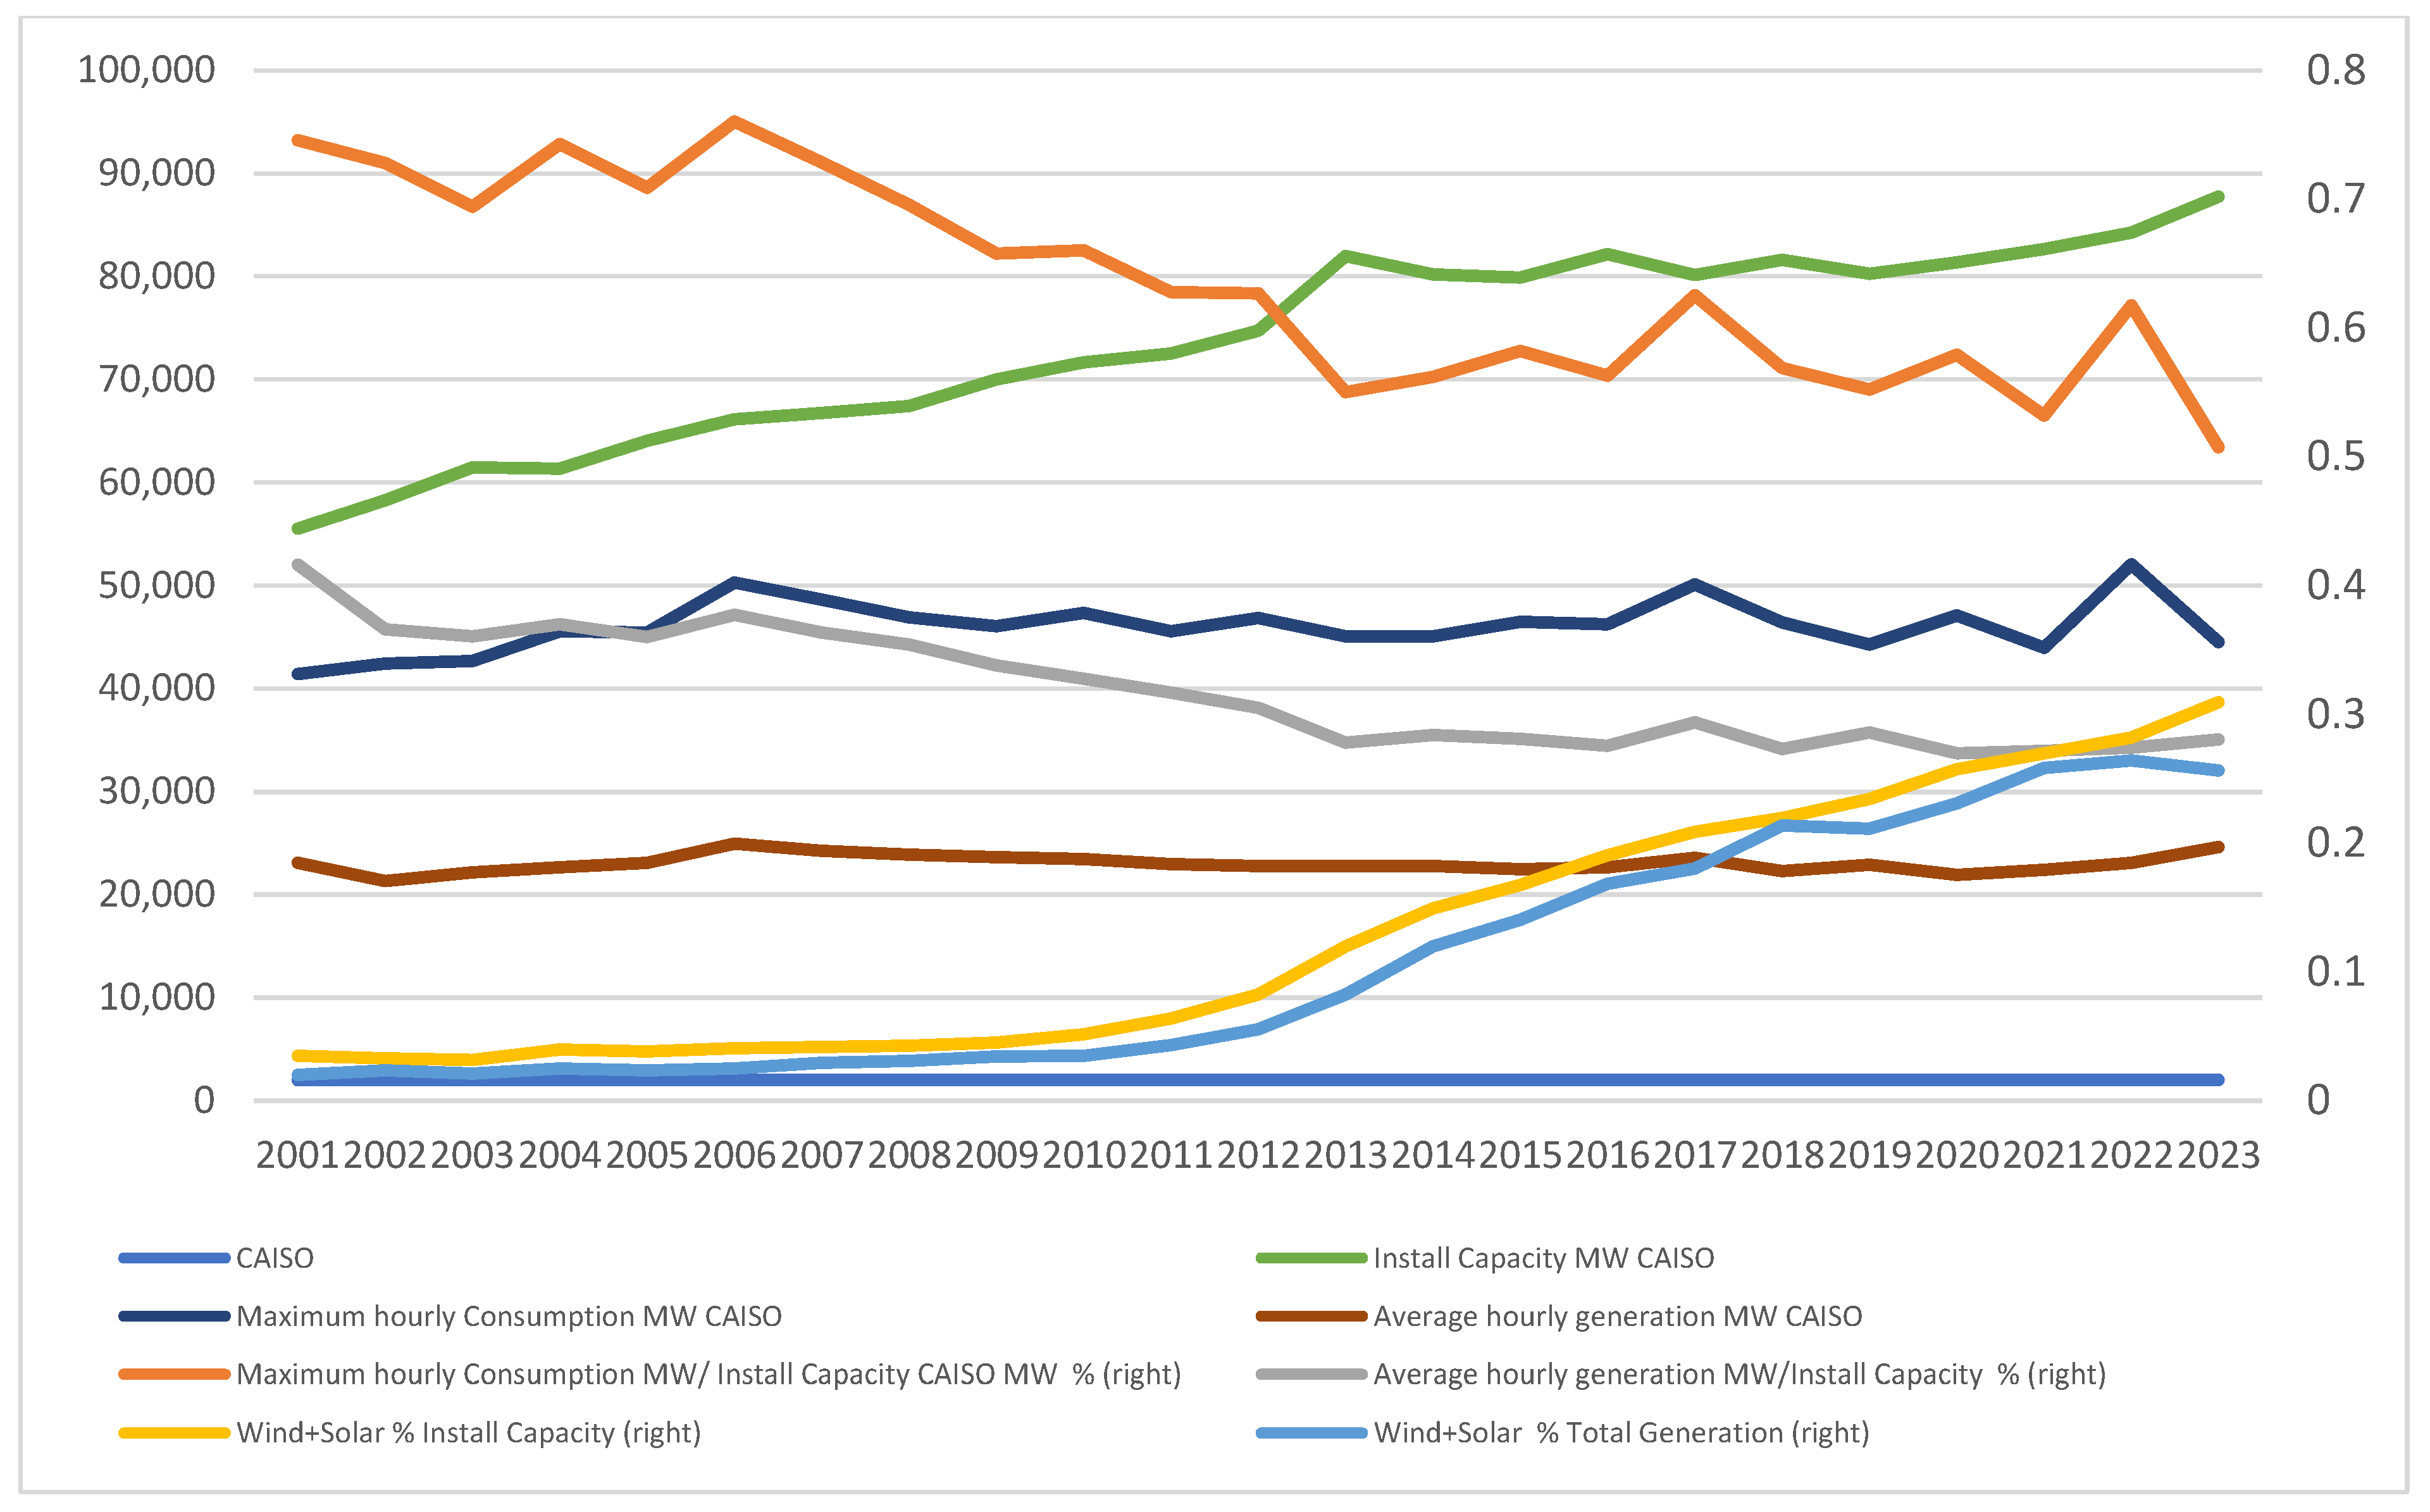
- (b)
- CAISO Case Study
4.2. Ramping Capacity Needs and Operating Reserves
- Balancing costs: The expenses for ancillary services needed to stabilize the grid include load-following and managing unforeseen fluctuations.
- Capacity costs: Backup generation and storage are required during low VRE output periods to ensure reliability.
- Transmission and distribution costs: Upgrading the grid infrastructure to accommodate the increasing number of small power plants, DG systems, and behind-the-meter VRE sources.
- Operational costs: Coordinating a diverse and larger array of power generators, energy storage, prosumers, and demand management systems.
- Curtailment costs: Managing surplus generation when VRE output exceeds demand, leading to curtailment or the need for investment in energy storage.
- (a)
- Chile’s Case Study
- (b)
- CAISO Case Study
4.3. Ramping Capability and Risk of Market Power
4.4. Overgeneration and Curtailment Risk
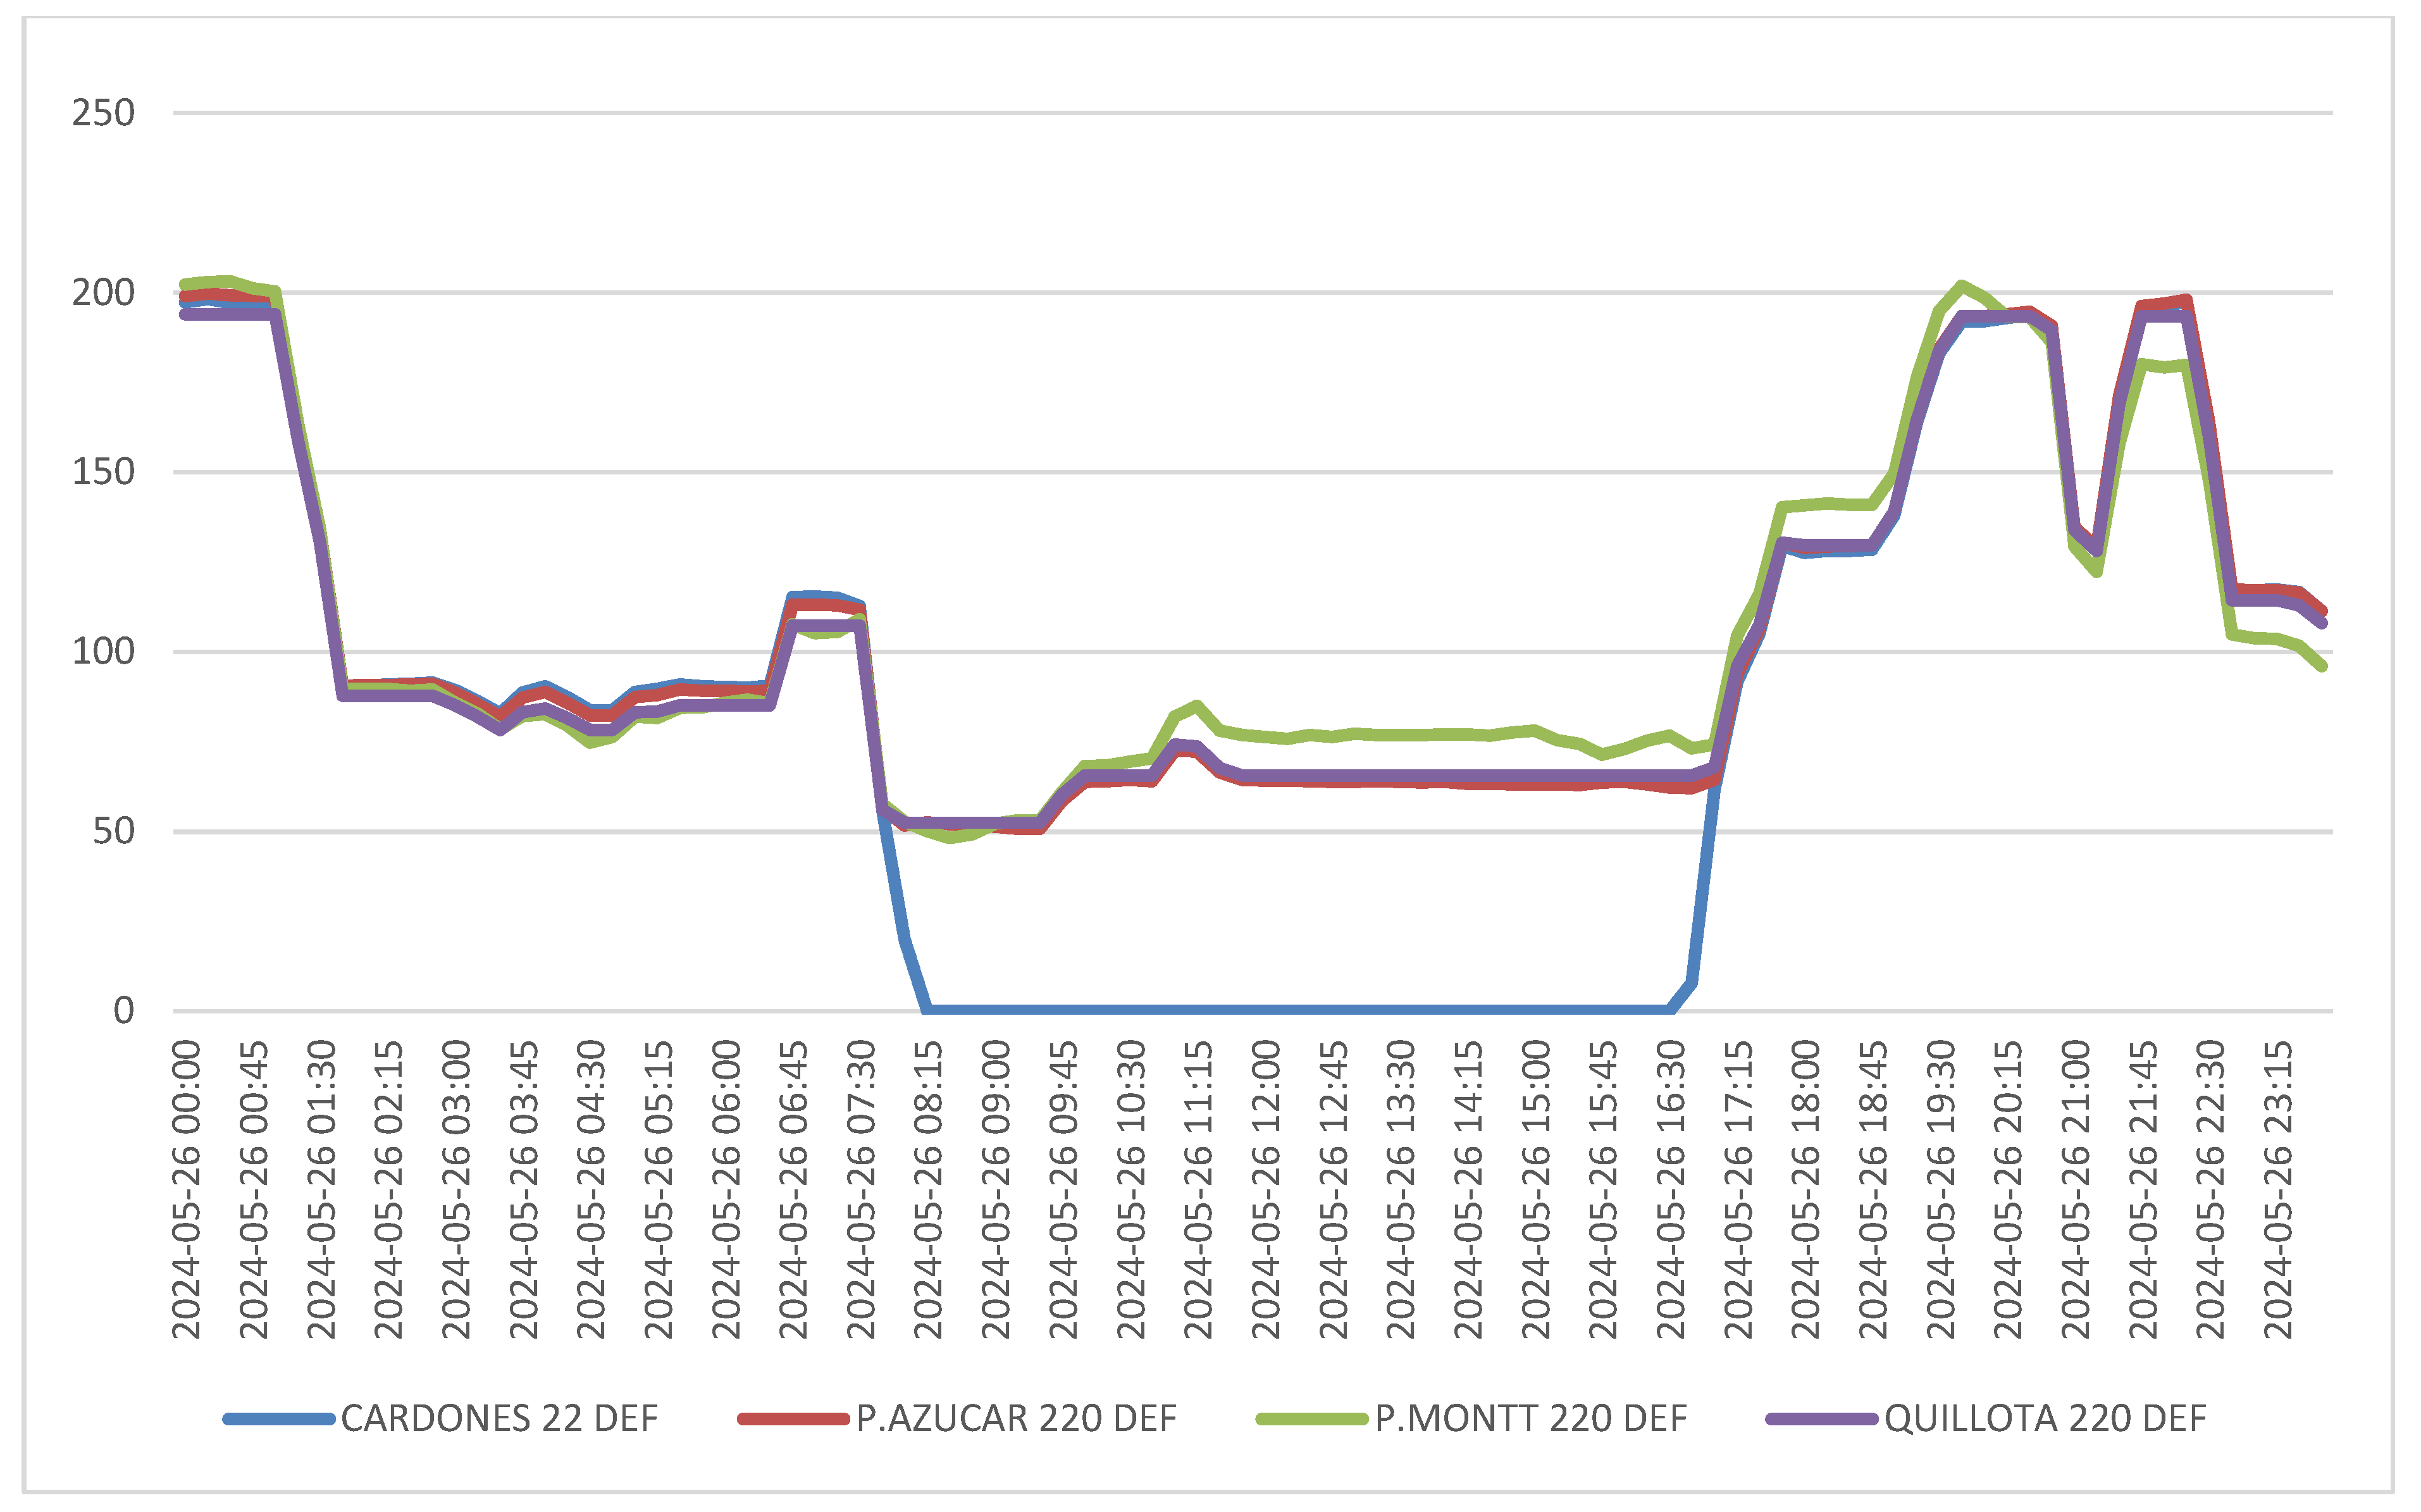
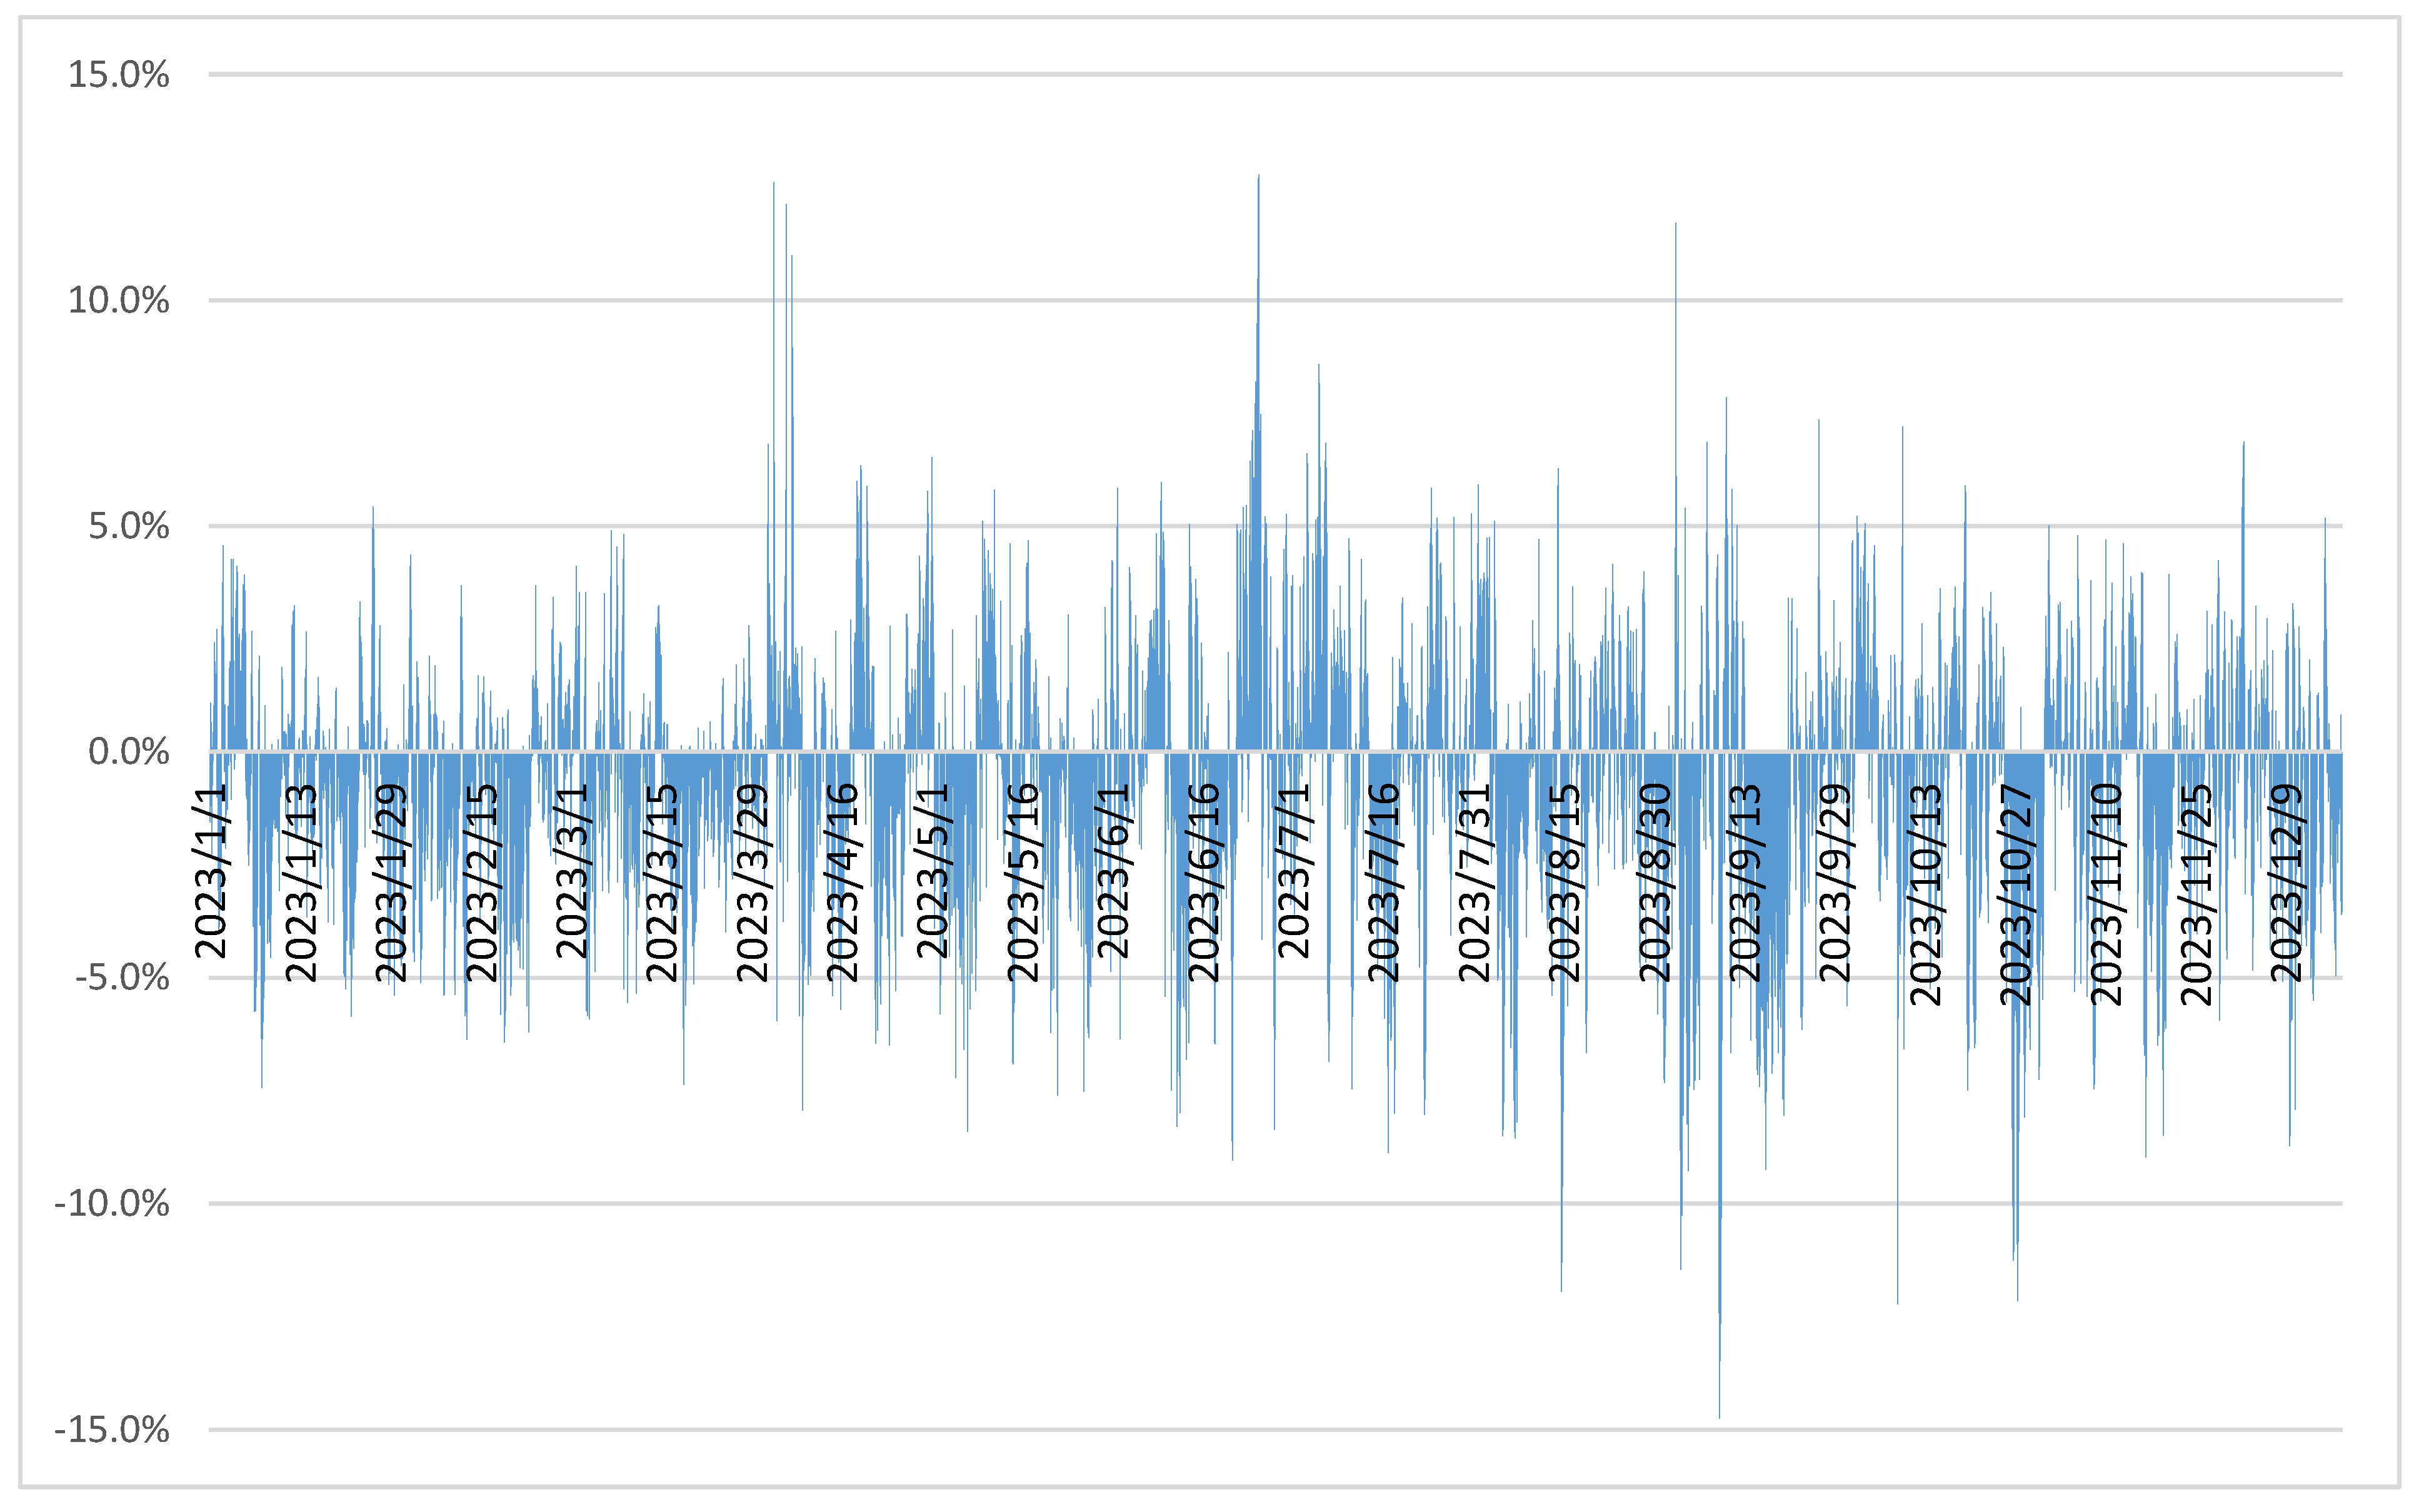
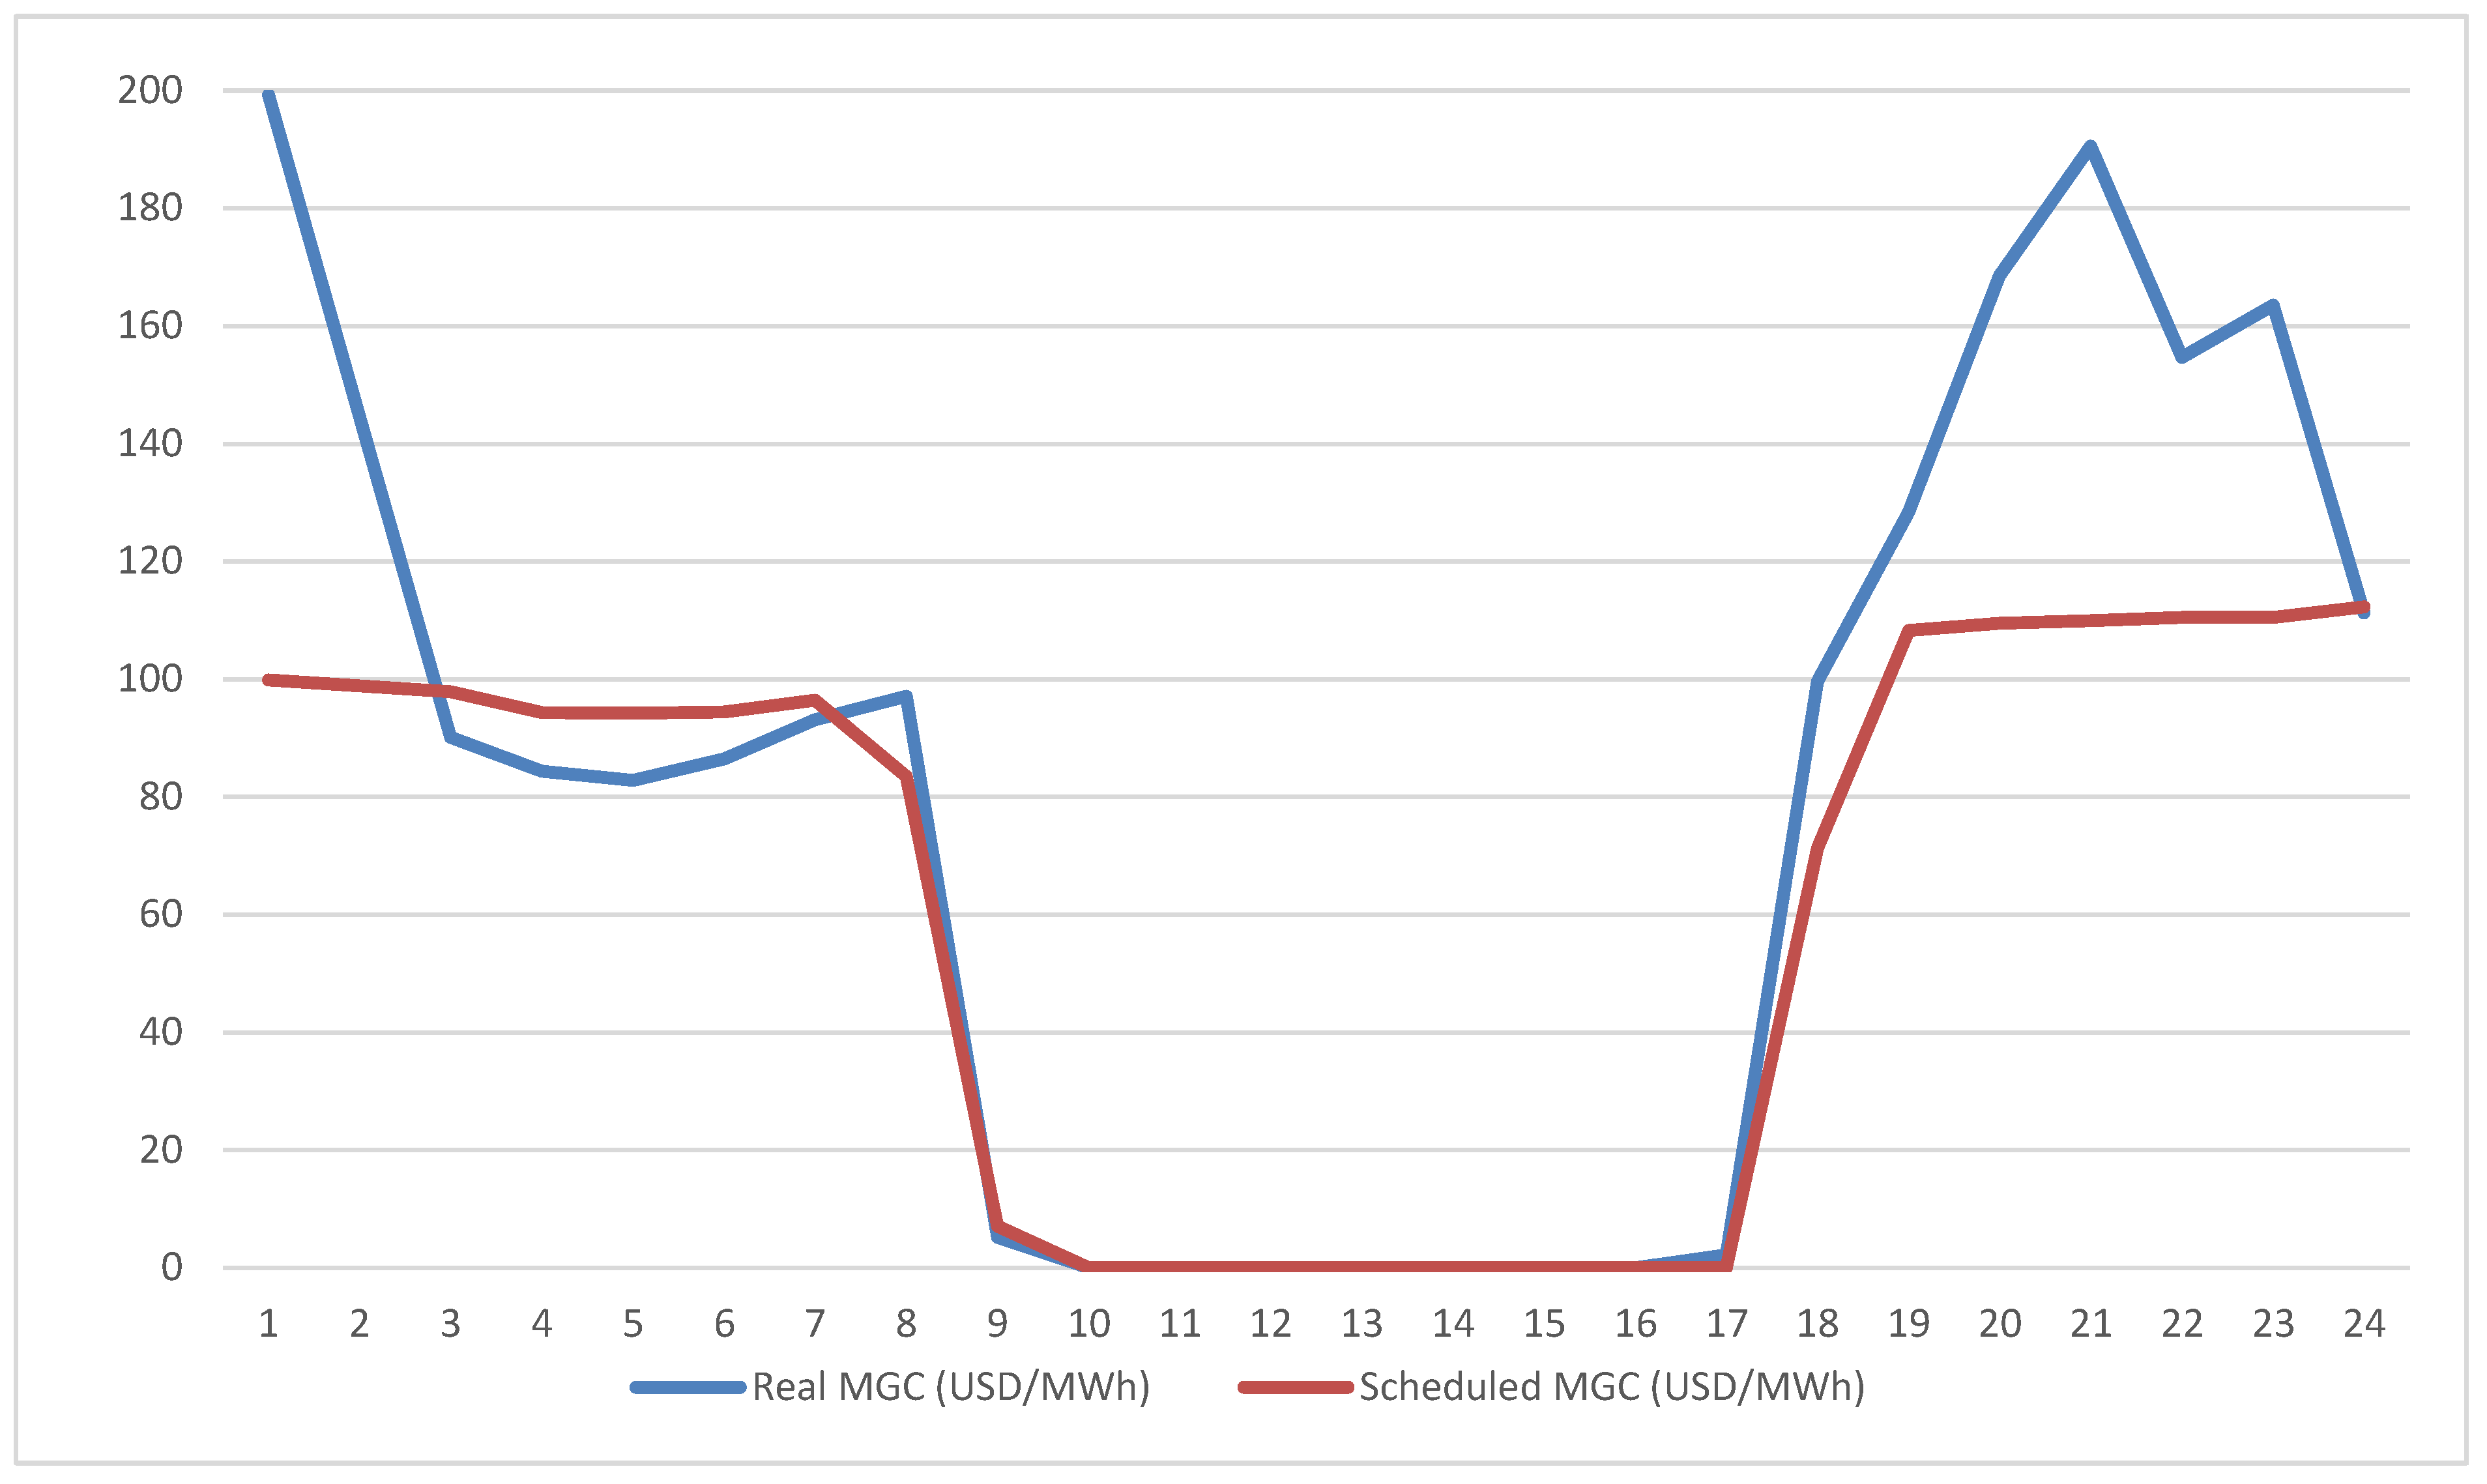
4.5. Discrepancies Within Day-Ahead and Real-Time Markets
- Chile’s Case Study
5. Implications of Decarbonization for Electricity Market Design
- (1)
- Day-Ahead and Real-Time/Balancing Markets: Decarbonization significantly impacts day-ahead and real-time/balancing electricity markets, requiring enhanced flexibility, forecasting, and market design. The variability and uncertainty of increased VRE requires flexible generation, ramping capabilities, and operating reserves, supported by improved weather and climate forecasting for day-ahead planning. However, real-time markets must address persistent uncertainties and risks of overgeneration, where oversupply may lead to zero or negative LMPs. Strengthened transmission networks and innovative technologies like dynamic line ratings can alleviate constraints and optimize renewable integration. The evolving resource mix, replacing baseload FF plants with renewables, DER, storage, hydrogen, and flexible nuclear, necessitates upgraded scheduling and operational, as well as dispatch approaches. Granular pricing intervals, advanced ICT, smart metering, and control technologies enable markets to better align with system dynamics, balancing flexibility and revenue adequacy. These reforms, coupled with mechanisms to mitigate oversupply and incentivize ancillary services, are essential for integrating high shares of renewables across day-ahead and real-time markets.
- (2)
- Capacity Market: Decarbonization fundamentally reshapes capacity markets, necessitating adaptations to ensure grid reliability and resource adequacy amid increased reliance on VRE and DERs. The low marginal costs and weather-dependent nature of VRE stress reserve margins threaten the financial sustainability of conventional power plants, with reduced hours of operation and, as such, leading to higher average energy costs, which require support that can come from capacity market revenues. These markets must integrate emerging resources like ES, DR, and DER while valuing their contributions to reliability. Shorter development timelines for renewables and batteries offer flexibility in capacity procurement but require alignment with the slower expansion of transmission infrastructure. As renewable sources with lower capacity factors replace baseload and FF plants, capacity markets must procure more nameplate capacity and embrace multi-year commitments with updated performance requirements to incentivize flexible and reliable resources. Enhanced forecasting and interregional transmission coordination will be essential for addressing grid bottlenecks and optimizing capacity procurement. Decarbonization’s dual impact—driving up capacity prices due to reduced reserve margins and downward energy price pressures from low-cost renewables—requires holistic market redesigns to ensure revenue adequacy for conventional and emerging technologies, securing grid stability in a low-carbon future.
- (3)
- Long-term Purchase Agreements: Decarbonization significantly reshapes LTPAs, making them a part of the equation to secure financing for capital-intensive renewable projects while introducing new complexities. As VRE with zero marginal costs increases, an LTPA provides revenue certainty but faces challenges like shorter contract terms due to rapid technological advancements and the risk of stranded assets. Hybrid structures combining RE with ES, hydrogen, or DERs might become more common to enhance flexibility and capacity commitments. Corporate renewable PPA may perhaps increase, expanding access to LTPAs. However, evolving risks such as counterparty challenges from utilities with high-carbon assets and pricing pressures from declining clean technology costs necessitate more dynamic agreements, often with renegotiation clauses or price adjustments. Despite these shifts, the LTPA remains critical for securing investment in a renewable-focused energy landscape.
- (4)
- Ancillary Services Market: Decarbonization fundamentally transforms ancillary services markets, increasing demand for services like operating reserves, frequency regulation, ramping, and reactive power to manage the variability and dispersion of RE. Faster response times and higher accuracy become critical, necessitating new ancillary services such as capacity synchronization, stability support, and congestion relief. Emerging resources like battery storage, advanced inverters, intelligent appliances, and electric vehicles are poised to play a significant role, requiring smarter grids and operations. Co-optimization of ancillary services and energy dispatch can leverage shared flexibilities, but market designs must evolve to introduce new products and compensation mechanisms for advanced technologies. Prices in ancillary services markets are likely to experience greater volatility, with potential spikes due to flexibility scarcity and the need for faster, more dynamic responses. Significant upgrades in ancillary services markets are essential to ensure system stability and reliability in a high-renewables grid.
- (5)
- Centralized Dispatch System: Decarbonization introduces significant complexity to centralized dispatch systems based on declared marginal costs, as the variability of VRE and DG challenges traditional supply-demand balancing. The predominance of low or zero-marginal-cost resources, coupled with overgeneration risks during periods of high renewable output and low demand, necessitates enhanced curtailment, load flexibility, and revenue mechanisms to ensure financial sustainability. Long-term planning becomes critical for capital-intensive projects like nuclear, pumped hydro, and transmission while managing security constraints and diverse generation profiles, such as DERs requiring advanced algorithms. Central Dispatch Systems are not exempt from controversy regarding declared marginal costs, particularly concerning the complex interplay between generators’ fuel procurement strategies and their influence on declared marginal and system marginal costs [138]. For example, one critical question is whether the natural gas combined cycle (NGCC) natural gas “take or pay” contracts inherently establish a must-run generation condition with a fuel opportunity cost of zero. Integrating advanced technologies and additional ancillary services through dynamic auctions will be essential to maintaining system stability. Declining marginal costs and clearing prices in merit-order dispatch systems could undermine conventional generators’ revenues, raising the need for innovative capacity and ancillary service procurement strategies. Ultimately, a centralized dispatch system could coordinate an efficient zero-carbon grid, and success hinges on addressing flexibility needs, optimizing marginal costs, and leveraging competitive electricity generation to deliver transparent, dynamic price signals.
- (6)
- Transmission Markets: Decarbonization places unprecedented demands on transmission markets, highlighting their central role in integrating renewable energy and ensuring the energy transition’s success. Utility-scale renewables, often sited far from demand centers, require robust and flexible transmission systems to deliver energy efficiently, reduce congestion, and prevent renewable curtailment. However, the rapid deployment of renewable generation outpaces the slower transmission infrastructure development, creating significant bottlenecks and curtailing clean energy’s full potential. This disconnect undermines economic viability, exacerbates grid stability challenges, and necessitates sophisticated planning and investment. Modern grids must adapt to bidirectional power flows, integrate DER, and lose the natural inertia from traditional power plants, requiring advanced control systems and AS. Solutions such as grid-enhancing technologies, dynamic line ratings, strategically deployed energy storage, and innovative market mechanisms like financial transmission rights are helping optimize current infrastructure and incentivize investment. Addressing this challenge requires earlier and proactive transmission planning, updated regulatory frameworks for fair cost allocation, and enhanced coordination between transmission and distribution systems. Accelerating transmission development through technical, policy, and market reforms is essential to achieving a sustainable and decarbonized energy future.
- (7)
- Effects of Power Sector Decarbonization on Power Plant Revenues: Decarbonization fundamentally reshapes power plant revenues, creating challenges and opportunities depending on the resource type and market participation. VRE introduces increased market variability, with low or even negative prices during high output periods, reducing traditional FF plants’ revenues as their operating hours decline. Price volatility and regulatory costs, like carbon pricing, further pressure FF plants, which may need to shift from a baseload to a more flexible peaking role with less predictable but higher short-term earnings during low renewable output periods. Capacity markets and ancillary services offer new revenue streams for flexible resources like gas peakers, hydropower, and storage, rewarding their ability to stabilize the grid amidst renewable variability. Renewable plants benefit from LTPAs and priority dispatch, but overgeneration risks and curtailment can undermine their earnings without sufficient storage or demand-side flexibility. As storage and DR technologies become cost-effective, competition in capacity and ancillary markets intensifies. Adapting to these dynamics by embracing flexibility, advanced technologies, and new market roles will be essential for sustaining power plant profitability in a decarbonized energy system.
- (8)
- Implications of Decarbonization on financial or derivatives markets and prices: Decarbonization significantly impacts financial and derivatives markets by increasing the demand for risk management tools to address heightened variability and uncertainty in energy output and prices. Integrating VRE introduces sharper price fluctuations, reflected in energy derivatives such as futures and options, which traders and investors use to hedge against market volatility. Capacity derivatives may adjust to shifts in reserve margins and the growing influence of weather-dependent resources. At the same time, AS markets could drive new financial instruments like options or swaps to manage risks tied to grid stability. Transmission congestion, a frequent challenge in renewable-heavy systems, heightens the relevance of instruments like CRRs and FTRs to hedge against localized price spikes. LTPA and its associated financial products could also evolve and be influenced by shifting technology costs and market structures. Additionally, derivatives tied to centralized dispatch systems may reflect the uncertainties of marginal costs and renewable integration efficiency. Decarbonization prompts the development of sophisticated financial tools to manage risks, ensure market stability, and capitalize on emerging opportunities in a transitioning energy landscape.
- (9)
- Emerging Technologies: The transformation of electricity markets necessitates a comprehensive approach integrating cutting-edge technologies and innovative market designs. Artificial intelligence and machine learning [139] can significantly enhance market forecasting and operational optimization, particularly for managing VRE uncertainties and DERs. Digital twin technologies offer crucial virtual simulation capabilities for testing grid scenarios, VRE integration strategies, and market responses.
- Economic Incentives:
6. Conclusions
- Key Insights:
- 1
- Market Dynamics and Flexibility: The variability and uncertainty introduced by VRE challenge traditional market structures, driving a shift toward markets that value flexibility. Resources capable of rapid response, such as energy storage and demand-side solutions, are becoming pivotal in maintaining system balance and reliability.
- 2
- Forecasting and Real-Time Operations: Accurate forecasting and responsive real-time operations are essential to bridge the gaps between day-ahead schedules and actual conditions. Improved forecasting techniques are critical to reducing costly system imbalances caused by discrepancies in renewable output.
- 3
- Generation Mix and Investment Patterns: A significant transition is evident, with traditional FF-based generation giving way to VRE, ES, and DERs. Investment patterns are shifting towards grid modernization and technologies that enable VRE integration.
- 4
- Transmission and Overgeneration: Transmission constraints and overgeneration issues are highlighted as critical bottlenecks. Overgeneration leads to curtailment and wasted clean energy, undermining renewable project economics. This study stresses the importance of expanded transmission infrastructure, better integration of storage solutions, and refined renewables incentive schemes to address these challenges.
- 5
- Capacity and Ancillary Services Markets: Decarbonization redefines capacity markets, which should prioritize flexible resources like storage and DR over a model designed to favor traditional baseload generators. Ancillary services markets are evolving to address the challenges posed by high VRE penetration, such as frequency regulation, ramping, and voltage support.
- 6
- Economic Dynamics and Policy Focus: The transition to VRE has implications for investment costs, levelized cost of electricity (LCOE), and system costs. Policymakers must incentivize clean energy adoption, encourage energy efficiency, and support the adoption and research into emerging technologies while addressing the system’s costs, the public good nature of energy security, and system flexibility.
- 7
- Financial Markets and Instruments: VRE variability underscores the importance of financial tools like LTPAs, carbon pricing, and derivatives for managing risks and stabilizing revenues. These instruments and the adoption of new technologies, like blockchain and smart contracts, will play a growing role in adapting to the evolving electricity market landscape.
- Concluding Implications:
Funding
Data Availability Statement
Acknowledgments
Conflicts of Interest
Acronyms
| Symbol/Term | Definition |
| AEMC | Australian Energy Market Commission |
| AEMO | Australian Energy Market Operator |
| AESO | Alberta Electric System Operator |
| AM | AM Time |
| ANEEL | Agência Nacional de Energia Elétrica, Brazil |
| APA | Administrative Procedure Act from the United States of America |
| ASs | ancillary services |
| BESS | battery energy storage system |
| BRA | base residual auction |
| BTM | behind the meter |
| CAISO | California Independent System Operator |
| CCS | carbon capture and storage |
| CDEC | Economic Load Dispatch Center (Centro de Despacho Económico de Carga) |
| CEC | clean energy certificates |
| CEN | National Electricity Coordinator (Coordinador Eléctrico Nacional), Chile |
| CENACE | Centro Nacional de Control de Energía, Mexico |
| CESs | clean energy standards |
| CfD | contracts for difference |
| CHP | combined heat and power |
| CNE | National Energy Commission (Comisión Nacional de Energia), Chile |
| CO2 | carbon dioxide |
| CO2e | carbon dioxide-equivalent emissions |
| COES SINAC | Committee for Economic Operation of the System (Comité de Operación Económica del Sistema Interconectado Nacional), Peru |
| CRR | congestion revenue rights |
| DER | distributed energy resource |
| DG | distributed generation |
| DR | demand response |
| DS | Decreto Supremo |
| EIA | Energy Information Administration from the United States of America |
| ERCOT | Electric Reliability Council of Texas |
| ES | energy storage |
| ESSs | energy storage solutions |
| ET | energy transition |
| EU | European Union |
| EV | electric vehicle |
| FERC | Federal Energy Regulatory Commission from the United States of America |
| FFs | fossil fuels |
| FPA | Federal Power Act from the United States of America |
| FTR | financial transmission rights |
| GHG | greenhouse gas |
| GW | gigawatt |
| GWh | gigawatts per hour |
| HECO | Hawaiian Electric Company |
| HELCO | Hawaii Electric Light Company |
| IBRs | inverter-based resources |
| ICEV | internal combustion engine vehicle |
| ICT | information and communications technologies |
| IEA | International Energy Agency |
| IESO | Independent Electricity System Operator from Ontario |
| ISO | independent system operator |
| ISO-NE | ISO New England |
| KIUC | Kauai Island Utility Cooperative |
| LCOE | levelized cost of electricity |
| LMPs | locational marginal prices |
| LNG | liquefied natural gas |
| LTPAs | long-term power agreements |
| LULUCF | land use, land-use change, and forestry |
| MAPE | mean absolute percentage error |
| MECO | Maui Electric Company |
| MGC | marginal cost |
| MISO | Midcontinent Independent System Operator |
| MOPR | minimum offer pricing rule |
| MW | megawatt |
| MWh | Megawatt per hour |
| NEA | Nuclear Energy Agency |
| NEM | National Electricity Market, Australia |
| NGCC | natural gas combined-cycle power plant |
| NYSO | New York Independent System Operator |
| OECD | Organisation for Economic Co-operation and Development |
| P2P | peer to peer |
| PE | stabilized price (Precio Estabilizado), Chile |
| PJM | Pennsylvania–New Jersey–Maryland System Operator |
| PM | PM time |
| PPAs | power purchase agreements |
| PV | photovoltaic |
| Q3 | third quarter |
| R&D | research and development |
| RE | renewable energy |
| RECs | renewable energy certificates |
| RETs | renewable energy targets |
| RPM | reliability pricing model |
| RPS | renewable portfolio standard |
| RTO | regional transmission organization |
| SEN | National Electrical System (Sistema Eléctrico Nacional), Chile |
| SIC | Central Interconnected System (Sistema Interconectado Central) |
| SMR | small modular reactor |
| SO | system operator |
| SPP | Southwest Power Pool System Operator |
| TWh | terawatts per hour |
| UK | United Kingdom |
| US | United States of America |
| USD | dollars of the Unites States of America |
| VPP | virtual power plant |
| VRE | variable renewable energy |
| VRR | variable resource requirement |
| WEIM | Western Energy Imbalance Market, from the United States of America |
References
- IPCC. Climate Change 2014: Mitigation of climate change. Contribution of Working Group III to the Fifth Assessment Report of the Intergovernmental Panel on Climate Change; Edenhofer, O., Pichs-Madruga, R., Sokona, Y., Farahani, E., Kadner, S., Seyboth, K., Adler, A., Baum, I., Brunner, S., Eickemeier, P., et al., Eds.; Cambridge University Press: Cambridge, UK, 2014. Available online: https://www.epa.gov/ghgemissions/global-greenhouse-gas-emissions-data#:~:text=Carbon%20dioxide%20(CO2)%3A,agriculture%2C%20and%20degradation%20of%20soils (accessed on 12 December 2023).
- Saxena, A.; Prakash Gupta, J.; Tiwary, J.K.; Kumar, A.; Sharma, S.; Pandey, G.; Biswas, S.; Raghav Chaturvedi, K. Innovative Pathways in Carbon Capture: Advancements and Strategic Approaches for Effective Carbon Capture, Utilization, and Storage. Sustainability 2024, 16, 10132. [Google Scholar] [CrossRef]
- Kumar, T.R.; Beiron, J.; Biermann, M.; Harvey, S.; Thunman, H. Plant and system-level performance of combined heat and power plants equipped with different carbon capture technologies. Appl. Energy 2023, 338, 120927. [Google Scholar] [CrossRef]
- Fu, Y.; Huang, Y.; Xin, H.; Liu, M.; Wang, L.; Yan, J. The pressure sliding operation strategy of the carbon capture system integrated within a coal-fired power plant: Influence factors and energy saving potentials. Energy 2024, 307, 132737. [Google Scholar] [CrossRef]
- Beiron, J.; Normann, F.; Johnsson, F. Carbon capture from combined heat and power plants—Impact on the supply and cost of electricity and district heating in cities. Int. J. Greenh. Gas Control. 2023, 129, 103973. [Google Scholar] [CrossRef]
- EPRI. US-REGEN Documentation. 2021. Available online: https://us-regen-docs.epri.com/v2021a/assumptions/electricity-generation.html#existing-fleet (accessed on 15 November 2023).
- Verma, S.; Dwivedi, G.; Verma, P. Life cycle assessment of electric vehicles in comparison to combustion engine vehicles: A review. Mater. Today Proc. 2022, 49, 217–222. [Google Scholar] [CrossRef]
- European Economic and Social Committee. The Potential of Geothermal Energy for the Green Transition (Own-Initiative Opinion). (TEN/843). Rapporteurs: Zsolt Kükedi & Thomas Kattnig; Advisor: József Ribànyi. Adopted at Plenary Session No. 591, 23 October 2024. Legal Basis: Rule 52(2) of the Rules of Procedure. Outcome of Vote: 238/0/5. Available online: https://www.eesc.europa.eu/en/our-work/opinions-information-reports/opinions/potential-geothermal-energy-green-transition (accessed on 16 January 2024).
- Ministry of Foreign Affairs and Trade. Iceland: Green Transition & Renewable energy. Market Intelligence Report, September 2024. Available online: https://www.mfat.govt.nz/market-reports (accessed on 16 January 2025).
- Van Campen, B.; Petursdottir, H. Geothermal Sustainability Regulation in Iceland and New Zealand. European Geothermal Congress 2016, Strasbourg, France, 19–24 September 2016.The Geothermal Institute, University of Auckland, and BBA. Available online: https://www.researchgate.net/publication/304019622_Geothermal_Sustainability_Regulation_in_Iceland_and_New_Zealand (accessed on 16 January 2024).
- Federal Energy Regulatory Commission (FERC). RTOs and ISOs. 2023. Available online: https://www.ferc.gov/power-sales-and-markets/rtos-and-isos (accessed on 29 November 2023).
- Federal Energy Regulatory Commission (FERC). Order No. 888. 1996. Available online: https://www.ferc.gov/industries-data/electric/industry-activities/open-access-transmission-tariff-oatt-reform/history-oatt-reform/order-no-888 (accessed on 29 November 2023).
- Federal Energy Regulatory Commission (FERC). Order No. 889. 1996. Available online: https://www.ferc.gov/industries-data/electric/industry-activities/open-access-transmission-tariff-oatt-reform/history-of-oatt-reform/order-no-889-1 (accessed on 29 November 2023).
- Federal Energy Regulatory Commission (FERC). Order No. 2000. 1999. Available online: https://www.ferc.gov/sites/default/files/2020-06/RM99-2-00K_1.pdf (accessed on 29 November 2023).
- Intercontinental Exchange, Inc. North American & European Power Futures. 2023. Available online: https://www.ice.com/energy/power (accessed on 12 December 2023).
- Denga, S.J.; Oren, S.S. Electricity derivatives and risk management. Energy 2006, 31, 940–953. Available online: https://oren.ieor.berkeley.edu/pubs/Deng%20and%20Oren-86.pdf (accessed on 12 December 2023). [CrossRef]
- World Federation of Exchanges. WFE Derivatives Report 2021. April 2022. Available online: https://www.world-exchanges.org/storage/app/media/2021%20Annual%20Derivatives%20Report.pdf (accessed on 30 January 2024).
- Bublitz, A.; Keles, D.; Fichtner, W. An analysis of the decline of electricity spot prices in Europe: Who is to blame? Energy Policy 2017, 107, 323–336. Available online: https://www.sciencedirect.com/science/article/abs/pii/S0301421517302598 (accessed on 14 September 2023). [CrossRef]
- De Vries, L.J.; Verzijlbergh, R.A. How Renewable Energy is Reshaping Europes Electricity Market Design. Econ. Energy Environ. Policy 2018, 7, 31–50. [Google Scholar] [CrossRef]
- Newbery, D.M.; Pollitt, M.G.; Ritz, R.A.; Strielkowski, W. Market design for a high-renewables European electricity system. Renew. Sustain. Energy Rev. 2018, 91, 695–707. [Google Scholar] [CrossRef]
- Ahmed, S.D.; Al-Ismail, F.S.M.; Shafiullah, M.; Al-Sulaiman, F.A.; El-Amin, I.M. Grid Integration Challenges of Wind Energy: A Review. IEEE Access 2020, 8, 10857–10878. [Google Scholar] [CrossRef]
- Sahoo, S.; Yanine, F.; Kulkarni, V.; Kalam, A. Editorial: Recent advances in renewable energy automation and energy forecasting. Front. Energy Res. 2023, 11, 1195418. [Google Scholar] [CrossRef]
- Gonzales, L.; Ito, K.; Reguant, M. The Investment Effects of Market Integration: Evidence From Renewable Energy Expansion in Chile. Econometrica 2023, 91, 1659–1693. [Google Scholar] [CrossRef]
- Martinot, E. Grid Integration of Renewable Energy: Flexibility, Innovation, and Experience. Annu. Rev. Environ. Resour. 2016, 41, 223–251. [Google Scholar] [CrossRef]
- Worku, M. Recent Advances in Energy Storage Systems for Renewable Source Grid Integration: A Comprehensive Review. Sustainability 2022, 14, 5985. [Google Scholar] [CrossRef]
- Garcia-Miguel, P.L.C.; Zarilli, D.; Alonso-Martínez, J.; Plaza, M.G.; Gómez, S.A. Optimal operation and market integration of a hybrid farm with green hydrogen and energy storage: A stochastic approach considering wind and electricity price uncertainties. Sustainability 2024, 16, 2856. [Google Scholar] [CrossRef]
- Raineri, R.; Rios, S.; Schiele, D. Technical and economic aspects of ancillary services markets in the electric power industry: An international comparison. Energy Policy 2006, 34, 1540–1555. [Google Scholar] [CrossRef]
- PJM Interconnection, LLC. PJM Markets and Operations. 2023. Available online: https://www.pjm.com/markets-and-operations (accessed on 27 November 2023).
- PJM Interconnection, LLC. PJM’s Energy Markets. 2023. Available online: https://learn.pjm.com/three-priorities/buying-and-selling-energy/energy-markets (accessed on 11 December 2023).
- Independent System Operator of New England. ISO New England Markets and Operations. 2023. Available online: https://www.iso-ne.com/markets-operations (accessed on 27 November 2023).
- California Independent System Operator. California ISO Markets and Operations. 2023. Available online: https://www.caiso.com/market/Pages/default.aspx (accessed on 27 November 2023).
- New York Independent System Operator. New York ISO Markets. 2023. Available online: https://www.nyiso.com/markets (accessed on 27 November 2023).
- Electric Reliability Council of Texas. ERCOT Market Information. 2023. Available online: https://www.ercot.com/mktinfo (accessed on 27 November 2023).
- The European Power Exchange. EPEX SPOT Basics of the Power Market. 2014. Available online: https://www.epexspot.com/en/basicspowermarket (accessed on 10 June 2024).
- European Network of Transmission System Operators for Electricity. ENTSO-E Market. 2023. Available online: https://www.entsoe.eu/ (accessed on 27 November 2023).
- The European Power Exchange. EPEX SPOT Market (2023). Available online: https://www.epexspot.com/ (accessed on 27 November 2023).
- Nord Pool. Nord Pool Markets. 2023. Available online: https://www.nordpoolgroup.com/ (accessed on 27 November 2023).
- Australian Energy Market Commission (AEMC). How Power Is Dispatched Across the System. 2023. Available online: https://www.aemc.gov.au/energy-system/electricity/electricity-market/how-power-dispatched-across-system#:~:text=AEMO’s%20central%20dispatch%20engine%20orders,generators%20to%20meet%20expected%20demand (accessed on 20 November 2023).
- Australian Energy Market Operator (AEMO). Australian Energy Market Operator. 2023. Available online: https://aemo.com.au/ (accessed on 27 November 2023).
- Australian Energy Market Operator (AEMO). Spot and Contract Markets. 2023. Available online: https://www.aemc.gov.au/energy-system/electricity/electricity-market/spot-and-contract-markets (accessed on 27 November 2023).
- Energy Facts Norway. The Power Market. 2023. Available online: https://energifaktanorge.no/en/norsk-energiforsyning/kraftmarkedet/ (accessed on 21 November 2023).
- Energy Market Authority of Singapore. Electricity Market. 2023. Available online: https://www.ema.gov.sg/our-energy-story/energy-market-landscape/electricity (accessed on 17 November 2023).
- Independent Electricity System Operator (IESO). Markets and Related Programs. 2023. Available online: https://www.ieso.ca/ (accessed on 15 October 2024).
- Alberta Electric System Operator (AESO). Guide to Understanding Alberta’s Electricity Market. 2023. Available online: https://www.aeso.ca/aeso/understanding-electricity-in-alberta/continuing-education/guide-to-understanding-albertas-electricity-market/ (accessed on 15 October 2024).
- Canada Energy Regulator (CER). Provincial and Territorial Energy Profiles—Canada. 2024. Available online: https://www.cer-rec.gc.ca/en/data-analysis/energy-markets/provincial-territorial-energy-profiles/provincial-territorial-energy-profiles-canada.html (accessed on 15 October 2024).
- Ministry of Business, Innovation and Employment. Chronology of New Zealand Electricity Reform. Energy Markets Policy, Energy & Resources Branch of Ministry of Business, Innovation and Employment. August 2015. Available online: https://www.mbie.govt.nz/assets/2ba6419674/chronology-of-nz-electricity-reform.pdf (accessed on 11 December 2023).
- Transpower. About Us. 2023. Available online: https://www.transpower.co.nz/ (accessed on 20 November 2023).
- Federal Energy Regulatory Commission (FERC). Electric Power Markets. 2023. Available online: https://www.ferc.gov/electric-power-markets (accessed on 27 November 2023).
- American Public Power Association. Wholesale Electricity Markets and Regional Transmission Organizations, Electricity Markets Issue Brief. 2023. Available online: https://www.publicpower.org/policy/wholesale-electricity-markets-and-regional-transmission-organizations-0 (accessed on 30 November 2023).
- PJM Interconnection, LLC. Capacity Market (RPM). 2023. Available online: https://www.pjm.com/markets-and-operations/rpm#:~:text=PJM’s%20capacity%20market%2C%20called%20the,energy%20demand%20in%20the%20future (accessed on 29 November 2023).
- PJM Interconnection, LLC. PJM Manual 18: PJM Capacity Market, Revision: 58, Effective Date: 15 November 2023. Prepared By Capacity Market & Demand Response Operations. 2023. Available online: https://www.pjm.com/~/media/documents/manuals/m18.ashx (accessed on 4 December 2023).
- Hancher, L.; de Hauteclocque, A.; Huhta, K.; Malgorzata, S. (Eds.) Capacity Mechanisms in the EU Energy Markets: Law, Policy, and Economics. Book, Energy Union Law. 2022. Available online: https://fsr.eui.eu/publications/?handle=1814/75007 (accessed on 15 October 2024).
- Raineri, R. Chile: Where it all started. Chapter 3. In Electricity Market Reform: An International Perspective; Sioshansi, F.P., Pfaffenberger, W., Eds.; Series: Global Energy Policy and Economics; Elsevier: Amsterdam, The Netherlands, 2006; Chapter 3; pp. 77–108. [Google Scholar]
- Ministerio de Energía Chile. Decreto Supremo No. 70 (DS 70), Ministerio de Energía, Chile. 2023. Available online: https://nuevo.leychile.cl/servicios/Consulta/Exportar?radioExportar=Normas&exportar_formato=pdf&nombrearchivo=Decreto-70-EXENTO_05-ABR-2023&exportar_con_notas_bcn=False&exportar_con_notas_originales=False&exportar_con_notas_al_pie=False&hddResultadoExportar=1190939.2023-04-05.0.0%23 (accessed on 20 January 2025).
- Cramton, P.; Stoft, S. A Capacity Market that Makes Sense. Electr. J. 2025, 18, 43–54. Available online: https://www.sciencedirect.com/science/article/abs/pii/S1040619005000850 (accessed on 12 September 2023). [CrossRef]
- Joskow, P.L. Capacity payments in imperfect electricity markets: Need and design. Util. Policy 2008, 16, 159–170. Available online: https://www.sciencedirect.com/science/article/abs/pii/S0957178707000926 (accessed on 12 September 2023). [CrossRef]
- Bushnell, J.; Flagg, M.; Mansur, E. Capacity Markets at a Crossroads. Energy Institute at Haas, Working Paper 278, April 2017. Available online: https://www.haas.berkeley.edu/wp-content/uploads/WP278Updated.pdf (accessed on 22 September 2023).
- Hogan, W.W. Electricity Scarcity Pricing Through Operating Reserves. Econ. Energy Environ. Policy 2013, 2, 65–86. Available online: https://www.pserc.cornell.edu/empire/2_2_a04.pdf (accessed on 22 September 2023). [CrossRef]
- Newbery, D. Missing money and missing markets: Reliability, capacity auctions and interconnectors. Energy Policy 2016, 94, 401–410. Available online: https://www.sciencedirect.com/science/article/abs/pii/S0301421515301555 (accessed on 14 September 2023). [CrossRef]
- de Vries, L.; Heijnen, P. The impact of electricity market design upon investment under uncertainty: The effectiveness of capacity mechanisms. Util. Policy 2008, 16, 215–227. Available online: https://www.sciencedirect.com/science/article/abs/pii/S0957178708000027 (accessed on 26 September 2023). [CrossRef]
- Bhagwat, P.C.; Iychettira, K.K.; Richstein, J.C.; Chappin, E.J.; De Vries, L.J. The effectiveness of capacity markets in the presence of a high portfolio share of renewable energy sources. Util. Policy 2017, 48, 76–91. Available online: https://www.sciencedirect.com/science/article/pii/S0957178716300406#:~:text=A%20decline%20or%20no%20growth,14 (accessed on 28 September 2023). [CrossRef]
- Hogan, W.W.; On an “Energy Only” Electricity Market Design for Resource Adequacy. Center for Business and Government, John F. Kennedy School of Government, Harvard University, 23 September 2005. Available online: https://scholar.harvard.edu/whogan/files/hogan_energy_only_092305.pdf (accessed on 22 September 2023).
- Bajo-Buenestado, R. Welfare implications of capacity payments in a price-capped electricity sector: A case study of the Texas market (ERCOT). Energy Econ. 2017, 64, 272–285. Available online: https://www.sciencedirect.com/science/article/abs/pii/S0140988317301032 (accessed on 26 September 2023). [CrossRef]
- Brown, D.P. Capacity payment mechanisms and investment incentives in restructured electricity markets. Energy Econ. 2018, 74, 131–142. Available online: https://www.sciencedirect.com/science/article/abs/pii/S0140988318302068 (accessed on 28 September 2023). [CrossRef]
- Simshauser, P. On intermittent renewable generation & the stability of Australia’s National Electricity Market. Energy Econ. 2018, 72, 1–19. Available online: https://www.sciencedirect.com/science/article/abs/pii/S0140988318300562 (accessed on 24 September 2023).
- Levin, T.; Botterud, A. Electricity market design for generator revenue sufficiency with increased variable generation. Energy Policy 2015, 87, 392–406. Available online: https://www.sciencedirect.com/science/article/abs/pii/S0301421515300999 (accessed on 24 September 2023). [CrossRef]
- Grubb, M.; Newbery, D. UK Electricity Market Reform and the Energy Transition: Emerging Lessons. Energy J. 2018, 39, 1–26. Available online: https://www.jstor.org/stable/26606242 (accessed on 24 September 2023). [CrossRef]
- Schwenen, S. Market design and supply security in imperfect power markets. Energy Econ. 2014, 43, 256–263. Available online: https://www.sciencedirect.com/science/article/abs/pii/S0140988314000395 (accessed on 26 September 2023). [CrossRef]
- Commission de Regulation de L’Energie. Wholesale Electricity Market. 2023. Available online: https://www.cre.fr/en/Electricity/Wholesale-electricity-market/wholesale-electricity-market (accessed on 21 November 2023).
- Guénaire, M.; Dufour, T.; George, E.; Assayag, S.; Nouel, G.L. “Lectricity Regulation in France: Overview. In Practical Law, Thomson Reuters. 2020. Available online: https://www.gide.com/sites/default/files/electricity_regulation_in_france_overview_7-629-75671.pdf (accessed on 21 November 2023).
- des Comptes, C.; Organization oe the Electricity Markets. Rapport Public Thématique, Public Policy Evaluation, July 2022. Available online: https://www.ccomptes.fr/system/files/2022-10/20220705-Organisation-electricity-markets-summary.pdf (accessed on 27 November 2023).
- Southface Institute, Vote Solar. Understanding the Electricity System in Georgia. Draft prepared by Southface Institute and Vote Solar, May 2018. Available online: https://www.southface.org/wp-content/uploads/2018/05/Georgia-Electricity-System-Primer-May-2018-Draft.pdf (accessed on 27 November 2023).
- WRAL NEWS. “Big Electricity Users Push for Competition in NC Energy Market”. NC State Capitol Bureau, State Capitol News. 2023. Available online: https://www.wral.com/story/big-electricity-users-push-for-competition-in-nc-energy-market/20943043/ (accessed on 28 November 2023).
- Tennesse Valley Authority. Tennesse Valley Authority. 2023. Available online: https://www.tva.com/ (accessed on 27 November 2023).
- Public Utilities Commission, State of Hawaii. Electric Utilities. 2023. Available online: https://puc.hawaii.gov/energy/ (accessed on 29 November 2023).
- Hawaiian Electric. Hawaiian Electric. 2023. Available online: https://www.hawaiianelectric.com/ (accessed on 29 November 2023).
- Alaska Energy Authority Alaska Energy Authority. 2023. Available online: https://www.akenergyauthority.org/ (accessed on 29 November 2023).
- Alaska Power Association. Alaska Power Association. 2023. Available online: https://alaskapower.org/ (accessed on 29 November 2023).
- Raineri, R.; Arce, R.; Sebastián Ríos, S.; Carlos Salamanca, C. From a bundled energy-capacity pricing model to an energy–capacity–ancillary services pricing model. Energy Policy 2008, 36, 2878–2886. [Google Scholar] [CrossRef]
- Becker, E. Análisis del Mercado Eléctrico Argentino: Impacto de la Regulación en su Funcionamiento. Departamento de Economía, Universidad Nacional del Sur, Trabajo de Grado de la Licenciatura en Economía. 2020. Available online: https://repositoriodigital.uns.edu.ar/bitstream/handle/123456789/5378/Becker%2C%20Eleonora_%20Tesis%20de%20Grado%202020.pdf?sequence=1&isAllowed=y (accessed on 21 November 2023).
- Comité de Operación Económica del Sistema Interconectado Nacional COES SINAC. Comité de Operación Económica del Sistema Interconectado Nacional. 2023. Available online: https://www.coes.org.pe/portal/ (accessed on 29 November 2023).
- Yongping, Z.; Feng, Z.; Linan, P.; Yang, Y. The current state of China’s electricity market. China Dialogue, 1 September 2023. Available online: https://chinadialogue.net/en/energy/the-current-state-of-chinas-electricity-market/ (accessed on 29 November 2023).
- Hove, A. China’s New Capacity Payment Risks Locking in Coal. China Dialogue, 23 November 2023. Available online: https://chinadialogue.net/en/energy/chinas-new-capacity-payment-risks-locking-in-coal/ (accessed on 29 November 2023).
- Federal Energy Regulatory Commission (FERC). Open Access Transmission Tariff (OATT) Reform. Order No. 888: Promoting Wholesale Competition Through Open Access Non-discriminatory Transmission Services by Public Utilities; Recovery of Stranded Costs by Public Utilities and Transmitting Utilities. 2006. Available online: https://www.ferc.gov/power-sales-and-markets/open-access-transmission-tariff-oatt-reform (accessed on 18 October 2024).
- European Union. Regulation (EC) No 714/2009 of the European Parliament and of the Council of 13 July 2009 on Conditions for Access to the Network for Cross-Border Exchanges in Electricity and Repealing Regulation (EC) No 1228/2003, (Text with EEA Relevance). 2009. Available online: http://data.europa.eu/eli/reg/2009/714/oj (accessed on 18 October 2024).
- Araneda, J.C. El Sistema Eléctrico Chileno. Coordinador Eléctrico Nacional, Encuentro Virtual de la Región Iberoamericana de CIGRE (e-RIAC): Desafíos de la Operación en la Región Iberoamericana. Una Mirada Postpandémica. 2021. Available online: https://www.cigre.cl/wp-content/uploads/2021/07/Sistema-Electrico_CHILE__e_RIAC_2021.pdf (accessed on 18 October 2024).
- Energy Networks Australia. Guide to Australia’s Energy Networks. 2021. Available online: www.energynetworks.com.au/assets/uploads/Guide-to-Australias-Energy-Networks_2021-1.pdf (accessed on 18 October 2024).
- Coordinador Eléctrico Nacional. Coordinador Eléctrico Impulsa Licitación de Obras de Ampliación del Sistema de Transmisión por más de US$ 34,5 Millones. 13 November 2024. Available online: https://www.coordinador.cl/novedades/coordinador-electrico-impulsa-licitacion-de-obras-de-ampliacion-del-sistema-de-transmision-por-mas-de-us-345-millones/ (accessed on 18 October 2024).
- Agência Nacional de Energia Elétrica (ANEEL). Transmissão. 2024. Available online: https://www.gov.br/aneel/pt-br/assuntos/transmissao (accessed on 18 October 2024).
- Centro Nacional de Control de Energía (CENACE). Quiénes Somos. 2024. Available online: https://www.cenace.gob.mx/CENACE.aspx (accessed on 18 October 2024).
- Nuclear Energy Agency (NEA). The Costs of Decarbonisation: System Costs with High Shares of Nuclear and Renewables. OECD Publishing, Paris. 2019. Available online: https://www.oecd-nea.org/jcms/pl_15000/the-costs-of-decarbonisation-system-costs-with-high-shares-of-nuclear-and-renewables?details=true (accessed on 27 November 2024).
- Howland, E.E. PJM It Will Remain Profitable to Sell PJM Capacity That You Can’t Deliver. Utility Dive, 28 September 2023. Available online: https://www.utilitydive.com/news/pjm-interconnection-board-capacity-market-proposal-ferc-reliability/695037/ (accessed on 25 November 2024).
- Energy Information Administration (EIA). Levelized Costs of New Generation Resources in the Annual Energy Outlook 2023. 2023. Available online: https://www.eia.gov/outlooks/aeo/electricity_generation/pdf/AEO2023_LCOE_report.pdf#:~:text=URL%3A%20https%3A%2F%2Fwww.eia.gov%2Foutlooks%2Faeo%2Felectricity_generation%2Fpdf%2FAEO2023_LCOE_report.pdf%0AVisible%3A%200%25%20 (accessed on 30 November 2023).
- National Renewable Energy Laboratory (NREL). Power Plant Cycling Costs. Conducted by the National Renewable Energy Laboratory (NREL). 2012. Available online: https://www.nrel.gov/docs/fy12osti/55433.pdf (accessed on 29 November 2024).
- Savin, O.S.; Badina, C.; Baroth, J.; Charbonnier, S.; Berenguer, C. Start and Stop Costs for Hydro Power Plants: A Critical Literature Review. In Proceedings of ESREL 2020—PSAM 2020—30th European Safety and Reliability Conference and 15th International Probabilistic Safety Assessment and Management Conference, Venice, Italy, 1–5 November 2020. Paper# 4102. [Google Scholar] [CrossRef]
- Van den Bergh, K.; Delarue, E. Cycling of conventional power plants: Technical limits and actual costs. Energy Convers. Manag. 2015, 97, 70–77. [Google Scholar] [CrossRef]
- Schill, W.P.; Pahle, M.; Gambardella, C. On Start-Up Costs of Thermal Power Plants in Markets with Increasing Shares of Fluctuating Renewables. Deutsches Institut für Wirtschaftsforschung, 2016, Berlin. Available online: https://d-nb.info/115301274X/34 (accessed on 10 November 2024).
- Xu, T.; Birchfield, A.B.; Gegner, K.M.; Shetye, K.S.; Overbye, T.J. “Application of Large-Scale Synthetic Power System Models for Energy”. In Proceedings of the 50th Hawaii International Conference on System Sciences, Hilton Waikoloa Village, HI, USA, 4–7 January 2017; pp. 3123–3129. Available online: http://hdl.handle.net/10125/41535 (accessed on 20 November 2023).
- Coordinado Eléctrico Nacional. Resumen Ejecutivo Estudio de Desgaste de SSCC. 2022. Available online: https://www.coordinador.cl/mercados/documentos/servicios-complementarios/estudio-de-costos-de-desagste-sscc/2022-estudio-de-costos-de-desagste-sscc/ (accessed on 18 November 2023).
- Coordinado Eléctrico Nacional. Estudio de Costos de los Servicios Complementarios Sistema Eléctrico Nacional 2024–2027. 2024. Available online: https://www.coordinador.cl/mercados/documentos/servicios-complementarios/estudio-de-costos-de-sscc/estudio-de-costos-sscc-2024/ (accessed on 20 November 2024).
- Energy Information Administration (EIA). About 25% of US Power Plants Can Start Up Within An Hour. 2020. Available online: https://www.eia.gov/todayinenergy/detail.php?id=45956 (accessed on 20 November 2024).
- National Renewable Energy Laboratory (NREL). (2018). Operational Analysis of the Eastern Interconnection at Very High Renewable Penetrations. 2018. Available online: https://www.nrel.gov/docs/fy18osti/71465.pdf (accessed on 20 November 2024).
- US Energy Information Administration (EIA). Annual Energy Outlook 2019 with Projections to 2050. 2019. Available online: https://biomassmurder.org/docs/2019-03-05-eia-annual-energy-outlook-2019-with-projections-to-2050-english.pdf (accessed on 15 December 2023).
- Huang, C.; Han, D.; Yan, Z.; Li, Y.; Sun, C.; Jia, Q. Bidding strategy of energy storage in imperfectly competitive flexible ramping market via system dynamics method. Int. J. Electr. Power Energy Syst. 2022, 136, 107722. [Google Scholar] [CrossRef]
- Ela, E.G.; O’Malley, M. Scheduling and Pricing for Expected Ramp Capability in Real-Time Power Markets. Power Syst. IEEE Trans. 2015, 31, 1681–1691. [Google Scholar] [CrossRef]
- Harvey, S. System Market Power: HASP Based Mitigation Design Discussion. Member, California ISO Market Surveillance Committee, Western Imbalance Market, 30 July 2020. Available online: https://www.caiso.com/documents/systemmarketpowermitigationdiscussion-harvey-presentation-july30_2020.pdf (accessed on 20 October 2024).
- International Energy Agency IEA. Status of Power System Transformation 2019 Power system flexibility. May 2019. Available online: https://iea.blob.core.windows.net/assets/00dd2818-65f1-426c-8756-9cc0409d89a8/Status_of_Power_System_Transformation_2019.pdf (accessed on 27 September 2024).
- Wiser, R.; Mills, A.; Seel, J.; Levin, T.; Botterud, A. Impacts of Variable Renewable Energy on Bulk Power System Assets, Pricing, and Costs. Lawrence Berkeley National Laboratory. 2017. Available online: https://emp.lbl.gov/publications/impacts-variable-renewable-energy (accessed on 10 September 2024).
- Federal Energy Regulatory Commission (FERC). State of the Markets Report 2019. Federal Energy Regulatory Commission, 19 March 2020. Available online: https://www.ferc.gov/sites/default/files/2020-04/2019StateoftheMarketsReport.pdf (accessed on 8 December 2023).
- Barbose, G. US States Renewables Portfolio & Clean Electricity Standards: 2024 Status Update. Lawrence Berkeley National Laboratory. 2024. Available online: https://emp.lbl.gov/publications/us-state-renewables-portfolio-clean-0 (accessed on 15 September 2024).
- Federal Energy Regulatory Commission (FERC). 2023 State of the Markets. Office of Energy Policy and Innovation, 21 March 2024. Staff Report. Available online: https://www.ferc.gov/media/2023-state-markets-report (accessed on 21 July 2024).
- California Independent System Operator (CAISO). Annual Report on Market Issues and Performance. Department of Market Monitoring, CAISO 29 July 2024. Available online: https://www.caiso.com/documents/2023-annual-report-on-market-issues-and-performance.pdf (accessed on 15 August 2024).
- Neeley, J. Understanding Negative Prices in the Texas Electricity Market. R Street Institute. 2021. Available online: https://www.rstreet.org/commentary/understanding-negative-prices-in-the-texas-electricity-market/ (accessed on 1 September 2024).
- Monitoring Analytics, LLC. State of the Market Report for PJM 2017. Independent Market Monitor for PJM, 8 March 2018. Available online: https://www.monitoringanalytics.com/reports/PJM_State_of_the_Market/2017/2017-som-pjm-volume1.pdf (accessed on 28 January 2025).
- Shrestha, S.; O’Konski, K. Third Circuit Upholds FERC’s Approval of PJM’s Focused MOPR. Troutman Pepper, Posted in Market Policy, 11 December 2023. Available online: https://www.troutmanenergyreport.com/2023/12/third-circuit-upholds-fercs-approval-of-pjms-focused-mopr/ (accessed on 24 February 2024).
- Wilson, J. Over-Procurement of Generating Capacity in PJM: Causes and Consequences. Wilson Energy Economics, Report Prepared for Sierra Club Natural Resources Defense Council. 2021. Available online: https://wilsonenec.com/dev/wp-content/uploads/2021/10/Wilson-Overprocurement-of-Capacity-in-PJM.pdf (accessed on 7 October 2024).
- Hogan, W. Electricity Market Design and Zero-Marginal Cost Generation. Curr. Sustain./Renew. Energy Rep. 2022, 9, 15–26. [Google Scholar] [CrossRef]
- Hogan, M. Follow the missing money: Ensuring reliability at least cost to consumers in the transition to a low-carbon power system. Electr. J. 2017, 30, 55–61. Available online: https://www.sciencedirect.com/science/article/pii/S1040619016302512#sec0035 (accessed on 7 October 2024). [CrossRef]
- Milstein, I.; Tishler, A. On the effects of capacity payments in competitive electricity markets: Capacity adequacy, price cap, and reliability. Energy Policy 2019, 129, 370–385. Available online: https://www.sciencedirect.com/science/article/pii/S0301421519301119 (accessed on 7 October 2024). [CrossRef]
- Lavin, L.; Murphy, S.; Sergi, B.; Apt, J. Dynamic operating reserve procurement improves scarcity pricing in PJM. Energy Policy 2020, 147, 111857. Available online: https://www.sciencedirect.com/science/article/pii/S0301421520305747 (accessed on 7 October 2024). [CrossRef]
- US Department of Energy. National Transmission Needs Study. October 2023. Available online: https://www.energy.gov/gdo/national-transmission-needs-study (accessed on 20 August 2024).
- Jowett, P. Negative Electricity Prices Registered in Nearly All European Energy Markets. PV Magazine, 10 April 2024. Available online: https://www.pv-magazine.com/2024/04/10/negative-electricity-prices-registered-in-nearly-all-european-energy-markets/ (accessed on 14 June 2024).
- European Commission. Report on energy prices and costs in Europe. 22 March 2024 (COM(2024) 136 Final). Available online: https://eur-lex.europa.eu/legal-content/EN/TXT/PDF/?uri=CELEX:52024DC0136 (accessed on 10 October 2024).
- AleaSoft Energy Forecasting. European Electricity Markets React to Increased Wind Energy Production with Price Declines. 17 June 2024. Available online: https://aleasoft.com/decreases-european-market-prices-increase-wind-energy/ (accessed on 7 October 2024).
- Horsch, A.; Aust, B. Negative market prices on power exchanges: Evidence and policy implications from Germany. Electr. J. 2020, 33, 106716. Available online: https://www.sciencedirect.com/science/article/pii/S1040619020300087 (accessed on 10 October 2024).
- Council of European Energy Regulators (CEER). Status Review of Renewable Support Schemes in Europe for 2020 and 2021. Report, Renewables Work Stream of Electricity Working Group Ref: C22-RES-80-04 28 September 2023. Available online: https://www.ceer.eu/wp-content/uploads/2024/04/RES_Status_Review_in_Europe_for_2020-2021.pdf (accessed on 10 October 2024).
- De Vos, K. Negative Wholesale Electricity Prices in the German, French and Belgian Day-Ahead, Intra-Day and Real-Time Markets. Electr. J. 2015, 28, 36–50. Available online: https://www.sciencedirect.com/science/article/pii/S1040619015000652#:~:text=Pages%2036%2D50-,Negative%20Wholesale%20Electricity%20Prices%20in%20the%20German%2C%20French%20and%20Belgian,Day%20and%20Real%2DTime%20Markets&text=Negative%20prices%20are%20a%20correct,caused%20by%20renewable%20support%20mechanisms (accessed on 10 October 2024). [CrossRef]
- International Energy Agency (IEA). Woorld Energy Outlook Special Report: Batteries and Secure Energy Transitions. 2024. Available online: https://iea.blob.core.windows.net/assets/cb39c1bf-d2b3-446d-8c35-aae6b1f3a4a0/BatteriesandSecureEnergyTransitions.pdf (accessed on 3 October 2024).
- Joos, M.; Staffell, I. Short-term integration costs of variable renewable energy: Wind curtailment and balancing in Britain and Germany. Renew. Sustain. Energy Rev. 2018, 86, 45–65. Available online: https://www.sciencedirect.com/science/article/pii/S1364032118300091 (accessed on 3 October 2024). [CrossRef]
- Nicolosi, M. Wind power integration and power system flexibility—An empirical analysis of extreme events in Germany under the new negative price regime. Energy Policy 2010, 38, 7257–7268. Available online: https://www.sciencedirect.com/science/article/abs/pii/S0301421510005860 (accessed on 28 September 2023). [CrossRef]
- European Commission. Quarterly Report on European Electricity Markets with Focus on Annual Overview for 2023. Market Observatory for Energy, DG Energy Volume 16 (Issue 4, Covering Fourth Quarter of 2023). 2024. Available online: https://static.smartgridsinfo.es/media/2024/06/New-Quarterly-Report-on-European-Electricity-markets-Q4-2023.pdf (accessed on 28 January 2024).
- Evol Services. Pérdidas De Energía Aumentan Y Alcanzan Más Del 18% De Producción Eólica Y Solar Del País En El Primer Trimestre. 2024. Available online: https://services.evol.energy/2024/04/15/perdidas-de-energia-aumentan-y-alcanzan-mas-del-18-de-produccion-eolica-y-solar-del-pais-en-el-primer-trimestre/ (accessed on 25 July 2024).
- Csereklyei, Z. Price and income elasticities of residential and industrial electricity demand in the European Union. Energy Policy 2020, 137, 111079. [Google Scholar] [CrossRef]
- Wang, Y.; Wu, L. Improving economic values of day-ahead load forecasts to real-time power system operations. IET Gener. Transm. Distrib. 2017, 11, 4238–4247. [Google Scholar] [CrossRef]
- Monitoring Analytics, LLC. 2023 Annual State of the Market Report for PJM. 2024. Available online: www.monitoringanalytics.com/reports/PJM_State_of_the_Market/2023/2023-som-pjm-vol2.pdf (accessed on 6 June 2024).
- Coordinador Electrico Nacional. Operational Data for 2022 and 2023 from Coordinador Electrico Nacional, Desviación de la Demanda Programada. 2024. Available online: https://www.coordinador.cl/ (accessed on 1 June 2024).
- Adhikari, U. Solving Price Volatility in Renewable Energy Wholesale Markets Renewable Energy Procurement. The Sol Source, Third Quarter 2019, 05 November 2019, pg. 6–9. Available online: https://www.solsystems.com/wp-content/uploads/2019/11/Sol_SOURCE_Q3.pdf (accessed on 15 June 2024).
- García Bernal, N. Condición de Inflexibilidad del GNL en el Sistema Eléctrico Nacional. Biblioteca del Congreso Nacional de Chile, Asesoría Técnica Parlamentaria, June 2021. Available online: https://obtienearchivo.bcn.cl/obtienearchivo?id=repositorio/10221/32301/1/BCN___Condicion_de_inflexibilidad_del_GNL.pdf (accessed on 19 December 2023).
- Gaamouche, R.; Chinnici, M.; Lahby, M.; Abakarim, Y.; Hasnaoui, A. Machine Learning Techniques for Renewable Energy Forecasting: A Comprehensive Review. In Computational Intelligence Techniques for Green Smart Cities. Green Energy and Technology; Lahby, M., Al-Fuqaha, A., Maleh, Y., Eds.; Springer: Cham, Switzerland, 2022. [Google Scholar] [CrossRef]
- Vionis, P.; Kotsilieris, T. The Potential of Blockchain Technology and Smart Contracts in the Energy Sector: A Review. Appl. Sci. 2024, 14, 253. [Google Scholar] [CrossRef]
- US Department of Energy. Virtual Power Plants. 2024. Available online: https://www.energy.gov/lpo/virtual-power-plants (accessed on 10 November 2024).
- Fournely, C.; Pečjak, M.; Smolej, T.; Türk, A.; Neumann, C. Flexibility markets in the EU: Emerging approaches and new options for market design. In Proceedings of the 18th International Conference on the European Energy Market (EEM), Ljubljana, Slovenia, 13–15 September 2022; pp. 1–7. [Google Scholar] [CrossRef]
- European Commission. Clean Energy for All Europeans Package. Official Publications. 2020. Available online: https://energy.ec.europa.eu/topics/energy-strategy/clean-energy-all-europeans-package_en#electricity-market-design (accessed on 9 December 2024).
- Australian Renewable Energy Agency (ARENA). Virtual Power Plant in South Australia Stage 1 Milestone Report. 31 July 2017. Available online: https://arena.gov.au/assets/2017/02/VPP-SA-Public-Milestone-1-Report-Final-for-issue.pdf (accessed on 9 December 2024).
- Australian Renewable Energy Agency (ARENA). Virtual Power Plant in South Australia Stage 2 Public Report. 15 June 2018. Available online: https://arena.gov.au/assets/2017/02/virtual-power-plants-in-south-australia-stage-2-public-report.pdf (accessed on 9 December 2024).
- Tokyo Electric Power Company (TEPCO). TEPCO Looks to the Transformative Potential of Blockchain by Investing in Electron, a UK Energy Technology Company. Announcement 19 Jan 2018. Available online: https://www.tepco.co.jp/en/announcements/2018/1473674_15434.html (accessed on 3 December 2024).
- Losanova, S. What Is a Virtual Power Plant (VPP)? Greenlancer. 2024. Available online: https://www.greenlancer.com/post/virtual-power-plants-vpps (accessed on 3 December 2024).
- Electric Power Research Institute EPRI. Vermont Green P2P Trading. EPRI Tech Portal. 2024. Available online: https://techportal.epri.com/demonstrations/demo/ubig/7FzJj6XWufc3QP08AqlfzC (accessed on 3 December 2024).
- Energy Web. About Energy Web. 2024. Available online: https://www.energyweb.org/about (accessed on 3 December 2024).
- Kraken. What Is Energy Web Token? (EWT). Kraken Learn Team, 19 Jan 2022. Available online: https://www.kraken.com/learn/what-is-energy-web-token-ewt (accessed on 3 December 2024).
- Energy Web. LO3 Energy Updates Pando Platform, Migrates to Energy Web Chain. Medium.com. 24 September 2020. Available online: https://medium.com/energy-web-insights/lo3-energy-updates-pando-platform-migrates-to-energy-web-chain-d709ae0e5311 (accessed on 3 December 2024).
- European Commission. Electricity Market Design. Energy, Climate Change, Environment. 2023. Available online: https://energy.ec.europa.eu/topics/markets-and-consumers/electricity-market-design_en?utm_source=chatgpt.com (accessed on 7 November 2024).


| Fuel Type | Ramp Rate (% of Rated Capacity Per Min) * | Start-Up Costs (USD/MW/Start) * | Shut-Down Costs (USD/MW/Shut-Down) * | Start-Up Time (Hours) * | Shut-Down TIME (Hours) * | Minimum On Time (Hours) * | Minimum Off Time (Hours) * | Cost of Wear and Tear (USD/MWh) For Primary and Secondary Frequency Control ** |
|---|---|---|---|---|---|---|---|---|
| Coal | 0.6–8 | 100–250 | 10–25 | 4–9 | 2–9 | 0–12 | 0–12 | 1.087–1.760 |
| Natural gas | 0.8–30 | 20–150 | 2–15 | 2–4 | 1–4 | 0–2 | 0–1 | 1.243–1.824 |
| Nuclear | 0–5 | 1000 | 1000 | 24 | 24 | Days | Days | 0.029 |
| Hydro | 15–25 | 0–5 | 0–0.5 | 0–1 | 0–1 | 0–1 | 0–1 | 2.722–4.714 Dum; 0.029 Run of River |
| Wind | Non-dispatchable | - | - | - | - | - | - | 0.006–0.070 |
| Solar | Non-dispatchable | - | - | - | - | - | - | 0.006–0.235 PV 0.017 CSP |
| Battery storage | 0–100 | Varies | Varies | <0.25 | <0.25 | <1 | <1 | 0.042 (PV + BEES) |
| Diesel | 2–5 | 5–20 | 1–5 | 0.25–0.5 | 0.17–0.33 | 1–2 | 1–2 | 0.043 |
Disclaimer/Publisher’s Note: The statements, opinions and data contained in all publications are solely those of the individual author(s) and contributor(s) and not of MDPI and/or the editor(s). MDPI and/or the editor(s) disclaim responsibility for any injury to people or property resulting from any ideas, methods, instructions or products referred to in the content. |
© 2025 by the author. Licensee MDPI, Basel, Switzerland. This article is an open access article distributed under the terms and conditions of the Creative Commons Attribution (CC BY) license (https://creativecommons.org/licenses/by/4.0/).
Share and Cite
Raineri, R. Power Shift: Decarbonization and the New Dynamics of Energy Markets. Energies 2025, 18, 752. https://doi.org/10.3390/en18030752
Raineri R. Power Shift: Decarbonization and the New Dynamics of Energy Markets. Energies. 2025; 18(3):752. https://doi.org/10.3390/en18030752
Chicago/Turabian StyleRaineri, Ricardo. 2025. "Power Shift: Decarbonization and the New Dynamics of Energy Markets" Energies 18, no. 3: 752. https://doi.org/10.3390/en18030752
APA StyleRaineri, R. (2025). Power Shift: Decarbonization and the New Dynamics of Energy Markets. Energies, 18(3), 752. https://doi.org/10.3390/en18030752