Abstract
EU countries have committed to taking national measures to reduce the average energy use of residential buildings by 16% by 2030 and 20–22% by 2035. Each country has decided how to achieve this and which buildings to focus on. However, certain categories of residential buildings, including historical buildings but also second homes, may be exempt from these obligations. In Sweden, second homes constitute a substantial part of the housing stock and contribute to energy use for heating and hot water of 2.79 TWh, of which 2.16 TWh is electricity. Even if the owners of second homes are not obliged to take energy efficiency measures, quite simple and inexpensive measures may contribute to substantial energy savings. In this study, simulations of energy use in 862 second homes heated with direct electric heating were carried out for five energy efficiency measures (additional attic insulation, new windows, air-to air heat pump and decreasing the temperature during absence to 10 and 5 °C). With the assumption that the 862 second homes are representative of the entire stock of electric-heated second homes in Sweden, the energy saving potential was estimated to be 1.17 TWh per year if all homes install heat pumps and 0.99 TWh and 1.30 TWh per year if all lower the temperature to 10 °C or 5 °C when the house is not used.
1. Introduction
Buildings in the European Union (EU) collectively account for 40% of energy use and 36% of greenhouse gas emissions, primarily due to activities such as construction, usage, renovation, and demolition (EUs Green Deal) [1]. Enhancing energy efficiency in buildings is therefore crucial for achieving the ambitious goal of carbon neutrality by 2050. The European Commission has adopted a set of proposals to make the EU’s climate, energy, transport and taxation policies fit for reducing net greenhouse gas emissions by at least 55% by 2030, compared to 1990 levels, as outlined in the European Green Deal. The Fit for 55′ legislative package sets the EU on a path to reach its climate targets by 2030 in a fair, cost effective and competitive way [2]. Recently, the EU has introduced new, ambitious policies to guide member states towards improved energy efficiency in buildings. A key policy is the revised Energy Performance of Buildings Directive (EU/2024/1275) that entered into force in all EU countries on 28 May 2024, which will support the increasing rate of renovation in the EU [3]. National Building Renovation Plans (NBRPs) [4] are newly introduced policy elements in the recast Energy Performance of Buildings Directive (EPBD 2024/1275) [3]. Under the revised legislation, EU countries have committed to taking national measures to reduce the average energy use of residential buildings by 16% by 2030 and 20–22% by 2035. Each country will decide how to achieve this and which buildings to focus on, taking into account factors such as the existing building stock and the local climate. However, certain categories of residential and non-residential buildings, including historical buildings but also holiday homes or second homes, may be exempt from these obligations [5]. The term “second homes” is used hereafter as it more accurately reflects their usage, which extends beyond holidays to include longer stays by individuals working remotely or those who are retired. Second homes are defined here as valuation units without registered inhabitants, taxed as agricultural units with buildings, small house units with buildings, small houses on freehold land, or small house units with a building value under SEK 50,000 (EUR 4400).
The electricity use in second homes has shown a consistent upward trend over the years. This increase is particularly notable as these properties are now frequently utilized year-round by retirees and holidaying families. The intensified year-round usage has led to higher electricity demands, primarily for space heating and hot water production. For instance, in Norway, electricity use surged by 97% from 1973 to 2005 [6]. This rise can be attributed to the fact that many second homes were initially constructed for summer use and thus often lack adequate insulation. In Sweden, the total energy used for heating and hot water in single- or two-family houses was 29.7 TWh in the year 2023, of which 15.5 TWh was electricity, with household electricity excluded. The second homes constitute a substantial part of the stock and contribute to an energy usage for heating and hot water of 2.79 TWh, of which 2.16 TWh is electricity. Recently published statistics from the Swedish Energy Agency show that there were 544,000 second homes in Sweden in 2023, with an average energy use of 5132 kWh per year for heating and hot water (not including household electricity) [7]. The second homes were heated 146 days on average, which is a substantial part of the heating season, even though they were only used 86 days on average, which means that these houses are heated unduly for long periods [7]. The statistics also show that the most frequent source of heating is air-to air heat pumps in combination with direct electric heating or/and biofuel (27%), followed by direct electric heating (24%). Even though many have already installed an air-to air heat pump, there are still a lot of houses heated with direct electric heating using electrical radiators, which could be the target for energy efficiency. Despite the fact that second homes are using a substantial amount of energy for heating and most likely have poor energy performance compared to permanent residential houses, these are exempted from the legislation on energy performance declaration [5]. Only about 24,000 Swedish second homes hold an energy performance certificate (EPC), presumedly prompted by a sale or lease of the house [8]. This means that there are little incentives for the second homeowners to decrease their energy use except for reducing the energy bill.
However, to reach the energy goals by 2033/2035, all should contribute. Even if the owners of second homes are not obliged to take energy efficiency measures, quite simple and inexpensive measures may contribute to quite substantial energy savings, with limited impacts of thermal comfort or contributions to global warming potential or resources. In many cases, measures like installing new windows or renovating the existing ones, insulating the attic or changing the boiler to an air-to-air heat pump have the potential to deliver substantial energy performance improvements—without the need for more extensive renovation works. However, purchasing and installing new materials and products imply a substantial carbon footprint and resources from production. Therefore, energy efficiency measures should be chosen so that the total climate footprint, both from production and operation, is reduced.
Since second homes are not used all the time, and probably not fully heated either, the energy for operation and heating is substantially lower than for permanent residency. This means that the energy efficiency measures that are usually recommended for detached houses do not necessarily have to be the most effective from a climate and resource perspective for second homes [9]. In this stock, simpler measures such as installing an air-to-air heat pump and controlling the temperature to lower levels when the house is not in use would be more suitable [10].
However, it is crucial to ensure that a lower temperature does not lead to moisture damage and that installation of a heat pump does not compromise cultural–historical values [11,12]. A Finnish study measuring hourly relative humidity and temperature in unheated, uninsulated cottages and outdoors found that the monthly average vapor content inside is generally lower than outside, except during certain periods in spring and when the cottage is occupied [13]. Winter visits that involve heating tend to dry out the cottage, maintaining the relative humidity below 80%, which is critical for preventing mold growth on organic materials. Introducing constant heating to raise the temperature by approximately 3 °C compared to outdoors resulted in a 10% decrease in relative humidity, significantly reducing the risk of condensation and mold growth [13]. An even more effective strategy would be to implement intermittent heating during critical climatic conditions to mitigate the risk of mold growth [13,14]. However, many insurance companies in Sweden recommend, and in some cases require, second homes to be heated to a temperature of at least 15 °C, even though this may not be justifiable when energy use must be reduced in all buildings.
Despite the prevalence of second homes in many countries, particularly in the Nordic region and Europe, and their relatively low energy performance compared to permanent residences, there is a lack of substantial research on this part of the building stock. Although these houses are being used, heated, and cooled for a significant part of the year, there is very little focus on the energy saving potential of this part of the housing stock. Most former studies have used a top-down approach, carrying out simulations on energy use based on geo data of the building stock.
Tuominen et al. (2014) developed a novel calculation tool (REMA) for assessing the effects of various energy efficiency measures in buildings on the scale of the whole building stock of Finland. REMA is based on representative building types (archetypes), such as detached houses, apartment buildings, commercial and public buildings and second homes, for estimating energy use including electricity for heating and electricity excluding heating in different segments of the building stock [15]. Their forecast for energy use for the heating of Finish homes in 2020 suggests a total of 70 TWh, whereof 19.7 TWh is electricity, and second homes usage is 2.3 TWh for heating, whereof 0.4 TWh is electricity [15].
Another top-down approach was used to map the spatial distribution of energy profiles, both for permanent houses and second homes on small Mediterranean islands experiencing an issue with increasing energy demands for space cooling and domestic hot water, especially during summer [16]. Ferrari et al. (2023) simulated hourly electric and thermal energy density load profiles using a dynamic energy simulation software with input from register data on the buildings’ footprints dimensions and construction year. The simulation was applied to the island of Pantelleria, Sicily (southern Italy), as representative of remote urban areas featured by high electric peaks in summer season. The outcomes of the method included the maps generated for the spatial analysis of residential buildings’ energy-related features and hourly energy demand, as a tool supporting the identification of sites where investing in energy measures and/or the promotion of energy communities could take place [16].
In a similar study, Andersson et al. (2008) simulated the energy use in Danish second homes combining top-down estimations based on a time series of total electricity use and number of second homes, combined with bottom-up analyses of estimated use based on measured electricity use for specific second homes, and the number of second homes of different types, considering heat losses and electricity used for appliances combined with four user patterns [17].
Only a few studies used a bottom-up approach, like the study conducted by Johnston et al. (2017) on detailed in situ thermal fabric tests to assess the energy performance on five new second homes in the UK, which indicated that the performance gap appears to be narrower than that documented for newbuild UK housing in general [18]. Similarly, detailed simulations of three second homes in Sweden were made by Gutke and Mjörnell (2024) with the aim to evaluate the effect of introducing different energy efficiency measures on the energy use and the global warming potential (GWP). The results showed that the most energy-efficient measure is to install an air-to-air heat pump, whereas the lowest GWP was achieved by simply lowering the temperature when the house is unoccupied [9].
Based on the simulations made by Gutke and Mjörnell (2024) of the potential energy savings in one of the second homes, used as a “pilot house”, the energy saving potential of 673 randomly selected second homes in Sweden was estimated based on the owner’s information on user behavior and heating methods [10]. The results show that installing an air-to-air heat pump in all second homes that do not already have one would decrease the total energy use by 56%, whereas lowering the temperature when the house is not occupied could decrease the energy use by more than 40%. Even though the simplification of assuming that all second homes can be represented by a “pilot house”, it is an attempt to obtain a picture of the energy saving potential in the national second home stock [10]. Similar results were shown in a focused study on energy use in second homes in winter sport areas [19].
Given the limited number of studies estimating the energy efficiency potential at building stock level for second homes, especially when it comes to considering different usage patterns and tailored energy efficiency measures for each individual building, there is a need for more bottom-up studies forecasting the energy saving potential at the stock level. It still remains unclear how much less energy and electricity in particular are needed to heat the second home stock without sacrificing comfort or the building durability.
The current study is therefore based on information of measured energy use in almost 24,000 Swedish second homes holding an energy performance certificate (EPC) [8], with a focus on a selection of 862 second homes heated with direct electric heating, located in four municipalities in Sweden that have a significant number of second homes. Simulations of energy use after implementing different energy efficiency measured were conducted, given the specific information for each house.
The overall aim was to estimate the energy saving potential in the Swedish second home stock heated by electric heating. One objective of this study was to develop a tool to simulate the energy use in second homes based on the energy performance, outdoor climate, user pattern and heating method of the specific house. The other objective was to simulate the effect of implementing a number of energy efficiency measures including attic insulation, installing new windows, air-to-air heat pump and decreasing the heating temperature when the house is unoccupied in a substantial number of second homes heated with direct electricity located in municipalities with a high frequency of second homes. The results could both be used to advise second homeowners on energy efficiency measures and energy-conscious operation but also form the basis for the design of policy and incitements for energy efficiency in the second home stock.
2. Materials and Methods
2.1. Compilation and Curation of Data
The data used for this study were collected from the Swedish EPC register [8]. Since 2006, it has been mandatory for single-family buildings with a living space of more than 50 square meters to have an energy performance certificate (EPC) at the point of sale or lease. The energy declaration is carried out by a certified energy expert and contains information about the property’s energy performance, energy use and possible energy efficiency measures. The EPC is valid for ten years and must be updated if there are changes in the property that may affect its energy performance. The EPC specifies an energy class for the building based on the building’s energy performance compared to the permissible energy performance of a new building (class C). Residential buildings that are used or intended for use for less than four months per year are exempt from the requirement for an EPC, which means that most second homes do not have one. However, there are exceptions if the house has been sold or used as a permanent residence for some time. These certificates are archived at the National Board of Housing, Building and planning, but the data were requested from Statistics Sweden [8]. Except for the energy use (kWh per m2 and year) and energy class (A–G), the EPC contains building specific information on the municipality in which the house is located, construction and reconstruction year, heated floor area (m2) and main heating method (direct electricity, electricity to water, air to air heat pump, exhaust air heat pump, oil, firewood, gas, etcetera). A data set with information of second homes’ energy use was requested from the EPC database of Swedish single-family houses with the extracts made in autumn 2024 [8]. The information retrieved covered almost 24,000 second homes holding an EPC.
From this set of data, the second homes heated with direct electric heating were separated out. Direct electric heating implies that there are electric radiators in each room, which means that all electric energy supplied to the electric radiator will be converted to heat. Possible losses may be caused by voltage losses in electric cables, but they are usually located close to the inside or on the inside and rather small, and therefore these losses were neglected in this work.
2.2. Development of a Simulation Software
For two reasons, a new simulation code and user-friendly simulation software were developed to fulfil the aim of analysing the energy efficiency measures of second homes and producing a simulation software for second homes owners and actors with an interest in second homes and possible energy measures [20]. The simulation is based on both occupant behaviour and energy performance of the house. First, the occupant-related schedules (user patterns) of a second home are not constructed as normal schedules in dwellings or premises. Therefore, a new type of schedule generator would make input data generation easier. Second, there is a need for a simple-to-use software for users that are not familiar with energy simulation software such as Energyplus [21] or IDA ICE [22]. The current version of the software resolves systems and features related to what is needed for evaluating energy measures in second homes in outdoor climates similar to the Swedish one. A typical user would be the owners of second homes but also people working in municipality planning and legislation, etc. There is also the need for a free software that can be accessed by a wider range of people.
In order to make the simulation software as simple as possible, some limitations were necessary. One limitation was to not include cooling systems in the energy calculations since second homes in Sweden generally have no cooling systems. Another is domestic hot water since its saving potential is negligible in second homes used in a normal way due to the low annual occupancy, so this was also excluded. However, internal heat loads that affect the heat balance were included. Additionally, both ventilation and leakage, which affect the heat balance the entire year, and solar radiation, since it adds heat all year, were included.
A typical heating strategy for a second home is to heat to one setpoint temperature, for example, 22 °C (22 degrees Celsius), when the second home is occupied and to another, for example, 10 °C, when not. This is also a very useful measure to decrease energy use. This type of varying indoor temperature must be handled carefully, which means that the simulation software must include thermal storage inside the insulation. The use of heat pumps is a very useful energy efficiency measure and was included in the simulation software with an assumed constant coefficient of performance.
The basis for the simulation code is the ISO 13790 standard [23], which describes the heating balance of a building where transmission losses (PTrans), ventilation losses (Pvent), unintentional leakage losses (PLeak), solar radiation gains (PSolar), internal heat loads (Pload) and heat transfer between heat a storage element inside the insulation (PStore) are included, as shown in Equation (1). Pheat is the needed heating power at a particular moment.
The heat transmission losses, Ptrans, are the sum of all external envelope areas, AWalls, ARoof and Afloor, multiplied with their U-values, UWalls, URoof and UFloor, and the temperature difference between indoors, tin, and outdoors, tout, as shown in Equation (2).
The power from the heat storage, PStore, is the temperature difference between the storage element, tStore and indoors, tin, multiplied with the heat transfer coefficient, α, and the envelope area, as shown in Equation (3). The new storage temperature in the next step of the simulation is the old temperature minus the power from the heat storage divided by the heat capacity of the envelope inside the insulation, cpm, multiplied with the envelope area, as shown in Equation (4).
The ventilation losses, Pvent, are based on the heat capacity of the air, cp air, multiplied with the temperature difference scaled down with the heat recovery efficiency, η, as shown in Equation (5).
The unintentional leakage losses, PLeak, are assumed to be a ratio of the envelope area multiplied with the leakage factor, lf, as shown in Equation (6). With exhaust ventilation, a is assumed to be 0.01 and with supply-end exhaust ventilation or no ventilation, a is assumed to be 0.05 based on experience from energy calculation software.
The power from the incoming solar radiation, Psolar, is the incoming component in each compass direction, north, east, west and south, taken from the outdoor climate file from Meteonorm [24] described below scaled by the window g-value multiplied by the window area.
The heating power is always assumed to be enough for the given hours and setpoints and input data. When the needed heating power is zero, the indoor temperature is resolved and rises above the set temperature, which results in higher temperatures in summer, since it is assumed that there is no cooling system.
In Table 1, the input parameters included in the developed code and simulation software are shown. The aim is to lower the number of parameters to a minimum and to still resolve the relevant part of the relevant energy measures to make it user friendly. Added to the code is the thermal mass inside the insulation, cpm, with a default value of 100 kJ/(m2·K) and the heat transfer coefficient between the thermal mass inside the insulation and the interior, α, which is on average assumed to be 5 W/(m2·K).

Table 1.
Input parameters for the simulation software.
The data representing the outdoor climate at ten locations in Sweden were collected from Meteonorm 7’s latest data for a normal year [24] and consisted of outdoor air temperature and global solar radiation towards a vertical surface in each direction, north, south, west and east, for each hour, as shown in Table 2. The simulation time resolution is hourly, and the algorithm analyzes a year with assumed internal loads and typical outdoor climate data and obtains the annual energy use for heating as the sum of the hourly energy use over the year. The normal year climate data mean that the software is not directly suitable for maximum power design since the extreme years are not considered.
Table 2.
Outdoor climates implemented in the simulation software.
The user schedule is inspired by former studies of the user patterns of Swedish second homeowners [10]. It is interpreted that the occupancy is in the form of a few consecutive days that repeat themselves in an evenly distributed pattern a certain number of times during four different periods of the year. These four periods of the year are winter (December–January), spring (March–May), summer (June–August) and fall (September–November). This is supposed to include different behaviours both in the skiing season and in the summer season. Full occupancy can be modelled by increasing the number of visits and consecutive days over these three months, respectively. It is assumed that the house is occupied with an average of the number of people given and with the internal heat load given. The resulting occupancy schedule over the year can be visualised in the software. The input of user pattern data is made to be as user friendly as possible and still represents rather typical behaviour.
2.3. Verification of the Software Performance Using Five Case Houses
To verify the software, comparisons were made using input data from five unique second homes located at different geographical locations in Sweden (Gotland, Orust, Dalsland, Dalarna and Umeå) with relatively known energy performance in terms of energy use from energy bills, technical specifications for presumed U-values, window areas, etc., and user patterns in terms of periods of use at different seasons. For one newly built second home owned by one of the authors, accurate data were available on the insulation levels and construction as well as logged energy use. The data were retrieved from the authors and their colleagues with second homes. The input data as well as the simulated output are shown in Appendix A.
The energy use calculated with the simulation software is in most cases somewhat lower than the real energy use, which can be explained by the fact that the total energy use based on the energy bill also includes heating of hot water and household electricity for appliances. An assumed template value of household electricity of 30 kWh per square meter for permanent residency is suggested by SVEBY, a sector standard for the calculation of energy use for houses [25]. Considering the size of the houses and how often the second homes are used, an estimated household electricity use was assumed and excluded from the simulated energy use, as shown in the second last row in Appendix A.
The owner of House C has stated that a heat pump is used for heating, but the simulated energy use is considerably lower than the measured energy use. However, if the simulation is made without a heat pump, the simulated energy use is higher, which indicates that the heat pump is probably used but not constantly or in the whole house. In total, the simulated values on yearly energy use for the five second homes are relatively consistent with those measured, which means that the simulation software has sufficiently good accuracy and may be considered feasible for calculations of the energy use in second homes in general.
2.4. Simulation of Energy Use in Second Homes Heated with Direct Electricity
A significant number of simulations were made in the simulation software (fritid.exe) [20] with input data from the EPC register [8]. The data set includes all second homes with an EPC, with direct electricity as their main heating source, located in four municipalities in Sweden: Båstad (southwest coast), Gotland (island on east coast), Malung-Sälen (middle inland) and Åre (middle-north mountain). For each specific house, input data on energy use, heated area and construction year were retrieved from the EPC register. Based on the construction year, the U-values were estimated according to the criteria in Table 3. The area of the façade, roof and foundation, type of ventilation and heating system as well as outdoor climate data and indoor temperatures were chosen according to the criteria outlined in Table 4.
Table 3.
Criteria for input data for thermal performance of the building envelope in the simulation.
Table 4.
Criteria for input data for different parameters in the simulation for the basic scenario.
After the basic scenario was simulated, several different energy efficiency measures were introduced and the energy use was simulated for the alternative scenarios, which included additional 15 cm insulation in the attic or roof, changing to new energy-efficient windows, installing a heat pump, and lowering the temperature in the house when not occupied to 10 or 5 °C respectively, as shown in Table 5.
Table 5.
Input data for specific parameters altered in the alternative scenarios.
2.5. Estimation of Energy Saving Potential for the Second Home Stock in Sweden
To estimate the energy efficiency potential of the entire stock of Swedish second homes, we based our calculations on the potential assessments for second homes with an energy performance certificate (EPC). However, since only a fraction of Swedish second homes have an EPC, the results need to be scaled up. Assuming that second homes with an EPC are representative of all second homes in a municipality, the number of second homes heated with direct electric heating can be estimated by multiplying the proportion of electrically heated second homes with an EPC by the proportion of second homes with an EPC and the total number of second homes in the respective municipality. The total energy saving potential in the municipality can then be multiplied by the estimated number of houses heated by direct electric heating.
Assuming that the results from the simulated energy saving potential in the 862 second homes in the four municipalities are representative of all Swedish second homes, these may be scaled to national level by multiplying the average saving of all second homes heated by electricity. According to Swedish energy statistics, there are approximately 132,000 Swedish second homes heated by direct electric heating (24.3%) [7].
3. Results
In 2023, the Swedish stock of second homes consisted of 544,000 properties, according to statistics from the Swedish Energy Agency [7]. The municipalities with the most second homes are Norrtälje (23,176), Värmdö (11,490), and Gotland (10,236), followed by the winter sports municipalities of Härjedalen (8804) and Malung-Sälen (7337), with the fewest in Sundbyberg [8], as shown in Figure 1a. According to information from the EPC register, there were nearly 24,000 second homes with an energy performance certificate (EPC), representing 4.4% of the total number of second homes [8]. The municipalities with the most EPC-certified second homes are Gotland (606), Malung-Sälen (604), Norrtälje (597), and Båstad (580), as shown in Figure 1b. The proportion of second homes with an ECP in the municipalities under study as well as the total proportion will be used for scaling up the energy saving potential to the national level.
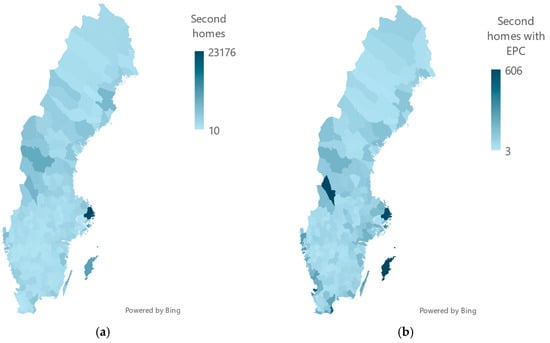
Figure 1.
Total number of second homes (a) and number of second homes with an EPC (b) in each of the Swedish municipalities.
Each building with an energy performance certificate (EPC) is assigned an energy class based on the primary energy number as a measure of the building’s energy performance. The main heating method is reported in the energy declaration and is presented for each energy class in Figure 2.
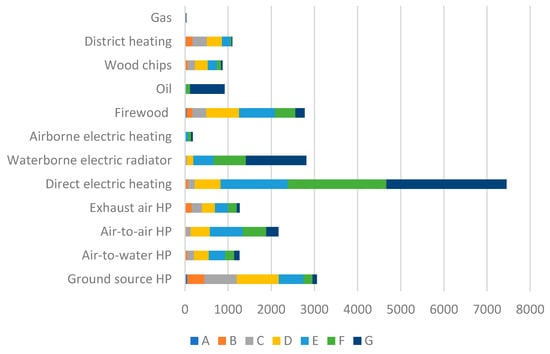
Figure 2.
Main heating source and energy classes (A–G) for second homes with an EPC.
Most second homes fall into energy classes E, F, and G. The majority (31.5%) use direct electric heating as the primary heating system. Some have installed an air-to-air heat pump, which is likely to reduce electricity use. Ground-source heat pumps are more common in second homes with high energy classes (A–D), probably because it is a significantly larger investment than installing an air-to-air heat pump. Quite a few houses are heated by wood burning. The EPC also includes information on whether the building has a special value or is a protected building, as this affects the proposed energy efficiency measures. Based on statistics from all second homes with an energy declaration, the distribution shows that most second homes are in energy classes E–G and are mainly heated by direct electric heating.
The calculated energy use for the basic scenario (heated all year) and alternative scenarios, such as additional 15 cm insulation in the attic or roof, changing to new energy-efficient windows, installing an air-to-air heat pump, and lowering the temperature in the house when not occupied to 10 or 5 °C (y-axis), versus measured energy use (x-axis) for second homes in four municipalities is presented in Figure 3, Figure 4, Figure 5 and Figure 6.
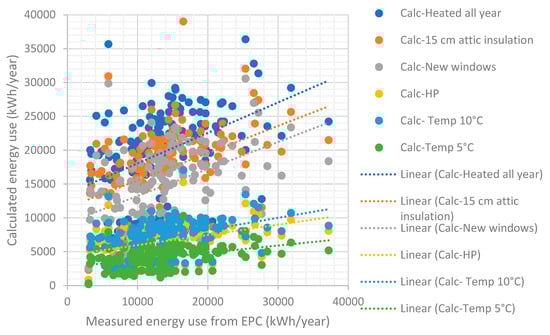
Figure 3.
Calculated energy use for different scenarios versus measured energy use according to EPC for second homes in Gotland.
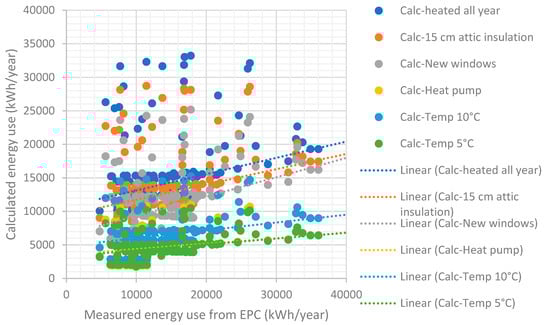
Figure 4.
Calculated energy use for different scenarios versus measured energy use according to EPC for second homes in Malung-Sälen.
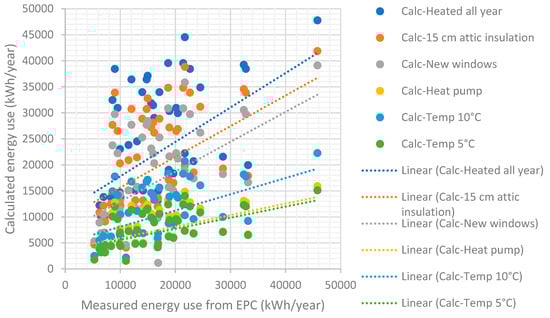
Figure 5.
Calculated energy use for different scenarios versus measured energy use according to EPC for second homes in Åre.
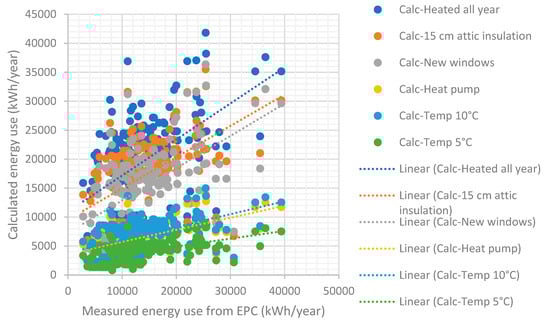
Figure 6.
Calculated energy use for different scenarios versus measured energy use according to EPC for second homes in Båstad.
The results clearly show that the measured energy use falls within the range between the highest (assuming the house is always heated to at least 22 °C) and the lowest (assuming the house is heated to at least 5 °C) calculated energy use. This indicates that some energy efficiency measures have been implemented in the house or that the temperature is reduced between stays. However, in many cases, the measured energy use is higher than calculated, which could be due to poorer energy performance than assumed or that electric heating is used for other purposes, such as heating of garages, pools, saunas, etc. The average measured energy use for all second homes with an EPC that are heated with direct electric heating in the four municipalities is shown in Table 6, together with the average calculated energy use for the following different scenarios: heated all year, additional 15 cm insulation in the attic or roof, changing to new energy-efficient windows, installing a heat pump, and lowering the temperature in the house when not occupied to 10 or 5 °C, respectively. The column headings in Table 6 show the number of second homes heated with direct electric heating and the total number of second homes with an EPC in each municipality.
Table 6.
Average energy use for all second homes with an EPC and heated with direct electric heating and calculated energy use for the following scenarios: heated all year round; additional 15 cm attic insulation; new windows; installing av heat pump; decreasing the temperature between visits to 10 °C and 5 °C, respectively. Energy efficiency compared to measured energy use in percentage is shown in brackets.
In order to scale up the results from the 862 second homes for with the calculations of energy efficiency potential were made according to national level, some assumptions must be made. According to the Swedish Energy Agency (2024), the percentage of second homes heated with direct electricity is 24.3%. With a total amount of 544,000 second homes in Sweden, this means that approximately 132,192 are heated with direct electric heating, as shown in Table 7.
Table 7.
Number of second homes and the proportion of second homes with an EPC and heated with direct electric heating, in the municipality of Båstad, Gotland, Malung-Sälen and Åre and in Sweden.
The potential decreases in energy use, assuming all second homes with an EPC that are heated with direct electric heating in the four municipalities implemented different energy efficiency measures, are shown in Table 8.
Table 8.
Potential energy reduction if all second homes with EPCs and heated with direct electric heating (number in bracket) in the four municipalities implemented different energy efficiency measures. All numbers are in GWh per year.
With the assumption that the 862 second homes in the four municipalities are representative for the entire stock of electric heated second homes in Sweden (132,192 houses), the energy saving potential was estimated by simply multiplying the results with a scaling factor of 153, which is 132,192 divided by 862, as shown in Table 9.
Table 9.
Potential energy reduction if all second homes in Sweden with EPCs (132,192 houses) and heated with direct electric heating implemented different energy efficiency measures. All numbers are in TWh per year.
It was concluded that if all the homes installed a heat pump and continued to heat their houses when unoccupied, the energy use could decrease by 1.17 TWh per year, and if all lower the temperature to 10 °C or 5 °C when the house is not occupied, the energy use could be decreased by 0.99 TWh/year and 1.30 TWh per year, respectively. However, decreasing to 5 degrees of Celsius must be combined with some kind of humidity control using either dehumidification or humidity-controlled intermittent heating [13].
4. Discussion
The current study encompasses a large number of simulations of energy use in second homes heated with direct electric heating. Assuming that five different energy efficiency measures (15 cm additional insulation, installing new windows, installing air-to-air heat pump and decreasing the temperature at absence to 10 and 5 degrees of Celsius, respectively) are implemented, the energy efficiency potential has been calculated for 862 second homes located in four municipalities in Sweden. The results have then been scaled up to national level to estimate the potential decrease in energy use for all second homes heated by direct electric heating, providing that they implement the measures mentioned above.
One advantage of conducting a bottom-up study that is subsequently scaled up is that it is based on measured energy use and conditions of actual buildings, with relatively accurate estimated energy performance and realistic usage patterns. The drawback is that a large number of simulations of individual houses are required to obtain a representative sample according to Andersen et al. (2008) [17] and Mjörnell (2024) [10], in contrast to top-down simulations by Ferrari et al. (2023) [16].
However, the developed user-friendly and open access software enabled simulations of an extensive number of second homes for which the energy savings from installing an air-to-air heat pump, additional attic insulation or new windows were compared with those involving lowering the temperature when the house is unoccupied, by accounting for factors such as outdoor climate and the building’s energy performance.
The verification of the software, comparing results from calculations with measured energy use in five second homes where the user pattern and heating pattern are relatively well known, shows that the accuracy between measured and calculated energy use is sufficiently good.
Not surprisingly, the results show an intriguing argument for reducing indoor temperature in second homes as a significant energy saving measure. This strategy is particularly effective when the property is infrequently occupied or used for short periods. Even though several insurance companies in Sweden mandate a minimum indoor temperature of 15 °C to prevent freezing and subsequent leakage of water pipes and installations, maintaining a temperature of at least 5 °C in the entire house should not pose any freezing issues. However, an increased moisture risk is a potential risk that must be addressed by future studies.
On the other hand, installing an air-to-air heat pump is the second most energy-efficient and cost-effective measure in houses in all municipalities and has the advantage that the indoor temperature can be maintained at rather high levels even though the heating source is concentrated at the location of the heat pump. Another advantage is that it is relatively easy to install without extensive interventions. However, most air-to-air heat pumps have a set point not lower than around 10 °C. Despite this limitation, at certain levels of occupancy, installing an air-to-air heat pump would still provide significant energy savings. On the other hand, production of an air-to-air heat pump involves an embodied energy-causing global warming potential (GWP), just like the refrigerant, that also must be considered when making decisions on energy efficiency measures, which was shown by Gutke and Mjörnell (2024) [9]. This discussion underscores the complexity of energy efficiency measures, where the benefits of reduced energy consumption must be weighed against the climate impact of the solutions themselves. In other words, this highlights the need for a holistic approach to energy efficiency, one that considers not only the operational phase but also the manufacturing and disposal phases of the technologies involved. Recent statistics from the Swedish Energy Agency (2024) [7] show that about 45% of Swedish second homes have already installed a heat pump and most commonly an air-to-air heat pump (35%), which is positive and reassuring for future energy savings. It is important to note that this study only included heating and not cooling, since the focus is on Swedish second homes where cooling is rarely used, whereas in other countries, the main challenge is to decrease energy use for cooling [16].
The results from the current study correspond quite well with earlier studies based on user and heating patterns stated by 673 owners in a questionnaire combined with energy simulations for one pilot house conducted by Mjörnell (2024) [10]. Installation of an air-to-air heat pump lies in the range from 52 to 68%, compared to 56% in the former study, and reduced temperature to 10 °C or 5 °C between visits lies between 38 and 50% and 58–70%, respectively, compared to 44% in the former study, whereas installing attic insultation and new windows showed less effect in this study compared to the former one [10].
The findings from this study clearly show that the average measured energy use falls within the range between the highest (assuming the house is always heated to at least 22 °C) and the lowest (assuming the house is heated to at least 5 °C) calculated energy use. This indicates that some energy efficiency measures have been implemented or that the temperature is reduced between stays. In fact, most second homes maintain significantly lower temperatures than 22 degrees year-round, according to previous surveys by Mjörnell (2024) [10] and statistics from the Swedish Energy Agency (2024) [7].
Specifically, the measured energy use in second homes located in Båstad, Gotland and Åre is generally lower than the simulated energy use for the scenario in which the house is heated all year, whereas the average for those located in Malung-Sälen is slightly higher. This indicates that the owners in Båstad, Gotland and Åre probably maintain a lower temperature than 22 °C between visits, while the owners in Malung-Sälen keep the heating on. One explanation as to why the measured energy use exceeded the calculated energy use even for the scenario in which the house is heated all year could be the overly optimistic assumptions about the energy performance in terms of the thermal insulation and airtightness of the building envelope. This means that there is a gap between actual performance and required energy performance according to building regulations [5], which stands in contrast to the findings by Johnston et al. (2017) [18], indicating a narrower gap between measured and required energy performance for five newly built second homes than for newly built homes in general in the UK. However, another reason could be that the household uses energy for other purposes within the property besides heating the house itself, such as heating a pool, sauna, or garage that has not been included as a heated space, which was also observed in the study by the Swedish Energy Agency [7]. This seems to be the most probable reason for many houses in Malung-Sälen, which is in line with results from another study on second homes in winter sport areas in particular [19], but also for a few large houses in Båstad.
Above all, this clearly demonstrates the misleading nature of basing the energy certification and classification for energy classes of second homes on measured energy use rather than calculated energy use, as energy use is highly dependent on usage and heating patterns.
The percentage of second homes heated with direct electric heating that hold an EPC is much higher in Malung-Sälen (76%) and Åre (61%) than in Sweden on average (31.1%), even though the proportion of new houses in the winter sport area Malung-Sälen is particularly high, which can only be explained by owners not being aware of or sensitive to high energy prices.
It is also remarkable that the average measured energy uses according to EPCs for second homes heated by direct electricity in the four municipalities are considerably higher than the average energy use of 5132 kWh per year for Swedish second homes according to recently published statistics from Swedish Energy Agency (2024) [7]. This indicates that second homes heated by direct electric heating use much more energy than Swedish second homes in general, which strongly motivates the argument that the suggested energy efficiency measures are focused on this specific part of the stock.
The scaling up of the results to a national level clearly indicates that installation of air-to-air heat pumps would result in a potential reduction in total electricity use for heating of at least 1.1 TWh, even if the temperature is maintained at 22 degrees, and an even greater reduction if the temperature is maintained at 15 degrees, which is a recommendation given by many insurance companies. Provided that the temperature in the second home is maintained at 15 °C, it could also advantageous to install an air-to-air heat pump, which can be operated and controlled remotely.
If the temperature is set at 10 degrees between visits, a reduction of approximately 1 TWh per year can be achieved even without a heat pump. The recommendation to lower the temperature between visits must be complemented with instructions for intermittent heating or dehumidification to ensure that the relative humidity is below critical levels and avoid the risk of damage caused by freezing and moisture damage, including mould growth.
The possible reduction corresponds to almost half of the total electricity used to heat Swedish second homes (2.16 TWh) and is therefore an important measure to reach the energy goal for 2030 and 2035. Even though this study was limited to Swedish second homes heated by direct electric heating, the results are most probably representative of second home stocks in other countries in norther regions relying on electricity for heating.
5. Conclusions
To summarize, this research has resulted in a user-friendly and open access software for simulating the effect of different energy efficiency measures on energy use, which has been used to estimate the energy saving potential in second homes heated by direct electric heating in four Swedish municipalities. Overall, the results show there is a huge potential to decrease the energy use in second homes heated by direct electric heating. On one hand, installing an air-to-air heat pump is a very energy-efficient measure in houses in all municipalities and has the advantage that the indoor temperature can be maintained at rather high levels to a reasonable energy cost. The effect is even more pronounced in cold climates (Malung-Sälen and Åre) than in milder ones (Båstad and Gotland). However, since the production of the air-to-air heat pump itself generates GHG emissions, just like the refrigerant, this must be accounted for when the life cycle environmental impact in terms of GHG emissions from heating the second home is estimated. On the other hand, the most efficient and simple measure, in terms of cost and climate impact, is obviously to keep the temperature at low levels (5 to 10 °C) when the second home is not in use. Even though lowering the temperature when the second home is unoccupied emerges as the most efficient measure, both in terms of cost-effectiveness and climate impact, there is always a risk of freezing and moisture damage.
Finally, scaling up the results to national level indicates that by installing air-to-air heat pumps in all Swedish second homes heated by direct electric heating, the energy use can be decreased by at least 1.1 TWh, or even more if the temperature is maintained at a lower temperature than 22 °C. The reduction corresponds to almost half the total energy used to heat Swedish second homes (2.79 TWh) and more than half of 2.16 TWh, which represents electricity. This is a necessary measure to reach the energy goal for 2030 and 2035.
As a final point, it is recommended to use the calculated energy use (as a measure of the energy class) in the EPC for second homes, rather that the measured energy use. A reason for this is that the measured energy use stated in the energy performance certificate does not give a fair indication of the energy performance of the second home, since user and heating patterns have a significant influence. The measured energy use may be very low in case the house is not heated between visits, which does not say anything about the actual energy performance. The same building may have a totally different energy use (and energy class) if the user pattern changes considerably.
The plan is that an English version of the user-friendly and open access software simulation tool for simulating the effect of different energy efficiency measures on energy use will be available in the near future. In the meantime, the Swedish version may be used alongside the parameters in Table 1.
Author Contributions
Conceptualization, K.M.; methodology, K.M. and D.J.; software, D.J.; validation, K.M. and D.J.; formal analysis, K.M.; investigation, K.M.; resources, K.M.; data curation, K.M.; writing—original draft preparation, K.M.; writing—review and editing, K.M. and D.J.; visualization, K.M.; project administration, K.M.; funding acquisition, K.M. and D.J. All authors have read and agreed to the published version of the manuscript.
Funding
This study has been conducted as part of the research project “Energieffektivisering och varsam renovering av fritidshus” P2022-00125 funded by Spara & Bevara, The Swedish Energy Agency.
Data Availability Statement
The data presented in this study are available on request from the corresponding author due to GDPR.
Acknowledgments
The authors wish to acknowledge financial support from the research programme Spara & Bevara by the Swedish Energy Agency. The authors also want to acknowledge Tim Johansson at the Research Institutes of Sweden for his help with retrieving and curating the data from Statistics Sweden.
Conflicts of Interest
The authors declare no conflicts of interest.
Abbreviations
The following abbreviations are used in this manuscript:
| EPC | Energy performance certificate |
| GHG | Greenhouse gas |
| GWP | Global warming potential |
Appendix A
Table A1.
Input data for verification of the energy use estimated by the simulation software against measured energy use.
Table A1.
Input data for verification of the energy use estimated by the simulation software against measured energy use.
| Parameter | Unit | House A | House B | House C | House D | House E |
|---|---|---|---|---|---|---|
| U-value walls | W/(m2·K) | 0.5 | 0.5 | 0.5 | 0.23 | 0.25 |
| U-value roof | W/(m2·K) | 0.5 | 0.5 | 0.5 | 0.18 | 0.25 |
| U-value floor | W/(m2·K) | 0.5 | 0.5 | 0.5 | 0.18 | 0.50 |
| Leakage at 50 Pa test pressure per envelope area | L/(s·m2) | 1.6 | 1.6 | 1.6 | 0.4 | 0.8 |
| Area outer walls | m2 | 75 | 100 | 100 | 95 | 135 |
| Area roof/ground | m2 | 50 | 90 | 40 | 104 | 60 |
| Area floor (Atemp) | m2 | 50 | 90 | 60 | 88 | 116 |
| U value windows | W/(m2·K) | 6 | 6 | 6 | 1 | 3 |
| g value windows | W/(m2·K) | 0.7 | 0.7 | 0.7 | 0.6 | 0.5 |
| Area of windows facing north | m2 | 3 | 6 | 3 | 0 | 6 |
| Area of windows facing north | m2 | 3 | 6 | 3 | 0 | 6 |
| Area of windows facing east | m2 | 3 | 3 | 3 | 3 | 6 |
| Area of windows facing south | m2 | 3 | 1 | 3 | 7 | 6 |
| Area of windows facing west | m2 | 3 | 3 | 3 | 2 | 6 |
| Ventilation system | No | No | No | No | No | |
| Airflow from ventilation per floor area | L/(s·m2) | - | - | - | - | - |
| Heat recovery of ventilation | % | - | - | - | - | - |
| Type of heating | Direct electric heating | Direct electric heating | Heat pump | Direct electric heating | Direct electric heating | |
| COP heat pump | - | - | 3 | - | - | |
| Outdoor climate | Location | Visby | Göteborg | Malung-Sälen | Stockholm | Skellefteå |
| Added insulation in outer walls | Cm | - | - | - | - | - |
| Added insulation in roof | Cm | - | - | - | - | - |
| Added insulation on ground | Cm | - | - | - | - | - |
| User pattern | ||||||
| Consecutive days | 3 | 3 | 3 | 3 | 2 | |
| Periods in Dec, Jan, Feb | 3 | 3 | 3 | 3 | 2 | |
| Periods in March, April, May | 3 | 3 | 3 | 3 | 0 | |
| Periods in June, July, Aug | 10 | 10 | 10 | 3 | 25 | |
| Periods in Sep, Oct, Nov | 3 | 3 | 3 | 3 | 4 | |
| Number of users | 2 | 2 | 2 | 2 | 2 | |
| Internal heat gain except persons | W | 150 | 150 | 150 | 150 | 150 |
| Indoor temp when occupied | °C | 22 | 22 | 22 | 22 | 22 |
| Indoor temp between visits | °C | 0 | 5 | 12 | 10 | 10 |
| Total simulated energy use | kWh/(m2·yr) | 1257 | 5454 | 3968 | 1788 | 7628 |
| Total energy use (measured) | kWh/(m2·yr) | 1423 | 5909 | 6600 | 2400 | 8242 |
| Estimated electricity not part of heating | kWh/(m2·yr) | 234 | 422 | 281 | 620 | 591 |
| The measured energy use excluding electricity not part of heating | kWh/(m2·yr) | 1189 | 5487 | 6319 | 1780 | 7651 |
References
- The European Green Deal—European Commission. Available online: https://commission.europa.eu/strategy-and-policy/priorities-2019-2024/european-green-deal_en (accessed on 6 January 2025).
- EU Fit for 55: EU’s Target of Reducing Net Greenhouse Gas Emissions by at Least 55% by 2030. The Proposed Package Aims to Bring EU Legislation in Line with the 2030 Goal. Fit for 55—The EU’s Plan for a Green Transition—Consilium. Available online: https://european-union.europa.eu/index_en (accessed on 10 May 2024).
- Energy Performance of Buildings Directive (EU) 2024/1275 of the European Parliament and of the Council of 24 April 2024 on the Energy Performance of Buildings. Available online: https://eur-lex.europa.eu/eli/dir/2024/1275/oj/eng (accessed on 6 January 2025).
- Boverket 2020. Underlag Till Den Tredje Nationella Strategin för Energieffektiviserande Renovering. 2020. Available online: https://www.boverket.se/sv/om-boverket/publicerat-av-boverket/publikationer/2019/underlag-till-den-tredje-nationella-strategin-for-energieffektiviserande-renovering/ (accessed on 1 February 2025).
- Boverket 2023. Byggnader som Inte Behöver Energideklareras—Energideklaration—Boverket. Buildings for Which Energy Declaration Is Not Needed. Swedish Board of Housing Building and Planning. Available online: https://www.boverket.se/sv/energideklaration/energideklaration/dessa-byggnader-behover-inte-energideklareras/ (accessed on 1 February 2025).
- Aall, C. Hyttebruk og Miljø: En Arena for Nøysomhet Eller Overforbruk? In Norsk Hytter i Endring—Om Bærekraft og Behag; Gansmo, H.J., Berker, T., Jørgensen, F.A., Eds.; Tapir Akademisk Forlag: Trondheim, Norway, 2011. [Google Scholar]
- Swedish Energy Agency. Energy Energistatistik för Fritidshus 2023. Energy Statistics for Second Homes 2023. 2024. Available online: https://www.energimyndigheten.se/statistik/officiell-energistatistik/tillforsel-och-anvandning/energistatistik-for-fritidshus/ (accessed on 6 January 2025).
- SCB 2024. Statistics Sweden 2024. Data retrieved from the micro data register for single family houses.
- Gutke, J.; Mjörnell, K. Environmental impact of retrofitting second homes. In Proceedings of the BuildSim conference, Espoo, Finland, 9–11 June 2024. [Google Scholar]
- Mjörnell, K. Energy Efficiency in Seasonal Homes: A Study on the Occupancy, Energy Use, and Renovation of Second Homes in Sweden, Energies, September 2024. Available online: https://www.mdpi.com/1996-1073/17/17/4493 (accessed on 1 February 2025).
- Broström, T.; Leijonhufvud, G. Heat Pumps for Conservation Heating. Engineering, Environmental Science 2008. Available online: https://www.diva-portal.org/smash/get/diva2:461212/FULLTEXT02.pdf (accessed on 2 September 2024).
- Eriksson, P.; Johansson, T. Towards Differentiated Energy Renovation Strategies for Heritage-Designated Multifamily Building Stocks. Heritage 2021, 4, 4318–4334. [Google Scholar] [CrossRef]
- Vinha, J.; Piironen, J.; Kiviste, M. Impacts of Energy Efficient Constant Output Heating on the Moisture Conditions of Unoccupied Summer Cottages in Finland. In Cold Climate HVAC 2018; Johansson, D., Bagge, H., Wahlström, Å., Eds.; CCC 2018; Springer Proceedings in Energy; Springer: Cham, Switzerland, 2018. [Google Scholar]
- Viitanen, H.; Hukka, A. A mathematical model of mould growth on wooden material. Wood Sci. Technol. 1999, 33, 475–485. [Google Scholar]
- Tuominen, P.; Holopainen, R.; Eskola, L.; Jokisalo, J.; Airaksinen, M. Calculation method and tool for assessing energy consumption in the building stock. Build. Environ. 2014, 75, 153–160. [Google Scholar] [CrossRef]
- Ferrari, S.; Zagarella, F.; Caputo, P.; Beccali, M. Mapping Seasonal Variability of Buildings Electricity Demand profiles in Mediterranean Small Islands. Energies 2023, 16, 1568. [Google Scholar] [CrossRef]
- Andersen, F.M.; Christensen, M.S.; Jensen, O.M.; Kofoed, N.U.; Morthorst, P.E. Second-home electricity consumption. Energy Policy 2008, 36, 280–289. [Google Scholar] [CrossRef]
- Johnston, D.; Farmer, D.; Miles-Shenton, D. Quantifying the aggregate thermal performance of UK holiday homes. Build. Serv. Eng. Res. Technol. 2017, 38, 209–225. [Google Scholar] [CrossRef]
- Mjörnell, K.; Johansson, D. The use, energy use and renovation of Swedish second homes in winter sport areas. In IOP Conference Series Earth and Environmental Science; IOP Publishing: Bristol, UK, 2024. [Google Scholar]
- fritid.exe. Available online: http://www.d-j.se/energi_i_fritidshus.zip (accessed on 24 September 2024).
- DOE. EnergyPlus Essentials. 2024. Available online: https://energyplus.net/assets/nrel_custom/pdfs/pdfs_v24.1.0/EnergyPlusEssentials.pdf (accessed on 1 February 2025).
- EQUA. IDA ICE 5.1. 2024. Available online: https://www.equa.se/en/building-performances (accessed on 1 February 2025).
- EN ISO 13790; Energy Performance of Buildings—Calculation of Energy Use for Space Heating and Cooling. ISO: Geneva, Switzerland, 2018. Available online: https://www.sis.se/en/produkter/construction-materials-and-building/protection-of-and-in-buildings/thermal-insulation-of-buildings/sseniso137902008/#:~:text=This%20International%20Standard%20gives%20calculation%20methods%20for%20assessment,part%20of%20it%2C%20referred%20to%20as%20%E2%80%9Cthe%20building%E2%80%9D (accessed on 1 February 2025).
- Meteotest 2019, Meteonorm Handbook, Manual and Theoretical Background, Switzerland. Available online: http://www.meteonorm.com/ (accessed on 1 February 2025).
- SVEBY. Brukarindata Bostäder. User Data for Housing. 2012. Available online: https://sveby.org/wp-content/uploads/2012/10/Sveby_Brukarindata_bostader_version_1.0.pdf (accessed on 1 February 2025).
Disclaimer/Publisher’s Note: The statements, opinions and data contained in all publications are solely those of the individual author(s) and contributor(s) and not of MDPI and/or the editor(s). MDPI and/or the editor(s) disclaim responsibility for any injury to people or property resulting from any ideas, methods, instructions or products referred to in the content. |
© 2025 by the authors. Licensee MDPI, Basel, Switzerland. This article is an open access article distributed under the terms and conditions of the Creative Commons Attribution (CC BY) license (https://creativecommons.org/licenses/by/4.0/).