Article

Optimization of Biomass to Bio-Syntetic Natural Gas Production: Modeling and Assessment of the AIRE Project Plant Concept

by
Emanuele Di Bisceglie
1,
Alessandro Antonio Papa
1,*,
Armando Vitale
1,
Umberto Pasqual Laverdura
2,
Andrea Di Carlo
1 and
Enrico Bocci
3
1
Industrial Engineering Department, University of L’Aquila, 67100 L’Aquila, Italy
2
ENEA C. R. Casaccia, 00123 Rome, Italy
3
Department of Science Engineering, Guglielmo Marconi University, 00193 Rome, Italy
*
Author to whom correspondence should be addressed.
Energies 2025, 18(3), 753; https://doi.org/10.3390/en18030753
Submission received: 19 December 2024 / Revised: 22 January 2025 / Accepted: 3 February 2025 / Published: 6 February 2025

Abstract

:
This study focuses on the modeling, simulation, and optimization of an integrated biomass gasification and methanation process to produce bio-synthetic natural gas (Bio-SNG) as part of the AIRE project. The process was simulated using Aspen Plus® software (V14), incorporating experimental results from pilot-scale gasification setups. Key steps involved syngas production in a dual fluidized bed gasifier and its subsequent conversion to Bio-SNG in a methanation section. Heat integration strategies were implemented to enhance system results demonstrate that optimized heat recovery, achieved by utilizing exothermic methanation reactions to preheat gasification inputs, eliminates the need for auxiliary fuel in the gasification process. The optimized system achieved a thermal recovery rate of 80%, a cold gas efficiency of 79%, a Bio-SNG production rate of 0.4 Nm3/kgBiom, and a methane content of 85 vol.%. These optimizations reduced CO2 emissions by 10% while increasing overall energy efficiency. This work highlights the potential of integrating biomass gasification and methanation processes with heat recovery for sustainable methane production. The findings provide a basis for scaling up the process and further exploring syngas utilization pathways to produce renewable energy carriers.

1. Introduction

The World Meteorological Organization (WMO) report confirmed that 2023 was the warmest year to date, with a global average near-surface temperature of 1.45 °C above the pre-industrial baseline. This year also marked the warmest decade ever recorded [1]. Human activities are widely recognized as the main cause of the climate crisis due to increasing greenhouse gas emissions. Moreover, population growth is projected to further increase global energy demands and pollutant emissions [2]. According to projections from the United Nations, the global population is expected to rise to approximately 10.3 billion by the mid-2080s before gradually declining to 10.2 billion by the end of the century. These projections are driven by factors such as economic activity, fuel choices, and the energy and carbon intensity of industrial processes [3].
To address these challenges, substantial research and development efforts have focused on advancing and implementing renewable energy technologies to enable a sustainable transition. The International Energy Agency (IEA) defines renewable energy as “energy derived from natural processes that are replenished at a faster rate than they are consumed” [4]. Among renewable energy sources, biomass represents a key energy carrier for the near future, ranking third among primary energy sources after coal and oil [5]. Presently, the overall potential availability of biomass is estimated to be around 679 Mton/y (dry basis), divided into agricultural residue, forestry residue, the organic fraction of municipal solid waste, and secondary residues of the wood industry, which together represent a crucial source of energy feedstock [6]. Biomass holds significant potential due to its near-neutral effect on the overall carbon cycle, enabling reductions in the emission of carbon dioxide and other pollutants. Furthermore, biomass contributes to diversifying energy sources and decreasing dependence on fossil fuels [7,8,9].
In any energy framework, an accurate understanding of the characteristics of the main energy source is essential to determine the amount of available energy, to select the method of energy transformation that dictates the volume and type of energy that can be provided for ultimate applications, and for the effective management of the system. In particular, the analysis of the volatile matter (VM), ash, moisture, and the fixed carbon (FC) via elemental analysis allows us to evaluate the chemical energy that is stored in the biomass [10].
The thermo-chemical processing of biomass, such as through combustion, pyrolysis, and gasification, represent the main pathways for converting it into valuable products. These processes generate several products, such as high-energy gas (syngas), bio-oil, carbonaceous solids (biochar), and heat. The distribution and composition of these products are strongly related to the processing conditions [11,12].
In particular, syngas produced through the gasification process primarily consists of hydrogen (H2) and carbon monoxide (CO), with lower contents of carbon dioxide (CO2), water (H2O), methane (CH4), higher hydrocarbons, and nitrogen (N2). However, undesired byproducts such as tars and inorganic contaminants, including hydrogen sulfide (H2S) and hydrogen chloride (HCl), can also be present [13]. The downstream processes used for syngas conditioning and cleaning determine the final product composition and pollutant content. Among gasification technologies, the dual fluidized bed (DFB) gasifier allows for the production of rich hydrogen syngas [14]. By integrating gas cleaning and conditioning units, syngas quality can be further improved, enhancing the hydrogen content while reducing or eliminating pollutants [15,16].
Key applications of syngas include direct combustion for energy production [17] and its use as a precursor of products formed through chemical synthesis [18], such as the production of bio-synthetic natural gas (Bio-SNG) [19]. Bio-SNG is an attractive renewable fuel that combines the advantages of natural gas with those of biomass-derived energy, allowing both the possibility of atmospheric synthesis and the utilization of the biomass carbon present in syngas [20].
In the past two decades, advancements have been made in developing biological and catalytic methods for producing synthetic natural gas (SNG) from renewable resources. Catalytic SNG production typically involves two key strategies: (i) employing biogenic feedstocks through thermochemical processes, and (ii) harnessing renewable electricity via electrochemical pathways in conjunction with biogenic carbon dioxide.
From the former strategy, hybrid systems have also emerged, such as the one that involves the addition of secondary hydrogen in the process with the aim of increasing methane production and the additional use of the carbon in the starting biomass, which is generally present in higher amounts than the stoichiometric carbon needed in the methanation reaction.
The first Bio-SNG production strategy route was demonstrated in a large-scale application by the GoBiGas 30MW plant [21]. It consisted of a circulating fluidized bed gasifier coupled with a methanation section involving a pre-methanation reactor at 680 °C and 13.7 bar to adjust the composition, followed by four intercooled methanation reactors at 200 °C and 11.3 bar.
A different strategy was demonstrated by the advanced DFB pilot plant developed at TU Wien and described in the work of Bartik et al. [22]. It consisted of a dual fluidized bed reactor system for the gasification of the biomass. After the cleaning section, the syngas was fed to another dual fluidized bed system used for the methanation. This methanation reactor was designed for an SNG output of 10 kWth, and it was separated into two individually fluidized reaction zones operated in the bubbling bed regime.
Furthermore, the simulation processes used by Wan et al. and Ciccone et al. [23,24] constitute two more theoretical approaches. In the simulated process led by Wan et al. [24] both a gasification and a methanation reactor were modeled using RGibbs reactor blocks in Aspen Plus®, and the syngas produced was mixed with hydrogen from the electrolysis unit to increase the carbon conversion in the methanation reactor. Finally, Ciccone et al. [23] compared a process layout involving a single stage of methanation with a process layout using Bio-SNG recirculation. In this way, the dilution of the gas into the methanation reactor was achieved, reducing the operating temperature and leading to an increase in the overall process performance.
This study presents results obtained within the framework of the AIRE project, which aims to develop an integrated system for electricity generation and storage by coupling a DFB gasifier with various downstream processes [25]. Specifically, three process lines have been investigated as part of the project: the direct use of syngas in an internal combustor engine (ICE) for electricity generation, coupling the DFB gasifier with an electrolyzer/fuel cell system to store surplus electricity from a renewable energy source (RES) such as Bio-SNG to avoid grid instability, and the direct production of Bio-SNG from syngas following the initial production strategies discussed above.
Each of the process lines allows for the effective exploitation of biomass, supporting renewable energy and/or energy vector production. In particular, the potential use of various biomass feedstocks to produce bio-synthetic natural gas (SNG) presents an opportunity for countries to reduce carbon dioxide emissions and dependency on foreign energy suppliers.
Although, as described above, a DFB gasifier can produce hydrogen-rich syngas, the specific physical and chemical properties of hydrogen make the pipeline transmission challenging compared to natural gas, both from an economic and technological point of view [26]. Additionally, methane has a significantly higher volumetric energy density than hydrogen (36.53 MJ/m3 and 12.85 MJ/m3, respectively [27]), making it more suitable for storage and transportation. Consequently, methane remains a practical and efficient energy carrier for near-term applications; it has broad applicability (household heating, cooking, transport, and industry) and can be distributed and stored using the extensive existing natural gas infrastructure, supported by its well-established distribution infrastructure in many countries. Moreover, the integral role of methane across industrial, energy, and transportation sectors highlight its continued relevance in modern economies [28].
The gasification process is endothermic, requiring heat input. In a DFB reactor, this heat is typically supplied through the combustion of the residual char along with auxiliary fuel [29,30]. On the other hand, methanation reactions are exothermic, making efficient heat removal a critical aspect of the optimization of methane production [31]. An optimal reactor design with effective heat recovery can enhance methane yield while minimizing energy demand. The AIRE project concept aims to recover the heat generated during methanation through intercooling exchangers between the methanation stages. Instead of cooling the stream with an auxiliary fluid, the heat could be recovered to preheat process streams, thereby improving the overall efficiency.
The results reported in this work refer to the objective of the AIRE project, which aims to study the effectiveness of the integration of biomass gasification and methanation processes to produce Bio-SNG. The study investigated the potential for heat recovery from the methanation section to reduce or eliminate the need for auxiliary fuel combustion in the gasification section, using the Aspen Plus® software. Initially, the simulation of the system without the integration of the two processes is presented. Then, optimized heat management strategies are analyzed to enhance the energy efficiency of both processes.

2. Material and Methods

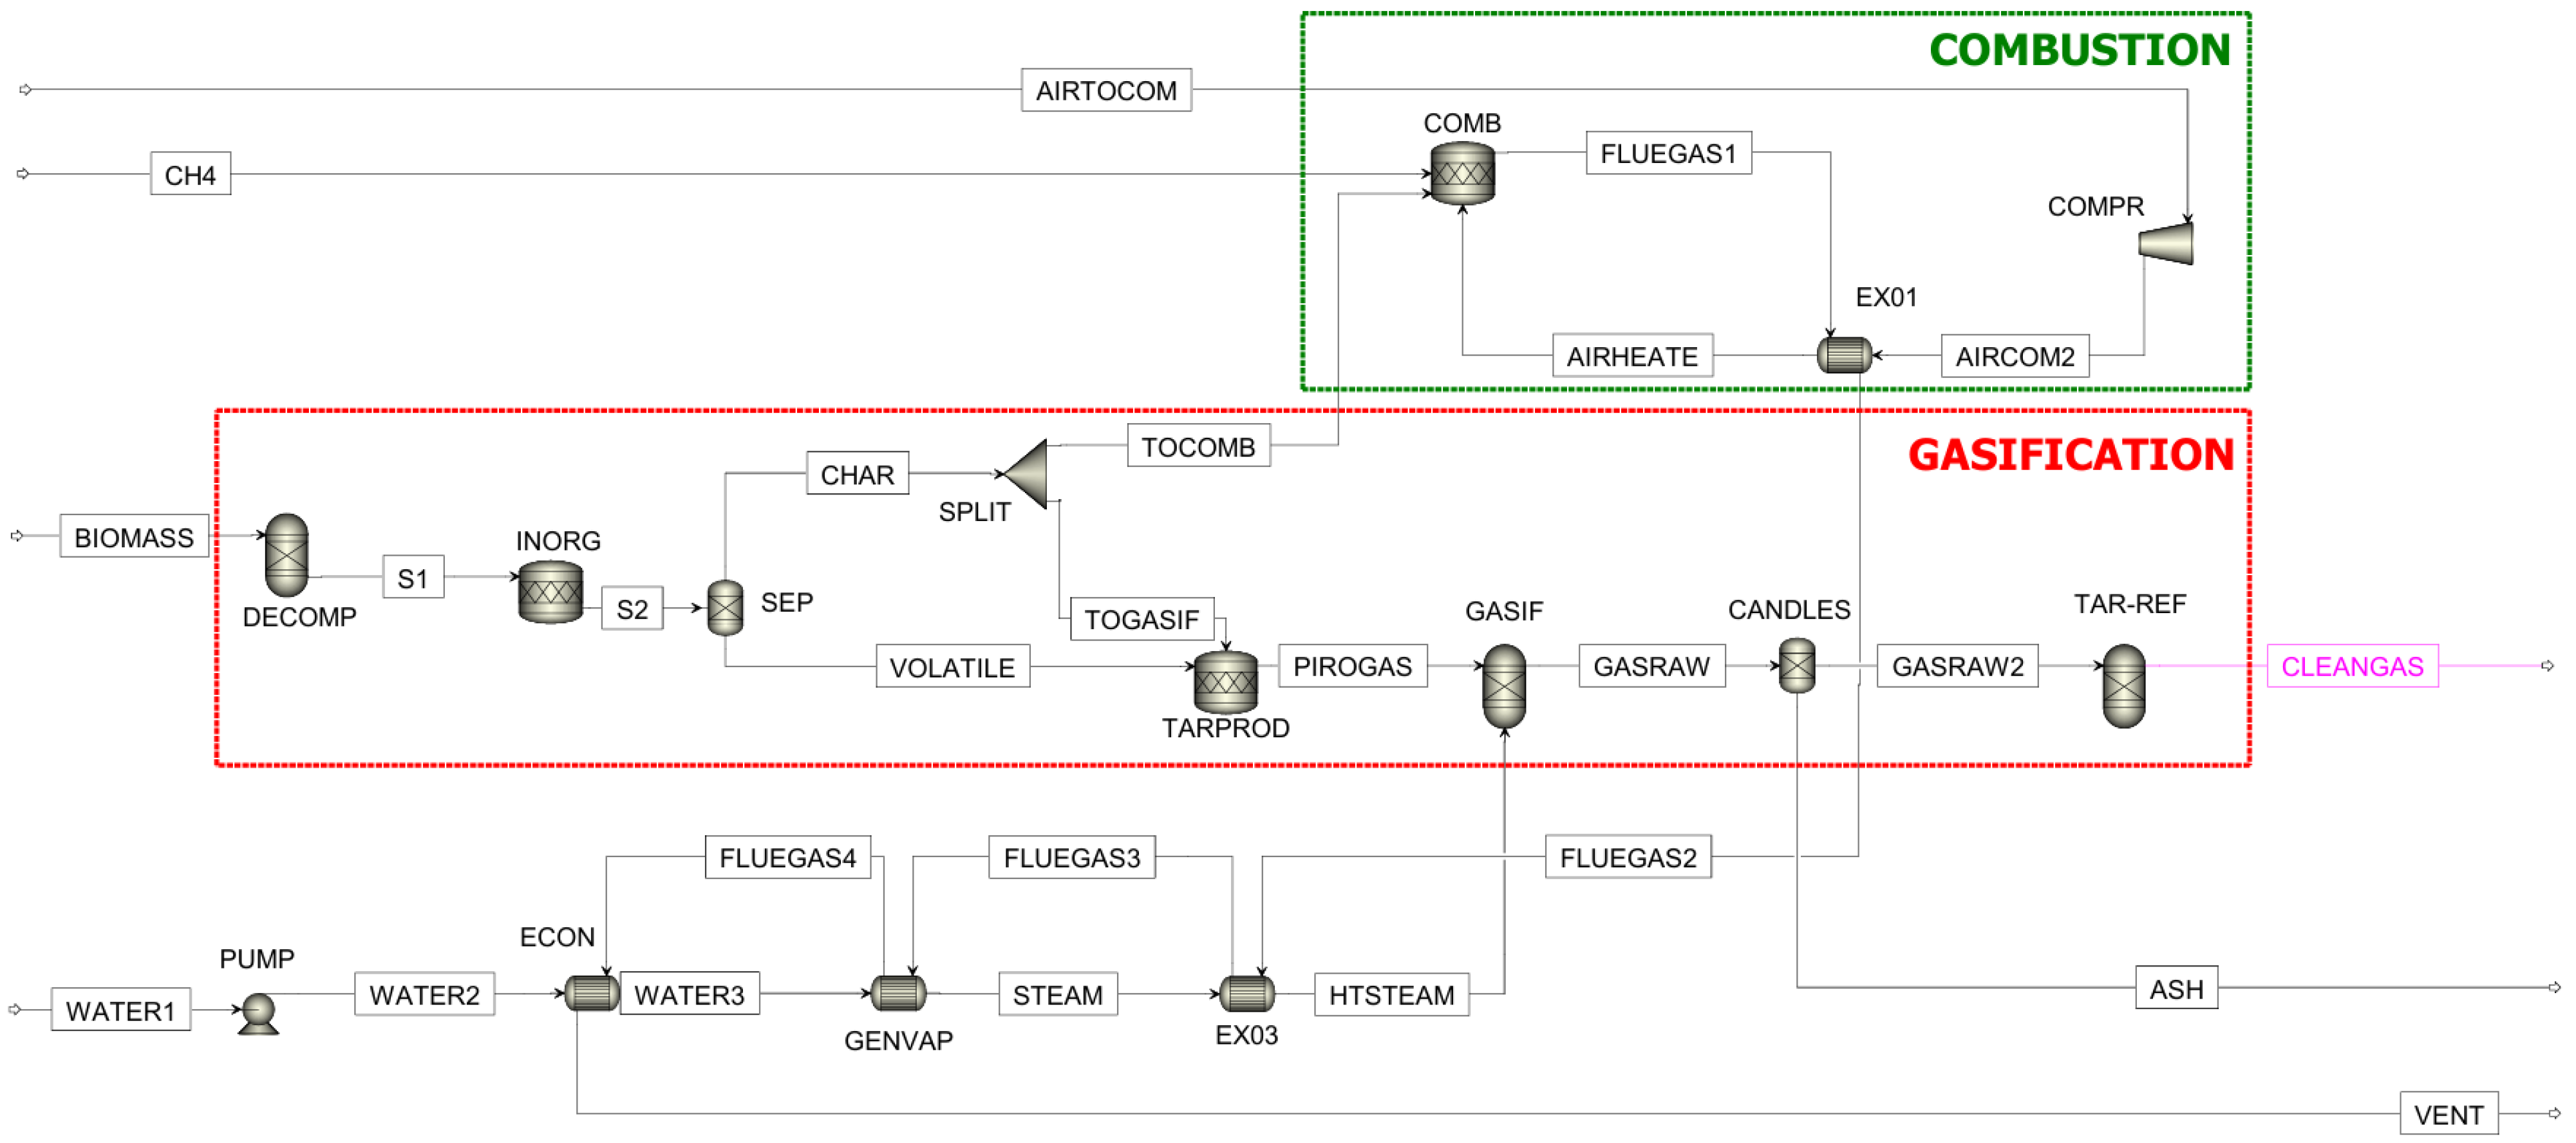
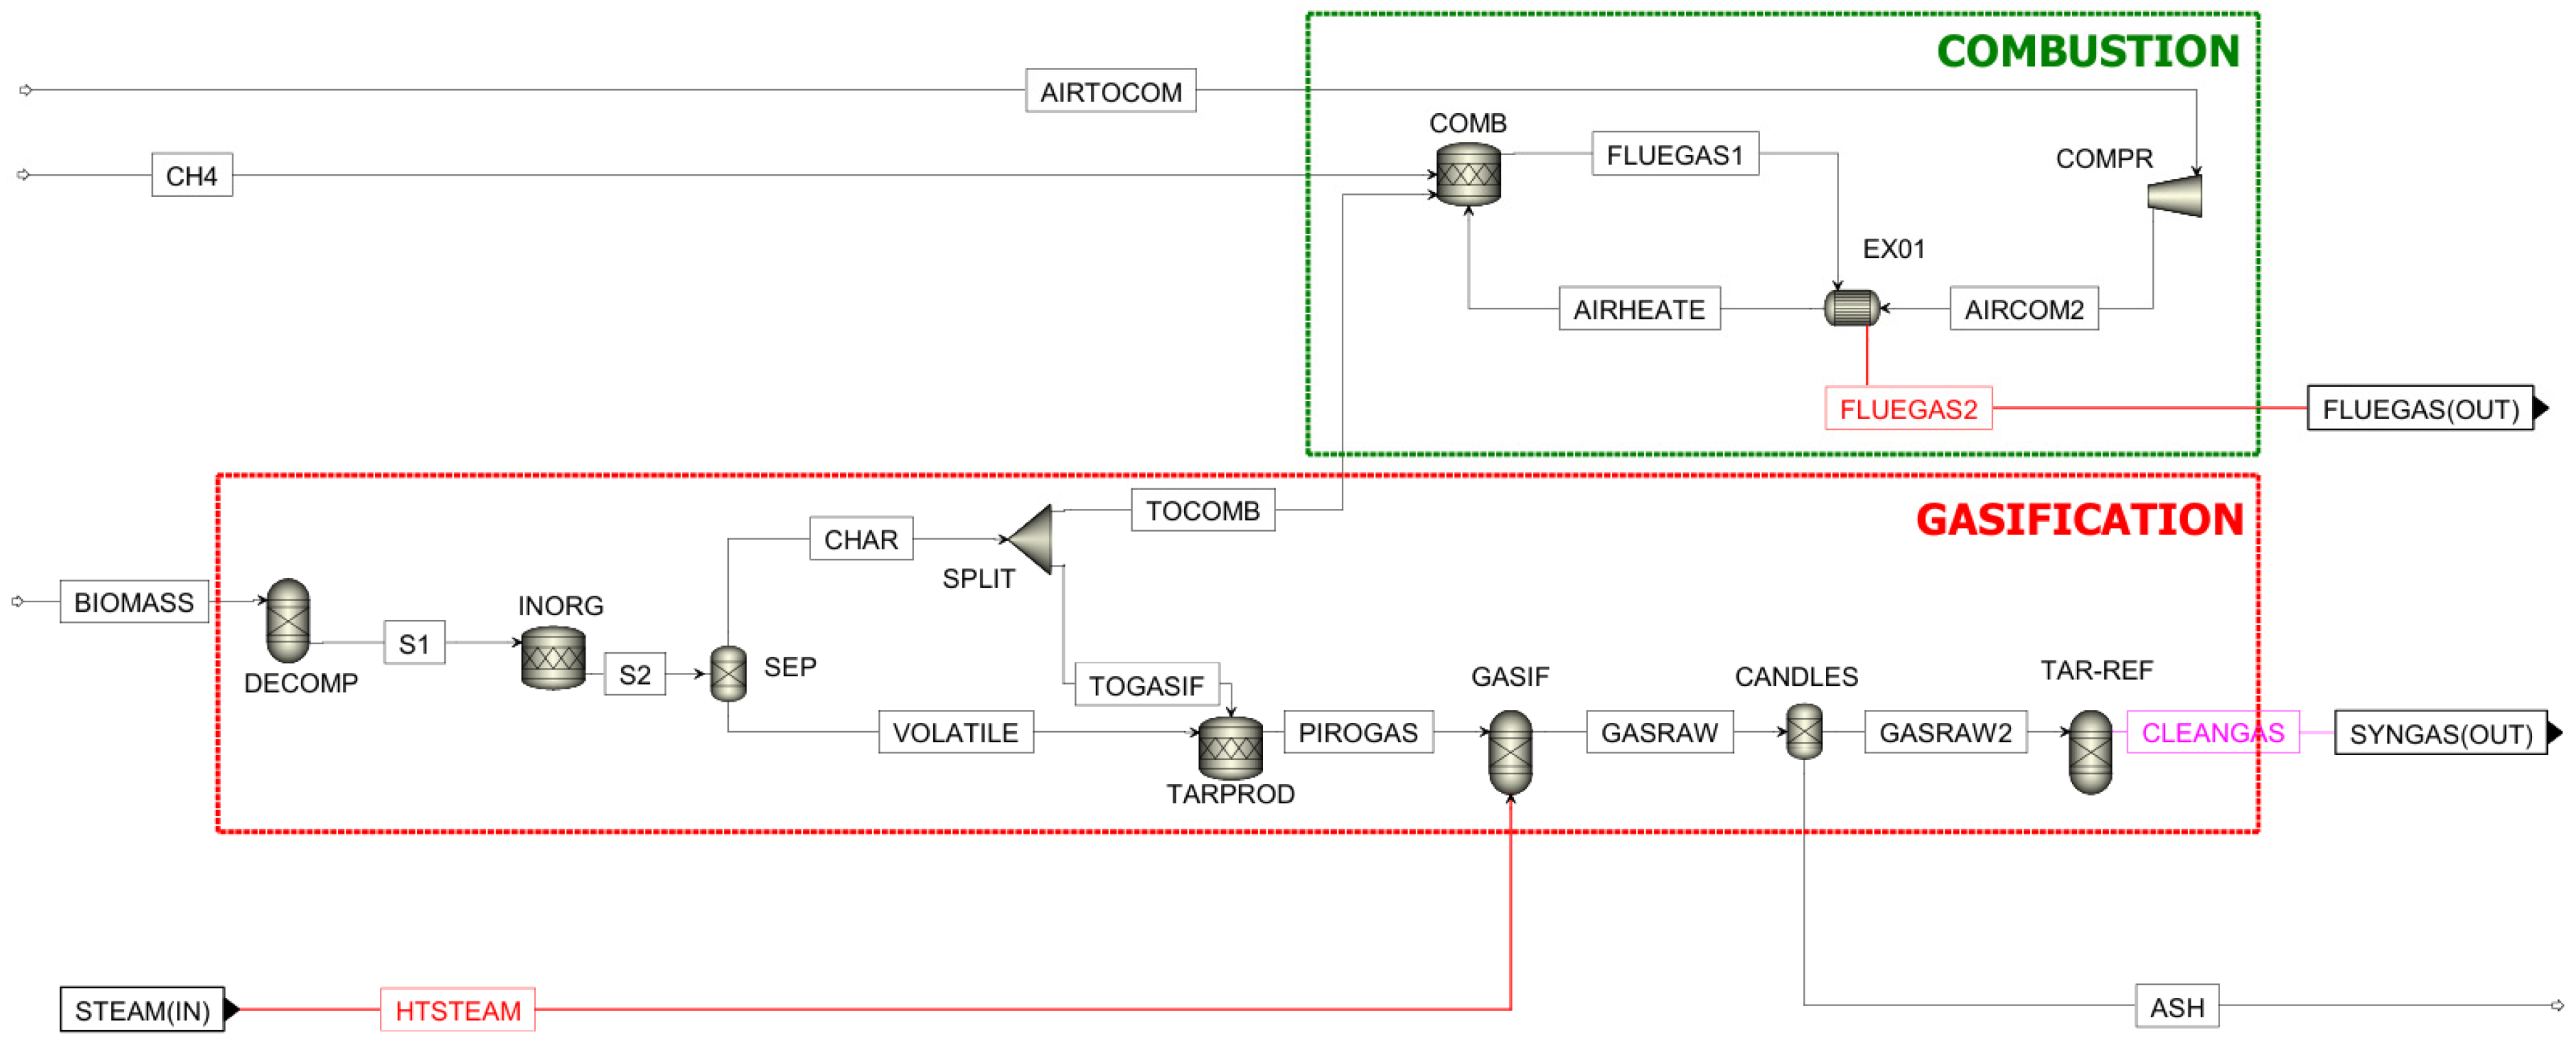
2.1. Gasification Process Simulation

The simulation of the entire process was performed in Aspen Plus®, Version 12.0. The Peng-Robinson (PR-BM) propriety method was used in this work. The PR-BM property method uses the Peng-Robinson cubic equation of state with the Boston–Mathias alpha function for all thermodynamic properties [32]. Figure 1 shows the ASPEN Plus® flowsheet of the gasification section, where the main output of the system is indicated in purple.
Both the gasification and the combustion section of the reactor were considered in the simulation. In particular, regarding the gasification section, previously published experimental test results were used for the gas composition and tar content without the cleaning section (GASRAW in the flowsheet) [15].
Hazelnut shells were selected as feedstock for the pilot plant, representing an agro-industrial byproduct that is widely available [33]. The biomass was purchased from a local vendor in bags of uncrushed shells. The size was already appropriate for feeding with a screw conveyor system. Moreover, the shells were characterized by low ash content and low moisture, requiring no additional pretreatment. They were implemented into the simulation as a non-conventional solid with a flow rate of 20 kg/h. The enthalpy and density of these non-conventional components were calculated using the HCOALGEN and DCOALGEN models, respectively. Biomass ultimate and proximate analyses were carried out according to the reference methods ASTM D5373, ASTM D4239, ASTMD2361, and ASTM D7582 [34,35,36,37]. In particular, ASTM D5373 was applied for CHN determination and ASTM D4230 for CL and S quantification. Oxygen content was obtained by difference.
According to ASTM D7582, the proximate analysis measures moisture and ash and volatile matter, while fixed carbon was determined by difference through thermogravimetric tests.
Table 1 reports the results of the ultimate and proximate analysis of the feedstock and the higher heating value calculated according to the Boie correlation [38].
In the simulation (Figure 1), firstly, the biomass was decomposed into its major elements by Ryield reactor (DECOMP) according to the elemental analysis results [15]. Then, using an Rstoic rector (INORG), HCl, H2S, and NH3 were generated considering the stoichiometric conversion of the Cl, S, and N2 content of the biomass. This conservative assumption produced higher concentrations of these contaminants than those obtained from the process. Once the biomass was decomposed and the inorganics were obtained, the feed was ready for the simulation of the gasification reaction. The char, assumed to be pure solid carbon, was split between the gasifier and combustor to simulate the amount of unreacted char that moved from the gasification to the combustion zone.
The amount of char sent to the combustor was obtained using the work of Fercher et al. [39] and is equal to
m C c o m b = 0.11 m b i o , d a f
Subsequently, via the Rstoic reactor (TARPROD), some of the carbon and hydrogen were used to generate tar, assumed to be toluene, naphthalene, and benzene, to obtain the tar content in the outlet stream of the gasifier (GASRAW) in concentrations equal to those obtained in optimized experimental tests [15]. The reactions considered for the tar formation are reported in Section Gasification Reactions (Equations (9)–(11)).
Steam, pre-heated at 450 °C, and the remaining components of the biomass were fed into the gasifier block (GASIF). An RGibbs reactor was used to simulate the gasification phase. This reactor was modeled using the quasi-equilibrium approach, which allows for the adjustment of the composition of the outlet stream by modifying the equilibrium temperature considered for each reaction inserted (Equations (2)–(6) in Section Gasification Reactions).
In particular, a temperature different from that used for the actual experimental gasification was considered, allowing the incorporation of operational or kinetic effects into the Aspen block that cause non-equilibrium states in real systems [40,41]. Ashes were separated from the stream leaving the gasifier by a separator (CANDLES) simulating the ceramic filter candles installed downstream of the pilot scale gasifier, and then, through an adiabatic RGibbs reactor (TAR-REF), clean gas was produced due to the tar reforming. This Aspen block allowed us to simulate the reformer reactor that was coupled to the gasifier and tested during the AIRE project. The tar conversion was based on the experimental results reported in the literature for similar working conditions [42,43]. The complete conversion of benzene, toluene, and naphthalene produced additional hydrogen, which increased the energy content of the syngas. The assumption of a complete tar conversion can be justified considering that several studies on the Aspen plus simulation of the gasification process neglect tars and their reforming reactions [24].
The air flow, at 450 °C, and the auxiliary fuel (assumed to be methane) were fed into the Rstoic combustor (COMB), where char and methane combustion reactions were implemented. Finally, the flue gas from the combustor was used at high temperature to superheat the air entering the combustor and thus generate the steam that was fed to the gasifier and then sent to the vent.
All unit operations are described in Table 2.

Gasification Reactions

The reactions considered in the gasification process are reported below. The Boudouard reaction is not considered in this simulation, because it is not favorable at these temperatures [44,45,46,47].
C + H 2 O H 2 + C O
C O + H 2 O H 2 + C O 2
C + 0.5 O 2 C O
H 2 + 0.5 O 2 H 2 O
C H 4 + H 2 O C O + 3 H 2
C + O 2 C O 2
C H 4 + 2 O 2 2 H 2 O
3 H 2 + 6 C C 6 H 6
4 H 2 + 7 C C 7 H 8
4 H 2 + 10 C C 10 H 8
Equations (2)–(6) are the chemical reactions considered for the gasification reactor, while (7) and (8) are the equations for the combustor and (9)–(11) are the equations for tar production.

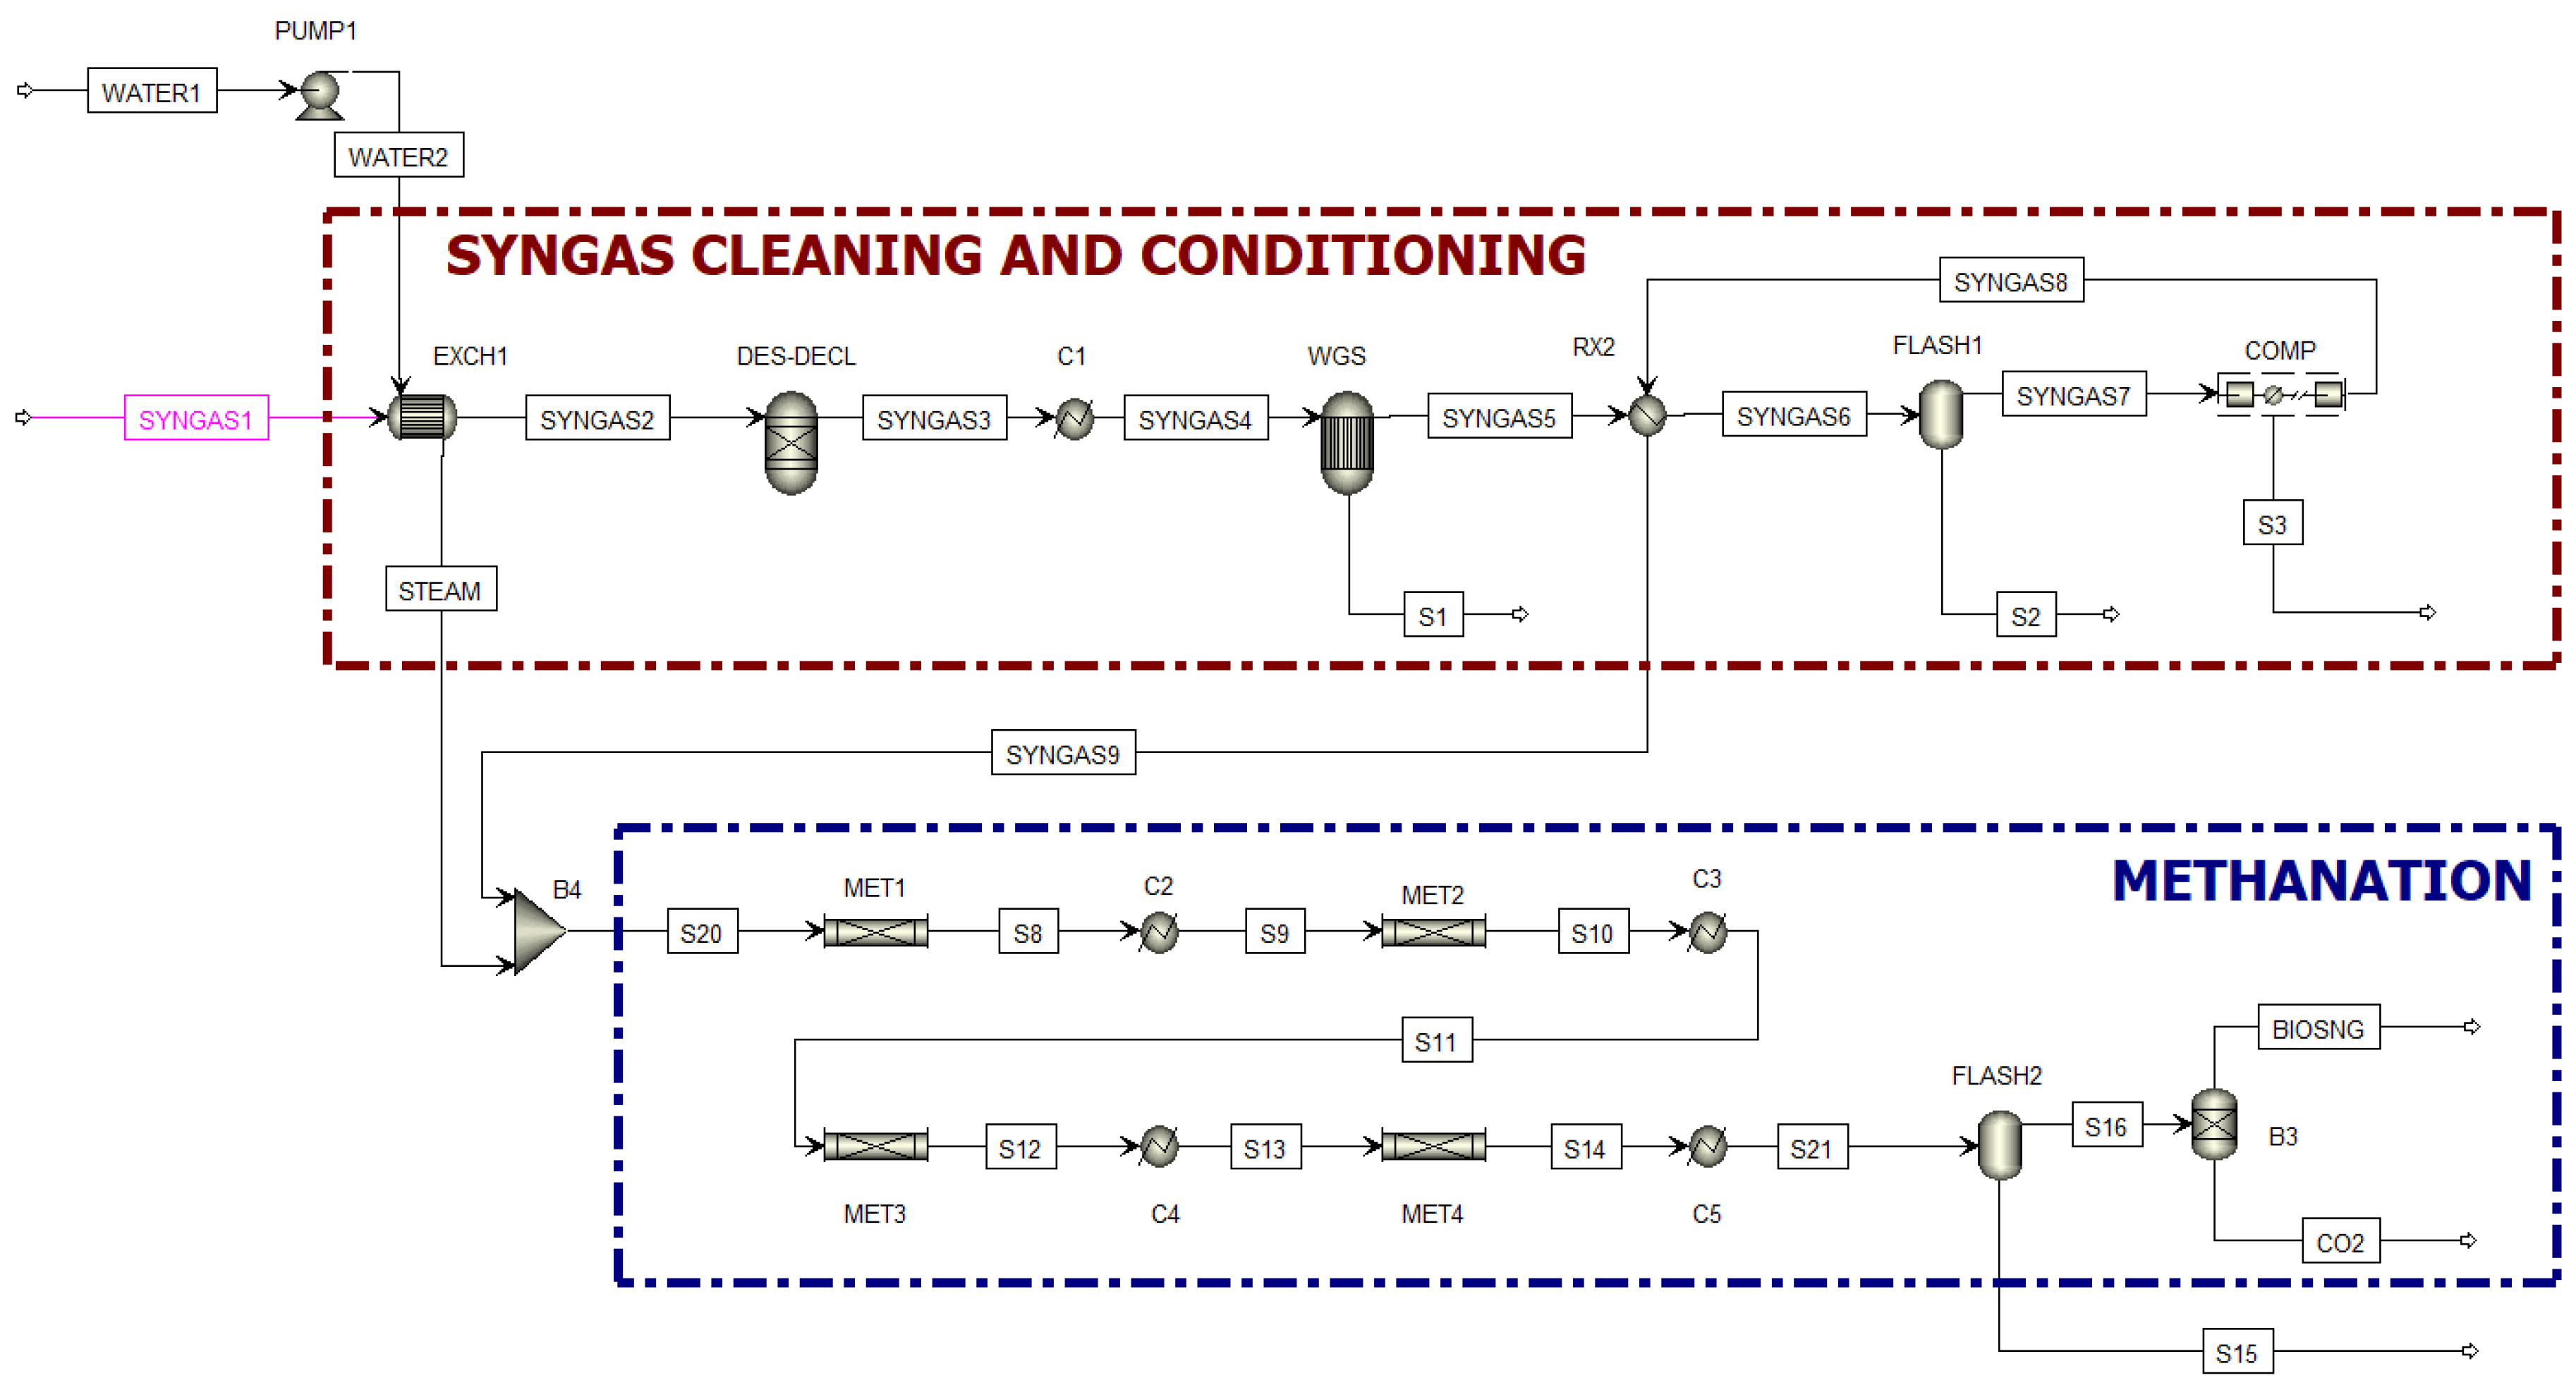
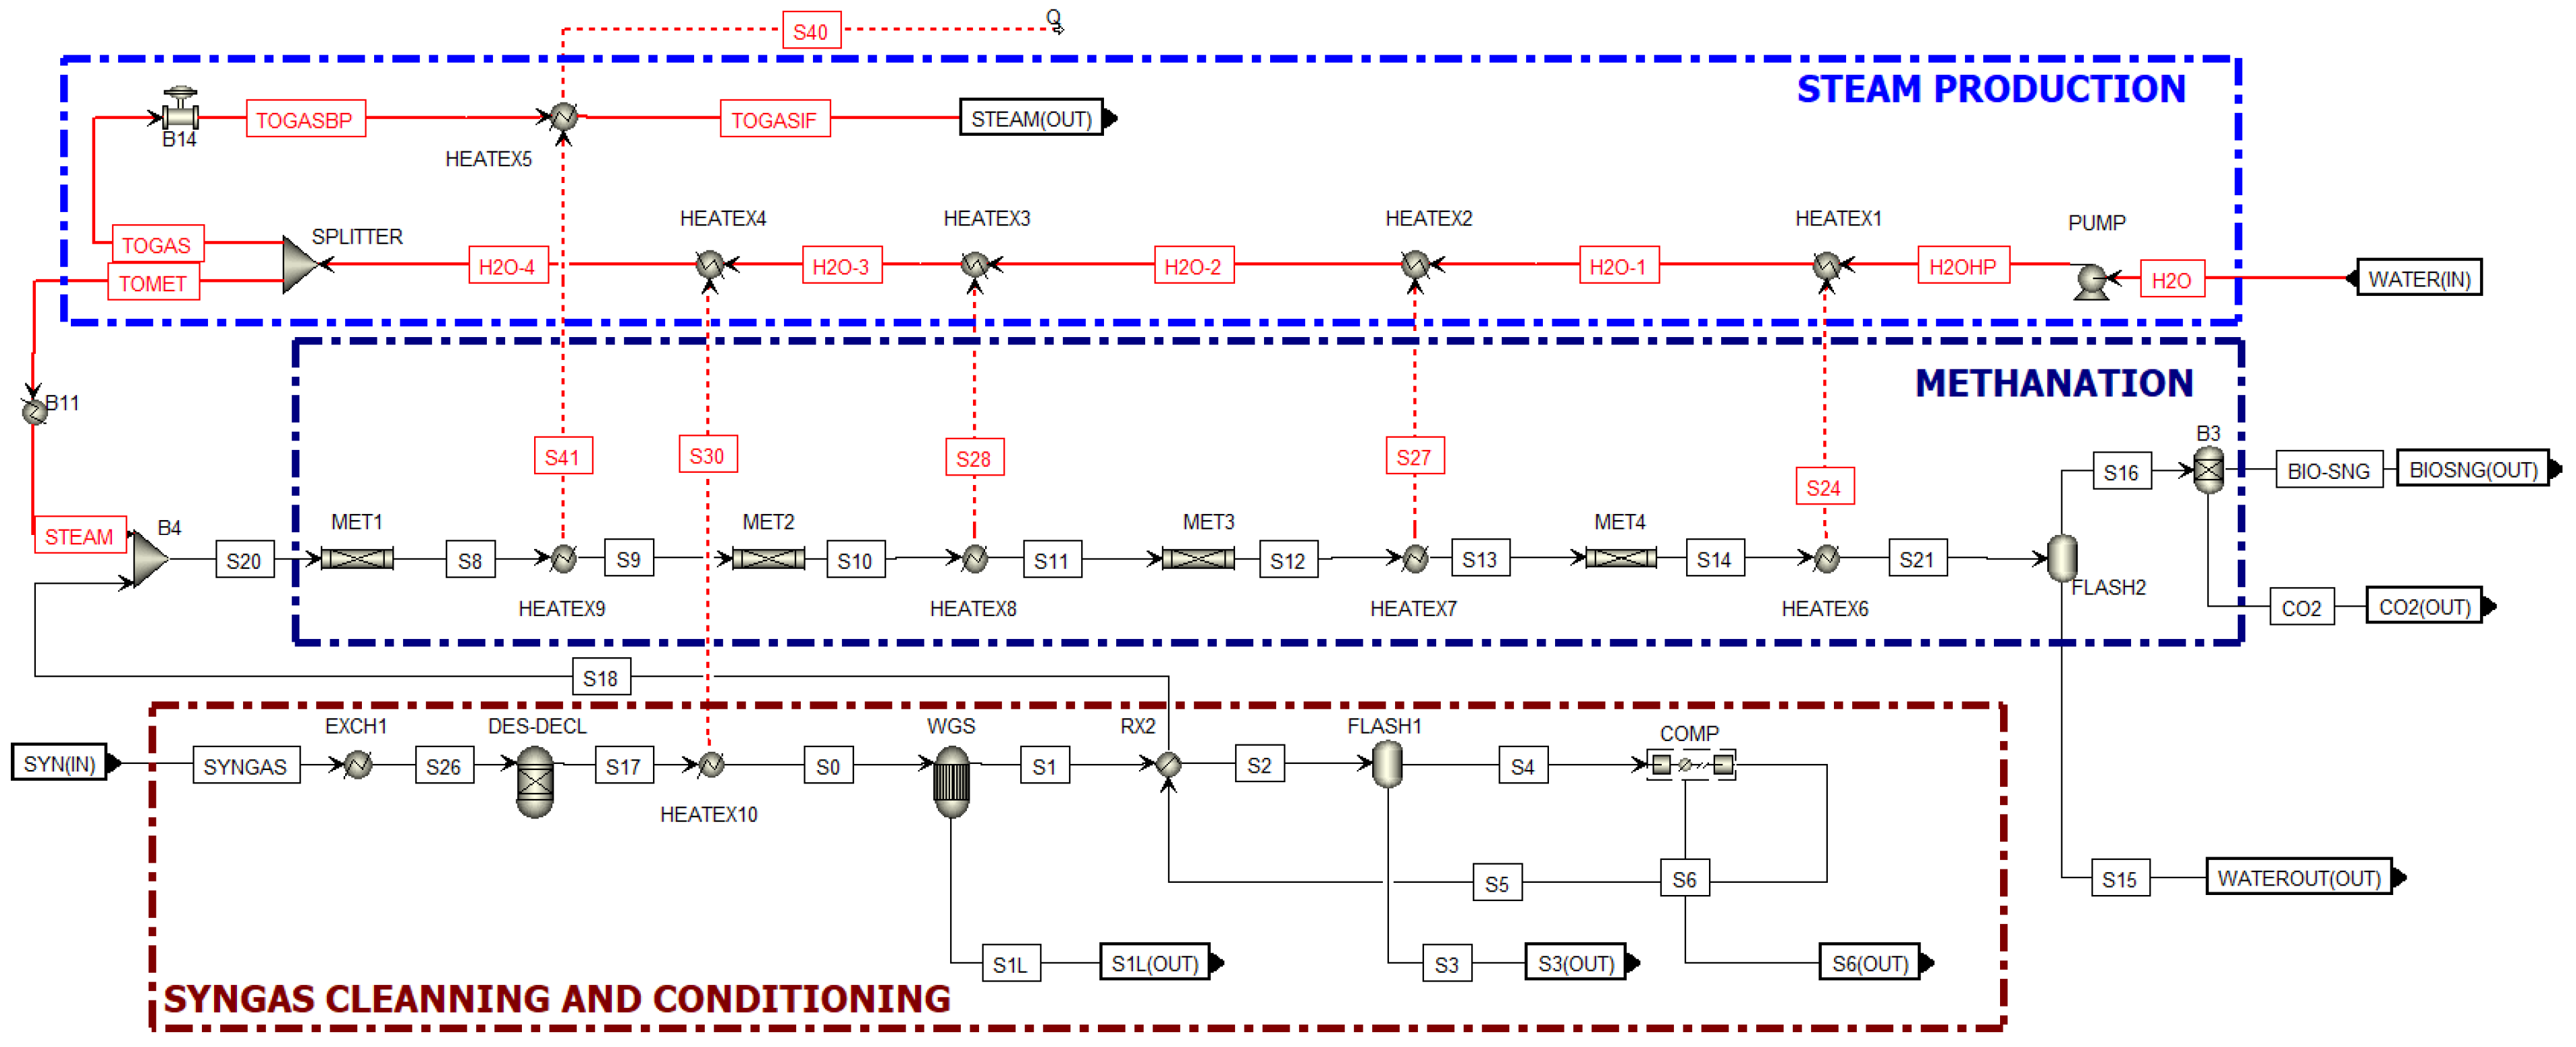
2.2. Methanation Process Simulation

Figure 2 shows the ASPEN Plus® flowsheet of the methanation section.
Syngas generated from the gasification process (purple stream) entered this section, where its sensible heat was used to generate steam for the initial methanation stage. The syngas, which had been cooled to 450 °C, was sent to an RGibbs reactor to simulate the several treatment steps required for the removal of inorganic compounds such as sulfides and chlorides through a sorbent fixed-bed reactor. It was then further cooled to the optimal temperature (250 °C) for the water–gas shift (WGS) reaction before entering the WGS reactor (REquil). There, H2 was produced from CO and H2O, with excess water subsequently removed through a flash process. The obtained gas was compressed and mixed with steam. Finally, the gas proceeded to Bio-SNG production through a series of inter-refrigerated methanators. The final products of the process were a pure CO2 stream and Bio-SNG (mainly CH4). All methanation unit operations are described in Table 3.

Methanation Reaction

The methanation simulations were conducted considering the use of four inter-refrigerated Plug Flow catalytic reactors, each with a length of 1 m and a diameter of 0.20 m, filled with a catalyst characterized by a bed voidage of 0.56 and a particle density of 1400 kg/m3.
The process was modeled using reaction kinetics available in the literature [48,49,50] based on the reaction mechanism described below.
The methanation of carbon dioxide, an exothermic catalytic reaction, was assumed to follow a two-step mechanism: in the first step, carbon dioxide reacts with hydrogen via the water–gas shift (WGS) reaction to produce carbon monoxide and water (Equation (12)). Subsequently, methane is formed from the reaction between carbon monoxide and hydrogen (Equation (13)). Additionally, the direct reaction of methane with water (Equation (14)) was included in the model.
H 2 + C O 2 C O + H 2 O
C O + 3 H 2 C H 4 + H 2 O
C H 4 + 2 H 2 O C O 2 + 4 H 2
The equilibrium of the reactions is favored at high pressure and low temperature.

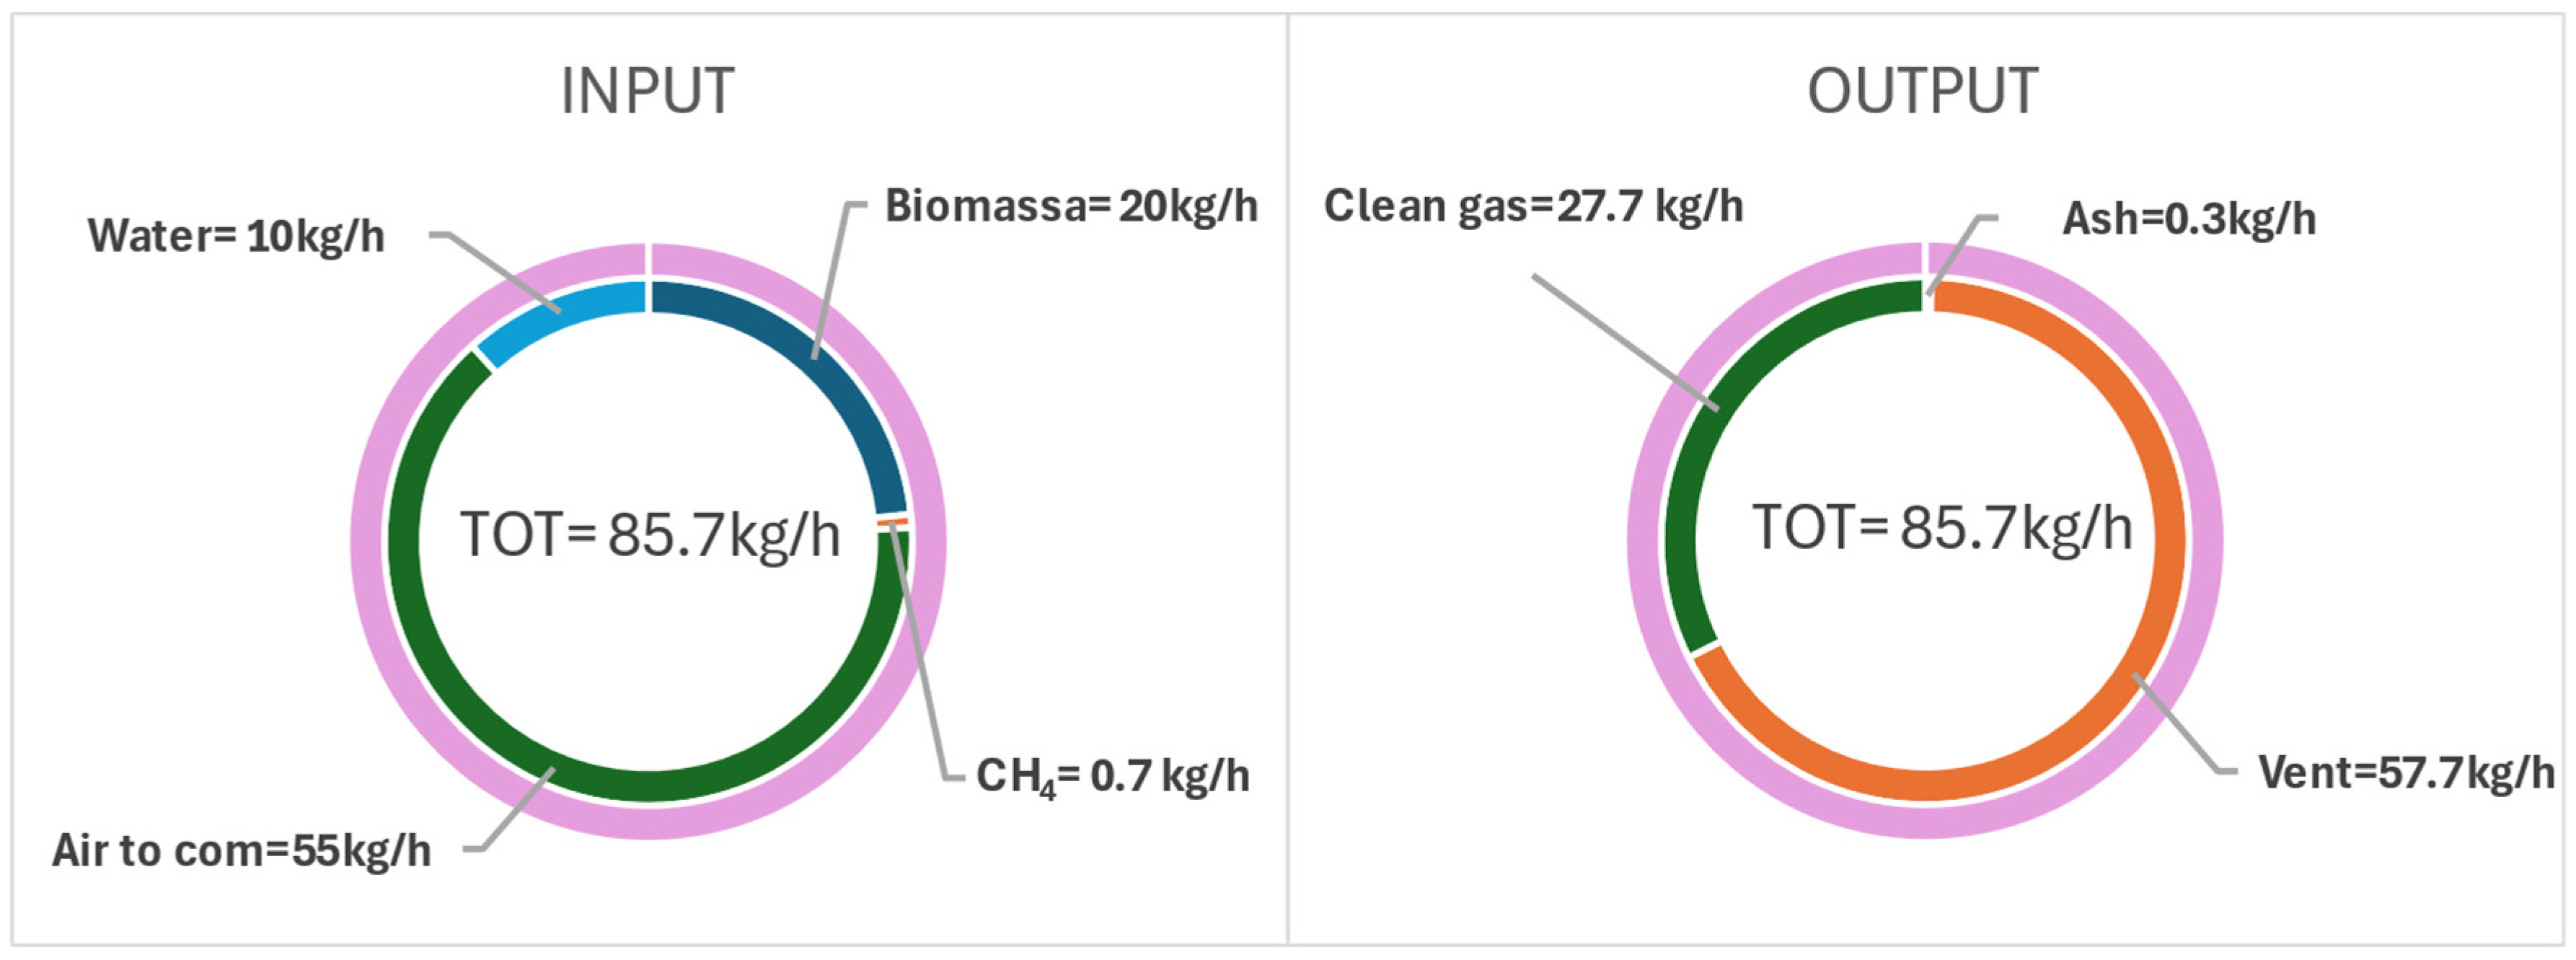
2.3. Parameters for the Performance Evaluation

To evaluate the performance of both the gasification and methanation systems and their integration, the following parameters were used.
Cold gas efficiency (CGE) (Equation (15)) is the chemical energy contained in the product gas with respect to the energy fed to the system through biomass and auxiliary fuel.
C G E = H H V c l e a n g a s   × F C l e a n g a s   H H V b i o × F b i o + H H V A u x F u e l   × F A u x F u e l  
where F is the flowrate (kg/h) and HHV is the higher heating value, expressed in MJ/kg.
Carbon conversion (CC) (Equation (16)) represents the amount of carbon in the biomass converted into CO, CO2, and CH4, expressed in moles.
C C = i = C O , C O 2 , C H 4 m o l i m o l C   b i o
Water conversion (WC) (Equation (17)) represents the total amount of water converted during the gasification process.
W C = 1 H 2 O C l e a n G a s H 2 O b i o + H 2 O g a s i f i e r
where H 2 O i represents the flowrate, expressed in kg/h, of the water exiting the gasifier alongside the syngas ( H 2 O C l e a n G a s ) and entering the gasifier as biomass moisture ( H 2 O B i o ) and steam ( H 2 O G a s i f i e r ) .
Methanation efficiency η B i o S N G (Equation (18)) is the chemical energy contained in the Bio-SNG with respect to the energy contained in the syngas. This parameter highlights the efficiency of the methanation process, whose input is the syngas.
η B i o S N G = H H V B i o S N G × F B i o S N G   H H V C l e a n G a s × F C l e a n G a s  
Overall plant efficiency   η B i o S N G O (Equation (19)) is the chemical energy contained in the Bio-SNG with respect to the energy entering into the process through biomass and auxiliary fuel. This parameter highlights the efficiency of the overall process.
  η B i o S N G O = H H V B i o S N G × F B i o S N G   H H V b i o × F b i o  
where F is the flowrate (kg/h) and HHV is the higher heating value expressed in MJ/kg.

2.4. Optimization Strategies

The aim of this optimization, as previously mentioned, was to find a configuration that maximizes the heat recovery of the integrated system. The optimization strategy consists of the following steps:
  • Investigate the thermal feasibility by analyzing the operative temperatures to avoid thermal crossovers and ensure adequate driving force for heat exchange.
  • Investigate the energy feasibility by analyzing the energy demand of each thermal operation.
Both thermal and energy optimization have been analyzed regarding the increase in the inlet temperature of the combustor air and the increase in the temperature of the steam for the gasification reactor, applied in order to raise the system efficiency and try to decrease or eliminate the auxiliary fuel.

3. Results

As mentioned above, the aim of this work was to analyze heat management strategies that seek to enhance the energy efficiency of Bio-SNG production through the integration of gasification and methanation processes. Firstly, the two processes were studied independently, focusing on internal optimization by ensuring the effective utilization of hot and cold streams.

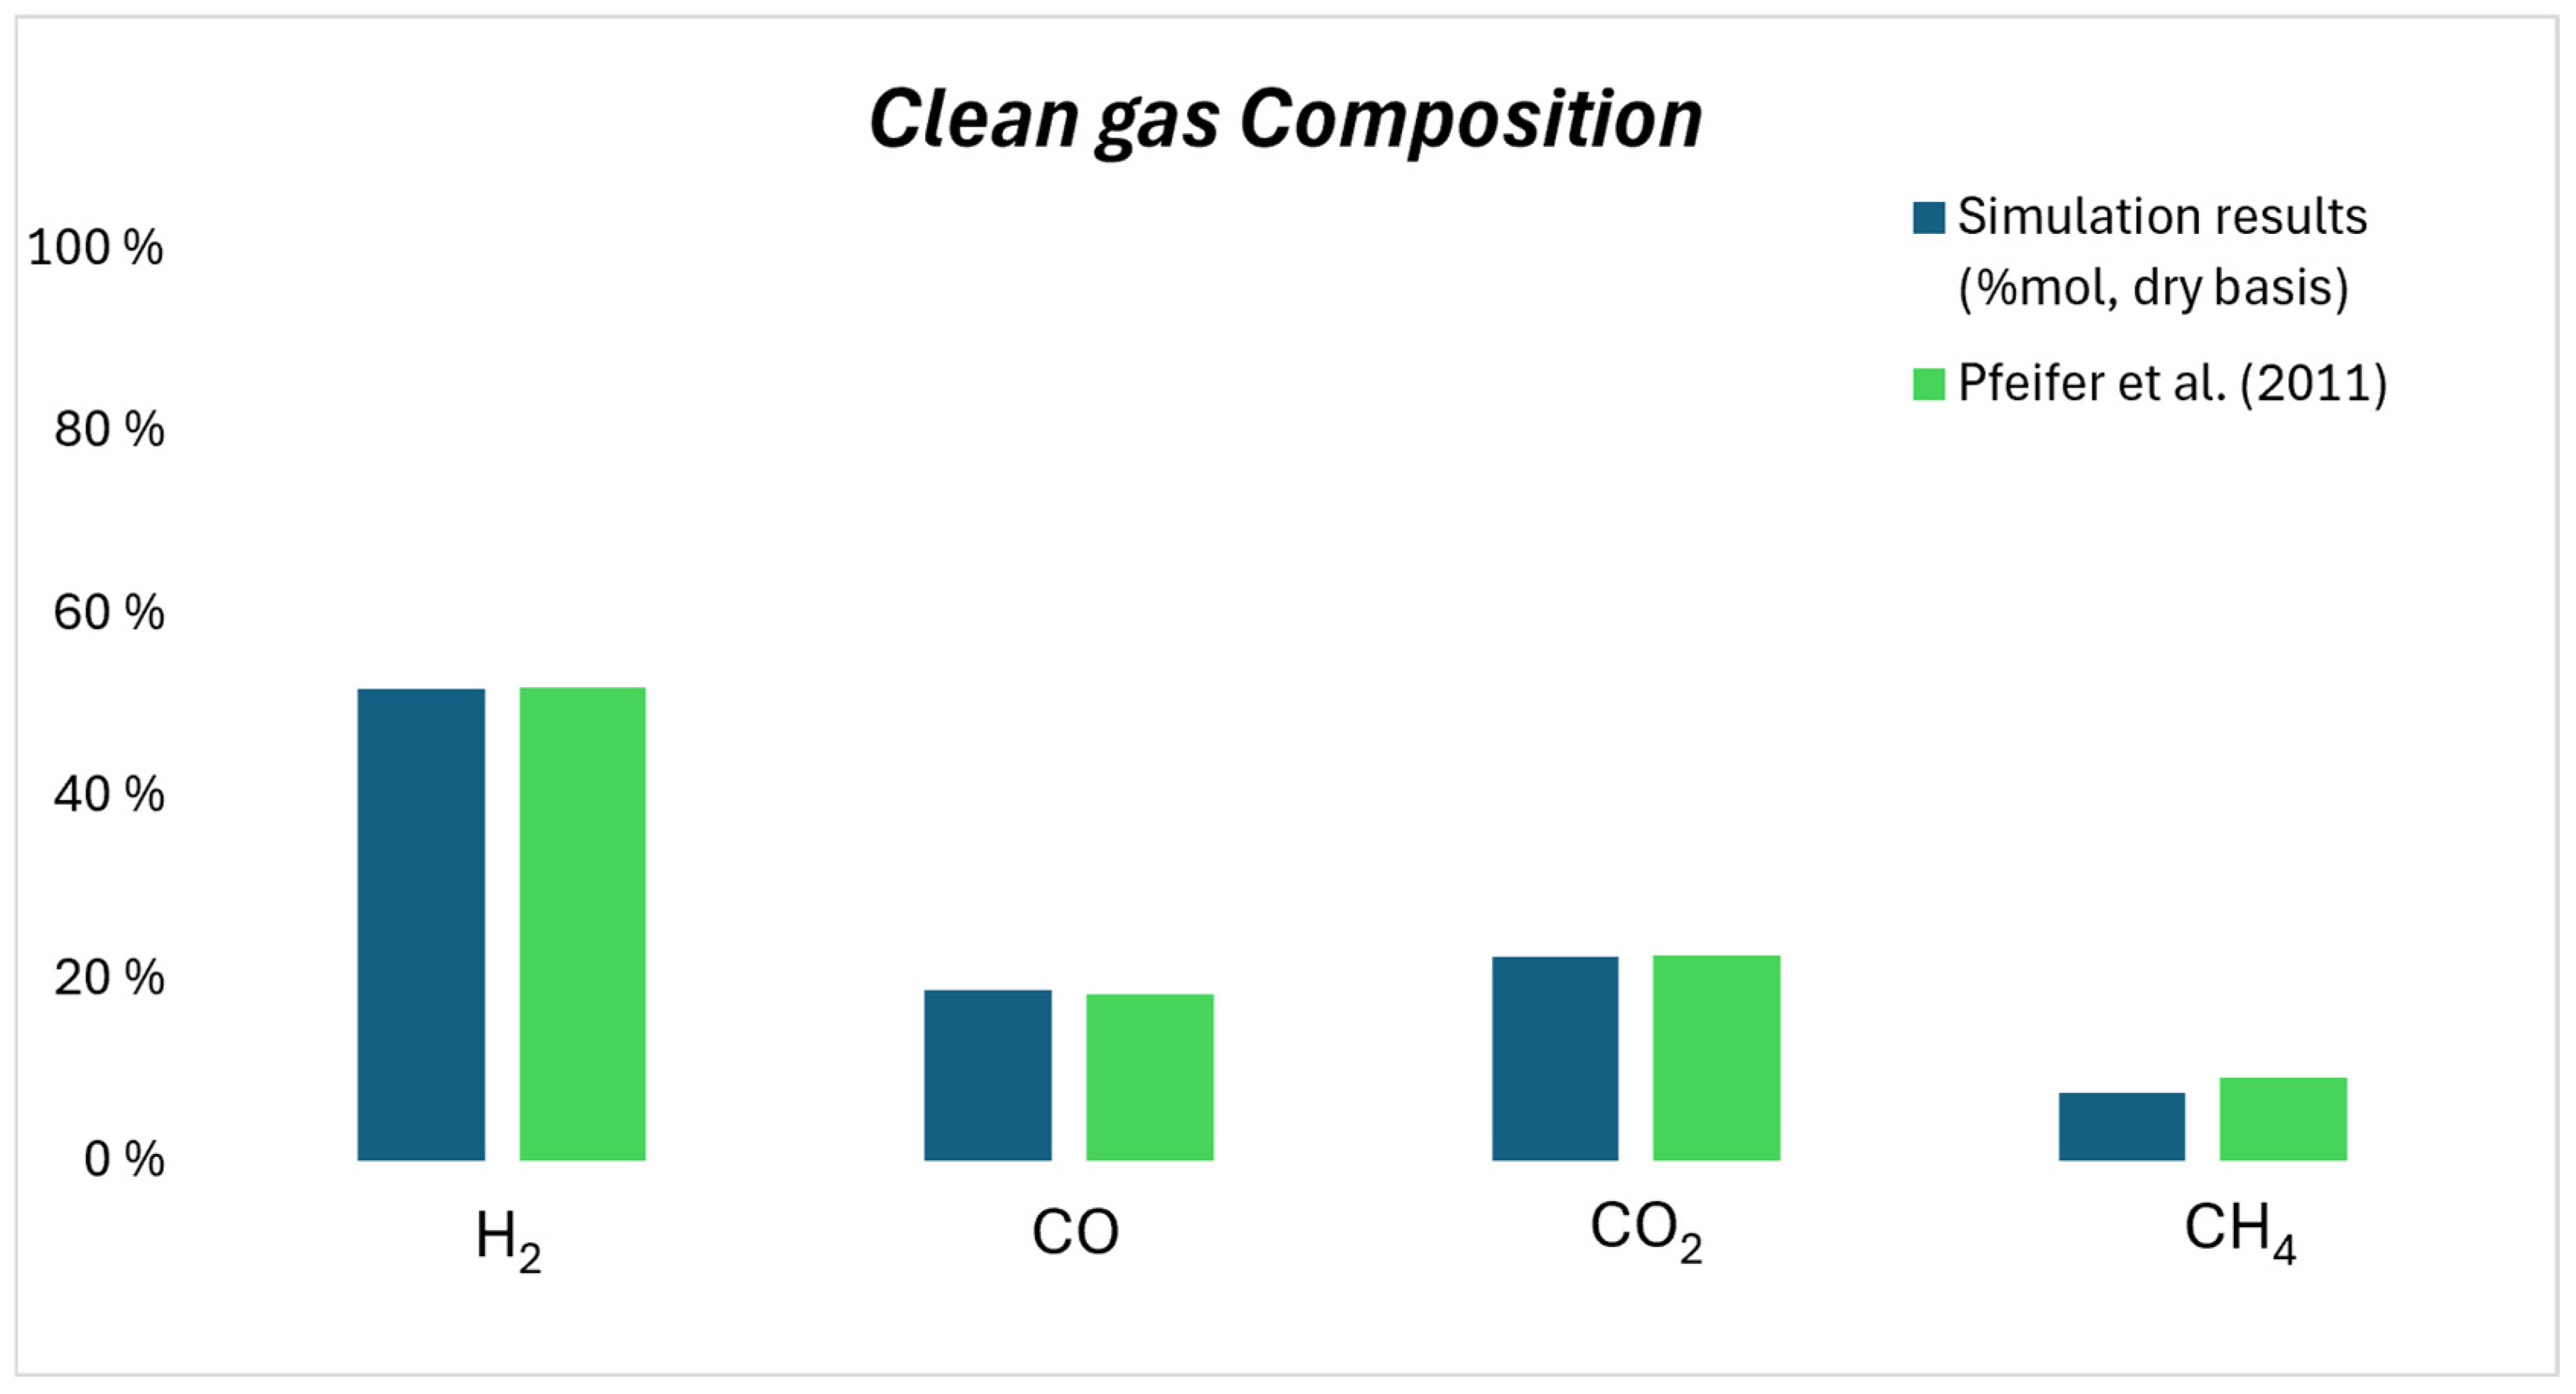
3.1. Gasification Results

The main steps involved in the gasification process simulation were the decomposition of biomass into its elemental components, the separation of the char not converted during the process, the generation of the tar, and the simulation of the steam gasification reactions with remaining components by using a quasi-equilibrium approach. These steps allowed us to simulate the degradation of biomass and evolution of volatile matter, including tars, and the steam gasification of char [51]. The composition of the stream produced by the DECOMP block is presented in Table 4. Starting from this composition, by considering the amount of unreacted char calculated according to Equation (1), three streams were obtained: 10.29 kg/h of gaseous compounds (VOLATILE), 2.04 kg/h of char fed to the combustor, and 7.67 kg/h of char fed to the gasifier.
The raw syngas composition was validated using results obtained from the pilot-scale plant [14,15]. To obtain the experimental composition, the quasi-equilibrium approach for the RGibbs reactor was considered. In particular, only the methane reforming reaction (R6) was limited by using a reaction temperature of 550 °C (less than 300 °C with respect to the actual temperature of the gasification process) to restrict the chemical equilibrium.
By considering the conversion of tar through an adiabatic RGibbs reactor (TAR-REF), the composition of the CLEANGAS reported in Table 5 was obtained. The temperature reported refers to the equilibrium temperature calculated by the software. The complete conversion of benzene, toluene, and naphthalene produced additional hydrogen, which increased the energy content of the syngas.
As shown in Figure 3, the gas composition obtained in this simulation is comparable with that obtained from the work of Pfeifer et al. [52]. They carried out experimental tests with a dual fluidized bed pilot-scale gasifier (100 kWth).
To simulate the heat supplied to the gasifier through sand bed recirculation from the combustion zone, the burner was modeled. The recovery of sensible heat from the exiting flue gas was considered for preheating the air fed to the combustor, which was heated to 450 °C, and the steam fed to the gasifier, thus reducing the gasification energy requirement. In this way, and by recirculating the residual char to the combustor, only 0.7 kg/h of CH4 was required. The combustion process was simulated at 950 °C, producing 18.4 kW of thermal power.
The CGE calculated without the tar and methane reforming section (using the flow rate and composition of the GASRAW stream) was 76%. This value increased to 85% when tar conversion was considered, highlighting the importance of tar reduction not only for cleaning purposes related to the downstream process but also for syngas energy improvement by recovering that lost due to the tar. In particular, syngas energy increased by approximately 10 kW as a result of the reduction in tar contaminants and the subsequent production of H2 and CO. CH4 and tar reforming accounted for about 10% of the HHV of the syngas, making this contribution non-negligible in the overall energy balance.
Moreover, due to the reforming of CH4 and tar, the carbon and water conversion also increased from 75% to 79% and from 25% to 47%, respectively.
Figure 4 reports the input and output mass flow rate of the gasification system.
Table 6 and Table 7 summarize the streams and blocks considered for the energy requirements of the gasification section.
Steam was introduced to the gasifier at 450 °C, heated, vaporized, and superheated using exhaust heat. The produced syngas and flue gas leave the gasification and combustion reactors at 850 and 950 °C, respectively.
The energy content of the inlet streams was 100.0 kW for the biomass and 10.8 kW for methane, while for the outlet streams, the energy content was 106.5 kW for the syngas and 1.6 kW for the vent.
The energy balance of the DECOMP-GASIFIER-COMB system gave a result of 0, confirming that the correct methane flow rate was chosen to provide the energy required by the system (in particular, the energy for the gasification reactions).
The thermal energy of the flue gas was recovered to heat the inlet air (6.4 kW) and to produce steam (1.2 kW as sensible heat, increasing the temperature from 20 to 112 °C (boiling temperature at 1.5 bar), and 6.4 kW latent heat) and superheat at 450 °C (1.9 kW).

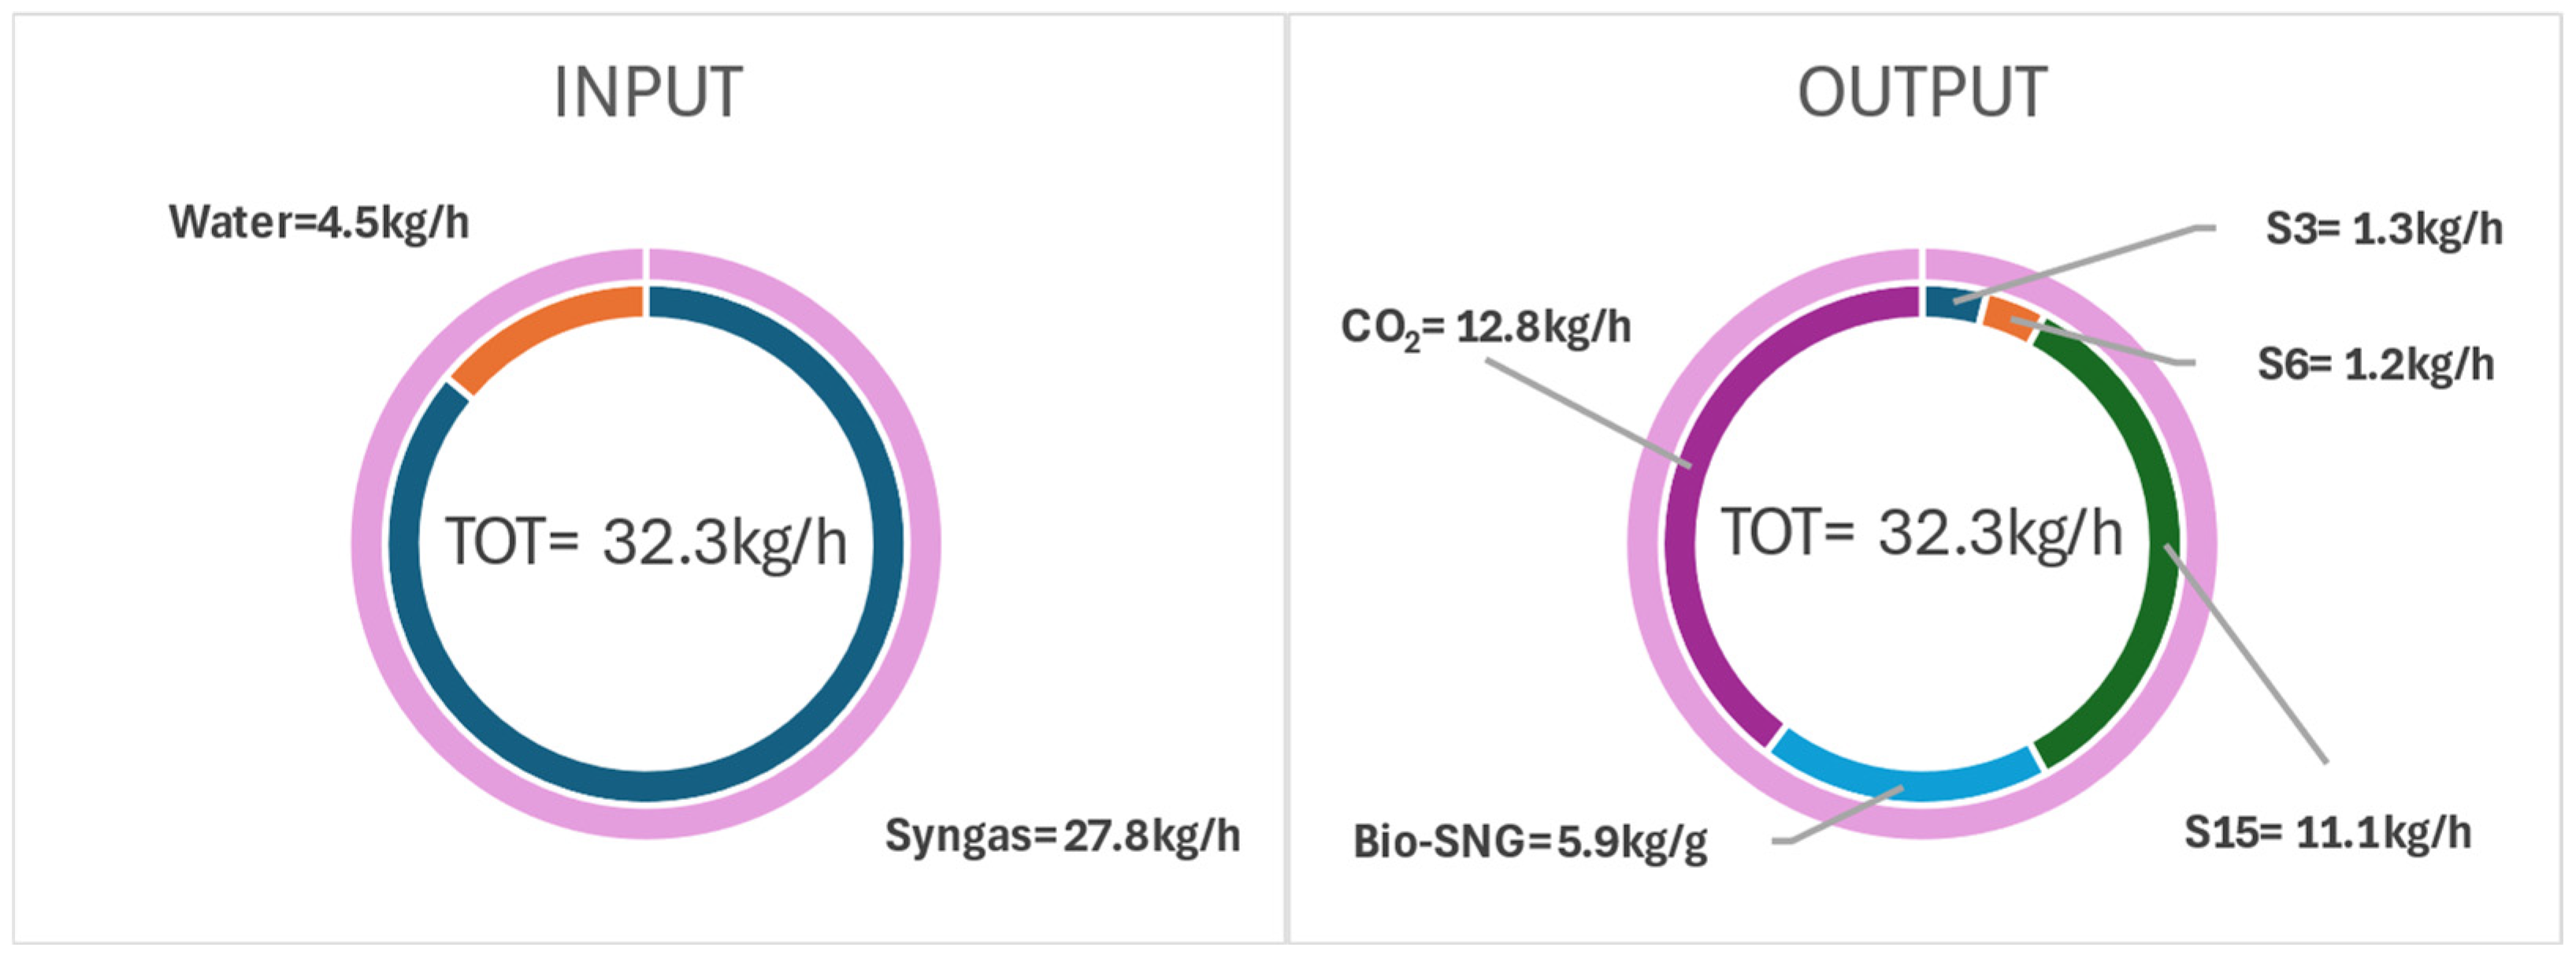
3.2. Methanation Results

The methanation simulation was developed taking into account the following constraints: the WGS inlet temperature was 250 °C; the methanation reaction was promoted at 290 °C, which is therefore the temperature to be guaranteed at each methanator inlet. Therefore, firstly, a heat exchanger was used to heat, vaporize, and superheat the steam used for methanation by using the sensible heat of the syngas, thus reducing the temperature of the syngas to that required by the WGS. Moreover, since the methanation reaction is exothermic, inter-refrigeration steps were required between each methanator. The water gas shift reactor (WGS) was considered adiabatic.
The pressure was selected to obtain CO, CO2, and H2 volumetric percentages in the Bio-SNG outlet of less than 0.1, 0.1, and 4%, respectively.
Figure 5 reports the dry composition of Bio-SNG obtained by varying operating pressure. If the pressure was more than 10 bar, the gas composition variation was negligible, or in any case, it does not justify further pressure increases. CO was less than 0.1% in all the simulations, while for pressures below 5 bar, the residual H2 in the gas was more than 8 vol.%. The operating pressure chosen in this work was 10 bar.
Table 8 reports the Bio-SNG composition obtained. The results obtained in this work are comparable with the study conducted by Taylor et al. (2024) [53], as reported in Figure 6.
The CGE and CC of the methanation section were 83% and 54%, respectively.
Figure 7 reports the input and output mass flow rate of the methanation section.
Table 9 and Table 10 summarize the blocks and streams considered to evaluate the energy requirements of the methanation section.
The system involved a series of heat exchangers and separators (flash) that could furnish 27.2 kW; furthermore, the syngas entered this section at 612 °C.
The sensible heat of the syngas (cooling down from 612 to 400 °C) was exploited to produce the steam for the methanation (4.5 kg/h at 183.2 °C), thus using 3.5 kW of sensible heat from the syngas.
Moreover, the vapor phase stream exiting the WGS (S1 in the ASPEN Plus® diagram) was used to heat the inlet stream of the first methanation reactor up to 303.2 °C.

3.3. Optimization Results

The system described, starting with biomass, produces CO2 and Bio-SNG, primarily composed of methane. At the burner inlet, auxiliary fuel (methane) is required to provide the energy necessary to close the energy balance of the process, decreasing its efficiency.
The current configuration includes two separate water inlets, as previously described: one in the gasification section and another in the methanation section. In the gasification section, water is heated, vaporized, and superheated using the sensible heat of the flue gas exiting the burner. In the methanation section, water is heated to the process temperature using the sensible heat released by the syngas. Since methanation is an exothermic reaction, the gas temperature increases. Consequently, a series of heat exchangers are used between methanation reactors to cool down the gas.
The optimization proposed in this study introduces a single water line with a flow rate equal to the requirement of the entire process. This water stream is initially heated to the methanation temperature (lower than that required for gasification) by exploiting the sensible heat released by the gas, which must be cooled down between the methanation reactors. The stream is subsequently split: one portion, to be sent to the methanation section, is mixed with the gas, while the other portion is depressurized through a lamination valve and further heated using the sensible heat of the syngas exiting the gasification block before entering the gasification reactor.
The optimized configuration achieves the following improvements:
Thermal recovery: Heat is recovered between methanation reactors, thereby reducing thermal losses.
Efficient sensible heat utilization: A portion of the sensible heat from the syngas exiting the gasification block is used to superheat the steam for gasification.
Flue gas optimization: The sensible heat of the flue gas exiting the burner is used to preheat the air entering the combustor, potentially reducing or even eliminating the need for auxiliary fuel.
These modifications enhance the overall process efficiency and significantly decrease the thermal outputs from the methanation system.
The primary objective of this optimization is to recover the heat generated during the methanation. In fact, the methanation reaction is exothermic, leading to an increase in the outlet stream and a reduction in the conversion efficiency. To ensure optimal operating conditions, heat exchangers are inserted to reduce the gas temperature to 290 °C before it enters the subsequent methanation reactor. The total recoverable heat from these exchangers was calculated to be 13.5 kW. In addition, the gasification section requires 10 kg/h of water, which is brought to the process temperature by exploiting the sensible heat of the flue gas. The energy required for this operation is 9.42 kW, as reported in Table 11.
The methanation section uses 4.5 kg/h of water, which is heated from 25 to 183.2 °C while cooling the syngas from 615 to 400 °C. This operation consumes 3.51 kW of thermal energy.
Consequently, in total, 12.93 kW is needed to heat the water for the entire process.
To ensure effective heat recovery, crossover in the exchangers must be avoided. Before optimization, the inlet and outlet temperatures of each exchanger must be carefully evaluated to maintain a minimum driving temperature difference of at least 10 °C. Table 12 summarizes the inlet and outlet temperatures of the exchangers.
Once the overall energy requirements and temperatures had been checked, it was possible to optimize the process.
A measure of 14.5 kg/h of water was pressurized to 10 bar through a pump, with an initial heat recovery step using the energy from the C5 exchanger to heat the water. In the previous configuration, the syngas exited the last exchanger at 152 °C, which would result in a crossover. To prevent this, the syngas was here cooled to 190 °C, while the water was heated to 180 °C. Heat was then recovered from the C4 and C3 exchangers to start vaporizing the water. At this point, heat from heat exchanger C1, before the WGS, was utilized for further evaporation, as C2 has the highest energy content, and using it at this stage would likely lead to crossover issues. Next, the stream was split using the block SPLITTER, and a heat exchanger (B11) was added to bring the 4.5 kg/h of water to the process temperature. A design specification was set for this exchanger, with its duty adjusted so that the S20 stream entering the first reactor reached a temperature of 290 °C. The remaining water for gasification (10 kg/h) was pressurized to 1.5 bar via a lamination valve (B14). To heat the water to 615°C, 3.63 kW of the 5.7 kW available from the C2 heat exchanger was used.
Finally, the exchanger set with the design specification required 0.55 kW to bring the steam to 205 °C, which could be achieved using the remaining thermal energy from C2.
The steam, now at 615 °C, entered the gasification section. At this point, the heat from the exhaust gas exiting the burner was exploited to bring the air entering the combustion chamber to 940 °C.
Figure 8 and Figure 9 present the optimized flowsheets, where the sections in red indicate the optimized streams.
Table 13 and Table 14 report the energy content and block energy duty.
It should be noted that the heat from the B13 exchanger was not exploited by the C2 exchanger.
Due to this optimization, it was possible to exploit the sensible heat of the flue gas to heat the air to 940 °C; as a direct consequence, the combustor did not need energy to bring the air to combustor temperature, and therefore, no auxiliary fuel was needed to close the energy balance.
Consequently, CGE was increased due to the absence of auxiliary fuel, as presented in Table 15.
In Table 16 below, the yield and efficiency of the system are reported.
Table 17 reports a comparison between the findings of this paper and some literature results in terms of Bio-SNG composition and CGE.
Bartik et al. [22] performed methanation with three different configurations:
  • DFB gasification with direct methanation of the DFB product gas (case I).
  • Methanation starting from DFB gasification supported by external hydrogen in the product gas (cases II and III).
  • DFB gasification with in-situ CO2 removal (SER process) and direct methanation (case IV).
Cases II and III differ in terms of the amount of hydrogen added to the product gas before methanation. The stochiometric number (SN), as defined in Table 17, takes into account this variation.
Similar to cases II and III reported by Bartik et al. [22], the model simulation reported by Wan et al. [24] considered a hydrogen stream in combination with syngas.
According to the literature results reported in Table 17, the methane yield increased with pressure and the ratio of H2 to carbonaceous species. Interestingly, this aspect is also more pronounced in case IV from Bartik et al. [22], where a SER process was considered. In fact, due to the use of in situ CO2 capture, the syngas produced by the DFB gasifier was characterized by higher H2 content and reduced CO2 content, enhancing the subsequent methanation step. At the same time, the role of pressure is emphasized by the results of Wan et al., where the use of higher pressure coupled with a stream of hydrogen lead to the best results in terms of methane yield. This aspect is further highlighted by the results reported in this work, where the operating pressure of 10 bar allowed us to obtain a methane content higher than that obtained by Bartik et al. but lower than in the work of Wan et al. [24].
The differences can be attributed both to the different operating conditions of the methanation and the number of methanation stages—four in this study, compared to a single stage in others. Moreover, the use of multi-stage methanation enabled, in the optimized process scheme, the recovery of the heat produced during the reaction. In this way, the highest value of ideal CGE was obtained, justifying the complexity of the scheme in which energy optimization was performed.
The plant optimization showed better exploitation of the heat flow by reducing the cooling stream needed for the methanation reactors. Moreover, a higher inlet temperature for air and water as they entered the gasification section is obtained. Consequently, as mentioned above, efficiencies increased and the auxiliary fuel for the combustor was avoided. This lead to a reduction of 10% in CO2 emissions, corresponding to 0.7 kg/h of methane combustion emission.
The developed model does not account for geometrical factors or scaling effects that might influence the performance of equipment, such as heat exchangers, reactors, or separators. Moreover, the inclusion of further data related to syngas cleaning and its utilization through methanation could enhance the accuracy and applicability of the model. Nonetheless, the results obtained represent a starting point for the scaling up of the process. In particular, the gasification model, validated with literature data, may be leveraged as a basis for further study on clean syngas utilization in process scheme layouts to produce different energy carriers.
Furthermore, the kinetic model of the methanation section can be utilized for the scaling up and sizing of industrial reactors, paving the way for methane production both from gasification, as demonstrated in this work, and from process layout coupling the syngas with other hydrogen sources, e.g., electrolysis, in order to increase CO2 utilization.
The potential scalability of the gasification process, both in size and operating pressure, combined with its flexibility in terms of feeding turn out to be well known in the literature [54] and provide a solid basis for coupling with the methanation process. The methanation process is also easily scalable, offering both thermodynamic and kinetic improvements, particularly with the pressurization of the system. Research is in progress to experimentally investigate these aspects further, focusing on optimizing process performance through gasification reactor pressurization.

4. Conclusions

This work presents a comprehensive simulation and optimization of an integrated biomass gasification process coupled with methanation for the production of Bio-SNG, which is currently a key pillar in the global energy scenario. The simulation, conducted using Aspen Plus® software, highlighted the potential to recover 80% of the heat generated during the exothermic methanation reactions, thereby eliminating the need for auxiliary fuel to sustain the gasification process, demonstrating the effectiveness of advanced thermal integration strategies in enhancing overall energy efficiency.
A theoretical cold gas efficiency of 94% was obtained from the gasification section simulation, with a carbon conversion of 79% and a syngas H2 content of 53.3% (mol.%, dry basis). By coupling the gasification process with the methanation process, after their energetic integration was optimized, an overall Bio-SNG yield of 0.40 Nm3Bio-SNG/kgBio, with a methane content of 85 vol.% and an overall plant efficiency of 79.1%, was achieved.
The application of the heat recovery strategies not only enhances the energy efficiency of the system, allowing the suppression of the burner auxiliary fuel, but also produces an overall reduction in CO2 emissions, estimated to be 10%, making the process more sustainable.
In conclusion, the optimized configuration presented confirms the potential of syngas methanation from biomass gasification to produce renewable synthetic methane with high energy efficiency, minimizing energy demand and CO2 emissions, which may represent an alternative source of energy to reduce dependence on fossil sources, given the wide availability of residual biomass.

Author Contributions

Conceptualization, A.D.C. and A.A.P.; Data curation, E.D.B., A.A.P., A.V. and U.P.L.; formal analysis, E.D.B., A.A.P., A.V. and U.P.L.; funding acquisition, A.D.C. and E.B.; investigation, A.A.P., E.D.B. and U.P.L.; methodology, A.A.P., A.D.C. and E.D.B.; project administration, A.D.C. and E.B.; resources, A.D.C. and E.B.; supervision, A.D.C. and E.B.; validation, A.A.P., A.D.C., E.B. and U.P.L.; visualization, A.A.P., A.V. and E.D.B.; writing-original draft: E.D.B.; writing-review & editing, E.D.B., A.A.P., A.V. and U.P.L. All authors have read and agreed to the published version of the manuscript.

Funding

This research was developed within the AIRE (Advanced Integration for Renewable Energies) Project, funded by the Italian program PON R&I 2014–2020, Contract ARS01_01245.

Data Availability Statement

Dataset available on request from the authors.

Conflicts of Interest

The authors declare no conflict of interest.

Abbreviations

AIREAdvanced integration for renewable energies
Bio-SNGBio-synthetic natural gas
CCCarbon conversion
CFBCirculating fluidized bed
CGECold gas efficiency
DFBDual fluidized bed
FiFlow rate (kg/h) of species i
HHVHigh heating value
ICEInternal combustion engine
IEAInternational energy agency
PR-BMPeng-Robinson with Boston–Mathias alpha
RESRenewable energy source
SERSorption-enhanced reforming
S/BSteam-to-biomass
WCWater conversion
WGSWater–gas shift
WMOWord Meteorological Organization

References

  1. World Meteorological Organization (WMO). State of the Global Climate 2023; WMO: Geneva, Switzerland, 2024. [Google Scholar]
  2. Gu, D.; Andreev, K.; Dupre, M.E. Major Trends in Population Growth Around the World. China CDC Wkly. 2021, 3, 604–613. [Google Scholar] [CrossRef] [PubMed]
  3. United Nations. World Population Prospects 2024: Summary of Results; United Nations: New York, NY, USA, 2024. [Google Scholar]
  4. Harjanne, A.; Korhonen, J.M. Abandoning the concept of renewable energy. Energy Policy 2019, 127, 330–340. [Google Scholar] [CrossRef]
  5. Werther, J.; Saenger, M.; Hartge, E.-U.; Ogada, T.; Siagi, Z. Combustion of agricultural residues. Prog. Energy Combust. Sci. 2000, 26, 1–27. [Google Scholar] [CrossRef]
  6. Dees, M.; Elbersen, B.; Fitzgerald, J.; Vis, M.; Ramirez-Almeyda, J.; Glavonjic, B.; Staritsky, I.; Verkerk, H.; Monti, A.; Datta, P.; et al. S2Biom Project Grant Agreement n°608622 D1.1 Roadmap for Regional End-Users on How to Collect, Process, Store and Maintain Biomass Supply Data Delivery of Sustainable Supply of Non-Food Biomass to Support a “Resource-Efficient” Bioeconomy in Europe; Institute of Forest Sciences, University of Freiburg: Freiburg, Germany, 2017. [Google Scholar]
  7. Li, S.; Xu, S.; Liu, S.; Yang, C.; Lu, Q. Fast pyrolysis of biomass in free-fall reactor for hydrogen-rich gas. Fuel Process. Technol. 2004, 85, 1201–1211. [Google Scholar] [CrossRef]
  8. Gallifuoco, A.; Papa, A.A.; Spera, A.; Taglieri, L.; Di Carlo, A. Dynamics of liquid-phase platform chemicals during the hydrothermal carbonization of lignocellulosic biomass. Bioresour. Technol. Rep. 2022, 19, 101177. [Google Scholar] [CrossRef]
  9. McKendry, P. Energy production from biomass (part 1): Overview of biomass. Bioresour. Technol. 2002, 83, 37–46. [Google Scholar] [CrossRef] [PubMed]
  10. Kumar, S.; Shukla, S.K. A review on recent gasification methods for biomethane gas production. Int. J. Energy Eng. 2016, 6, 32–43. [Google Scholar] [CrossRef]
  11. Papa, A.A.; Bartolucci, L.; Cordiner, S.; Di Carlo, A.; Mele, P.; Mulone, V.; Vitale, A. The effect of pyrolysis temperature on the optimal conversion of residual biomass to clean syngas through fast-pyrolysis/steam gasification integration. Int. J. Hydrogen Energy 2024, 95, 1316–1327. [Google Scholar] [CrossRef]
  12. Palone, O.; Ramezani, R.; Navarro, C.; Di Felice, L.; Borello, D.; Grasa, G.; Gallucci, F. On the reduction of NiFe/Al2O3 oxygen carrier in high-pressure chemical looping applications. Int. J. Hydrogen Energy 2024, 49, 1304–1317. [Google Scholar] [CrossRef]
  13. Rey, J.R.C.; Longo, A.; Rijo, B.; Pedrero, C.M.; Tarelho, L.A.C.; Brito, P.S.D.; Nobre, C. A review of cleaning technologies for biomass-derived syngas. Fuel 2024, 377, 132776. [Google Scholar] [CrossRef]
  14. Di Carlo, A.; Savuto, E.; Foscolo, P.U.; Papa, A.A.; Tacconi, A.; Del Zotto, L.; Aydin, B.; Bocci, E. Preliminary Results of Biomass Gasification Obtained at Pilot Scale with an Innovative 100 kWth Dual Bubbling Fluidized Bed Gasifier. Energies 2022, 15, 4369. [Google Scholar] [CrossRef]
  15. Papa, A.A.; Tacconi, A.; Savuto, E.; Ciro, E.; Hatunoglu, A.; Foscolo, P.U.; Del Zotto, L.; Aydin, B.; Bocci, E.; Di Carlo, A. Performance evaluation of an innovative 100 kWth dual bubbling fluidized bed gasifier through two years of experimental tests: Results of the BLAZE project. Int. J. Hydrogen Energy 2023, 48, 27170–27181. [Google Scholar] [CrossRef]
  16. Marchetti, L.; Guastaferro, M.; Annunzi, F.; Tognotti, L.; Nicolella, C.; Vaccari, M. Two-stage thermal pyrolysis of plastic solid waste: Set-up and operative conditions investigation for gaseous fuel production. Waste Manag. 2024, 179, 77–86. [Google Scholar] [CrossRef] [PubMed]
  17. Enebe, N.L.; Chigor, C.B.; Obileke, K.; Lawal, M.S.; Enebe, M.C. Biogas and Syngas Production from Sewage Sludge: A Sustainable Source of Energy Generation. Methane 2023, 2, 192–217. [Google Scholar] [CrossRef]
  18. Rauch, R.; Hrbek, J.; Hofbauer, H. Biomass gasification for synthesis gas production and applications of the syngas. Wiley Interdiscip Rev. Energy Environ. 2014, 3, 343–362. [Google Scholar] [CrossRef]
  19. Materazzi, M.; Taylor, R.; Cozens, P.; Manson-Whitton, C. Production of BioSNG from waste derived syngas: Pilot plant operation and preliminary assessment. Waste Manag. 2018, 79, 752–762. [Google Scholar] [CrossRef] [PubMed]
  20. Johansson, M.T. Bio-synthetic natural gas as fuel in steel industry reheating furnaces—A case study of economic performance and effects on global CO2 emissions. Energy 2013, 57, 699–708. [Google Scholar] [CrossRef]
  21. Thunman, H.; Seemann, M.; Vilches, T.B.; Maric, J.; Pallares, D.; Ström, H.; Berndes, G.; Knutsson, P.; Larsson, A.; Breitholtz, C.; et al. Advanced biofuel production via gasification—Lessons learned from 200 man-years of research activity with Chalmers’ research gasifier and the GoBiGas demonstration plant. Energy Sci. Eng. 2018, 6, 6–34. [Google Scholar] [CrossRef]
  22. Bartik, A.; Benedikt, F.; Fuchs, J.; Hofbauer, H.; Müller, S. Experimental investigation of hydrogen-intensified synthetic natural gas production via biomass gasification: A technical comparison of different production pathways. Biomass Convers Biorefin. 2024, 14, 23091–23110. [Google Scholar] [CrossRef]
  23. Ciccone, B.; Murena, F.; Ruoppolo, G.; Urciuolo, M.; Brachi, P. Methanation of syngas from biomass gasification: Small-scale plant design in Aspen Plus. Appl. Therm. Eng. 2024, 246, 122901. [Google Scholar] [CrossRef]
  24. Wan, H.; Feng, F.; Yan, B.; Liu, J.; Chen, G.; Yao, J. Methanation of syngas from biomass gasification in a dual fluidized bed: An Aspen plus modeling. Energy Convers Manag. 2024, 318, 118902. [Google Scholar] [CrossRef]
  25. Luca del Zotto, Progetto AIRE, le Potenzialità Delle Biomasse Residuali. 2021. Available online: https://www.rinnovabili.it/energia/biomassa/progetto-aire-potenzialita-biomasse-residuali/ (accessed on 15 January 2025).
  26. Kuczynski, S.; Łaciak, M.; Olijnyk, A.; Szurlej, A.; Włodek, T. Thermodynamic and technical issues of hydrogen and methane-hydrogen mixtures pipeline transmission. Energies 2019, 12, 569. [Google Scholar] [CrossRef]
  27. Green, D.W.; Perry, R.H. Perry’s Chemical Engineers’ Handbook, 8th ed.; McGraw-Hill Education: Berkshire, UK, 2008; Available online: https://www.accessengineeringlibrary.com/content/book/9780071422949 (accessed on 18 December 2024).
  28. Alptekin, F.M.; Celiktas, M.S. Review on Catalytic Biomass Gasification for Hydrogen Production as a Sustainable Energy Form and Social, Technological, Economic, Environmental, and Political Analysis of Catalysts. ACS Omega 2022, 7, 24918–24941. [Google Scholar] [CrossRef] [PubMed]
  29. Murakami, T.; Xu, G.; Suda, T.; Matsuzawa, Y.; Tani, H.; Fujimori, T. Some process fundamentals of biomass gasification in dual fluidized bed. Fuel 2007, 86, 244–255. [Google Scholar] [CrossRef]
  30. Li, Y.H.; Chen, Z.; Watkinson, P.; Bi, X.; Grace, J.; Lim, C.J.; Ellis, N. A novel dual-bed for steam gasification of biomass. Biomass Convers. Biorefin. 2018, 8, 357–367. [Google Scholar] [CrossRef]
  31. Colelli, L.; Verdone, N.; Bassano, C.; Segneri, V.; Vilardi, G. Optimization of Power to Gas system with cooled reactor for CO2 methanation: Start-up and shut-down tests with Ru-based and Ni-based kinetics. Energy 2024, 312, 133554. [Google Scholar] [CrossRef]
  32. Dimian, A.C.; Bildea, C.S.; Kiss, A.A. Introduction in Process Simulation. Comput. Aided Chem. Eng. 2014, 35, 35–71. [Google Scholar] [CrossRef]
  33. Solís, A.; Rocha, S.; König, M.; Adam, R.; Garcés, H.O.; Candia, O.; Muñoz, R.; Azócar, L. Preliminary assessment of hazelnut shell biomass as a raw material for pellet production. Fuel 2023, 333, 126517. [Google Scholar] [CrossRef]
  34. ASTM D5373-93 (1997); Standard Methods for Instrumental Determination of Carbon, Hydrogen, and Nitrogen in Laboratory Samples of Coal and Coke. ASTM International: West Conshohocken, PA, USA, 1993.
  35. ASTM D4239-18e1; Standard Test Method for Sulfur in the Analysis Sample of Coal and Coke Using High-Temperature Tube Furnace Combustion. ASTM International: West Conshohocken, PA, USA, 2021.
  36. ASTM D2361-95; Standard Test Method for Chlorine in Coal. ASTM International: West Conshohocken, PA, USA, 2021.
  37. ASTM D7582-15; Standard Test Methods for Proximate Analysis of Coal and Coke by Macro Thermogravimetric Analysis. ASTM: West Conshohocken, PA, USA, 2015.
  38. Boie, W. Fuel Technology calculations. Energietechnik 1952, 3, 309–316. [Google Scholar]
  39. Fercher, E.; Hofbauer, H.; Fleck, T.; Rauch, R.; Veronik, G. Two Years Experience with the Ficfb-Gasification Process. In Biomass for Energy and Industry, Proceedings of the 10th European Conference and Technology Exhibition Biomass for Energy and Industry, Würzburg, Germany, 8–11 June 1998; Commission of the European Communities: Brussels, Belgium, 1998. [Google Scholar]
  40. Puig-Gamero, M.; Pio, D.T.; Tarelho, L.A.C.; Sánchez, P.; Sanchez-Silva, L. Simulation of biomass gasification in bubbling fluidized bed reactor using aspen plus®. Energy Convers Manag 2021, 235, 113981. [Google Scholar] [CrossRef]
  41. Marcantonio, V.; Bocci, E.; Monarca, D. Development of a Chemical Quasi-Equilibrium Model of Biomass Waste Gasification in a Fluidized-Bed Reactor by Using Aspen Plus. Energies 2020, 13, 53. [Google Scholar] [CrossRef]
  42. El-Rub, Z.A.; Bramer, E.A.; Brem, G. Experimental comparison of biomass chars with other catalysts for tar reduction. Fuel 2008, 87, 2243–2252. [Google Scholar] [CrossRef]
  43. Rapagnà, S.; Jand, N.; Kiennemann, A.; Foscolo, P.U. Steam-gasification of biomass in a fluidised-bed of olivine particles. Biomass Bioenergy 2000, 19, 187–197. [Google Scholar] [CrossRef]
  44. Han, J.; Liang, Y.; Hu, J.; Qin, L.; Street, J.; Lu, Y.; Yu, F. Modeling downdraft biomass gasification process by restricting chemical reaction equilibrium with Aspen Plus. Energy Convers. Manag. 2017, 153, 641–648. [Google Scholar] [CrossRef]
  45. Doherty, W.; Reynolds, A.; Kennedy, D. The effect of air preheating in a biomass CFB gasifier using ASPEN Plus simulation. Biomass Bioenergy 2009, 33, 1158–1167. [Google Scholar] [CrossRef]
  46. Lahijani, P.; Zainal, Z.A.; Mohammadi, M.; Mohamed, A.R. Conversion of the greenhouse gas CO2 to the fuel gas CO via the Boudouard reaction: A review. Renew. Sustain. Energy Rev. 2015, 41, 615–632. [Google Scholar] [CrossRef]
  47. Puig-Arnavat, M.; Bruno, J.C.; Coronas, A. Review and analysis of biomass gasification models. Renew. Sustain. Energy Rev. 2010, 14, 2841–2851. [Google Scholar] [CrossRef]
  48. Rönsch, S.; Schneider, J.; Matthischke, S.; Schlüter, M.; Götz, M.; Lefebvre, J.; Prabhakaran, P.; Bajohr, S. Review on methanation—From fundamentals to current projects. Fuel 2016, 166, 276–296. [Google Scholar] [CrossRef]
  49. Gao, J.; Wang, Y.; Ping, Y.; Hu, D.; Xu, G.; Gu, F.; Su, F. A thermodynamic analysis of methanation reactions of carbon oxides for the production of synthetic natural gas. RSC Adv. 2012, 2, 2358–2368. [Google Scholar] [CrossRef]
  50. Stangeland, K.; Kalai, D.; Li, H.; Yu, Z. CO2 Methanation: The Effect of Catalysts and Reaction Conditions. In Energy Procedia; Elsevier: Amsterdam, The Netherlands, 2017; pp. 2022–2027. [Google Scholar] [CrossRef]
  51. Vitale, A.; Papa, A.A.; Iannello, S.; Ciro, E.; Hatunoglu, A.; Corradetti, V.; Rovelli, N.; Foscolo, P.U.; Di Carlo, A. Devolatilization of Polypropylene Particles in Fluidized Bed. Energies 2023, 16, 6324. [Google Scholar] [CrossRef]
  52. Pfeifer, C.; Koppatz, S.; Hofbauer, H. Catalysts for dual fluidised bed biomass gasification-an experimental study at the pilot plant scale. Biomass Convers. Biorefin. 2011, 1, 63–74. [Google Scholar] [CrossRef]
  53. Taylor, D.G.; Taylor, D.; Raju, A. Renewable Syngas Methanation; California Energy Commission: Sacramento, CA, USA, 2024.
  54. Basu, P. Biomass Gasification and Pyrolysis: Practical Design and Theory; Elsevier: Amsterdam, The Netherlands, 2010. [Google Scholar] [CrossRef]
Figure 1. ASPEN Plus® gasification flowsheet.
Energies 18 00753 g001
Figure 2. ASPEN Plus® methanation flowsheet.
Energies 18 00753 g002
Figure 3. Simulation data results and comparison with literature data from the work of Pfifer et al. [52].
Energies 18 00753 g003
Figure 4. Input/output streams of gasification section.
Energies 18 00753 g004
Figure 5. Dry Bio-SNG composition trend as pressure changes.
Energies 18 00753 g005
Figure 6. Bio-SNG composition obtained by the simulation (vol.%, dry basis) and comparison with literature data from the work of Taylor et al. [53].
Energies 18 00753 g006
Figure 7. Input/output streams of the methanation section.
Energies 18 00753 g007
Figure 8. Gasification optimized flowsheet.
Energies 18 00753 g008
Figure 9. Methanation optimized flowsheet.
Energies 18 00753 g009
Table 1. Results of ultimate and proximate analyses of the biomass and higher heating value (HHV) calculated with Boie.
Ultimate AnalysisProximate Analysis
Ash (wt.%dry)1.20Moisture (wt.%)7.90
Carbon (wt.%dry)50.96Fixed Carbon (wt.%dry)23.3
Hydrogen (wt.%dry)5.72Volatile Matter (wt.%dry)75.5
Nitrogen (wt.%dry)0.42Ash (wt.%dry)1.20
Chlorine (wt.%dry)0.02
Sulfur (wt.%dry)0.03HHV (MJ/kg)19.27
Oxygen (wt.%dry)41.65
Table 2. ASPEN Plus® gasification flowsheet unit operation.
ASPEN Plus® UnitBlock IDDescription
RYIELDDECOMPConverts the non-conventional stream “BIOMASS” into conventional components, from which weight fraction is calculated according to biomass characterization.
RSTOICINORGConverts the inorganic components of the biomass (N2, S, Cl) into syngas contaminants (NH3, H2S, HCL).
TARPRODSimulates tar content produced during the process by establishing the conversion of C and H2 obtained in the previous step.
COMBConverts char and CH4 to produce energy for gasification.
SEPSEPSeparates char from volatile compounds.
CANDLESSeparates ashes from the raw gas.
RGIBBSGASIFProduces gaseous fuel.
TAR-REFProduces H2 from tar.
FSPLITSPLITDivides the char stream, sending some to the combustion chamber and some to the TARPROD reactor.
COMPRCOMPAIRIsentropic compressor that exerts slight overpressure.
HEATXEX01Recovers the sensible heat in the flue gas leaving the combustor by bringing the air to combustion temperature.
Table 3. ASPEN Plus® methanation flowsheet unit operation.
ASPEN Plus® UnitBlock IDDescription
RGIBBSDES-DECLRemoves H2S and HCl.
REQUILWGSAdiabatic reactor where the WGS reaction takes place.
RPLUGMET1, MET2, MET3, MET4Adiabatic reactors where the Bio-SNG is produced.
PUMPPUMP1Water is pressurized from 1 to 20 atm.
HEATXEXCH1, C1, RX2, C2, C3, C4, C5Heat exchanger.
FLASHFLASH1–FLASH2Flash separator used to separate water from the gas.
SEPB3Separator for CO2 removal from Bio-SNG.
MCOMPRCOMPGas undergoes methanation and is compressed from 1 to 20 atm.
MIXERB4Gas and steam are mixed before entering the methanators.
Table 4. Vapor–solid stream produced after DECOMP.
H2
(wt.%)
H2O
(wt.%)
O2
(wt.%)
C
(wt.%)
N2
(wt.%)
S
(wt.%)
Cl
(wt.%)
Ash
(wt.%)
5.277.9038.3646.930.390.030.021.11
Table 5. Steam-to-biomass (S/B) ratio, temperature, composition, and HHV of syngas exiting the gasification section.
T (°C)612
H2 (mol.%, dry basis)51.6%
CO (mol.%, dry basis)18.7%
CO2 (mol.%, dry basis)22.3%
CH4 (mol.%, dry basis)7.4%
HHV (MJ/kg)12.25
Table 6. Summary of the main input/output streams of the gasification section and their energy content.
StreamTemperature (°C)Energy Content (kW)Sensible Heat (kW)
INPUTBiomass25100.03-
Methane2510.80-
OUTPUTVent88.061.56
Clean gas61293.7512.78
Ash8501.850.05
Table 7. Block energy duty of the blocks in the gasification simulation.
Block NameEnergy Duty (kW)
DECOMP38.14
TARPROD0.05
GASIF−20.7
COMB−18.41
INORG−0.10
Table 8. Bio-SNG composition.
H2
(%mol)
CO
(%mol)
CO2
(%mol)
CH4
(%mol)
H2O
(%mol)
N2
(%mol)
HHV
(MJ/kg)
10.40.44.283.80.70.648.9
Table 9. Summary of the main input/output streams of the methanation section and their energy content.
StreamTemperature (°C)Energy Content (kW)Sensible Heat (kW)
INPUTClean gas61294.5612.78
OUTPUTBio-SNG40.079.630.01
Table 10. Block energy duty in the methanation section simulation.
Block NameEnergy Duty (kW)
C1 (heater)−2.36
FLASH1−1.73
C2 (heater)−5.77
C3 (heater)−0.82
C4 (heater)−3.44
C5 (heater)−3.49
FLASH2 (Flash)−9.01
B3 (Sep)−0.03
Table 11. Required energy for the production of steam for the gasification section.
StreamWater2Water3SteamHTSTEAM
FromPumpECONOMGENVAPEX03
ToECONOMGENVAPEX03GASIF
Temperature (°C)20112112450
Heat duty (kW) 1.166.41.88
Table 12. Inlet/outlet temperature of the exchangers between the methanation reactors.
StreamS8S9S10S11S12S13S14S21
FromMET1C2MET2C3MET3C4MET4C5
ToC2MET2C3MET3C4MET4C5FLASH2
Temperature (°C)630.7290342290504.2290385.5150.5
Table 13. Summary of the main input/output streams of the overall system when optimized.
StreamTemperature
(°C)
Energy Content
(kW)
Sensible Heat
(kW)
INPUTBiomass25100.03-
OUTPUTFlue gas105-1.27
Clean gas615.194.5612.78
Ash8501.850.05
Bio-SNG4079.620.01
Table 14. Block energy duty in the optimized process simulation.
Block NameHeat Duty (kW)
DECOMP38.19
TARPROD0.05
GASIF−21.56
COMB−17.89
INORG−0.10
B13 (heater)−2.14
B12 (heater)−3.56
FLASH1−1.73
FLASH2 (Flash)−9.49
B3 (Sep)−0.03
B11 (heater)0.50
Table 15. Cold gas efficiency (CGE).
CGEGasification94%
CGEMethanation84%
CGEOverall79%
Table 16. Yield and efficiency of the optimized system.
Syngas yield wet1.78Nm3Syngas/kgBio
Syngas yield dry1.43Nm3Syngas/kgBio
Bio-SNG yield0.29Nm3Bio-SNG_dry/Nm3CleanGas_dry
Overall Bio-SNG yield0.41Nm3Bio-SNG_dry/kgBio
Bio-SNG methane content83.9vol.%
η B i o S N G (Equation (18))84.2-
η B i o S N G O (Equation (19))79.6-
Table 17. Composition, CGE, and operative condition results and comparison with literature results.
Bartik et al. [22]Wan et al. [24]
Aspen Plus ModelingExperimental InvestigationASPEN Plus Modeling
(Case I)(Case II)(Case III)(Case IV)
CGE (Equation (15))79%58%58–59%58–59%66%61%
CH4 (vol.%)85.5%42.0%62.40%58.80%70.00%96.11%
CO (vol.%)0.3%0%0.3%0.3%0.3%0.00%
CO2 (vol.%)4.1%46.0%11.0%6.0%17.7%3.47%
H2 (vol.%)10.2%12.0%26.30%34.50%12.00%0.42%
Stechiometrich Number: SN (*) 0.911.04
Methanation Temperature290 °C360 °C358 °C364 °C342 °C300 °C
Methanation Pressure10 bar1 bar1 bar1 bar1 bar30 bar
Case I: Direct methanation of DFB product gas (case I), Cases II and III: Methanation of syngas from DFB gasifier integrated with external H2 (case II), Case IV: Via SER process (case IV), (*): S N = y H 2 y C O + y C O 2 + y C n H m .
Disclaimer/Publisher’s Note: The statements, opinions and data contained in all publications are solely those of the individual author(s) and contributor(s) and not of MDPI and/or the editor(s). MDPI and/or the editor(s) disclaim responsibility for any injury to people or property resulting from any ideas, methods, instructions or products referred to in the content.

