Article

Energy Efficiency in Seasonal Homes: A Study on the Occupancy, Energy Use, and Renovation of Second Homes in Sweden

by
Kristina Mjörnell
1,2
1
Research Institutes of Sweden, Sven Hultins Plats 5, 412 58 Gothenburg, Sweden
2
Division of Building Physics, LTH, Lund University, 221 00 Lund, Sweden
Energies 2024, 17(17), 4493; https://doi.org/10.3390/en17174493
Submission received: 8 August 2024 / Revised: 20 August 2024 / Accepted: 3 September 2024 / Published: 6 September 2024
(This article belongs to the Section G: Energy and Buildings)

Abstract

:
The escalating utilisation of second homes has led to an extension in heating periods and, to a certain degree, renovations to elevate the standard, resulting in augmented energy and resource consumption. A comprehensive survey was conducted in Sweden, examining user patterns across different seasons, heating systems, and implemented energy efficiency measures. The results indicate that second homes are occupied for extended periods during the summer season and intermittently throughout the year. Over half of the second homes are heated even when unoccupied, with 12% maintaining a temperature above 16 °C. The predominant heating method is direct electricity (32.2%), followed by heat pumps (29.5%) and stoves (17.5%). A variety of renovations are undertaken, primarily to enhance the standard and technical performance, but also to implement energy efficiency measures such as window replacement, additional insulation, or heat pump installation. Based on the reported user and heating patterns, and the energy renovations carried out, the potential energy savings with different energy renovation strategies were estimated for the Swedish second home stock. The results show that though lowering the temperature when a second home is unoccupied emerges as the most efficient measure, both in terms of cost-effectiveness and climate impact, it needs to be complemented with intermittent heating or dehumidification to ensure that the relative humidity is below critical levels, to avoid the risk of damages caused by, for example, mould growth. Installing a heat pump is the second most energy- and cost-effective measure and has the advantage that the indoor temperature can be maintained at rather high levels.

1. Introduction

1.1. Background

Society is confronted with significant challenges in transforming the built environment to enhance resource efficiency and reduce climate impact. In Europe, the European Union has established objectives for the energy efficiency of buildings, necessitating each country to devise and implement a strategy to support the energy renovation of existing buildings. The new regulations in the “Fit for 55” package aim to reduce greenhouse gas emissions from the building sector by 40%, a significant decrease from the 29% recorded in 2005 [1]. In Sweden, the National Board of Housing, Building, and Planning has developed a national renovation strategy. This strategy includes a roadmap that supports the energy renovation of the building stock, with an ambitious goal of reducing energy use by 50% by 2030 compared with 2005 [2]. Even though most energy for heating Swedish buildings originates from district heating, electricity, or biofuel, it is still motivated to decrease the total consumption. Reducing electricity use in the housing sector would support the green transition of the transport and industrial sectors and also contribute to a cleaner European electricity market. Furthermore, the strategy proposes the complete phase-out of fossil fuels by 2050 at the latest and suggests several measures to expedite the energy renovation of the building stock [2]. Most incentives are specifically designed for multi-family buildings, with the sole incentive for single-family housing being a tax deduction for renovation work. According to EU regulations, each property must possess an energy performance certificate to inform both owners and users about the property’s energy performance [3]. However, certain groups of buildings, such as second homes, are exempt from the requirement for an energy performance certificate [4]. This exemption is questionable, given the non-negligible number of second homes and its impact on total energy and power use [5,6].

1.2. Previous Research on Use and Energy Use in Second Homes

Access to a second home is a prevalent phenomenon in the Nordic countries, including Norway, Sweden, Finland, and Denmark, as well as in the United Kingdom, France, Germany, the Czech Republic, South Africa, Canada, the United States, and Australia [7,8]. During the 1960s, 1970s, and early 1980s, the construction of second homes experienced a boom, leading to the addition of cottages in locations on the urban periphery across the Nordic countries [8,9,10,11,12]. A substantial part of second homes in Sweden, Norway, and Finland, between 80 and 90 per cent, were purpose-built. However, the stock of second homes is supplemented by converted single-family houses, which previously served as primary residences but had become obsolete or abandoned because of increased demands for modern, comfortable housing, or outmigration as a result of urbanisation [9,13,14]. Consequently, converted second homes are common in rural areas in the Nordic countries. Approximately 50% of all Nordic households have access to a second home [10]. According to earlier studies, 26% of the population in Norway own a second home, but 40% utilise second homes [15], and in Sweden, about 54% of the population owns or has access to a second home through relatives and friends [5,16]. In Finland, 62% of the population has regular access to one or more second homes [17], and in Denmark, 14% own a second home, but it is likely that more people have access to one [18]. The frequency of use of second homes in these three countries generally follows the same pattern. In Finland, second homes are used on average for 75 days per year, in Sweden, for 71 days, and in Norway, for between 26 and 51 days per year (with a national mean of 47 days per year). However, there are significant regional differences in the frequency of use because of location and standard [13].
In recent years, there has been a growing interest in the purchase and utilisation of second homes, driven by factors such as “flight shame”, which has encouraged more holidays to be taken closer to one’s permanent residence and within the home country, rather than abroad, as well as the COVID-19 pandemic, which has facilitated remote work—a trend likely to endure. Second homes serve various purposes, including use as summer or winter residences and variations in between, and their operation and maintenance are diverse. Additionally, many second homes have been converted into permanent residences and vice versa. However, the climate impact resulting from the increased use of second homes, alongside potential renovations and energy efficiency improvements in building systems and materials, remains underexplored, despite the environmental and climate implications of second homes being a topic of interest since the 1970s [19]. The cultural and historical values associated with second homes have also been insufficiently researched. Studies from various European regions indicate that simpler second homes are being renovated to enhance comfort. For instance, in Norway, the increased standard of facilities in second homes has led to greater energy use and climate impact [20]. Similarly, in France, there has been a rise in energy consumption, larger building spaces, and increased land use pressure from second homes [21]. A Danish study reveals that second homes used for rental purposes exhibit higher standards and increased energy consumption, with electricity predominantly used for heating, in contrast to the broader Danish building stock [22]. A questionnaire survey among Norwegian second homeowners, aiming to understand the Norwegian second home phenomenon in relation to sustainability (environmental, social, and economic), shows a low interest in reducing energy use [23]. Steffansen (2017) observes an increase in the use of second homes by both owners and others during the pandemic, while also noting the blurred distinction between second and permanent homes. He further reports an average increase in living space, material use, energy consumption, and standards per second home. In Finland, a national survey called the Second Homes Barometer provides information on the location of second homes, available facilities and amenities, and owners’ future plans [24]. Local surveys of second homeowners in Finland have been used to study travel habits and the associated climate impact of second homes [25]. Similar trends have been observed outside Europe, for example, in South Africa [26]. Electricity consumption in second homes has steadily increased over the years, particularly as these properties are increasingly used year-round by retirees and families on holiday. The more intensive year-round use has driven up electricity consumption, whether for space heating or hot water production. In Norway, electricity consumption increased by 97% from 1973 to 2005 [27]. This trend is partly due to the fact that most second homes were originally built for summer use and are therefore often poorly insulated. Andersson et al. (2008) simulated energy consumption in Danish second homes, combining top-down estimations based on time series of total electricity consumption and the number of second homes, with bottom-up analyses of measured electricity consumption in specific second homes, considering heat losses, electricity used for appliances, and various user patterns [28]. Based on a survey of 700 second homeowners from selected areas in Denmark and interviews with representatives from typical groups of second homeowners, as well as stakeholders in rental, construction, electricity supply, regulatory processes, and renewable energy plants, a catalogue of recommendations for energy savings was developed [29]. This catalogue is aimed at the mentioned actors, including second homeowners themselves. The study concludes that the potential for energy savings in second homes is substantial, with solutions ready to be implemented. However, there is a lack of awareness of these solutions and a belief that investing in energy savings in second homes could be beneficial [29].
The second home stock in Sweden consists of a little more than 600,000 second homes, [5]. Second homes are here defined as valuation units that do not have registered residents and are taxed as agricultural units with building(s), single-family house units with building(s), single-family houses on freehold land, or single-family house units with building value below SEK 50,000 corresponding to EUR 4325 or USD 4755 [5]. Even though the energy use for the Swedish second home stock decreased from 3.5 TWh in 2011 to 2.83 TWh in 2021, which means approximately 20% during the last 10 years [5,6], more ambitious measures must be taken to reach the 2030 goals. Mata et al. (2013) estimate the potential for reducing energy use in Swedish residential buildings with permanent use, considering that a number of energy measures were performed, to be 53% based on 1400 sample buildings, and the results show that the measures with the greatest savings are those involving heat recovery systems (22%) and reduced indoor temperature (14%) [30]. Although second homes are not mandated to possess an energy performance certificate, some homeowners have voluntarily obtained one. As of August 2022, there were 10,766 second homes in Sweden with an issued energy performance certificate (EPC), accounting for 1.8% of the total number of second homes. The average specific energy use of these 10 766 second homes was estimated to be 119 kWh/m2 [31]. Most Swedish second homes are in energy classes E, F, and G. The poor energy performance can be explained by the fact that 80–90% were purpose-built and intended mainly for use during the summer. The majority of second homes have direct electricity as their main heating system, but some have installed an air-to-air heat pump, presumably to reduce electricity consumption. Ground source heat pumps are more common in second homes with higher energy classes (A–D), probably because it is a significantly larger investment than installing an air-to-air heat pump and quite a few of the houses are heated by wood stoves or tiled stoves [31]. The poor energy performance, together with a high proportion of electrical heating, make this group of buildings an interesting target group for energy efficiency measures.
In addition, there is very limited research on the energy renovation of second homes and its impact on cultural–historical values. Second homes represent great economic and cultural–historical but also social values that must not be neglected or distorted. It must be ensured that energy-efficient measures do not cause moisture damage or devastate cultural–historical values [32,33]. At the same time, second homes must also provide a good indoor environment regarding both thermal comfort and air quality, which becomes especially important if users’ time spent in second homes increases. However, results from a Finish study measuring relative humidity and temperature indoors hourly in unheated, uninsulated cottages and outdoors indicated that the monthly average vapour content of air inside is lower than the average vapour content outside most times except for some occasions during spring and when a cottage is occupied [34]. However, winter visits involving heating induce drying of the cottage. The relative humidity stays mainly below 80%, which is a critical level for mould growth on organic materials. When constant heating was introduced to increase the temperature by approximately 3 °C, it resulted in a decrease in the relative humidity by 10%. This would be enough to substantially decrease the risk of condensation and mould growth considerably [34]. An even better approach would be to introduce intermittent heating, when climatic conditions are critical in terms of the risk of mould growth [34,35]. This must be thoroughly analysed and validated in more second homes before any general recommendations can be made. Despite the existence of several prior studies on energy use, including some that focus on energy use and the potential for energy efficiency in second homes [25,28,34,36], there remains a dearth of information on current usage patterns, energy use, heating sources, and energy saving potential in second homes.

1.3. Aim and Structure of This Study

The overarching aim of this study is to compile and systemise information on energy use and energy renovation measures and to analyse the energy efficiency potential in Swedish second homes. This was accomplished by completing the following:
  • Collecting data through a nationwide survey [37], where second homeowners were asked how they use, heat, and renovate their second homes and also if they take the building’s cultural–historical values into consideration when implementing renovation measures.
  • Evaluating the energy performance and energy efficiency potential of the Swedish second home stock, based on the national survey data on user patterns, heating methods, and renovation measures, in combination with results from a theoretical analysis of the energy saving potential and carbon footprint generated by different energy renovation measure made on a pilot second home [36].
Despite the limited sample, the results give indications that the energy use for second homes can be halved if appropriate renovation measures and heating patterns are introduced, which are presented in this paper.

1.4. Strengths and Limitations

The strength of this study lies in the combination of findings from the nationwide survey, which scrutinises the usage pattern, heating methodologies, and energy renovations undertaken by second homeowners. These data are coupled with prior simulations of energy use, using BIM Energy to analyse the effect of implementing various energy renovation measures [36]. This approach facilitates an estimation of the potential energy savings for the entire Swedish second home stock, as well as the climate impact of introducing specific energy efficiency measures. The limitations are that this study was conducted in Sweden and only reflects national conditions, even though there are similarities in other Nordic countries. The results are based on a limited number of responses from second home residents, which are considered a representative sample of the Swedish second home stock. The potential for energy efficiency is evaluated based on the simulated energy use for one pilot house, a wooden house situated on the Swedish west coast, on which various renovation measures were introduced. Even though this is a rough simplification, the pilot house serves as a relevant example of typical Swedish second homes, and the results should be seen as reasonable estimates.

2. National Questionnaire Survey

2.1. Question Formulation

To gather insights on the usage, heating, and renovation patterns of the Swedish second home stock, a questionnaire was developed and distributed with support by the SOM Institute (National Survey Institute). This nationwide survey enables researchers, media, and politicians to pose questions to a representative sample of the population [37]. The author formulated seven questions concerning ownership, accessibility, use pattern, heating, renovation, and energy-efficient measures made as well as care and preservation of cultural–historical values of the second homes. Several of the questions were multiple-choice. The SOM Institute was responsible for the production of the questionnaire, coding of open responses, and preparation of the final dataset, which included possibilities for open questions and specially constructed variables. The specific questions, translated into English, are presented in Appendix A.

2.2. Survey Execution and Data Preparation

The survey was executed in September 2022 when the questionnaire, both in paper and as a digital questionnaire to be filled in online, was distributed to a random sample of 3750 individuals, aged 16 to 90, living across Sweden. The survey received responses from 1826 participants between September and December 2022. The responses were optically read using a scanner. Out of the gross sample of 3750 individuals who received the questionnaire, there was a natural non-response that included 137 questionnaires. This could be attributed to factors such as unknown addresses, absence during the period, residing/studying/working abroad, lack of proficiency in Swedish, institutional care, mental incapacity to respond, or lack of the ability to communicate.

3. Results

3.1. Results of the National Survey

The results of the questionnaire survey were supplied by the SOM Institute in the form of an Excel spreadsheet, with tick marks corresponding to the answers of each respondent to the specific questions and multiple-choice alternatives. The total number of respondents was 1826, equating to a response rate of 51%. Out of these, there were 674 affirmative responses to the question of whether they own or have access to a second home. This indicates that more than one-third of the respondents have access to a second home, as shown in Table 1.
The outcome of the question regarding how the respondents utilise their second home reveals that the majority use their second homes for shorter periods in the spring and autumn, or not at all during the autumn. Furthermore, they use it for shorter or longer durations during the summer period, as depicted in Table 2.
The responses to the question regarding the typical heating temperature of the second home when unoccupied suggest that over a third of the users do not utilise any heating during their absence. A quarter of the respondents maintain a low temperature, not exceeding 10°C. Another quarter keeps the temperature within the range of 11–15 °C. Merely 12% of the users keep the temperature at 16 °C or higher, as illustrated in Table 3.
In second homes, the predominant source of heating is electrical heating. This is subsequently followed by the use of heat pumps and either wood stoves or tiled stoves, as depicted in Table 4.
Out of the 674 respondents, 202 indicated that they have undertaken energy renovation measures over the past decade. These measures typically encompass the replacement of windows with more energy-efficient alternatives, the addition of insulation to the roof and/or attic, the façade, or the floor and/or foundation, and the installation of a new heating system, as shown in Table 5.
Furthermore, 310 respondents indicated that they undertook some type of renovation measure or reconstruction over the past decade. These renovation measures typically involve refurbishing interior surfaces, kitchens, and bathrooms, as well as roofs, façades, and windows, with a few owners who undertook foundation work, see Table 6.
A significant number of 85 respondents conveyed that their decisions regarding renovation or energy renovation measures have been influenced by the cultural–historical values of their second home, due to their appreciation for these values. Conversely, a mere eight respondents asserted that their decisions were prompted by requirements imposed by the local municipality.

3.2. Summary of Results

This study reveals that the majority of the second home users in Sweden are low users, defined as no use at all to longer periods in the summer, shorter periods or single days in other seasons, but not in all seasons and especially not in the winter. About one-fourth of the second home users are defined as high users, which means full or longer periods in one or more seasons and at least shorter periods in all other seasons, especially during the heating season. The heating practices vary, with 36% of the users not heating their homes when unoccupied, while others maintain varying degrees of temperature. Energy efficiency measures were implemented by 202 of the 673 second homeowners surveyed, with the installation of new heating systems and energy-efficient windows being the most common. However, only about 20% added insulation to their homes.

4. Estimation of the Energy Saving Potential

4.1. Approach for Estimating Energy Saving Potential

An analysis of the energy saving potential was performed based on the results from the survey. The results show that patterns of usage among second homeowners exhibit significant variation, ranging from isolated occasions to shorter or longer periods spanning over one or multiple seasons. Understanding these patterns is crucial for comprehending how the second home is utilised and potentially heated. This understanding allows for a comparison of the impact of different energy renovation measures on the energy consumption of various second homes. The criteria for identifying user profiles were inspired by those defined by [20]. For instance, in the case of medium usage, the four dark dots indicate that the house is used during summer weeks, as well as occasional weekends throughout the rest of the year. The user profiles, as defined by Gutke (2023), are presented in Figure 1 [36].
Drawing upon the outcomes of the questionnaires, wherein respondents detailed the duration of their stay in their second homes across various seasons, user profiles were assigned to the second home users. These profiles, categorised as “low”, “medium”, and “high”, were allocated in accordance with the criteria delineated in Table 7.
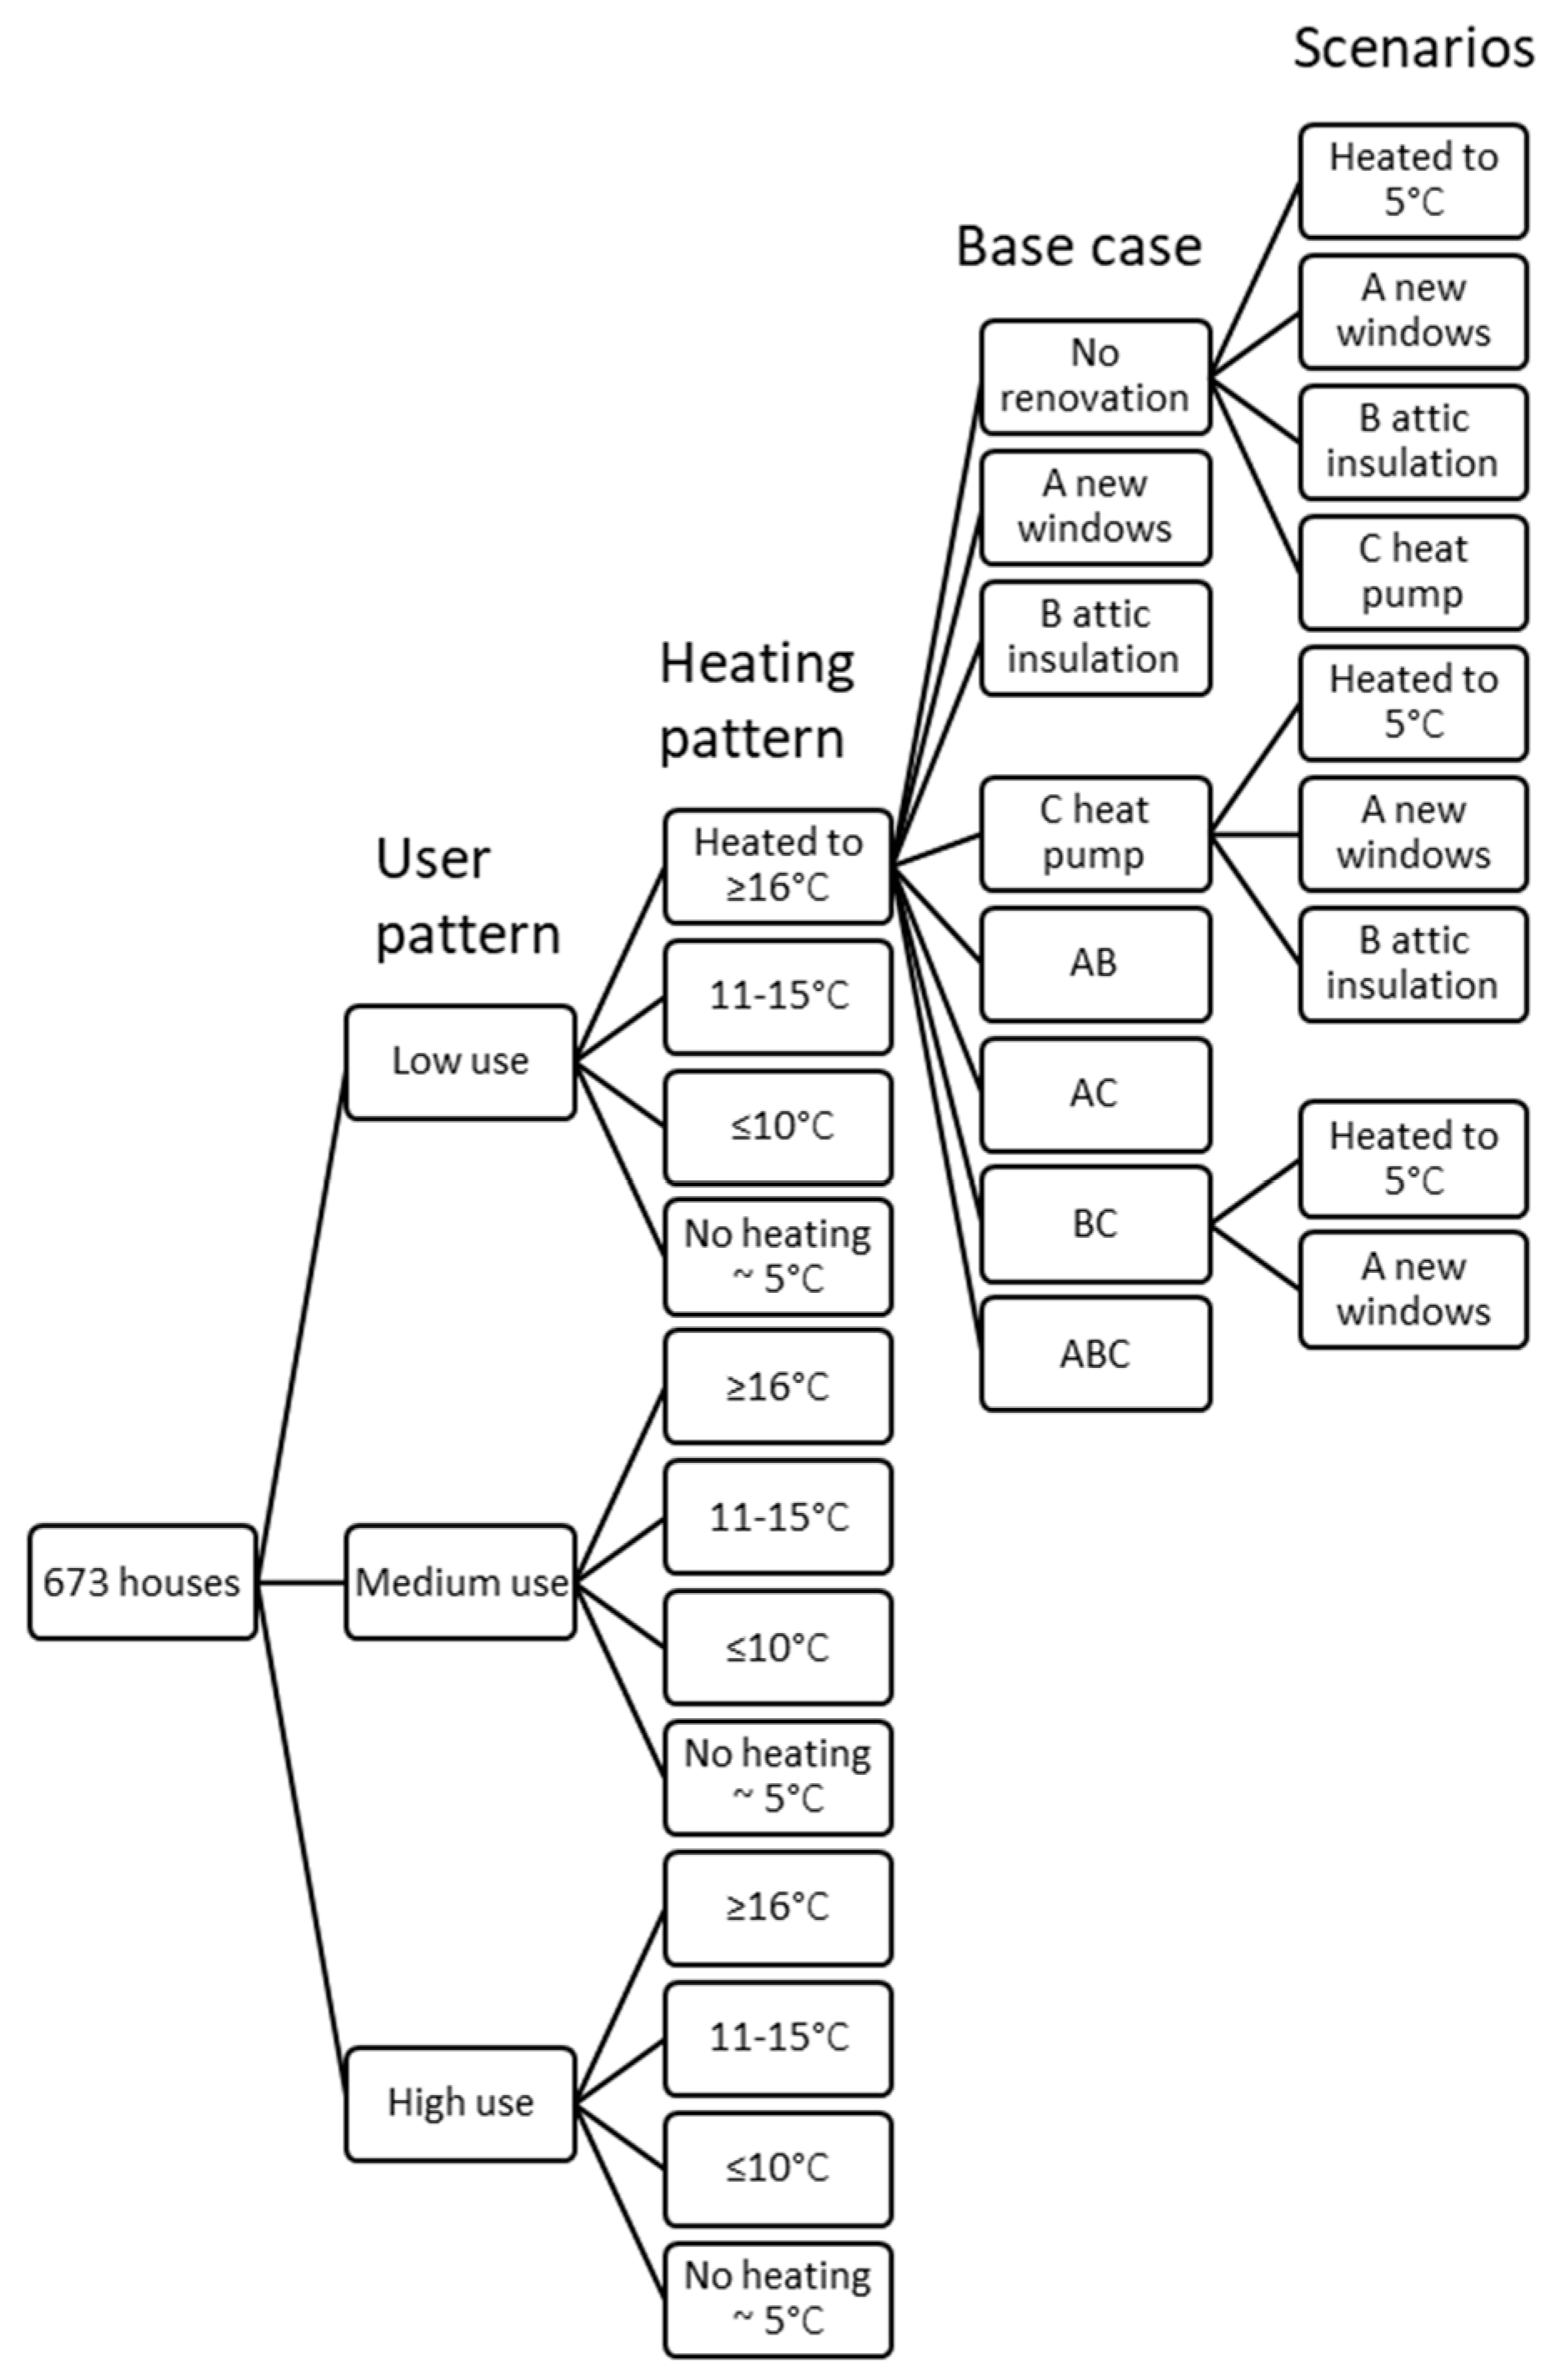
Subsequently, each second home was assigned a heating pattern based on outcomes from the questionnaire and an index, either as NR, signifying no renovation, or A, B, C, or combinations thereof, contingent upon the energy efficiency measures declared to have been implemented, referred to as Base case in Figure 2. The three energy efficiency measures are as follows: A represents window replacement, B denotes additional insulation of the attic or roof, and C signifies the installation of a heat pump.
In order to make a plausible estimate of energy usage, the presumed energy demand was derived from the calculated energy consumption for diverse usage patterns, heating patterns, and measures to curtail the energy consumption of a pilot second home, as conducted in a separate research project [36]. The pilot second home in question was a poorly insulated timber house, one-and-a-half stories in height, with a total area of 100 m2, situated on the west coast of Sweden, as depicted in Figure 3.
The energy use in the pilot house with different user patterns, heating patterns, and energy renovation measures was modelled using BIM Energy [38]. First, a baseline was simulated by calibrating the model to the actual energy use reported by the house owner, and then energy savings resulting from different user and heating patterns and renovation measures were modelled. The energy renovation measures were as follows: A: changing windows to ones with a U-value of 1.1 W/(m2·K); B: insulating the roof or attic, depending on whether it is a cold or warm attic; and C: installing an air-sourced heat pump (ASHP). The estimated energy consumptions for the pilot house are presented in Table 8. This estimation is predicated on users’ behavioural patterns, heating regimens, and implementation of energy-efficiency measures, as reported by the 673 respondents. These factors were categorised according to indices NR, A, B, and C or a combination thereof. Consequently, presumed energy consumption was apportioned to each secondary residence for which a user referenced in this study.
Given that the temperature intervals provided in the multiple-choice options in the survey slightly deviated from those utilised in the energy simulations for the pilot secondary residence, it was imperative to make some assumptions. Consequently, the responses “>16 °C” and “11–15 °C” were uniformly assigned a value of 15 °C. Similarly, responses indicating “up to 10 °C” were designated as 10 °C, and responses indicating “no heating” or “no answer” were assigned a value of 5 °C. This is a considerable simplification since there is a significant difference between heating to 5 °C and not heating at all, but it is the best match of the available data from the survey and simulations.
In the baseline scenario, referred to as Base case in Figure 2, energy consumption was assigned to each individual second home based on the users’ responses regarding occupancy patterns (low, medium, high), the temperature to which they heat their houses when not in use, and the type of energy efficiency measures implemented. In total, there were distinct responses from 673 second homeowners and users. One of the 674 respondents was excluded because of an inconsistency caused by multiple markings. In the second scenario, it was assumed that all users lower the temperature to 5 °C when their houses are not in use, and new energy usage levels from the table’s rows for 5 °C were assigned to each individual second home. In the third scenario, it was assumed that all users undertook a window replacement, except for those who already indicated that they had done so. In the fourth scenario, it was assumed that all second home users installed additional insulation in the attic or roof, except for those who already indicated that they had done so. In the fifth scenario, it was assumed that all second homes have a heat pump installed, except those that already have one. If the respondent specified that the heating method is a “heat pump” but did not declare an energy efficiency measure of “installed heat pump”, the energy usage for case C or a combination of C was used regardless. Based on this, the total energy usage and average usage for the different scenarios were calculated for the 673 second homes. From the calculations of energy savings resulting from each energy efficiency measure, a general estimation was made of the energy-saving potential among the second home users who responded to the survey. If one assumes that the 673 second homes constitute a representative sample of second homes in Sweden, the results can be extrapolated to estimate not only the energy usage but also the energy saving potential of the entire stock of Swedish second homes, consisting of approximately 610,000 houses.

4.2. Estimated Energy Saving Potential

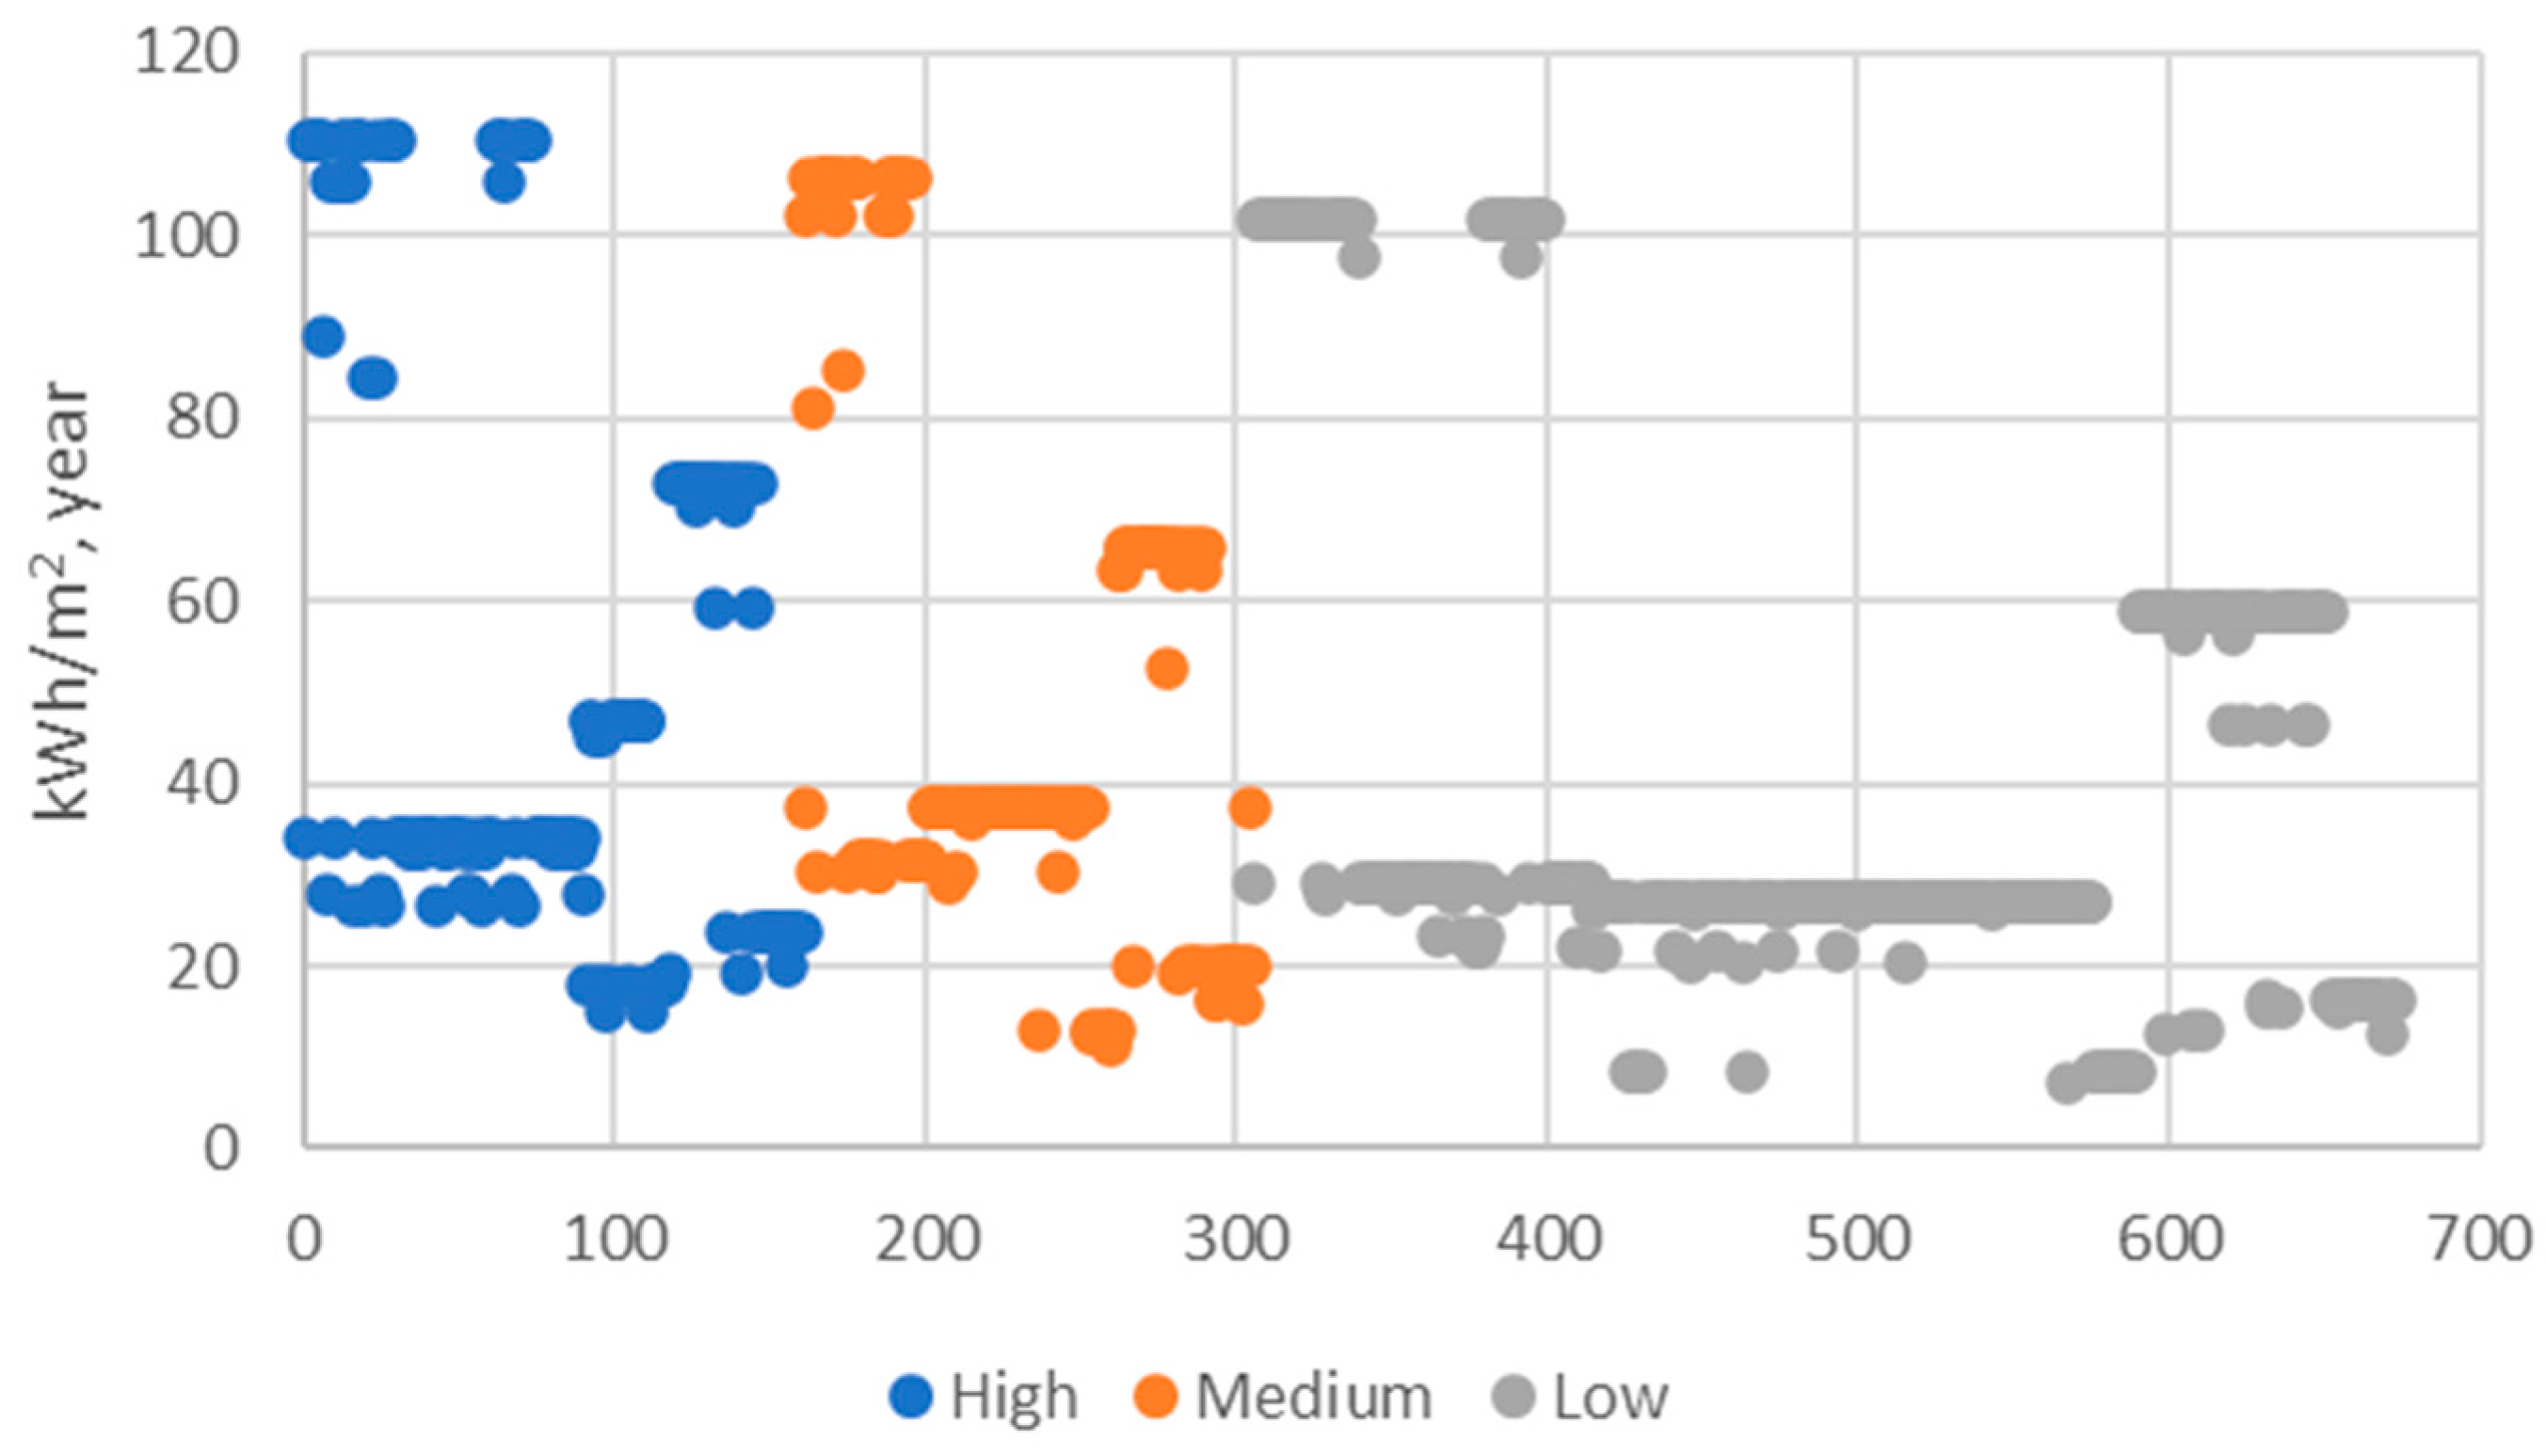
Estimated energy use, as detailed in Table 8, was assigned to each of the respondent’s second homes. This allocation was based on the user pattern (low, medium, or high, referring to user profiles), the temperature to which the users heat their houses when not in use, and the renovation and energy renovation measures carried out, as depicted in Figure 4. Subsequently, average energy usage was computed for the 673 respondents’ second homes, as shown in Table 4. Following this, the energy usage for the entire stock of second homes was estimated by simply multiplying the average energy usage for the sample of 673 houses by the total number of second homes in Sweden, which is approximately 610,000, as per Table 2. The low values for “high users” represent households that installed a heat pump, carried out other energy renovation measures, and did not heat their houses when not in use. Conversely, the high values for “low users” represent those who did not carry out energy renovation measures and heat their houses to 11–15 °C or more when not in use.
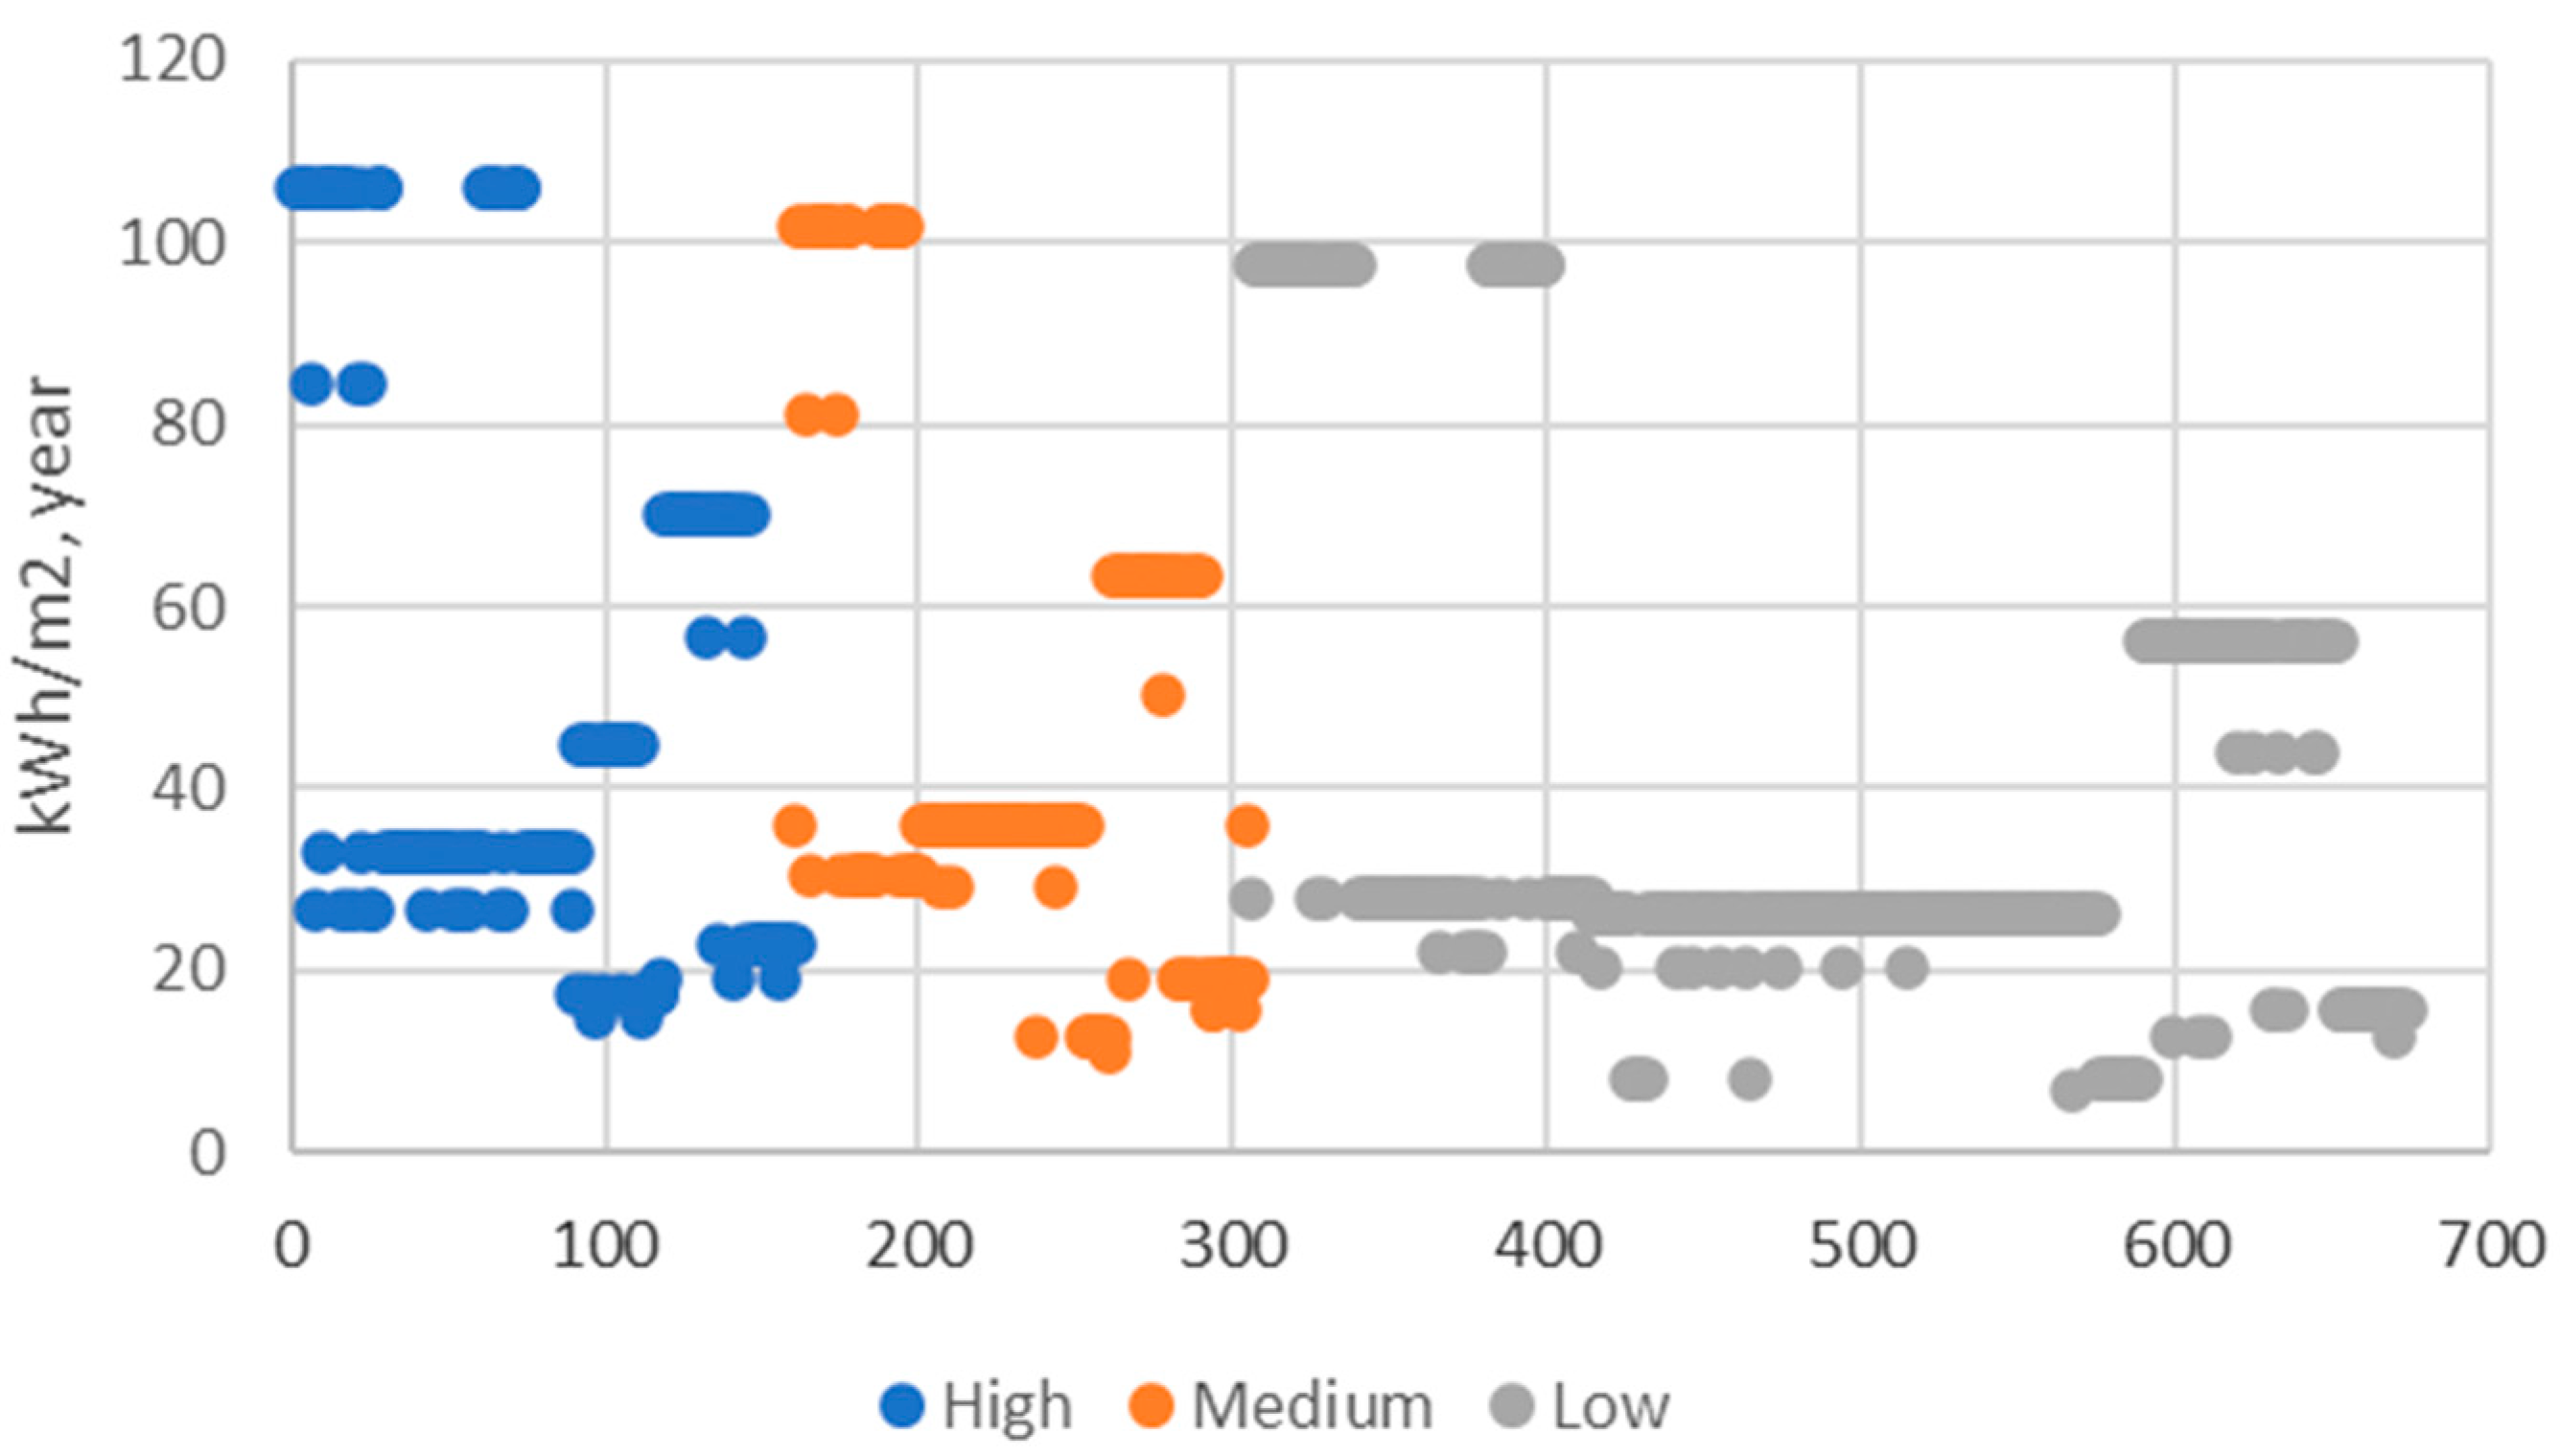
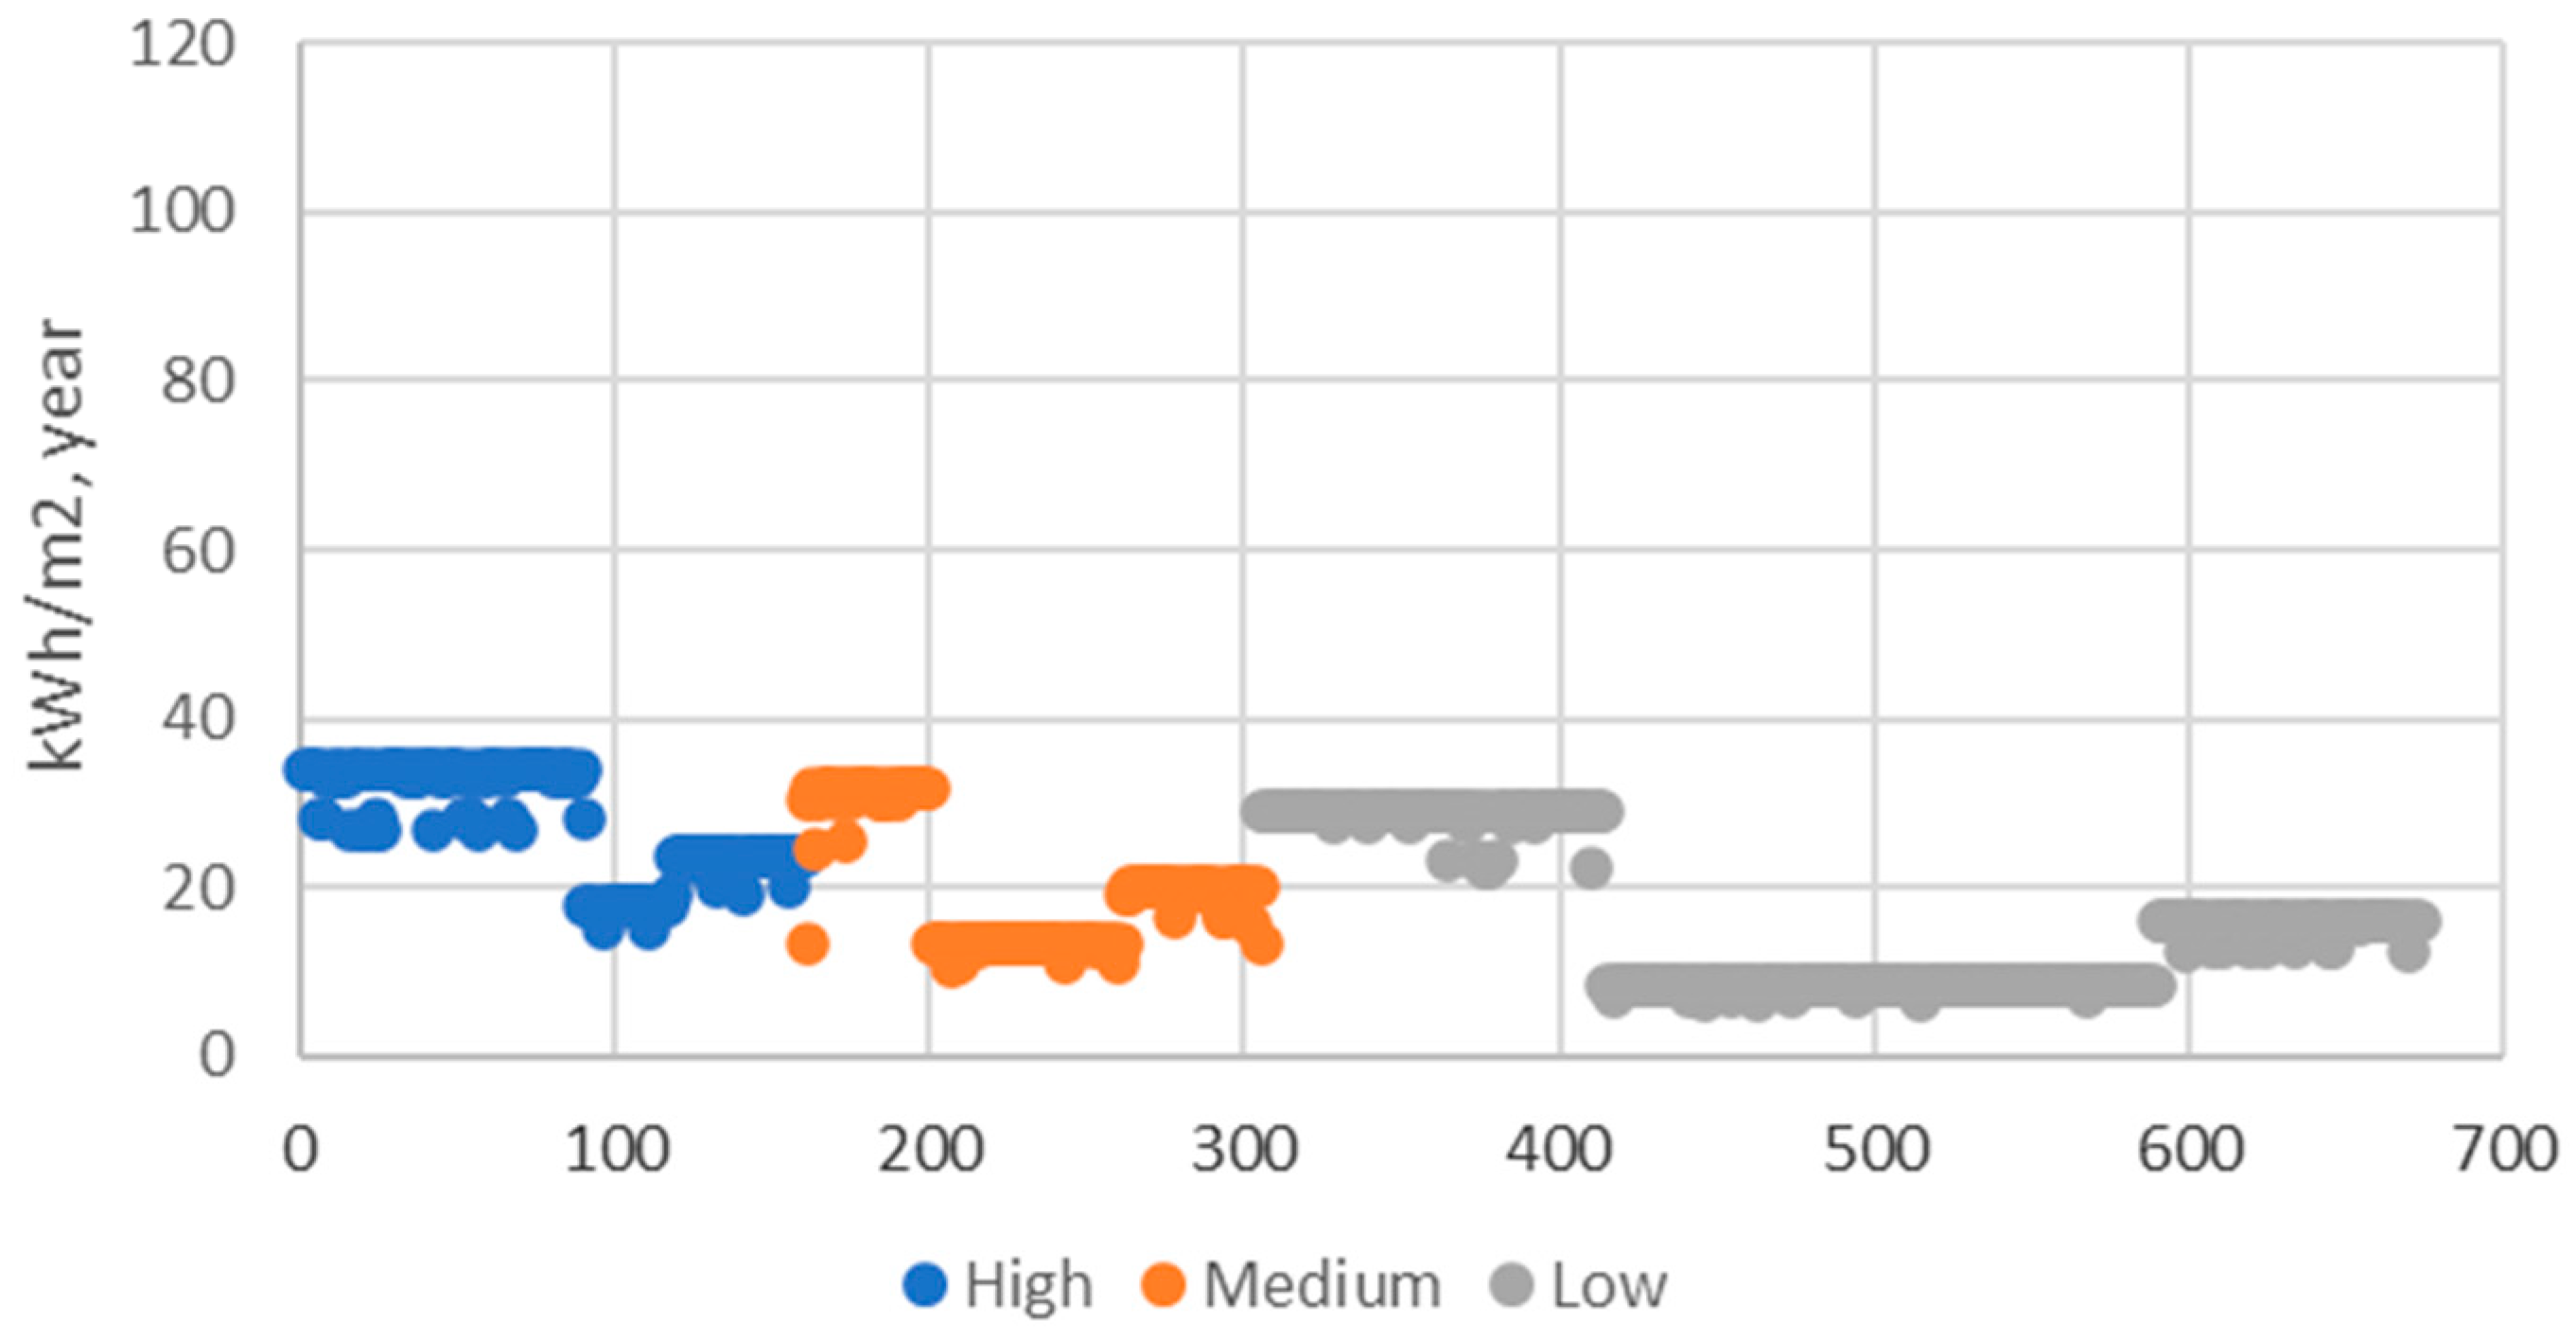
In the subsequent stage, the energy usage for the pilot house, assuming that one of the energy efficiency measures was implemented, was assigned to the 673 second homes, as illustrated in Figure 5, Figure 6, Figure 7 and Figure 8.
In light of this, a comprehensive estimation was conducted to ascertain the potential energy savings among the 673 second homeowners who participated in the survey, as indicated in the second row of Table 4. Assuming that these 673 secondary homes are a representative sample of second homes in Sweden, the findings were extrapolated to estimate the energy saving potential for the entire stock of approximately 610,000 second homes, as shown in the third row of Table 9.

4.3. Summary of Estimated Energy Saving Potential

The calculations of energy savings as a result of implementing different energy renovation measures, based on a pilot house representing an average Swedish second home, suggest significant energy-saving potential. It is important to stress that the assumption that the pilot house represents an average second home is a gross simplification. The results show that the greatest savings could be achieved by installing heat pumps in all second homes that do not yet have one installed and by lowering the temperature to around 5 °C when the second homes are unoccupied. However, this study also highlights the environmental footprint of such measures, particularly the manufacture of heat pumps [36]. Therefore, the suggestion is to maintain a low indoor temperature for extended periods when a second home is unoccupied, which could lead to substantial energy savings, provided measures are taken to prevent damage such as mould growth or the freezing of pipes. Renovations, particularly of windows, façades, and roofs, can also contribute to energy efficiency, but these interventions must be assessed with consideration of cultural–historical values of the homes. Based on the calculated energy use for different operating cases, user patterns, and implemented energy renovation measures, the total energy consumption by the 673 second homes that the users referred to in the survey was calculated. In addition, assuming that these second homes are a representative sample of the Swedish second home stock, the energy use for the entire stock was calculated by scaling up the number to 610,000 buildings, and the total energy use was then summed up to 2.7 TWh.

5. Discussion

The current study slightly contrasts previous research on the usage of second homes in Sweden. It reveals that access to second homes is significantly lower than previously reported, with only 37% of the population having access compared with the 54% reported in earlier studies [5,16]. This discrepancy warrants further investigation to understand the underlying factors contributing to this decline. Current access to a second home is, however, in line with the access reported in Norway [15]. This study also provides insights into the usage patterns of these second homes. It confirms the expectation that most people use their second homes for extended periods in the summer and shorter periods in the other seasons. However, there is no clear definition of what constitutes a “high user”. In this study, a high user is defined as someone who uses a second home, which means extended periods spanning one or more seasons and, at the very least, shorter durations in all remaining seasons. With this definition, only a quarter of the users are defined as high users, which is lower than the average of 71 days reported in earlier studies [8]. Similarly, the reported periods spent in the second home in this study are more in line with numbers reported in Norway [13].
Interestingly, this study contradicts the anticipated trend in the increased usage of second homes due to the shift towards remote work in the wake of the pandemic. It was expected that the ability to work remotely would enable professionals to spend more time in their second homes. However, the findings suggest that this has not been the case. This raises questions about the factors that might be inhibiting professionals from taking advantage of this opportunity. Further research could explore whether these factors are related to the nature of their work, personal preferences, or other constraints.
Considering the emerging trend towards new second home establishments on previously unexploited land, excessive energy use, and luxury renovations, Refs. [20,21,22] urge for actions to decrease the climate impact of the second home stock, in terms of energy efficiency, source of heating, and renovation measures undertaken. In contrast to Norway, which increased living space, material use, and standards, but also doubled its energy use over the last 30 years, there was a slight decrease in the total energy use in the Swedish second home stock during the last decade. Even though there have been national initiatives, for example, in Denmark, aimed to inform second homeowners and actors in the construction and energy sectors on energy-saving recommendations [28], one question still remains regarding how to encourage second homeowners to undertake energy efficiency measures instead of interior renovations. There is definitely a need for easy-to-access information and guidance for tailored energy efficiency measures intended for second homeowners with different types of houses, especially in Sweden.
The results of the current study present a compelling argument for the installation of heat pumps in second homes as an energy-efficient measure, with an energy saving potential of more than 50%, supporting findings from previous studies on permanent residences [30]. This recommendation is predicated on the significant reduction in energy use that heat pumps can facilitate. However, while the installation of a heat pump does involve a cost, it is suggested that this cost will be recouped over time because of the energy savings. This aspect of the argument aligns with the economic principle of cost–benefit analysis, where the initial investment is justified by long-term benefits. Yet, the manufacture of heat pumps contributes to a substantial climate impact, as reported by Gutke (2023), which could amount to between 1500 and 9500 kg CO2 per unit, depending on the extent of refrigerant reuse [36]. This introduces a paradox where an energy-saving measure also contributes to climate impacts because of the CO2 emissions involved in its production [36]. This discussion underscores the complexity of energy-efficiency measures, where the benefits of reduced energy consumption must be weighed against the climate impact of the solutions themselves. This highlights the need for a holistic approach to energy efficiency, one that considers not only the operational phase but also the manufacturing and disposal phases of the technologies involved. Further research could explore alternative manufacturing processes or technologies that could reduce the climate impact of heat pumps, thereby making them a more sustainable solution.
The results show an intriguing argument for reducing indoor temperature in second homes as a significant energy-saving measure. This strategy is particularly effective when the property is infrequently occupied or used for short periods. Even though several insurance companies in Sweden mandate a minimum indoor temperature of 15 °C to prevent freezing and subsequent leakage of water pipes and installations, maintaining a temperature of at least 5 °C in the entire house should not pose any freezing issues.
A potential concern raised against this measure is the risk of mould growth due to excess moisture, but no simulations of hygrothermal conditions were conducted in this study to analyse if this is a problem or not. However, Vinha et al. (2018) demonstrate the insignificance of excess moisture in unoccupied houses without additional moisture sources [34]. Their study further shows that the risk of mould growth is minimal and can be managed by providing additional heat when the relative humidity and temperature exceed the critical threshold for mould growth [34,35]. This has been proven by field measurements in Finish log houses, installing a device that records temperature and humidity and automatically activates a heat source or a dehumidifier when needed [34]. The approach allows the indoor temperature to remain low for extended periods, resulting in substantial energy savings. In conclusion, this discussion underscores the potential of simple, practical measures in achieving significant energy efficiency. It also highlights the importance of considering local climatic conditions and building regulations in devising energy-saving strategies. Further research could explore the development of smart devices that can effectively manage indoor conditions to maximise energy savings while ensuring the structural integrity of the property.
The implementation of energy efficiency measures on the building envelope, such as the installation of new windows or additional insulation in the attic or roof, has been found to have a relatively low impact on energy use. These interventions entail certain costs for materials and labour, but they also impact the climate in terms of greenhouse gas (GHG) emissions. According to estimates by Gutke (2023), these emissions correspond to 35 to 74 kg CO2 per m2 for windows and 0.66 to 1.14 kg CO2 equivalents per kg of insulation [36]. However, if the technical status of the windows, façade, and roof is poor and it becomes necessary to undertake renovations to extend the life of a building, such measures should of course be considered. To some extent, measures may also be required in kitchens and bathrooms to prevent water damage. However, most renovations in these areas are usually undertaken to elevate the standard of the second home. Furthermore, all interventions must be carried out with due consideration of the cultural–historical values of the second home, if any exist [33]. Preservation of the existing materials and structures is often preferable to the exchange of materials. This approach underscores the importance of balancing the need for modernisation with the preservation of cultural–historical heritage.
The energy demand for the pilot house, as calculated by Gutke (2023), demonstrated variations ranging from 10 to 110 kWh/m2 per year [36]. These variations were dependent on user patterns, heating patterns, and the implementation of energy renovation measures. This is significantly lower than the average specific energy use of the 10,766 second homes with an energy performance certificate (EPC), which was estimated to be 119 kWh/m2. The likely reason for this discrepancy is that the EPC declares energy use for permanent occupancy, which can be misleading as second homes are not used permanently. In contrast, the calculated energy use also took into account the reported user and heating patterns. The total energy use for the second home stock was estimated by extrapolating the average energy use of the 673 responding households to the entire Swedish second home stock consisting of approximately 610,000 houses. The calculated energy use amounted to 2.70 TWh per year, compared to the total energy use by second homes reported by the Swedish Energy Agency, which was 2.83 TWh in 2021. Despite the broad assumptions made in these calculations, the estimations appear to be realistic. Consequently, the potential energy savings calculated based on the scenarios where various types of energy-saving measures were introduced may therefore also be considered reasonably realistic.

6. Conclusions

In conclusion, this study contributes valuable insights into our understanding of second home usage in Sweden, challenging some existing assumptions and highlighting areas for further research. It underscores the importance of continually reassessing and investigating trends, particularly in the context of significant societal shifts such as the move towards remote work, but also renovation trends. The results of the estimated energy use and potential savings seem realistic and show that the most efficient measure, in terms of cost and climate impact, is obviously to decrease the temperature when the second home is not in use. Installing a heat pump is the second most energy- and cost-effective measure and has the advantage that the indoor temperature can be maintained at rather high levels. Even though lowering the temperature when the second home is unoccupied emerges as the most efficient measure, both in terms of cost-effectiveness and climate impact, it needs to be complemented with intermittent heating or dehumidification to ensure that the relative humidity is below critical levels and avoid the risk of damages caused by, for example, mould growth. Further research should focus on the energy saving potential and climate impact of tailored energy efficiency measures for different types of second homes, climatic conditions, and user patterns. In addition, the moisture conditions after implementing different measures must be analysed in detail. The findings from this study could be used to develop recommendations for second home owners on energy-efficient behaviour and encourage them to perform energy efficiency measures and energy renovation, rather than interior renovation, taking into consideration energy use, climate impact, and the preservation of cultural–historical values. The findings can also encourage policymakers to encompass incentives and recommendations in future energy efficiency strategies.

Funding

This study was conducted within the research project “Energieffektivisering och varsam renovering av fritidshus” P2022-00125, funded by Spara&Bevara through The Swedish Energy Agency.

Data Availability Statement

The original contributions presented in the study are included in the article, further inquiries can be directed to the corresponding author.

Acknowledgments

The author acknowledges the SOM Institute for support with the practical distribution of the questionnaire and compilation of responses as part of their national survey 2023. The questions were formulated and analysed by the author.

Conflicts of Interest

The author declares no conflicts of interest.

Appendix A

The original questionnaire translated into English.
  • Questions Included in the National Survey.
Do you own or have access to a second home?
Own
Have access to
No, and do not have access to
Usually, how do you stay in the second home during the following periods?
Not at AllOnly a Few Occasions during the DayShorter PeriodsLonger PeriodsEntire Period
Spring
Summer
Autumn
Winter
What is the main heating system in the second home?
Direct-acting electricity
Wood stove, tiled stove
Heat pump
Other
Usually, to what temperature is the second home heated when no one is staying there?
No heating
Up to 10 degrees Celsius
11–15 degrees Celsius
16 degrees Celsius or more
Have you, in the last 10 years, carried out any renovations or remodelling of the second home and if so, which ones?
No
Yes
Roof
Window
Interior surfaces
Ground
Kitchen
Facade
Bathroom
Have you, in the last 10 years, implemented any measures with the aim of reducing energy consumption in the second home?
No
Yes
Energy-efficient windows
Additional insulation roof/attic
Changing the heating system
Additional insulation façade
Additional insulation floor/ground/foundation
Have your decisions regarding renovation and/or energy efficiency been influenced by the cultural historical value of the second home?
No
Yes, because we value the building’s cultural historical values ourselves
Yes, as the municipality has had a requirement to do so

References

  1. EU Fit for 55: EU’s Target of Reducing Net Greenhouse Gas Emissions by at Least 55% by 2030. The Proposed Package Aims to Bring EU Legislation in Line with the 2030 Goal. Available online: https://www.consilium.europa.eu/en/policies/green-deal/fit-for-55/ (accessed on 10 May 2024).
  2. Boverket 2020. Underlag till Den Tredje Nationella Strategin för Energieffektiviserande Renovering. 2020. Available online: https://www.boverket.se/sv/om-boverket/publicerat-av-boverket/publikationer/2019/underlag-till-den-tredje-nationella-strategin-for-energieffektiviserande-renovering/ (accessed on 10 May 2024).
  3. COM 2021. Proposal for a DIRECTIVE of the EUROPEAN PARLIAMENT and of the COUNCIL on the Energy Performance of Buildings. Available online: www.eur-lex.europa.eu/legal-content/EN/TXT/HTML/?uri=CELEX:52021PC0802 (accessed on 10 May 2024).
  4. Boverket 2023. Byggnader Som Inte Behöver Energideklareras—Energideklaration—Boverket. Buildings for Which Energy Declaration Is Not Needed. Swedish Board of Housing Building and Planning. Available online: https://www.boverket.se/sv/energideklaration/energideklaration/dessa-byggnader-behover-inte-energideklareras/ (accessed on 10 May 2024).
  5. Energy Statistics for Dwellings with No Registered Permanent Resident (Holiday Homes) 2011; Report ES 2012:03; ISBN 1654-7543. Available online: https://www.energimyndigheten.se/globalassets/statistik/officiell-statistik/statistikprodukter/energistatistik-for-fritidshus/energistatistik-for-fritidshus-2011.pdf (accessed on 10 May 2024).
  6. SCB Statistikmyndigheten i Sverige. Information on Second Homes. 2022. Available online: https://www.scb.se/hitta-statistik/statistik-efter-amne/miljo/markanvandning/fritidshusomraden/ (accessed on 10 May 2024).
  7. Back, A.; Marjavaara, R. Mapping an invisible population: The uneven geography of second-home tourism. Tour. Geogr. 2017, 19, 595–611. [Google Scholar] [CrossRef]
  8. Häkkänen, L.; Ilgın, H.E.; Karjalainen, M. The Current State of the Finnish Cottage Phenomenon: Perspectives of Experts. Buildings 2022, 12, 260. [Google Scholar] [CrossRef]
  9. Müller, D. Tourism, Mobility and Second Homes: Between Elite Landscape and Common Ground; Aspects of Tourism. In Tourism, Mobility and Second Homes; Aspects of Tourism Series; Hall, M.C., Muller, D.K., Eds.; Channel View Publications: Bristol, UK, 2004; Volume 15. [Google Scholar]
  10. Müller, D. Second Homes in the Nordic Countries: Between Common Heritage and Exclusive Commodity. Scand. J. Hosp. Tour. 2007, 7, 193–201. [Google Scholar] [CrossRef]
  11. Mowl, G.; Barke, M.; King, H. Exploring the heterogeneity of second homes and the ‘residual’ category. J. Rural. Stud. 2020, 79, 74–87. [Google Scholar] [CrossRef]
  12. Tress, G. Development of Second-Home Tourism in Denmark. Scand. J. Hosp. Tour. 2002, 2, 109–122. [Google Scholar] [CrossRef]
  13. Lithander, J.; Tynelius, U.; Malmsten, P.; Råboc, I.; Fransson, E. Rural Housing–Landsbygdsboende i Norge, Sverige och Finland. Tillväxtanalys, Rapport 05. Östersund. Nordic Council of Ministers. 2012. Available online: https://www.tillvaxtanalys.se/publikationer/rapport/rapportserien/2012-09-18-rural-housing----landsbygdsboende-i-sverige-norge-och-finland.html (accessed on 10 May 2024).
  14. Marjavaara, R. Route to Destruction? Second Home Tourism in Small Island Communities. Isl. Stud. J. 2007, 2, 27–46. [Google Scholar] [CrossRef]
  15. Statistics Norway, 2016. Dette er Norge—Hva tallerne forteller. Oslo/Kongsviger.
  16. Back, A. Endemic and Diverse: Planning Perspectives on Second-home Tourism’s Heterogeneous Impact on Swedish Housing Markets. Hous. Theory Soc. 2021, 39, 317. [Google Scholar] [CrossRef]
  17. Adamiak, C.; Vepsäläinen, M.; Strandell, A.; Hiltunen, M.; Pitkänen, K.; Hall, M.; Rinne, J.; Hannonen, O.; Paloniemi, R.; Åkerlund, U. Second Home Tourism in Finland—Perceptions of Citizens and Municipalities on State and Development of Second Home Tourism. Reports of the Finnish Environment Institute 22en/2015. Available online: https://helda.helsinki.fi/handle/10138/155090 (accessed on 10 May 2024).
  18. Nordregio, 2022. Data from Archive Nordregio.se. Available online: https://archive.nordregio.se/en/ (accessed on 10 May 2024).
  19. Gallent, N.; Mace, A.; Tewdwr-Jones, M. Second Homes: European Perspectives and UK Policies; Routledge: London, UK, 2017. [Google Scholar]
  20. Berker, T.; Gansmo, H.J. Sustainable urbanisation? Norwegian cabin culture in transition. J. Tour. Cult. Chang. 2010, 8, 172–182. [Google Scholar] [CrossRef]
  21. Dubois, G. Indicators for an environmental assessment of tourism at national level. Curr. Issues Tour. 2005, 8, 140–154. [Google Scholar] [CrossRef]
  22. Ellehauge, K.; Kildemoes, T.; Kristensen, J.; Bjergen Jensen, T. Heat Pump System for Summer Houses If Possible Combined with Solar Heating; Varmepumpeanlaeg til Fritidshus Eventuelt i Kombination med Solvarme; 2006 Teknisk Rapport; Rapport Nummer NEI-DK-4736; Denmark. Available online: https://energiforskning.dk/files/media/document/336-070%20Slutrapport.pdf (accessed on 2 September 2024).
  23. Steffansen, R. Norwegian Second Home Phenomenon—A Critical Perspective. Ph.D. Thesis, Aalborg Universitet, Aalborg, Denmark, 2017. Available online: https://vbn.aau.dk/da/publications/the-norwegian-second-home-phenomenon-a-critical-perspective (accessed on 2 September 2024).
  24. Hiltunen, M.J. Environmental impacts of rural second home tourism–case Lake District in Finland. Scand J. Hosp. Tour. 2007, 7, 243–265. [Google Scholar] [CrossRef]
  25. Huhtala, A.; Lankia, T. Valuation of trips to second homes: Do environmental attributes matter? J. Environ. Plan Manag. 2012, 55, 733–752. [Google Scholar] [CrossRef]
  26. Hoogendoorn, G.; Fitchett, J.M. Perspectives on second homes, climate change and tourism in South Africa. Afr. J. Hosp. Tour. Leis. 2018, 7, 1–18. [Google Scholar]
  27. Aall, C. Hyttebruk og Miljø: En arena for nøysomhet eller overforbruk? In Norsk Hytter i Endring—Om Bærekraft og Behag; Gansmo, H.J., Berker, T., Jørgensen, F.A., Eds.; Tapir Akademisk Forlag: Trondheim, Norway, 2011. [Google Scholar]
  28. Andersen, F.M.; Morthorst, P.E.; Christensen, M.S.; Kofoed, N.-U.; Jensen, O.M. Second-home electricity consumption. Energy Policy 2008, 36, 280–289. [Google Scholar] [CrossRef]
  29. Jensen, O.M.; Kofoed, N.-U.; Roed Rasmussen, E.; Weldingh, P.; Worm, J.; Adams Rasmussen, L.; Ellehauge, K.; Kjærgaard, C.-J.; Reuss, M. Elbesparelser i Sommerhuse her og nu; SBi 2010 Nr. 2010; SBI Forlag: Hørsholm, Denmark, 2010; Volume 54. [Google Scholar]
  30. Mata, E.; Sasic Kalagasidis, A.; Johnsson, F. Energy usage and technical potential for energy saving measures in the Swedish residential building stock. Energy Policy 2013, 55, 404–414. [Google Scholar] [CrossRef]
  31. Mjörnell, K.; Johansson, D.; Femenias, P.; Eriksson, P.; Donarelli, A.; Johansson, T. Energy use patterns and renovations of Swedish second homes. J. Phys. Conf. Ser. 2023, 2654, 012011. [Google Scholar] [CrossRef]
  32. Broström, T.; Leijonhufvud, G. Heat Pumps for Conservation Heating. Engineering, Environmental Science 2008. Available online: https://www.diva-portal.org/smash/get/diva2:461212/FULLTEXT02.pdf (accessed on 2 September 2024).
  33. Eriksson, P.; Johansson, T. Towards Differentiated Energy Renovation Strategies for Heritage-Designated Multifamily Building Stocks. Heritage 2021, 4, 4318–4334. [Google Scholar] [CrossRef]
  34. Vinha, J.; Piironen, J.; Kiviste, M. Impacts of Energy Efficient Constant Output Heating on the Moisture Conditions of Unoccupied Summer Cottages in Finland. In Cold Climate HVAC 2018; Johansson, D., Bagge, H., Wahlström, Å., Eds.; CCC 2018; Springer Proceedings in Energy; Springer: Cham, Switzerland, 2018. [Google Scholar]
  35. Viitanen, H.; Hukka, A. A mathematical model of mould growth on wooden material. Wood Sci. Technol. 1999, 33, 475–485. [Google Scholar] [CrossRef]
  36. Gutke, J. Environmental Impact of Retrofitting Second Homes. A Case-Study of the Net Global Warming Potential of Different Retrofit Measures in a Swedish Context. Master’s Thesis, Chalmers University of Technology, Gothenburg, Sweden, 2023. [Google Scholar]
  37. Göteborgs Universitet, SOM-Institutet. Den Nationella SOM Undersökningen 2022; SOM 2022; SOM-Rapport nr 2023:04. 2024. Available online: https://snd.se/sv/catalogue/dataset/2023-10-1/1 (accessed on 2 September 2024).
  38. StruSoft AB (2022) BIM Energy. Available online: https://bimenergy.com/ (accessed on 2 September 2024).
Figure 1. User profiles defined by Gutke, 2023 [36]. The circle represents one year, and darker dots indicate one full week of use, whereas lighter dots represent a weekend visit.
Energies 17 04493 g001
Figure 2. User patterns and heating patterns for the base case and energy renovation scenarios for the 673 second homes in this study.
Energies 17 04493 g002
Figure 3. The second home in Sweden that was used as a pilot house for energy simulations [36].
Energies 17 04493 g003
Figure 4. Estimated energy use for each of the 673 second homes (x-axis) based on the energy usage calculated for the pilot secondary residence, as detailed in Table 8.
Energies 17 04493 g004
Figure 5. Estimated energy use for each of the 673 second homes (x-axis), based on the energy use calculated for the pilot house in Table 8, under the assumption that a temperature of 5 °C was sustained during periods of non-occupancy.
Energies 17 04493 g005
Figure 6. Estimated energy use for each of the 673 second homes (x-axis), based on the energy use calculated for the pilot house in Table 8, under the assumption that all users install new windows.
Energies 17 04493 g006
Figure 7. Estimated energy use for each of the 673 second homes (x-axis), based on the energy use calculated for the pilot house in Table 8, under the assumption that all users install additional insulation in the attic or roof.
Energies 17 04493 g007
Figure 8. Estimated energy use for each of the 673 second homes (x-axis), based on the energy use calculated for the pilot house in Table 8, under the assumption that users all install a heat pump.
Energies 17 04493 g008
Table 1. Respondents’ answers to whether they own or have access to a second home or not.
RespondsNo. of PeoplePercentage
Own their second home28715.7
Have access to a second home38721.2
Do not own or have access to108559.4
No answer or multiple answers673.7
Table 2. User patterns during different seasons, as declared by the respondents, in percentage of the total number of responses (682), which are slightly more than the number of respondents (674) because of multiple answers.
User PatternSpringSummerAutumnWinter
Not at all13.23.715.635.1
Only a few occasions during daytime22.08.823.819.8
Shorter periods46.536.344.830.8
Longer periods9.436.17.85.7
Entire period4.513.84.12.6
N/A4.41.34.05.9
Table 3. The approximate temperature to which the house is heated when not used.
Lower than 10 °C11–15 °C16 °C or HigherNo HeatingN/A
25%24%12%36%3%
Table 4. Main heating source reported by the respondents expressed in percentage of all 674 responding households.
Main Heating SourceOwnerHave Access toIn Total
Direct electricity13%19%32%
Wood stove or tiled stove7%11%18%
Heat pump14%15%29%
Other3%6%9%
Multiple marks4%4%8%
N/A1%3%4%
Table 5. Energy renovation measures undertaken during the last decade, as reported by the respondents, expressed as the percentage of all 674 responding households. Some respondents gave multiple answers.
Energy Renovation MeasuresOwnHave Access to
Installing energy-effective windows25%15%
Additional insulation in the roof and/or attic17%10%
Additional insulation on façade12%9%
Additional insulation of floor and/or foundation13%9%
New heating system39%25%
Table 6. Renovation measures undertaken during the last decade, as reported by the respondents expressed, as the percentage of 674 responding households. Some respondents gave multiple answers.
Renovation MeasuresOwnerHave Access to
Roof/attic15%20%
Windows19%28%
Façade19%27%
Ground8%7%
Interior surfaces19%33%
Kitchen18%25%
Bathroom18%23%
Table 7. Description of typical use patterns for different user profiles.
User ProfileTypical Use Pattern
LowA range of usage, from complete non-utilisation to extended durations in the summer and shorter intervals or isolated days in other seasons. However, it does not extend to all seasons, particularly excluding the winter period.
Medium Extended periods in the summer, but it can also be other seasons, shorter periods, or single days in other seasons, but not all seasons.
HighExtended periods spanning one or more seasons and, at the very least, shorter durations in all remaining seasons, particularly during the heating season, are taken into account. Single day visits are not considered.
Table 8. Estimated energy use expressed as kWh/m2, year for different user and heating patterns and energy renovation measures for a pilot second home, based on calculations by Gutke (2023) [36].
User (1) and Heating (2) PatternNR (3)A (3)B (3)C (3)AB (3)AC (3)BC (3)ABC (3)
low 15101.797.681.328.977.327.823.322.2
low 1058.756.346.416.344.215.613.112.5
low 527.226.221.58.520.58.27.16.8
medium 15106.2102.085.231.681.030.425.724.5
medium 1065.863.252.719.950.219.216.415.7
medium 537.436.030.513.129.112.711.310.8
high 15110.4106.088.834.284.532.928.026.8
high 1073.070.259.223.756.422.919.919.1
high 546.745.038.917.837.317.215.515.0
(1) User pattern: Low, medium, and high corresponding to the user profiles in Table 1. (2) Heating pattern: 15, 10 and 5 refers to the temperature that the house is heated to when not used. (3) NR: no renovation, A: new windows, B: attic or roof insulation, C: air-sourced heat pump (ASHP). AB, AC, BC, and ABC indicate combinations of energy renovation measures.
Table 9. Estimated energy use reported by the owners of the 673 second homes for the current status and after different energy efficiency measures were implemented. Results are also scaled up to estimate the total energy saving potential for the entire Swedish second home stock.
Estimated Average Energy Use for Different ScenariosCurrent Status Declared by UsersTemperature Is Kept at 5 °C (1) When House Is Not UsedAll Houses Change to Energy Efficient WindowsAll Houses Install Roof or Attic InsulationAll Houses Install a Heat Pump (3)
Average energy use in kWh per m2 and year for the sample of 673 second homes44.22542.73619.6
Total energy use in TWh scaled up to the entire stock of 610,000 second homes (2)2.71.52.62.21.2
Total energy saving potential in TWh and in percentage of current use 1.2 (44%)0.1 (4%)0.5 (19%)1.5 (56%)
(1) The temperature is assumed to be 5 °C when a house is not used, which basically means very low or no heating. (2) If the respondent reported a heat pump as the main heating system but did not report a heat pump as an energy-efficiency measure, the energy use for case C (heat pump) or a combination including C was used. (3) The assumption is that the average second home is 100 m2 for the sake of simplicity.
Disclaimer/Publisher’s Note: The statements, opinions and data contained in all publications are solely those of the individual author(s) and contributor(s) and not of MDPI and/or the editor(s). MDPI and/or the editor(s) disclaim responsibility for any injury to people or property resulting from any ideas, methods, instructions or products referred to in the content.