Article

Comparative Evaluation of the Effect of Exhaust Gas Recirculation Usage on the Performance Characteristics and Emissions of a Natural Gas/Diesel Compression-Ignition Engine Operating at Part-Load Conditions

by
Nikolaos Rizopoulos
1 and
Roussos Papagiannakis
2,*
1
Independent Researcher, 11475 Athens, Greece
2
Thermodynamic, Energy & Propulsion Systems Section, Aeronautical Sciences Department, Hellenic Air Force Academy, 13671 Acharnes, Greece
*
Author to whom correspondence should be addressed.
Energies 2025, 18(3), 710; https://doi.org/10.3390/en18030710
Submission received: 6 December 2024 / Revised: 21 January 2025 / Accepted: 22 January 2025 / Published: 4 February 2025
(This article belongs to the Special Issue Internal Combustion Engine Performance 2024)

Abstract

:
The use of natural gas as an alternative fuel in dual-fuel compression-ignition engines can lead to a substantial reduction in the majority of pollutant emissions compared to fossil fuels, while the thermal efficiency of the engine can be maintained at adequate levels. Its usage has increased widely in recent years, and significant efforts have been made to investigate the inherent physical and chemical processes that take place during this engine’s combustion, as well as the parameters that affect the operation of the engine and use natural gas as energy source. The scope of this study is to investigate the effect of EGR temperature (cold and hot) and rate (10% and 20%) on the performance characteristics and emissions of a dual-fuel compression-ignition engine operating at a specific engine operating point under dual-fuel (diesel–natural gas) conditions. For this reason, a phenomenological two-zone combustion model was developed. The results of the model were validated against the experimental data obtained from a single-cylinder direct-injection, turbocharged compression-ignition dual-fuel research engine operated under part-load conditions (IMEP = 0.52 Mpa and engine speed = 1500 rpm) and at various replacement percentages of diesel using methane (which was treated as a natural gas surrogate). The model results were in good agreement with the experimental results, revealing the ability of the model to be used in the aforementioned EGR analysis. The results of the study revealed that engine operation with 10% cold EGR does not significantly affect the engine performance characteristics, and combined with the addition of 80% gaseous fuel energy, can lead to a substantial reduction in NO and soot emissions, with a moderate increase in CO emissions. On the other hand, a significant finding of the present work is that engine operation with hot EGR under the investigated operating conditions, even though it had a beneficial effect on NO-specific emissions, led to a reduction in engine efficiency and may raise issues regarding the mechanical strength of the engine.

1. Introduction

Natural gas has gained significant popularity as an alternative fuel in internal combustion engines in recent years. This is mainly attributed to the increasingly stringent environmental regulations that have been imposed on many industrial sectors. An indicative example is the maritime industry, where environmental regulations adopted by the International Maritime Organization (IMO) and the European Union, both targeting net-zero emissions by 2050, have led many shipowners to increasingly use natural gas for the propulsion of their fleets [1,2,3].
Due to the increased demand, natural gas has an increasingly growing supply infrastructure [4,5]. Furthermore, in comparison with fossil fuels, it has higher reserves [6], while its price is rather competitive [6,7]. Moreover, natural gas possesses higher combustion enthalpy than fossil fuels, and its combustion in internal combustion engines emits significantly lower levels of smoke, soot, nitric oxides (NOx), and sulfur oxides (SOx) [6,8]. The latter has led to the characterization of the combustion of natural gas as clean [9,10], and it is one of the most significant factors that has led to its widespread usage. Additionally, its high autoignition temperature makes it suitable for use in all kinds of compression-ignition (CI) engines without serious modifications to the engine. However, its usage is accompanied by some drawbacks in comparison with diesel fuel, such as lower thermal efficiency, higher carbon monoxide (CO), and unburned hydrocarbon (mainly methane) emissions at lower loads [6,11,12].
Natural gas can be used as an energy source in either spark-ignition or compression-ignition engines. In spark-ignition engines, the fuel can be delivered to the engine in gaseous form, typically through port injection. The charge of the air and natural gas is then compressed and, prior to TDC, is ignited by the energy given from the spark plug [6,13,14,15]. In compression-ignition engines, natural gas is used simultaneously with diesel fuel as an energy source. This practice is known as dual fueling. Dual-fuel (DF) compression-ignition engines using natural gas are typically classified as those operating under high-pressure injection systems of natural gas and those operating under low-pressure injection systems of natural gas. In the first category, both diesel and natural gas are injected directly into the combustion chamber at high pressures while the engine operates under the diesel cycle. There are multiple research studies investigating this type of engine [1,16,17,18]. For example, Hountalas et al. [1] conducted a comparative analysis of the performance and combustion mechanism of dual-fuel and diesel modes for a two-stroke high-pressure injection natural gas engine using experimental data and found that the performance under the dual-fuel mode was overall close to that of the conventional diesel mode. In the second category, also known as ‘‘Fumigated Dual-Fuel CI Engines”, the engine operates under the Otto cycle. Natural gas is induced during the induction stroke, mixed with the air, and then the gaseous charge is compressed during the compression stroke until its ignition using a small amount of diesel fuel injected into the cylinder prior to the top dead center (TDC).
There is a wide variety of experimental and theoretical studies in international literature investigating operational parameters that affect the performance and emissions of Fumigated Dual-Fuel Compression-Ignition Engines. Some of these parameters are the swirl ratio [19,20,21], the start of injection timing of diesel fuel [22,23,24], diesel fuel quantity (mass) [25], preheating of air inlet [26,27], and the compression ratio [28]. One important parameter that may significantly affect the performance and emissions of the above engines is exhaust gas recirculation (EGR). The primary goal of EGR usage is to control emissions, specifically nitrogen oxides (NOx). It is important to highlight that EGR induction in DF CI engines influences flame suppression by lowering the combustion chamber’s temperature, which, in turn, reduces NOx emissions. In the past, various studies have been conducted to investigate this effect. Pirouzpanah et al. [29] conducted an experimental study to determine the performance and exhaust emission characteristics of an automotive direct injection dual-fuel diesel engine. Their study revealed that the application of 10% EGR at high loads and 15% at part loads can considerably reduce NOx, unburned hydrocarbons, CO, and soot without a significant influence on the performance characteristics of the engine. Abdelaal et al. [30] investigated experimentally the combustion characteristics, engine performance, and exhaust emissions of a single-cylinder direct injection pilot-ignited dual-fuel engine operating under various rates (5, 10, and 20%) of partly cooled EGR and a wide range of engine loads. Papagianakis et al. [31] made a theoretical investigation using a phenomenological simulation model in order to examine the effect of the pilot fuel quantity and exhaust gas recirculation rate on the performance and emissions of a dual-fuel natural gas diesel engine. From the results of this study, it was derived that the simultaneous increase in the abovementioned two parameters may result in an improvement in the engine brake efficiency and exhaust emission levels without causing negative impacts on combustion quality and the mechanical strength of the engine. Paykani et al. [32] investigated experimentally the simultaneous effect of the EGR and preheating of the inlet air on performance and emitted pollutants of a single-cylinder four-stroke water-cooled indirect injection dual-fuel engine operating at constant speed. The study revealed that the combination of the above two parameters can lead to a reduction in exhaust emissions (NOx, CO, unburned hydrocarbons) without deteriorating engine thermal efficiency. Qi et al. [33] conducted an experimental study in order to investigate the introduction of varying rates of hot EGR (up to 26%) at different engine loads on a single-cylinder direct injection dual-fuel research engine operating under the ALPING (advanced injection low pilot-ignited natural gas) combustion concept. The results of this study revealed that the use of hot EGR at lower engine loads can lead to a reduction in CO emissions, and a significant reduction in unburned hydrocarbons without a notable increase in NOx emissions and improvement in engine efficiency.
The model types used to theoretically investigate the thermal and chemical processes that take place during the operation of internal combustion engines vary in complexity, predictive ability, and computational cost. The CFD models [34,35,36] provide detailed 3D spatial information on the properties of the cylinder charge and the accurate calculation of performance characteristics and emissions. The phenomenological models can be categorized into zero-dimensional (0D) [37,38] and quasi-dimensional models [9,39,40,41]. These models are simpler and computationally more inexpensive than CFD, with 0D treating the cylinder charge as a uniform system and quasi-dimensional dividing cylinder charge into zones, with each zone having uniform properties [37,38,42]. The predictive capability of quasi-dimensional models regarding the calculation of performance characteristics of the engine can be relatively good. Also, they can be used for the prediction of emissions, with the accuracy being increased in accordance with the increase in the number of zones used. The 0D models are less accurate than quasi-dimensional models as far as the performance characteristics of the engine are concerned and, in general, cannot be used for emission prediction. Semi-empirical combustion models rely on correlations derived from the model developer’s expertise and basic theoretical approximations, often simplifying complex processes [37]. In these models, the heat release rate shape is defined a priori by commonly using Wiebe-type functions [43,44,45]. The computational cost of these models is low, but they are not able to predict the heat release rate or the emissions of the engine.
The scope of the present work is to theoretically study the influence of EGR temperature (cold and hot) and rate (10% and 20%) on the performance characteristics and emissions of a Fumigated DF CI engine operating on diesel and methane (which was treated as the natural gas surrogate) at various rates of energy substitution (PES) of diesel with methane (30%, 50%, 80%). For this reason, a two-zone phenomenological model was developed describing the closed part of the engine’s operating cycle (from inlet valve closure until exhaust valve opening). The model incorporates sub-models that describe diesel fuel jet and flame propagation mechanisms along with their combustion processes. Furthermore, it includes sub-models used for the calculation of NO, soot, and CO produced. The model was first validated against experimental data from a single-cylinder direct injection super-charged CI dual-fuel research engine using methane as gaseous fuel [24,28,46,47]. The engine operated at part-load conditions with IMEP equal to 0.52 Mpa and an engine speed of 1500 rpm at different PES rates of diesel from methane (30%, 50%, 60%, 70%, 80%). The validation of the model was carried out while the engine operated without EGR. This mode of operation is called normal dual-fuel operation (NDFO) hereafter. The good agreement between the theoretical and experimental results validated the feasibility of the model to be used in the aforementioned theoretical study. The test cases examined included the usage of 10% and 20% of both cold and hot EGR rates at three PES rates equal to 30%, 50%, and 80%, respectively. Cold EGR was assumed to be inserted in the cylinder at a temperature equal to 310 K, while hot EGR for each PES rate examined was assumed to be inserted in the cylinder at a temperature equal to the cylinder exhaust gas temperature of NDFO. The results of this study revealed that the use of cold EGR does not significantly affect the performance characteristics of the engine compared with NDFO. Regarding emissions, the increase in the cold EGR quantity can lead to lower NO emissions, while CO and soot emissions are increased compared to NDFO. On the other hand, the engine operation with hot EGR seems to have a bigger effect on the performance characteristics of the engine. The increase in the hot EGR rate, according to the model, decreases the flame combustion rate during the initial stage of flame development and increases the maximum cylinder pressure. The latter may raise issues regarding the mechanical strength of the engine. As far as emissions are concerned, the increase in hot EGR, similar to cold EGR, can lead to lower NO emissions and higher CO and soot emissions compared to NDFO. However, the values of NO emissions are higher, and soot and CO emissions are lower compared to the engine’s operation with cold EGR. According to the results of the model, the combination of 10% cold EGR with an 80% PES rate, compared with NDFO, can lead to a significant decrease in NO and soot emissions without any serious impact on the engine efficiency and mechanical strength of the engine. Moreover, the penalty that is observed at the CO emissions level can be considered small.

2. Brief Description of the Model

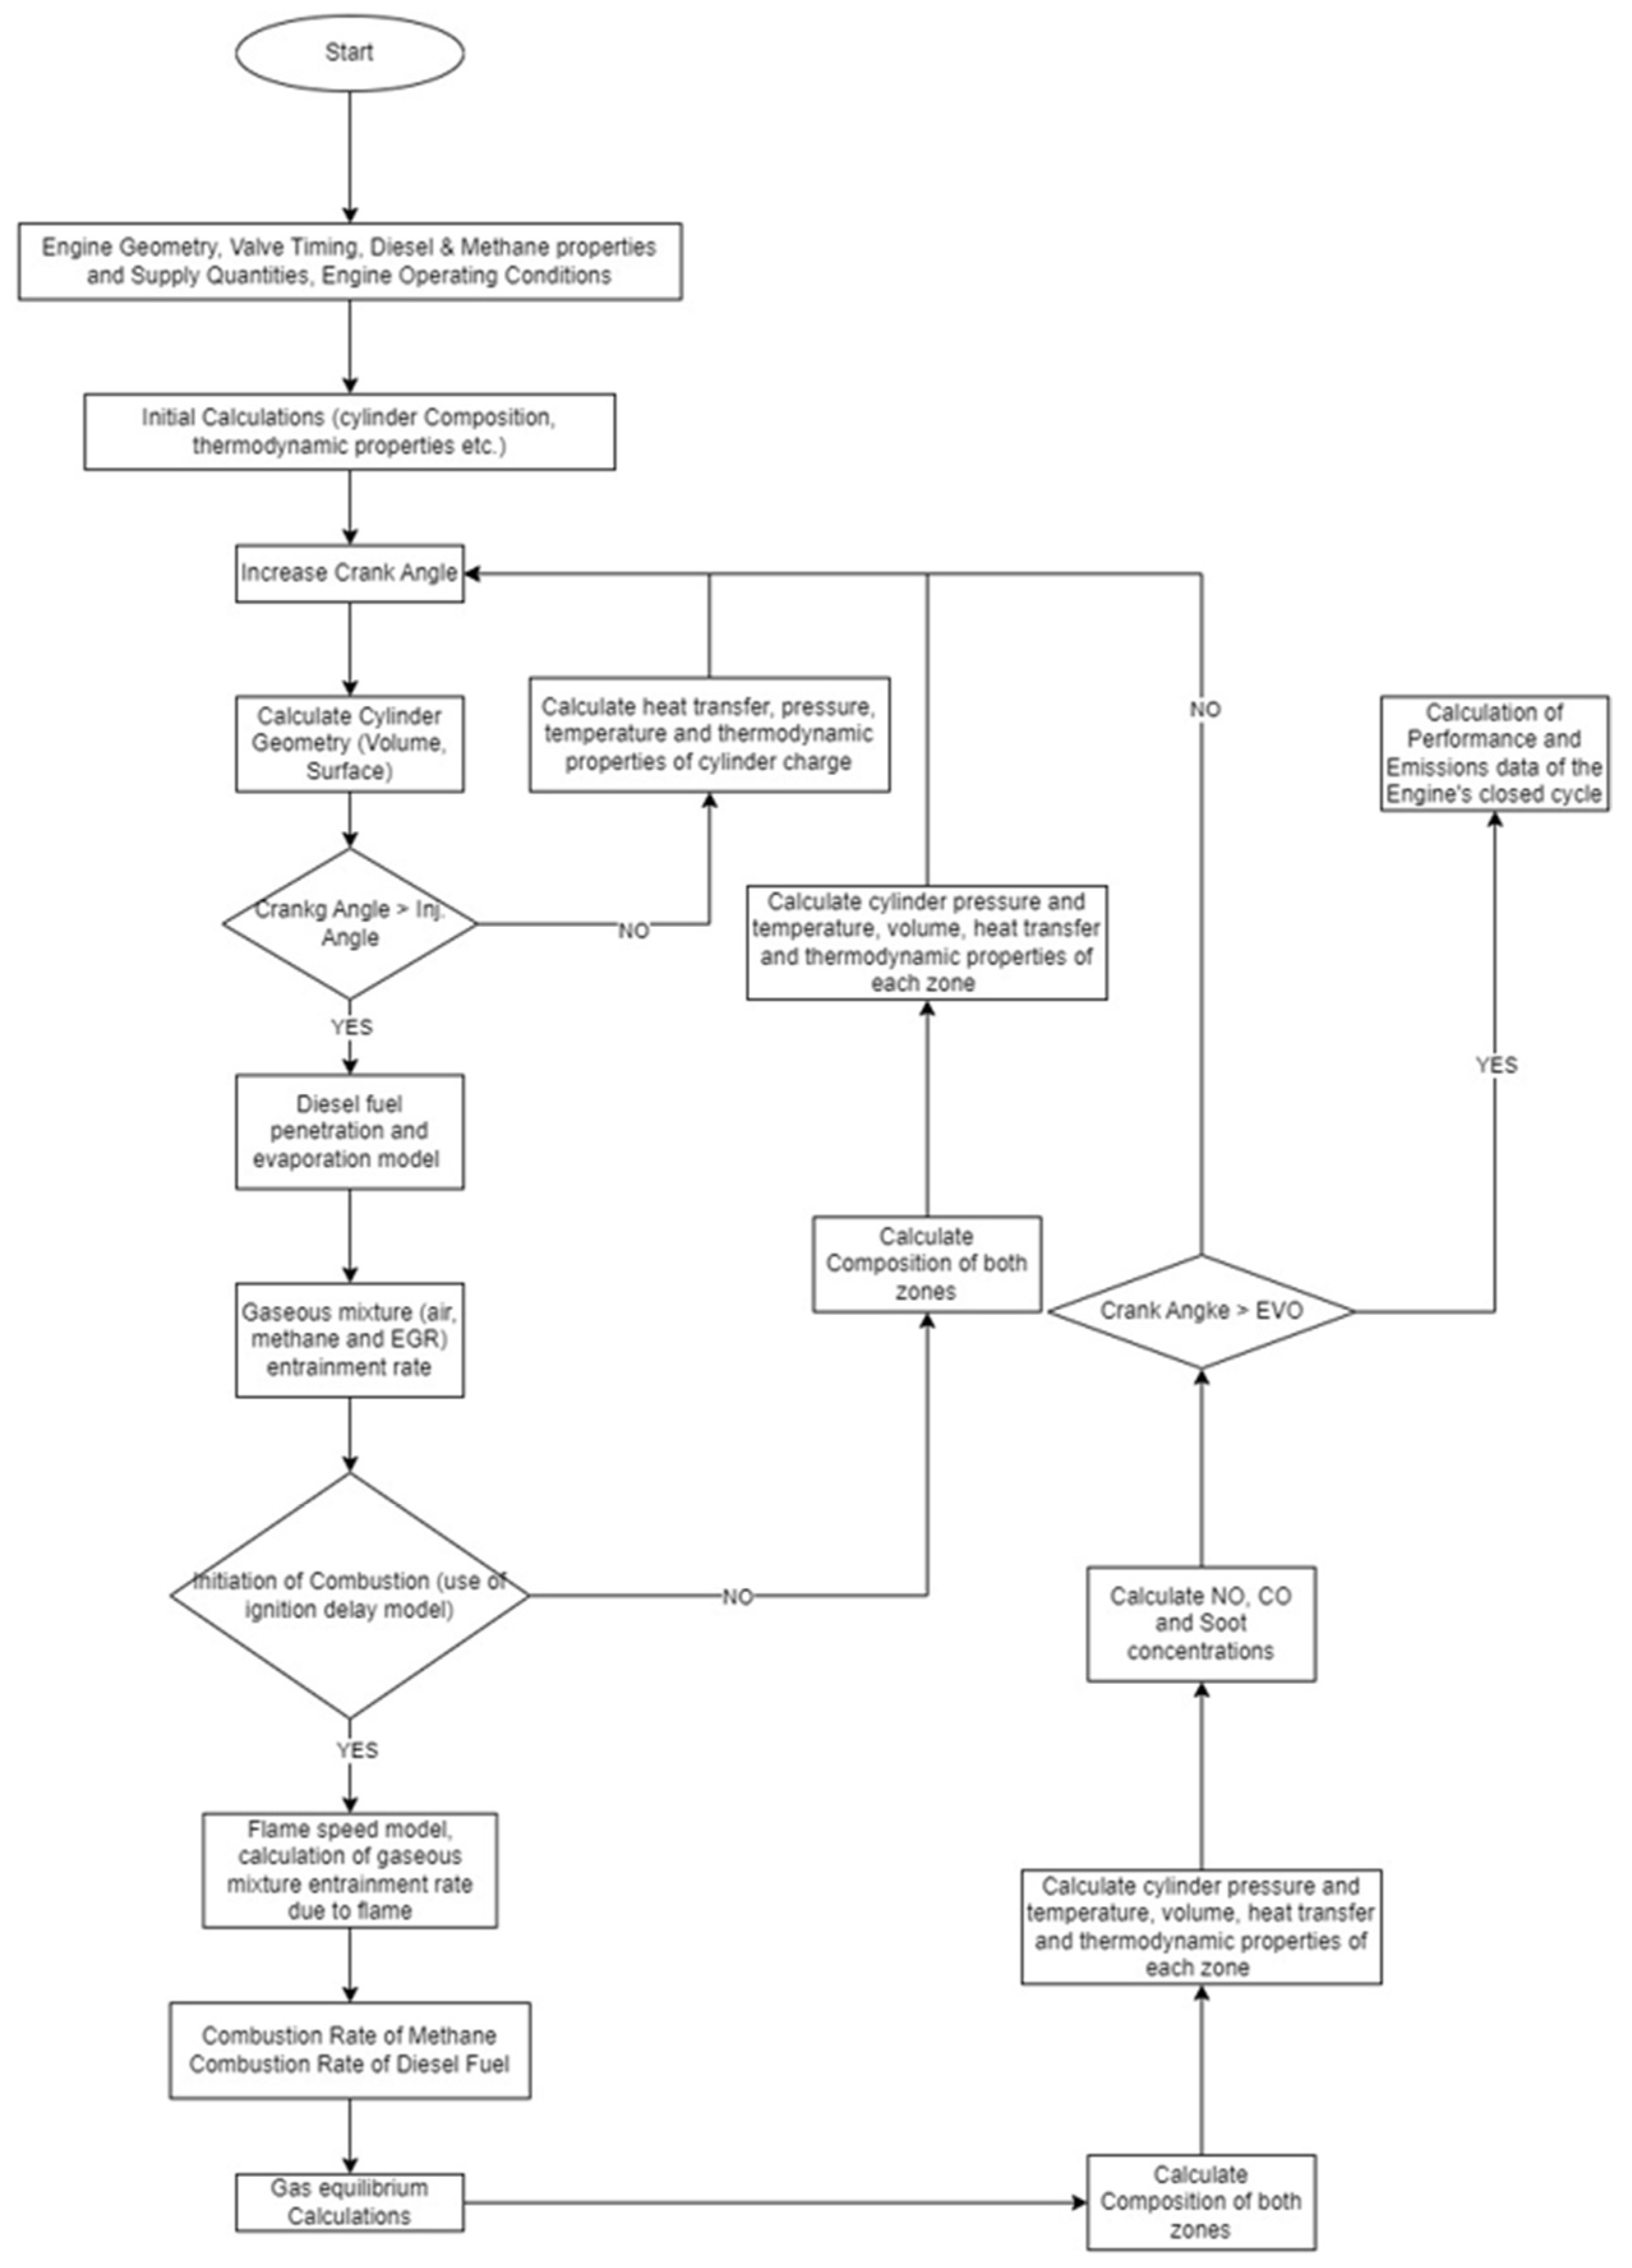
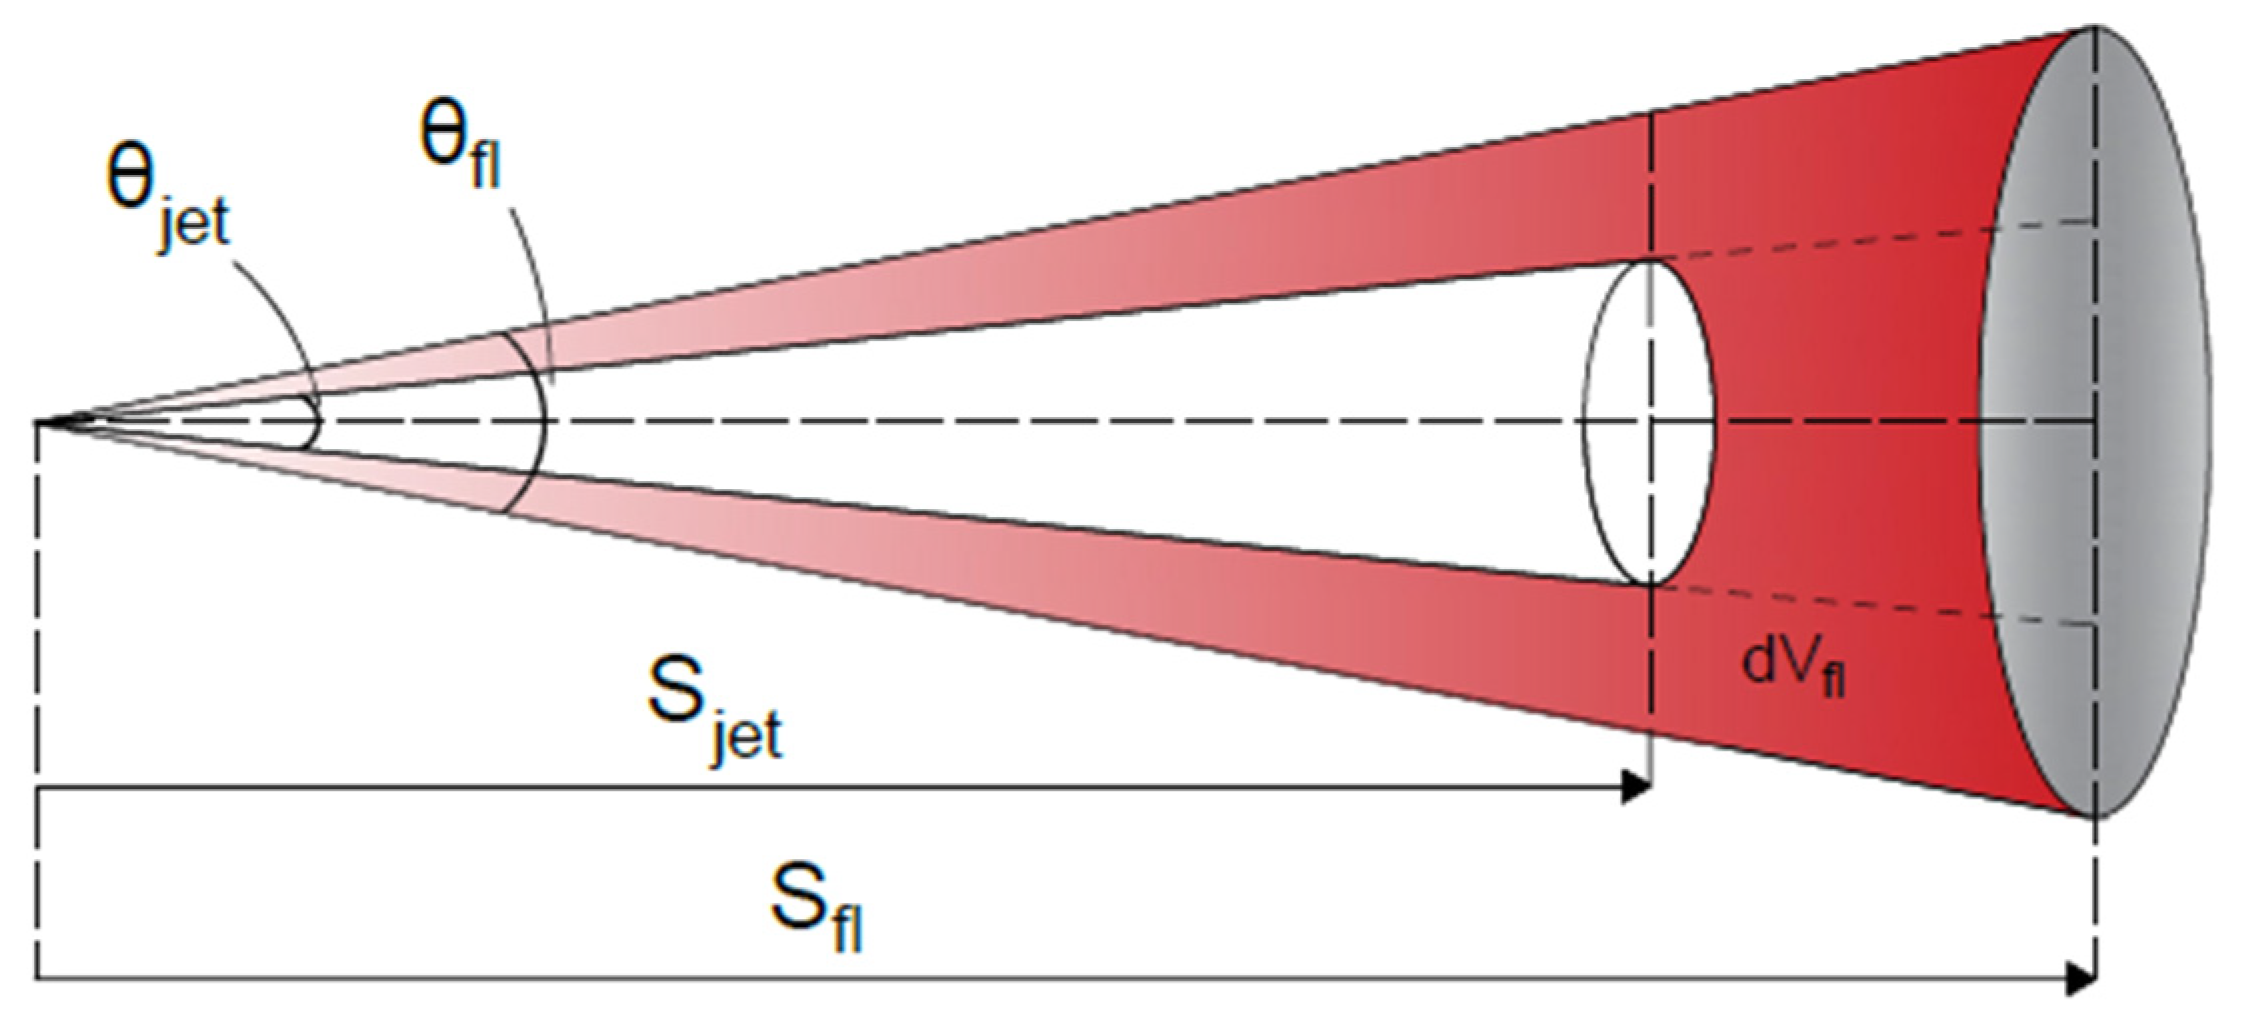
The phenomenological two-zone model examines the closed part of the engine cycle (from inlet valve closure to exhaust valve opening). The compression phase of the cycle starts as soon as the inlet valve closes and ends prior to diesel fuel injection [9,28,31,46]. During this phase, the in-cylinder charge is considered to be one zone, called the unburned zone, with the uniform pressure, temperature, and composition of air and gaseous fuel, which is assumed to be represented by methane. Both air and methane are considered to be ideal gasses that are premixed during the intake stroke. Also, it is considered that there is no chemical reaction between them [9,28,31,46]. As the piston moves towards TDC, the cylinder charge is compressed to high pressure and temperature. Close to the TDC, an amount of diesel fuel, which is represented by dodecane (C12H26), is injected into the combustion chamber [9,28,31,46]. After the fuel jet is broken up into small droplets, it is considered that diesel fuel forms a conical jet that penetrates inside the unburned zone according to the jet penetration theory of Hiroyasu [48]. Thus, the combustion chamber is divided into two zones, which are separated by the boundaries of the aforementioned conical jet, as depicted in Scheme 1. Inside, the uniformity of each zone regarding temperature and composition is assumed [9,28,31,46]. Also, the pressure is uniform for both zones. Heat transfer and chemical reactions between the zones are neglected, and any potential gaseous charge leakage from the cylinder is not taken into account. The first zone, as previously mentioned, is the unburned zone, and it consists of air and methane (in the case of NDFO) [9,24,28,31,46]. The second zone is defined as the burning zone, and it is enclosed by the boundaries of the diesel fuel jet (see Scheme 1). Inside the burning zone, the process of combustion takes place. As a result, the main constituents of this zone are combustion products, unburned evaporated diesel fuel, unburned gaseous fuel, and air that has not yet participated in combustion [9,24,28,31,46]. All the gasses are considered to be ideal. The ignition of the charge inside the burning zone commences after the autoignition of the evaporated diesel fuel [9,24,28,31,46]. The time interval between the start of diesel fuel injection and the initiation of combustion defines the ignition delay period [9,24,28,31,46]. The ignition delay period is calculated using the Prakash and Ramesh formula, which takes into account the concentration of oxygen in the cylinder’s charge and the pressure and temperature of the cylinder charge are close to TDC [49]. During the ignition delay period, a homogenous mixture of air and methane entrains into the burning zone from the unburned zone due to diesel fuel jet penetration and mixes with the gaseous mixture (air–methane-evaporated diesel fuel) that exists in the burning zone, forming a combustible mixture [9,24,28,31,46]. After the initiation of combustion, a flame front that covers the outer area of the burning zone is formed and separates it from the unburned zone. Before its impingement on the cylinder wall, it is assumed that the flame front has a conical shape, which is expanded towards the cone base with turbulent flame speed, and its angle becomes bigger during combustion (see Scheme 2). The turbulent flame speed is calculated by adding laminar flame speed, which is calculated based on the model by Karim and Al-Himyary [50], and turbulent intensity, which is calculated by the Rapid Distortion Theory [51,52,53]. Also, before its impingement on the cylinder wall, it is assumed that the penetration of the flame front is affected by the fuel jet penetration mechanism. After its impingement on the cylinder wall, the deviation in the volume of the burning zone is assumed to depend only on the flame propagation rate of growth, the calculation of which is not based on geometric correlations. Instead, it is calculated using an exponential decay function because it is assumed that due to the impingement on the cylinder wall, the flame front area’s rate of growth starts to decrease gradually over time [52,53]. The gaseous fuel mixture entrained inside the burning zone can be divided into two parts. The first part entrains into the burning zone due to diesel fuel jet penetration [9,24,28,31,46]. The combustion of this part is described using an Arrhenius-type premixed reaction rate [9,24,28,31,46]. The second part enters the burning zone due to the flame propagation mechanism. This part is assumed to be burned according to the formula of Tabaczynski et al. [52,53,54,55]. The preparation and combustion rate of diesel fuel is described by the semi-empirical combustion model of Whitehouse–Way [56]. As a result, the total heat release rate is the sum of the heat release rate of diesel and methane. The heat exchange between each zone with cylinder walls is calculated using the formula of Annand [57]. The burning zone after combustion-initiation is assumed to consist of eleven pieces, the concentration of which is calculated according to the Vickland et al. method [58]. The NO formation rate, which is kinetically controlled, is calculated using the extended Zeldovich mechanism [42]. The soot net formation rate is calculated using a semi-empirical formula [48,51], which incorporates separate expressions for the soot formation and oxidation rate. The CO formation rate is calculated according to a semi-empirical model [42,51], taking into account the temperature of the burning zone. In order to simulate the presence of EGR in the cylinder charge, it is assumed that the EGR quantity consists of O2 N2, CO2, and H2O and that it replaces only part of the fresh air of the gaseous mixture [26,31,59]. Thus, during the operation of the engine with EGR, the unburned zone apart from air (which consists of O2 and N2) and methane also consists of CO2 and H2O. A representative flow diagram of the model is given in Figure A1 of Appendix A.

3. Mathematical Treatment

3.1. Conservation of Mass Energy and State Equations

The cylinder volume after the fuel jet break into small droplets is divided into two zones. The burning zone consists of air-evaporated diesel fuel, gaseous fuel, and combustion products, and the unburned zone consists of air, methane, and, in the case of EGR usage, CO2 and H2O. Each zone has its own temperature (Tu,b), volume (Vu,b), mass (mu,b), and kmole quantity (Nu,b), while the pressure is uniform for both zones. The first thermodynamic law equation and the ideal gas equation for each zone can be written as shown below [42,51]:
dU u =   dQ u   dW u h u · dm u
dU b =   dQ b   dW b + h u · dm u +   h D , pr · dm D , pr
P · V u , b = N u , b ·   R m · T u , b
where h u · dm u is the total enthalpy addition to the burning zone from the unburned zone due to the entrainment rate of the unburned mixture, and h D , pr · dm D , pr is the total enthalpy addition to the burning zone from the diesel fuel prepared for combustion [9,24,28,31,46]. The above equations are applied under the constraints of mass conservation and volume balance equations, which may be written as below:
V cyl =   V u + V b
m tot =   m u + m b
In order to calculate the temperatures of each zone, the Newton–Raphson method and the first law of thermodynamics are applied [38,60]:
T u , b n + 1 =   T u , b n f ( E ) u , b f ( E ) u , b
f ( E ) u = dU u   dQ u +   dW u + h u · dm u
f ( E ) b = dU b   dQ b +   dW b h u · dm u h dpr · dm dpr
f ( E ) u , b =   N u , b ·   c v u , b
where f(E)u,b represent the errors of the first law for burning and unburned zone and Cv-u,b is the specific heat capacity at the constant volume of its zone. The volumes of both zones are calculated by the ideal gas state equation as follows:
V u , b = N u , b ·   R m · T u , b P
The above Equations (6)–(10) are applied to both unburned and burning zones until the errors (f(E)u,b) are sufficiently low and the values of the temperatures of both zones have been converged.
After obtaining the temperatures and volumes of each zone, the volume constraint is checked according to Equation (4). If the error is not sufficiently low, the value of pressure is corrected according to the following equation [38,60], and the temperatures and volumes of both zones are recalculated.
P =   P   ·   V cyl V u + V b

3.2. Heat Transfer Model

For the calculation of the heat exchange rate from each zone, the empirical formula of Annand was used [57]. The heat exchange rate of the entire cylinder charge is calculated according to the expression below:
dQ cyl = A   · [ a   ·   λ D p   ·   Re b · ( T cyl T W ) + c   ·   σ   · ( T cyl 4   T w 4 ) ]
where a, b, and c are constants, λ and Re are the thermal conductivity and Reynolds number of the charge; Tcyl is the bulk average temperature of both zones, which is calculated according to the formula below [60]:
T cyl = N u , b ·   c v u , b   ·   T u , b N u , b ·   c v u , b
The heat exchange for each zone is calculated based on the formula below using the quantity in kmols of the temperature and the specific heat capacity at the constant volume of each zone below [60]:
dQ u =   dQ cyl   ·   N u ·   c v u ·   T u N u , b ·   c v u , b   ·   T u , b
dQ b =   dQ cyl ·   N b ·   c v b ·   T b N u , b ·   c v u , b ·   T u , b

3.3. Liquid Fuel Spray Development

The rate of the injected diesel fuel quantity is calculated based on the formula below [42,51]:
dm f D =   ρ D   ·   u inj   ·   π   ·   D inj 2 4   · Nh
where ρD is diesel fuel density, Dinj is the diameter of nozzle holes, Nh is the number of nozzle holes, and uinj is the injection velocity, which is calculated by the formula below [42,51]:
u inj = C D · 2 · Δ P ρ D
where CD is the discharge coefficient of the nozzle, and ΔP is the pressure difference across the injector hole, which is assumed to be constant during diesel injection (without a significant calculation error [38,48]) and it is calculated based on the expression below:
Δ P = P inj P
where P is the cylinder pressure, and Pinj is the injection pressure.

3.4. Ignition Delay

The ignition delay of diesel fuel is calculated based on the model developed by Prakash and Ramesh [49] using the set of equations below:
τ = a   ·   C · O c b · e ( E D   ·   P   +   Q 0.63 )
C = ( 0.36 + 0.22 · u p )
P = 1 R b soi   ·   T b soi 1 17190
Q = 21.2 P soi 12.4
O c = X   O 2 cyl 0.21
where up is the mean piston speed, ED is the activation energy of diesel fuel, and Rb-soi and Tb-soi are the gas constant and temperature of the burning zone at the start of injection. Psoi is the pressure at the start of injection, XO2-cyl is the kmol fraction of oxygen inside the cylinder, and a,b are constants.

3.5. Flame Speed

After the initiation of combustion, a flame front is formed, which can be treated as negligibly thin [38,42,51,61]. Flame speed is defined as the speed under which unburned gaseous charge in the unburned zone is inserted into the reaction zone of the flame. The turbulent flame speed of the flame front is calculated using the formula below:
u turb = u lam + u
where ulam is the laminar flame speed and u′ is the turbulence intensity. The laminar flame speed is calculated based on the expressions provided by Karim and Al-Himyary [50] according to the following set of expressions:
u lam = A + ( F 1 · F 2 ) · ( F 3 + F 4 · f + F 5 · f 2 )
A = P 0.557 · e 346 T u + 5.193
F 1 = 0.28 + 1.76 · f + 10.8 · f 2 + 5.9 · f 3
F 2 = P ( 0.29 0.69   ·   f   2.13   ·   f 2 +   f 3 )
F 3 = 98.556 + 0.52 · T u 5.3 · 10 4 · T u 2
F 4 = 3.87 0.04 · T u + 1.25 · 10 4 · T u 2
F 5 = 261 1.12 · T u + 2.5 · 10 3 · T u 2
f = φ 1.336
where φ is the fuel-to-air equivalence ratio. The turbulence intensity of the flame front is calculated by the Rapid Distortion Theory [51,52,53,54]:
u =   u ign   ·   ( ρ u ρ u ign ) 1 3
where ρu-ign and u′ign are the density of the unburned zone and the turbulence intensity at the moment of combustion initiation. The latter is calculated according to the expression below [51,52,53,54]:
u ign = c · u p
where up is the mean piston speed and c is a constant.

3.6. Burning Zone Definition Before Initiation of Combustion

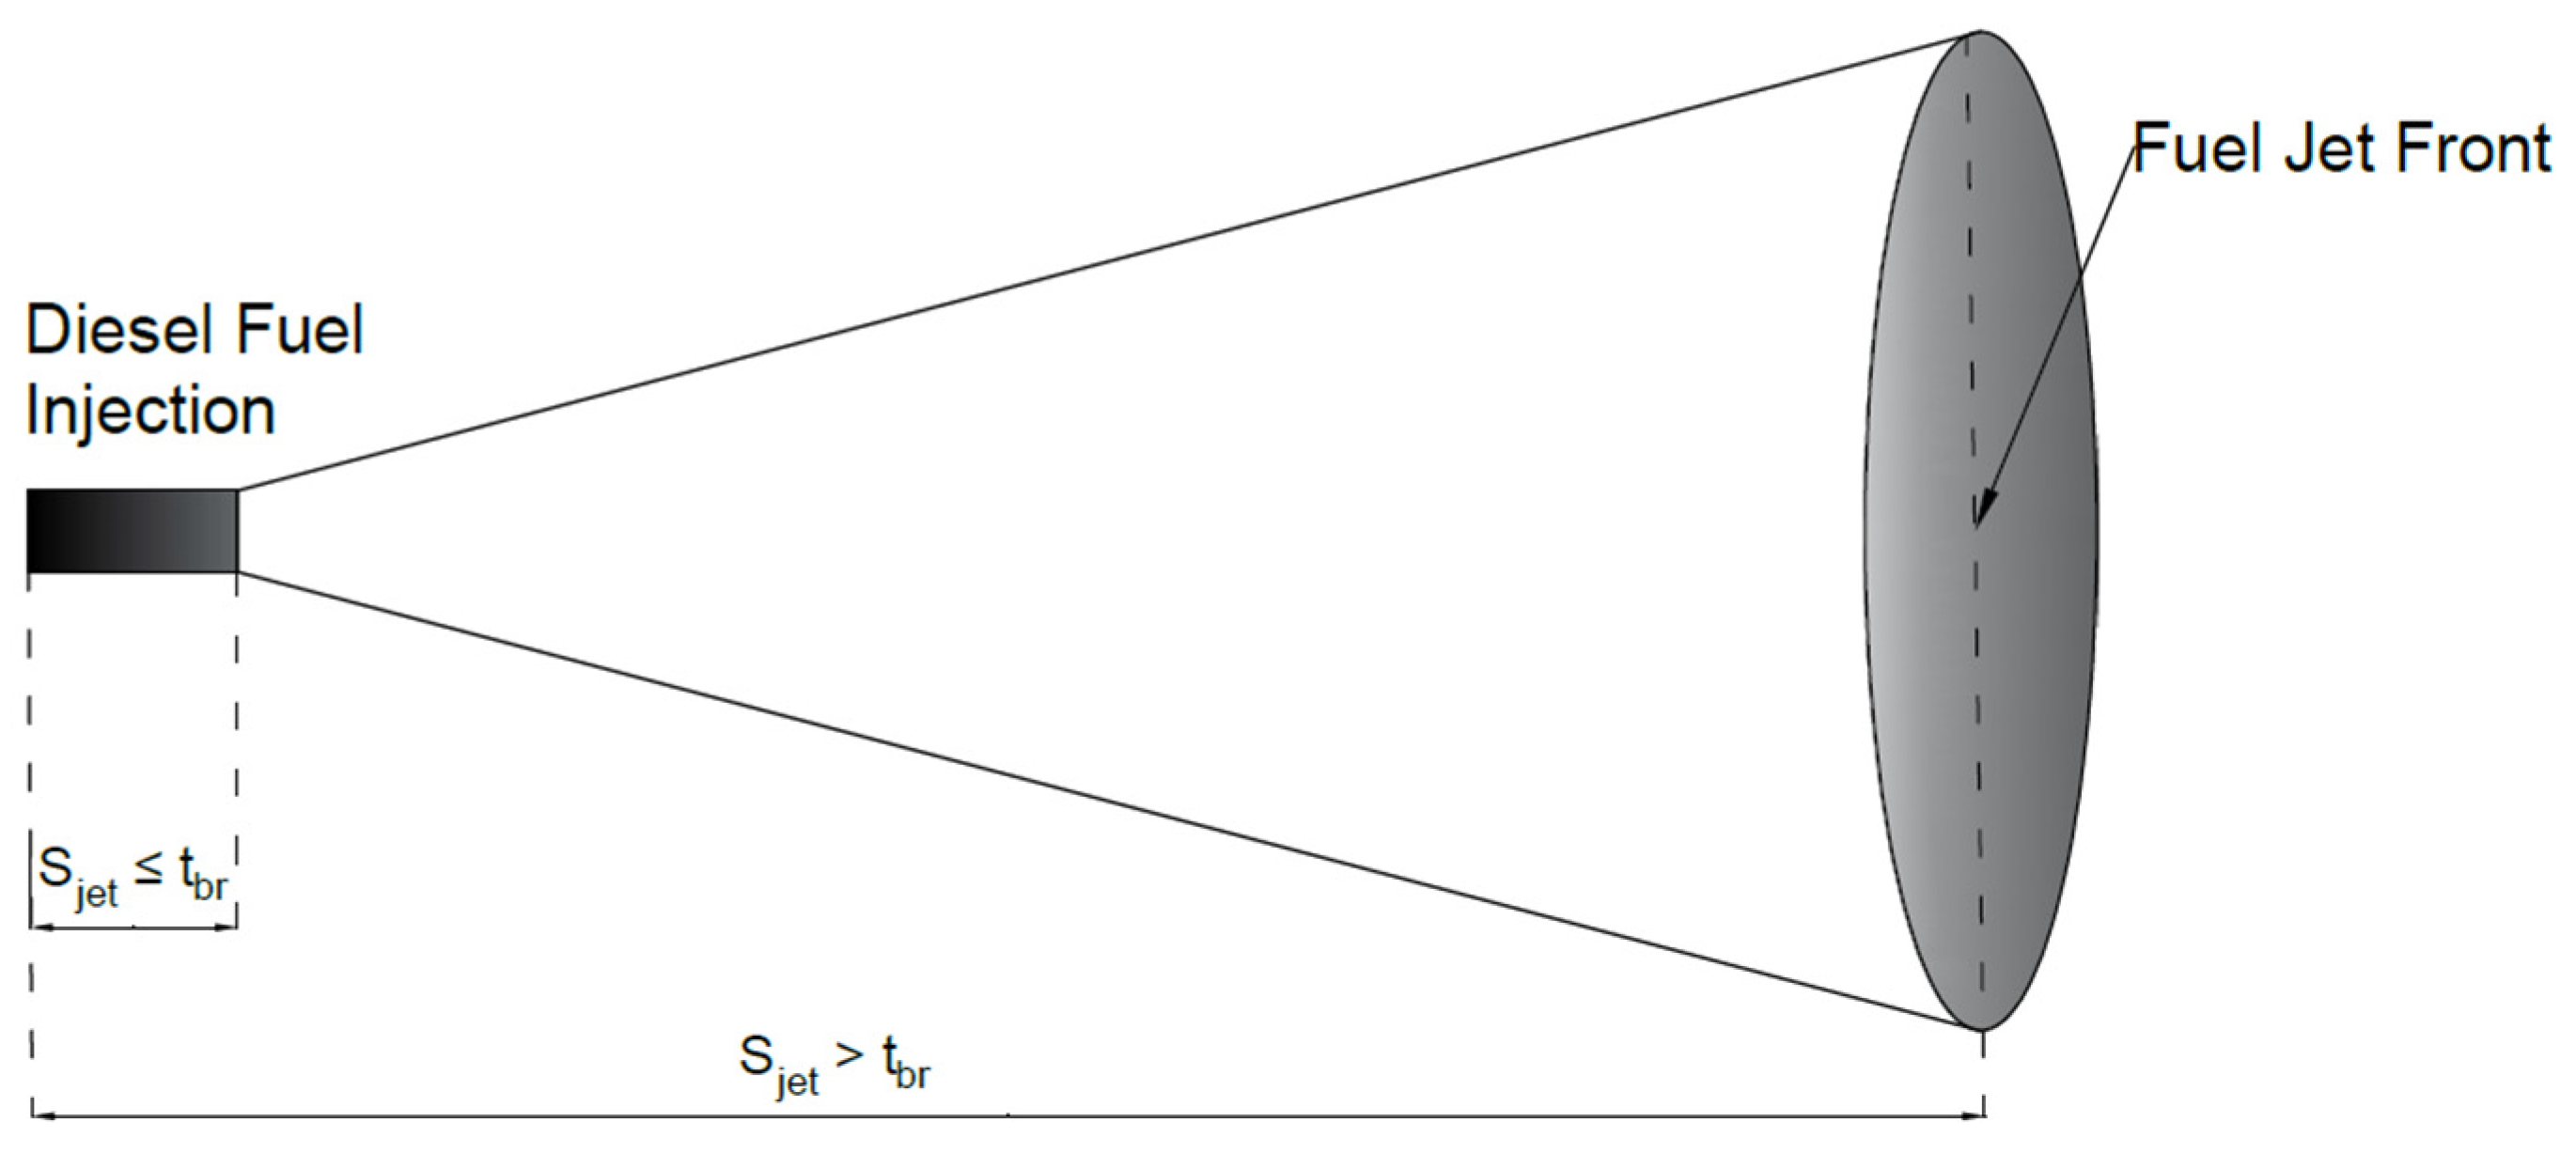
Prior to the initiation of combustion, the burning zone evolution depends solely on the fuel jet propagation mechanism (see Scheme 3). For the time interval between the initiation of diesel fuel injection and the break-up of the fuel jet into small droplets, the jet penetration is calculated using the formula below [42,51]:
S jet =   C D   ·   2   ·   Δ P ρ D     · t
where t is the time elapsed from the initiation of diesel fuel injection. The break-up time is calculated based on the formula below [42,51]:
t br = 28.65   ·   ρ D     ·   D inj ρ u   ·   Δ P
where Dinj is the diameter of the injector. After the jet break-up, it is assumed that the fuel jet forms a conical jet, the boundaries of which define the limits of the burning zone. The entrainment of the fuel jet inside the cylinder results in mass transfer from the unburned to the burning zone, which is calculated based on the formula below:
dm u jet = ρ u · dV jet
dV jet = [ π 3   ·   tan 2 θ jet   · ( S jet 2 3   S jet 1 3 ) ]
where Sjet is the penetration of the fuel jet, which is calculated by the empirical formula of Hiroyasu [48].
S jet 2 =   S jet 1 +   u jet   ·   dt step
u jet = 1.475   · [ Δ P ρ u ] 0.25   ·     D inj t
where t is the time elapsed from the fuel jet break-up. The angle of the fuel jet is calculated based on the empirical formula of Wakuri [9,24,28,31,46]:
θ jet = c   ·   ρ u   ·   Δ P   ·   D inj 2 μ u 2 4
where μu is the dynamic viscosity of the unburned zone, and c is a constant. In the scheme below, a schematic diagram of the penetration of the fuel jet before and after the fuel jet break-up into smaller droplets is displayed as follows:

3.7. Burning Zone Definition After Initiation of Combustion

3.7.1. Flame Front Propagation Before Its Impingement on Cylinder Wall

After the initiation of combustion, for each time interval before the flame front impinges on the cylinder wall, the calculation of the flame front geometry is based on both diesel fuel jet and flame penetration mechanisms [9,24,28,31,46].
Diesel fuel jet penetration is assumed to define the geometry (the penetration and angle) of the flame front at the beginning of each time interval as follows [9,24,28,31,46]:
S jet 2 =   S fl 1 +   u jet   ·   dt step
θ jet 2 = θ fl 1
where subscripts 1 and 2 denote the previous and current step, and Sfl-1 and θfl-1 are the flame penetration and flame angle of the previous time interval. The initial values of Sfl-1 and θfl-1 are equal to the values of diesel fuel jet penetration and jet angle at the moment of diesel fuel ignition.
Due to the above penetration, the entrainment rate of the gaseous mixture from the unburned zone to the burning zone is calculated by the following expressions [9,24,28,31,46]:
dm u jet   =   ρ u   ·   dV jet
dV jet = π 3   ·   tan 2 θ jet   · ( S jet 2 3   S jet 1 3 )  
The flame penetration mechanism is assumed to define the geometry of the flame front at the end of each time interval by forcing an expansion of the burning zone perpendicular to the base of its conical shape, and an increment in the angle of the cone takes place, as follows (see Scheme 2):
S fl 2 =   S jet 2 +   u turb   ·   dt step
θ fl 2 = c 1   ·   u turb ·   Δ t ign c 2 +   θ jet ign
where Δtign is the time that has elapsed since diesel fuel ignition; θjet-ign is the angle of the fuel jet at the moment of initiation of combustion; and c1,2 are constants. It is worth mentioning that the aforementioned relation of the angle of flame was developed in the framework of the present study.
The volume of change in the burning zone due to the flame penetration mechanism is given by the following equations:
dV fl =   V fl   V jet
V fl = π 3   ·   tan 2 θ fl   · S fl 2 3
V jet = π 3   ·   tan 2 θ jet   · S jet 2 3

3.7.2. Flame Front Propagation After Its Impingement on Cylinder Wall

After the impingement of the flame front on the cylinder wall, the rate of flame front growth is not calculated based on geometric expressions. It is assumed that due to the impingement, the rate of growth starts to decrease gradually over time [52,53]. Thus, its value is estimated using the weighted mean of the flame volume rate of growth at the moment of impingement on the cylinder wall (the first part of the expression below) and the exponential decay of the previously calculated value of the flame volume rate of growth (the second part of the expression below) [52,53]:
dV fl = ( 1 w )   ·   dV fl w + w   · dV fl 1   ·   [ 1 exp ( m u b   ·   m cyl ) ]  
w = m u w   m u m u w
where dVfl-w and mu-w are the flame volume rate of growth and the mass of the unburned zone at the moment of impingement on the cylinder wall, and b is a constant.

3.8. Total Heat Release Rate

The rate of the total gross heat release rate is calculated by the expression below:
GHRR ( θ ) = dm bur D · LHV D +   dm bur Ar M · LHV M + dm bur fl M · LHV M
where dm bur D is the mass of diesel fuel burned, dm bur Ar M is the burn rate of methane mass entrained into the burning zone due to fuel jet propagation, and dm bur fl M is the burn rate of methane mass entrained into the burning zone due to flame propagation. Also, LHV D , M is the lower heating value of diesel and methane.

3.9. Diesel Fuel Combustion

The combustion rate of diesel fuel is described by the semi-empirical formula of Whitehouse–Way [56]. According to this formula, the preparation rate of diesel fuel for combustion is given by the formula below:
dm pr D = K 1 · m f 2 D 1 a · ( m f 2 D m pr 1 D ) a   · P O 2 b
where m f 2 D is the total amount of fuel injected into the cylinder, m pr 1 D is the amount of fuel that has already been prepared for combustion, P O 2 is the partial pressure of oxygen inside the burning zone, and a,b are constants. The constant K1 is calculated based on the formula below [38,56]:
K 1 = b · RPM a 1 · m cyl D   a 2 · Δ θ inj a 2 · Nh   a 2 · D inj a 3
where m cyl D is the total amount of fuel injected into the cylinder; Δθinj is the duration of diesel fuel injection in degrees; CA, Nh, and Dinj are the number of injector holes and their hole diameter, respectively; RPM is the engine speed in rpm; and a1,2,3, b are constants.
The combustion rate depends on air availability inside the burning zone, and it is described by the Arrhenius-type expressions below [38,56]:
dm bur D = K 2   ·   P O 2 RPM   ·   T b   ·   e ( E D T b ) · ( m pr 2 D m bur 1 D )   if   AFR b D >   AFR st D
dm bur D = K 2   ·   P O 2 RPM   ·   T b · AFR st D   ·   e ( E D T b ) · ( m b 2 A m bur 1 A )   if   AFR b D >   AFR st D
where AFR b D is the air to fuel ratio inside the burning zone,   AFR st D is the stoichiometric air for diesel combustion, m b 2 A and m bur 1 A are the air that has been entrained and burned inside the burning zone, and m bur 1 D and E D is the burned mass and activation energy of diesel fuel.

3.10. Methane Combustion

The methane that has entered into the burning zone due to jet penetration is assumed to be burned according to the Arrhenius-type reaction formula described below [9,24,28,31,46]:
dm bur Ar M =   c   · ( m e jet 2 M   m bur jet 1 M   ) a ·   ( P O 2   ) b RPM   ·   T b ·   e E M T b
where m e jet 2 M is the amount of methane entrained into the burning zone due to jet penetration and m bur jet 1 M is the amount of fuel burned according to the abovementioned Arrhenius-type reaction formula while c is a constant.
For the methane that enters into the burning zone due to flame penetration, it is assumed that it does not burn immediately. Its burning rate is calculated based on the combustion model of Tabaczynski et al. [54,55]:
dm bur fl M = m e fl 2 M   m bur fl 1 M   τ
τ = c   ·   λ u lam
where τ is the time that is needed so that the combustion will be completed at the edges of the Taylor microscale, c is a constant, and λ is the characteristic length of Taylor eddies and is given by the expression below [54,55]:
λ L = 15 0.5   ·   (   u   L v u ) 0.5
L =   L ign   ·   ( ρ u ign ρ u ) 1 3
where L is the characteristic length of the flow, and Lign is the characteristic length of the flow at the time of ignition.

3.11. Chemical Equilibrium

The dissociation of combustion products is incorporated into the model using the approach of Vickland et al. [58]. It was assumed that the burning zone after combustion initiation consists of soot and the eleven elements below:
[ 1 ]   H 2 O [ 2 ]   H 2 [ 3 ]   OH [ 4 ]   H [ 5 ]   N 2 [ 6 ]   NO [ 7 ]   N [ 8 ]   CO 2 [ 9 ]   CO [ 10 ]   O 2 [ 1 ]   O
The equilibrium concentrations of the above species are calculated by solving a system of 11 equations, which comprise four atom balance equations for C, H, O, and N and the seven equilibrium equations below:
1 2 H 2 H ,   K p 1 = P X 4 X 2
1 2 O 2 O ,   K p 2 = P X 11 X 10
1 2 N 2 N ,   K p 3 = P X 7 X 5
2 H 2 O 2 H 2 + O 2 ,   K p 4 = PX 10 B 2
H 2 O OH + 1 2 H 2 ,   K p 5 = P X 3 / ( B X 2 )
CO 2 +   H 2     H 2 O + CO ,   K p 6 = BX 9 / X 8
H 2 O + 1 2 N 2 H 2 + NO ,   K p 7 = P X 6 / ( B X 5 )
where B = X1/X2 denotes the kmole fraction of elements 1 and 2, and Kp is the reaction equilibrium constant. The method of Vickland was used to solve the abovementioned system of equations.

3.12. Nitric Oxide Formation Model

In order to calculate the formation rate of NO, which is a kinetically controlled process, the extended Zeldovich mechanism is used. Below, the reactions that were used, along with their forward rate coefficients, are given [42,51].
R 1 = k 1 f × [ NO ] e × [ NO ] e
The formation rate of NO is given by the formula below:
1 V b d [ ( NO ) V b ] dt = 2 × ( 1 β 2 ) × R 1 1 + β × R 1 R 2 +   R 3
where the brackets “[]” denote concentration and β = [NO]/[NO]e and subscript e denotes equilibrium. Vb is the volume of the burning zone, and R1, R2, and R3 are the one-way equilibrium rates that are calculated as follows:
R 1 = k 1 f × [ NO ] e × [ NO ] e
R 2 = k 2 f × [ N ] e × [ O 2 ] e
R 3 = k 3 f × [ N ] e × [ OH ] e

3.13. Carbon Oxide Formation Model

The carbon monoxide formation rate and combustion and carbon dioxide oxidation rates to carbon monoxide are given by the expressions below, along with their forward reaction rate constants [42,51]:
CO + HO CO 2 + H ,   k 1 f = 6.76 × 10 10   e ( T b 1102 )
CO 2 + O   CO + O 2 ,   k 1 f = 2.51 × 10 12   e ( 22041 T b )
The net rate of carbon monoxide formation is given below [42,51]:
d [ CO ] dt = ( R 1 +   R 2 )   ( R 1 +   R 2 ) · [ CO ] [ CO ] e
where the one-way equilibrium rates R1 and R2 are given as follows:
R 1 = k 1 f × [ CO ] e × [ HO ] e
R 2 = k 2 f × [ CO 2 ] e × [ O ] e

3.14. Soot Formation Model

Soot formation and oxidation rates are given by the semi-empirical model below [42,51]:
dm sf = a f × m avail D × P 0.5 × exp ( E sf R m T b )
dm sb = a b × m s × P O 2 P × P 1.8 × exp ( E sb R m T b )
where m avail D is the diesel fuel that has not yet participated in the combustion, ms is the net soot mass that has already formed, P O 2 is the partial oxygen pressure inside the burning zone, E sf and E sb are the activation energies of soot formation and oxidation, and ab,f are constants.

3.15. EGR Simulation

The percentage of EGR is defined by the formula below:
X EGR ( % ) = EGR mix , IVC   · 100 %
where ( EGR ) represents the mass flow rate of exhaust gas and ( mix , IVC ) represents the mass flow rate of air and EGR inside the cylinder at inlet valve closing (IVC). The model assumes that the usage of EGR replaces only the mass of fresh air included in the cylinder charge [26,31,59], which is calculated by the expression below:
air , IVC = ( 1   X EGR   )   · mix , IVC
The temperature of the gaseous mixture at IVC is calculated by considering that fresh air, exhaust gas, and methane are mixed adiabatically while the pressure of the cylinder charge at IVC is considered to be equal to the experimental one at each PES value.
The exhaust gas is assumed to consist of O2, N2, CO2, and H2O, the concentrations of which are equal to the respective concentrations at the exhaust valve opening event of NDFO. The temperature of EGR for each PES is considered to be equal either to the temperature of the cylinder exhaust gas during NDFO (hot EGR) or to the respective experimental temperature of the air and methane mixture at IVC during NDFO (cold EGR).

4. Experimental Data

The experimental data that were used for the model validation in the present work were derived from an experimental investigation on a single-cylinder direct injection turbocharged dual-fuel compression-ignition research engine located at Mississippi State University (MSU). The aforementioned data have been used by the research team in the past [24,28,46]. Further details regarding the experimental procedure that was followed are given in the work by Raihan et al. [47]. In Table 1, some main design and operational characteristics of the research engine are given:
The types of fuel used for the experimental analysis were diesel fuel and pure methane, which can be considered natural gas surrogates since it is its main component. All the experimental measurements were taken at an engine speed of 1500 rpm and at part-load conditions (IMEP = 0.52 Mpa and brake torque = 48.5 N) for PES rates equal to 30%, 50%, 60%, 70%, and 80%. PES rate is the percentage of energy substitution of diesel fuel from methane, and it is calculated based on the formula below:
PES = M · LHV M D · LHV D + M · LHV M   · 100 %
where D , M and LHV D , M are the mass flow rates and lower heating values of diesel and methane, respectively. The experimental data for each PES rate include the measured mean cylinder pressure diagram for each crank angle, the engine speed, brake torque, diesel fuel injection pressure, diesel fuel injection timing, and the temperature and pressure of the cylinder charge at IVC. Furthermore, the experimental measurements include the air, diesel fuel, and methane mass flow rates along with NO, CO, and soot emissions concentrations. The concentrations of NO and CO were measured in ppm, and the soot concentration was measured in Filter Smoke Number (FSN) units. All emissions measurements were converted to g/kWh.
After further processing of the experimental data, the corresponding fuel equivalence ratio (φ), the net apparent heat release rate (AHRR), the indicated power (iPower), the indicated mean effective pressure (IMEP), the indicated energy consumption (ISEC), the maximum cylinder pressure, and the specific emissions of CO, NO, and soot were derived.
The indicated power was calculated from the mean cylinder pressure diagram versus the crank angle using the below expression [42,51]:
iPower = ( IVC EVO P · dV ) ·   RPM 120
where RPM is the engine speed, and dV is the cylinder volume deviation. The equivalence ratio was calculated according to the expression below:
φ = D · AFR st , D + M · AFR st , M A
where AFRst,D and AFRst,M correspond to the stoichiometric air–fuel ratio for diesel and methane fuel. The net apparent heat release rate was calculated according to the expression below [47]:
AHRR ( θ ) = γ γ 1   · P   ·   dV d θ + 1 γ 1   · V   ·   dP d θ
where γ is the specific heat ratio, P is the mean cylinder pressure, and V is the cylinder volume for the respective crank angle θ. The specific energy consumption was calculated according to the expression below:
ISEC   [ MJ / kWh ] = D · LHV D + M · LHV M iPower
where LHVD,M represents the lower heating value of diesel fuel and methane, respectively. In Table 2, the aforementioned engine operational data for each PES value are included.

5. Model Validation

In order to assess the ability of the model to predict the main performance characteristics and exhaust emissions of a diesel engine operating under dual-fuel conditions, the experimental results were compared against the theoretical ones derived from the model.
The comparison was made for engine operating conditions at a speed of 1500 rpm, at part-load conditions (IMEP = 0.52 Mpa, brake torque = 48.5 N), and for various PES rates. The PES rates that were investigated were 30%, 50%, 60%, 70%, and 80%.
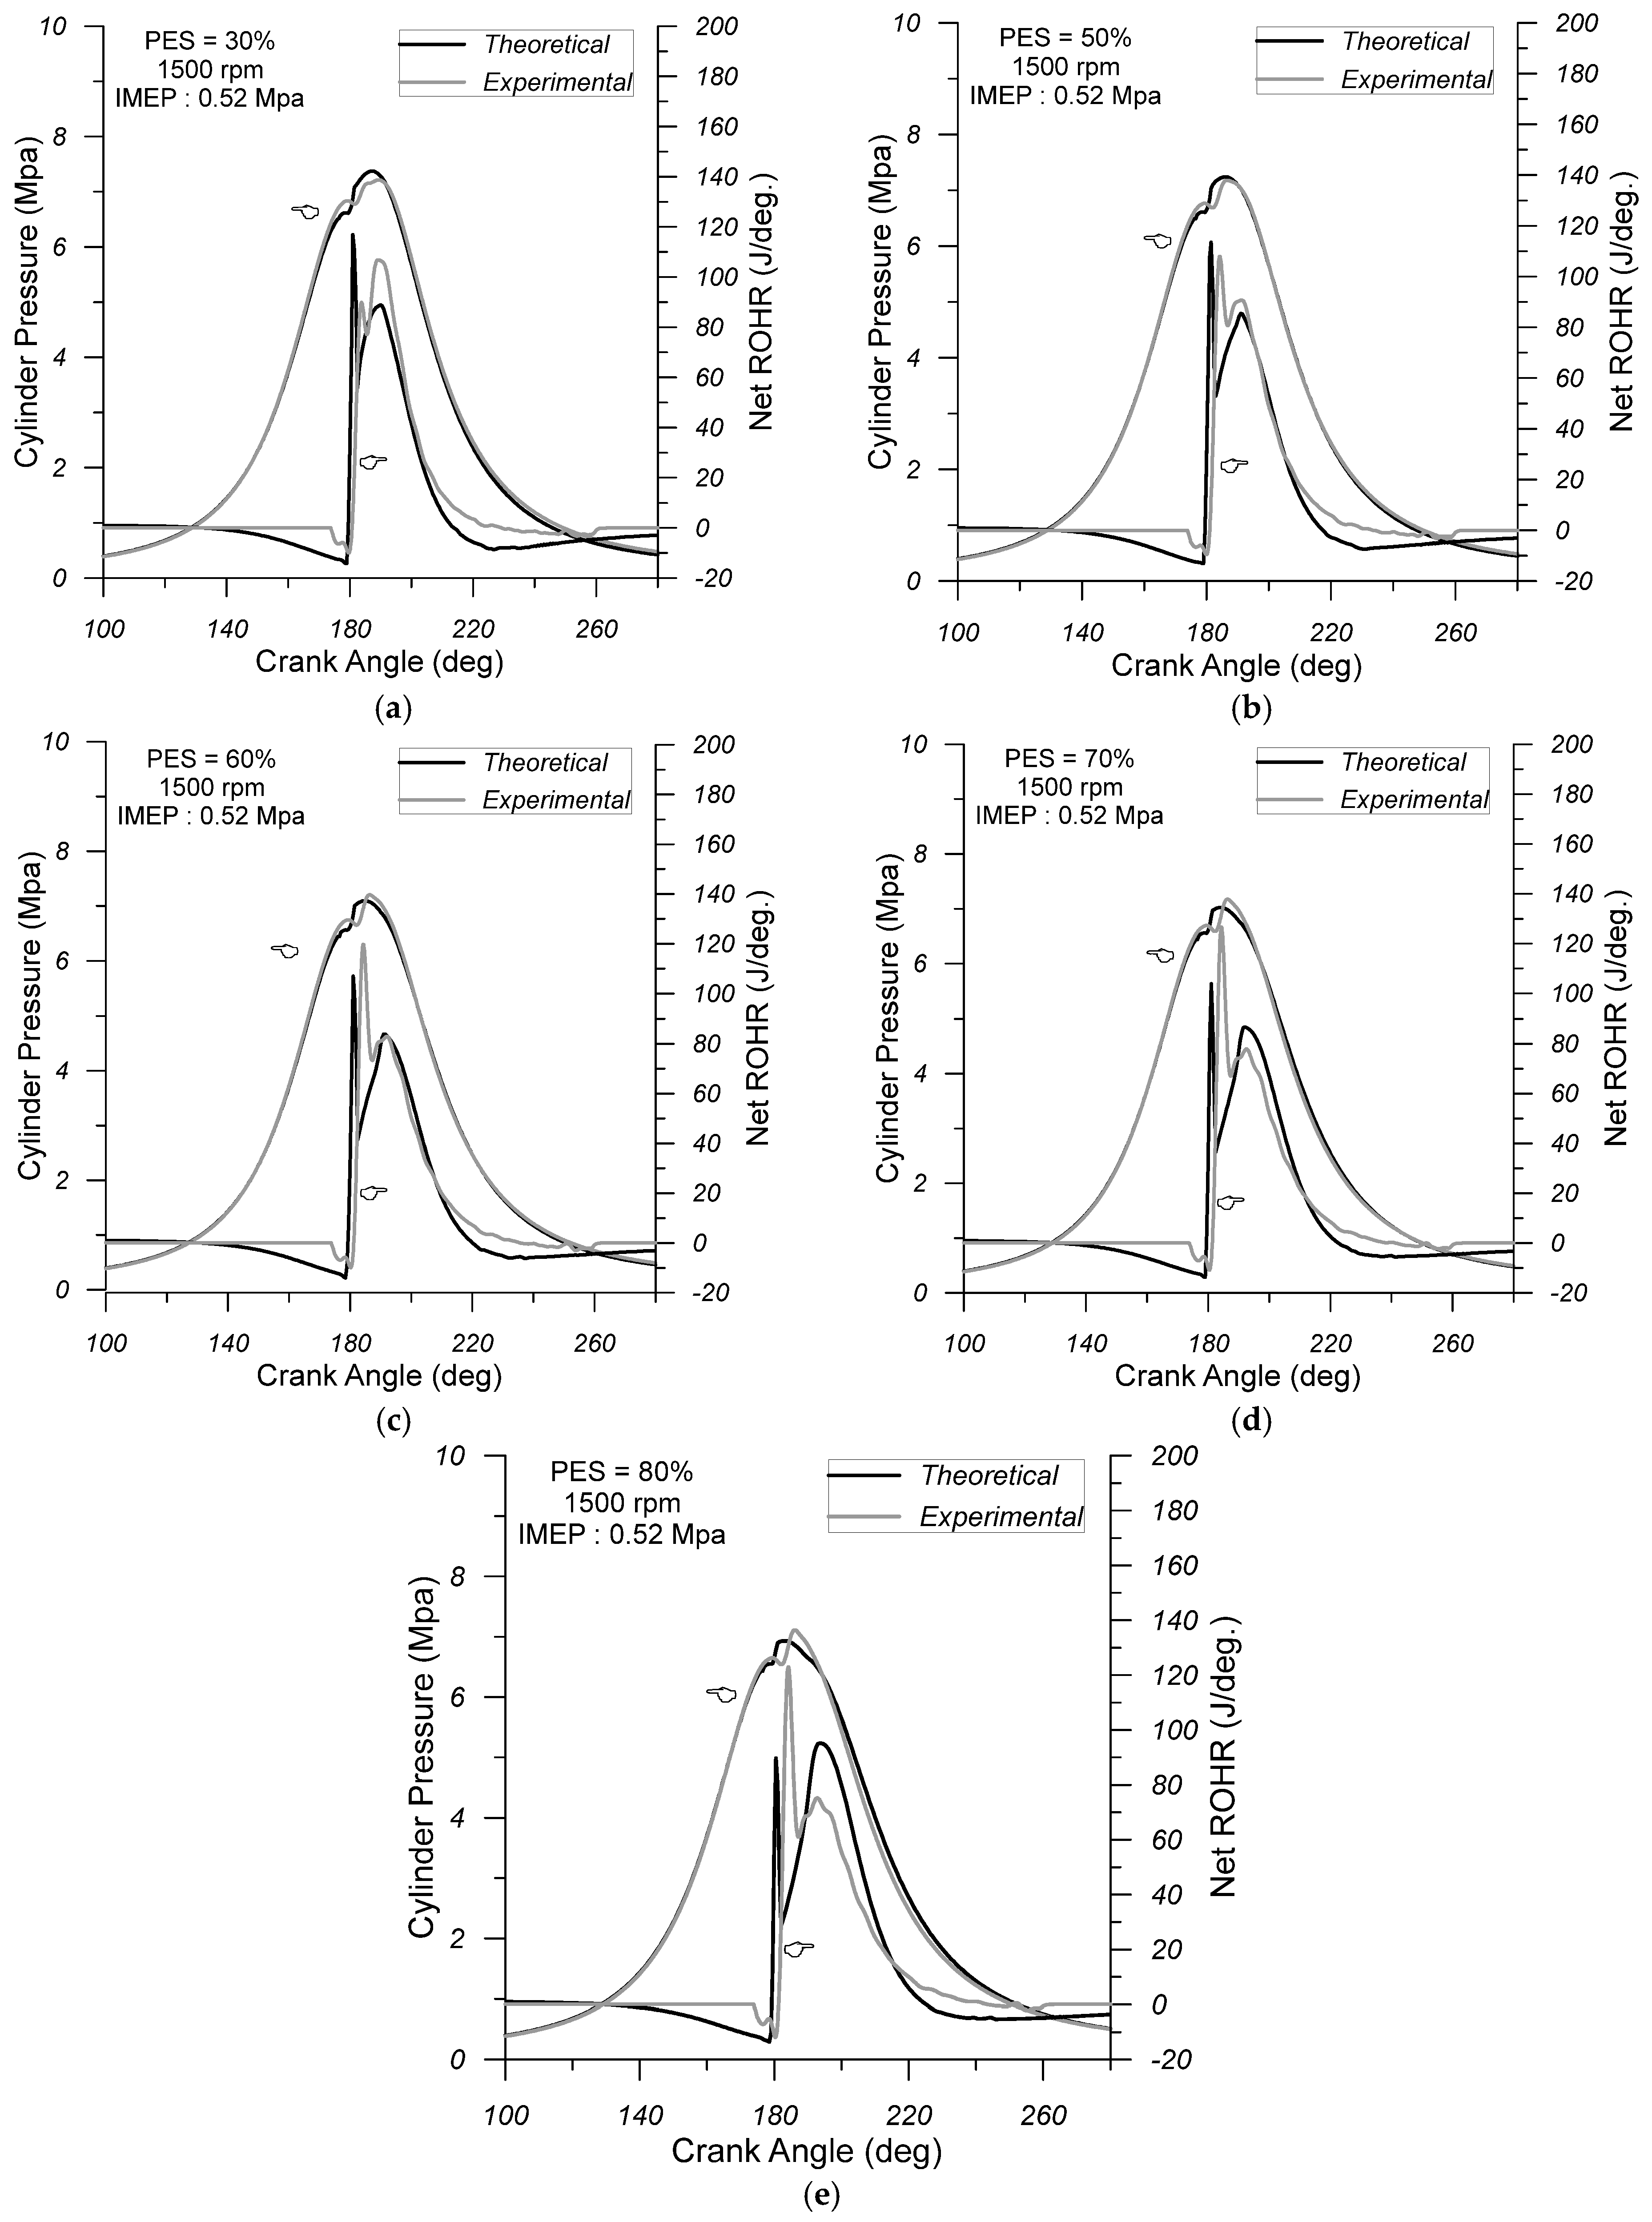
In Figure 1a–e, the experimental and theoretical mean cylinder pressure and net apparent heat release rate for each crank angle for all the operating conditions described above are displayed. From these figures, the model predicts with satisfactory accuracy both the deviation in the mean cylinder pressure and the total net heat release rate (from the combustion of both diesel and methane) during the closed operating cycle of the engine. It is worth mentioning that the model was calibrated at the following engine operating conditions: engine speed = 1500 rpm, IMEP = 0.52 Mpa, and PES = 70%. The constants of the model were kept unchanged for all the test cases that were investigated in the present work.
In Figure 2, the theoretical and experimental values of maximum cylinder pressure, mean effective pressure (IMEP), and specific energy consumption (ISEC) are displayed for all the PES rates that were investigated. The decision to use ISEC instead of the indicated specific fuel consumption was taken due to the fact that diesel fuel and methane have different LHVs, which are considered to be equal to 42.5 MJ/kg and 50 MJ/kg, respectively [28]. By observing the graphs below, it can be determined that the model predicted rather satisfactorily not only the trend in maximum pressure and the indicated specific energy consumption but also their values. The observed deviations in the values of the above performance indicators are linked to the inherent limitations of using a two-zone phenomenological model in order to simulate the complex processes taking place inside the combustion chamber of a dual-fuel compression-ignition engine.
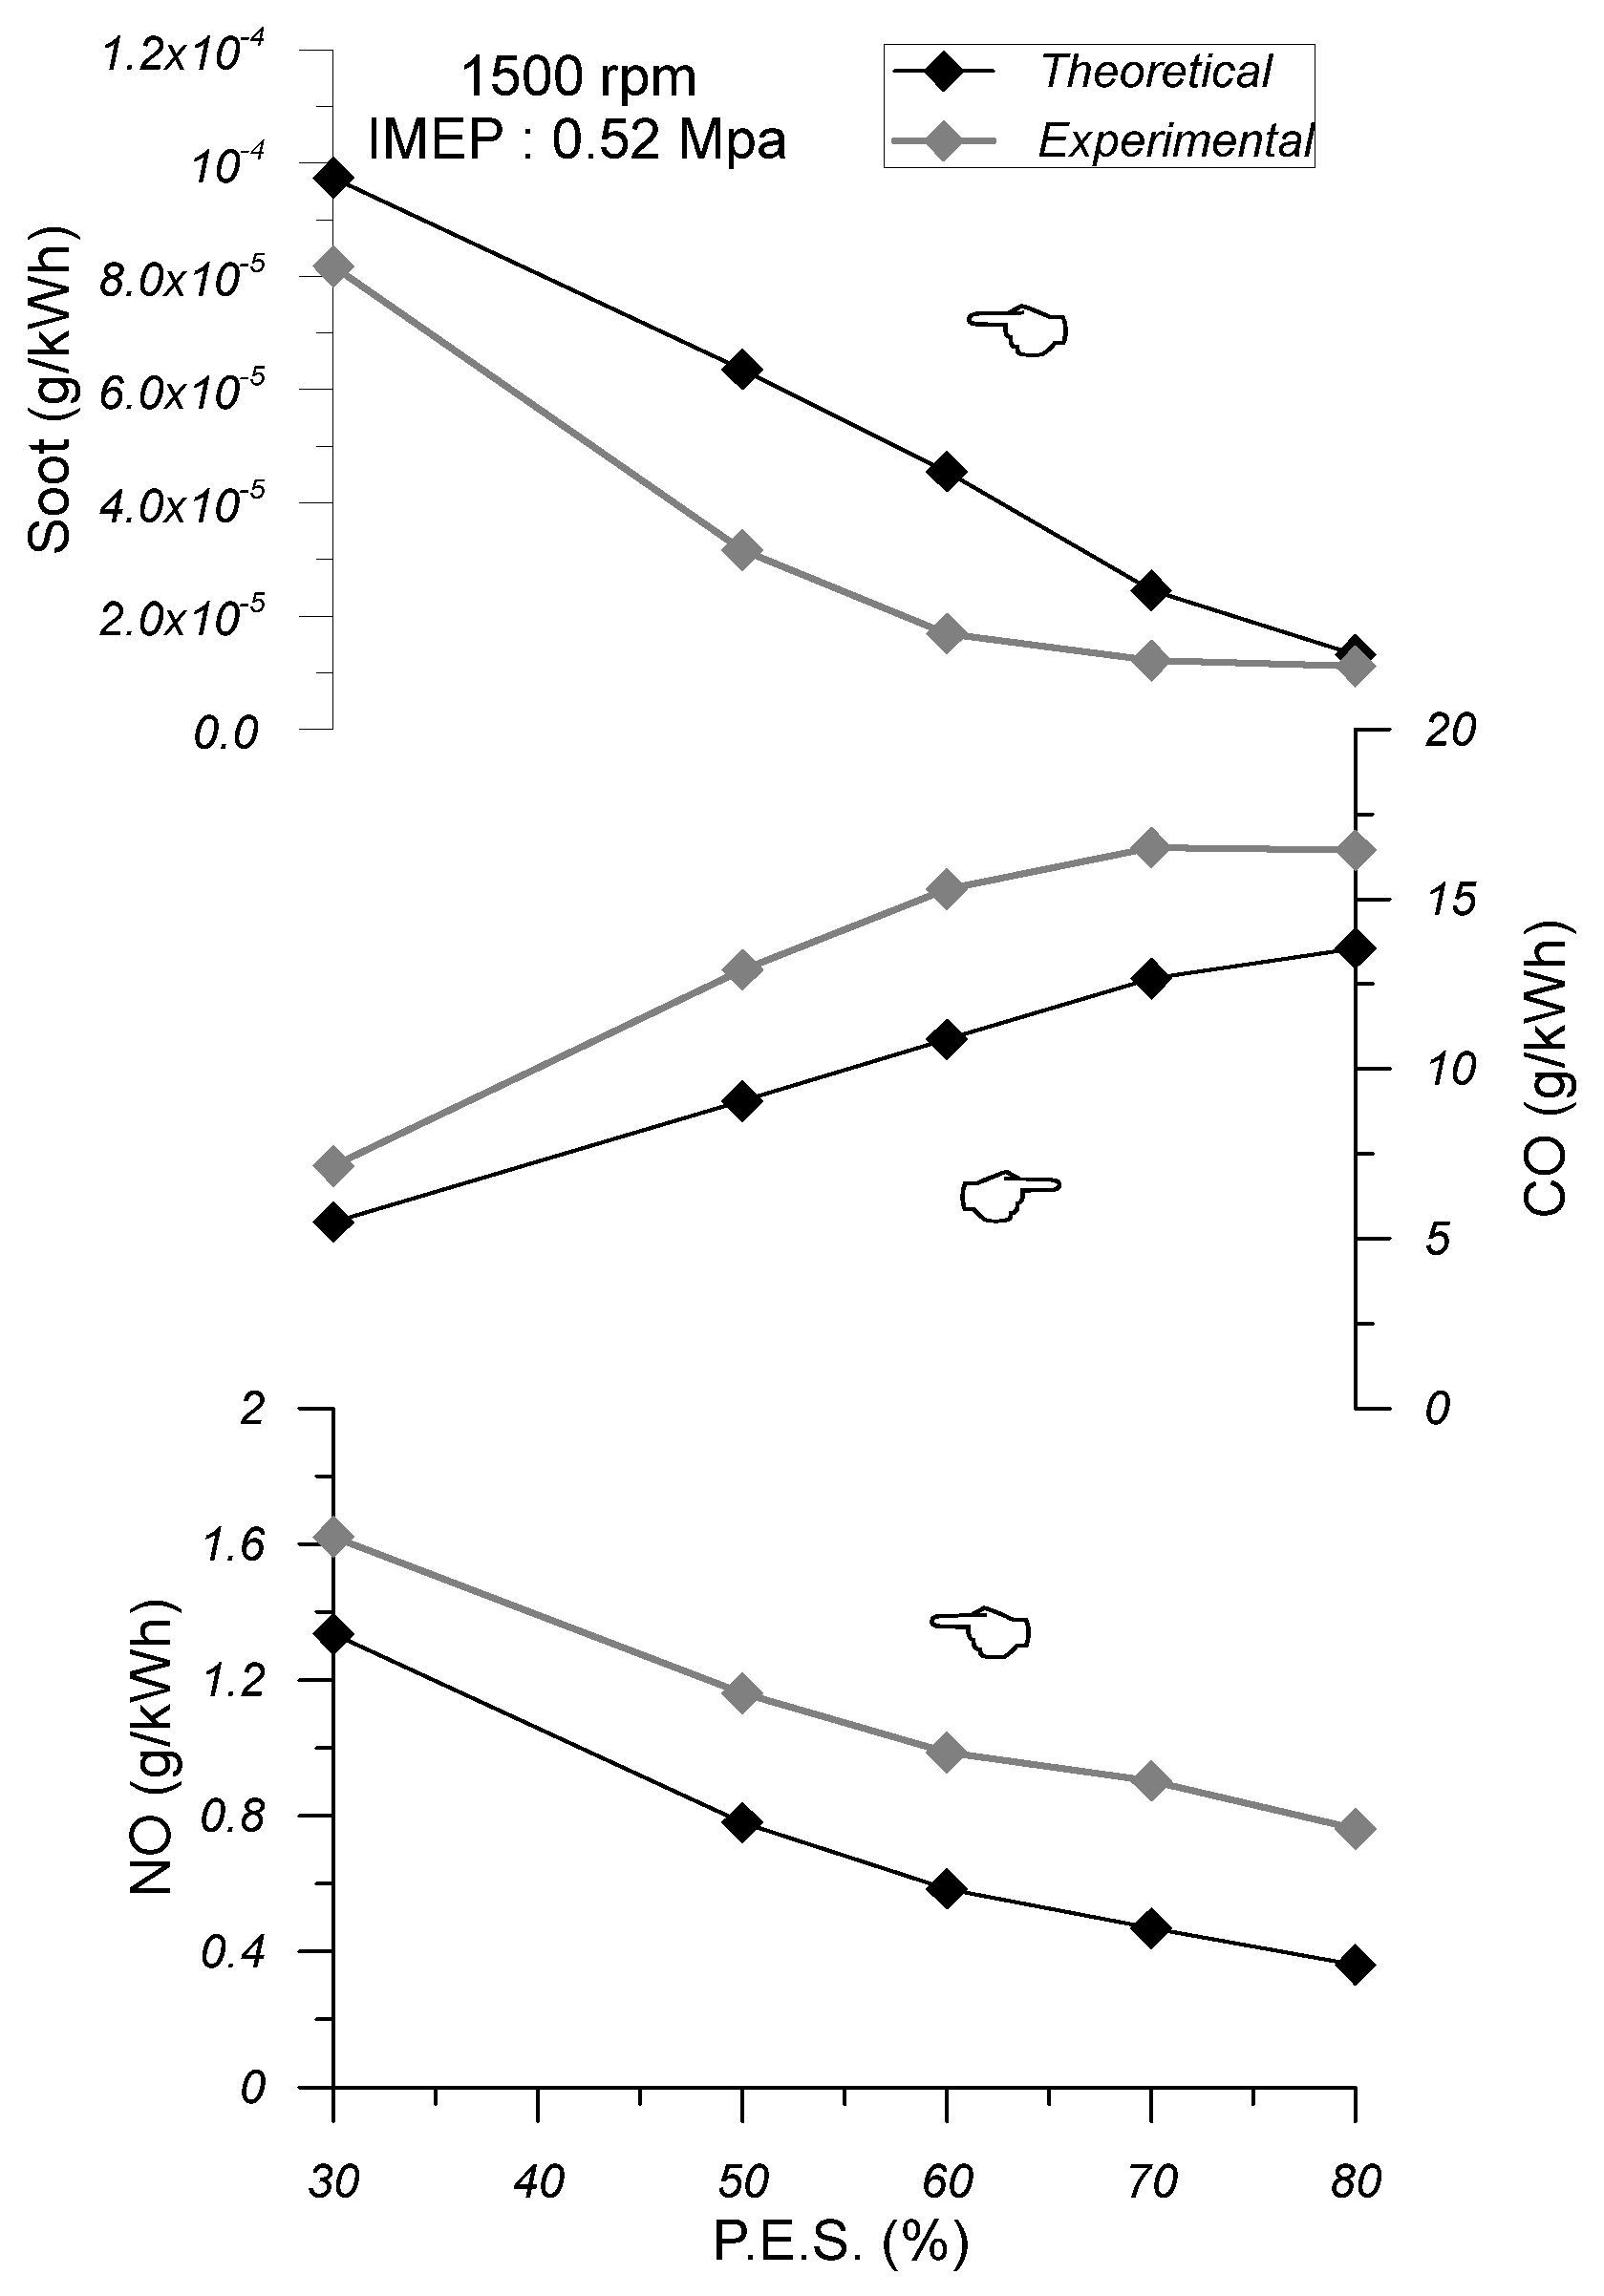
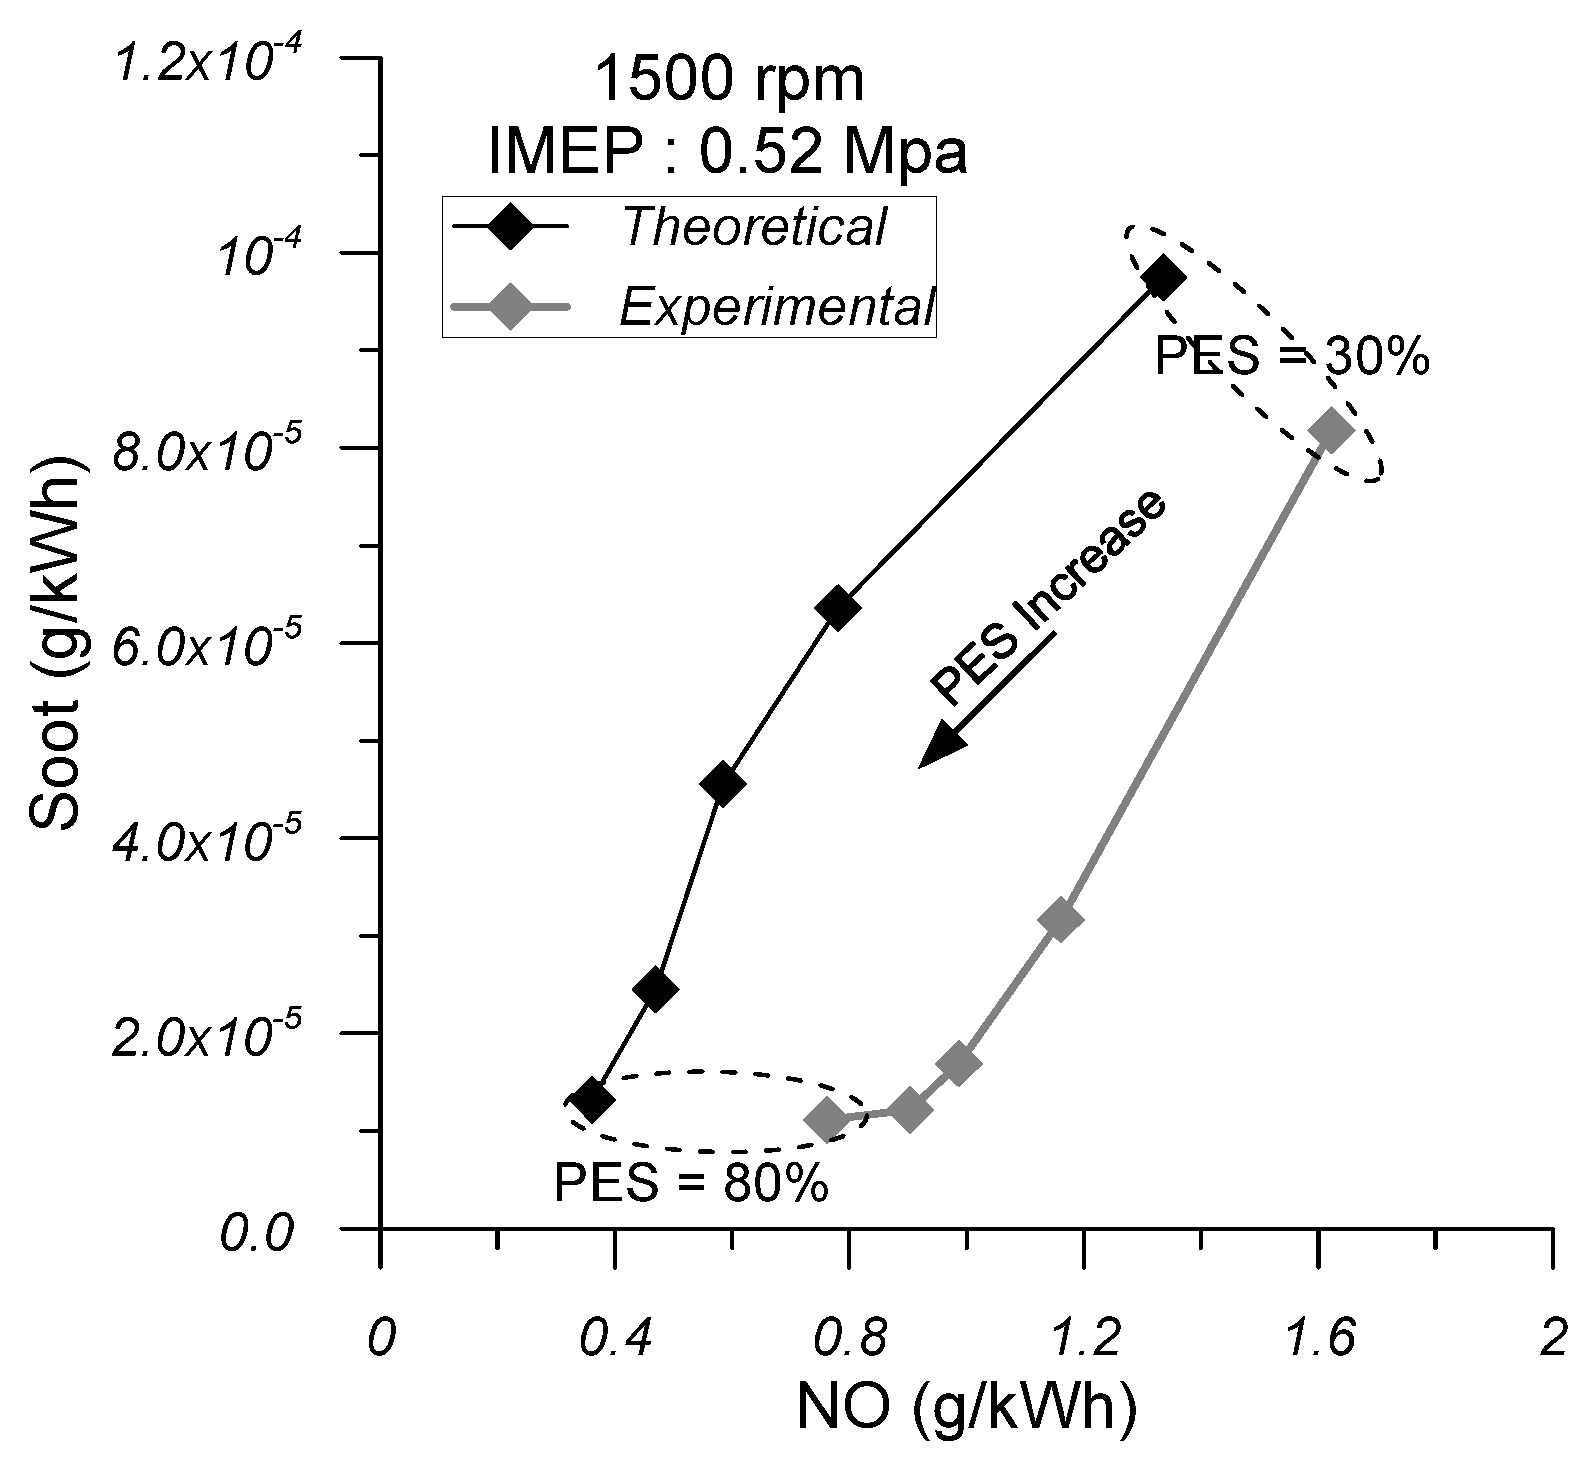
In Figure 3 and Figure 4, the experimental and theoretical deviation in specific emissions of CO, NO, and soot, as well as the NO–soot trade-off, are displayed for all the PES rates that were investigated. By observing these graphs, it is revealed that the model managed to predict with satisfactory accuracy the trend in specific emissions and, thus, the mechanisms of formation and oxidation of NO, CO, and soot, which are three of the most important emissions of dual-fuel compression-ignition engines.
Overall, the theoretical performance and emissions results derived from the model are in relatively good agreement with the experimental data, revealing the capability of the model to predict with satisfactory accuracy the physical and chemical processes that take place inside a compression-ignition engine operated under dual-fuel conditions. Thus, the model can be further used in order to investigate the effect of different EGR strategies (in terms of the EGR rate and temperature) on the performance and emissions characteristics of the CI DF engine.

6. Test Cases Examined

After the successful validation process, the model was used to theoretically investigate the effect of EGR usage under different rates and temperatures on the performance and emitted pollutants (NO, CO, and soot) of a compression-ignition engine operated under dual-fuel conditions. Thus, at the same operating point of the engine (IMEP 0.52 Mpa and engine speed 1500 rpm), the usage of 10% and 20% EGR under two different temperatures was investigated. The first temperature was assumed to be equal to the experimental temperature of the gaseous mixture at IVC when the engine operated under NDFO (cold EGR). The second temperature for each PES examined was assumed to be equal to the cylinder exhaust gas temperature under NDFO. The above EGR usage strategies were investigated at three different rates of PES equal to 30%, 50%, and 80%, respectively. Thus, the above 12 test cases were derived and are summarized in Table 3 below and will be investigated in the following section:

7. Results and Discussion

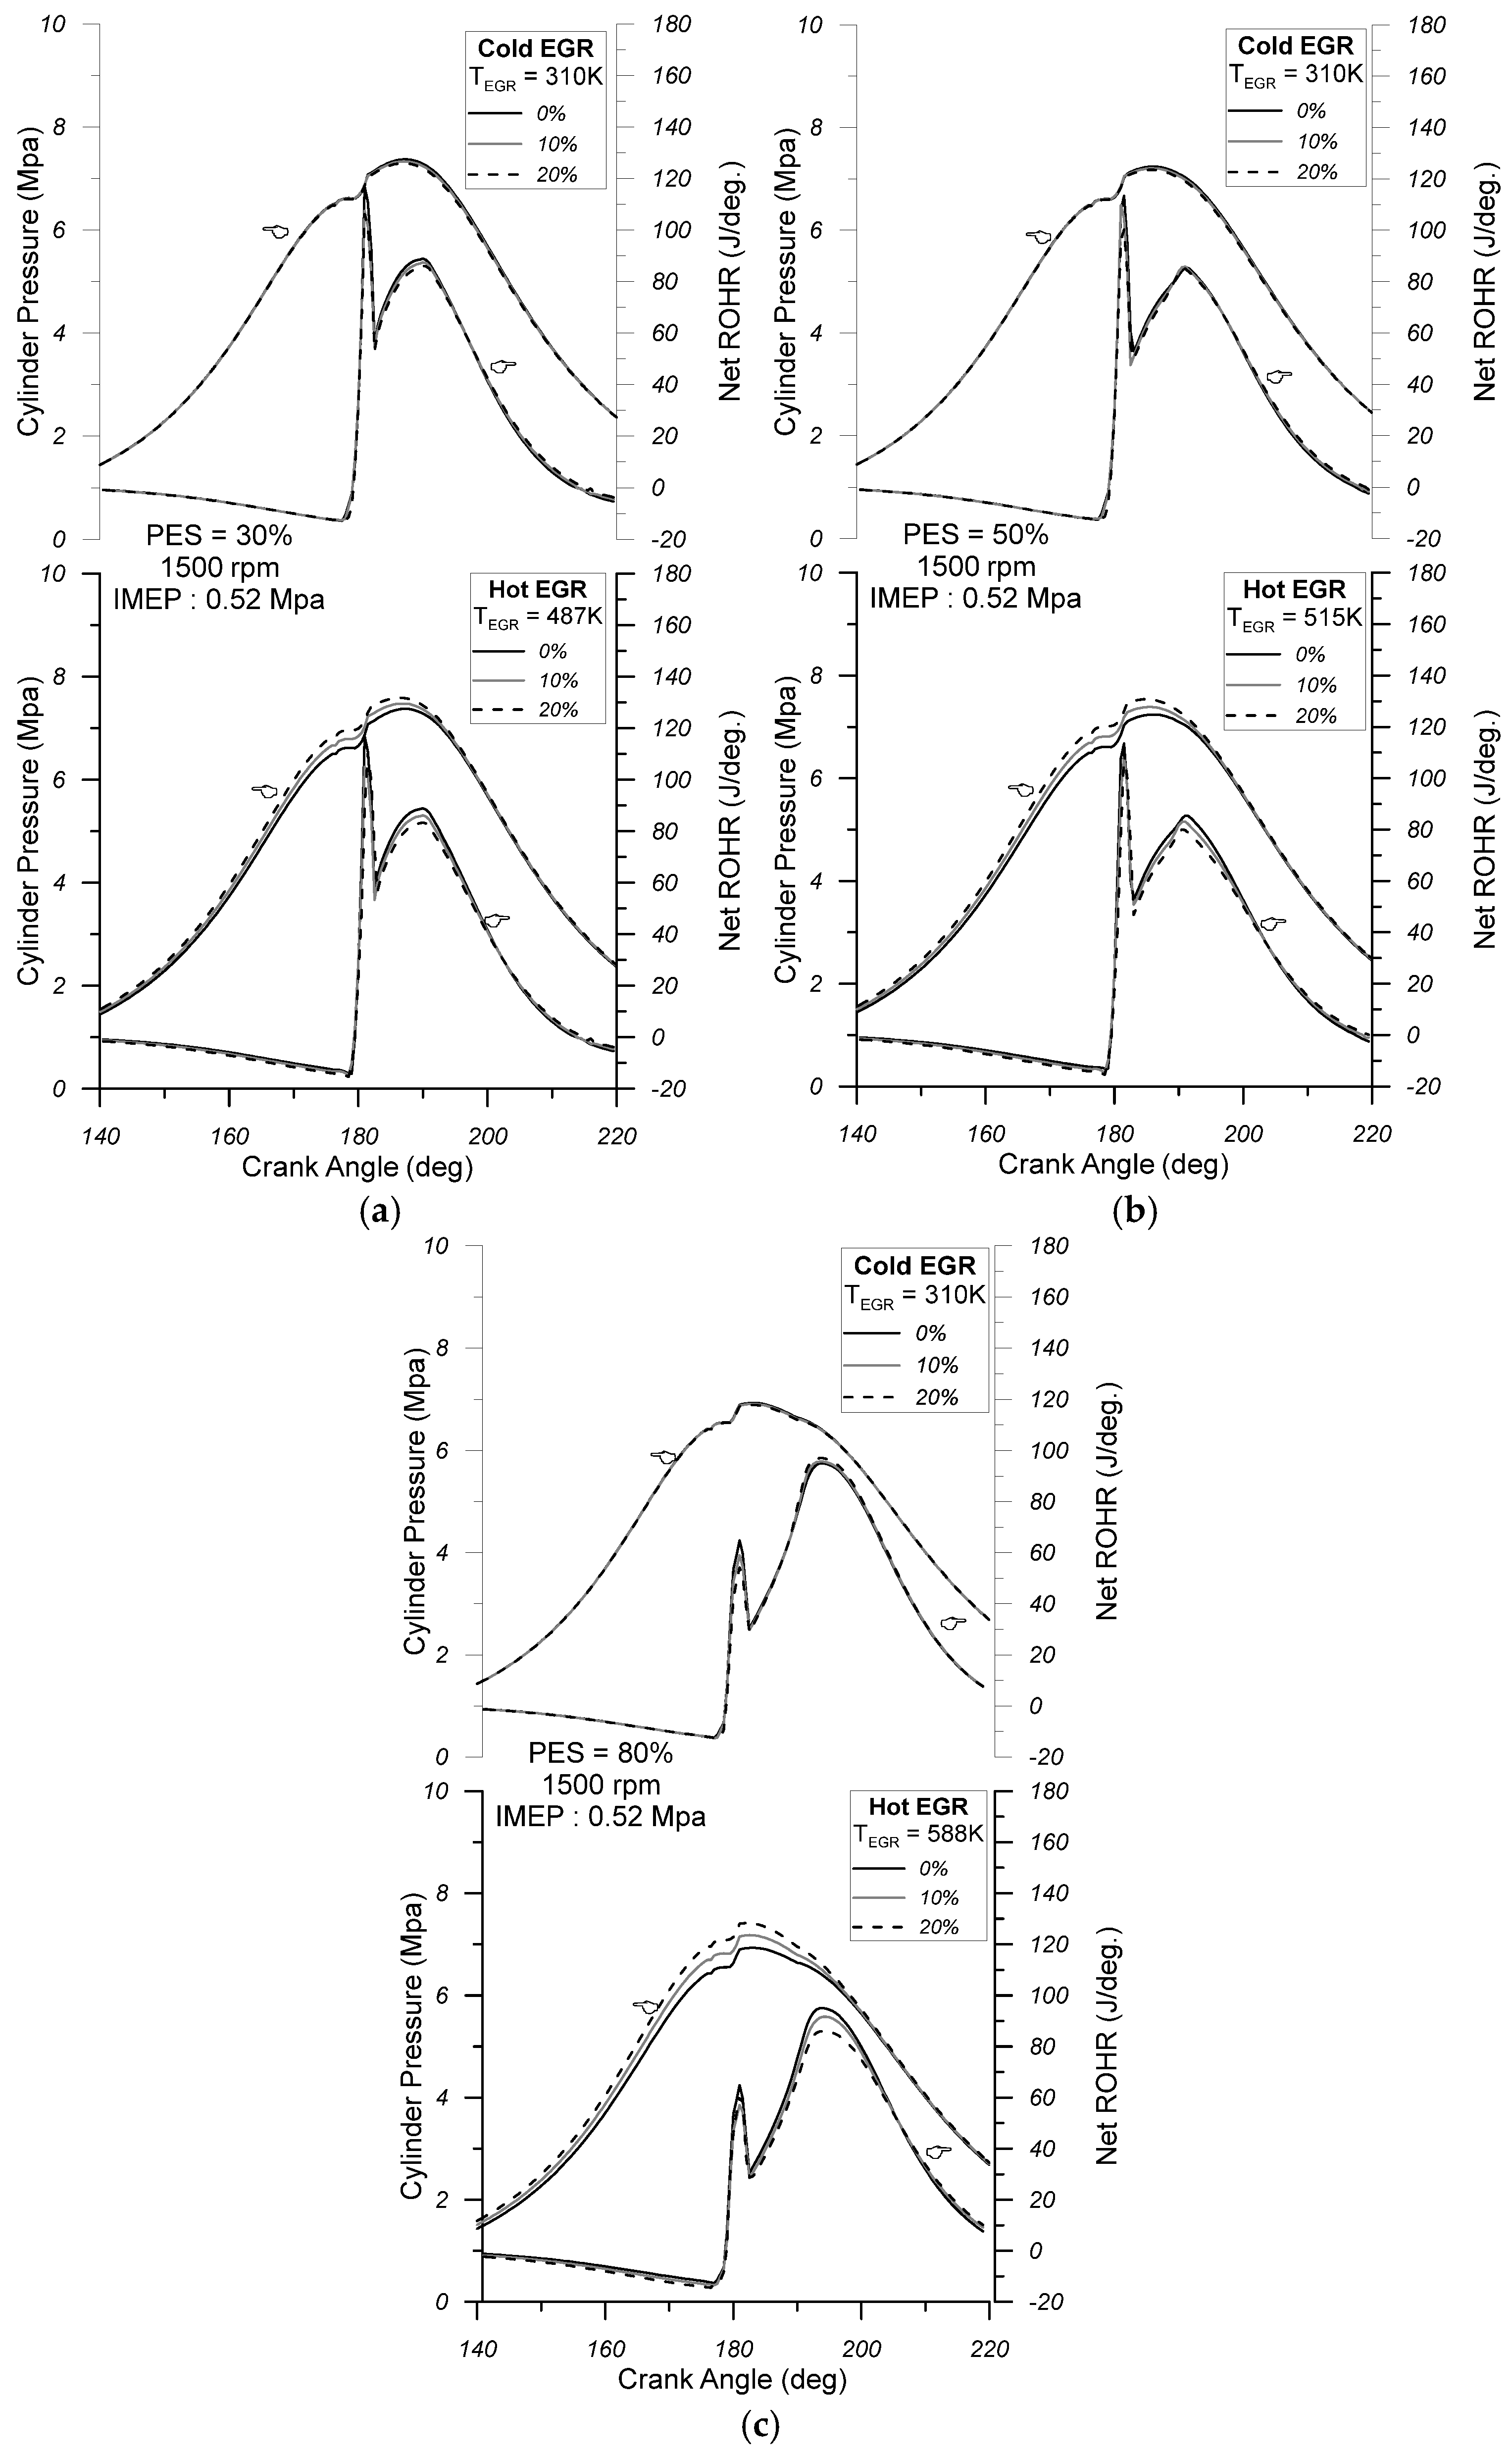
In this section, the results of the investigation of the different EGR strategies presented above are analyzed. In Figure 5a–c, the calculated pressure trace and net apparent heat release rates for engine operation at 1500 rpm, part-load (IMEP = 0.52 Mpa), dual-fuel conditions (30%, 50%, and 80% PES) for normal dual-fuel operation (NDFO) without EGR and for engine operation under different EGR temperatures (cold and hot) and rates (10% and 20%) are displayed. By examining the figures below, it can be concluded that in the case of cold EGR, the increase in the EGR rate for all PESs does not significantly affect the mean cylinder pressure diagram. Some small deviations can be observed during the premixed combustion stage and at the first stages after the initial development of the flame front. These can be attributed mainly to the lower combustion rates during the premixed combustion of diesel fuel and methane entrained inside the burning zone during the ignition delay period. In the case of hot EGR, by observing the respective diagrams for all PES rates, it can be noticed that there is a significant increase in the mean cylinder pressure as the EGR rate increases. This increase is mainly observed during the compression phase and during the first stages of combustion and can be mainly explained by the increased cylinder charge temperature due to the addition of hot exhaust gas. It is worth mentioning that later in the combustion stage, the pressure traces of hot EGR tend to converge to the respective traces under NDFO for all the EGR rates and for all the PES rates examined.
By observing the heat release traces of cold EGR, it can be noticed that as the EGR rate increases, the combustion starts later for all PESs. This is mainly attributed to the higher specific heat capacity of the cylinder charge, resulting in a longer ignition delay period. By observing the first stages of combustion in the case of cold EGR, for all the PES rates, it can be observed that the increase in EGR rate causes a deterioration in diesel and methane combustion rates. On the other hand, during the second stage of combustion, which is primarily controlled by the flame propagation mechanism, the increase in the EGR rate causes an increase in the heat release rate. This is because the increased EGR rate results in a lower total air excess ratio, which favors the flame propagation mechanism [26,31]. By observing the heat release traces of hot EGR, it can be noticed that for each PES rate, the combustion starts slightly earlier as the EGR rate increases. This can be ascribed to the smaller ignition delay period due to the higher prevailing cylinder charge temperature during the compression stroke. Moreover, it can be concluded that for every PES rate, the increase in the EGR quantity leads to a decrease in the flame combustion rate during the initial stages of flame development. This is the result of the decreased density of the unburned zone, which has a detrimental effect on the turbulent intensity and, thus, on the speed of flame propagation according to the Rapid Distortion Theory (see Equation (33)) [51,52,53,54,55]. Thus, even if the chemical kinetics are faster due to the higher temperature of the unburned zone (increasing laminar flame speed), the reduction in turbulence intensity seems to counteract this effect. This detrimental effect on flame speed does not impact the pressure trace close to TDC since it occurs early in the combustion stage when the mean cylinder pressure is mostly affected by the premixed combustion of the diesel and methane fuel that is entrained into the fuel jet. However, it seems that it impacts the mean cylinder pressure later during the expansion phase when the pressure trace tends to converge to the respective one under NDFO. At that stage, even if the flame combustion rate becomes higher, this does not affect the pressure trace since it occurs later in the expansion stroke.
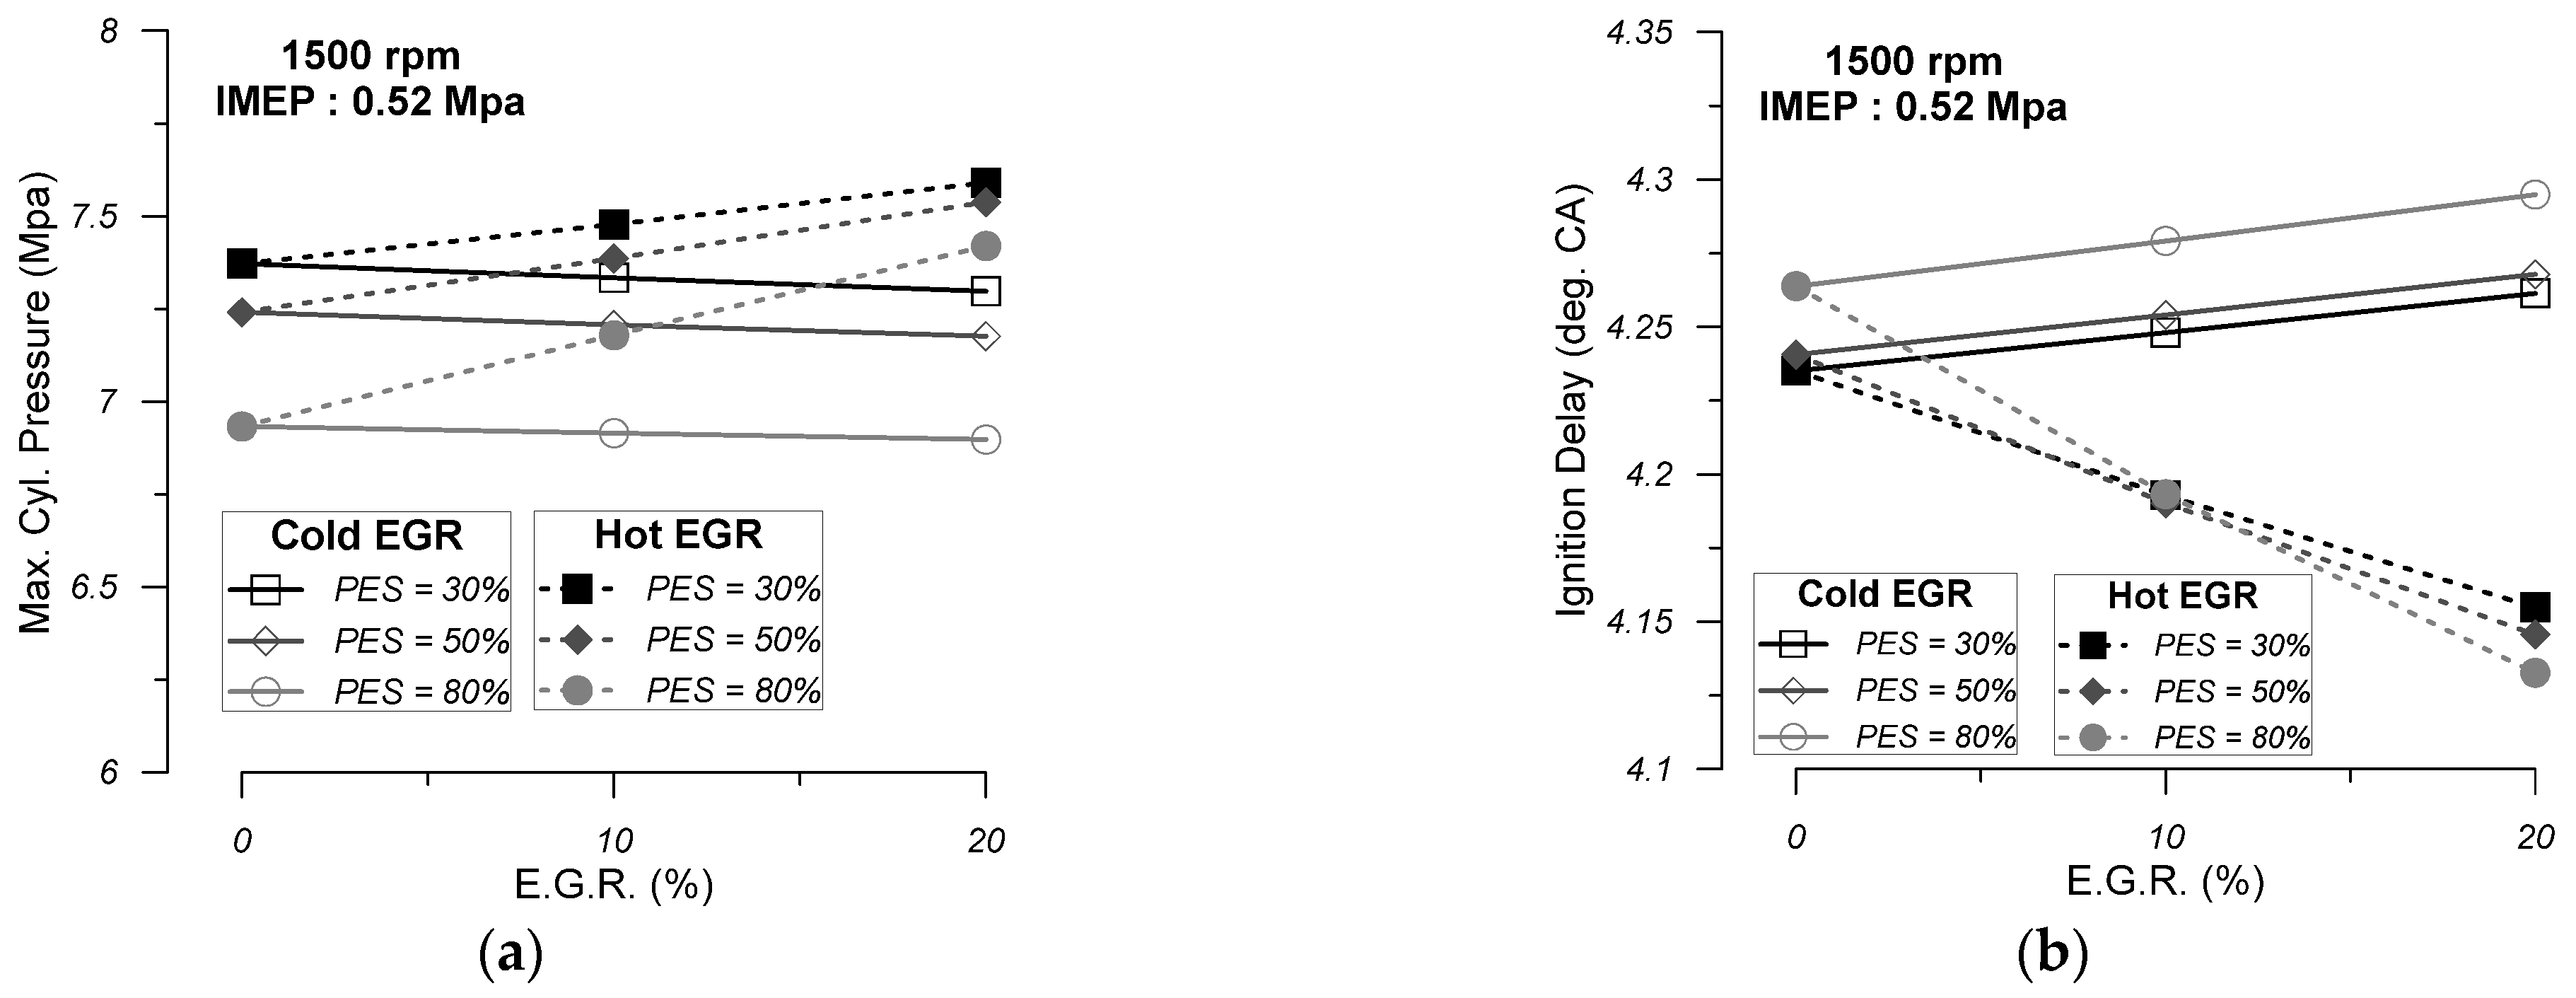
In Figure 6a, the maximum cylinder pressure for engine operation at 1500 rpm, part-load (IMEP = 0.52 Mpa), and dual-fuel conditions (30%, 50%, and 80% PES) for NDFO and engine operation under different EGR temperatures (cold and hot) and rates (10% and 20%) is displayed. By observing this figure, it can be concluded that during engine operation under NDFO conditions, the increase in PES rate leads to a decrease in maximum cylinder pressure. This can be mainly attributed to the increased ignition delay period due to the increased specific heat capacity of the cylinder charge and to the lower premixed combustion rate of diesel and methane. From the same diagram, it can be observed that during engine operation with cold EGR, the increase in EGR quantity for every PES rate causes a decrease in maximum cylinder pressure, which can primarily be attributed to the longer ignition delay period and to the decrease in cylinder charge temperature. On the other hand, during engine operation with hot EGR, the increase in the quantity of EGR results in a significant increase in maximum cylinder pressure, especially for lower PES rates. This trend can be explained by the higher cylinder charge temperature that is observed during the compression phase, which leads to a lower ignition delay period and higher combustion rates of diesel fuel and methane during the initial stages of the premixed combustion. It is worth mentioning that this increase may have detrimental effects on the mechanical strength of the engine. By examining the same EGR rate and temperature, it can be observed that the increase in PES rate causes a decrease in maximum cylinder pressure, which can be ascribed to a longer ignition delay period and the lower diesel and methane premixed combustion rates.
In Figure 6b, the ignition delay for the engine operation at 1500 rpm, part-load (IMEP = 0.52 Mpa), and dual-fuel conditions (30%, 50%, and 80% PES) for NDFO and engine operation under different EGR temperatures (cold and hot) and rates (10% and 20%) is displayed. The ignition delay is defined as the crank angle interval between the start of diesel fuel injection and the combustion initiation. Examining this figure, it can be derived that during engine operation under NDFO conditions, the increase in PES rate leads to an increase in the ignition delay period, which can be explained by the reduction in cylinder charge temperature due to the increase in the specific heat capacity of the charge. During engine operation with cold EGR, it can be observed by the graph below that the increase in EGR quantity leads to an increase in the ignition delay period. This is mainly linked to the higher specific heat capacity of the cylinder charge with the increase in the EGR rate. On the other hand, the increasing rate of hot EGR leads to a decrease in the ignition delay period due to the higher prevailing cylinder gas temperature, even though the cylinder charge’s specific heat capacity is higher than NDFO.
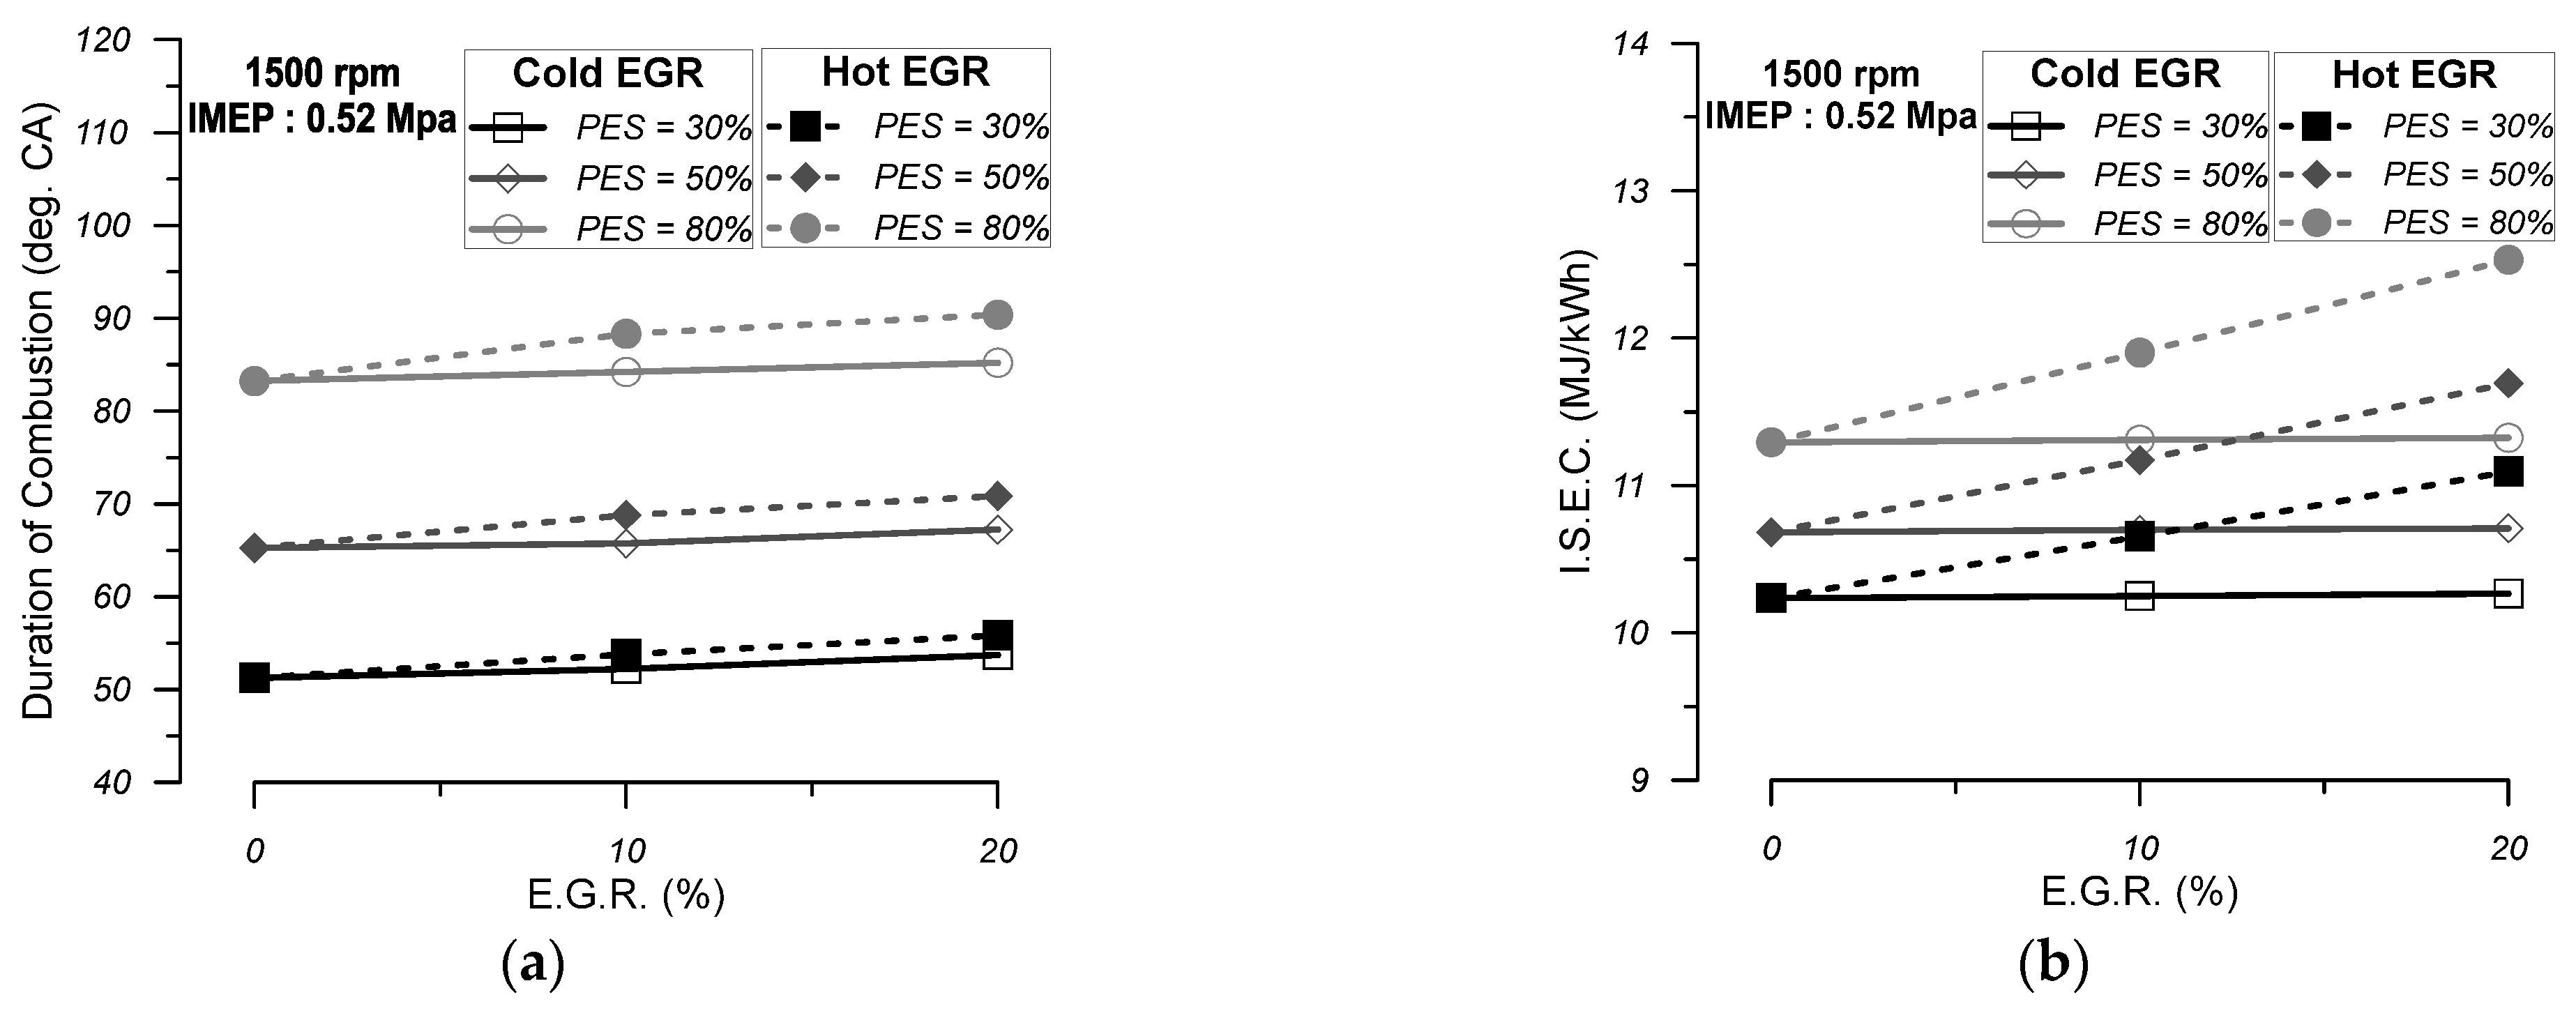
In Figure 7a, the duration of combustion for engine operation at 1500 rpm, part-load (IMEP = 0.52 Mpa), and dual-fuel conditions (30%, 50%, and 80% PES) for NDFO and engine operation under different EGR temperatures (cold and hot) and rates (10% and 20%) is displayed. The duration of combustion is defined as the crank angle interval from the initiation of combustion to 99% of the total mass of diesel and gaseous fuel that has been consumed. As can be concluded from this graph, when the engine is operating under NDFO, the increase in the PES rate leads to an increased combustion duration primarily since the premixed combustion rate of diesel and methane is lower. Furthermore, it can be derived that the duration of combustion increases with the increase in the EGR rate for both cold and hot EGR. For cold EGR, the increase is not so intense and can be attributed to the higher ignition delay period and the decrease in the combustion rate of diesel fuel and methane during the first stages of combustion. For engine operation with hot EGR, the increase, which is higher than the cold EGR, can be attributed to the deteriorated flame combustion rate during the first stages of flame front development. For the same EGR quantity and temperature, it can be observed from this graph that the increase in the PES rate leads to an increase in the duration of combustion due to the lower premixed combustion intensity imposed by the increase in methane quantity in the cylinder charge.
In Figure 7b, the specific energy consumption (ISEC) for engine operation at 1500 rpm, part-load (IMEP = 0.52 Mpa), and dual-fuel conditions (30%, 50% and 80% PES) for NDFO, and engine operation under different EGR temperatures (cold and hot) and rates (10% and 20%) is displayed. By examining this graph, it can be observed that when the engine operates under NDFO conditions, the increase in PES leads to an increase in ISEC. This can be mainly attributed to the increased combustion duration period at an increasing PES rate. Regarding engine operation with cold EGR, it seems that the increase in EGR quantity provokes a slight increase in ISEC. The fact that this trend is not so intense can be mainly attributed to the fact that when the EGR quantity increases, the total excess air ratio of the charge becomes lower, which favors the flame combustion rate. From the same graph, it can be concluded that the increasing percentage of hot EGR seems to lead to an increase in ISEC. This can be partly ascribed to the decrease in the flame combustion rate during the initial stages of flame development. Moreover, even though the mean cylinder pressure is higher than NDFO during the compression stroke and the initial phases of the combustion stage, this does not result in a higher power output since this is observed mainly during the compression phase when the cylinder volume is reduced with the upper movement of the piston towards TDC. Furthermore, for the same EGR quantity and temperature, the increase in PES value leads to an increase in ISEC, which is primarily attributed to the decrease in the cylinder charge temperature and the longer ignition delay imposed by the increase in methane mass into the cylinder charge.
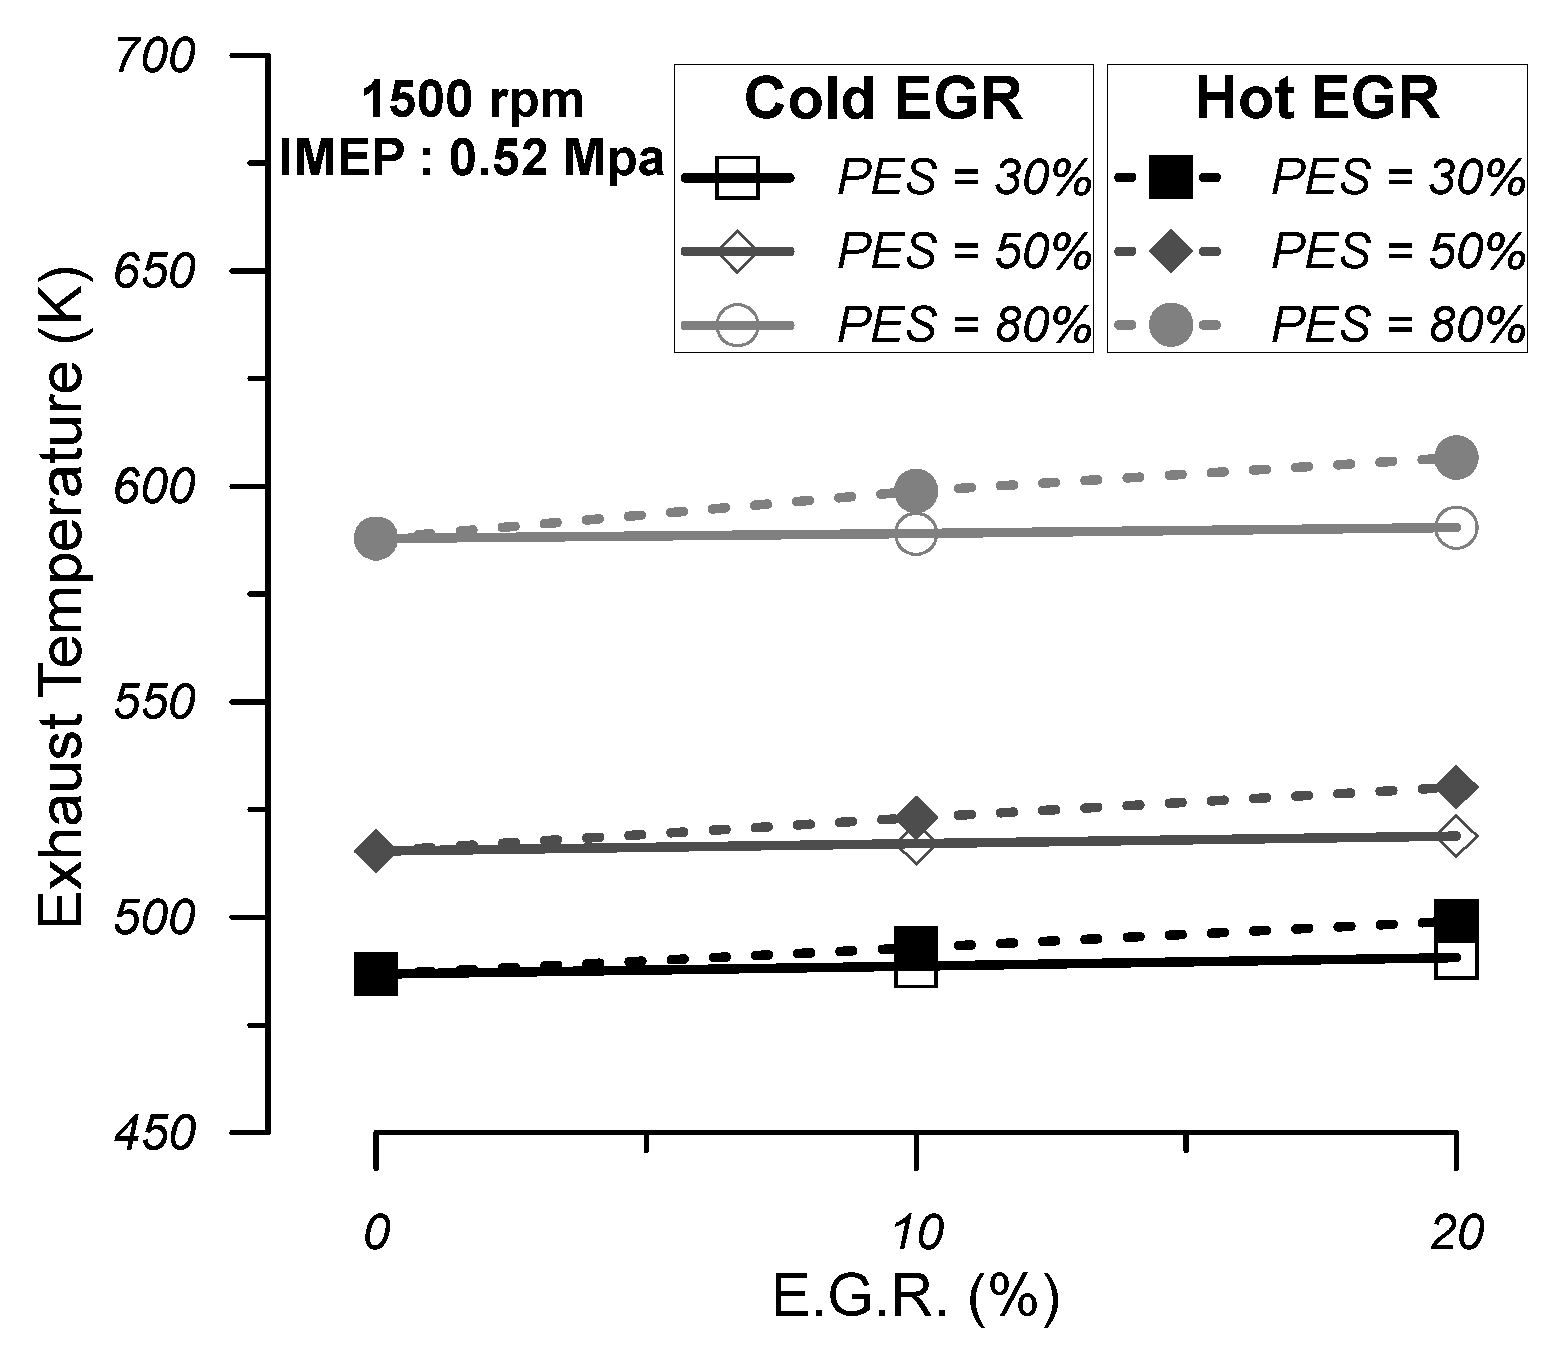
In Figure 8, the exhaust gas temperature at EVO for engine operation at 1500 rpm, part-load (IMEP = 0.52 Mpa), and dual-fuel conditions (30%, 50%, and 80% PES) for NDFO and for engine operation under different EGR temperatures (cold and hot) and rates (10% and 20%) is displayed. From this figure, it can be concluded that during NDFO, the increase in the PES rate leads to an increase in exhaust gas temperature mainly due to the increased combustion duration. Also, it is derived that the increase in both cold and hot EGR leads to higher values of exhaust gas temperature for all the PES rates examined. This is primarily attributed to the longer combustion duration period of both EGR temperatures compared with NDFO. This increasing trend is more intense for hot EGR than cold EGR, with the difference in exhaust gas temperature values becoming bigger as the PES rate increases. It is also worth mentioning that for the same EGR temperature and quantity, the increase in the PES rate leads to an increased exhaust gas temperature due to the increase in the combustion duration period.
In Figure 9a, the specific NO emissions for engine operation at 1500 rpm, part-load (IMEP = 0.52 Mpa), and dual-fuel conditions (30%, 50%, and 80% PES) for NDFO and engine operation under different EGR temperatures (cold and hot) and rates (10% and 20%) are displayed. According to the international literature [42,51], NO formation is highly controlled by the local oxygen concentration inside the cylinder and the cylinder charge temperature. In this graph, it is observed that when the engine operates without EGR, the increase in PES causes a decrease in specific NO emissions. This can be explained by the lower cylinder charge temperature and the lower concentration of oxygen inside the cylinder with the increasing PES rate. The increase in both the cold and hot EGR quantity leads to a decrease in specific NO emissions for all the PES rates examined. This can be mainly attributed to the decreased concentration of oxygen inside the burning zone. In the same diagram, by comparing the trends of cold and hot EGR, it can be observed that NO emissions are higher for engine operation with hot EGR due to the higher cylinder charge temperature. It can also be concluded that the increase in the PES rate for the same EGR quantity and temperature has a positive effect (i.e., reduction) on NO-specific emissions since it leads to a lower cylinder charge temperature and a lower concentration of oxygen inside the burning zone.
In Figure 9b, the specific CO emissions for engine operation at 1500 rpm, part-load (IMEP = 0.52 Mpa), and dual-fuel conditions (30%, 50%, and 80% PES) for NDFO and engine operation under different EGR temperatures (cold and hot) and rates (10% and 20%) are displayed. The main factors that favor CO formation are the existence of unburned hydrocarbons, the low air–fuel ratio, and the low charge temperature [42,51]. In Figure 9b, when the engine is operating under NDFO, it can be concluded that specific CO emissions are increased with the increase in the PES rate as it results in a lower air–fuel ratio and lower cylinder charge temperature. By observing the respective diagrams of engine operation with EGR, it can be derived that the specific CO emissions are increased with the increase in EGR quantity both for cold and hot EGR. This is primarily ascribed to the decrease in the air–fuel ratio in the cylinder. This increase compared with NDFO can be considered moderate for 10% EGR, while it becomes bigger when the EGR rate increases to 20% for both cold and hot EGR. In the case of cold EGR, this trend becomes more intense due to the lower cylinder charge temperature as the EGR percentage increases. In the case of hot EGR, the increase in specific CO emissions is counteracted by the increased cylinder charge temperature. The difference between cold and hot EGR becomes bigger with the increase in the PES rate since the cylinder charge temperature and oxygen concentration become lower with the increase in methane quantity inside the cylinder for the same EGR quantity and temperature.
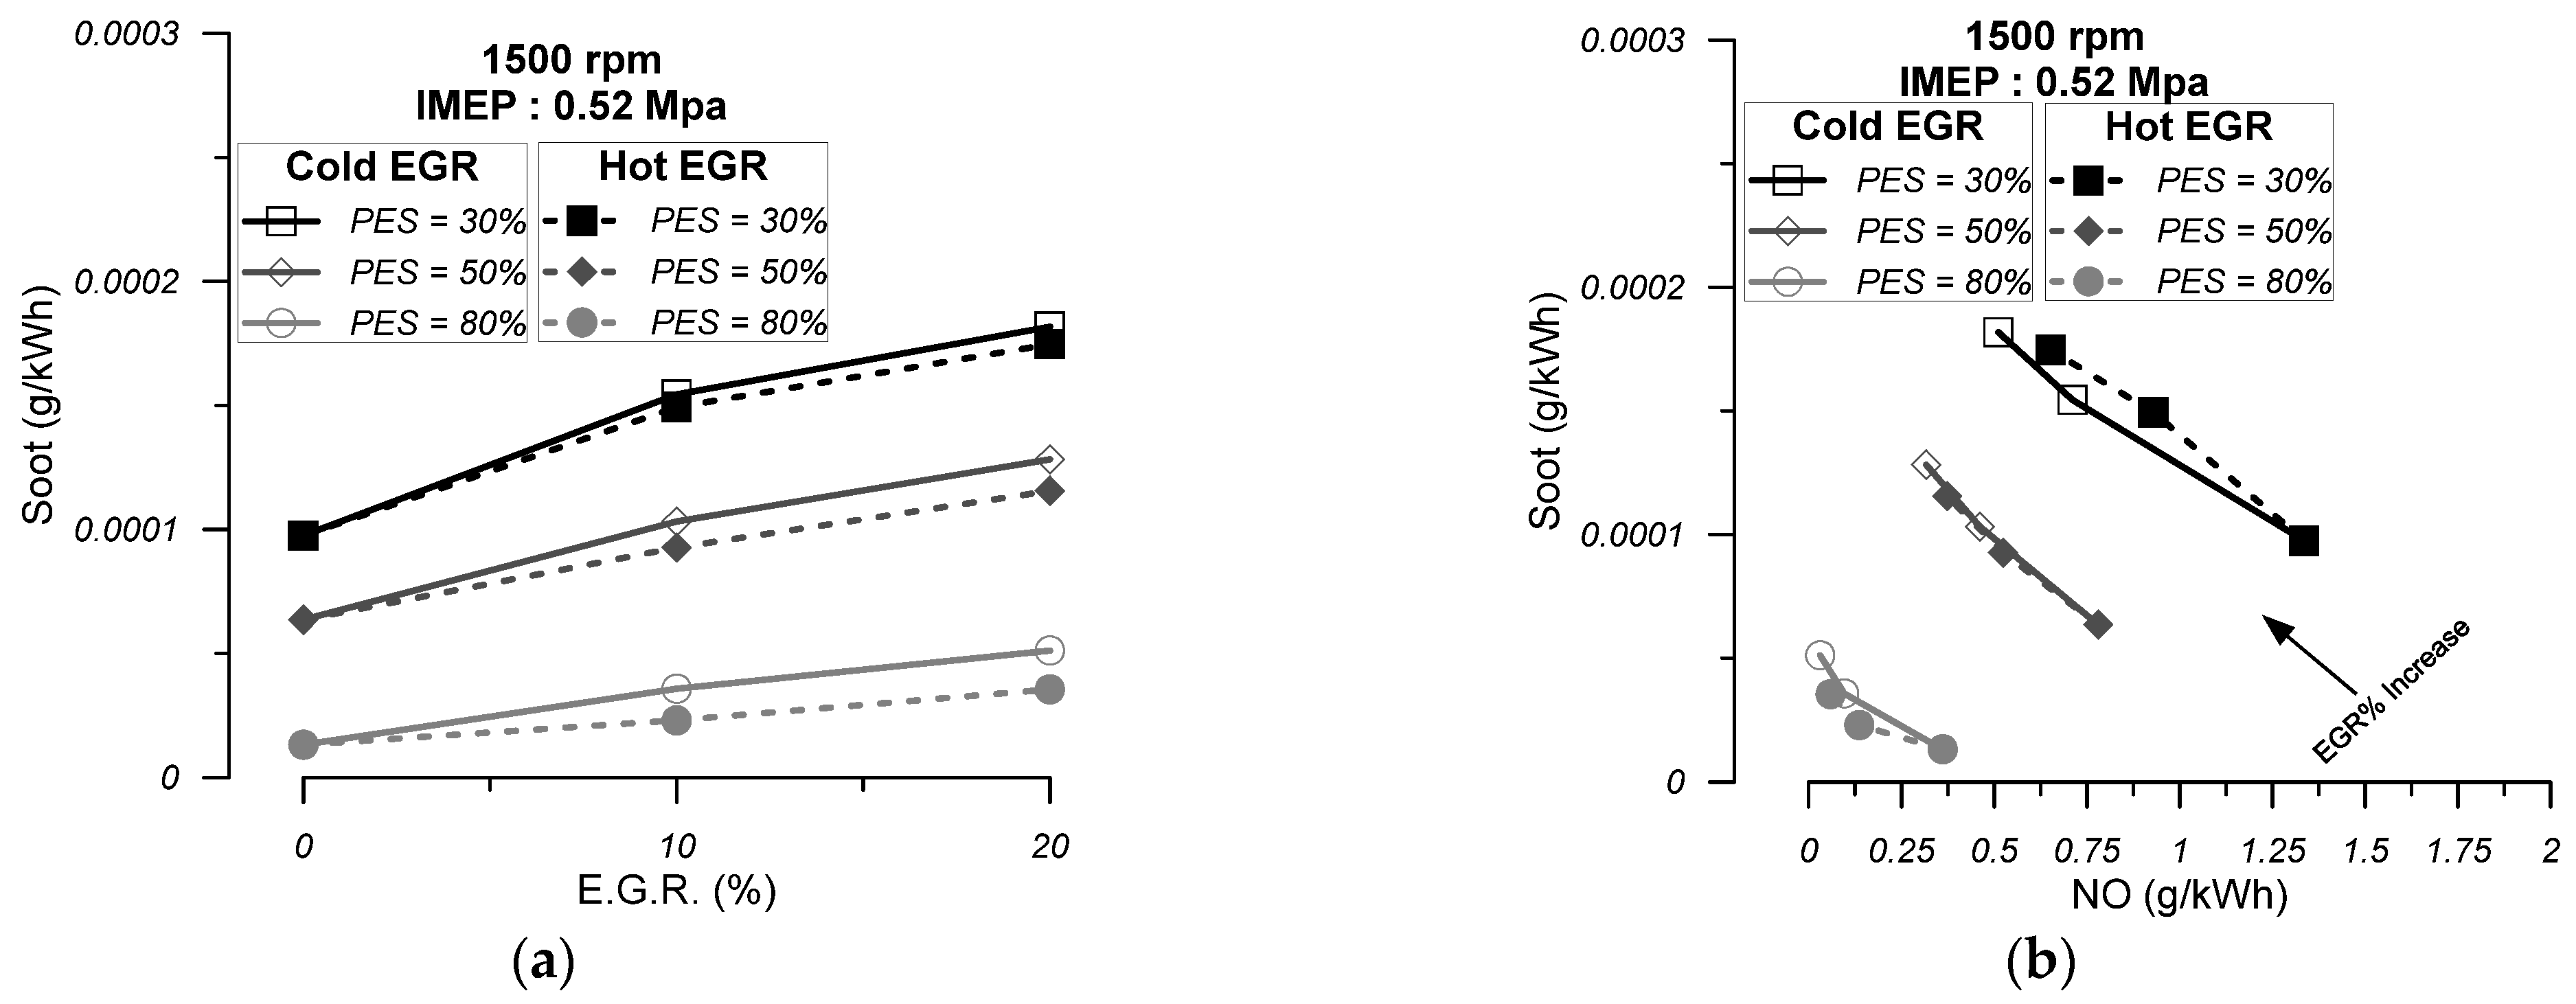
In Figure 10a, the specific soot emissions for engine operation at 1500 rpm, part-load (IMEP = 0.52 Mpa), and dual-fuel conditions (30%, 50%, and 80% PES) for NDFO and engine operation under different EGR temperatures (cold and hot) and rates (10% and 20%) are displayed. Soot formation is primarily controlled by the fuel–air excess ratio and by the burning zone local temperature [42,51]. By observing this figure, it can be concluded that when the engine operates under NDFO, the increase in the PES rate leads to a decrease in specific soot emissions due to the decrease in diesel fuel quantity. When the engine operates with EGR, the increase in EGR quantity increases specific soot emissions, both for cold and hot EGR, due to the decreased oxygen availability inside the burning zone. This trend is more intense in the case of cold EGR than in the case of hot EGR since the lower local temperature of the burning zone in the case of cold EGR favors the formation of soot emissions. Furthermore, for a specific EGR quantity and temperature, the increase in the PES rate favors specific soot emissions (i.e., decrease) since the diesel fuel quantity is reduced.
In Figure 10b, the specific NO–soot trade-off emissions for engine operation at 1500 rpm, part-load (IMEP = 0.52 Mpa), and dual-fuel conditions (30%, 50%, and 80% PES) for NDFO and engine operation under different EGR temperatures (cold and hot) and quantities (10% and 20%) are displayed. During engine operation under NDFO conditions, it can be observed from this diagram that the increase in the PES rate results in a simultaneous decrease in specific NO and Soot emissions. From the same graph, it can be derived that when the engine operates with EGR, the increase in EGR quantity (either cold or hot) can lead to a decrease in specific NO emissions combined with an increase in specific soot emissions. For higher PES rates (50% and 80%), the NO–soot trade-off is slightly superior (i.e., lower NO and soot emissions) for hot EGR than cold EGR, while the opposite is observed for the 30% PES rate. By observing the diagram below, it can be concluded that engine operation with 10% cold or hot EGR and 80% PES values can result in very low NO and soot emissions.

8. Summary and Conclusions

In the present study, a two-zone phenomenological model was developed in order to study the effect of the EGR temperature (cold and hot) and rate (10% and 20%) on the performance characteristics and emissions of a dual-fuel compression-ignition engine operating at 1500 rpm engine speed and part-load conditions (IMEP = 0.52 Mpa) with different gaseous fuel quantities (30%, 50%, 80% PES rates). The model was validated against experimental data obtained from a single-cylinder direct injection supercharged dual-fuel compression-ignition research engine operating at 1500 rpm and part-load conditions (IMEP = 0.52 Mpa) and at various PES rates (30%, 50%, 60%, 70%, 80%). After the successful validation, the model was used to investigate the effect of different EGR strategies on the performance characteristics and emissions of the engine. From this analysis, the following conclusions were derived:
  • The increase in the cold EGR quantity does not have a significant impact on the mean cylinder pressure and net apparent heat release diagrams compared with NDFO. Thus, the main performance characteristics of the engine are not seriously affected. More specifically, the maximum cylinder pressure is slightly reduced, and the ignition delay period, combustion duration, ISEC, and cylinder exhaust gas temperature are slightly increased. As far as the specific emissions are concerned, the increase in cold EGR results in decreased NO emissions and increased CO and soot emissions compared with NDFO. In particular, when combined with high PES (80%), engine operation with 10% cold EGR can result in very low levels of NO and soot emissions without a serious penalty on engine efficiency and a moderate increase in CO emissions.
  • The increase in hot EGR, on the other hand, seems to have a significant effect on the mean cylinder pressure and the net apparent heat release diagrams compared with NDFO. The mean cylinder pressure becomes higher than NDFO during the compression phase and the initial combustion phase. By observing the net apparent heat release diagram, it is revealed that the flame combustion rate decreases compared to NDFO during the initial stages of flame development. Regarding the main performance characteristics of the engine, it can be concluded that with the increasing EGR quantity, the maximum cylinder pressure increases, which may raise issues regarding the mechanical strength of the engine. Also, the ignition delay is reduced, while the combustion duration of the ISEC and the exhaust gas temperature are increased to higher values than cold EGR. As far as the specific emissions are concerned, the increase in hot EGR leads to a decrease in NO emissions and an increase in CO emissions and soot emissions compared to NDFO. The NO-specific emissions are higher compared to the respective emissions when the engine is operating with cold EGR, while the specific CO and soot emissions are lower.
  • On the whole, it can be concluded that the addition of a 10% quantity of cold EGR in the cylinder charge when the engine is operating at 80% PES can lead to a serious reduction in specific NO and soot levels without any serious effect on the engine efficiency and mechanical strength of the engine. Furthermore, the increase in CO emissions observed can be considered moderate.

Author Contributions

Conceptualization, N.R. and R.P.; methodology, N.R.; validation, N.R.; investigation, N.R.; writing—review and editing, N.R. and R.P.; supervision, R.P. All authors have read and agreed to the published version of the manuscript.

Funding

This research received no external funding.

Data Availability Statement

The data are contained within the article.

Conflicts of Interest

The authors declare no conflicts of interest.

Appendix A

Figure A1. Flow diagram of the model.
Energies 18 00710 g0a1

References

  1. Hountalas, T.D.; Founti, M.; Zannis, T.C. Experimental investigation to assess the performance characteristics of a marine two-stroke dual fuel engine under diesel and natural gas mode. Energies 2023, 16, 3551. [Google Scholar] [CrossRef]
  2. Livaniou, S.; Papadopoulos, G.A. Liquefied natural gas (LNG) as a transitional choice replacing marine conventional fuels (heavy fuel oil/marine diesel oil), towards the era of decarbonisation. Sustainability 2022, 14, 16364. [Google Scholar] [CrossRef]
  3. Arefin, M.A.; Nabi, M.N.; Akram, M.W.; Islam, M.T.; Chowdhury, M.W. A review on liquefied natural gas as fuels for dual fuel engines: Opportunities, challenges and responses. Energies 2020, 13, 6127. [Google Scholar] [CrossRef]
  4. Yusuf, N.; Al-Ansari, T. Current and future role of natural gas supply chains in the transition to a low-carbon hydrogen economy: A comprehensive review on integrated natural gas supply chain optimisation models. Energies 2023, 16, 7672. [Google Scholar] [CrossRef]
  5. Wang, Y.; Wright, L.A. A comparative review of alternative fuels for the maritime sector: Economic, technology, and policy challenges for clean energy implementation. World 2021, 2, 456–481. [Google Scholar] [CrossRef]
  6. Korakianitis, T.; Namasivayam, A.M.; Crookes, R.J. Natural-gas fueled spark-ignition (SI) and compression-ignition (CI) engine performance and emissions. Prog. Energy Combust. Sci. 2011, 37, 89–112. [Google Scholar] [CrossRef]
  7. Chala, G.T.; Abd Aziz, A.R.; Hagos, F.Y. Natural gas engine technologies: Challenges and energy sustainability issue. Energies 2018, 11, 2934. [Google Scholar] [CrossRef]
  8. Cho, H.M.; He, B.Q. Combustion and emission characteristics of a natural gas engine under different operating conditions. Environ. Eng. Res. 2009, 14, 95–101. [Google Scholar] [CrossRef]
  9. Hountalas, D.T.; Papagiannakis, R.G. Theoretical and experimental investigation of a direct injection dual fuel diesel-natural gas engine. In Proceedings of the SAE 2002 World Congress & Exhibition, Detroit, MI, USA, 4–7 March 2002; p. 2002-01–0868. [Google Scholar] [CrossRef]
  10. Karim, G.A. A review of combustion processes in the dual fuel engine—The gas diesel engine. Prog. Energy Combust. Sci. 1980, 6, 277–285. [Google Scholar] [CrossRef]
  11. Guo, H.; Liko, B.; Luque, L.; Littlejohns, J. Combustion performance and unburned hydrocarbon emissions of a natural gas–diesel dual fuel engine at a low load condition. J. Eng. Gas Turbines Power 2018, 140, 112801. [Google Scholar] [CrossRef]
  12. Fakhari, A.H.; Shafaghat, R.; Jahanian, O.; Ezoji, H.; Motallebi Hasankola, S.S. Numerical simulation of natural gas/diesel dual-fuel engine for investigation of performance and emission. J. Therm. Anal. Calorim. 2020, 139, 2455–2464. [Google Scholar] [CrossRef]
  13. Cho, H.M.; He, B.-Q. Spark ignition natural gas engines—A review. Energy Convers. Manag. 2007, 48, 608–618. [Google Scholar] [CrossRef]
  14. Manivannan, A.; Porai, P.T.; Chandrasekaran, S.; Ramprabhu, R. Lean burn natural gas spark ignition engine—An overview. In Proceedings of the 2003 World Congress & Exhibition, Madrid, Spain, 16–20 November 2003; p. 2003-01–0638. [Google Scholar] [CrossRef]
  15. Xiang, L.; Song, E.; Ding, Y. A two-zone combustion model for knocking prediction of marine natural gas SI engines. Energies 2018, 11, 561. [Google Scholar] [CrossRef]
  16. Boretti, A. Numerical analysis of high-pressure direct injection dual-fuel diesel-liquefied natural gas (LNG) engines. Processes 2020, 8, 261. [Google Scholar] [CrossRef]
  17. Yang, R.; Theotokatos, G.; Vassalos, D. CFD modelling and numerical investigation of a large marine two-stroke dual fuel direct injection engine. Ships Offshore Struct. 2022, 17, 1062–1074. [Google Scholar] [CrossRef]
  18. Li, J.; Wang, J.; Liu, T.; Dong, J.; Liu, B.; Wu, C.; Ye, Y.; Wang, H.; Liu, H. An investigation of the influence of gas injection rate shape on high-pressure direct-injection natural gas marine engines. Energies 2019, 12, 2571. [Google Scholar] [CrossRef]
  19. Liu, L.; Liu, S.; Xia, Q.; Liu, B.; Ma, X. Numerical investigation on mixing characteristics and mechanism of natural gas/air in a super-large-bore dual-fuel marine engine. Atmosphere 2022, 13, 1528. [Google Scholar] [CrossRef]
  20. Carlucci, A.P.; Laforgia, D.; Saracino, R.; Toto, G. Combustion and emissions control in diesel–methane dual fuel engines: The effects of methane supply method combined with variable in-cylinder charge bulk motion. Energy Convers. Manag. 2011, 52, 3004–3017. [Google Scholar] [CrossRef]
  21. Yousefi, A.; Guo, H.; Birouk, M. Effect of swirl ratio on NG/diesel dual-fuel combustion at low to high engine load conditions. Appl. Energy 2018, 229, 375–388. [Google Scholar] [CrossRef]
  22. Zhou, H.; Zhao, H.W.; Huang, Y.P.; Wei, J.H.; Peng, Y.H. Effects of injection timing on combustion and emission performance of dual-fuel diesel engine under low to medium load conditions. Energies 2019, 12, 2349. [Google Scholar] [CrossRef]
  23. Pirouzpanah, V.; Saray, R.K. A predictive model for the combustion process in dual fuel engines at part loads using a quasi-dimensional multi-zone model and detailed chemical kinetics mechanism. IJE Trans. B Appl. 2006, 19, 83–98. [Google Scholar]
  24. Papagiannakis, R.G.; Krishnan, S.R.; Rakopoulos, D.C.; Srinivasan, K.K.; Rakopoulos, C.D. A combined experimental and theoretical study of diesel fuel injection timing and gaseous fuel/diesel mass ratio effects on the performance and emissions of natural gas-diesel HDDI engine operating at various loads. Fuel 2017, 202, 675–687. [Google Scholar] [CrossRef]
  25. Alla, G.H.A.; Soliman, H.A.; Badr, O.A.; Rabbo, M.F.A. Effect of pilot fuel quantity on the performance of a dual fuel engine. Energy Convers. Manag. 1999, 41, 559–572. [Google Scholar] [CrossRef]
  26. Papagiannakis, R.G. Study of air inlet preheating and EGR impacts for improving the operation of compression ignition engine running under dual fuel mode. Energy Convers. Manag. 2013, 68, 40–53. [Google Scholar] [CrossRef]
  27. Ishida, M.; Tagai, T.; Ueki, H. Effect of EGR and preheating on natural gas combustion assisted with gas–oil in a diesel engine. JSME Int. J. 2003, 46, 124–130. [Google Scholar] [CrossRef]
  28. Papagiannakis, R.G.; Hountalas, D.T.; Krishnan, S.R.; Srinivasan, K.K.; Rakopoulos, D.C.; Rakopoulos, C.D. Numerical evaluation of the effects of compression ratio and diesel fuel injection timing on the performance and emissions of a fumigated natural gas–diesel dual-fuel engine. J. Energy Eng. 2016, 142, E4015015. [Google Scholar] [CrossRef]
  29. Pirouzpanah, V.; Saray, R.K. Reduction of emissions in an automotive direct injection diesel engine dual-fuelled with natural gas by using variable exhaust gas recirculation. Proc. Inst. Mech. Eng. Part D J. Automob. Eng. 2003, 217, 719–725. [Google Scholar] [CrossRef]
  30. Abdelaal, M.M.; Hegab, A.H. Combustion and emission characteristics of a natural gas-fueled diesel engine with EGR. Energy Convers. Manag. 2012, 64, 301–312. [Google Scholar] [CrossRef]
  31. Papagiannakis, R.G.; Hountalas, D.T. Comparative evaluation of various strategies for improving the characteristics of performance of a pilot ignited natural gas/diesel engine. Procedia-Soc. Behav. Sci. 2012, 48, 3284–3296. [Google Scholar] [CrossRef]
  32. Paykani, A.; Khoshbakhti Saray, R.; Shervani-Tabar, M.T.; Mohammadi-Kousha, A. Effect of exhaust gas recirculation and intake pre-heating on performance and emission characteristics of dual fuel engines at part loads. J. Cent. South Univ. Technol. 2012, 19, 1346–1352. [Google Scholar] [CrossRef]
  33. Qi, Y.; Srinivasan, K.K.; Krishnan, S.R.; Yang, H.; Midkiff, K.C. Effect of hot exhaust gas recirculation on the performance and emissions of an advanced injection low pilot-ignited natural gas engine. Int. J. Engine Res. 2007, 8, 289–303. [Google Scholar] [CrossRef]
  34. De Robbio, R.; Cameretti, M.C.; Mancaruso, E.; Tuccillo, R.; Vaglieco, B.M. CFD Study and Experimental Validation of a Dual Fuel Engine: Effect of Engine Speed. Energies 2021, 14, 4307. [Google Scholar] [CrossRef]
  35. Schiffner, M.; Grochowina, M.; Sattelmayer, T. Development of a numerical model for ignition phenomena in a micro pilot ignited dual fuel engine with external mixture formation. In Proceedings of the ASME Internal Combustion Engine Division Fall Technical Conference, Seattle, WA, USA, 15–18 October 2017; p. V002T06A006. [Google Scholar]
  36. Mancaruso, E.; Vaglieco, B.M. CFD analysis of the combustion process in dual-fuel diesel engines. In SAE Technical Paper 2018-01-0257; SAE: Warrendale, PA, USA, 2018. [Google Scholar]
  37. Seykens, X.L.J. Development and Validation of a Phenomenological Diesel Engine Combustion Model. Ph.D. Dissertation, Technische Universiteit Eindhoven, Eindhoven, The Netherlands, 2010. Available online: https://pure.tue.nl/ws/files/3302351/656995.pdf (accessed on 6 January 2025).
  38. Benson, R.S.; Whitehouse, N.D. Internal Combustion Engines: A Detailed Introduction to the Thermodynamics of Spark and Compression Ignition Engines, Their Design and Development, 1st ed.; Elsevier: Oxford, UK, 2013. [Google Scholar]
  39. Taritaš, I.; Kožarac, D.; Šjerić, M.; Sierra-Aznar, M.; Vuilleumier, D.; Tatschl, R. Development and validation of a quasi-dimensional dual fuel (diesel–natural gas) combustion model. SAE Int. J. Engines 2017, 10, 483–500. [Google Scholar] [CrossRef]
  40. Liu, Z.; Karim, G.A. Simulation of combustion processes in gas-fuelled diesel engines. Proc. Inst. Mech. Eng. A 1997, 211, 111–120. [Google Scholar] [CrossRef]
  41. Rakopoulos, C.D.; Michos, C.N. Availability analysis of a syngas fueled spark ignition engine using a multi-zone combustion model. Energy 2008, 33, 256–271. [Google Scholar] [CrossRef]
  42. Heywood, J.B. Internal Combustion Engine Fundamentals, 1st ed.; McGraw-Hill: New York, NY, USA, 1988. [Google Scholar]
  43. Milojević, S.; Pešić, R. Determination of combustion process model parameters in diesel engine with variable compression ratio. J. Combust. 2018, 2018, 5292837. [Google Scholar] [CrossRef]
  44. Liu, J.; Dumitrescu, C.E. Single and double Wiebe function combustion model for a heavy-duty diesel engine retrofitted to natural-gas spark-ignition. Appl. Energy 2019, 248, 95–103. [Google Scholar] [CrossRef]
  45. Saad, C.; Maroteaux, F.; Millet, J.B.; Aubertin, F. Combustion modeling of a direct injection diesel engine using double Wiebe functions: Application to HiL real-time simulations. In SAE Technical Paper 2011-24-0143; SAE: Warrendale, PA, USA, 2011. [Google Scholar]
  46. Papagiannakis, R.G. Comparative assessment for improvement of performance and exhaust emissions in existing dual-fuel diesel engines. J. Energy Eng. 2018, 144, 04018054. [Google Scholar] [CrossRef]
  47. Raihan, M.S.; Guerry, E.S.; Dwivedi, U.; Srinivasan, K.K.; Krishnan, S.R. Experimental analysis of diesel-ignited methane dual-fuel low-temperature combustion in a single-cylinder diesel engine. J. Energy Eng. 2015, 141, C4014007. [Google Scholar] [CrossRef]
  48. Hiroyasu, H.; Kadota, T.; Arai, M. Development and use of a spray combustion modeling to predict diesel engine efficiency and pollutant emissions: Part 1 combustion modeling. Bull. JSME 1983, 26, 569–575. [Google Scholar] [CrossRef]
  49. Prakash, G.; Ramesh, A.; Shaik, A.B. An approach for estimation of ignition delay in a dual fuel engine. SAE Trans. 1999, 399–405. [Google Scholar] [CrossRef]
  50. Al-Himyary, T.J.; Karim, G.A. A correlation for the burning velocity of methane-air mixtures at high pressures and temperatures. ASME J. Eng. Gas Turbines Power 1987, 109, 439–442. [Google Scholar] [CrossRef]
  51. Ramos, J.I. Internal Combustion Engine Modeling; Hemisphere Publishing Corp: New York, NY, USA, 1989. [Google Scholar]
  52. Krishnan, S.R. Experimental Investigations and Phenomenological Simulation of Combustion in a Low Pilot-Ignited Natural Gas Engine with a Focus on Advanced Injection Timings. Ph.D. Dissertation, University of Alabama, Tuscaloosa, AL, USA, 2005. [Google Scholar]
  53. Johnson, S.L.; Clarke, A.; Fletcher, T.; Hylands, D. A phenomenological approach to dual fuel combustion modelling. Int. Combust. Eng. Div. Fall Tech. Conf. 2012, 55096, 781–791. [Google Scholar]
  54. Tabaczynski, R.J.; Ferguson, C.R.; Radhakrishnan, K. A turbulent entrainment model for spark-ignition engine combustion. SAE Trans. 1977, 2414–2433. [Google Scholar] [CrossRef]
  55. Tabaczynski, R.J.; Trinker, F.H.; Shannon, B.A.S. Further refinement and validation of a turbulent flame propagation model for spark-ignition engines. Combust. Flame 1980, 39, 111–121. [Google Scholar] [CrossRef]
  56. Whitehouse, N.D.; Way, R. Rate of heat release in diesel engines and its correlation with fuel injection data. Proc. Inst. Mech. Eng. Conf. Proc. 1969, 184, 973–996. [Google Scholar] [CrossRef]
  57. Annand, W.J.D. Heat transfer in the cylinders of reciprocating internal combustion engines. Proc. Inst. Mech. Eng. 1963, 177, 973–996. [Google Scholar]
  58. Vickland, C.W.; Strange, F.M.; Bell, R.A.; Starkman, E.S. A consideration of the high temperature thermodynamics of internal combustion engines. SAE Trans. 1962, 70, 785–793. [Google Scholar]
  59. Rakopoulos, C.D.; Rakopoulos, D.C.; Mavropoulos, G.C.; Kosmadakis, G.M. Investigating the EGR rate and temperature impact on diesel engine combustion and emissions under various injection timings and loads by comprehensive two-zone modeling. Energy 2018, 157, 990–1014. [Google Scholar] [CrossRef]
  60. Rakopoulos, C.D.; Rakopoulos, D.C.; Kyritsis, D.C. Development and validation of a comprehensive two-zone model for combustion and emissions formation in a DI diesel engine. Int. J. Energy Res. 2003, 27, 1221–1249. [Google Scholar] [CrossRef]
  61. Stone, R. Introduction to Internal Combustion Engines, 3rd ed.; Macmillan: London, UK, 1999. [Google Scholar]
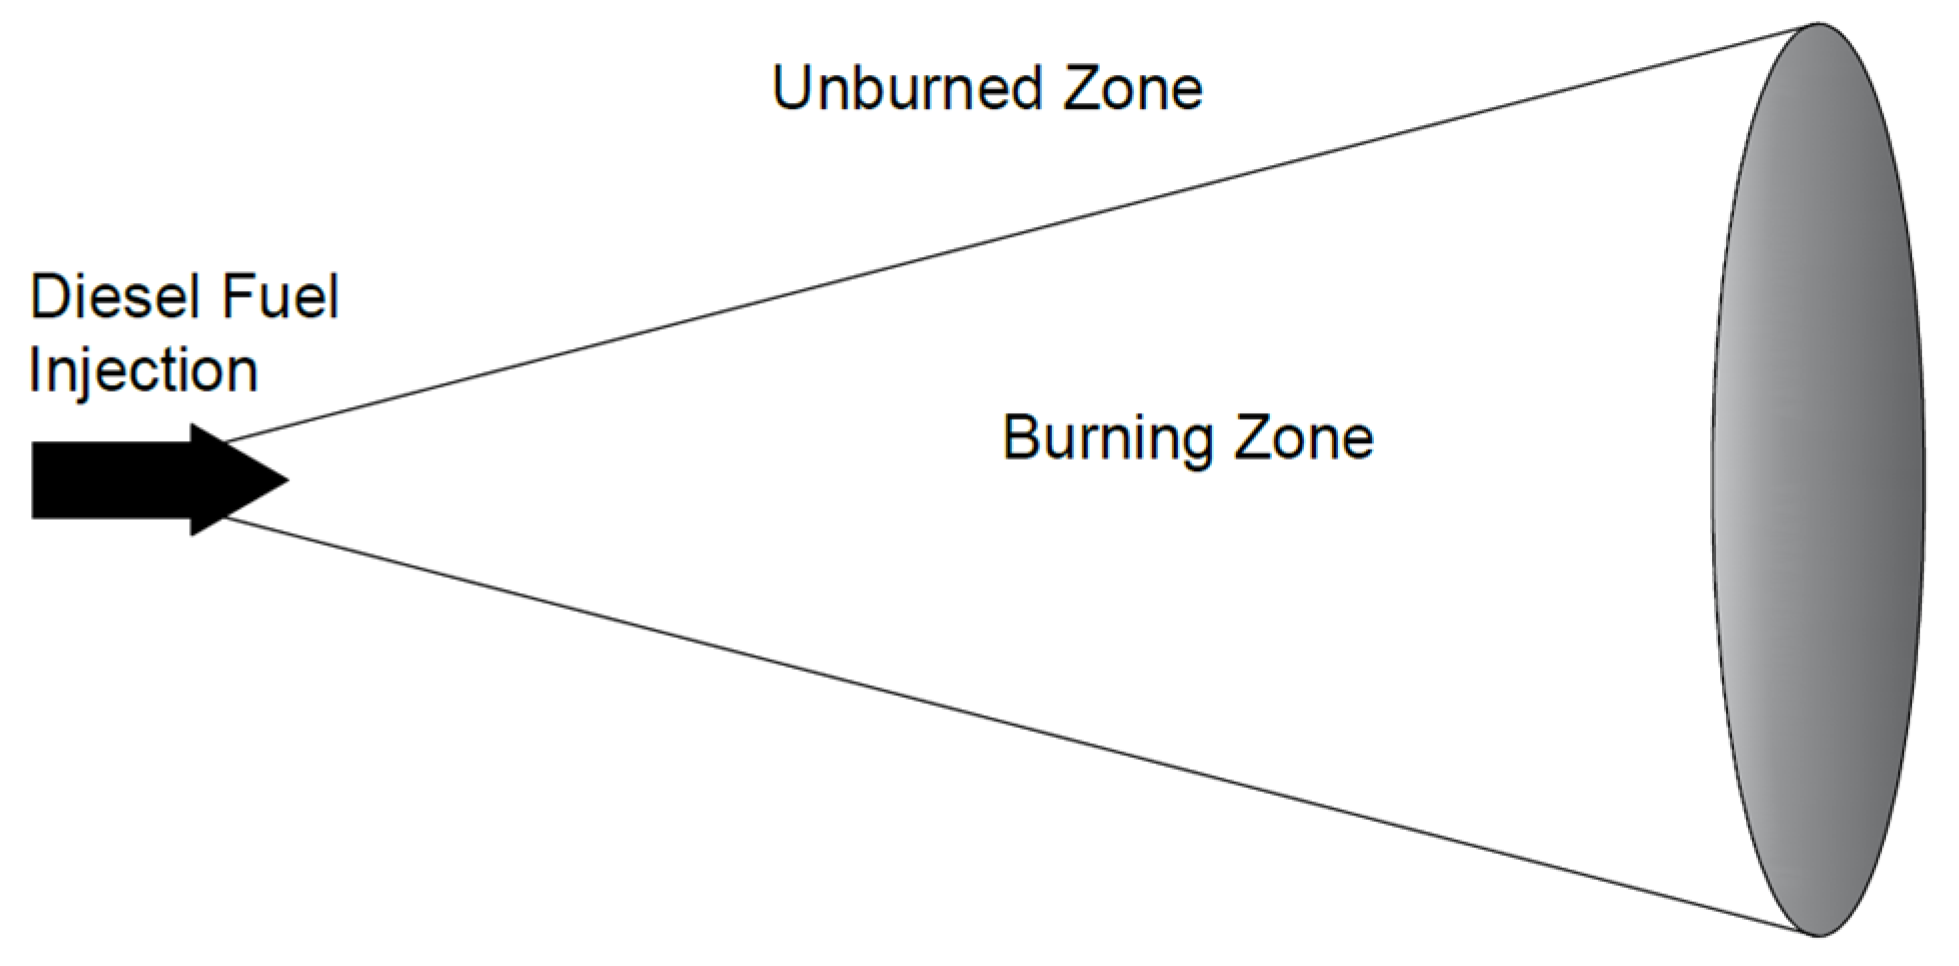
Scheme 1. Definition of burning and unburned zones.
Energies 18 00710 sch001
Scheme 2. Development of flame front before impingement on cylinder wall.
Energies 18 00710 sch002
Scheme 3. Definition of burning zone before initiation of combustion.
Energies 18 00710 sch003
Figure 1. Comparison between experimental and theoretical mean cylinder pressure and traces of net apparent heat release rates during engine operation at an engine speed of 1500 rpm and part-load conditions (IMEP = 0.52 Mpa): (a) PES 30%, (b) PES 50%, (c) PES 60%, (d) PES 70%, and (e) PES 80%.
Energies 18 00710 g001
Figure 2. Comparison between experimental and theoretical IMEP, ISEC, and maximum cylinder pressure during engine operation at the engine speed of 1500 rpm, part-load conditions (IMEP = 0.52 Mpa), and PES from 30% to 80%.
Energies 18 00710 g002
Figure 3. Comparison between experimental and theoretical specific emissions indicated for NO, CO, and soot during engine operation at the engine speed of 1500 rpm, part-load conditions (IMEP = 0.52 Mpa), and PES from 30% to 80%.
Energies 18 00710 g003
Figure 4. Comparison between experimental and theoretical NO—soot trade-off during engine operation at an engine speed of 1500 rpm, part-load conditions (IMEP = 0.52 Mpa), and PES from 30% to 80%.
Energies 18 00710 g004
Figure 5. Calculated pressure trace and apparent net heat release rate during engine operation at 1500 rpm engine speed and part-load conditions (IMEP = 0.52 Mpa), for 10% and 20% of cold and hot EGR at (a) PES = 30%, (b) PES = 50%, and (c) PES = 80%.
Energies 18 00710 g005
Figure 6. (a) Maximum cylinder pressure and (b) ignition delay during engine operation at 1500 rpm engine speed and part-load conditions (IMEP = 0.52 Mpa) for 10% and 20% of cold and hot EGR at PES values equal to 30%, 50%, and 80%.
Energies 18 00710 g006
Figure 7. (a) Duration of combustion and (b) specific energy consumption indicated during engine operation at 1500 rpm engine speed and part-load conditions (IMEP = 0.52 Mpa) for 10% and 20% cold and hot EGR at PES values equal to 30%, 50%, and 80%.
Energies 18 00710 g007
Figure 8. Exhaust gas temperature during engine operation at 1500 rpm engine speed and part-load conditions (IMEP = 0.52 Mpa) for 10% and 20% cold and hot EGR at PES values equal to 30%, 50%, and 80%.
Energies 18 00710 g008
Figure 9. (a) Specific NO emissions and (b) specific CO emissions during engine operation at 1500 rpm engine speed and part-load conditions (IMEP = 0.52 Mpa), for 10% and 20% cold and hot EGR at PES values equal to 30%, 50%, and 80%.
Energies 18 00710 g009
Figure 10. (a) Specific soot emissions and (b) NO–soot trade-off during engine operation at 1500 rpm engine speed and part-load conditions (IMEP = 0.52 Mpa) for 10% and 20% cold and hot EGR at PES values equal to 30%, 50%, and 80%.
Energies 18 00710 g010
Table 1. Main operational and design characteristics of the research engine.
ParameterValue
Engine typeCompression-ignition, turbocharged, direct injection, dual-fuel research engine
Number of cylinders1
Bore0.128 m
Stroke0.142 m
Compression ratio17:1
Number of injector holes8
Injector hole diameter0.197 mm
Connecting rod length0.228 m
Inlet valve opening29 degrees ATDC
Inlet valve closure192 degrees ATDC
Exhaust valve opening546 degrees ATDC
Exhaust valve closure7 degrees ATDC
Table 2. Operational data of the research engine for each PES rate.
ParametersValues
PES [%]3050607080
Engine Speed [rpm]15001500150015001500
Brake Torque [Nm]48.448.548.548.049.1
iPower [kW]11.811.911.911.912.0
IMEP [Mpa]0.520.520.520.520.53
ISEC [MJ/kWh]8.79.710.211.012.2
Injection pressure [Mpa]5050505050
SOI [BTDC deg CA]5.05.05.05.05.0
Pressure at IVC [Mpa]0.1550.1550.1540.1540.154
Temperature at IVC [K]310310310310310
Pmax [Mpa]7.227.187.207.177.11
mair [kg/h]122.1121.0120.8119.9118.8
mD [kg/h]1.71.41.10.90.7
mM [kg/h]0.61.21.51.82.3
φ [−]0.310.330.340.360.39
NO [g/kWh]1.61.21.00.90.8
CO [g/kWh]7.112.915.316.516.4
Soot [g/kWh]0.00008180.00003170.00001690.00001220.0000111
Table 3. EGR test cases examined.
PES 30%PES 50%PES 80%
EGR 10%Hot EGR (487 K)Hot EGR (515 K)Hot EGR (588 K)
Cold EGR (310 K)Cold EGR (310 K)Cold EGR (310 K)
EGR 20%Hot EGR (487 K)Hot EGR (515 K)Hot EGR (588 K)
Cold EGR (310 K)Cold EGR (310 K)Cold EGR (310 K)
Disclaimer/Publisher’s Note: The statements, opinions and data contained in all publications are solely those of the individual author(s) and contributor(s) and not of MDPI and/or the editor(s). MDPI and/or the editor(s) disclaim responsibility for any injury to people or property resulting from any ideas, methods, instructions or products referred to in the content.