Abstract
Policies concerning renewable energy transition are the primary responsibilities of individual states in the United States. This article aims to provide a comprehensive evaluation of state-level renewable energy policies, focusing on identifying key factors driving successful energy transitions and offering actionable insights for policymakers. The research investigates: What are the critical indicators and strategies contributing to an effective renewable energy transition at the state level? To ensure meaningful comparisons, states were selected based on top and bottom performance across various energy parameters, including renewable energy share, solar and wind capacity, electricity costs, and policy adoption (RPS, EERS, and net metering). A rubric, structured around environmental, institutional, social, and techno-economic criteria, was developed to measure policy effectiveness across 15 indicators. Scores for each state were weighted based on their contextual relevance, determined through consultations with energy professionals and the adaptation of existing weighting frameworks. Washington state emerges as the frontrunner, achieving the highest scores for both weighted and unweighted transition performance, closely followed by California. Conversely, Kentucky, Texas, and Florida exhibit the lowest scores. A correlation analysis reveals relationships among performance indicators, such as the impact of stakeholder diversity on energy equity and the link between policy integration and energy demand. This study provides a roadmap for prioritizing renewable policy integration, showing how technology and policy drivers collectively influence the rate of energy transitions. It offers essential insights for shaping state-level renewable energy policies, fostering partnerships, and steering states toward a greener and more resilient energy future.
1. Introduction
An energy transition involves a fundamental shift in how energy is produced and consumed. This transition is driven by technological advancements, resource availability, economic factors, and private and public desire for addressing climate change. A primary goal of this shift is to mitigate global warming, whose impacts—such as altered air and water temperatures, more extreme precipitation events [1], rising sea levels [2], and increasingly intense weather-related disasters [3]—have been evident for decades. The reliance on fossil fuels has significantly increased greenhouse gas concentrations, disrupting ecosystems and threatening human livelihoods [4]. Events like sea level rise and extreme flooding may force communities to relocate. Renewable energy is thus viewed as a crucial strategy for mitigating climate change and its effects.
Renewable electricity comes from sources like wind, solar, hydropower, and geothermal energy. It has been noted that renewable energy has lower social and environmental costs compared to traditional energy sources [5]. It also enhances national security by reducing reliance on imported fuels. The shift from carbon-intensive sources like coal, oil, and gas—known for pollution and safety concerns—to cleaner options like wind and solar is central to the transition.
There are three key strategies that governments can use to boost renewable energy adoption [6]: promoting voluntary actions through education and information, implementing regulatory frameworks at multiple levels, and introducing market mechanisms to make renewables more competitive. As climate change coincides with rising energy demand, various policy tools have emerged to support sustainable energy transitions. A few prominent tools include Renewable Portfolio Standards (RPSs), which mandate a minimum share of renewable energy in power generation [5]; Energy Efficiency Resource Standards, which set reduction targets for energy use [7]; and net metering, allowing consumers to sell excess solar power back to the grid [8].
This study aims to analyze energy transition progress across different U.S. states by evaluating 12 states using a rubric that measures current success and future potential. It examines renewable energy policy implementation across four criteria: environmental, institutional, social, and techno-economic factors. The rationale for selecting only 12 states lies in the need for a manageable yet representative sample that captures a broad spectrum of renewable energy policy successes and challenges. By focusing on top-performing and bottom-performing states across key energy parameters, the study ensures a diverse and balanced analysis while maintaining the depth and rigor necessary for meaningful insights. Regional diversity plays a critical role in renewable energy policy effectiveness, making state-level comparisons valuable. The study’s dynamic approach allows the importance of each criterion to vary, offering a nuanced understanding of the factors driving successful transitions. This methodology provides policymakers with insights into best practices for sustainable energy policies.
Recent studies have applied multi-criteria analysis (MCA) to explore renewable energy deployment in diverse contexts. For instance, MCA has been used to evaluate solar, wind, and bio-energy in Glasgow to meet emission reduction targets [9]. Another study used MCA to identify potential sites for renewable energy projects, considering factors like solar radiation and population density [10]. MCA methods have been combined with the Analytical Hierarchy Process (AHP) and PROMETHEE-II for selecting renewable energy sites in the Red Sea region [11]. Project sustainability and stakeholder engagement were evaluated, with social acceptability becoming a critical factor alongside governmental support [12]. A study in the Tamil Nadu state of India used MCA to evaluate solar energy integration, focusing on technical, economic, and environmental indicators [13]. Similarly, MCA was employed to optimize the region’s energy mix in Greece [14]. MCA has also been combined with life cycle analysis to assess the sustainability of various energy systems [15]. While there are alternative analytical approaches to evaluating Renewable Energy Transition Success, we chose MCA because of its ability to integrate both qualitative and quantitative metrics, reflecting a wide degree of stakeholders’ and technology considerations.
Renewable energy policy success in the U.S., Germany, the U.K., Denmark, and China has been compared using criteria like replicability, feasibility, equity, efficiency, and effectiveness [16]. Recommendations include ensuring affordable energy access, improving energy efficiency, deploying renewable technologies, and advancing new energy innovations. They emphasized the role of feed-in tariffs (or net metering) in accelerating renewable energy deployment.
While energy transition performance varies vastly across the U.S. states, no such comprehensive study is available to evaluate what factors lead to such variation. MCA offers a tailored approach to assess renewable energy policy across U.S. states, using specific criteria related to environmental, social, institutional, and techno-economic contexts. This research provides comparable indicators to facilitate state comparisons and identifies critical factors for successful renewable energy policy implementation, aiding policymakers, energy industries, and community stakeholders in their decision-making efforts. Depending on the stakeholder, the importance of each criterion may vary. For example, if the reader is a government entity, they may prioritize the institutional aspects of renewable energy policy, such as regulatory frameworks and governance. On the other hand, utilities may focus more on the techno-economic aspects, evaluating costs, feasibility, and grid integration. The public will likely emphasize the social aspects, such as equity, job creation, and community impacts. However, the environmental aspect will be universally important for all stakeholders, as it underpins the long-term sustainability of any renewable energy initiative.
The novelty of this research lies in its opportunity to confront some of the crucial questions around the effectiveness of renewable energy policies to reduce climate change in the USA. The country ranks as one of the top emitters of greenhouse gases, therefore the study of the diverse approaches taken by various states to promote renewable energy transition will be crucial to identify approachable and scalable solutions. Additionally, this research tailors a framework with four criteria and 15 indicators to comprehensively evaluate state-level policy performance in the U.S. context. Unlike previous studies, this approach combines both quantitative and qualitative metrics to highlight actionable insights across different aspects of renewable energy policy. The results provide different stakeholders, including the government, industry leaders, and the public, with intricate dynamics, such as the influence of stakeholder diversity on energy equity and policy integration on energy demand, which could promote the development of more equitable and resilient energy policy.
2. Materials and Methods
This study aims to assess the diverse factors influencing the successful implementation of renewable energy policy and energy transitions across different states in the U.S. To address this research problem, we first identify a set of 12 states that would be considered most successful and least successful, based on various aspects, such as their renewable energy production and capacity or the implementation of different energy policies. The key drivers of energy transition success are examined based on different criteria, including policy, technological, and stakeholder factors. This study identifies patterns of renewable energy policy implementation success and provides recommendations for policymakers.
2.1. State Selection
To facilitate policy comparison across states, we chose six top-performing and six bottom-performing states based on different parameters. The energy parameters of interest for the purpose of this study were: solar capacity (potential for solar production on the territory), wind capacity (potential for wind production on the territory), hydroelectric electricity production, share of renewable energy within the electricity mix, electricity consumption per capita, electricity cost, and the presence of three policies—net metering, Renewable Portfolio Standards (RPSs), and Energy Efficiency Resource Standards (EERSs). Each policy’s presence was indicated using a binary system: 1 for presence and 0 for absence. For each parameter, the top three and bottom three states were identified. Random selection using Excel’s Rand between function ensured the unbiased assignment of states to policy presence or absence, generating an initial list of 21 top-performing and 21 bottom-performing states. States that made the top or bottom positions based on multiple energy parameters were automatically chosen. States for any remaining open spots were randomly selected. It is important to note that being top-ranked for some parameters does not necessarily imply overall renewable energy policy success. The purpose of selecting top-performing and bottom-performing states was to analyze the diversity of renewable energy policy approaches and their effectiveness in different contexts. By comparing states with varying performance levels across key energy parameters, this study aims to identify patterns, challenges, and opportunities in renewable energy transitions, offering insights for policy improvement and broader applications.
Information on energy variables was summarized (Table 1) and used as the basis for which states were selected for this research. California and Texas had the highest solar and wind capacities, while North Dakota and South Dakota had the lowest solar capacity; Florida, Kentucky, and Louisiana showed minimal wind capacity. In terms of hydroelectric production, Washington and California ranked very high, while Delaware and Hawaii ranked very low. South Dakota (80.51%) and Idaho (76.08%) boasted the highest shares of renewable energy, whereas Delaware (2.52%) and Louisiana (3.33%) fell behind. Louisiana and Washington offered the lowest average retail electricity prices at 7.51 and 8.33 cents per kWh, respectively, while Hawaii and Alaska had the highest rates at 27.55 and 19.82 cents per kWh. North Dakota (3.57 MWh/person/year) and Louisiana (5.23 MWh/person/year) reported the lowest per capita energy use, whereas Hawaii (16.54 MWh/person/year) and California (15.80 MWh/person/year) had the highest. Regarding policy adoption, only California, Delaware, and Washington had implemented all three policies (RPSs, EERSs, and net metering), while Kentucky and Louisiana lacked any.

Table 1.
Summary of energy statistics for sample states, 2020.
2.2. Rubric Creation
Following various studies (see Criteria and Indicators Section), a rubric was structured around four primary performance criteria: environmental, institutional, social, and technical-economic, designed to encompass multiple aspects of the electricity system. Each criterion comprised several indicators. The performance of each indicator was measured on a scale of 1 to 4, where 4 = excellent, 3 = very good, 2 = moderate, and 1 = poor. After rating all indicators, the points were tallied to derive an overall performance score for each state. These scores were further broken down into four criteria to assess performance within each category. With the overall scores determined, states could be ranked from best to worst in terms of their integration of renewable energy policies and efficiency measures. The aim of developing this rubric was to create a standardized and comprehensive framework for the performance analysis of renewable energy policy across states. With a nuanced understanding of all the dimensions of energy policy and the creation of a ranking system, the strengths and weaknesses of renewable energy policy implementation in multiple states can be assessed and used as knowledge by policymakers.
Criteria and Indicators
The selection of criteria for evaluating renewable energy policies was based on environmental, institutional, social, and techno-economic aspects, summarized below:
Environmental Criteria:
- Renewable Energy Diversity: Assesses the availability of natural resources suitable for renewable energy production, factoring in weather patterns, biofuel resources, and water access for hydropower [29].
- Share of Renewable Energy in the Electricity Mix: Evaluates the percentage of electricity generated from renewables in 2020. States scoring above 70% received a score of 4, while those below 30% received a score of 1, indicating the importance of renewable energy transition and its potential for reducing GHG emissions [30].
- Renewable Energy Minimum: Analyzes mandatory or voluntary goals for utilities to produce renewable energy, highlighting the role of Renewable Portfolio Standards in increasing production and reducing GHG emissions [31,32].
Institutional Criteria:
- Government Involvement: Examines the state’s role in engaging stakeholders and developing energy strategies crucial for the energy transition [33].
- Policy Budget, Subsidies, and Loans: Considers funding for renewable energy policies and financial resources available to the public and businesses, influencing future renewable energy roles [34].
- Breadth of Policy and Integration: Measures the presence of multiple renewable energy policies, emphasizing the need for effective combinations to avoid inefficient energy strategies [35].
- Monitoring and Enforcement: Captures mechanisms for performance reporting and penalties to ensure compliance with energy policies, promoting high adherence rates among utilities [36].
Social Criteria:
- Variety of Stakeholders and Their Participation: Assesses collaboration among public, business, and government in energy policy development, ensuring stakeholder inclusion [37].
- Consumer Satisfaction: Measures consumer satisfaction with energy options and rates, noting that some are willing to pay a premium for green power [38].
- Energy Equity: Evaluates reliable electricity access, particularly for marginalized communities facing higher energy costs [39].
Techno-economic Criteria:
- Energy Demand: Analyzes per capita energy demand and efficiency based on 2020 data, with higher scores for lower demand. Projections indicate a 25% increase in demand by 2050 due to population growth and climate change [40].
- Electricity Cost: Evaluates consumer satisfaction regarding electricity costs, with scores reflecting cost thresholds ranging from less than 10 cents to above 20 cents per kWh [41].
- Security of Energy Supply/Imports: Reviews the availability of diverse energy resources for reliability, noting that renewable energy can enhance security [42].
- Grid Modernization: Assesses plans to upgrade grid capacity for better renewable integration, recommending strategies aligned with expected production [43].
- Net Metering: Examines consumers’ ability to resell electricity back to the grid and the associated benefits for decentralized production [44].
2.3. Measurement of Weights
In this research, a weighting process was applied to account for the varying importance of different aspects of renewable energy policy. The initial weights were derived from a study analyzing the potential deployment of renewable technologies [45]. To tailor these weights to the context of the United States, informal consultations and discussions were held with various energy professionals. Their insights were used to refine and adapt the original weights. A detailed explanation of this process and the adjusted weights can be found in Section 3.4.
2.4. Data Collection
Data for each indicator and study were gathered from online sources, including a review of state energy strategy plans where available. These plans provided insights into existing renewable energy policies, funding availability, monitoring and enforcement procedures, stakeholder meetings, and grid modernization efforts. Information about stakeholder participation meetings was also collected from utility websites. Additionally, news articles were used to gather details on electricity blackouts and overall consumer satisfaction. Quantitative data, such as electricity costs, per capita usage, and the share of renewable energy in the electricity mix, was sourced from the Environmental Information Agency and the U.S. Census Bureau. While this research relied primarily on qualitative information, efforts were made to convert these details into measurable indicators. Given the potential for unconscious bias when processing qualitative data, caution is advised when interpreting state-level results, especially when performance scores between states are close. Data sources for each indicator and state are detailed in the Results section.
2.5. Determinants of Energy Transition Success
Defining policy success is a complex and potentially biased process. While many studies have explored the success of renewable energy technology implementation [46,47,48], comprehensive analyses of overall policy success in the USA remain limited. Success in the environmental dimension is defined by the availability of renewable energy potential, the current share of renewable energy in the electricity mix, and the implementation of a renewable portfolio standard. However, a state may possess significant renewable resources and supportive policies yet fail to achieve the desired ecological outcomes due to stakeholder non-participation. The institutional criterion focuses on effective governance structures, regulatory frameworks, financial opportunities, and administrative capacities that support policy implementation and compliance. Success hinges on fostering collaboration and trust among diverse participants. The social criterion evaluates policies’ impact on equity and public access to green power purchase programs, measuring how well they promote social cohesion and address the needs of various groups to ensure broad-based support and participation. Finally, the techno-economic dimension considers electricity costs, energy supply security from local renewables and imports, grid modernization programs, and net metering policies. Success in this area is assessed by states’ ability to optimize electricity costs, ensure a stable energy supply, and implement grid modernization initiatives.
Looking over the different indicators, it became apparent that some of them were collective reflections of successful renewable energy transition, such as Renewable Energy Share, Consumer Satisfaction, Energy Equity, Security of Energy Supply/Imports, and Electricity Cost. These indicators were grouped as Renewable Energy Transition Success (RETS) factors. The rest of the indicators were grouped into three categories: policy drivers (Renewable Energy Minimum, Government Involvement, Policy Budget, Subsidies and Loans, Breadth of Policy and Integration, and monitoring and enforcement), technology factors (grid modernization and net metering), while the last category, stakeholder participation, only included this one indicator. These three broad categories represent drivers of energy transition success. We were interested to see the impact of these drivers on RETS. A regression analysis was performed to assess the relationship between RETS and the three transition drivers, as stated above.
3. Results
3.1. State-Level Energy Policy Initiatives and Outcomes
3.1.1. Alaska
Alaska boasts the fourth-largest crude oil reserve in the nation and ranks third in natural gas withdrawals. Despite this reliance on fossil fuels, the state is making strides in renewable energy, generating 30.78% of its electricity from green sources in 2020, including hydropower, wind, solar, biomass, and biodiesel [49]. To further this progress, Governor Mike Dunleavy introduced a bill in February 2022 mandating electric companies to increase renewable electricity production to 80% by 2040 [50].
The Alaska Energy Pathway, established through House Bill 306 in 2009 and supported by Senate Bill 220 in 2010, provides a framework for achieving renewable energy goals [51]. Recent legislative efforts, such as House Bill 301 and Senate Bill 179, demonstrate the state’s commitment to updating renewable energy policies [50]. Additionally, initiatives like the Renewable Energy Grant Fund, property tax incentives, and rebate programs support renewable energy adoption and investment.
Alaska encourages public involvement in energy policy through webinars, board meetings, and strategic planning workshops, ensuring diverse stakeholder input [52,53]. However, the lack of green power purchase options limits consumer choice in transitioning to renewable electricity. High electricity rates pose challenges for low-income households, exacerbated by extreme weather conditions, though programs like the Alaska Renewable Energy Fund and Power Cost Equalization Program provide assistance [54,55].
Alaska’s per capita electricity consumption in 2020 was 12.39 MW per person per year, with electricity costs averaging $19.82/kWh, considered medium-high [17]. Despite a significant share of renewable energy, the state remains dependent on fossil fuels, with vulnerabilities in its interconnected grid system [56]. However, Alaska’s extensive microgrid infrastructure and focus on grid modernization projects, supported by funding initiatives, enhance resilience and facilitate renewable energy integration [54]. Net metering policies provide incentives for renewable energy adoption, though rates remain low [57,58].
3.1.2. California
California stands out for its diverse mix of renewable resources and abundant fossil fuel reserves, particularly crude oil. As the fourth-largest electricity producer in the USA, California generated approximately 5% of the nation’s electricity in 2021 [18]. The state leads in geothermal and biomass energy production and ranks second in hydropower. With 42.59% of its electricity derived from renewables in 2020, California has implemented various energy policies aimed at achieving an energy transition [59]. Notably, the Renewable Portfolio Standard (RPS) mandates 100% carbon-free electricity by 2045, focusing on solar, wind, geothermal, small hydroelectric, and biopower facilities [60]. The RPS excludes large hydroelectric dams and nuclear facilities from its carbon-free selection. Renewable Energy Credits (RECs) incentivize RPS-eligible electricity production, with a target of 60% by 2030 and 100% by 2045.
Since the 1990s, California has been at the forefront of renewable energy policy implementation [61]. The California Public Utilities Commission (CPUC) initiated efforts in 1994 to restructure the electricity sector, supporting renewables and green technologies. The Energy Policy Act of 1992 allocated tax credits to renewable electricity production [62]. The California Energy Commission oversees the state’s energy strategy, with regulations in place for building efficiency, RPSs, and emergency planning. Tax breaks for renewable technologies, such as solar power, are available, along with federal and state incentives and rebates for solar installations and energy-efficient upgrades [63]. The state enforces Renewable Energy Standards, Energy Efficiency Resource Standards, and net metering policies, with penalties for non-compliance.
California’s Intergovernmental Renewable Energy Task Force fosters collaboration among federal, state, local, and Tribal governments on renewable energy initiatives [64]. Programs like Microgrid Projects prioritize community resilience and stakeholder involvement [65]. Utilities offer green energy options, and since 2015, customers can choose their electricity sources [66]. Energy equity indicators and tracking reports monitor progress, although disparities persist in blackout frequency and electricity costs, particularly affecting low-income communities [67].
In 2020, California had a per capita electricity consumption of 15.8 MW per person and an electricity cost of 18 cents per kWh, ranking high in consumption and medium-high in cost [59]. Despite diverse energy sources, renewables constitute less than half of the mix, but the state aims for a significant increase. Grid modernization efforts and microgrid projects address reliability concerns, especially during wildfires [68]. Net metering programs incentivize renewable energy adoption, allowing customers to sell surplus electricity back to the grid [69].
3.1.3. Delaware
Natural gas dominates Delaware’s energy landscape, comprising 92% of its electricity generation in 2020, with approximately half of households utilizing it for heating [70]. Despite this, the state has renewable energy potential, with solar power, biomass, and wind energy contributing to around 2% of the electricity mix in 2020. Delaware aims to increase its renewable energy share to 40% by 2035 through its Renewable Portfolio Standard implemented in 2005 [71].
The Delaware Energy Office, under the Department of Natural Resources and Environmental Control, oversees the Green Energy Program, funded by the Delmarva Power Green Energy Fund, to promote renewable energy adoption [72]. The state’s Climate Action Plan, developed with input from multiple agencies and stakeholders, addresses climate resilience and mitigation strategies [71]. Tax incentives, rebate programs, and utility-funded initiatives support renewable energy investments.
Delaware encourages public participation in energy policy through workshops, council meetings, and accessible materials [73,74,75]. While there’s no statewide option for purchasing electricity from renewable sources, consumers can choose their electricity supplier, with some offering higher renewable energy content. Initiatives like the Delaware Empowerment Grant and Energize Delaware Energy Equity Fund aim to provide clean energy access to low-income households through grants and discounted solar panel programs (Energize Delaware, Cape Gazette).
In 2020, Delaware’s per capita energy consumption was 8.9 MW per person per year, with electricity costing an average of 10.24 cents per kWh, ranking medium in cost [19]. The state remains heavily reliant on natural gas, but efforts are underway to modernize the grid and diversify the energy mix. Delaware ranks 5th in the grid modernization index, with prioritized feeder upgrades contributing to a 53% reduction in outages over the past decade [76,77].
3.1.4. Florida
Florida heavily relies on natural gas for its energy needs, constituting 75% of its electricity mix in 2020 [78]. While the state possesses resources for solar, biomass, and hydropower generation, renewables only accounted for 4.29% of the electricity mix in 2020. Notably, Florida lacks a Renewable Portfolio Standard (RPS) to guide renewable energy adoption.
The former State Agriculture Commissioner (2019–2023) had set a goal of achieving 100% renewable energy by 2050, but no clear strategy or enforcement mechanisms are in place to accomplish this [79]. Florida’s energy and climate plan lacks concrete initiatives and timelines. The enforcement of energy policies remains absent.
Public access to documents such as the Florida Energy and Climate Plan is available, but stakeholder engagement, particularly with the public, appears limited. Utilities often have the upper hand in policies like net metering. While some utilities offer green pricing, it is not mandated statewide. The establishment of an energy equity task force signals a growing focus on equitable energy access, particularly given the medium cost of energy, which burdens low-income households [80].
In 2020, Florida’s per capita electricity consumption was 8.88 MW, with an average electricity cost of 10.06 cents per kWh, considered medium [78]. Renewable energy utilization remains low, with fossil fuels, particularly natural gas, dominating the energy mix. While the grid is interconnected, statewide grid modernization efforts are lacking, though utilities have invested in improving reliability, especially in light of natural disasters like hurricanes [81]. Despite the presence of net metering, utilities’ efforts to monopolize electricity production threaten its efficacy, highlighting the need for statewide regulations to ensure fair access to renewable energy.
3.1.5. Hawaii
With its 137 islands, 5 counties, and 1.42 million people, Hawaii faces the challenge of ensuring a stable energy supply. Currently, petroleum remains the primary source of electricity generation, with 444,000 MWh generated in February 2022, compared to 111,000 MWh from nonhydroelectric renewables [82]. Although there has been a gradual decrease in petroleum-fired electricity, Hawaii’s geographical location complicates efforts to reduce dependence on fossil fuels. Despite this, the state boasts a range of renewable energy sources, including solar, wind, geothermal, biomass, and hydroelectric, although they accounted for only 15.87% of electricity production in 2020 [21]. However, Hawaii is committed to reaching its Renewable Portfolio Standard (RPS) goal of 100% renewable electricity by 2045, steadily increasing its share of renewables to meet this target.
Hawaii operates a State Energy Office, responsible for implementing initiatives such as the Hawaiian Clean Energy Initiative [83], launched in 2008 to transition from oil-based electricity to renewables. While there’s a clear commitment to this transition, monitoring and enforcement guidelines are lacking. Energy security funds support Hawaii’s energy transition, alongside tax credits for multifamily residential and commercial properties with solar or wind systems [84]. Loan programs, permit processing priority, and feed-in tariff incentives further promote energy efficiency measures. Hawaii has set ambitious energy targets, including a 40% energy efficiency standard by 2040, a 100% RPS by 2045, and net metering, with penalties for non-compliance and public access to compliance reports [85].
Community engagement is emphasized, with stakeholders encouraged to participate in meetings and provide feedback, facilitating communication between utilities and the public. Programs like the GEM$ program by HGIA enable low-income communities to access clean energy through public–private contributions [86]. While electricity costs are high, programs are available for lower-income households [87]
Hawaii’s per capita energy consumption was 16.54 MW per person per year in 2020, with electricity costs at 72.55 cents per kWh, considered high [82]. Despite abundant renewable resources, the state remains heavily reliant on fossil fuels, with an unconnected grid. Integrated Grid Planning focuses on grid modernization, aiming to incorporate more renewables and manage excess inflow. Net Energy Metering Plus and Customer Grid-Supply Plus programs offer opportunities for consumers to utilize and even sell their own electricity, albeit at avoided-cost rates.
3.1.6. Idaho
Idaho stands out as a leader in renewable electricity, with 76% of its 2020 electricity sourced from renewables, primarily hydroelectric power [88]. Geothermal, solar, biomass, and wind also contribute. Despite natural gas being the most consumed energy resource, the state prioritizes renewables. While lacking a Renewable Portfolio Standard (RPS), Idaho Power’s “Clean Today, Cleaner Tomorrow” initiative targets 100% clean energy by 2045.
The Idaho Governor’s Office of Energy and Mineral Resources (OEMR) coordinates energy and mineral use, offering public access to energy landscape and security plans [89]. Energy efficiency is promoted across sectors, supported by property tax deductions, sales tax refunds, and low-interest loans. The Idaho Energy Resources Authority (IERA) finances electric generation and transmission projects. However, Idaho lacks mandated RPSs, Energy Efficiency Resource Standards (EERSs), or statewide net metering policies [90].
Idaho Power emphasizes public involvement, regularly engaging stakeholders in Integrated Resource Planning Advisory Committee (IRPAC) meetings every two years. However, community energy equity initiatives are limited, with no state-funded assistance for electricity bill payments [91]. Idaho Power’s “Clean Energy Your Way” program offers renewable energy purchase options but lacks provisions for affordability.
With a per capita electricity consumption of 7.52 MW per person in 2020 and low average electricity costs of 7.99 cents per kWh, Idaho’s energy landscape is stable [88]. Renewable resources are abundant, supplemented by available fossil fuels. Idaho Power plans a smart grid implementation for improved efficiency and reliability. Net metering, primarily offered by Idaho Power, allows credits for excess generation but lacks statewide uniformity and sufficient incentives.
3.1.7. Kentucky
Kentucky is renowned for its significant coal production, hosting one-fifth of all U.S. coal mines. In 2020, coal accounted for 69% of the state’s electricity production [92]. Additionally, Kentucky possesses one oil refinery, representing 1.6% of the nation’s refining capacity, and 22 underground natural gas storage sites [23]. While coal and natural gas dominate energy usage, renewables are minimal, comprising only 8.49% of the state’s electricity mix in 2020, with renewable energy capacity accounting for a mere 0.4% of the national share [23]. Kentucky lacks a statewide RPS or renewable energy goal; however, cities like Louisville have adopted resolutions for 100% clean energy by specific deadlines [93].
The Office of Energy Policy oversees Kentucky’s energy programs, with the Kentucky E3 initiative published in 2021 aiming to facilitate energy transitioning [94]. The state provides funding opportunities for entities, requiring reporting obligations and compliance with detailed manuals. Various state programs, including rebate programs for energy-efficient appliances and tax credits for renewable energy facilities, are available [95]. Kentucky lacks an RPS or EERS, thus no monitoring is required, though a net metering policy is in place [96].
Public participation is integral to Kentucky’s environmental program, though specific energy-related public notices are scarce [97]. Residents lack the option to purchase electricity from renewable resources. Despite being part of equity-focused clean energy programs, in-state initiatives for energy equity are lacking [98]. Low-income neighborhoods face electricity cost burdens and blackout risks, exacerbated by coal mining-related flooding [98].
Kentucky’s per capita electricity consumption in 2020 was 6.28 MW, with moderate efficiency programs like How$martKY in place [23]. Electricity costs were relatively low in 2020 at 8.58 cents per kWh [92]. However, the state’s heavy reliance on fossil fuels necessitates the integration of more renewables, especially as resources deplete [23]. Kentucky is part of interconnected grids, necessitating grid modernization efforts, though timelines for projects like the KY Smart Grid Roadmap remain unclear [99]. Summers and winters witness blackouts, underscoring the need for energy system resilience [23].
3.1.8. Louisiana
Louisiana holds the third position in natural gas production, constituting 9% of the market [100]. Natural gas is the primary energy resource for electricity generation, with nuclear power being the second most utilized. Although the state boasts some renewable energy sources like biomass, hydropower, and solar power, they only contribute around 3% to the electricity mix. In response to Hurricane Katrina, the city of New Orleans has implemented a Renewable and Clean Portfolio Standard with the ambitious target of achieving 100% zero carbon emission resources by 2050 [101].
The State of Louisiana Department of Natural Resources oversees renewable energy initiatives, while the Louisiana Public Service Commission established a renewable energy pilot program in 2010, determining no immediate need for a Renewable Portfolio Standard. However, the Commission has recently published an action plan against climate change, aiming to transition to clean energy [102]. Tax credits, property tax exemptions, and rebate programs incentivize the adoption of renewable energy systems. Despite lacking a mandatory Renewable Portfolio Standard or Energy Efficiency Resource Standard, the state supports voluntary net metering policies without formal monitoring mechanisms.
Louisiana’s Climate Action Plan, developed through public meetings and task force collaboration, outlines strategies and actions to reduce greenhouse gas emissions [103]. Public stakeholder planning and task forces ensure community input and diverse perspectives in decision-making processes. Initiatives like the Climate Initiatives Task Force, comprising members from various sectors, aim to develop policies to mitigate climate change impacts.
Louisiana’s per capita electricity consumption in 2020 was 5.23 MW per person, with electricity costs averaging 7.51 cents per kWh, categorized as low [100]. Fossil fuels, particularly oil, dominate the energy landscape, with minimal renewable integration. The connected grid infrastructure facilitates electricity flow, although increasing blackouts pose challenges. Net metering policies, previously mandated by law until 2019, require utilities to purchase all energy produced by solar panels at the avoided cost rate, promoting renewable energy adoption. However, comprehensive grid modernization plans are lacking, with utilities focusing on reactive maintenance rather than proactive upgrades.
3.1.9. North Dakota
North Dakota ranks third in crude oil production and boasts significant bio-ethanol production [104]. Coal accounts for over 50% of electricity generation due to abundant lignite reserves, while wind power contributes 34%. Despite the potential for renewable sources like wind, hydropower, geothermal, and solar, renewables only make up 38.14% of the electricity mix. The state’s Renewable Portfolio Standard (RPS) aims for 10% renewable energy by 2015, though it is voluntary and measured by megawatt hours with credit trading.
The Empower Energy Strategy, spanning from 2010 to 2025, emphasizes energy sector growth, efficiency, and environmental policies [105]. The Renewable Energy Program, initiated in 2007, provides financial assistance for renewable energy development and co-products. However, North Dakota lacks mandatory RPS goals or energy efficiency standards, relying instead on voluntary initiatives. Net metering is available, but there’s no ongoing tracking as the RPS goal has been met.
The Empower strategy involves stakeholders from various sectors to gather input and build public–private collaboration [106]. Zoom meetings and stakeholder engagements are accessible to involve communities. However, options for purchasing renewable energy are limited, though electricity costs are low. Pandemic relief programs like LIHEAP offer one-time payments to low-income households, while the Inflation Reduction Act also aids in energy cost reduction [107].
North Dakota’s per capita electricity use in 2020 was 3.57 MW per person, with an average electricity cost of 8.53 cents per kWh [104], categorized as low. Fossil fuels dominate the market, despite a decent share of renewables. The connected grid allows for electricity imports and exports. Grid reliability reports address the challenges posed by renewable energy development, leading to substantial transmission upgrades like the CapX2020 Minnesota initiative and investments by entities such as Minnkota Power Cooperative. Net metering policies enable compensation for excess generation, mainly for investor-owned utilities, fostering renewable energy adoption.
3.1.10. South Dakota
In 2020, South Dakota made significant strides in renewable energy, generating 83% of its electricity from renewable sources, primarily hydroelectric and wind [26]. Additionally, the state is a major ethanol producer, contributing about 7% of the nation’s fuel ethanol production in 2018. Despite these renewable successes, natural gas and biomass were the primary energy consumption resources in 2020 [108]. South Dakota has maintained a Renewable, Recycled, and Conserved Energy Objective since 2008, aiming for 10% renewable energy by 2015 [109]. While this goal was achieved, the state lacks credit trading systems or compliance mechanisms due to the voluntary nature of the policy.
The South Dakota Department of Agriculture and Natural Resources oversees the state’s energy policy, implementing initiatives like the State Energy Plan funded by the U.S. Department of Energy to enhance energy efficiency and reduce costs [110]. Tax exemptions incentivize the adoption of wind energy for commercial and residential properties, alongside utility loan and rebate programs [111]. While South Dakota lacks a mandatory Energy Efficiency Resource Standard, various energy efficiency programs exist, including the Efficiency Plus Demand Side Management Plan offered by North-Western Energy (2014). Although net metering is absent, rebates on solar panel systems and robust property tax exemptions for solar-equipped homes are available.
Public access to reports on the Renewable, Recycled, and Conserved Energy Objective is limited to information available until 2017, with minimal public engagement in energy policy [110]. However, two utilities—Xcel Energy and Black Hills Energy—offer voluntary green pricing, with Xcel Energy ranking third in green power sales and second in green power customers in 2020 [112]. Despite medium-low electricity costs, occasional blackouts due to extreme weather events highlight vulnerabilities in the state’s energy infrastructure [113].
South Dakota exhibited a per capita energy consumption of 6.98 MW per person in 2020, with electricity costs at 10.06 cents per kWh, deemed medium for this study. The state boasts a diverse range of renewable energy sources alongside available fossil fuels, with a connected grid to other networks. However, concrete plans for grid modernization are lacking, and there’s no statewide law for net metering. Customers can engage local utilities for power purchase agreements, though the benefits may be limited due to additional monitoring equipment costs [114].
3.1.11. Texas
Texas boasts diverse renewable resources, including wind, solar, biomass, hydroelectric, and biofuels [115]. In 2020, renewable energy accounted for 21.84% of the state’s electricity production, supported by the Renewable Generation Requirement enacted in 1999. The state surpassed its renewable energy goals of 5880 MW by 2015 and 10,000 MW by 2025 [116]. However, there are no recent updates on these targets.
Texas lacks an overarching energy strategy, with renewable energy adoption primarily driven by market forces rather than government policy [117]. Despite this, Renewable Energy Credits have successfully increased the share of renewables. Many cities have set goals for 100% clean energy. Utility rebate programs incentivize energy efficiency upgrades for both residential and commercial properties. Tax deductions and incentives for green buildings are widespread, along with grants and loan programs for energy efficiency initiatives [118]. While the state’s RPS has been achieved and not updated, an EERS has been recently updated, encouraging utilities to transition to more energy-efficient systems [119].
The State Energy Plan Advisory Committee lacks public input and diverse representation, potentially excluding voices from the renewable energy industry [120]. Most Texas residents can choose their electricity source through utility programs, with varying renewable energy incorporation rates [121]. Research suggests that minority and lower-income communities face higher blackout risks and energy costs [122].
Texas’ per capita electricity consumption in 2020 was 6.83 MW, with an average retail price of 8.36 $/kWh, considered low [115]. However, the state’s grid isolation has led to major blackouts, such as those during the February 2021 winter storm, resulting in significant human and economic losses [123]. Grid improvement proposals have been filed to address these issues, but net metering remains inconsistent across utilities [124].
3.1.12. Washington
Washington boasts the highest hydropower-generated electricity in the nation, contributing to 27% of the U.S. utility-scale hydropower electricity in 2020 [125]. Hydropower constitutes approximately 77% of the state’s annual energy production [125]. Moreover, renewable energy accounted for 75% of the state’s electricity sector in 2020, with over 100 out of 133 electric power plants dedicated to renewable energy. The state’s renewable resources include hydropower, wind power, biomass, solar power, and biogas/biofuel. Washington established the Renewable Energy Standard (Energy Independence Act) in 2006, aiming for 15% renewable energy by 2020, GHG neutrality by 2030, and 100% renewable or zero-emission energy by 2045 [93].
The Washington State Energy Office oversees the implementation of federal and regional policies and laws [126]. Notably, Governor Jay Inslee signed the Clean Energy Transformation Act in 2019 to reduce greenhouse gas emissions [127]. The state’s Clean Energy Fund has allocated over $72 million to advance renewable energies, leveraging an additional $128.7 million from partners [128]. Washington’s comprehensive policy framework includes RPSs, EERSs, and net metering, overseen by regulatory bodies like the Utilities and Transportation Commission and State Auditor [129].
Washington emphasizes stakeholder engagement, with diverse workgroups involved in developing energy policies [130,131]. The public has easy access to related documents on the Washington State Legislature website [129]. The state prioritizes public participation and the inclusion of historically marginalized communities in energy strategies [132]. Various counties, like Whatcom County, have established committees to address climate change impacts [133]. Additionally, the state offers green power purchase options and initiatives like the Community Solar Program and Community Energy Efficiency Program to promote energy equity.
Washington’s per capita electricity consumption in 2020 was 9 MWh per year, considered medium for this study’s purposes [125]. The state’s average retail electricity price in 2020 was 8.33 cents per kWh, classified as low cost [28]. With abundant renewable resources, particularly hydropower, and a grid modernization program funded by the Clean Energy Fund, Washington ensures a stable energy supply [134]. The state has mandated net metering for all utility companies since 1998, allowing various technologies such as wind, solar, hydroelectric, and fuel cells to participate [130,131].
3.2. Overall State Score
We determined average performance scores for various criteria across states, along with the overall average score (Table 2). Washington achieved the highest scores, averaging 4.0 in environmental criteria, 4.0 in institutional criteria, 3.67 in social criteria, and 3.80 in techno-economic criteria. California and South Dakota tied for second in the environmental criterion with a score of 3.33, while Kentucky, Florida, and Louisiana scored the lowest at 1.67, below the average of 2.64. In the institutional criterion, California ranked second with a score of 3.75, whereas Kentucky and Florida scored the lowest at 1.5. The social criterion had the lowest overall average score, with California and Delaware at 3.33 in second place, while Kentucky and Texas were at the bottom with 1.67. In the techno-economic criterion, North Dakota and Idaho tied for second, while Alaska and Hawaii scored the lowest at 2.00, making this criterion have the highest overall average score.
Table 2.
State Average Score for Each Indicator.
3.3. Indicator Weights
Lenarczyk et al. (2022) [45] conducted a multi-criteria decision-making analysis to evaluate the potential development of renewable energy technologies in Poland, establishing weights for various criteria that informed our research. Acknowledging the differences in renewable energy policies between Poland and the USA, we consulted with four state representatives and the EIA Macroeconomics and Emissions Team to adjust the indicator weights based on their insights. We summarized our interpretation of their reflection on the priorities that stakeholders attach to various criteria in the context of their selected state, the average weight derived from all inputs, and the original weights (Table 3) [45].
Table 3.
Criteria weights based on consultation with four state representatives and the EIA Macroeconomics and Emissions Team.
Our analysis revealed that the average scores for the environmental and institutional criteria were largely consistent with those from the original study in Poland. However, significant changes occurred in the social and techno-economic criteria based on individual states’ energy policy scenarios. The weight of the social criteria doubled, highlighting the importance of public sentiment toward renewable energy policy. In contrast, the weight of the techno-economic criteria decreased slightly to accommodate this shift but remained the most important criterion in our research.
3.4. Ranking of States Based on Weighted Composite Indices
The weighted average composite scores in percentages are displayed below (Figure 1). It can be observed that Washington obtained the highest overall composite score of 96%, followed by California (81%) and Delaware (76%). Florida (50%), Kentucky (50%), and Texas (56%) are the three lowest-performing states with a composite score. Remarkably, states such as Idaho, South Dakota, North Dakota, and Hawaii, positioned in the middle of the graph, demonstrate closely identical scores. However, the distribution of scores varies across categories, with each state scoring differently in each category.
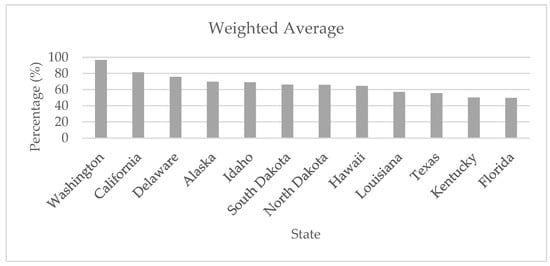
Figure 1.
Weighted average composite scores by state.
The percent success of each state within each category is displayed in Table 4. It is interesting to note the varying degrees of success exhibited by each state within each category. The institutional category emerges as the highest-ranking one, with Washington leading with a perfect score of 100%, followed closely by California with 93.8% and Alaska with 87.5%. This indicates that these high-performing states have established offices dedicated to managing renewable energy policy, along with a range of financial tools to support policy implementation and enforcement. Interestingly, North Dakota and Texas both scored 62.5% while having different approaches to the policy aspect of renewable energy transition: while Texas has no energy plan or strategy, North Dakota has an energy strategy with actions and goals, but the state lacks the implementation of strong policies to achieve these goals. The pivotal role of the state in fostering renewable energy success cannot be overstated, as they oversee fund allocation and policy amalgamation. Florida and Kentucky score the lowest of all states under the institutional category of indicators.
Table 4.
Category-wise performance scores of study States.
In the environmental category, Washington also registers the top spot with a score of 100%, followed by California and South Dakota with 83.3%. This category primarily hinges on the availability of renewable resources within the state’s territory. While some states boast a diverse array of accessible renewables, not all effectively utilize these re-sources. For instance, North Dakota, despite its abundance of resources, falls short in generating sufficient electricity from renewables due to lenient policies like the RPS. The adoption of mandatory renewable energy policies is deemed crucial for bolstering renewable energy production across states. Conversely, states with limited renewable options may excel in integrating a single renewable source into their electricity mix, as exemplified by Idaho where hydropower constitutes 76% of the electricity mix.
Moving on to the techno-economic category, Washington once again leads among the study states with a commendable score of 95%, followed by Idaho and North Dakota, both scoring 85%. This category evaluates the overall functionality of the grid, encompassing factors such as per capita consumption, cost, reliability, and future grid upgrade plans. The grid’s readiness to accommodate increased renewable energy integration amidst rising energy demand and climate change impacts is a critical consideration. Florida and Louisiana scored 70% in this criterion, which represents the highest score for both states compared to other criteria. This is mostly due to the fairly low cost and low per capita electricity demand compared to other states. The impending strain on the electricity grid necessitates comprehensive modernization efforts to mitigate blackout risks, especially during extreme weather conditions. Interestingly, Hawaii and Alaska score the least (i.e., both 50%) in terms of composite techno-economic indices, although they exhibit much better performance under other categories.
Lastly, the social category sees Washington scoring highest with 91.7%, followed by California and Delaware with 83.3%. Analyzing the social aspect of renewable energy policy proves more nuanced, contingent on factors like population size, political views, and education levels. Interestingly, while being different, Louisiana, South Dakota, and Idaho scored the same (66.7%). While South Dakota has green pricing across two utilities, Louisiana only offers one option for its customers. Meanwhile, Idaho provides various subscription plans to its customers to access renewable electricity from their homes. Both Idaho and South Dakota lack any strong energy equity programs, while Louisiana has developed a program for workforce training for green energy jobs. Access to information regarding renewable energy options may vary among states, with some consumers lacking the awareness or resources to opt for renewable energy services. Equitable access to electricity, alongside considerations of affordability and reliability, underscores the need for grid modernization efforts, particularly in underserved communities. The transition from fossil fuel to renewable energy jobs poses socio-economic challenges, necessitating proactive state-led initiatives to facilitate workforce transitions through re-localization and professional training programs. Despite potential opposition from fossil fuel-dependent communities, these transitions are imperative for sustainable energy futures and should be supported by comprehensive state policies and interventions.
Energy Performance Based on Attribute Priorities
Assessing the effectiveness of energy policy requires understanding the significance of each indicator category in achieving overall success. A common method for this is assigning weights to individual indicators, allowing policymakers to prioritize certain criteria and make informed decisions. These weights reflect the collective preferences of stakeholders, which may differ among various groups. Additionally, criteria priorities can vary from state to state. In the following subsections, we will apply different criteria distributions that represent varying policy priorities and demonstrate how these shifts influence the rankings of study states in terms of policy performance.
- Scenario 1: State ranking using equal weights
The equal weight scenario refers to state scoring when all criteria are given equal weights. Figure 2 shows overall state scoring under equal weights.
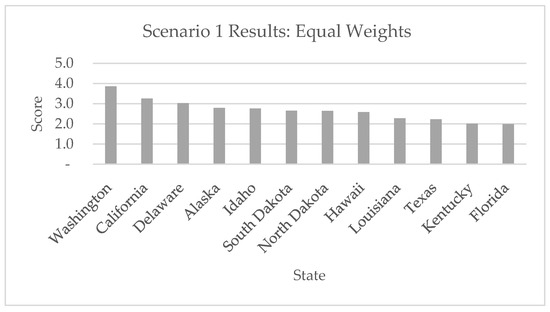
Figure 2.
State policy performance ranking under equal criteria weights.
Washington is the highest-scoring state by far, with a 3.87 out of 4, followed by California (3.25) and Delaware (3.03). Alaska, Idaho, South Dakota, North Dakota, and Hawaii are all in the middle-scoring categories, with very close scores ranging from 2.79 to 2.58. The lowest-scoring states include Louisiana, Texas, Kentucky, and Florida, with scores from 2.28 to 1.99.
- Scenario 2: Ranking based on environmental focus
In this scenario, the environmental criterion is weighted the most, with a 0.4 weight. Keeping the same proportionality of weights of the remaining criteria as the baseline (i.e., weights developed in this study), the institutional criterion is given a weight of 0.17, the social criterion is given a weight of 0.18 and the techno-economic criterion is given a weight of 0.25. Figure 3 shows the overall state scoring based on these revised weights.
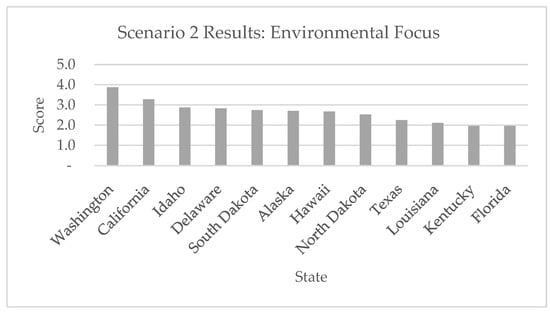
Figure 3.
Scenario 2: Environmental Focus.
Washington maintains the highest score of 3.88, while Florida attained the lowest score of 1.96. Washington’s improved score suggests a robust environmental criterion, evidenced by its significant renewable energy electricity production and strong Renewable Portfolio Standard (RPS). Conversely, Florida’s lower score in this scenario is due to its limited renewable energy electricity production and the absence of an RPS. Other states, including South Dakota, Alaska, Hawaii, and North Dakota scored in the middle region.
- Scenario 3: Ranking based on institutional focus
In this scenario, the institutional criterion is weighted the most, with a 0.4 weight. The rest of the criteria receive weights based on the same proportionality of criteria weights as in the baseline scenario. That is, the environmental criterion receives a weight of 0.22, the social criterion a weight of 0.16, and the techno-economic criterion a weight of 0.22. Figure 4 shows the overall state scoring based on these weights.

Figure 4.
Scenario 3: Institutional Focus.
Washington achieves the highest score of 3.89, i.e., the highest rank across all scenarios, while Florida attains the lowest score of 1.89, the lowest across all scenarios. This underscores the critical role of the institutional criterion in the implementation of renewable energy policy. States like Washington have demonstrated strong governmental involvement in policy development, resulting in the availability of adequate financial resources to support these policies. Moreover, the promotion of a comprehensive set of policies targeting various aspects of renewable energy and energy efficiency, coupled with robust monitoring and enforcement procedures, is crucial. These procedures not only assess performance but also hold accountable those who fail to meet established goals. In contrast, governments in states like Florida or Kentucky exhibit a lack of commitment to renewable energy policy, characterized by the absence of an energy strategy. South Dakota and North Dakota scored in the middle range again, with Idaho and Hawaii.
Scenario 4: Ranking based on social focus
In this scenario, the social criterion was weighted the most, with a 0.4 weight. Like in the previous scenarios, the environmental criterion is given a weight of 0.22, the institutional criterion a weight of 0.16, and the techno-economic criterion a weight of 0.22. Figure 5 shows the overall state scoring based on these weights.
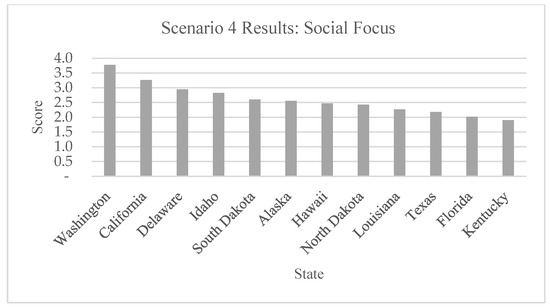
Figure 5.
Scenario 4: Social Focus.
Once again, Washington led with the highest score of 3.77, while Kentucky ranked the lowest with a score of 1.90. Interestingly, the last position switched from Florida to Kentucky, with Florida scoring slightly higher at 2.02. This scenario marked the lowest score for Washington, indicating a need for improvement in this criterion. This suggests that there is room for enhancement not only in Washington but also in other states, such as South Dakota or Hawaii, regarding their social approach to energy transition. North Dakota and South Dakota score in the middle again, with Alaska and Hawaii.
- Scenario 5: Ranking based on techno-economic focus
In this scenario, the techno-economic criterion is weighted the most, with a 0.4 weight. The environmental, institutional, and social criteria receive weights of 0.24, 0.17, and 0.18, respectively. Figure 6 shows the overall state scoring based on these weights.
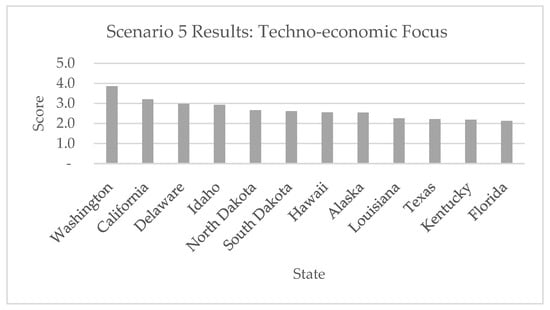
Figure 6.
Scenario 5: Techno-economic Focus.
In this scenario, Washington state achieved a score of 3.86, while Florida attained a score of 2.13, marking the highest score for the latter. Florida’s performance in this scenario can be attributed to its moderate per capita energy demand and affordable electricity costs. The institutional criterion played a pivotal role, as it encompasses the state’s infrastructure. The cost of electricity is influenced by various factors, including demand and the energy sources used for generation. Renewables typically have higher levelized costs due to initial investment, although this is declining with advancements in technology, such as decreasing solar panel prices. North Dakota and South Dakota score in the middle again, with Alaska and Hawaii.
4. Discussion
4.1. States’ Energy Criteria Performance
The study results indicate that state rankings for energy transition performance are sensitive to the policy priorities assigned to various attributes. States like Washington, California, and Idaho benefited from greater emphasis on the environmental criterion, while Florida, Kentucky, and Delaware scored lower despite overall high rankings. Prioritizing environmental criteria encourages states to focus on renewable electricity generation and reduce greenhouse gas emissions from fossil fuels [30]. Implementing a Renewable Portfolio Standard can also enhance renewable electricity shares [31,32]. However, this approach may disadvantage states with limited renewable resources, highlighting the need for complementary grid modernization efforts to address potential load challenges.
Some states prioritized the institutional criterion, emphasizing governmental action’s critical role in renewable energy policy success. While these states may not have achieved high transition success, their strong institutional frameworks position them for future advancements. Governments are responsible for formulating comprehensive policies, strategies, and financial resources to support the transition to renewable energy [135]. Addressing financial challenges is crucial, as renewable energy is often more expensive than conventional sources. Governments must prepare all stakeholders through effective planning, financial support, and robust monitoring mechanisms to facilitate a sustainable energy transition [34]. However, they should be cautious of large, unexpected policy changes that could have negative impacts [136].
The social aspect scored the lowest; improving it requires engaging diverse stakeholders in renewable policy development and ensuring access to information [37]. Public involvement, such as offering consumers renewable energy options, can promote environmentally conscious behavior and incentivize utilities to increase renewable production [38]. Targeted actions are also needed to address energy needs in lower-income areas, reduce energy costs, and enhance participation in the energy transition, thereby establishing a more reliable energy system and reducing blackout incidences in minority neighborhoods. Unfortunately, social aspects are often overlooked in energy policy studies [137].
Energy security is partially linked to the environmental criterion, as states with diverse renewable sources tend to have more secure supplies, especially with storage technology [138]. For example, Idaho scores high due to its diverse renewable mix, unlike Texas, which has limited renewable resources and a closed grid system, restricting import opportunities during outages. Grid reliability is vital during energy transitions, and smart grids are crucial for transitioning electricity systems [139]. Washington has allocated funding to utilities to improve grid infrastructure, while Florida lacks a statewide plan, though utilities are focusing on grid enhancements due to climate change threats.
Net metering can further strengthen renewable energy policies by allowing customers to offset electricity costs through renewable installations and contribute excess energy to the grid, thus reducing reliance on fossil fuels and decentralizing production [44].
Intriguingly, Washington garnered its lowest score under the social focus scenario, which aligns with this category being its weakest aspect (Figure 7). On average, the social category had one of the lowest success rates, at 64.6%. Conversely, the institutional focus scenario garnered the highest score of 97%, despite being the second-lowest scoring criterion when unweighted. This underscores Washington’s robust governmental stance on renewable energy policy. Similarly, California attained the highest score in the institutional focus scenario, with a score of 85%, showcasing strong government involvement.
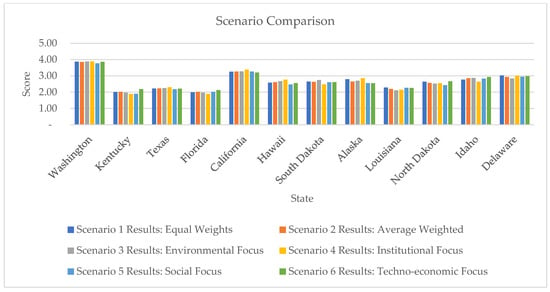
Figure 7.
Scenario comparison.
Conversely, the techno-economic scenario recorded the lowest score, mainly due to high electricity costs (Figure 7). Notably, Delaware, alongside Louisiana, achieved its highest score in the equal-weight scenario. Conversely, the environmental focus scenario garnered the lowest scores, reflecting states producing less than 3% of their electricity from renewable sources.
On average, Kentucky emerged as the lowest-scoring state, with an average score of 50%, followed closely by Florida and Louisiana. Kentucky exhibited the most score variation among these states, while Louisiana demonstrated the least. Alaska displayed the greatest score variation, ranging from 72% (institutional focus scenario) to 64% (techno-economic focus). Conversely, Washington showcased the least score variation, scoring 97 at its highest and 94% at its lowest.
4.2. Renewable Energy Transition Success (RETS)
After attempting alternative formulations of RETS regression, the model presented in Table 5 gave the best results. RETS was expressed in natural log form given the discrete nature of this independent variable.
Table 5.
Estimated regression model of Renewable Energy Transition Success in the USA.
The high adjusted R2 value indicates a high goodness of fit of the model. The estimated model lent strong support to the view that the policy and technology driver variables were the strongest determinants of the Renewable Energy Transition Success. Interestingly, the stakeholder participation variable did not emerge as a significant predictor of RETS. Surprisingly, the coefficient of the policy–technology interaction variable was negative and statistically significant. This only signifies that the relationships between the energy transition success variable and the two enabling drivers are increasing, yet at diminishing rates.
The above model results further validate that states that have implemented robust policy frameworks and invested in advanced technology infrastructure tend to achieve higher transition success. For instance, states like Washington, which excel in both policy formulation and technological innovation, demonstrate high rates of transition success. Conversely, states like Florida and Texas, with comparatively weaker standings in these drivers and factors, show lower levels of success in their renewable energy transitions. It is important to highlight the pivotal role of technology in the success of policy implementation. For example, Thonglek et al. [140] developed a Long Short-Term Memory (LSTM)-based neural network model to predict future solar power generation using historical data and weather forecasts. This model achieved an R² score of approximately 0.78, demonstrating its effectiveness in enhancing the stability and efficiency of solar energy systems by enabling better control over electricity storage in batteries, which would be crucial in the large-scale development of solar power. Additionally, Zatsarinnaya et al. [141] proposed a novel hybrid methodology using Artificial Intelligence (AI) to determine the Maximum Power Point Tracking (MPPT) in solar photovoltaic systems. This approach addresses challenges in solar power generation, including variability and intermittency, by optimizing energy output and improving system reliability.
Nevertheless, our analysis also highlighted exceptions, where certain states managed to achieve notable transition success despite lacking high scores in specific areas. For example, Idaho registered scores a high transition success rate despite relatively lower scores in policy drivers, while South Dakota achieved comparable success despite less emphasis on technology and stakeholder participation.
These findings underscore the pivotal role played by policy frameworks and technological advancements as primary drivers of successful renewable energy transitions. They emphasize the need for states to prioritize strengthening these critical areas to foster an environment conducive to the widespread adoption of renewable energy sources and sustainable energy practices. By doing so, states can position themselves at the forefront of the national energy transition movement, ensuring both environmental sustainability and economic resilience in the face of evolving energy landscapes.
5. Conclusions
Evaluating states’ energy policies is complex due to numerous variables. The comprehensive criteria allow for a thorough assessment, highlighting the importance of public opinion, infrastructure development, and grid reliability. Different weighting scenarios provide insights into the relative importance of each criterion and its impact on overall policy success. Additionally, high correlations were found between transition success factors, policy drivers, and technological factors.
This study analyzed renewable energy policies of twelve U.S. states using fifteen indicators categorized into four criteria: environmental, institutional, social, and techno-economic. Each state was scored for these indicators, allowing for both inter- and intra-state comparisons regarding policy effectiveness. Washington ranked the highest with a 97% success rate, although it scored lower in social and techno-economic criteria. In contrast, Florida had the lowest score at 50%, mainly due to institutional deficiencies. Despite similar overall results, states like South Dakota and North Dakota demonstrated strengths in different areas, with South Dakota excelling in environmental policy and North Dakota in techno-economic aspects.
A significant strength of this study lies in its use of a multi-criteria analysis (MCA) methodology. This approach enables the evaluation of renewable energy policies across multiple dimensions—environmental, institutional, social, and techno-economic. MCA is particularly well-suited for this type of analysis, as it allows for a detailed comparison of states by adjusting the weights assigned to different criteria. This flexibility helps pinpoint specific areas where policy improvements are needed, such as the social aspect, which may not always receive sufficient attention. Other methodologies can be applied, such as the Analytic Hierarchy Process (AHP), however, for the purpose of this study, MCA was preferred for its ability to compare a wide range of indicators, with both quantitative and qualitative data. This allowed a facilitated comparison with diverse stakeholders and provided a clearer comparison between the trade-offs of different criteria.
The goal of this framework is not only to identify why certain states, such as Washington, succeed in renewable energy transitions but also to uncover specific areas of underperformance. By focusing on areas like institutional capacity and technological investments, states can develop targeted strategies to enhance their renewable energy policies. The study demonstrates that technology and policy drivers work in tandem by having not only a direct, positive influence but also a compounding impact on the rate of renewable energy transition. This nuanced approach aids informed decision-making, facilitating a comprehensive assessment of each state’s policy success and promoting effective strategies for advancing renewable energy adoption. Although every state experiences its own set of natural, technological, and economic scenarios, the framework developed in this study allows for a relative assessment of energy transition performance, fostering a valuable exchange of strengths and best practices among states.
Author Contributions
A.F. collected the data, analyzed it, and sorted it. A.F. and M.G.B. developed the indicators and criteria rubric. A.F. performed the correlation analysis. M.G.B. performed the regression for the RETS. T.G.T. reviewed the manuscript and improved readability. All authors read and approved the final manuscript. All authors have read and agreed to the published version of the manuscript.
Funding
This research was funded by the Florida International University Graduate School.
Data Availability Statement
The datasets used and/or analyzed during the current study are available from the corresponding author upon reasonable request due to privacy.
Acknowledgments
This is contribution number #1811 from the Institute of Environment at Florida International University.
Conflicts of Interest
The authors declare no conflicts of interest.
References
- Myhre, G.; Alterskjær, K.; Stjern, C.W.; Hodnebrog, Ø.; Marelle, L.; Samset, B.H.; Sillmann, J.; Schaller, N.; Fischer, E.; Schulz, M.; et al. Frequency of extreme precipitation increases extensively with event rareness under global warming. Sci. Rep. 2019, 9, 16063. [Google Scholar] [CrossRef] [PubMed]
- Shi, W.; Wang, S.; Yang, Q. Climate change and global warming. Rev. Environ. Sci. Biotechnol. 2010, 9, 99–102. [Google Scholar] [CrossRef]
- Christoff, P. Changes in extreme weather. In Four Degrees of Global Warming: Australia in a Hot World; Earthscan/Routledge: London, UK, 2014. [Google Scholar]
- Al-Ghussain, L. Global warming: Review on driving forces and mitigation. Environ. Prog. Sustain. Energy 2019, 38, 13–21. [Google Scholar] [CrossRef]
- Berry, T.; Jaccard, M. The renewable portfolio standard: Design considerations and an implementation survey. Energy Policy 2001, 29, 263–277. [Google Scholar] [CrossRef]
- Espey, S. Renewables portfolio standard: A means for trade with electricity from renewable energy sources? Energy Policy 2001, 29, 557–566. [Google Scholar] [CrossRef]
- Brennan, T.J.; Palmer, K.L. Energy efficiency resource standards: Economics and policy. Util. Policy 2013, 25, 58–68. [Google Scholar] [CrossRef]
- Poullikkas, A.; Kourtis, G.; Hadjipaschalis, I. A review of net metering mechanism for electricity renewable energy sources. Int. J. Energy Environ. Print 2013, 4, 975–1002. [Google Scholar]
- Ahmed, A.; Sutrisno, S.W.; You, S. A two-stage multi-criteria analysis method for planning renewable energy use and carbon saving. Energy 2020, 199, 117475. [Google Scholar] [CrossRef]
- Shao, M.; Han, Z.; Sun, J.; Xiao, C.; Zhang, S.; Zhao, Y. A review of multi-criteria decision making applications for renewable energy site selection. Renew. Energy 2020, 157, 377–403. [Google Scholar] [CrossRef]
- Abdel-Basset, M.; Gamal, A.; Chakrabortty, R.K.; Ryan, M. A new hybrid multi-criteria decision-making approach for location selection of sustainable offshore wind energy stations: A case study. J. Clean. Prod. 2021, 280, 124462. [Google Scholar] [CrossRef]
- Estévez, R.A.; Espinoza, V.; Oliva, R.D.P.; Vásquez-Lavín, F.; Gelcich, S. Multi-criteria decision analysis for renewable energies: Research trends, gaps and the challenge of improving participation. Sustainability 2021, 13, 3515. [Google Scholar] [CrossRef]
- Vishnupriyan, J.; Manoharan, P.S. Multi-criteria decision analysis for renewable energy integration: A southern India focus. Renew. Energy 2018, 121, 474–483. [Google Scholar] [CrossRef]
- Mourmouris, J.C.; Potolias, C. A multi-criteria methodology for energy planning and developing renewable energy sources at a regional level: A case study Thassos, Greece. Energy Policy 2013, 52, 522–530. [Google Scholar] [CrossRef]
- Campos-Guzmán, V.; García-Cáscales, M.S.; Espinosa, N.; Urbina, A. Life Cycle Analysis with Multi-Criteria Decision Making: A review of approaches for the sustainability evaluation of renewable energy technologies. Renew. Sustain. Energy Rev. 2019, 104, 343–365. [Google Scholar] [CrossRef]
- Lu, Y.; Khan, Z.A.; Alvarez-Alvarado, M.S.; Zhang, Y.; Huang, Z.; Imran, M. A critical review of sustainable energy policies for the promotion of renewable energy sources. Sustainability 2020, 12, 5078. [Google Scholar] [CrossRef]
- U.S. Energy Information Administration. Alaska Electricity Profile 2020. State Electricity Profile. 2021. Available online: https://www.eia.gov/electricity/state/archive/2020/alaska/ (accessed on 7 February 2023).
- U.S. Energy Information Administration. California Electricity Profile 2020. State Electricity Profile. 2021. Available online: https://www.eia.gov/electricity/state/archive/2020/california/ (accessed on 7 February 2023).
- U.S. Energy Information Administration. Delaware Electricity Profile 2020. State Electricity Profile. 2021. Available online: https://www.eia.gov/electricity/state/archive/2020/delaware/ (accessed on 7 February 2023).
- U.S. Energy Information Administration. Florida Electricity Profile 2020. State Electricity Profile. 2021. Available online: https://www.eia.gov/electricity/state/archive/2020/florida/ (accessed on 7 February 2023).
- U.S. Energy Information Administration. Hawaii Electricity Profile 2020. State Electricity Profile. 2021. Available online: https://www.eia.gov/electricity/state/archive/2020/hawaii/ (accessed on 7 February 2023).
- U.S. Energy Information Administration. Idaho Electricity Profile 2020. State Electricity Profile. 2021. Available online: https://www.eia.gov/electricity/state/archive/2020/idaho/ (accessed on 7 February 2023).
- U.S. Energy Information Administration. Kentucky Electricity Profile 2020. State Electricity Profile. 2021. Available online: https://www.eia.gov/electricity/state/archive/2020/kentucky/ (accessed on 7 February 2023).
- U.S. Energy Information Administration. Louisiana Electricity Profile 2020. State Electricity Profile. 2021. Available online: https://www.eia.gov/electricity/state/archive/2020/louisiana/ (accessed on 7 February 2023).
- U.S. Energy Information Administration. North Dakota Electricity Profile 2020. State Electricity Profile. 2021. Available online: https://www.eia.gov/electricity/state/archive/2020/northdakota/ (accessed on 7 February 2023).
- U.S. Energy Information Administration. South Dakota Electricity Profile 2020. State Electricity Profile. 2021. Available online: https://www.eia.gov/electricity/state/archive/2020/southdakota/ (accessed on 7 February 2023).
- U.S. Energy Information Administration. Texas Electricity Profile 2020. State Electricity Profile. 2021. Available online: https://www.eia.gov/electricity/state/archive/2020/texas/ (accessed on 7 February 2023).
- U.S. Energy Information Administration. Washington Electricity Profile 2020. State Electricity Profile. 2021. Available online: https://www.eia.gov/electricity/state/archive/2020/washington/ (accessed on 7 February 2023).
- Pavlović, B.; Ivezić, D.; Živković, M. A multi-criteria approach for assessing the potential of renewable energy sources for electricity generation: Case Serbia. Energy Rep. 2021, 7, 8624–8632. [Google Scholar] [CrossRef]
- Lahiani, A.; Mefteh-Wali, S.; Shahbaz, M.; Vo, X.V. Does financial development influence renewable energy consumption to achieve carbon neutrality in the USA? Energy Policy 2021, 158, 112524. [Google Scholar] [CrossRef]
- Li, W.; Lu, C.; Zhang, Y.W. Prospective exploration of future renewable portfolio standard schemes in China via a multi-sector CGE model. Energy Policy 2019, 128, 45–56. [Google Scholar] [CrossRef]
- Liu, D.; Liu, M.; Xu, E.; Pang, B.; Guo, X.; Xiao, B.; Niu, D. Comprehensive effectiveness assessment of renewable energy generation policy: A partial equilibrium analysis in China. Energy Policy 2018, 115, 330–342. [Google Scholar] [CrossRef]
- Rogge, K.S.; Reichardt, K. Policy mixes for sustainability transitions: An extended concept and framework for analysis. Res. Policy 2016, 45, 1620–1633. [Google Scholar] [CrossRef]
- Ahmed, Z.; Cary, M.; Shahbaz, M.; Vo, X.V. Asymmetric nexus between economic policy uncertainty, renewable energy technology budgets, and environmental sustainability: Evidence from the United States. J. Clean. Prod. 2021, 313, 127723. [Google Scholar] [CrossRef]
- Fischer, C.; Preonas, L. Combining policies for renewable energy: Is the whole less than the sum of its parts? Resour. Future Discuss. Pap. 2010, 12, 10–19. [Google Scholar] [CrossRef]
- Sigman, H. Monitoring and enforcement of climate policy. In The Design and Implementation of US Climate Policy; University of Chicago Press: Chicago, IL, USA, 2011; pp. 213–225. [Google Scholar]
- Rountree, V.; Baldwin, E. State-level renewable energy policy implementation: How and why do stakeholders participate? Front. Commun. 2018, 3, 6. [Google Scholar] [CrossRef]
- Knapp, L.; O’Shaughnessy, E.; Heeter, J.; Mills, S.; DeCicco, J.M. Will consumers really pay for green electricity? Comparing stated and revealed preferences for residential programs in the United States. Energy Res. Soc. Sci. 2020, 65, 101457. [Google Scholar] [CrossRef]
- Ross, L.; Drehobl, A.; Stickles, B. The High Cost of Energy in Rural America: Household Energy Burdens and Opportunities for Energy Efficiency; American Council for an Energy Efficient Economy: Washington, DC, USA, 2018. [Google Scholar]
- Van Ruijven, B.J.; De Cian, E.; Sue Wing, I. Amplification of future energy demand growth due to climate change. Nat. Commun. 2019, 10, 2762. [Google Scholar] [CrossRef]
- West, A.; Grijalva, S. Shining light on electrical energy burden: Affordability and equity in rate design. In Proceedings of the 2024 IEEE Texas Power and Energy Conference (TPEC), College Station, TX, USA, 12–13 February 2024. [Google Scholar] [CrossRef]
- Ölz, S.; Sims, R.; Kirchner, N. Contribution of Renewables to Energy Security; OECD/IEA: Paris, France, 2007. [Google Scholar]
- Aguero, J.R.; Takayesu, E.; Novosel, D.; Masiello, R. Modernizing the grid: Challenges and opportunities for a sustainable future. IEEE Power Energy Mag. 2017, 15, 74–83. [Google Scholar] [CrossRef]
- Sunar, N.; Swaminathan, J.M. Net-metered distributed renewable energy: A peril for utilities? Manag. Sci. 2021, 67, 6716–6734. [Google Scholar] [CrossRef]
- Lenarczyk, A.; Jaskólski, M.; Bućko, P. The application of a multi-criteria decision-making for indication of directions of the development of renewable energy sources in the context of energy policy. Energies 2022, 15, 9629. [Google Scholar] [CrossRef]
- Stapleton, G.J. Successful implementation of renewable energy technologies in developing countries. Desalination 2009, 248, 595–602. [Google Scholar] [CrossRef]
- Jeffrey, H.; Sedgwick, J.; Robinson, C. echnology roadmaps: An evaluation of their success in the renewable energy sector. Technol. Forecast. Soc. Change 2013, 80, 1015–1027. [Google Scholar] [CrossRef]
- Mondal, M.A.H.; Kamp, L.M.; Pachova, N.I. Drivers, barriers, and strategies for implementation of renewable energy technologies in rural areas in Bangladesh—An innovation system analysis. Energy Policy 2010, 38, 4626–4634. [Google Scholar] [CrossRef]
- U.S. Energy Information Administration (EIA). Alaska Profile Analysis. 2022. Available online: https://www.eia.gov/state/analysis.php?sid=AK (accessed on 7 February 2023).
- Renewable Energy Alaska Project. A Renewable Portfolio Standard for Alaska. 2023. Available online: https://alaskarenewableenergy.org/a-renewable-portfolio-standard-for-alaska/ (accessed on 28 February 2023).
- Alaska Energy Authority. Alaska Energy Pathway. 2010. Available online: https://www.akenergyauthority.org/Portals/0/Publications%20and%20Resources/2010.07.01%20Alaska%20Energy%20Pathway%20-%20Toward%20Energy%20Independence.pdf?ver=gAeku72zBENTt4s-YVYfgA%3d%3d (accessed on 28 February 2023).
- The Alaska Center. Renewable Portfolio Standards Drive Innovation & Economic Development. 2022. Available online: https://akcenter.org/2022/03/04/rps-drive-economic-development/ (accessed on 28 February 2023).
- Alaska Energy Authority. Board Meetings. 2023. Available online: https://www.akenergyauthority.org/Who-We-Are/Governance/Board-Meeting-Schedule (accessed on 28 February 2023).
- Center for the New Energy Economy. State Brief: Alaska. Colorado State University. 2019. Available online: https://cnee.colostate.edu/wp-content/uploads/2019/08/State-Brief_AK.pdf (accessed on 2 March 2023).
- Alaska Energy Authority. Power Cost Equalization Program Guide. 2019. Available online: https://www.akenergyauthority.org/Portals/0/Programs/Power%20Cost%20Equalization%20(PCE)/Reports%20&%20Publications/PCEProgramGuide100319.pdf (accessed on 2 March 2023).
- Alaska’s News Source. Power Outages Occurring Across Southcentral Alaska. 2022. Available online: https://www.alaskasnewssource.com/2022/01/01/power-outages-occurring-across-southcentral/ (accessed on 2 March 2023).
- Renewable Energy Alaska Project. Net Metering. 2023. Available online: https://alaskarenewableenergy.org/ppf/net-metering/ (accessed on 2 March 2023).
- Spot for Clean Energy. Alaska—Utility Green Power Option. 2023. Available online: https://spotforcleanenergy.org/state/alaska/utility-green-power-option/ (accessed on 28 February 2023).
- U.S. Energy Information Administration (EIA). California Profile Analysis. 2022. Available online: https://www.eia.gov/state/analysis.php?sid=CA (accessed on 7 February 2023).
- California Public Utilities Commission. Renewables Portfolio Standard (RPS) Program. Available online: https://www.cpuc.ca.gov/rps/ (accessed on 28 February 2023).
- Wiser, R.; Pickle, S.; Goldman, C. Renewable energy policy and electricity restructuring: A California case study. Energy Policy 1998, 26, 465–475. [Google Scholar] [CrossRef]
- Morris, G. Biomass Energy Production in California: The Case for a Biomass Policy Initiative; Final Report; No. NREL/SR-570-28805; National Renewable Energy Lab (NREL): Golden, CO, USA, 2000.
- Energy-Grants.net. California Energy Grants. Available online: http://www.energy-grants.net/california-energy-grants-rebates-loans-incentives/ (accessed on 7 February 2023).
- Bureau of Ocean Energy Management (BOEM). California 2022 Task Force Meeting Five. Available online: https://www.boem.gov/renewable-energy/state-activities/california-2022-task-force-meeting-five (accessed on 28 February 2023).
- Pacific Gas and Electric Company (PG&E). Community Microgrid Enablement Program (CMEP). Available online: https://www.pge.com/en_US/safety/emergency-preparedness/natural-disaster/wildfires/community-microgrid-enablement-progam.page (accessed on 28 February 2023).
- Green-e. California Green Tariff Shared Renewables Program Information for Customers. 2023. Available online: https://www.green-e.org/programs/energy/ca-ecr-customers (accessed on 28 February 2023).
- California Energy Commission. Energy Equity Indicators Tracking Progress. 2018. Available online: https://www.energy.ca.gov/sites/default/files/2019-12/energy_equity_indicators_ada.pdf (accessed on 28 February 2023).
- St. John, J. California Stakeholders Weigh in on Blackout Prevention Value of Utility Scale and Behind the Meter Resources. Wood Mackenzie Business. 2020. Available online: https://www.greentechmedia.com/squared/dispatches-from-the-grid-edge/california-ccas-der-providers-weigh-in-on-blackout-prevention-value-of-utility-scale-behind-the-meter-resources (accessed on 28 February 2023).
- California Public Utilities Commission. Energy Efficiency Strategic Plan. Available online: https://www.cpuc.ca.gov/industries-and-topics/electrical-energy/demand-side-management/energy-efficiency/energy-efficiency-strategic-plan (accessed on 28 February 2023).
- U.S. Energy Information Administration (EIA). Delaware Profile Analysis. 2022. Available online: https://www.eia.gov/state/analysis.php?sid=DE (accessed on 7 February 2023).
- Delaware Department of Natural Resources and Environmental Control. (2013–2020). Delaware’s Climate Action Plan: Climate Resilience Actions Summary. Available online: https://documents.dnrec.delaware.gov/energy/Documents/Climate/Plan/Delaware-Climate-Resilience-Actions-Summary.pdf (accessed on 2 March 2023).
- Delaware Public Service Commission. RPS and Green Power Product Compliance. Available online: https://depsc.delaware.gov/rps-and-green-power-product-compliance/ (accessed on 2 March 2023).
- Delaware Department of Natural Resources and Environmental Control. Renewable Energy Assistance. Available online: https://dnrec.alpha.delaware.gov/climate-coastal-energy/renewable/assistance/ (accessed on 2 March 2023).
- Delaware.gov. Energy Tips and Assistance. Available online: https://delaware.gov/guides/energy-tips-and-assistance/ (accessed on 2 March 2023).
- Delaware.gov. Energy Access and Equity Collaborative EEAC Workgroup. Available online: https://dnrec.alpha.delaware.gov/en/events/energy-access-and-equity-collaborative-eeac-workgroup/ (accessed on 2 March 2023).
- Energize Delaware. Empowerment Grant Powered by the Energy Equity Fund. Available online: https://energyequityfund.org (accessed on 2 March 2023).
- Cape Gazette. Energize Delaware Empowerment Grant Awards $95,500 to Applied Energy Group. 2022. Available online: https://www.capegazette.com/article/energize-delaware-empowerment-grant-awards-95500-applied-energy-group/235443 (accessed on 2 March 2023).
- U.S. Energy Information Administration (EIA). Florida Profile Analysis. 2022. Available online: https://www.eia.gov/state/analysis.php?sid=FL (accessed on 7 February 2023).
- Florida Department of Agriculture. Florida Energy and Climate Plan. 2019. Available online: https://www.fdacs.gov/ezs3download/download/89011/2560887/Media/Files/Energy-Files/Florida%20Energy%20and%20Climate%20Plan.pdf (accessed on 28 February 2023).
- Florida Department of Agriculture and Consumer Services. A Study of Energy Equity Within Florida. 2022. Available online: https://www.fdacs.gov/ezs3download/download/106272/2738517/Media/Files/Energy-Files/FDACS-Study-of-Energy-Equity-within-Florida-Final-Report-Web-Version/FDACS-Study-of-Energy-Equity-within-Florida-Final-Report-Web-Version.pdf (accessed on 28 February 2023).
- FPL. FPL Customers See 45% Improvement in Reliability over Last Decade. 2022. Available online: http://newsroom.fpl.com/news-releases?item=126273 (accessed on 28 February 2023).
- U.S. Energy Information Administration (EIA). Hawaii Profile Analysis. 2022. Available online: https://www.eia.gov/state/analysis.php?sid=HI (accessed on 7 February 2023).
- Hawaii State Energy Office. Hawaii Clean Energy Initiative. Available online: https://energy.hawaii.gov/hawaii-clean-energy-initiative/ (accessed on 28 February 2023).
- Energy-Grants.net. Hawaii Energy Grants. Available online: http://www.energy-grants.net/hawaii-energy-grants-rebates-loans-incentives/ (accessed on 7 February 2023).
- State of Hawaii Department of Business, Economic Development & Tourism. Annual Reports & Reports to the Legislature. Available online: http://dbedt.hawaii.gov/overview/annual-reports-reports-to-the-legislature/ (accessed on 28 February 2023).
- Hawaii Green Infrastructure Authority. GEMS. Available online: https://gems.hawaii.gov (accessed on 28 February 2023).
- Hawaii Department of Human Services. Low Income Home Energy Assistance Program (LIHEAP). Available online: https://humanservices.hawaii.gov/bessd/liheap/ (accessed on 28 February 2023).
- U.S. Energy Information Administration (EIA). Idaho Profile Analysis. 2022. Available online: https://www.eia.gov/state/analysis.php?sid=ID (accessed on 7 February 2023).
- Idaho Governor’s Office of Energy and Mineral Resources (OEMR). Available online: https://oemr.idaho.gov (accessed on 10 February 2023).
- Idaho Legislature. Idaho Energy Resources Authority. Available online: https://legislature.idaho.gov/statutesrules/idstat/title67/t67ch89/ (accessed on 12 February 2023).
- Idaho Power. Our Twenty-Year Plan. Available online: https://www.idahopower.com/energy-environment/energy/planning-and-electrical-projects/our-twenty-year-plan/ (accessed on 12 February 2023).
- U.S. Energy Information Administration (EIA). Kentucky Profile Analysis. 2022. Available online: https://www.eia.gov/state/analysis.php?sid=KY (accessed on 7 February 2023).
- Shields, L. Greenhouse Gas Emissions Reduction Targets and Market-Based Policies; NCSL: New Delhi, India, 2021. [Google Scholar]
- Kentucky Office of Energy. KYE3: Designs for a Resilient Economy. 2021. Available online: https://eec.ky.gov/Energy/Documents/KYE3_Final_10.18.2021.pdf (accessed on 7 February 2023).
- Energy-Grants.net. Kentucky Energy Grants. Available online: http://www.energy-grants.net/kentucky-energy-grants-rebates-loans-incentives/ (accessed on 7 February 2023).
- Lane, C. Kentucky Net Metering Changes: Is Coal Stifling the Sun? Solar Reviews. 2022. Available online: https://www.solarreviews.com/blog/kentucky-net-metering-changes-to-affect-solar-customers (accessed on 7 February 2023).
- Kentucky Energy and Environment Cabinet. Kentucky Energy Profile. Available online: https://eec.ky.gov/Energy/News-Publications/Pages/Kentucky-Energy-Profile.aspx (accessed on 7 February 2023).
- Rojas, R.; Flavelle, C.; Robertson, C. How Coal Mining and Years of Neglect Left Kentucky Towns at the Mercy of Flooding. New York Times, 4 August 2022. Available online: https://www.nytimes.com/2022/08/04/us/kentucky-flooding-coal-industry.html (accessed on 7 February 2023).
- Liao, Y.; Turner, M.; Du, Y. Development of a Smart Grid Roadmap for Kentucky. Electr. Power Compon. Syst. 2014, 42, 267–279. [Google Scholar] [CrossRef]
- U.S. Energy Information Administration (EIA). Louisiana Profile Analysis. 2022. Available online: https://www.eia.gov/state/analysis.php?sid=LA (accessed on 7 February 2023).
- NOLA Climate Action. Net Zero by 2050: A Priority List for Climate Action in New Orleans. Available online: https://nola.gov/nola/media/Climate-Action/2022/Net-Zero-by-2050-A-Priority-List-for-Climate-Action-in-New-Orleans.pdf (accessed on 20 February 2023).
- Governor’s Office of Coastal Activities. Louisiana Climate Action Plan. 2022. Available online: https://gov.louisiana.gov/assets/docs/CCI-Task-force/CAP/ClimateActionPlanFinal.pdf (accessed on 2 March 2022).
- Louisiana Office of the Governor. Louisiana Approves First Climate Action Plan in the Gulf South. 2022. Available online: https://gov.louisiana.gov/index.cfm/newsroom/detail/3551 (accessed on 6 March 2023).
- U.S. Energy Information Administration (EIA). North Dakota Profile Analysis. 2022. Available online: https://www.eia.gov/state/analysis.php?sid=ND (accessed on 8 February 2023).
- North Dakota Commerce. Empower ND Commission Meeting/Public Hearing Agenda. 2022. Available online: https://wdeawebsite.blob.core.windows.net/usrfiles/documents/empower%20nd%20commission%20agenda%20may%2011_%202022.pdf (accessed on 6 March 2023).
- Empower. Growing a More Resilient Energy Sector: North Dakota Empower Commission Strategy Development. 2020. Available online: https://ndlegis.gov/files/committees/66-2019/21_5181_02000_100pm_presentation.pdf (accessed on 6 March 2023).
- North Dakota Department of Health and Human Services. (n.d). Low Income Home Energy Assistance Program (LIHEAP). Available online: https://www.hhs.nd.gov/applyforhelp/liheap (accessed on 6 February 2023).
- U.S. Energy Information Administration (EIA). South Dakota Profile Analysis. 2022. Available online: https://www.eia.gov/state/analysis.php?sid=SD (accessed on 7 February 2023).
- South Dakota Public Utilities Commission. South Dakota’s Renewable, Recycled and Conserved Energy Objective Annual Reports. Available online: https://puc.sd.gov/energy/reo/SDakotaRenewableRecycledConservedReport.aspx (accessed on 8 February 2023).
- South Dakota Legislative Research Council. Renewable, Recycled, and Conserved Energy Objective Compliance Report to the South Dakota Public Utilities Commission. 2014. Available online: https://puc.sd.gov/commission/Energy/REO/otp2014.PDF (accessed on 28 February 2023).
- Energy-Grants.net. South Dakota Energy Grants. Available online: http://www.energy-grants.net/south-dakota-energy-grants-rebates-loans-incentives/ (accessed on 7 February 2023).
- National Renewable Energy Laboratory (NREL). Top Ten Utility Green Pricing Programs (2020 Data). 2020. Available online: https://www.nrel.gov/analysis/assets/pdfs/green-pricing-top-10-2020-data-plus-archives.pdf (accessed on 28 February 2023).
- Mitchell, T.J.; Galvan, A. More than 13,000 Without Power in Southeastern South Dakota After Straight-Lined Winds. 2022. Available online: https://news.yahoo.com/more-10-000-without-power-231845821.html?guccounter=1&guce_referrer=aHR0cHM6Ly93d3cuZ29vZ2xlLmNvbS8&guce_referrer_sig=AQAAAM427QvTwogzBCCW-J25pdAzS1Y4Zx4sHec4JdrqifhSDLxS3qQxQSQaS5OSmuFQvLXdNBWziDbRFmcA0aqHdo9wMNkUQFCdWrGmdjYsjQ16W9ow9iIUETHwqplSkg7SJydq4h5baw1rL04HktzsHV5yEG_sBPW1sHl_turMrhXu (accessed on 28 February 2023).
- Basin Electric Power Cooperative. Wind Power Purchase Agreement with Basin Electric Now Commercial. Available online: https://www.basinelectric.com/News-Center/news-briefs/Wind-power-purchase-agreement-with-Basin-Electric-now-commercial (accessed on 28 February 2023).
- U.S. Energy Information Administration (EIA). Texas Profile Analysis. 2022. Available online: https://www.eia.gov/state/analysis.php?sid=TX (accessed on 7 February 2023).
- Public Utility Commission of Texas. Texas Renewable Energy Credits. Available online: https://www.puc.texas.gov/industry/electric/business/rec/rec.aspx (accessed on 7 February 2023).
- Huxley-Reicher, B.; Metzger, L.; Clean Energy Pathways for Texas, Renewable Energy Credits and Other Tools for Local Governments. Frontier Group. 2022. Available online: https://frontiergroup.org/resources/clean-energy-pathways-texas/ (accessed on 28 February 2023).
- Energy-Grants.net. Texas Energy Grants. Available online: http://www.energy-grants.net/texas-energy-grants-rebates-loans-incentives/ (accessed on 7 February 2023).
- State Policy Energy Efficiency Resources (SPEER). Rethinking Texas Investor-Owned Utility (IOU) Energy Efficiency Programs. Available online: https://eepartnership.org/program-areas/policy/history-of-energy-efficiency-programs/ (accessed on 23 February 2023).
- Texas Solar Energy. State Energy Plan Advisory Committee Meeting Puts Renewables on the Chopping Block. 2022. Available online: https://txses.org/state-energy-plan-advisory-committee-meeting-puts-renewables-on-the-chopping-block/ (accessed on 26 February 2023).
- Just Energy. Power to Choose Texas: A Guide for Texas Electricity Rates. Available online: https://justenergy.com/blog/power-to-choose-texas-electricity/ (accessed on 28 February 2023).
- Shepherd, M. Minorities Far More Likely to Have Experienced Blackouts in Texas Winter Storm. Forbes. 2021. Available online: https://www.forbes.com/sites/marshallshepherd/2021/05/24/minorities-far-more-likely-to-have-experienced-blackouts-in-texas-winter-storm/?sh=75c70757fe1b (accessed on 26 February 2023).
- Texas Tribune. Texas Winter Storm Left Millions of People Suffering and Revealed Inequities. 2021. Available online: https://www.texastribune.org/2021/02/19/Texas-winter-storm-suffering-inequities/ (accessed on 18 November 2024).
- Entergy. Entergy Texas Files Proposal to Ensure a Bright Future for Southeast Texas. 2022. Available online: https://www.entergynewsroom.com/news/entergy-texas-files-proposal-ensure-bright-future-for-southeast-texas/ (accessed on 28 February 2023).
- U.S. Energy Information Administration (EIA). Washington Profile Analysis. 2022. Available online: https://www.eia.gov/state/analysis.php?sid=WA (accessed on 6 February 2023).
- Washington State Energy Office. Available online: https://www.commerce.wa.gov/growing-the-economy/energy/washington-state-energy-office/ (accessed on 5 February 2023).
- Zheng, Z.; Cao, J. Small modular reactors competitive in Washington’s clean energy future. Energy Rep. 2021, 7, 34–42. [Google Scholar] [CrossRef]
- Thomas, P. $7 Million in State Clean Energy Fund Grants Advance Microgrid Projects at Avista, SnoPUD.; Washington State Department of Commerce: Washington, DC, USA, 2017. Available online: https://www.commerce.wa.gov/ (accessed on 12 February 2023).
- Washington State Legislature. Washington Clean Energy Transformation Act. Available online: https://app.leg.wa.gov/RCW/default.aspx?cite=19.405&full=true (accessed on 10 February 2023).
- Utilities and Transportation Commission (UTC). Energy Company Advisory Groups. Washington Utilities and Transportation Commission. Available online: https://www.utc.wa.gov/regulated-industries/utilities/energy/energy-company-advisory-groups (accessed on 15 February 2023).
- UTC. Green Power Programs in Washington; Washington Utilities and Transportation Commission: Washington, DC, USA. Available online: https://www.utc.wa.gov/regulated-industries/utilities/energy/conservation-and-renewable-energy-overview/green-power-programs-washington (accessed on 15 February 2023).
- Brown, L. Washington 2021 Energy Strategy; Washington State Department of Commerce: Washington, DC, USA, 2021. Available online: https://www.commerce.wa.gov/wp-content/uploads/2020/12/Washington-2021-State-Energy-Strategy-December-2020.pdf (accessed on 10 February 2023).
- Whatcom County, Washington. Climate Impact Advisory Committee Additional Information; Boards and Commissions: Washington, DC, USA. Available online: https://www.whatcomcounty.us/3162/Meetings-Additional-Information (accessed on 12 February 2023).
- Washington State Department of Commerce. Grid Modernization Plan. Available online: https://www.commerce.wa.gov/growing-the-economy/energy/clean-energy-fund/energy-grid-modernization/ (accessed on 14 February 2023).
- Strielkowski, W.; Civín, L.; Tarkhanova, E.; Tvaronavičienė, M.; Petrenko, Y. Renewable energy in the sustainable development of electrical power sector: A review. Energies 2021, 14, 8240. [Google Scholar] [CrossRef]
- White, W.; Lunnan, A.; Nybakk, E.; Kulisic, B. The role of governments in renewable energy: The importance of policy consistency. Biomass Bioenergy 2013, 57, 97–105. [Google Scholar] [CrossRef]
- Chapman, A.J.; McLellan, B.C.; Tezuka, T. Prioritizing mitigation efforts considering co-benefits, equity, and energy justice: Fossil fuel to renewable energy transition pathways. Appl. Energy 2018, 219, 187–198. [Google Scholar] [CrossRef]
- Johnson, S.C.; Papageorgiou, D.J.; Harper, M.R.; Rhodes, J.D.; Hanson, K.; Webber, M.E. The economic and reliability impacts of grid-scale storage in a high penetration renewable energy system. Adv. Appl. Energy 2021, 3, 100052. [Google Scholar] [CrossRef]
- Akhil, J.; Balachandra, P. Smart grid to energy internet: A systematic review of transitioning electricity systems. IEEE Access 2020, 8, 215787–215805. [Google Scholar] [CrossRef]
- Thonglek, K.; Ichikawa, K.; Yuasa, K.; Babasaki, T. LSTM-based Neural Network Model for Predicting Solar Power Generation. Tech. Comm. Energy Eng. Electron. Commun. IEICE-EE 2021, 121, 7–12. [Google Scholar]
- Zatsarinnaya, Y.; Repev, E.; Shustrova, M. Artificial Intelligence Applications to Solve Solar Power Problems. In Proceedings of the 2021 International Conference on Electrotechnical Complexes and Systems (ICOECS), Ufa, Russia, 16–18 November 2021; pp. 180–184. [Google Scholar]
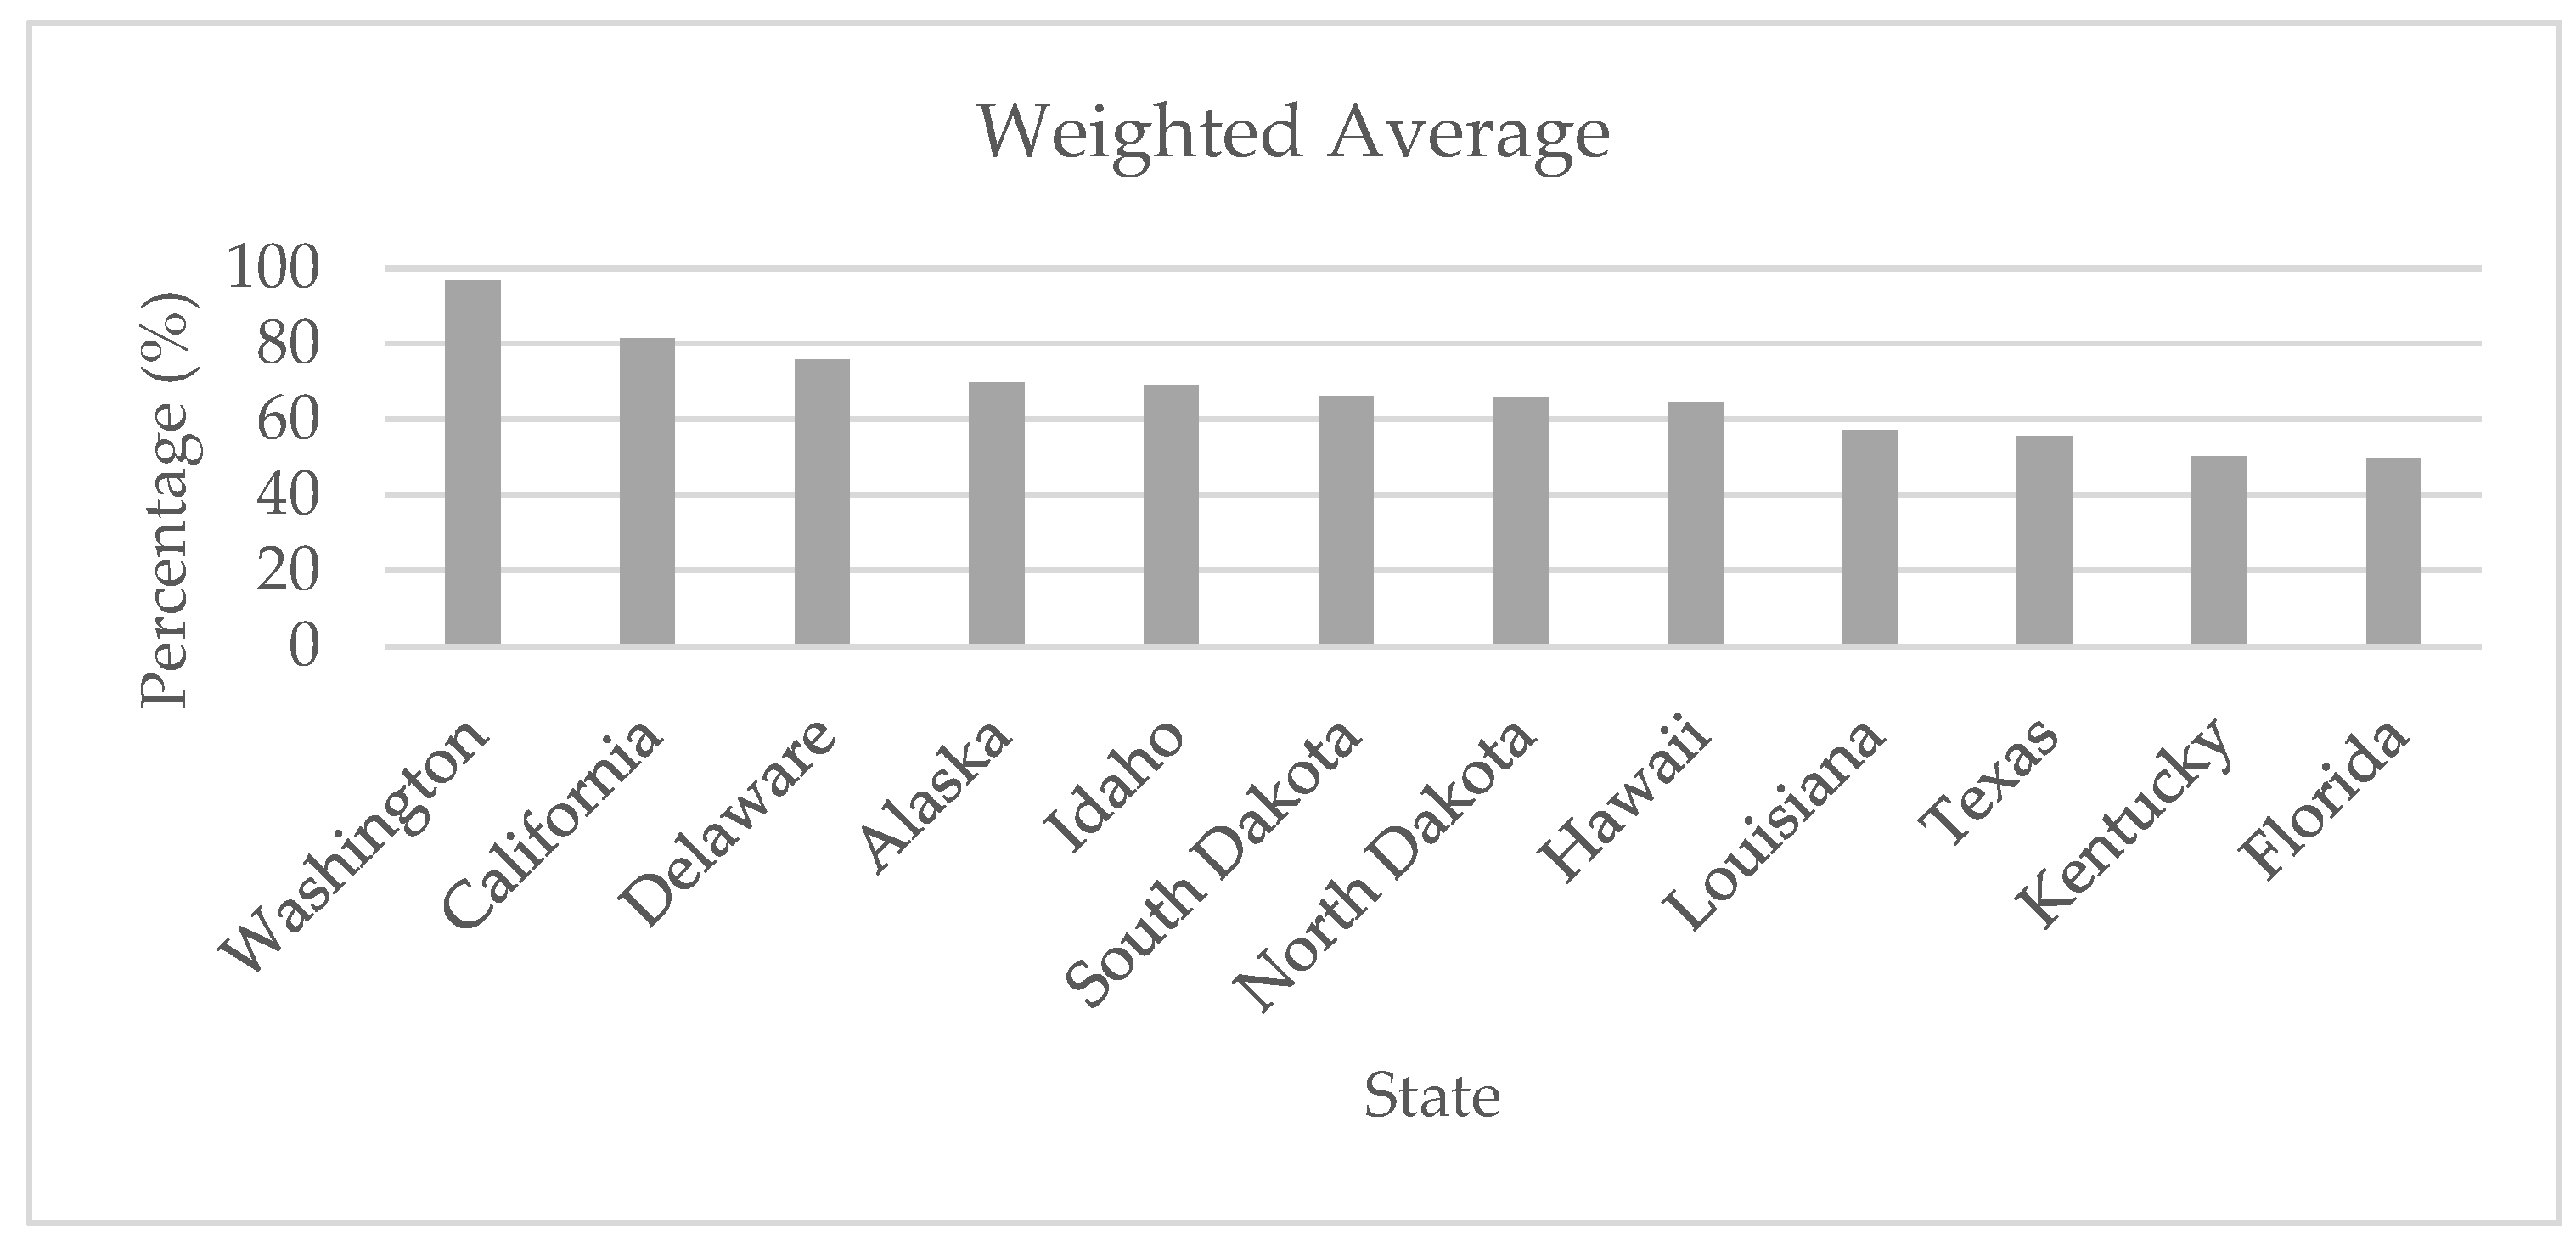

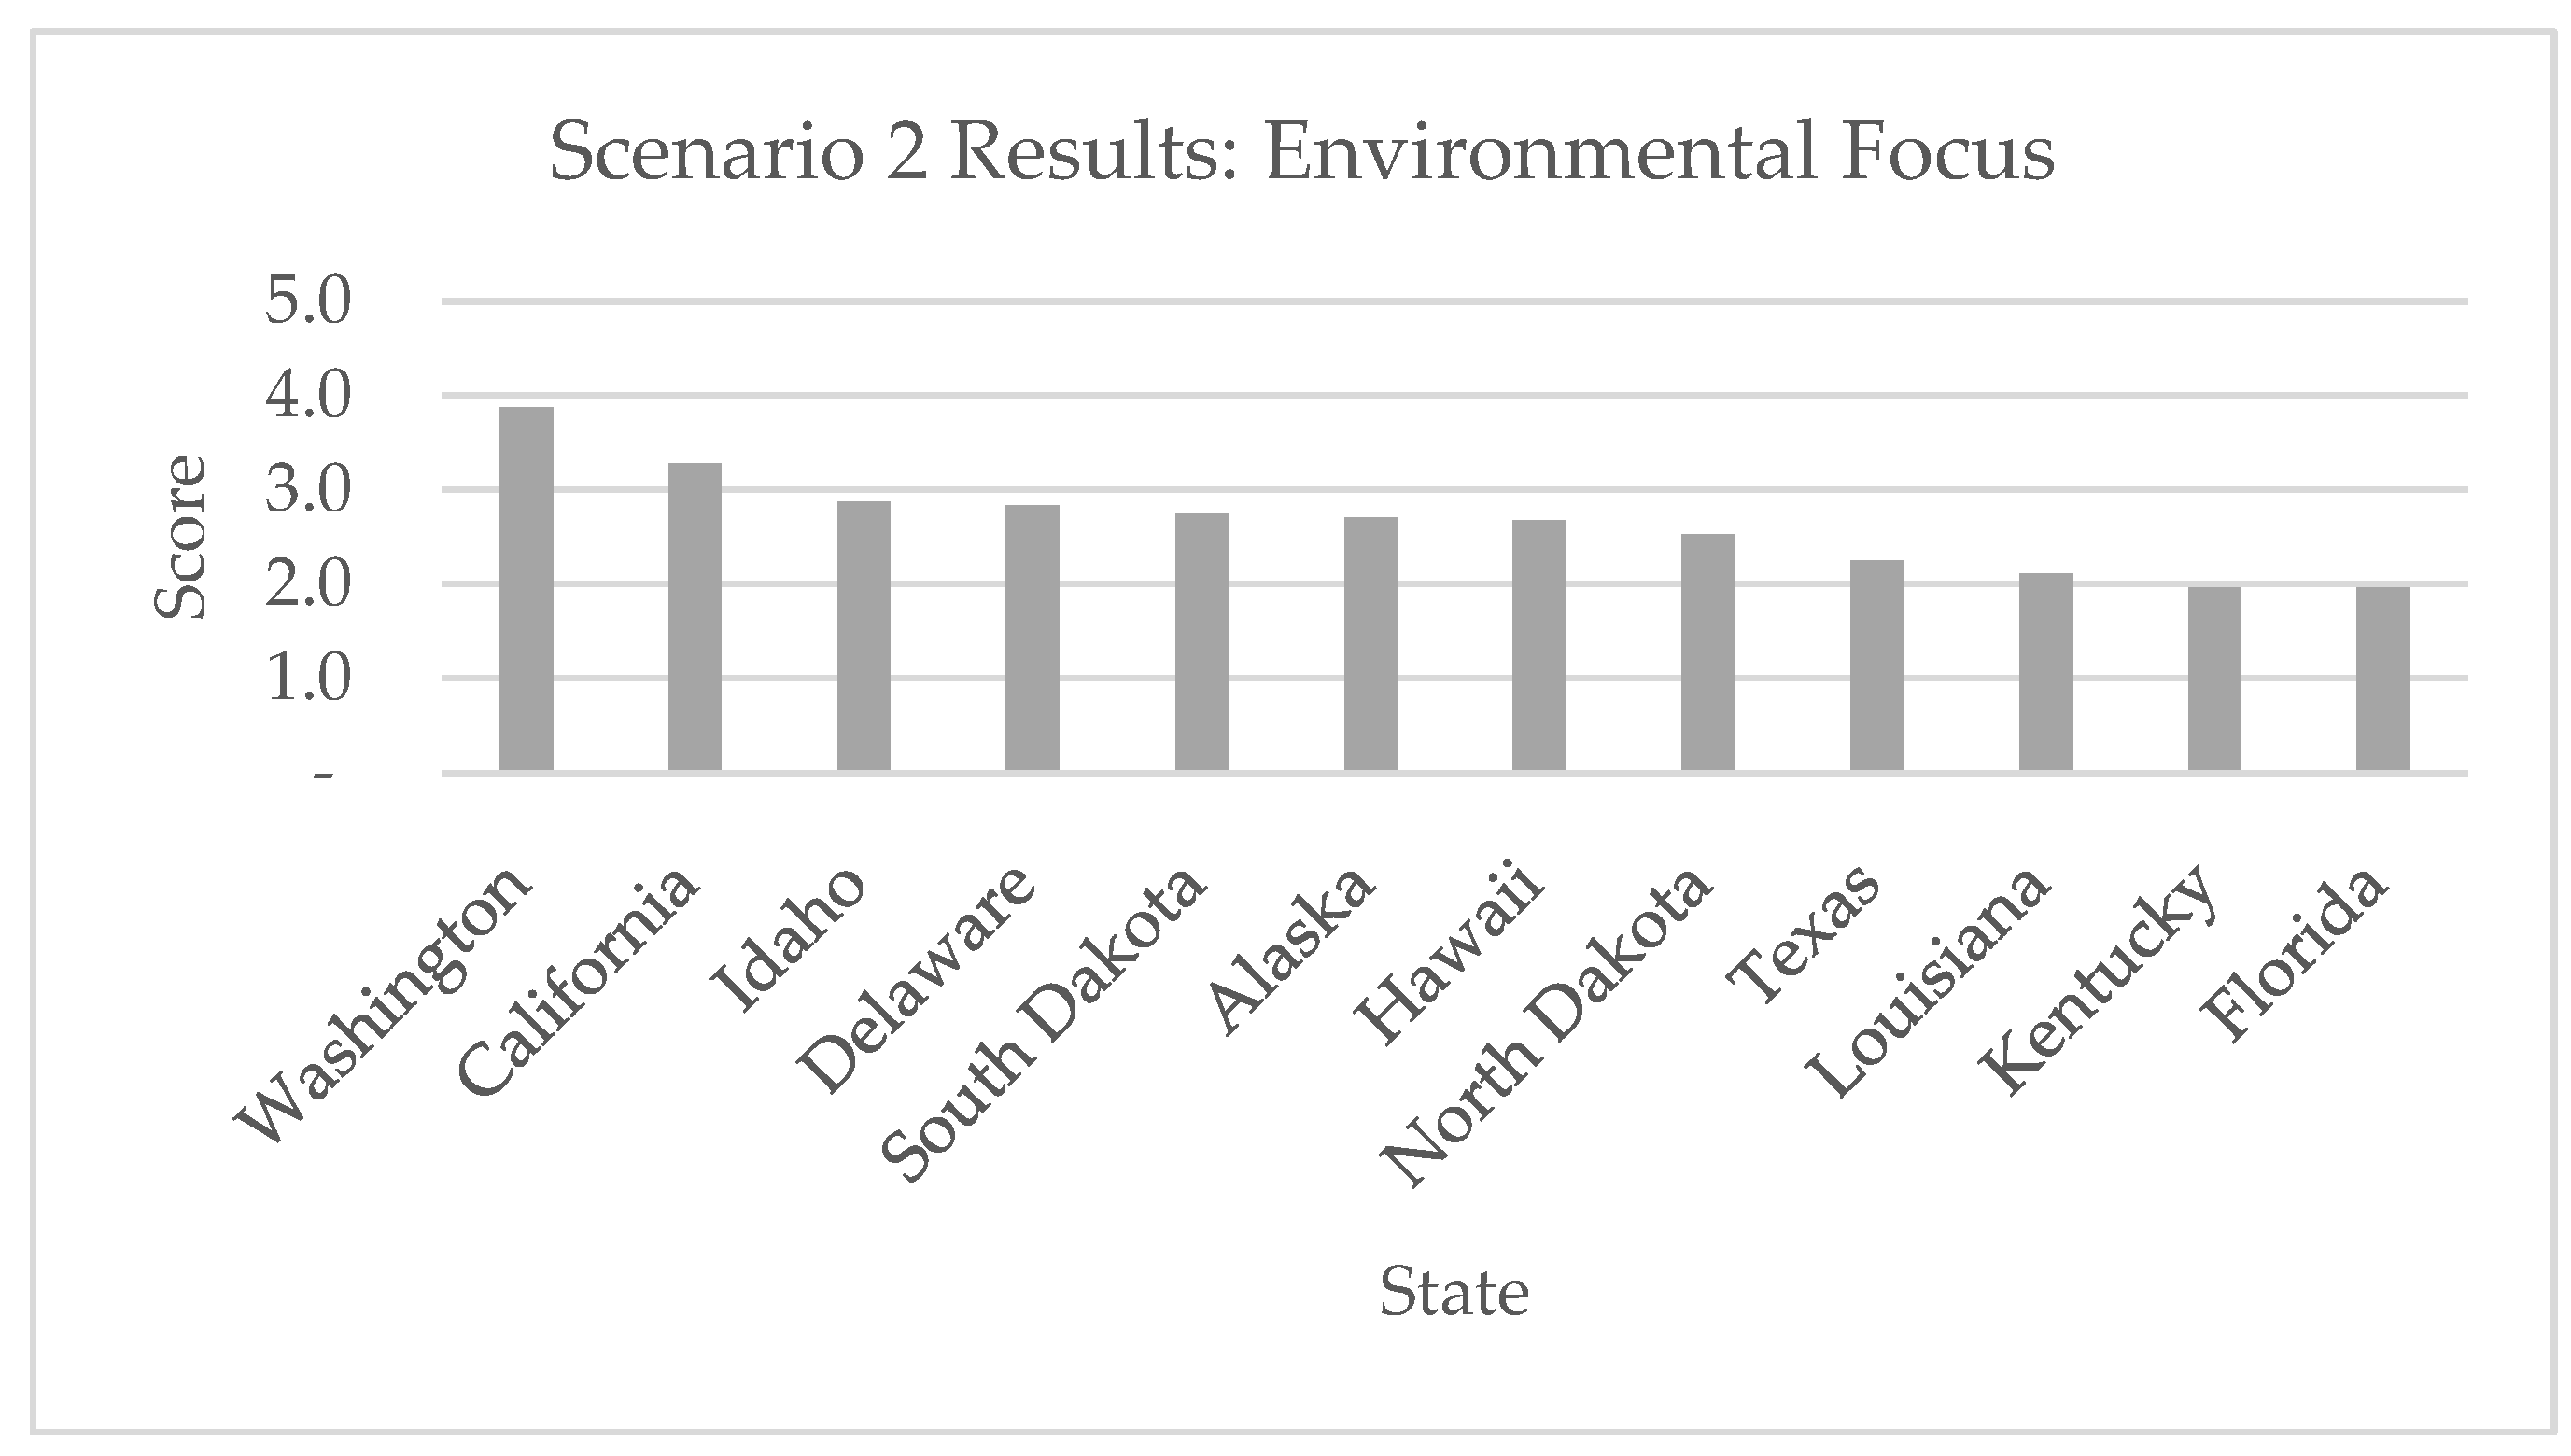
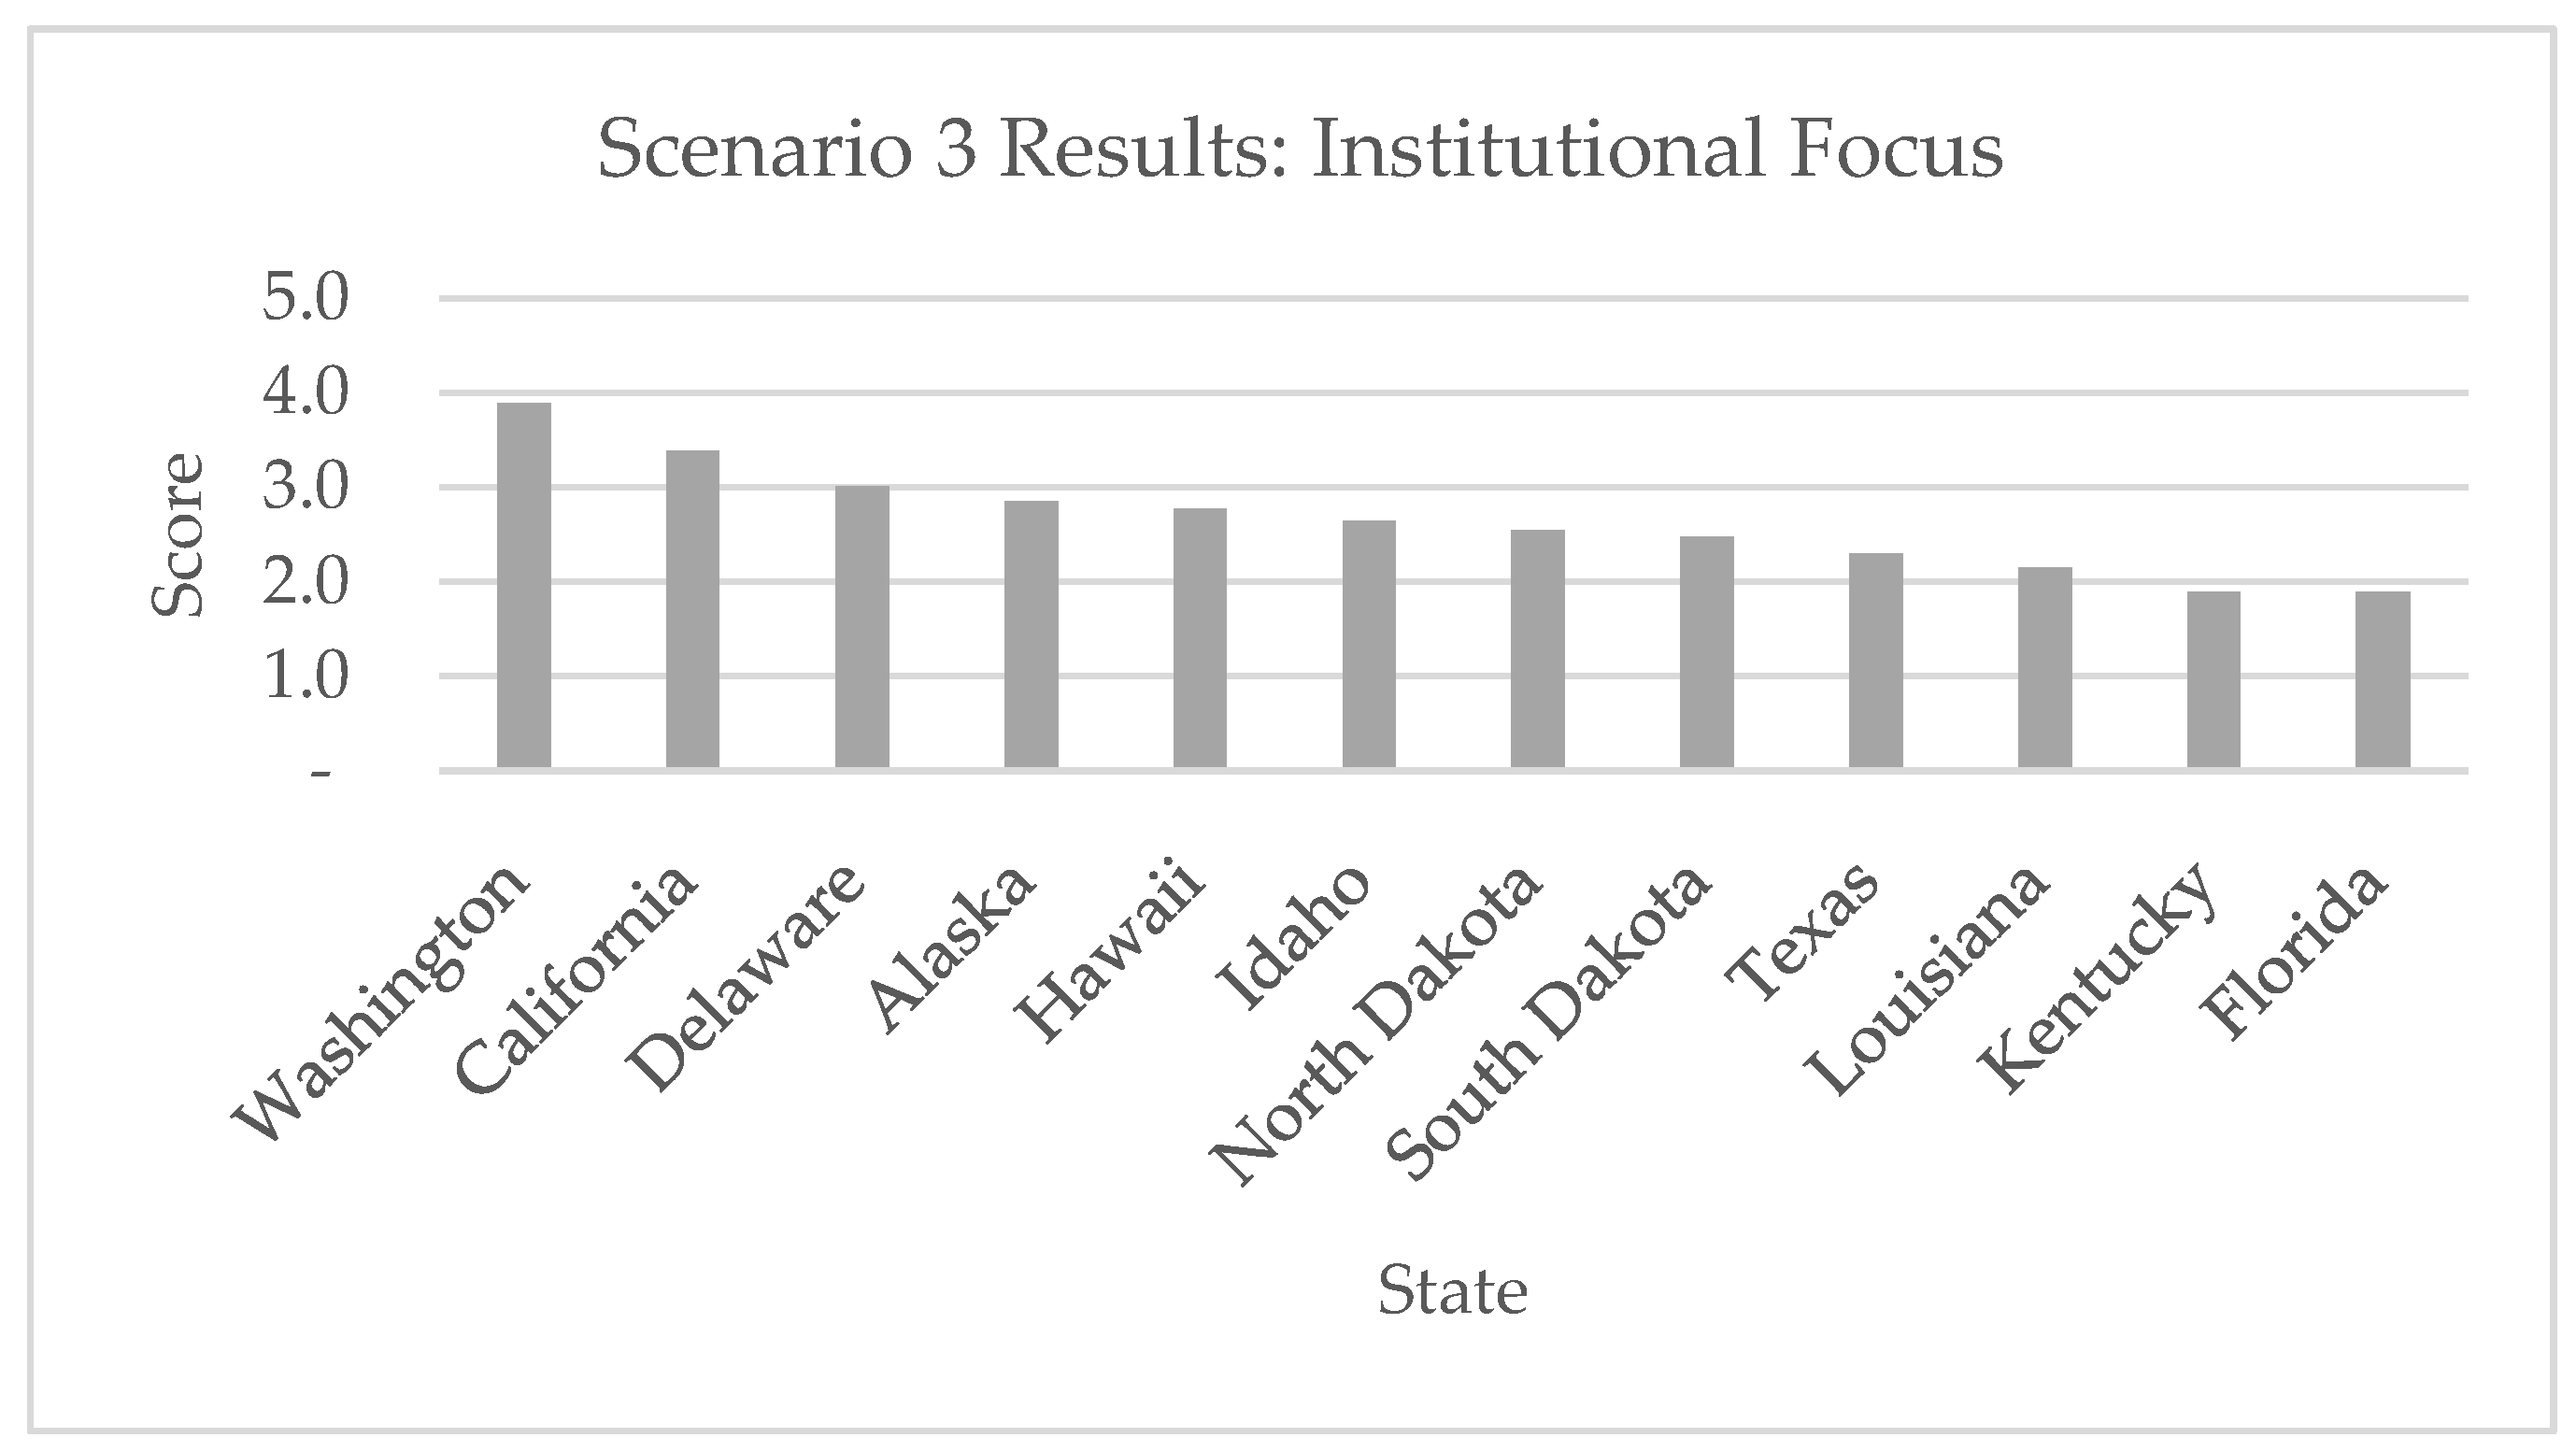
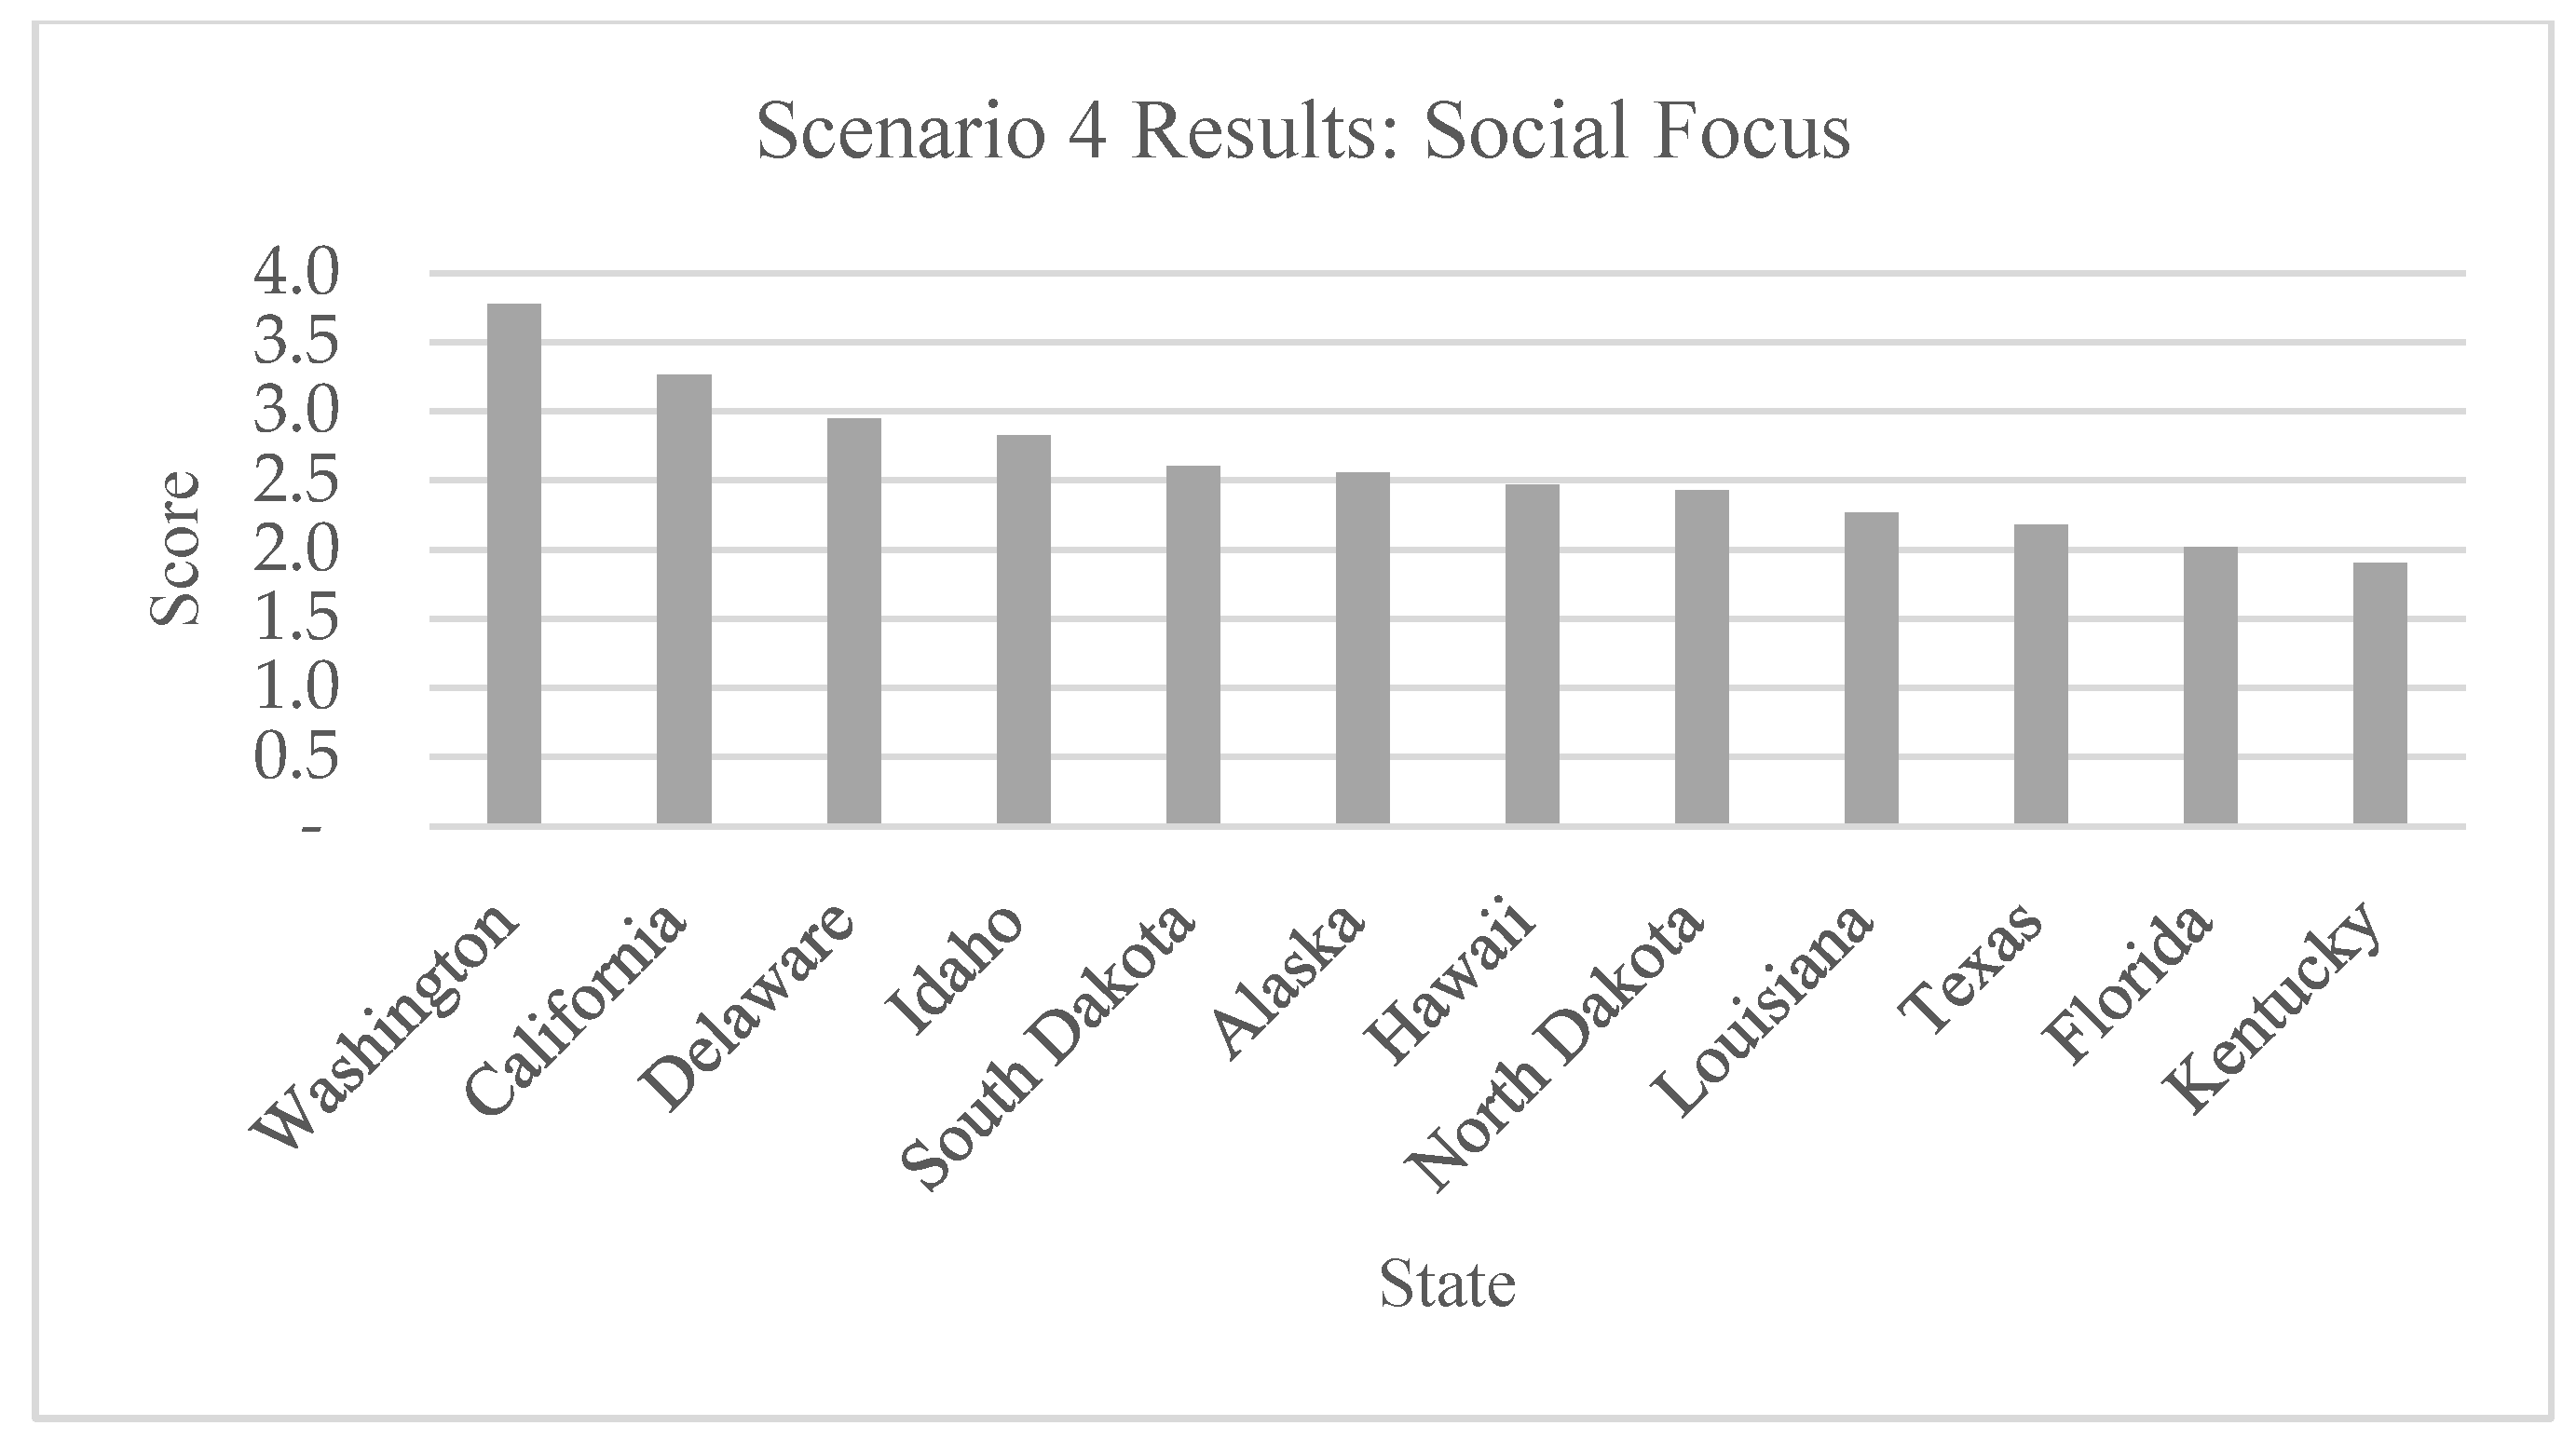
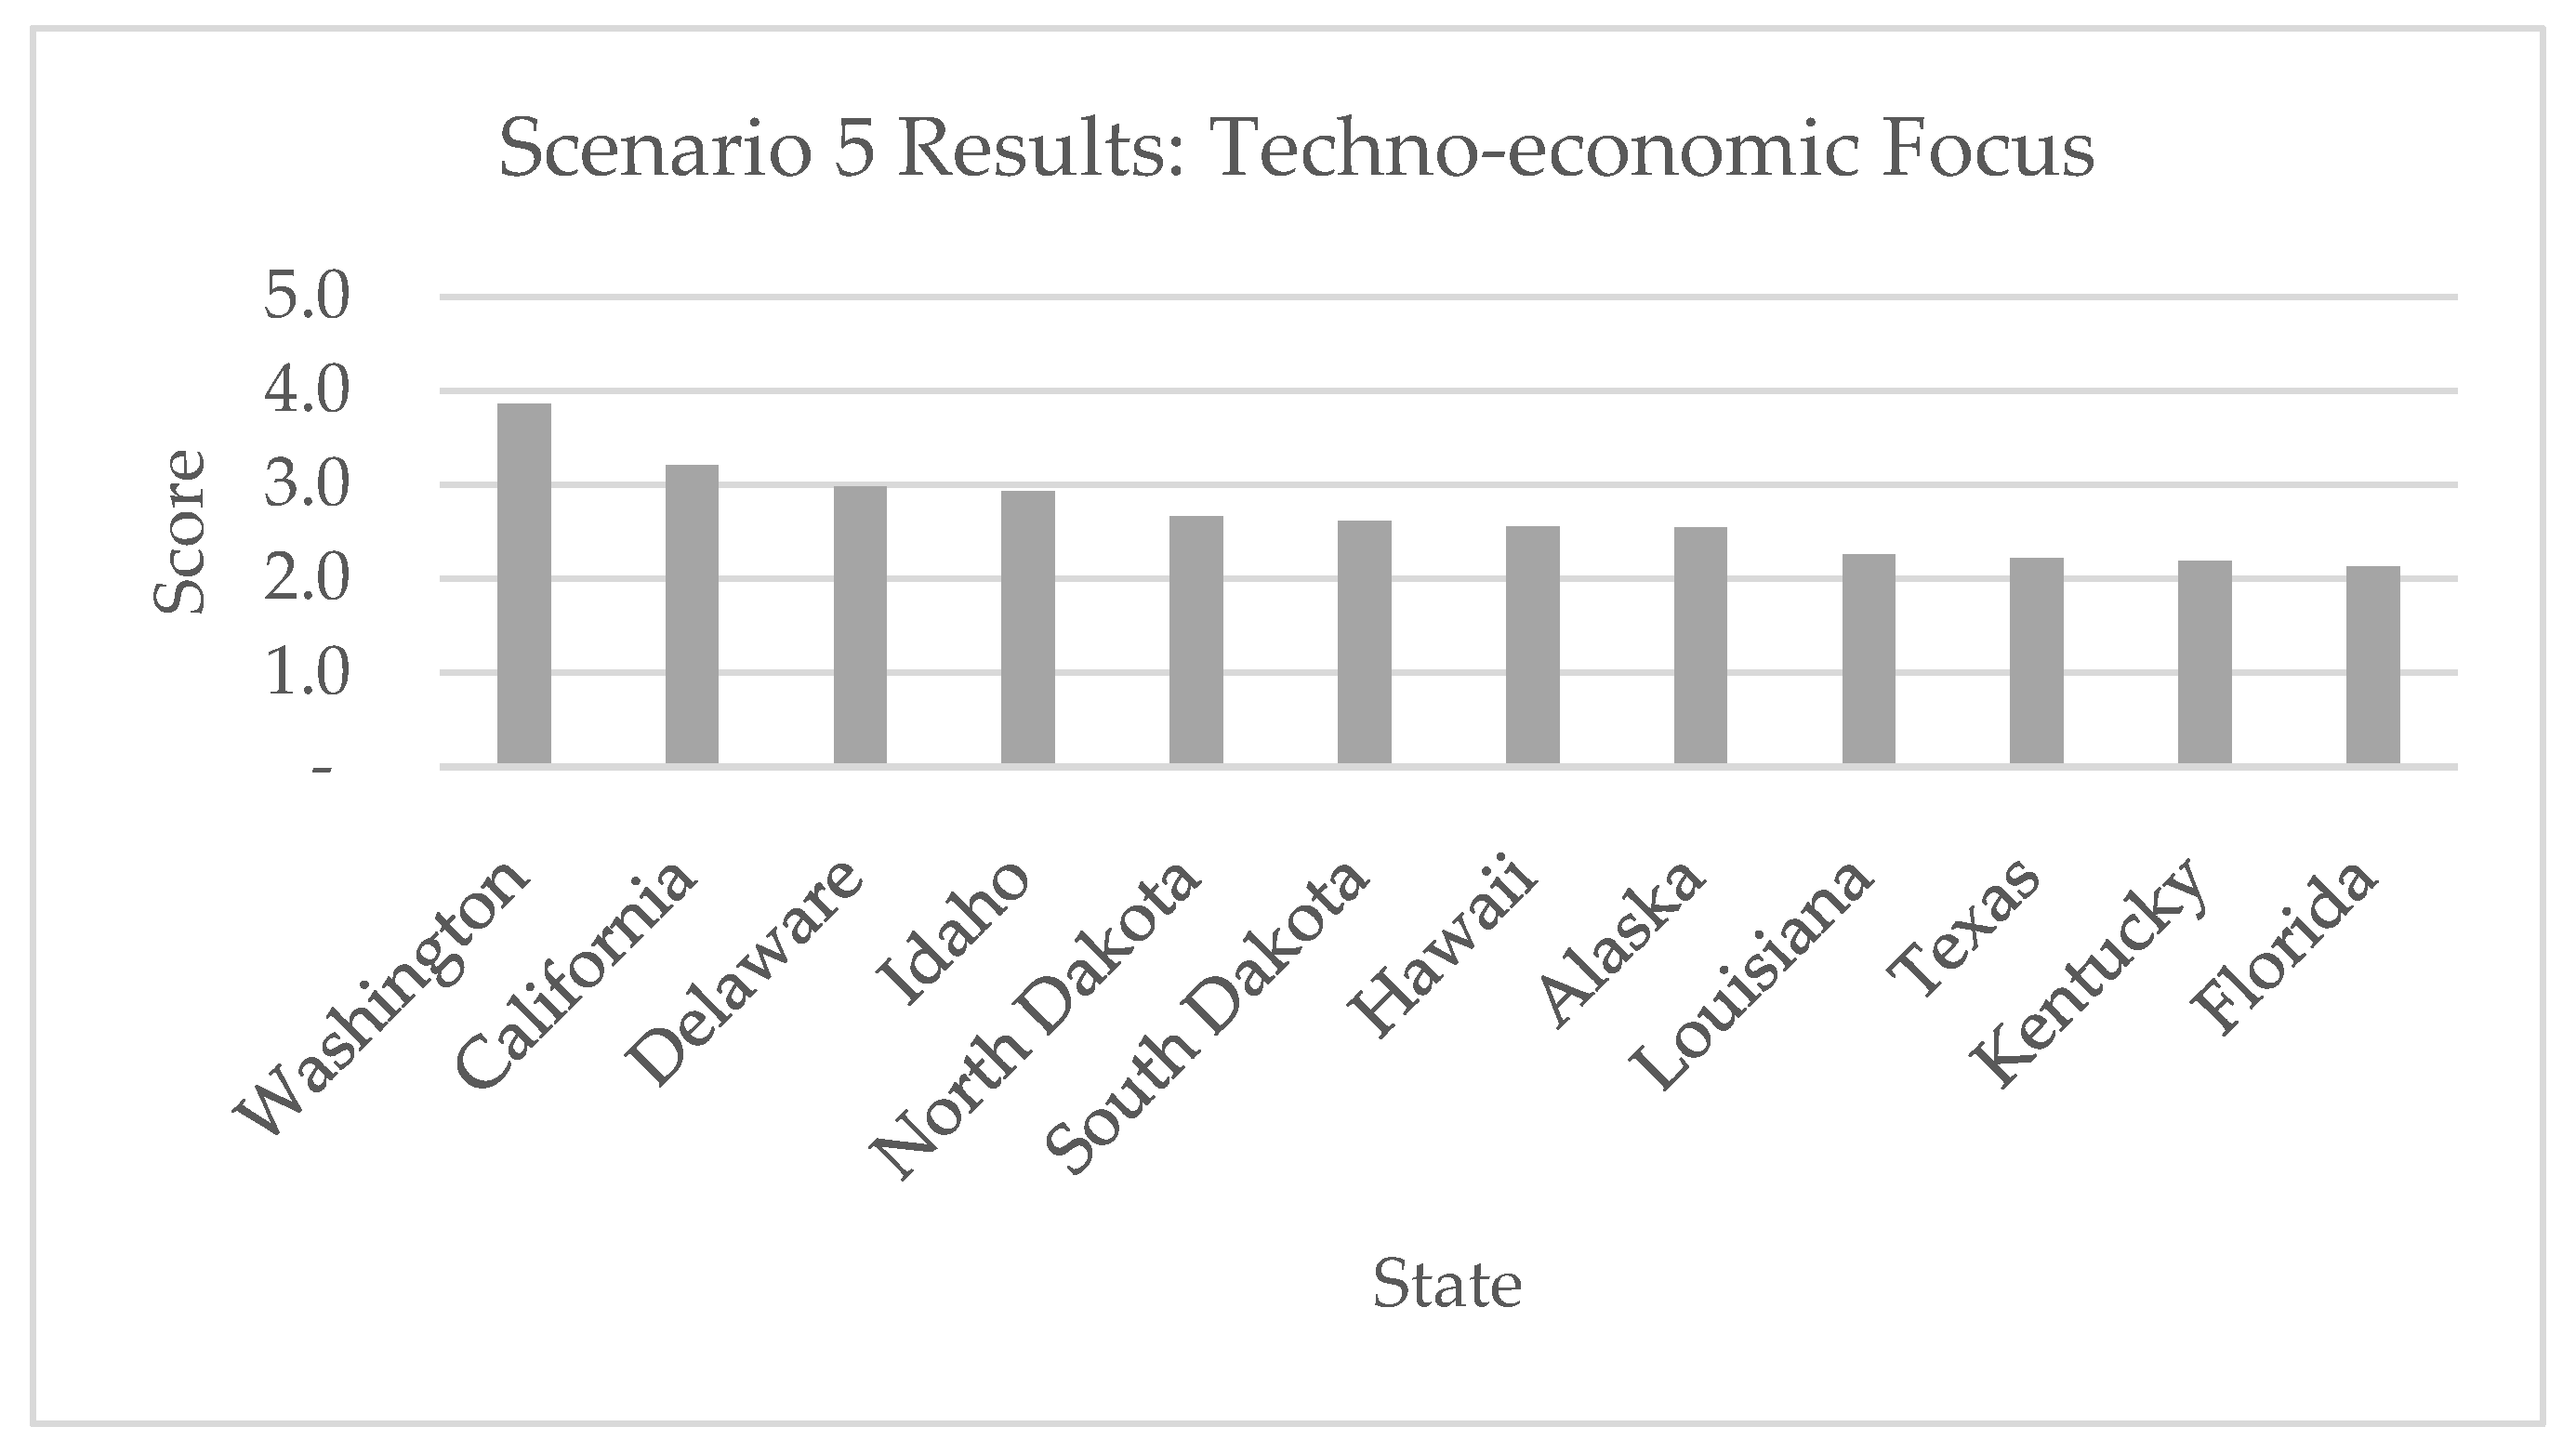
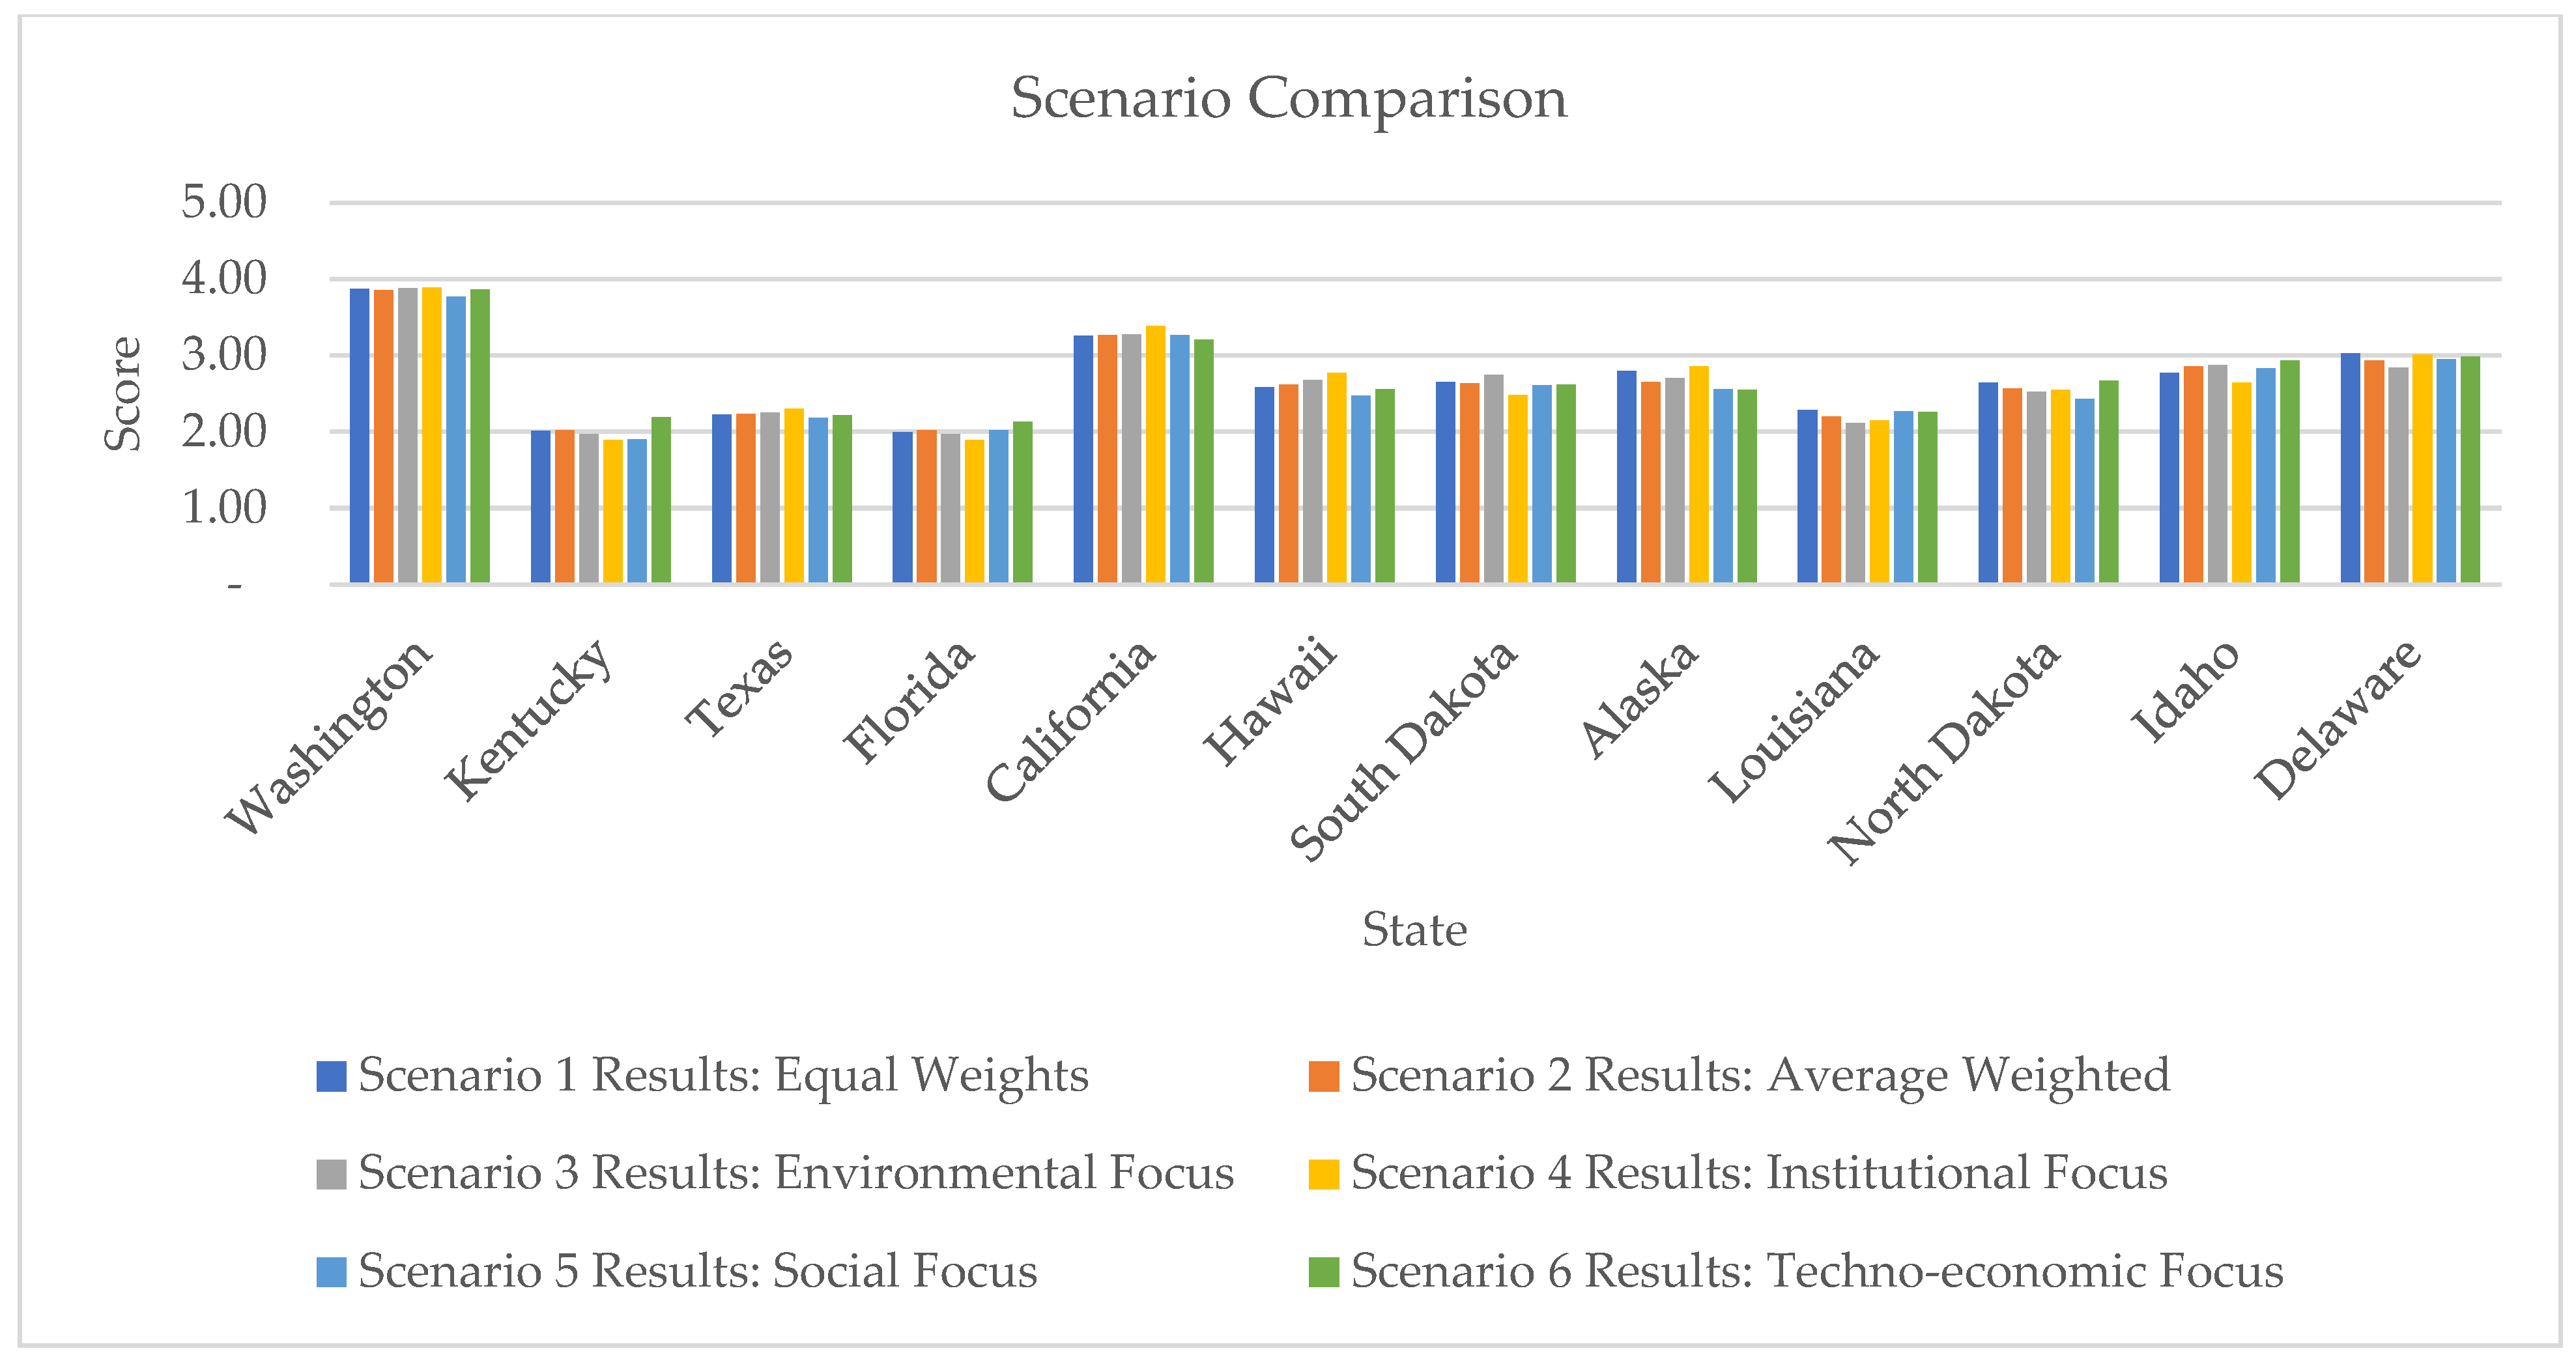
Disclaimer/Publisher’s Note: The statements, opinions and data contained in all publications are solely those of the individual author(s) and contributor(s) and not of MDPI and/or the editor(s). MDPI and/or the editor(s) disclaim responsibility for any injury to people or property resulting from any ideas, methods, instructions or products referred to in the content. |
© 2025 by the authors. Licensee MDPI, Basel, Switzerland. This article is an open access article distributed under the terms and conditions of the Creative Commons Attribution (CC BY) license (https://creativecommons.org/licenses/by/4.0/).