Abstract
In the field of economic analysis, the study of the EU ETS policy has primarily focused on the impact of renewable energy consumption on economic growth, as well as the role of legal and fiscal instruments in the development of clean energy. This study aimed to evaluate the effectiveness of the EU ETS policy in altering the energy mix of selected European countries, providing both cognitive and applicational value. The evaluation of the effectiveness of this policy focused on the structure of the energy mix and the relationship between rising CO2 emission allowance prices and the decreasing share of coal in the energy mix. The goal was achieved through statistical analysis of secondary sources, primarily sourced from Bloomberg (2016–2024). The research findings indicated that changes in the structure of energy sources varied across the studied European countries, due to the adopted energy source utilization strategy, resource availability, and geopolitical situations. Additionally, different correlation values were noted between rising CO2 emission allowance prices and the expected reduction in fossil fuel use. Therefore, the EU ETS policy does not fulfill its assigned role—its implementation contributes to disparities in the economic situations of European economies and creates conditions for unequal competition.
1. Introduction
The European Union Emissions Trading System (the EU ETS) is a mechanism subject to dynamic changes, including the expansion of its scope, extension of compliance periods, reduction in the allowance cap, and introduction of paid allocation of primary allowances among participants. The system has also transitioned from a grandfathering approach to a benchmarking method for allowance allocation, allowing for the use of emission benchmarks of the most efficient installations. This complex mechanism incorporates both market elements (the primary allocation system through auction sales, secondary trading of EUA units among participants in the system) and non-market elements (including especially greenhouse gas emission permits, derogations from auction sales, encompassing specific rules for the free allocation of allowances, as well as monitoring, reporting, and verification of emissions, and sanctions for failure to comply with the obligation to account for the number of allowances corresponding to a given entity’s emissions) [].
Participants of the EU ETS system are therefore required to make numerous decisions regarding actions related to emission reduction and the trading of emission allowances. These actions are crucial at a national level as they impact the structure of the energy mix, which in turn affects the functioning of the entire national economy, including the living conditions of people in the country.
In the existing literature, research on the EU ETS has primarily focused on four key areas:
- (1)
- technological [,,];
- (2)
- environmental [,,,];
- (3)
- methodological [,,,,,];
- (4)
- economic [,,,,].
In the economic field, research has primarily examined the impact of renewable energy consumption on economic growth and the role of fiscal instruments in the development of clean energy. Hence, an analysis of the effectiveness of the EU ETS policy in changing the energy mix (i.e., gradually decarbonizing due to fluctuating prices of CO2 emission allowances) could contribute to filling the existing research gap in this area.
The subject matter is approached with consideration of the following:
- (1)
- a review of legislation concerning emissions trading (the EU ETS);
- (2)
- selecting countries with a diverse energy mix for study;
- (3)
- a long research period, spanning both the years preceding the Russian invasion of Ukraine and the years following it, can significantly enrich the cognitive and applied layers of the article. The research results may be of interest to a wide range of audiences.
The most important stakeholder groups include representatives:
- (1)
- European Union institutions and other decision-making bodies influencing the shaping of legal regulations concerning the emissions trading policy (EU ETS);
- (2)
- various branches of industry taking actions related to the reduction in CO2 emissions and/or trading of emission allowances;
- (3)
- consumers of goods and services, whose availability on the market is conditioned by the production process involving CO2 emissions.
2. Review of EU ETS Mechanism
Currently, the European Emissions Trading System (EU ETS) is the largest rules-based system in the world. The EU ETS has been in operation since 1 January 2005, in all European Economic Area (EEA) countries. It involves the legal obligation for energy and industrial companies to acquire CO2 emission allowances (EUAs). On the other hand, member states and entities at risk of carbon leakage receive a pool of allowances through auctions and for free, which is currently smaller than their needs, creating a demand for allowances and facilitating trading. This is also influenced by the Linear Reduction Factor (LRF), which determines the pace of emission reduction within the EU ETS system by annually reducing the total number of emission allowances. Emission allowance trading mainly occurs on the ICE exchange in London and the EEX exchange in Leipzig. Interestingly, the European Commission based its design of the EU ETS on the emission trading system previously developed in the United States, which ceased to operate in March 2010 []. The European Union Emissions Trading System (the EU ETS) was introduced to establish a rational, economically and socially acceptable pace for reducing greenhouse gas emissions. The design of the EU ETS was intended to support energy transformation. Emissions allowances can be defined as accounting units, initially recorded in national registries and currently in a unified EU registry, which represent the right to introduce a specific volume of greenhouse gases into the atmosphere and, under certain conditions, are tradable assets []. The primary legal basis for the construction and implementation of three instruments aimed at increasing the cost-effectiveness of climate change mitigation—the Joint Implementation Mechanism, the Clean Development Mechanism, and Emissions Trading Scheme—is the Kyoto Protocol, which remained in force until 2012 []. This instrument significantly strengthened the role of law in the process of combating climate change by imposing specific obligations through the establishment of binding and quantitative targets related to the limitation of and reduction in greenhouse gas emissions. One of the most important legal documents of the EU is Directive 2003/87/EC of the European Parliament and of the Council of 13 October 2003, establishing a scheme for greenhouse gas emission allowance trading within the Community []. This is a key instrument regulating CO2 emissions in Europe through the establishment of an emissions trading system, under which emitters must possess a sufficient number of CO2 emission allowances that they can buy and sell on the market. In accordance with the provisions of Article 1, this directive establishes a scheme for greenhouse gas emission allowance trading within the Community in order to promote reductions in greenhouse gas emissions in a cost-effective and economically efficient manner. This directive also envisions further reductions in greenhouse gas emissions to contribute to achieving levels of reduction that scientists consider necessary to avoid dangerous climate change. It contributes to achieving the EU’s climate neutrality goal and the climate targets set out in Regulation (EU) 2021/1119 (European Climate Law) [], and thus to the implementation of the Paris Agreement goals. This agreement commits to a faster reduction in greenhouse gas emissions. The EU significantly contributed to the first-ever universal, legally binding international climate agreement in history, which took place in 2015 during the COP 21 Paris Climate Conference []. The Paris Agreement did not include specific quantitative commitments of individual parties regarding the reduction in greenhouse gas emissions. Instead, the agreement provides for a strict mechanism of cooperation among its parties, including the obligation to submit Intended Nationally Determined Contributions (INDCs) regarding the reduction in and absorption of carbon dioxide, in accordance with a program covering every five years. The response to ambitious objectives of the international agreement is Directive 2018/410 of the European Parliament and of the Council [] amending Directive 2003/87/EC [] to enhance cost-effective emission reductions and low-carbon investments, and Decision (EU) 2015/1814 []. This Directive introduces a series of changes aimed at increasing the effectiveness of the CO2 emissions trading system and reducing greenhouse gas emissions in the energy sector. According to its regulations, a minimum of 50% of the revenues generated from trading emission allowances must be invested in climate protection. This action was complemented by the European Green Deal strategy presented in December 2019 [], whose main goal is to make Europe the first climate-neutral continent by 2050. One of the main instruments to achieve this goal is the transformation of the EU’s energy system by relying on renewable sources. However, as the discussions have shown, the existing regulatory framework in the form of the EU Emissions Trading System is not sufficient in this regard [].
The latest legislative act is Directive (EU) 2023/959 of the European Parliament and of the Council amending Directive 2003/87/EC establishing a system for greenhouse gas emission allowance trading within the Union and Decision (EU) 2015/1814 concerning the establishment and operation of a market stability reserve for the Union greenhouse gas emission trading system []. This directive aims to contribute to the achievement of reduction targets by creating a European organized trading system for greenhouse gas emissions allowances. Member states’ tasks in this system include determining the allocation method for allowances within their own allocation pool. Member states are therefore required to establish national plans for distributing emission rights. These emissions can then be subject to pan-European trading.
The EU ETS allows the achievement of goals resulting from the above legal acts, and its implementation proceeded in four stages. The first stage of the EU ETS lasted from 2005 to 2007 and was a pilot phase used to test the formation of prices in the carbon dioxide emissions rights market and to create the necessary infrastructure for the monitoring, reporting, and verification of emissions. The second stage of the EU ETS lasted from 2008 to 2012, the same period as the first commitment period under the Kyoto Protocol. The subsequent years, up to 2020, constitute the third stage, focusing on improving the harmonization of the system across the entire EU. The fourth stage of the EU ETS in reference to the European Green Deal was initiated on 14 July 2021, when the European Commission adopted a legislative package called “Fit for 55” [], which aims to enable the EU to reduce net greenhouse gas emissions by at least 55% by 2030 compared to 1990 levels and achieve climate neutrality by 2050.
Within the European Union emissions trading system, a specified number of emission allowances (EUAs) are annually issued at the EU level and then allocated to entities participating in the system. In the past, this allocation was mainly allocated through grandfathering, in which allowances were granted free of charge to individual entities based on their historical emissions data. Currently, however, the system primarily utilizes auction mechanisms for a fee, with some allowances allocated for free based on benchmarks, which are indicators of the most efficient installations []. According to the content of Article 3 point j of the EU ETS directive [], each EUA is associated with the ability to emit one ton of carbon dioxide (or an equivalent amount of other greenhouse gases with the same global warming potential). Entities participating in the system are required to account for their emissions by canceling a corresponding number of EUA units. These units can be acquired by them at auctions as part of the initial allocation or obtained, through secondary trading, based on the principle of freedom of contracting, from other entities; allowances can also be retained for future years of the current compliance period and future compliance periods (known as banking) []. According to Article 12(2a) and 3 of the EU ETS directive [], by 30 April of each year, operators are required to surrender a quantity of allowances equal to the total volume of their emissions in the previous calendar year, after which these allowances are canceled. Failure to do so may result in penalties in the form of fines, as well as the obligation to make up for the shortfall in allowances in the following year. Additionally, operators are required to submit a report to the climate and energy agency by 31 March of each year, containing information on the quantity of greenhouse gas emissions and the number of allowances to be surrendered. Failure to document the quantity of greenhouse gas emissions may result in a fine and the requirement to supplement the allowances by 100% of the missing amount. These provisions are aimed at ensuring that operators fulfill their obligations under the EU ETS system and contribute to the achievement of greenhouse gas emission reduction targets.
Each EEA country has implemented Directive 2003/87 [] into its legal system, which serves as the basis for the functioning of the EU ETS, a market-based carbon pricing mechanism that establishes a price for the emissions of greenhouse gases into the atmosphere. The system is designed to gradually decarbonize emitters by exerting price pressure on them. Simultaneously, emission reductions should occur in sectors where the marginal cost of this process is lowest, leading to the most economically efficient distribution of burdens in this regard. The EU ETS operates as a cap-and-trade system, rigidly determining the allowable level of emissions in the covered sectors while allowing participants to trade emission allowances []. For example, in Poland, the Act on the system of greenhouse gas emission allowance trading [] was established, which was repeatedly updated as a result of changes in EU policy. Due to the fact that the Polish economy is one of the most emission-intensive in the EU, energy transformation and decarbonization are very difficult and costly to implement. And an unsuccessful attempt was made to challenge it before the CJEU in a case concerning the market stability reserve within the ETS system (CJEU judgment of 21.6.2018 in the case of the Republic of Poland v the Parliament and Council of the EU, C-5/16) []. According to the thesis of the judgment, the assessment of the effects on the energy policy of a member state caused by an act of the Union is not an element that should be assessed in isolation from the purpose or content of that act or as an exception to them. The cited judgment of the CJEU is very important for the future of the EU ETS and the EU climate policy. Consequently, arguments regarding the impact of the EU ETS measures on the choice by member states of different energy sources and the overall energy supply structure cannot effectively be invoked to apply a special legislative procedure (assuming unanimity) []. The resolution adopted by the Sejm of the Republic of Poland, which called on the European Union member states to suspend the EU Emissions Trading System (EU ETS) and take action towards reform on 9 December 2021, was ineffective and purposeless []. The unilateral exclusion of Poland from the ETS is legally and politically impossible as it would require changes to many EU regulations, legislative initiatives by the Commission, and the consent of the majority of EU countries. A major shortcoming is that unlike other countries, Poland did not pursue its own climate policy, and its actions were limited to the delayed implementation of EU law and hindering investments in RES []. According to the Polish Wind Energy Association, the regulations adopted in 2016 led to the exclusion of approximately 99% of the country’s territory from investment, resulting in the virtually complete halt of onshore wind energy development [].
Implementation of these same objectives results in very different burdens for different member states, a varying scope of necessary investment actions, and consequently varying scales of costs. Different countries have different starting points, known as the energy mix, and different geographic and even weather conditions, which affect, for example, the energy efficiency of buildings. In the case of Poland, the slow pace of necessary legislative actions to eliminate longstanding barriers to the development of renewable energy has had a significant impact on the much larger scale of actions (and, consequently, costs) required compared to other countries. This is due to the lack of a comprehensive approach to solving the issue by legislators, as well as delays in actions towards energy transformation [].
One of the possible approaches to fulfilling a state’s obligations in reducing greenhouse gas emissions is the introduction of national climate legislation. Framework climate protection laws are already in place in the United States, Australia, and in 16 EU member states (Austria, Bulgaria, Croatia, Denmark, Finland, France, Greece, Spain, the Netherlands, Ireland, Luxembourg, Malta, Germany, Portugal, Sweden, and Hungary), as well as in five other European countries (Iceland, Liechtenstein, Norway, Switzerland, and the United Kingdom). Work is ongoing on legislation in four more EU countries (Estonia, Latvia, Slovakia, and Slovenia), and in Turkey [].
In Poland, there is a lack of a climate protection law with a binding goal of climate neutrality. Other countries recognize the need for national coordination of climate policy with specific commitments and have set goals to effectively coordinate economic and environmental policy. For example, in Germany, there is a climate protection law from 12 December 2019 (Bundes-Klimaschutzge-setz) [], regulating national climate goals and permissible annual emissions levels until 2030. This law includes the commitment of the Federal Republic of Germany to strive for carbon neutrality by 2050, as well as the obligation to reduce greenhouse gas emissions by at least 55% by 2030. The law specifies annual allowable emission levels until the target year—2030. As a result of a complaint against the provisions of the federal Climate Protection Act, the German legislature amended the Act to introduce a schedule for reducing greenhouse gas emissions after 2030 and to increase overall mitigation goals [].
3. Methodology
The aim of the research is to evaluate the effectiveness of the EU ETS policy in changing the energy mix in selected European countries. It is posited that a determining factor of this effectiveness is the identification of the following:
- (1)
- the structure of the energy mix;
- (2)
- the relationship between the increase in CO2 emission allowances prices and the decrease in the share of coal in favor of gas (i.e., a less emission-intensive fuel) in the energy mix. To determine this relationship, the C/G ratio was used (the ratio of the amount of energy produced from coal to the amount of energy produced from gas). This coefficient well illustrates the changes that occur in energy production. It should be noted that when analyzing the effectiveness of the CO2 emission allowances system, the impact of the prices of these allowances on the operation of power plants with coal-fired and gas-fired units should be visible in the first place. An increase in the price of CO2 emission allowances should lead to a greater utilization of gas units and the shutdown of coal units, as energy production from coal, due to higher CO2 emissions, becomes more expensive than energy production from gas.
With a research objective formulated to be of interest from both cognitive and applicative perspectives, it was important to conduct analyses aimed at answering two key questions:
- How is the structure of energy sources for electricity production changing, focusing on low-emission energy sources?
- How does the change in the price of CO2 emission allowances affect the adoption of strategies to move away from high-emission raw materials (such as coal and gas in the energy mix) for electricity production?
The analyses were conducted taking into account secondary data concerning the following:
- (1)
- the amount of electricity production from six main sources of energy MW, such as coal (hard and brown), natural gas, wind power plants, solar power plants, nuclear power, and hydroelectric power plants;
- (2)
- average prices of CO2 emission allowances in EUR per tonne,
- (3)
- average hourly electricity production from natural gas in MW (for one country),
- (4)
- electricity prices per 1 MWh in EUR.
The data for the analytical section of the article were obtained from the following sources:
- ENTESO-E, the European Network of Transmission System Operators for Electricity, established under the third EU energy package in July 2009 [] (data provided by Bloomberg). The data were collected from 2016 to May 2024. For the year 2024, data were gathered until May, except for France, where data were available only until March. Adopting the aforementioned research period facilitated the achievement of the research objective and allowed for a more comprehensive interpretation of the results by covering the period from January 2016 to January 2022 (preceding Russia’s invasion of Ukraine) and from February 2022 to March/May 2024 (during Russia’s invasion of Ukraine). The selected time frame for the study (2016–2024) was determined, among other factors, by the analysis of data found in the European Carbon Monthly, January 2023, published by Bloomberg. This analysis indicated that prior to 2016, there was no observed increase in the volatility of EUA prices, and the tightening of European policy regarding CO2 emissions allowances began after 2016. Consequently, there was a significant increase in EUA prices, which could influence decisions regarding the choice of sources used for electricity production in the countries studied.
- International industry reports (International Energy Agency, World Nuclear Association’s, and European Environment Agency).
The subject analyses were conducted using selected European countries as examples:
- (1)
- Germany (rapid transition to energy from renewable sources—RES);
- (2)
- France (high level of nuclear energy);
- (3)
- Spain (early independence from Russian gas, diversification of energy sources);
- (4)
- Italy (independence from Russian gas);
- (5)
- Norway (high consumption of hydroelectric energy);
- (6)
- Poland (dominant coal-based energy production).
The selection of research objects was deliberate, taking into account the following criteria:
- (1)
- diversity of leading energy sources;
- (2)
- geographic location and access to energy resources;
- (3)
- the impact of energy-emitting sources on final energy costs.
Achieving the research goal involved the following methods:
- (1)
- data collection, including a literature review on the emissions trading policy (EU ETS) with a specific focus on assessing the state of legislation in this area.
- (2)
- data processing, involving quantitative analysis using descriptive statistics techniques and the Pearson correlation coefficient, which is widely recognized in the field of economics, facilitating the comparability and replication of results in scientific research [,]. The correlation coefficient enabled the determination of the strength and direction of the linear relationship between the variables: the C/G coefficient ratio and the price of CO2 emission allowances.
- (3)
- data presentation.
The analyses were conducted within a normative framework, allowing for the determination of the necessary conditions for designing new solutions in the realm of finance [].
4. Results
The effectiveness of the EU ETS policy in changing the energy mix has been evaluated in each of the selected European countries (Germany, France, Spain, Italy, Norway, and Poland) using a standardized research methodology. This evaluation included an assessment of the structure of the energy mix and the relationship between the increase in carbon emission allowances prices and the decrease in coal’s share in the energy mix. This conceptual approach allows the reader flexibility to choose how to engage with the analytic content according to personal preferences and research interests. Readers can familiarize themselves with the analytic content by selecting the research object criterion (both subject areas of analysis) or the analysis object criterion (e.g., evaluating energy mix in all countries or in a country chosen by the reader).
4.1. Germany
Since 2016, the production of electricity in Germany has been mainly based on the consumption of coal and nuclear energy. However, there has been noticeable development in the production of energy from renewable sources, mainly wind energy, and to a lesser extent, solar energy. Due to its geographical location and relatively flat terrain, wind farms have shown high efficiency, leading to the development of this energy source []. The initiated process of phasing out nuclear energy was intended to be replaced by wind energy and natural gas energy (as indicated by the trend shown in Figure 1). Figure 1 presents the share of electricity production in Germany from January 2016 to May 2024 from the following sources: coal (hard and brown), natural gas, wind power plants, solar power plants, nuclear energy, and hydroelectric power plants.
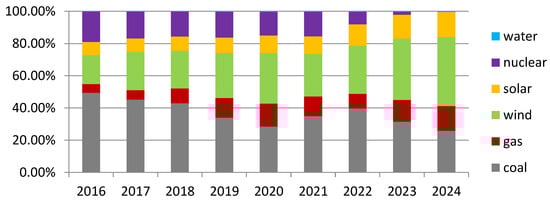
Figure 1.
Share of electricity production from six primary sources of energy in Germany from January 2016 to May 2024. Source: own elaboration based on [].
The pressures from ecological communities in Europe has led to a change in the structure of the energy mix towards increased utilization of renewable sources of energy and replacing highly emitting sources []. The EU ETS system was intended to assist in this process by incentivizing the energy industry to phase out coal usage due to its high carbon footprint and associated higher costs. Natural gas was cheaper to use, and thanks to cooperation between the Federal Republic of Germany and Russia, natural gas imported from Russia was supposed to balance energy production and partially replace the decommissioning of nuclear power plants. This trend is visible until 2020—a decrease in energy production from coal and nuclear power is accompanied by an increase in energy from wind and natural gas.
The relationship between the average price of CO2 emission allowances and the C/G coefficient in Germany during the analyzed period is presented in Figure 2.
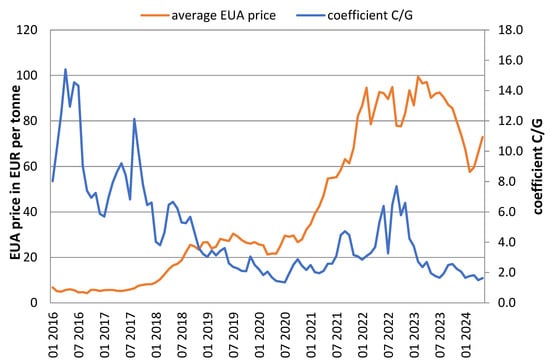
Figure 2.
Change in CO2 emission allowance prices and the C/G coefficient for Germany from January 2016 to May 2024. Source: own elaboration based on [].
In 2016, the coefficient was 10, which means that the production of electricity from coal was ten times higher than from natural gas. In 2023, this coefficient was only 2.35. Thus, over the course of eight years, the German energy industry was able to reduce the coal/gas production ratio fivefold, aligning with the adopted strategy of moving away from using high-emission raw materials (coal) for energy production. This was also related to the increase in CO2 emission allowances prices, where during the same period, there was an increase in the average price from 5.35 EUR/MWh to 89.30 EUR/MWh []. The correlation coefficient between the C/G coefficient and the price of CO2 emissions allowances from January 2016 to May 2024 was −0.48 (48% of the variability in the C/G coefficient was due to changes in CO2 allowance prices). When analyzing the period from 2016 to January 2022, the correlation coefficient was −0.58. However, as previously noted, since February 2022, after the outbreak of the war in Ukraine, trends observed in the energy mix have been somewhat distorted. In some European countries, coal has been reintroduced as a substitute for natural gas, which lowered this coefficient from −0.58 to −0.48 for the entire study period.
Since the outbreak of war in Ukraine and the subsequent lack of natural gas supplies from Russia, the German government has immediately embarked on the expansion of LNG gas terminals for the regasification of imported liquefied gas, mainly from the United States and Qatar. Additionally, there has been further expansion of wind power plants while reducing the use of coal as a high-emission raw material []. It is important to note that, influenced by events in Ukraine, Germany did not retreat from the closure of its nuclear power plants (reflected in a decreasing share of energy production from this source from 2021 to 2023 and the lack of energy production from this source in the first months of 2024). Considering the changes in the structure of electricity production, Germany serves as a good example of a country that effectively seeks cost-effective and low-emission sources of electricity production, with its geographic location favoring a high wind energy utilization rate.
4.2. France
France is characterized by a unique energy mix in Europe, with nuclear energy playing a dominant role, maintaining a constant share of 80% of total electricity production throughout the analyzed period (see Figure 3). The analysis of energy production dynamics in France is particularly important in the context of geopolitical events (such as the war in Ukraine) and in evaluating the impact of different energy policies on the structure of the energy mix. From January 2016 to March 2024, nuclear energy served as the cornerstone of electricity production in France. Such a strong reliance on nuclear power distinguishes France from other European countries and significantly contributes to its low-emission energy profile [].
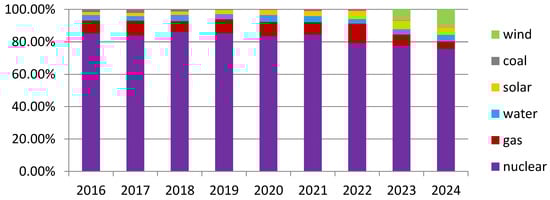
Figure 3.
Share of electricity production from six primary sources of energy in France from January 2016 to March 2024. Source: own elaboration based on [].
In Figure 3, the share of electricity production in France from January 2016 to March 2024 is presented for six primary sources of energy. An analysis of the data indicates that the outbreak of war in Ukraine in 2022 did not cause significant disruptions in the share of individual energy sources in electricity production. However, there is a trend towards increased use of renewable energy sources, especially wind energy. The geographic location of France and its long coastline favor the development of efficient wind farms []. Despite the increasing use of renewable energy sources, the share of natural gas in France’s energy mix remains minimal. This minimal dependence on gas implies that the CO2 emissions trading system has limited impact on energy production strategies in France. The C/G coefficient in France has fluctuated within a narrow range of 0.1–0.4 (see Figure 4), indicating a much lower share of coal than gas in energy production [].
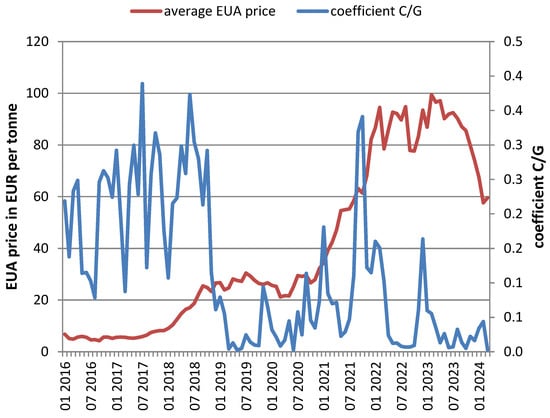
Figure 4.
Change in CO2 emission allowance prices and the C/G coefficient for France from January 2016 to March 2024. Source: own elaboration based on [].
In 2016, the C/G coefficient was 0.2, increasing to 0.35 in the years 2017–2018, and then decreasing to below 0.1 in 2019. A short-term increase in the C/G coefficient occurred at the turn of 2021/2022, reaching its maximum values before stabilizing. In 2024, the shares of energy production in gas, hydro, and solar power plants are comparable, while the production of energy from wind farms is on an upward trend, and the use of coal has been abandoned. Despite low coal utilization, there is a noticeable correlation between the share of this source and the prices of CO2 emission allowances. The correlation coefficient between the C/G coefficient and the prices of CO2 emission allowances for the period from January 2016 to March 2024 was −0.49, indicating a moderately negative relationship. Prior to the conflict in Ukraine, this correlation was even lower at −0.29, indicating that France’s energy policy is relatively independent of fluctuations in CO2 emission allowance prices. France’s low dependence on coal and significant utilization of nuclear energy provide the country with a competitive advantage, reducing operational costs and increasing the competitiveness of French companies compared to other economies. The adopted strategy of utilizing nuclear energy aligns with France’s long-term goals in terms of energy security and sustainable development [].
France’s energy strategy, characterized by a strong reliance on nuclear energy and an increasing use of renewable energy sources (especially wind energy), sets it apart from other European countries. France’s approach to energy production and its relative independence from the CO2 emissions trading system underscore the importance of maintaining a diversified and resilient energy mix. Such a strategy not only supports France’s energy security, but also enhances its competitiveness in the broader European context.
4.3. Spain
Spain is characterized by a very diverse energy mix, which the production of energy from nuclear, wind, and gas power plants accounting for almost 70% of total electricity production []. The country has significantly reduced its production of energy from coal, while simultaneously increasing its production in solar power plants. Thanks to its favorable geographical location, Spain fully utilizes its wind and solar resources, contributing to the efficient use of renewable energy sources []. Figure 5 illustrates the share of electricity production in Spain from January 2016 to May 2024 across six primary energy sources.

Figure 5.
Share of electricity production from six primary sources of energy in Spain from January 2016 to May 2024. Source: own elaboration based on [].
In 2016, the C/G coefficient (carbon to gas ratio) was approximately 0.8, and by the beginning of 2024, it had decreased to 0.1. This signifies that Spain, like Germany, has significantly reduced its utilization of coal as an energy source (see Figure 6).
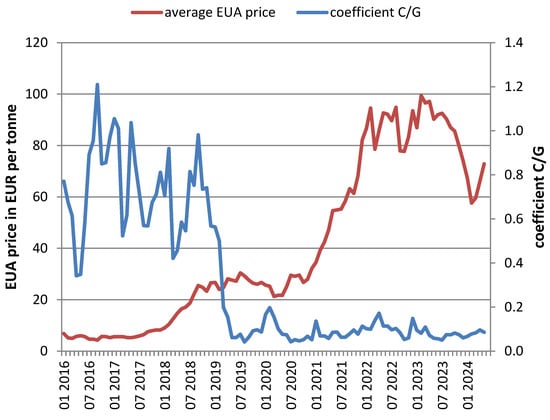
Figure 6.
Change in CO2 emission allowance prices and the C/G coefficient for Spain from January 2016 to May 2024. Source: own elaboration based on [].
The reduction in coal energy production in Spain coincided with an increase in the price of CO2 emission allowances, reflected in a high correlation coefficient of −0.68. In contrast to Germany, the correlation coefficient did not change in 2022, which can be attributed to the diversity of energy sources in the Spanish energy mix and the minimal use of gas imported from Russia []. Most of the gas used in Spain comes from North Africa, which means that the limited import of gas from Russia did not have a significant impact on the energy mix of the country. Spain has effectively reduced its dependence on coal, while simultaneously developing renewable sources of energy, particularly solar and wind energy []. Favorable geographic conditions have allowed for the full utilization of these resources, contributing to the stability and diversity of the energy mix. Spain has effectively reduced its dependence on coal, while simultaneously developing renewable sources of energy, particularly solar and wind energy []. Favorable geographic conditions have allowed for the full utilization of these resources, contributing to the stability and diversity of the energy mix. With minimal dependence on gas imported from Russia, Spain has been able to avoid significant disruptions in its energy system, even in the face of global crises [].
4.4. Italy
Italy is an interesting example of a country that remains reliant on traditional sources of energy, despite its favorable geographic location. Throughout the period under study, the use of natural gas production accounted for approximately 60% []. The second most important source of electricity generation is solar production, followed by coal-fired power plants in third place []. In recent years, coal production has been reduced, as depicted in Figure 7. The C/G coefficient was 0.4 in both 2017 and 2018, and decreased to 0.1 in 2024. This indicates a fourfold decrease in coal utilization for energy production. Similar to other countries studied, the decline in coal production occurred around 2019 and coincided with the beginning of an increase in market prices for CO2 emissions allowances.
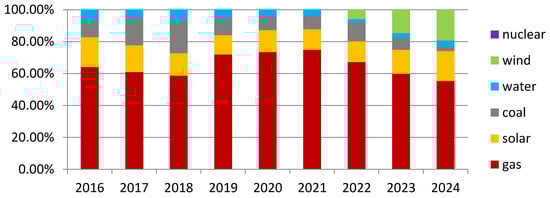
Figure 7.
Share of electricity production from six primary sources of energy in Italy from January 2016 to May 2024. Source: own elaboration based on [].
The outbreak of war in Ukraine did not significantly affect the decrease in the gas share in energy production, as Italy, like Spain, relies on gas imported from North Africa []. In the initial phase of the war, there were no concerns about supply disruptions. However, the Italian government noticed the issue of gas availability and the need for the diversification of renewable sources, leading to an increase in the use of wind energy starting in 2022 []. By the first months of 2024, wind energy already accounts for around 20% of energy production.
Figure 8 presents the relationship between the average price of CO2 emission allowances and the C/G coefficient in Italy from January 2016 to May 2024. During the study period, the correlation coefficient between the change in CO2 emission allowance prices and the C/G coefficient was −0.37, but it was higher up to the year 2021 and during the period from January 2016 to January 2022 it was −0.43 []. Issues with access to natural gas in Europe contributed to a sharp increase in coal consumption, which led to a change in the correlation coefficient and a decreasing trend in the C/G coefficient.
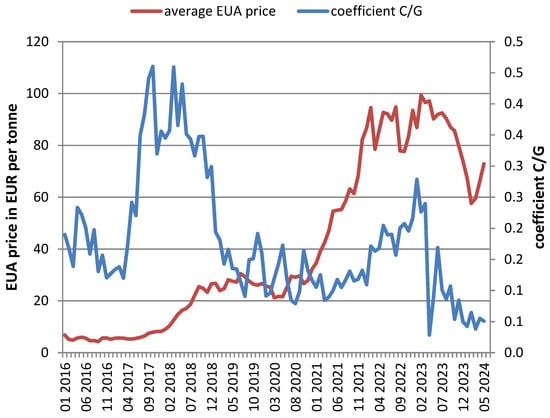
Figure 8.
Change in CO2 emission allowance prices and the C/G coefficient for Italy from January 2016 to May 2024. Source: own elaboration based on [].
Italy represents an interesting case of maintaining a high share of traditional emission sources, despite favorable geographical conditions for developing renewable energy sources. The significant share of natural gas in electricity production, sustained by imports from North Africa, demonstrates that even in the face of global crises, Italy has managed to maintain energy stability. At the same time, the noticeable increase in the share of wind energy indicates a growing awareness of the need to diversify energy sources [].
4.5. Norway
Norway is an exceptional example of a European country in terms of energy production, obtaining around 80% of its energy from hydroelectric power plants, and the rest from wind farms []. Additionally, Norway has vast natural gas reserves, which it supplies to Europe, but uses natural gas to a limited extent for electricity production itself []. The high share of hydropower in the energy mix is illustrated in Figure 9. Climate change, including droughts and low water levels in rivers, poses a threat to the energy generation system that depends on hydropower plants. Norway has been investing in wind farms for several years as an alternative to hydroelectric power plants, as well as a source of renewable energy []. Despite possessing vast natural gas resources, the country is not building gas-fired power plants, but instead continues its strategy of utilizing renewable energy sources as the dominant method for energy production.
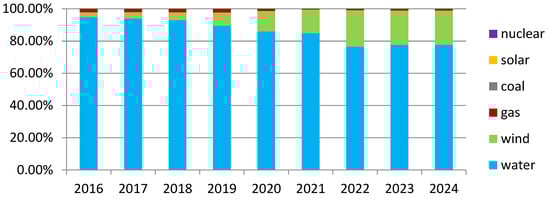
Figure 9.
Share of electricity production from six primary sources of energy in Norway from January 2016 to May 2024. Source: own elaboration based on [].
In the case of Norway, due to the lack of coal as a source of electricity generation, it is not possible to determine the C/G coefficient. The comparison of emission allowances prices was made in this situation with the average hourly production of electricity from natural gas and the correlation coefficient between these variables was calculated. Figure 10 shows the relationship between the average price of CO2 emission allowances and the average hourly production of electricity from natural gas in MW for Norway from January 2016 to May 2024.
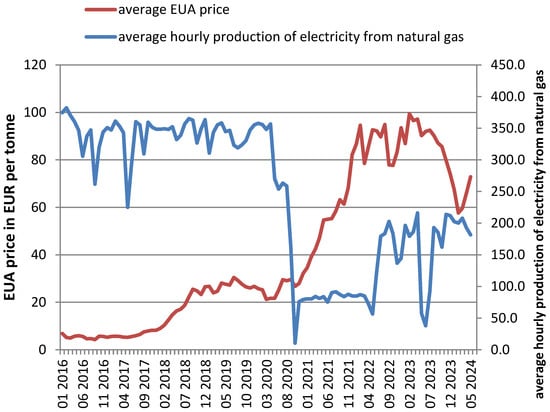
Figure 10.
Change in CO2 emission allowance prices and average hourly production of electricity from natural gas for Norway from January 2016 to May 2024. Source: own elaboration based on [].
In 2021, Norway significantly reduced its already low production of energy from natural gas. This period coincided with increased price volatility in the CO2 emission allowances market, where the price of allowances increased five-fold from 20 EUR per ton to nearly 100 EUR per ton in 2022. During the studied period from January 2016 to May 2024, the correlation coefficient was −0.74, indicating a strong relationship between the use of gas for energy production and the price of emission allowances. Since 2021, the increase in emission allowance prices has been accompanied by an increase in natural gas prices, which can be partially explained by a more profitable increase in gas exports from Norway rather than its use for electricity generation.
Despite having vast reserves of natural gas, Norway continues its strategy of utilizing renewable energy sources as the dominant method for energy production. Climate change poses a challenge to the hydropower-based energy system, which is why investments in wind energy are key to Norway’s energy future. The increasing prices of CO2 emissions allowances and natural gas influence decisions regarding the export and utilization of gas in Norway.
4.6. Poland
Poland significantly differs from other European countries in terms of the structure of electricity production sources, with coal still maintaining a very high level of contribution. In 2016, coal’s share accounted for nearly 90%, but by the beginning of 2024, it had decreased to around 65% []. Natural gas production makes up approximately 10% and is mainly used for balancing purposes during peak periods, complementing the energy system rather than serving as an alternative to coal-fired power plants []. Figure 11 illustrates Poland’s energy mix during the analyzed period. It can be observed that from 2022 onwards, there has been a decrease in coal utilization for electricity production, while there has been an increase in production from wind and solar power plants [].
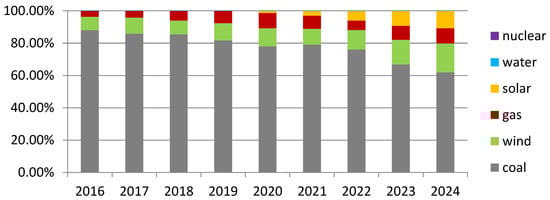
Figure 11.
Share of electricity production from six primary sources of energy in Poland from January 2016 to May 2024. Source: own elaboration based on [].
Despite using coal as the main source for energy production, the C/G coefficient decreased from 40 in 2016 to 10 in 2024 over the study period. Similar to other countries studied, Poland also experienced a decrease in the ratio during 2018–2019. The outbreak of war in Ukraine caused a sudden increase in the C/G coefficient to 20, as shown in Figure 12.
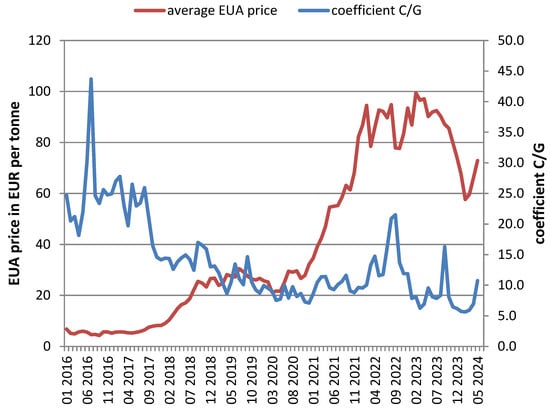
Figure 12.
Change in CO2 emission allowance prices and the C/G coefficient for Poland from January 2016 to May 2024. Source: own elaboration based on [].
The correlation coefficient for the studied period between the change in the price of CO2 emission allowances and the C/G coefficient was −0.53 for Poland. Before the outbreak of the war in Ukraine, this coefficient was higher, reaching −0.63 from January 2016 to January 2022. It can be assumed that the increase in the price of CO2 emission allowances compels some energy producers to decrease the share of coal in the energy mix. However, the higher cost associated with EUA fees is passed on to the end consumer, leading to higher energy costs in Poland compared to other European countries. Poland, despite its high share of coal in electricity production, is beginning to show trends towards increasing the share of renewable energy sources. The policy of additional CO2 charges influences changes in the energy mix; however, the country’s geographical and climatic conditions limit the possibility of a rapid transition to renewable energy sources. The development of wind farms on the coast and the planned construction of nuclear power plants may in the future reduce dependence on coal and lower energy costs in Poland.
The results obtained from the studies conducted in individual countries, using a unified research methodology, could serve as the basis for further comparative and cross-sectional research, taking into account, for example, the assessment of the effectiveness of EU ETS policy from the perspective of representatives of various stakeholder groups in energy transformation (policy makers, businesses, environmental groups, etc.).
5. Conclusions
The research topics addressed are highly relevant in the context of ongoing climate change, the pursuit of reducing greenhouse gas emissions, and achieving climate neutrality by European countries, primarily through the implementation of sustainable transformations. These transformations, particularly crucial following the outbreak of the war in Ukraine, include the replacement of high-emission fossil fuels with low-emission energy sources (such as solar, wind, water, and nuclear energy, as studied in the conducted research).
In accordance with the research goal of assessing the effectiveness of the EU ETS policy in changing the energy mix in selected European countries (Germany, France, Spain, Italy, Norway, and Poland), analyses were conducted in two key areas:
- (1)
- assessment of changes in the energy mix structure;
- (2)
- evaluation of the relationship between the increase in CO2 emission allowance prices and the decrease in the coal share in the energy mix.
Based on the conducted analyses, it can be concluded that during the period of January 2016–March/May 2024, changes in the structure of energy sources acquisition differed in the studied European countries. These differences were influenced by the energy strategies adopted by these states, the availability of resources, and the geopolitical situation.
Germany and Spain were characterized by significant energy diversification. In Germany, there was a transition from a high share of coal energy production (50% in 2016) and a gradual phase-out of nuclear energy production towards an increased focus on wind energy production (43% by May 2024). It is worth noting that in 2023, the share of new wind installations in Germany was the highest among all European countries, accounting for 21% []. At the end of the study period, low-emission sources accounted for a higher share of the energy mix than high-emission sources. Spain, in turn, is an example of a country that utilizes all the energy sources analyzed, with a noticeable trend towards increasing the share of low-emission sources, which reached 84% by May 2024.
In France and Norway, energy diversity was limited and mainly focused on low-emission sources. In France, nuclear energy predominated (accounting for 85–75% of all sources during the study period), with a gradual increase in wind energy production after 2022 (reaching 11% by March 2024). In Norway, hydropower was the dominant source of energy production (making up 95% by May 2016), with a slight decrease in favor of alternative wind energy (which rose to 21% by May 2024). The war in Ukraine had no impact on the diversification of energy sources in both countries. The only threat to low-emission energy production in Norway is climate change, including droughts. However, the country does not need to worry about a lack of energy sources, as it has significant gas reserves.
There was also a limited diversity in energy sources in Italy and Poland, with a focus primarily on high-emission sources such as gas in Italy (with an average share of 55–75% in the energy mix) and coal in Poland (with an average share ranging from 62 to 88%). In both countries, there has been a noticeable increase in the share of low-emission energy since 2022, reaching 41% in Italy and 29% in Poland as of May 2024.
The transformation in the structure of energy source procurement, focusing on low-emission sources, was also driven by changes in the prices of CO2 emission allowances. The increase in these prices was intended to encourage countries to reduce the share of fossil fuels, including coal, in the total energy mix. In order to verify these assumptions, the EU ETS and the application of the Pearson correlation coefficient in the analysis resulted in different values in the studied European countries. During the selected research period, a strong negative correlation was observed in Spain (−0.67) and Poland (−0.53), indicating that an increase in the price of CO2 emission allowances led to a decrease in the utilization of coal and gas energy production. In Spain, the C/G coefficient ranged from 0.1 to 1.2, while in Poland, it ranged from 5.6 to 43.7 (due to the significant reliance on coal as the primary source of energy). Moderate levels of correlation were observed in Germany (−0.48) and France (−0.49), while the lowest was in Italy (−0.37). In the latter country, where gas is the leading source of energy, the C/G coefficient ranged from 0.0 to 0.5 during the study, showing the weakest link to the average price of CO2 emission allowances among all countries. It is noteworthy that, outside of Spain, the studied correlation values were higher until the outbreak of the war in Ukraine. This situation disrupted the previously adopted national strategy of moving away from high-emission sources due to the renewed use of coal for energy production, as a substitute for Russian gas (as seen in Germany), and influenced the diversification of sources, including renewables (in Italy, Spain, Germany, and Poland).
Due to the previously mentioned lack of coal utilization in Norway as a source for energy production and the application of average hourly natural gas production, a very strong negative correlation of −0.74 was observed. This indicates that the increase in the price of CO2 emission allowances significantly influenced the government’s decisions regarding gas exports.
The analysis conducted leads to the conclusion that access to energy resources and the opportunities for the use of renewable energy sources (which depend, among other factors, on geographical location) have different impacts in the surveyed countries on the evaluation of the effectiveness of the EU ETS policy in terms of changing the energy mix. This policy represents a significant burden for the economies of countries that rely on their own energy resources, thus hindering their ability to compete with economies of countries better positioned to utilize renewable energy sources. Examples from France and Norway suggest that countries utilizing low-emission energy sources are less vulnerable to transformation costs. On the other hand, Poland, with a high share of coal, incurs higher costs, resulting in a significant burden on the economy. Furthermore, Poland’s geographical limitations prevent the efficient utilization of solar and wind energy. According to Poland’s Energy Policy (PEP), the target for renewables by 2030 is 29.8%, which is below the EU-required minimum of 32% [].
Therefore, it can be concluded that the EU ETS policy does not fulfill its assigned role, as its implementation differentiates the economic situation of European countries and creates conditions for uneven competition. The differences in electricity prices in the studied countries of Europe have been explained as a result of the conducted research. According to data from Bloomberg/ENTSO-E European Network of Transmission System Operators for Electricity as of 25 June 2024, prices in EUR per 1 MWh were as follows: Germany—75.60; France—45.74; Spain—70.07; Italy—114.01; Norway—33.23; and Poland—137.85. A significant share of high-emission sources in energy production results in higher energy prices due to production costs and fees for CO2 emissions. As a result, energy prices in Poland and Italy are higher, while Norway and France experience significantly lower energy prices.
The actions taken within the framework of the EU ETS policy regarding the change in the energy mix are of immense importance for the future of Europe as well as the world. The main stakeholders of this policy include decision-makers at both state and local levels, the broadly defined business sector, environmental organizations, and society. Decision-makers, primarily state governments, should undertake numerous tasks related to building a clean energy system, conserving energy, reducing emissions across various sectors of the economy, introducing green financing, promoting a low-emission lifestyle among the public, and enhancing the ecological capacity of CO2 sinks []. The latest policies related to supporting negative emissions include, among others, afforestation and the protection of existing forests, as well as the introduction of a blue economy. According to a KPMG report, governments of countries with relevant coastlines have started to pay attention to oceans, seas, and shores to support their efforts in reducing CO2 emissions []. The implementation of stringent policies by decision-makers aimed directly at the development of the energy sector (including government subsidies), the increase in environmental protection taxes, and the tightening of environmental standards (including those related to CO2 emissions) may have a positive impact on the production of energy from renewable sources and the reduction in CO2 emissions [,]. Furthermore, the process of achieving emission neutrality goals can be forecasted by analyzing CO2 emissions trends among various energy-consuming entities, against the backdrop of geographical and ecological environmental conditions [] as well as financial capabilities. Policies implemented by governments will have a direct impact on business and society, given the necessity for adaptation and the ability to meet new challenges driven by advancements in innovation, infrastructure, and technology. Consequently, these policies will create opportunities for ecological organizations to support initiatives aimed at improving energy efficiency and promoting low-emission mobility, as well as contributing to education and raising social awareness.
The results can serve as an information base for making responsible and informed decisions in the field of energy transformation in individual countries and collectively achieving the goals of the EU strategy to strengthen the effectiveness of the EU ETS policy.
Author Contributions
Conceptualization, M.B., A.C., I.K., A.M. and P.S.; methodology, M.B., A.C., I.K., A.M. and P.S.; software, A.M.; validation, M.B., A.C., I.K., A.M. and P.S.; formal analysis, M.B., A.C., I.K., A.M. and P.S.; investigation, M.B., A.C., I.K., A.M. and P.S.; resources, A.M.; data curation, A.M.; writing—original draft preparation, M.B., A.C., I.K., A.M. and P.S.; writing—review and editing, M.B., A.C., I.K., A.M. and P.S.; visualization, A.M. and P.S.; supervision, M.B., A.C., I.K., A.M. and P.S.; project administration, M.B.; funding acquisition, M.B., A.C., I.K., A.M. and P.S. All authors have read and agreed to the published version of the manuscript.
Funding
This research received no external funding.
Data Availability Statement
The data presented in this study are available on request from the corresponding author.
Conflicts of Interest
The authors declare no conflicts of interest.
References
- Przybojewska, I. Instrumenty Rynkowe w Prawie Ochrony Środowiska Unii Europejskiej; CH Beck: Warsaw, Poland, 2021. [Google Scholar]
- Lobus, N.V.; Knyazeva, M.A.; Popova, A.F.; Kulikovskiy, M.S. Carbon Footprint Reduction and Climate Change Mitigation: A Review of the Approaches, Technologies, and Implementation Challenges. C J. Carbon Res. 2023, 9, 120. [Google Scholar] [CrossRef]
- Hossain, E.; Faruque, H.M.R.; Sunny, S.H.; Mohammad, N.; Nawar, N. A Comprehensive Review on Energy Storage Systems: Types, Comparison, Current Scenario, Applications, Barriers, and Potential Solutions, Policies, and Future Prospects. Energies 2020, 13, 3651. [Google Scholar] [CrossRef]
- Beckmann, J.; Klöckner, K.; Letmath, P. Scenario-based multi-criteria evaluation of sector coupling-based technology pathways for decarbonization with varying degrees of disruption. Energy 2024, 297, 131248. [Google Scholar] [CrossRef]
- Rozkwitalska, M. Social Learning for Energy Transition—A Literature Review. Energies 2021, 14, 8531. [Google Scholar] [CrossRef]
- Niekurzak, M. The Potential of Using Renewable Energy Sources in Poland Taking into Account the Economic and Ecological Conditions. Energies 2021, 14, 7525. [Google Scholar] [CrossRef]
- Xiong, B.; Sui, Q. Does Carbon Emissions Trading Policy Improve Inclusive Green Resilience in Cities? Evidence from China. Sustainability 2023, 15, 12989. [Google Scholar] [CrossRef]
- Wang, X.; Sun, X.; Ahmad, M.; Chen, J. Energy transition, ecological governance, globalization, and environmental sustainability: Insights from the top ten emitting countries. Energy 2024, 292, 130551. [Google Scholar] [CrossRef]
- Segnon, M.; Lux, T.; Gupta, R. Modeling and forecasting the volatility of carbon dioxide emission allowance prices: A review and comparison of modern volatility models. Renew. Sustain. Energy Rev. 2017, 69, 692–704. [Google Scholar] [CrossRef]
- Berrisch, J.; Pappert, S.; Ziel, F.; Arsova, A. Modeling volatility and dependence of European carbon and energy prices. Financ. Res. Lett. 2023, 52, 103503. [Google Scholar] [CrossRef]
- Benz, E.; Trück, S. Modeling the Price Dynamics of CO2 Emission Allowances; Elsevier Science: Amsterdam, The Netherlands, 2008; Available online: https://papers.ssrn.com/sol3/papers.cfm?abstract_id=903240 (accessed on 10 June 2024).
- Hammoudeh, S.; Nguyen, D.K.; Ricardo, M.S. Energy prices and CO2 emission allowance prices: A quantile regression approach. Energy Policy 2014, 70, 201–206. [Google Scholar] [CrossRef]
- Böhm, L.; Kolb, S.; Plankenbühler, T.; Miederer, J.; Markthaler, S.; Karl, J. Short-Term Natural Gas and Carbon Price Forecasting Using Artificial Neural Networks. Energies 2023, 16, 6643. [Google Scholar] [CrossRef]
- Jåstad, E.O.; Bolkesjø, T.F. Modelling emission and land-use impacts of altered bioenergy use in the future energy system. Energy 2023, 265, 126349. [Google Scholar] [CrossRef]
- Suproń, B.; Myszczyszyn, J. Impact of Renewable and Non-Renewable Energy Consumption and CO2 Emissions on Economic Growth in the Visegrad Countries. Energies 2023, 16, 7163. [Google Scholar] [CrossRef]
- Aslan, A.; Ilhan, O.; Usama, A.; Savranlar, B.; Polat, M.; Metawa, N.; Raboshuk, A. Effect of economic policy uncertainty on CO2 with the discrimination of renewable and non renewable energy consumption. Energy 2024, 291, 130382. [Google Scholar] [CrossRef]
- Degirmenci, T.; Yavuz, H. Environmental taxes, R&D expenditures and renewable energy consumption in EU countries: Are fiscal instruments effective in the expansion of clean energy? Energy 2024, 299, 131466. [Google Scholar] [CrossRef]
- Siddik, A.B.; Khan, S.; Khan, U.; Yong, L.; Murshed, M. The role of renewable energy finance in achieving low-carbon growth: Contextual evidence from leading renewable energy-investing countries. Energy 2023, 270, 126864. [Google Scholar] [CrossRef]
- Inglesi-Lotz, R. The impact of renewable energy consumption to economic growth: A panel data application. Energy Econ. 2016, 53, 58–63. [Google Scholar] [CrossRef]
- Grzegorczyk, F. Carbon Border Adjustment Mechanism (CBAM)—A few reflections on the basis of the European Green Deal. In Economy in the Synergy of Economic, Financial and Environmental Law; Powałowski, A., Ed.; CH Beck: Warsaw, Poland, 2022. [Google Scholar]
- Wemaere, M.; Streck, C.; Chagas, T. Legal Ownership and Nature of Kyoto Units and EU Allowances. In Legal Aspects of Carbon Trading; Freestone, D., Streck, C., Eds.; Copenhagen, and beyond: Kyoto, Japan; Oxford, UK, 2009; p. 37. [Google Scholar]
- The Kyoto Protocol to the United Nations Framework Convention on Climate Change, adopted on 11 December 1997. J. Laws 2005, 19, 1684.
- Directive 2003/87/EC of the European Parliament and of the Council of 13 October 2003 establishing a system for greenhouse gas emission allowance trading within the Community and amending Council Directive 96/61/EC. OJ L 2003, 275, 32–46.
- Regulation (EU) 2021/1119 of the European Parliament and of the Council of 30 June 2021 establishing the framework for achieving climate neutrality and amending Regulations (EC) No 401/2009 and (EU) 2018/1999 (‘European Climate Law’) PE/27/2021/REV/1. OJ L 2021, 243, 1–17.
- The Paris Agreement to the United Nations Framework Convention on Climate Change, adopted in New York on 9 May 1992, as of 12 December 2015. J. Laws 2017, 36.
- Directive (EU) 2018/410 of the European Parliament and of the Council of 14 March 2018 amending Directive 2003/87/EC to enhance cost-effective emission reductions and low-carbon investments, and Decision (EU) 2015/1814. OJ L 2018, 76, 3–27.
- Decision (EU) 2015/1814 of the European Parliament and of the Council of 6 October 2015 concerning the establishment and operation of a market stability reserve for the Union greenhouse gas emission trading scheme and amending Directive 2003/87/EC. OJ L 2015, 264, 1–5.
- Communication from the Commission to the European Parliament, the European Council, the Council, the European Economic and Social Committee and the Committee of the regions. In The European Green Deal; COM: Brussels, Belgium, 2019; p. 640.
- Porzeżyńska, M. Pomoc Państwa na Produkcję Energii ze Źródeł Odnawialnych w Prawie Unii Europejskiej; CH Beck: Warsaw, Poland, 2020. [Google Scholar]
- Directive (EU) 2023/959 of the European Parliament and of the Council of 10 May 2023 amending Directive 2003/87/EC establishing a system for greenhouse gas emission allowance trading within the Union and Decision (EU) 2015/1814 concerning the establishment and operation of a market stability reserve for the Union greenhouse gas emission trading system. OJ L 2023, 130, 134–202.
- Communication from the Commission to the European Parliament; the European Council; the Council; the European Economic and Social Committee and the Committee of the regions. Communication from the Commission to the European Parliament, the Council, the European Economic and Social Committee and the Committee of the Regions; Commission Work Programme 2021 A; Union of Vitality in a World of Fragility; COM: Brussels, Belgium, 2020; p. 690. [Google Scholar]
- Maruszkin, R. (Ed.) Commentary on the Emissions Trading System Act; CH Beck: Warsaw, Poland, 2023. [Google Scholar]
- Announcement of the Marshal of the Sejm of the Republic of Poland of 27 January 2023 regarding the publication of the consolidated text of the Act on the system of trading greenhouse gas emission allowances. J. Laws 2023, 589.
- Case C-5/16: Judgment of the Court (Second Chamber) of 21 June 2018—Republic of Poland v European Parliament, Council of the European Union (Action for annulment—Decision (EU) 2015/1814—Determination of legal basis—No taking into account of the effects of a measure—Article 192(1) TFEU—Article 192(2)(c) TFEU—Measures significantly affecting a Member State’s choice between different energy sources and the general structure of its energy supply—Principle of sincere cooperation—Article 15 TEU—Powers of the European Council—Principles of legal certainty and protection of legitimate expectations—Principle of proportionality—Impact assessment). OJ C 2018, 285, 483.
- Stoczkiewicz, M. The role of the courts in EU climate policy. In Handbook on European Union Climate Change Policy and Politics; Edward Elgar Publishing: Cheltenham, UK, 2023; pp. 129–142. [Google Scholar]
- Uchwała Sejmu Rzeczypospolitej Polskiej z Dnia 9 Grudnia 2021 r. w Sprawie Wezwania Państw Unii Europejskiej do Zawieszenia Unijnego Systemu Handlu Uprawnieniami do Emisji (EU ETS) i Podjęcia Działań na Rzecz Reformy(M.P.2021.1179). Available online: https://isap.sejm.gov.pl/isap.nsf/DocDetails.xsp?id=WMP20210001179 (accessed on 13 July 2024).
- Raport Najwyższej Izby Kontroli, Bariery Rozwoju Odnawialnych Źródeł Energii, Warsaw 2021. Available online: https://www.nik.gov.pl/kontrole/wyniki-kontroli-nik/kontrola,21436.html (accessed on 25 June 2024).
- Kiedy Zniesienie Zasady 10H? Rynek Liczy na Przyśpieszenie Prac Legislacyjnych. Available online: https://www.cire.pl/artykuly/o-tym-sie-mowi/kiedy-zniesienie-zasady-10-h-rynek-liczy-na-przyspieszenie-praclegislacyjnych- (accessed on 25 June 2024).
- Sobieraj, K. Wyzwania w zakresie wdrażania unijnej polityki klimatycznej w dobie kryzysu energetycznego na przykładzie odnawialnych źródeł energii. Gdańskie Stud. Prawnicze 2023, 4, 122–136. [Google Scholar] [CrossRef]
- Stoczkiewicz, M. Prawo klimatyczne potrzebne od zaraz. Rzeczpospolita, 29 March 2023. [Google Scholar]
- Bundes-Klimaschutzgesetzes. Bundesgesetzblatt. 12 December 2019; p. 2513. Available online: https://www.bundesverfassungsgericht.de/SharedDocs/Entscheidungen/DE/2021/03/rs20210324_1bvr265618.html (accessed on 24 June 2024).
- Stoczkiewicz, M. Klimatyczne spory sądowe. Globalny fenomen w prawnej ochronie klimatu. In Studia Prawnoustrojowe; Wydawnictwo Uniwersytetu Warmińsko-Mazurskiego w Olsztynie: Olsztyn, Poland, 2024; Nr 64. [Google Scholar]
- Regulation (EU) 2019/943 of the European Parliament and of the Council of 5 June 2019 on the internal market for electricity. OJ L 2019, 158, 54–124.
- Hawkins, C.A.; Weber, J.E. Statistical Analysis: Applications to Business and Economics; Harper & Row: New York, NY, USA, 1980. [Google Scholar]
- Debbie, L.; Hahs-Vaughn, D.L.; Lomax, R. An Introduction to Statistical Concepts; Routledge: New York, NY, USA, 2020. [Google Scholar] [CrossRef]
- Owsiak, S. Finanse; PWE: Warszawa, Poland, 2015; p. 86. [Google Scholar]
- Schleicher-Tappeser, R. How renewables will change electricity markets in the next five years. Energy Policy 2012, 48, 64–75. [Google Scholar] [CrossRef]
- Bloomberg/ENTSO-E European Network of Transmission System Operators for Electricity. Available online: https://www.bloomberg.com/asia (accessed on 18 June 2024).
- Gawel, E.; Strunz, S.; Lehmann, P. A public choice view on the climate and energy policy mix in the EU—How do the emissions trading scheme and support for renewable energies interact? Energy Policy 2014, 64, 175–182. [Google Scholar] [CrossRef]
- European Environment Agency Report 07/2023. Trends and Projections in Europe 2023—Tracking Progress towards Europe’s Climate and Energy Targets. Available online: https://www.eea.europa.eu/publications/trends-and-projections-in-europe-2023 (accessed on 20 June 2024).
- Benton, T.; Froggatt, A.; Wellesley, L.; Grafham, O.; The Ukraine War and Threats to Food and Energy Security. Chatham House—International Affairs Think Tank. 2022. Available online: https://www.chathamhouse.org/sites/default/files/2022-04/2022-04-12-ukraine-war-threats-food-energy-security-benton-et-al_0.pdf (accessed on 20 June 2024).
- World Nuclear Association. Nuclear Power in France. 2023. Available online: https://wna.origindigital.co/information-library/country-profiles/countries-a-f/france (accessed on 20 June 2024).
- Renewable Energy Capacity Statistics 2022. IRENA. Available online: https://www.irena.org/publications/2022/Apr/Renewable-Capacity-Statistics-2022 (accessed on 20 June 2024).
- European Environment Agency. 2022. Trends and Projections in Europe 2022—Tracking Progress towards Europe’s Climate and Energy Targets. Available online: https://www.eea.europa.eu/publications/trends-and-projections-in-europe-2022 (accessed on 22 June 2024).
- Energy Policies of IEA Countries: France 2023 Review. International Energy Agency. Available online: https://iea.blob.core.windows.net/assets/2e740989-204d-4444-ab0f-7b4733e1541e/WEO2023_Executivesummary_French.pdf (accessed on 22 June 2024).
- Montoya, F.G.; Aguilera, M.J.; Manzano-Agugliaro, F. Renewable energy production in Spain: A review. Renew. Sustain. Energy Rev. 2014, 33, 509–531. [Google Scholar] [CrossRef]
- Duffield, J. The politics of renewable power in Spain. Eur. J. Gov. Econ. 2020, 9, 5–25. [Google Scholar] [CrossRef]
- Martínez, F.G.; Pacce, M. The Spanish Electricity Sector in the Face of Rising Gas Prices and the Government Measures Rolled Out in Response. Banco De Espana 2023. Documentos Ocasionales, No. 2316. Available online: https://repositorio.bde.es/handle/123456789/33330 (accessed on 24 June 2024). [CrossRef]
- Frilingou, N.; Xexakis, G.; Koasidis, K.; Nikas, A.; Campagnolo, L.; Delpiazzo, E.; Chiodi, A.; Gargiulo, M.; McWilliams, B.; Koutsellis, T.; et al. Navigating through an energy crisis: Challenges and progress towards electricity decarbonisation, reliability, and affordability in Italy. Energy Res. Soc. Sci. 2023, 96, 102934. [Google Scholar] [CrossRef]
- Esposito, L.; Romagnoli, G. Overview of policy and market dynamics for the deployment of renewable energy sources in Italy: Current status and future prospects. Heliyon 2023, 9, e17406. [Google Scholar] [CrossRef] [PubMed]
- Henderson, J. The Impact of the Russia-Ukraine War on Global Gas Markets. Curr. Sustain. Renew. Energy Rep. 2024, 11, 1–9. Available online: https://link.springer.com/article/10.1007/s40518-024-00232-x (accessed on 22 June 2024). [CrossRef]
- Fermeglia, M.; Bevilacqua, P.; Cafaro, C.; Ceci, P.; Fardelli, A. Legal Pathways to Coal Phase-Out in Italy in 2025. Energies 2020, 13, 5605. [Google Scholar] [CrossRef]
- Killingtveit, A. 8—Hydropower. In Managing Global Warming: An Interface of Technology and Human; Academic Press: Cambridge, MA, USA, 2019; pp. 265–315. [Google Scholar] [CrossRef]
- Norway 2022. Energy Policy Review. International Energy Agency. Available online: https://iea.blob.core.windows.net/assets/de28c6a6-8240-41d9-9082-a5dd65d9f3eb/NORWAY2022.pdf (accessed on 20 June 2024).
- Kaltenborn, B.; Keller, R.; Krange, O. Attitudes toward Wind Power in Norway–Solution or Problem in Renewable Energy Development? Environ. Manag. 2023, 72, 922–931. [Google Scholar] [CrossRef]
- Szpor, A.; Ziółkowska, K. The Transformation of the Polish Coal Sector. Energy Policy 2018, 120, 645–654. Available online: https://www.iisd.org/system/files/publications/transformation-polish-coal-sector.pdf (accessed on 22 June 2024).
- Rybak, A.; Rybak, A.; Joostberens, J. The Impact of Removing Coal from Poland’s Energy Mix on Selected Aspects of the Country’s Energy Security. Sustainability 2023, 15, 3457. [Google Scholar] [CrossRef]
- Attia, S.; Kosiński, P.; Wójcik, R.; Węglarz, A.; Koc, D.; Laurent, O. Energy efficiency in the polish residential building stock: A literature review. J. Build. Eng. 2022, 45, 103461. [Google Scholar] [CrossRef]
- Energetyka wiatrowa w Polsce. Report 2024. p. 11. Available online: https://windenergy-tpa.pl/ (accessed on 29 June 2024).
- Rynek fotowoltaiki w Polsce. Raport 2024. Instytut Energetyki Odnawialnej., p. 17. Available online: https://ieo.pl/raport-rynek-fotowoltaiki-w-polsce-2024 (accessed on 29 June 2024).
- Liu, Z.; Deng, Z.; He, G.; Wang, H.; Zhang, X.; Lin, J.; Qi, Y.; Liang, X. Challenges and opportunities for carbon neutrality in China. Nat. Rev. Earth Environ. 2022, 3, 141–155. [Google Scholar] [CrossRef]
- Net Zero Readiness Report 2023. KPMG ESG. p. 27. Available online: https://kpmg.com/xx/en/home/insights/2023/09/net-zero-readiness-report-2023.html (accessed on 29 July 2024).
- Godawska, J.; Wyrobek, J. The Impact of Environmental Policy Stringency on Renewable Energy Production in the Visegrad Group Countries. Energies 2021, 14, 6225. [Google Scholar] [CrossRef]
- Wolde-Rufael, Y.; Mulat-Weldemeskel, E. Do environmental taxes and environmental stringency policies reduce CO2 emissions? Evidence from 7 emerging economies. Environ. Sci. Pollut. Res. 2020, 28, 22392–22408. [Google Scholar] [CrossRef] [PubMed]
- Zhou, C.; Zhang, R.; Loginova, J.; Sharma, V.; Zhang, Z.; Qian, Z. Institutional Logic of Carbon Neutrality Policies in China: What Can We Learn? Energies 2022, 15, 4391. [Google Scholar] [CrossRef]
Disclaimer/Publisher’s Note: The statements, opinions and data contained in all publications are solely those of the individual author(s) and contributor(s) and not of MDPI and/or the editor(s). MDPI and/or the editor(s) disclaim responsibility for any injury to people or property resulting from any ideas, methods, instructions or products referred to in the content. |
© 2024 by the authors. Licensee MDPI, Basel, Switzerland. This article is an open access article distributed under the terms and conditions of the Creative Commons Attribution (CC BY) license (https://creativecommons.org/licenses/by/4.0/).