


Abstract
Pumped storage power is considered an ideal regulated power source for new energy. However, the traditional one-dimensional characteristic line method cannot predict the pulsating pressure caused by the reverse “S” characteristic of a pump–turbine. In this paper, a variable-step Euler algorithm is presented to calculate the hydraulic transient process of pumped storage units, the interval times of start-up and load regulation between two pump–turbine units are investigated by using the method of peak staggering and valley filling, and the closure law of guide vanes in the transient process of load rejection is optimized. The results show that the presented method is valid, and that pulsating pressure is accurately captured during the transient process of load rejection. The water level fluctuation amplitude in the surge chamber is greatly reduced by the sequential start-up mode. The rotational speed fluctuation amplitude of the sequential load reduction is also reduced. After the load of two pump–turbine units is rejected at the same time, the duration of pulsating pressure in the spiral case is shortened by 45% by using the quick-then-slow closure law compared with the straight-line closure law. Moreover, the pulsating pressure amplitude and the second peak value of rotational speed are also reduced accordingly, and the transient characteristics of the pump–turbine units are greatly improved.
1. Introduction
With the rapid development of nuclear energy and new energy sources such as wind and solar energy [1], the support of energy storage facilities is required due to their weak regulation ability. In general, battery energy storage [2], compressed air energy storage [3], and flywheel energy storage [4] are good options, but the consensus is that pumped storage power stations (PSPSs) are the most mature and large-scale ideal regulated power sources [5,6,7]. Therefore, the Chinese mainland is vigorously developing pumped storage technology. By the end of 2023, the installed capacity of the PSPSs under construction in China reached 167 million kW, and it is expected to reach 300 million kW by 2035 [8].
PSPSs perform the roles of frequency regulation, peak load shaving, and emergency power supply in the power grid [9,10]. To accomplish the above tasks, pump–turbines (PTs) need to constantly go through various transient processes between start-up and shutdown, which poses a challenge to the safe and stable operation of PTs. No-load instability is a typical operating problem of PTs. Zhao et al. studied the no-load operational dynamic characteristic by bifurcation diagrams, and analyzed the no-load stability of PTs by introducing step disturbances and slopes. They found that different disturbance intensities and slopes have different influences on no-load stability [11]. Sun et al. investigated the possibility of misaligned guide vanes (MGVs) to control the stability in the S region, and found that MGVs can improve the no-load stability, but intensify pressure fluctuation [12]. During the start-up transient process in the power generation mode, due to large variations in the parameters such as discharge and water head, the vibration of the pump–turbine unit (PTU) will inevitably be intensified, which threatens the safe operation of the PTU. Yang et al. studied the flow-induced vibration of PTUs by a three-dimensional CFD method, and believed that it was strongly related to the axial thrust caused by the fluid flow [13]. There is a large amount of research literature with a focus on water hammer pressure and pulsating pressure during the transient process of load rejection. Zeng et al. developed a simplified mathematical model of transient process, derived the analytical expression for the change rate of water head, and discussed the relationship between the trajectory slopes in different domains and water hammer pressure, and optimized the guide vane closure schemes for reducing the maximum transient pressure. They believe that three-phase valve-closing schemes have advantages in controlling pulsating pressure and runaway velocity [14]. Zhao et al. proposed a novel optimization framework to derive the optimal operating policies for a pumped storage hydropower system. The results showed that the maximum water pressure of the volute and the vacuum in the draft tube could be improved by 5.59% and 9.6%, and the rotational speed oscillation also be decreased, compared with the on-site operation [15]. Ye et al. developed a water hammer pressure model combined with genetic algorithms or the non-dominated sorting genetic algorithm II, and optimized the closure schemes for the guide vanes of the PT and ball valve. The results showed that the pressure coefficient in the pump-turbine was reduced. However, due to the error of the peak-to-peak diagrams, the estimated fluctuating pressure in the proposed model was inevitably biased, and this method needs to be improved [16]. Zhang et al. formulated a dynamic model of the PT by introducing a stochastic variable, investigated the stochastic dynamic characteristics of the PT in the load-rejection process, and analyzed the effects of the stochastic intensity on the dynamic behavior of the PT. They found that stochastic hydraulic excitation has a significant influence on the safe and stable operation of a pump–turbine [17].
In short, more scholars are focused on the study of the transient process of load rejection. In fact, the optimization of the entire transient processes of PTUs in the power generation mode is also worthy of in-depth study. Compared with conventional hydropower plants, PSPSs have a small reservoir capacity, leading to a large variation in water head, coupled with the reverse “S” characteristics of the PT, so the operation stability of the PTU is poor and the load regulation is slow, which affects the operation safety of the PTU [18,19]. Traditionally, the characteristic line method is commonly used in hydraulic transition process calculations [17,20]. However, using this method makes it difficult to capture the pulsating pressure of the transition process. In this paper, taking “one diversion tunnel with two PTUs” as an example, a hydraulic–mechanical–electrical coupling model is constructed on the MATLAB platform, a variable-time-step Euler algorithm is presented, and the method of peak staggering and valley filling is used to calculate the appropriate peak staggering regulation time and optimize the closure law of the guide vanes to improve the characteristics of the transient process of the PTU. The calculation is performed by a personal computer with a 40-core CPU and 64G RAM, and the computing time for one operating condition is about 5 min.
The rest of this paper is organized as follows. In Section 2, the mathematical model of a pump–turbine regulation system and the project overview of a typical PSPS are introduced. Then, three typical transient processes are calculated and optimized in Section 3. Finally, our conclusions are summarized in Section 4.
2. Model of Pump–Turbine Regulation System
2.1. Model of Diversion Pipeline
2.1.1. Elastic Water Hammer Model
The diversion pipeline is composed of the diversion tunnel, pressure pipe, tailwater pipeline, and tailwater tunnel. The elastic water hammer model of the diversion pipeline is described by the following continuity and momentum equations [21]:
where is the water head (m), is the discharge (m3/s), is the flow velocity (m/s), is time (s), the coefficients , , is the water hammer wave speed (m/s), is the gravitational acceleration (m2/s), is the Darcy–Weisbach friction factor, is the section area of the pipeline (m2), and is the dimeter of the pipeline (m).
2.1.2. Algorithm of Hydraulic Transient Process
Equations (1) and (2) can be converted into the problem of the initial values of differential equations.
Generally, Equations (3) and (4) can be expressed in a generic form:
where the variable is , and the function is .
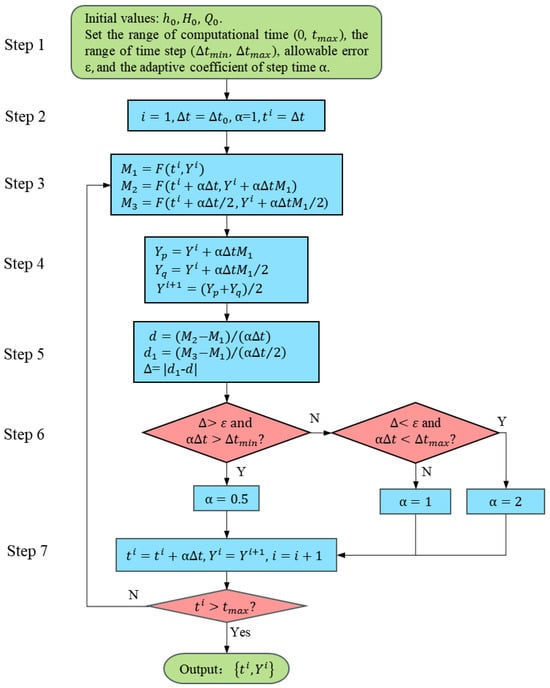
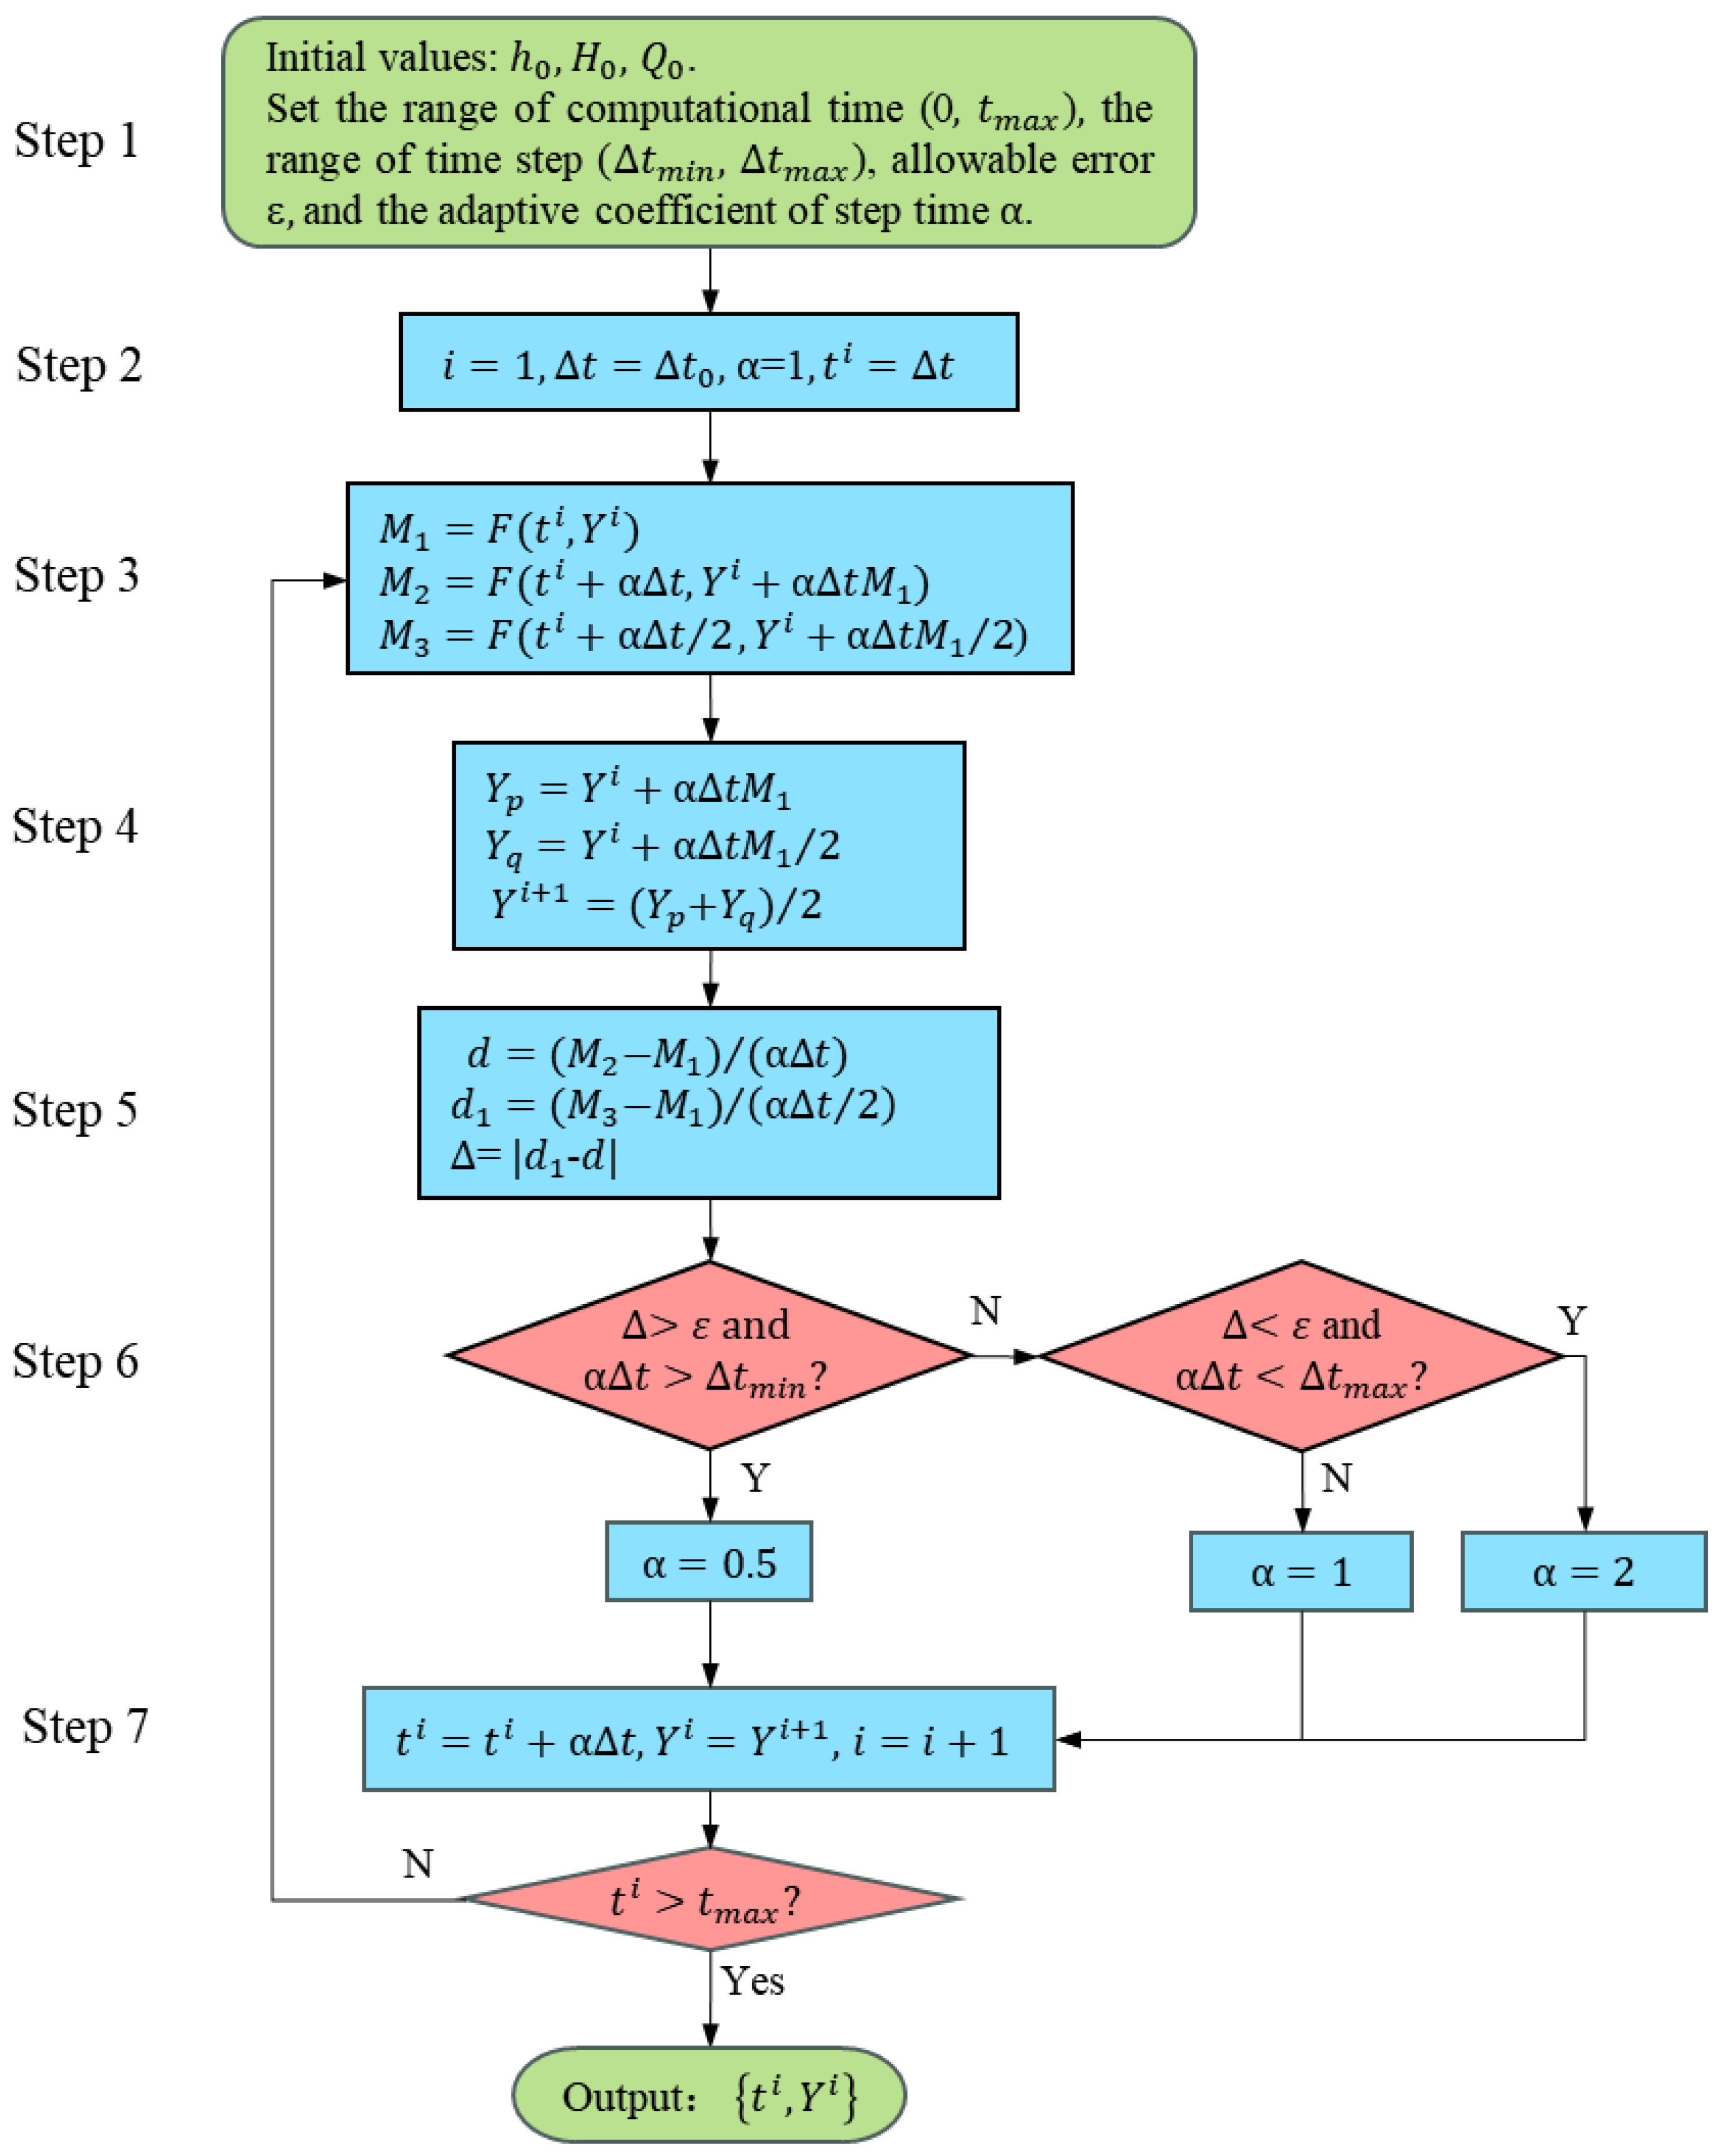
In this section, a variable-time-step Euler algorithm is presented [22]; the flowchart is shown in Figure 1.
Figure 1.
Flowchart of variable-time-step Euler algorithm.
Step 1: Give the initial values: the initial time step (), initial water head (), and initial discharge (), and set the range of computational time (0, ), the range of the time step (, ), the allowable error ε, and the adaptive coefficient of step time .
Step 2: Set the time step as equal to , the adaptive coefficient of the time step = 1, and the computational time .
Step 3: Calculate the intermediate functions , , and .
Step 4: Use a modified Euler method to calculate .
Step 5: Define the solution error ∆.
Step 6: Solve the adaptive coefficient of step time ; if the error ∆ is more than the allowable error ε and the time step is longer than the minimum time step , then the adaptive coefficient of step time is halved, i.e., . Otherwise, if the error ∆ is less than the allowable error ε and the time step is shorter than the maximum time step , then the adaptive coefficient of step time is doubled, i.e., , else, .
Step 7: Use the calculated results as the initial values for the next calculating time, return to Step 3, and repeat Step 3 to Step 7 until the computational time is greater than , then output the results ().
In general, the range of time steps is between 10−5 s and 0.01 s, and the pulsating pressure in the range of 10 Hz to 1000 Hz can be captured. The initial time step s, and the allowable error ε = 10−3.
2.2. Hydraulic Boundary Treatment
The hydraulic boundary contains the upstream and downstream reservoirs, surge chamber, and pump-turbine.
2.2.1. Upstream and Downstream Reservoirs
Due to the small volume of the upstream and downstream reservoirs of the PSPSs, they can be treated as limited containers. The relationship between the water level and discharge of the upstream reservoir can be described as follows [23]:
where is the water level of the upstream reservoir (m), is the discharge in the diversion tunnel (m3/s), is the surface area of the upstream reservoir (m2), the sign ‘−’ denotes the turbine operational condition, and ‘+’ denotes the pump operational condition.
Hence, the water level boundary of the upstream reservoir for the turbine operational condition can be obtained:
where is the time step (s), and is the adaptive coefficient of step time.
Similarly, the relationship between the water level and discharge of the down reservoir can be described as follows:
where is the water level of the downstream reservoir (m), is the discharge of the tailwater tunnel (m3/s), is the surface area of the upstream reservoir (m2), the sign ‘+’ denotes the turbine operational condition, and ‘−’ denotes the pump operational condition.
Therefore, the water level boundary of the downstream reservoir for the turbine operational condition can be solved as follows:
2.2.2. Surge Chamber
The surge chamber is an important hydraulic facility and mainly plays the role of suppressing water hammer pressure. Taking the impedance surge chamber as an example, its equations are composed of the momentum, continuity, and water level equations.
Momentum equation:
Continuity equation:
Water level equation:
where is the discharge of the surge chamber (m3/s), is the section area of the surge chamber (m2), is the water depth in the surge chamber (m), is the water head at the bottom of the surge chamber (m), is the discharge in the tunnel (m3/s), is the discharge of the PT (m3/s), is the water level in the surge chamber (m), is the impedance orifice area of the surge chamber (m2), and is the hydraulic loss coefficient of the impedance orifice.
Consequently, the boundary of the surge chamber can be written:
where is the hydraulic loss coefficient of the surge chamber, .
2.2.3. Pump–Turbine
In general, the unit parameters of the PT are defined as:
where is the unit speed (rpm), is the unit discharge (m3/s), is the unit moment (N-m), is the rotational speed of the prototype PT (rpm), is the discharge of the prototype PT (m3/s), is the moment of the prototype PT (N-m), is the water head of the the prototype PT (m), and is the diameter of the prototype PT (m).
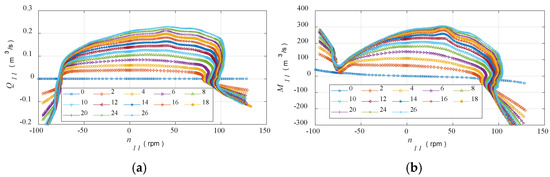
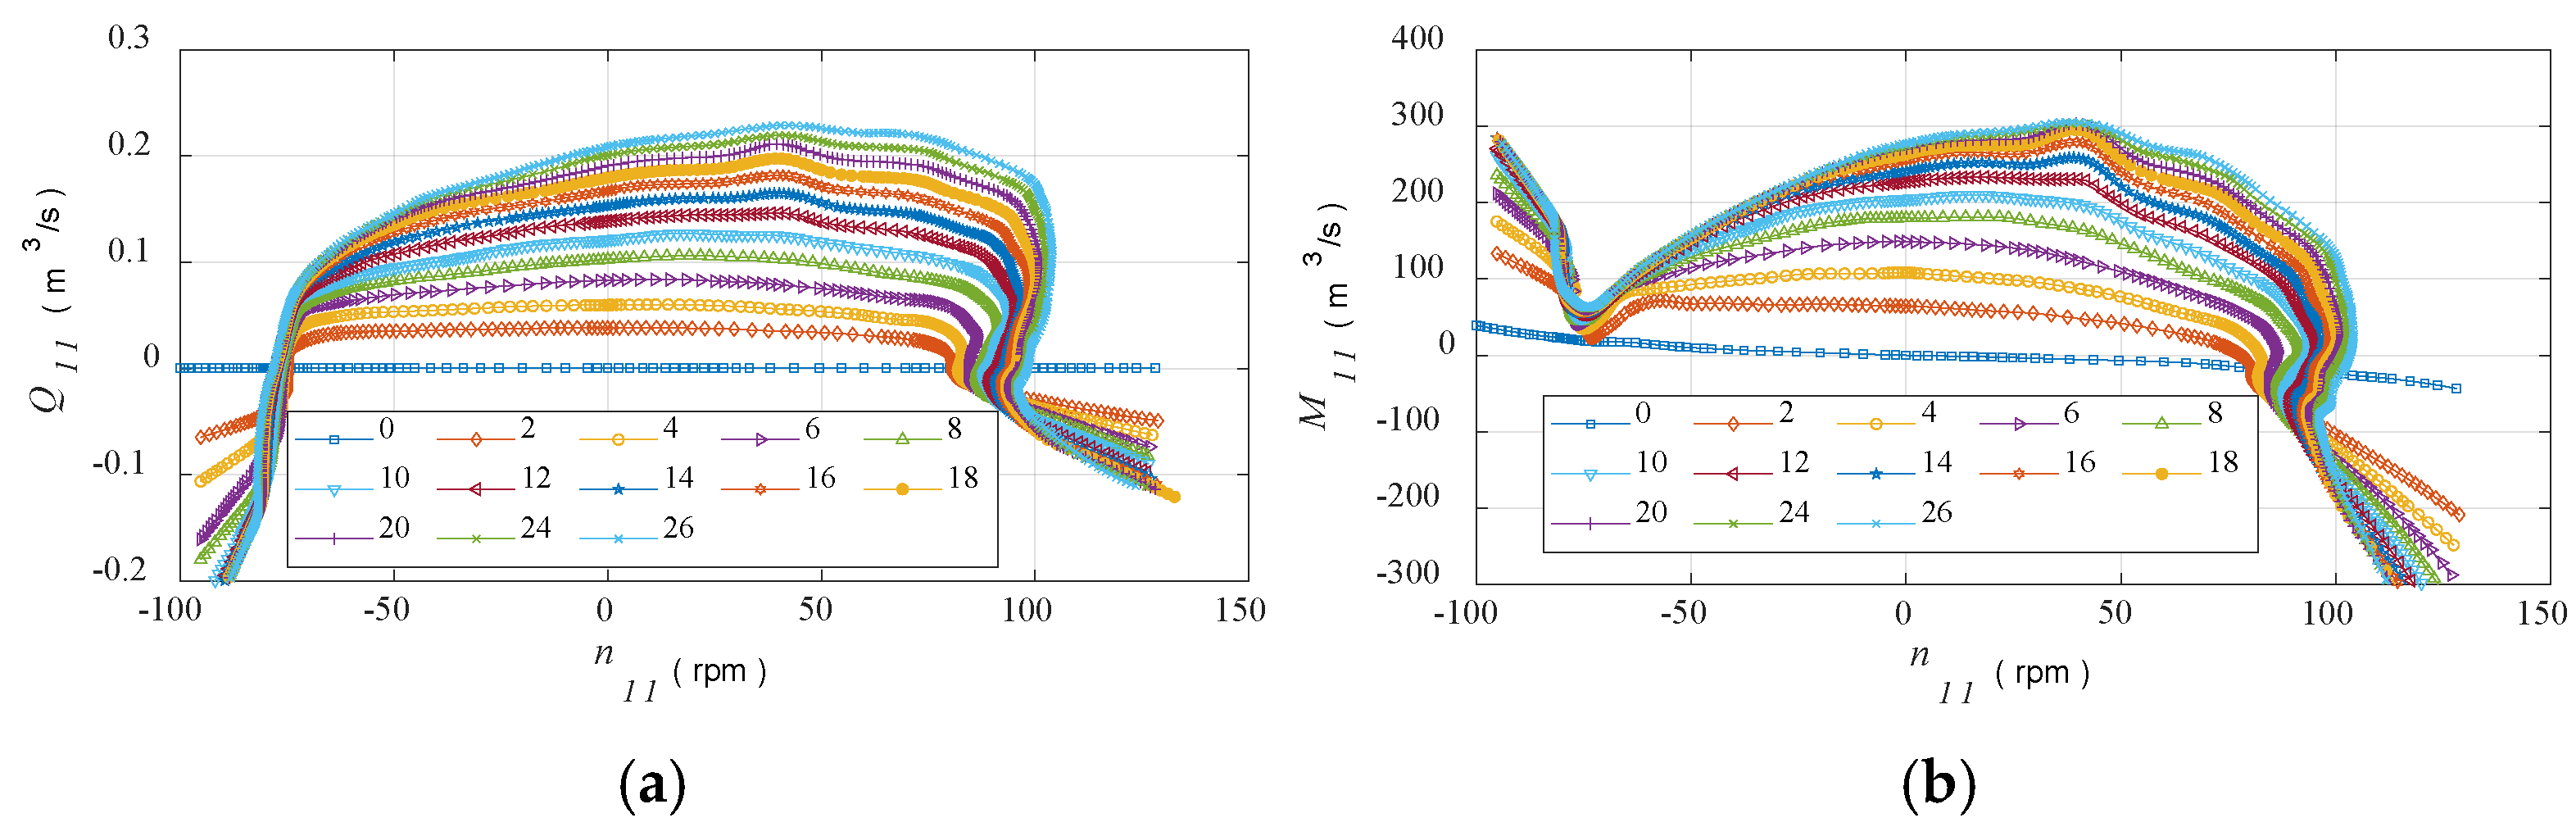
The complete characteristic curves of the model PT were obtained by the model tests in the manufacturing plant, as shown in Figure 2, including and curves.
Figure 2.
Model characteristic curves of PT. (a) curve. (b) curve.
It is evident that the characteristic curves have the inverse “S” feature, which result in multiple values in the inverse “S” region during interpolation. Therefore, the Suter transform [24] can convert them into the single-valued curves, and the transform is described as follows:
where , , , , is generally equal to 0.5 to 1.5, and the subscript ’r’ represents the rated value.
Through the above transform, and are the single-valued curves. During the calculation of the transient process, once is known, and can be obtained by the interpolation of the single-valued characteristic curves, and and can be reverse-calculated by Equations (17) and (18), then the discharge and moment of the prototype PT can be calculated:
where is the discharge of the prototype PT (m3/s), is the moment of the prototype PT (N-m), is the diameter of the prototype PT (m), is the rotational speed of the prototype PT (rpm), is the unit discharge (m3/s), is the unit moment (N-m), and is the unit speed (rpm).
2.3. Synchronous Generator
The rotor rotation operation of the synchronous generator is described by the following first-order governing equations:
where is the rotational speed of the prototype PT (rpm), is the inertia (N-m2), is the moment of the prototype PT (N-m), and is the resistance torque of the rotor (N-m).
Hence, the discrete algorithm for the synchronous generator model can be expressed as follows:
2.4. Governor
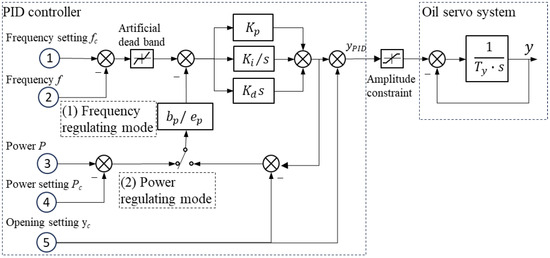
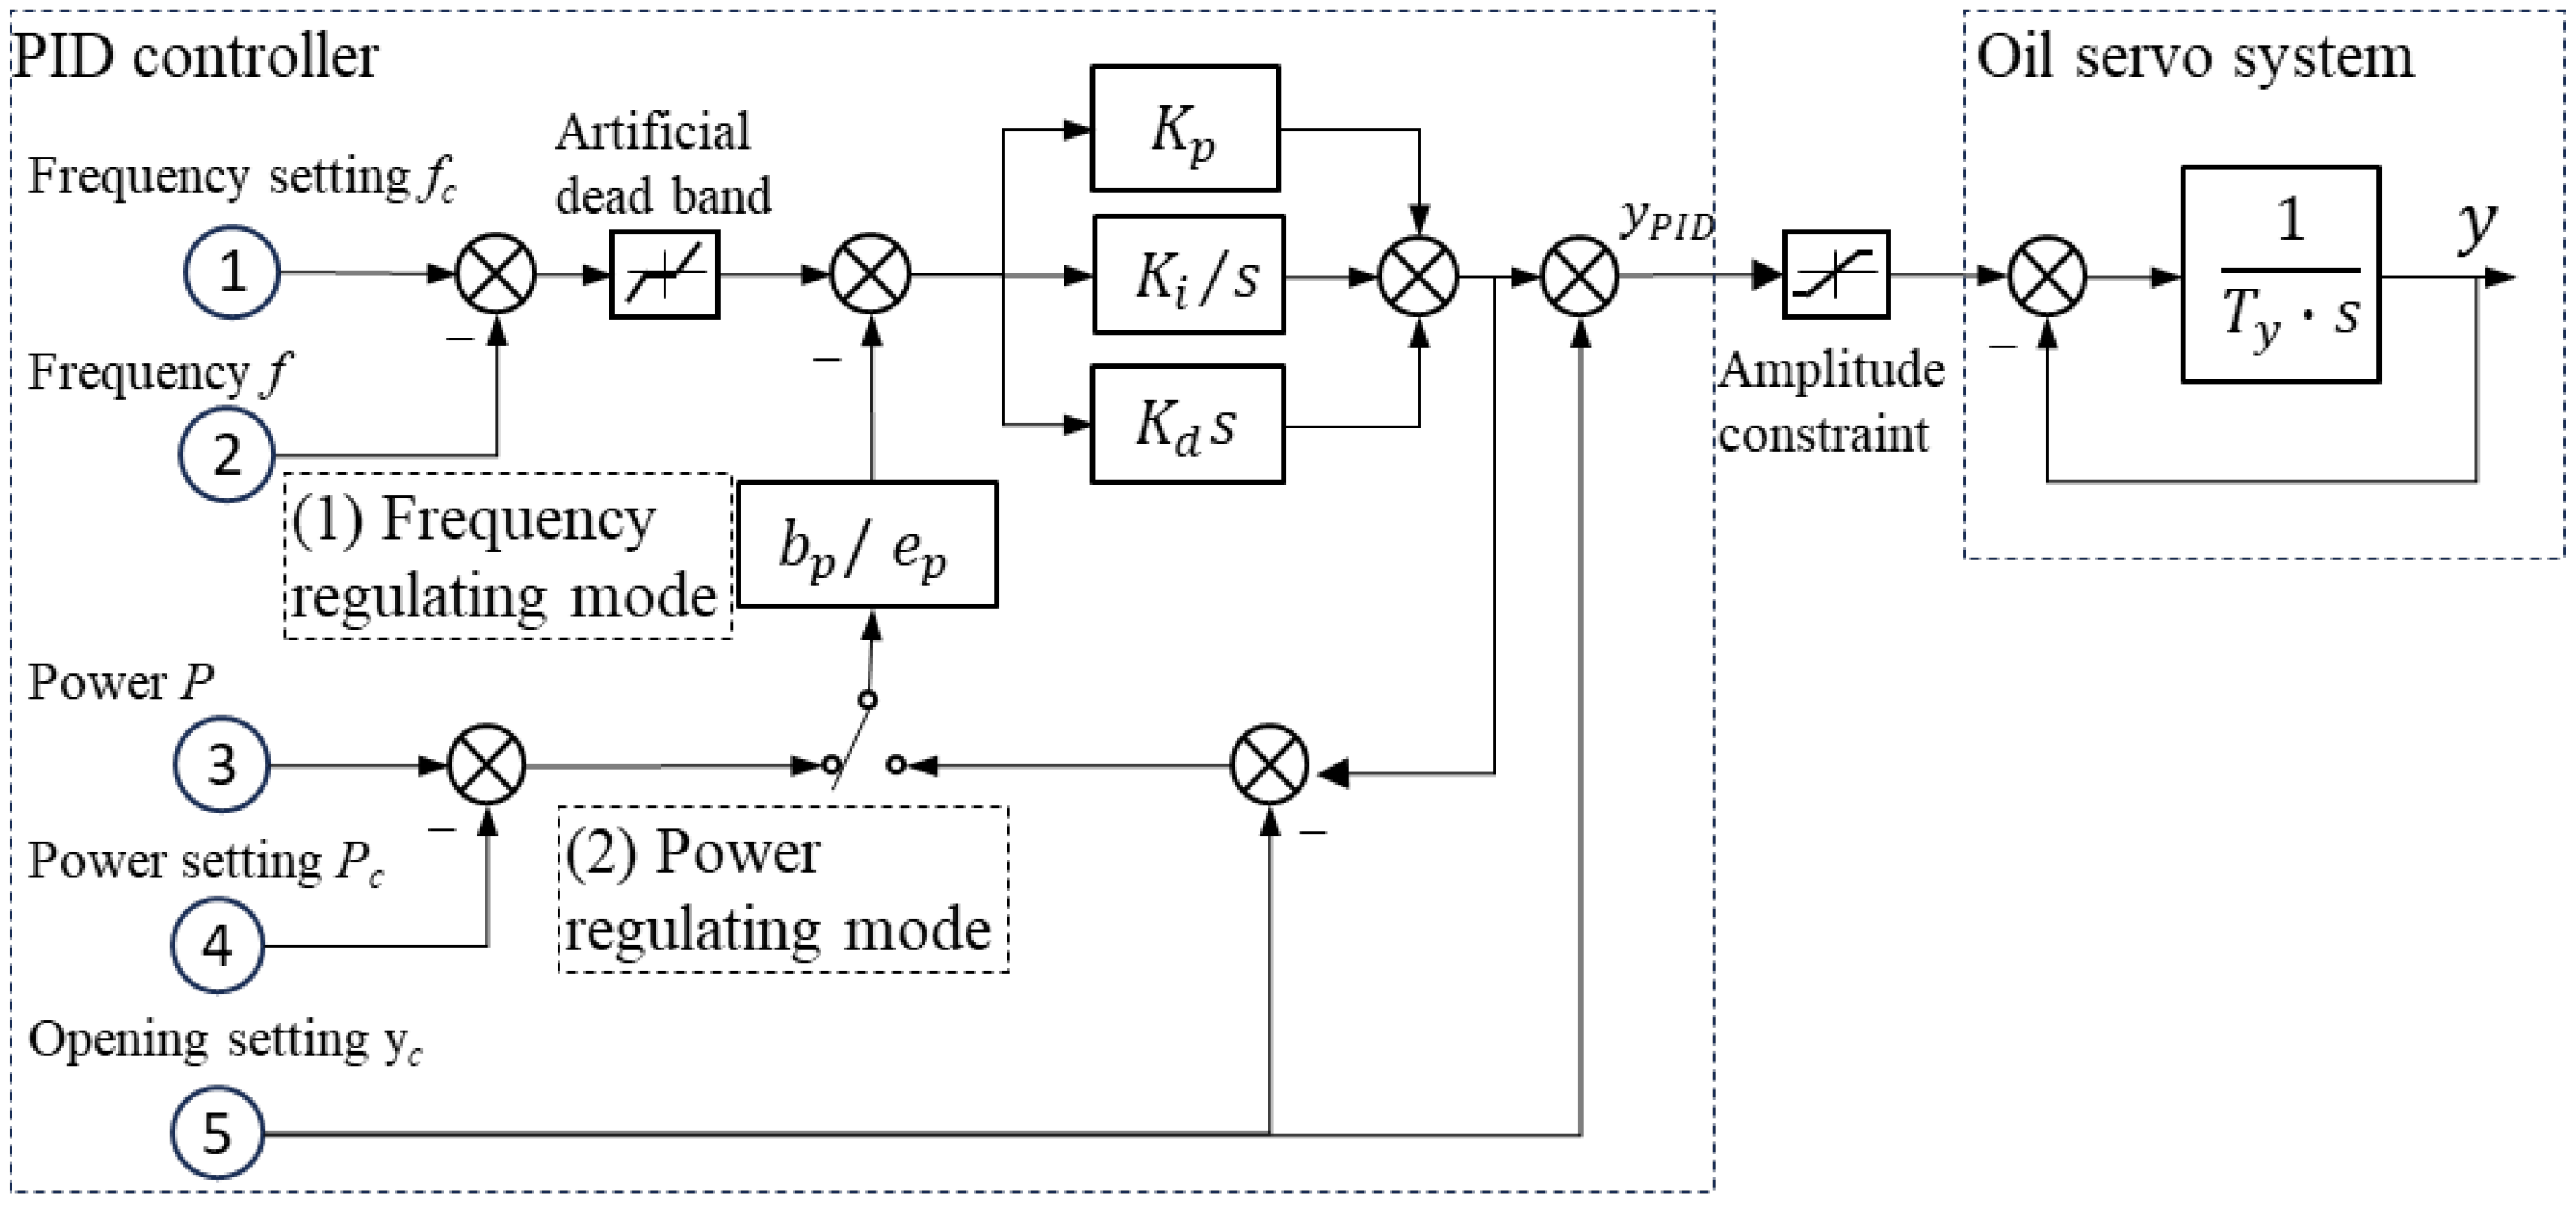
A microcomputer governor with the parallel PID regulation law is adopted, as shown in Figure 3, which is composed of the PID controller and oil pressure servo system. In the cases of start-up, no-load, and isolated grid operation, the frequency regulation mode is preferred. Once the PTU is connected to the power grid, the power regulation mode is prioritized to respond quickly to load changes. The optimal parameters of the governor are shown in Table 1.
Figure 3.
Schematic diagram of governor.
Table 1.
Optimal parameters of governor.
Under the frequency regulation mode, the algorithm of the guide vane opening (GVO) is derived.
where is the frequency error of the generator (Hz), is the rated frequency of the generator (Hz), is the rated rotational speed of the generator (rpm), and is the number of the pole pairs of the generator.
Similarly, under the power regulation mode, the algorithm of the GVO can be written as follows:
where is the power error of the generator (MW), is the power setting of the generator (MW), is the power of the generator (MW), and is the efficiency of the generator (%).
3. Project Overview and Parameters
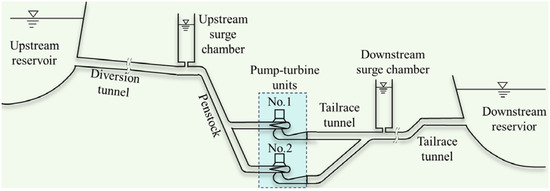
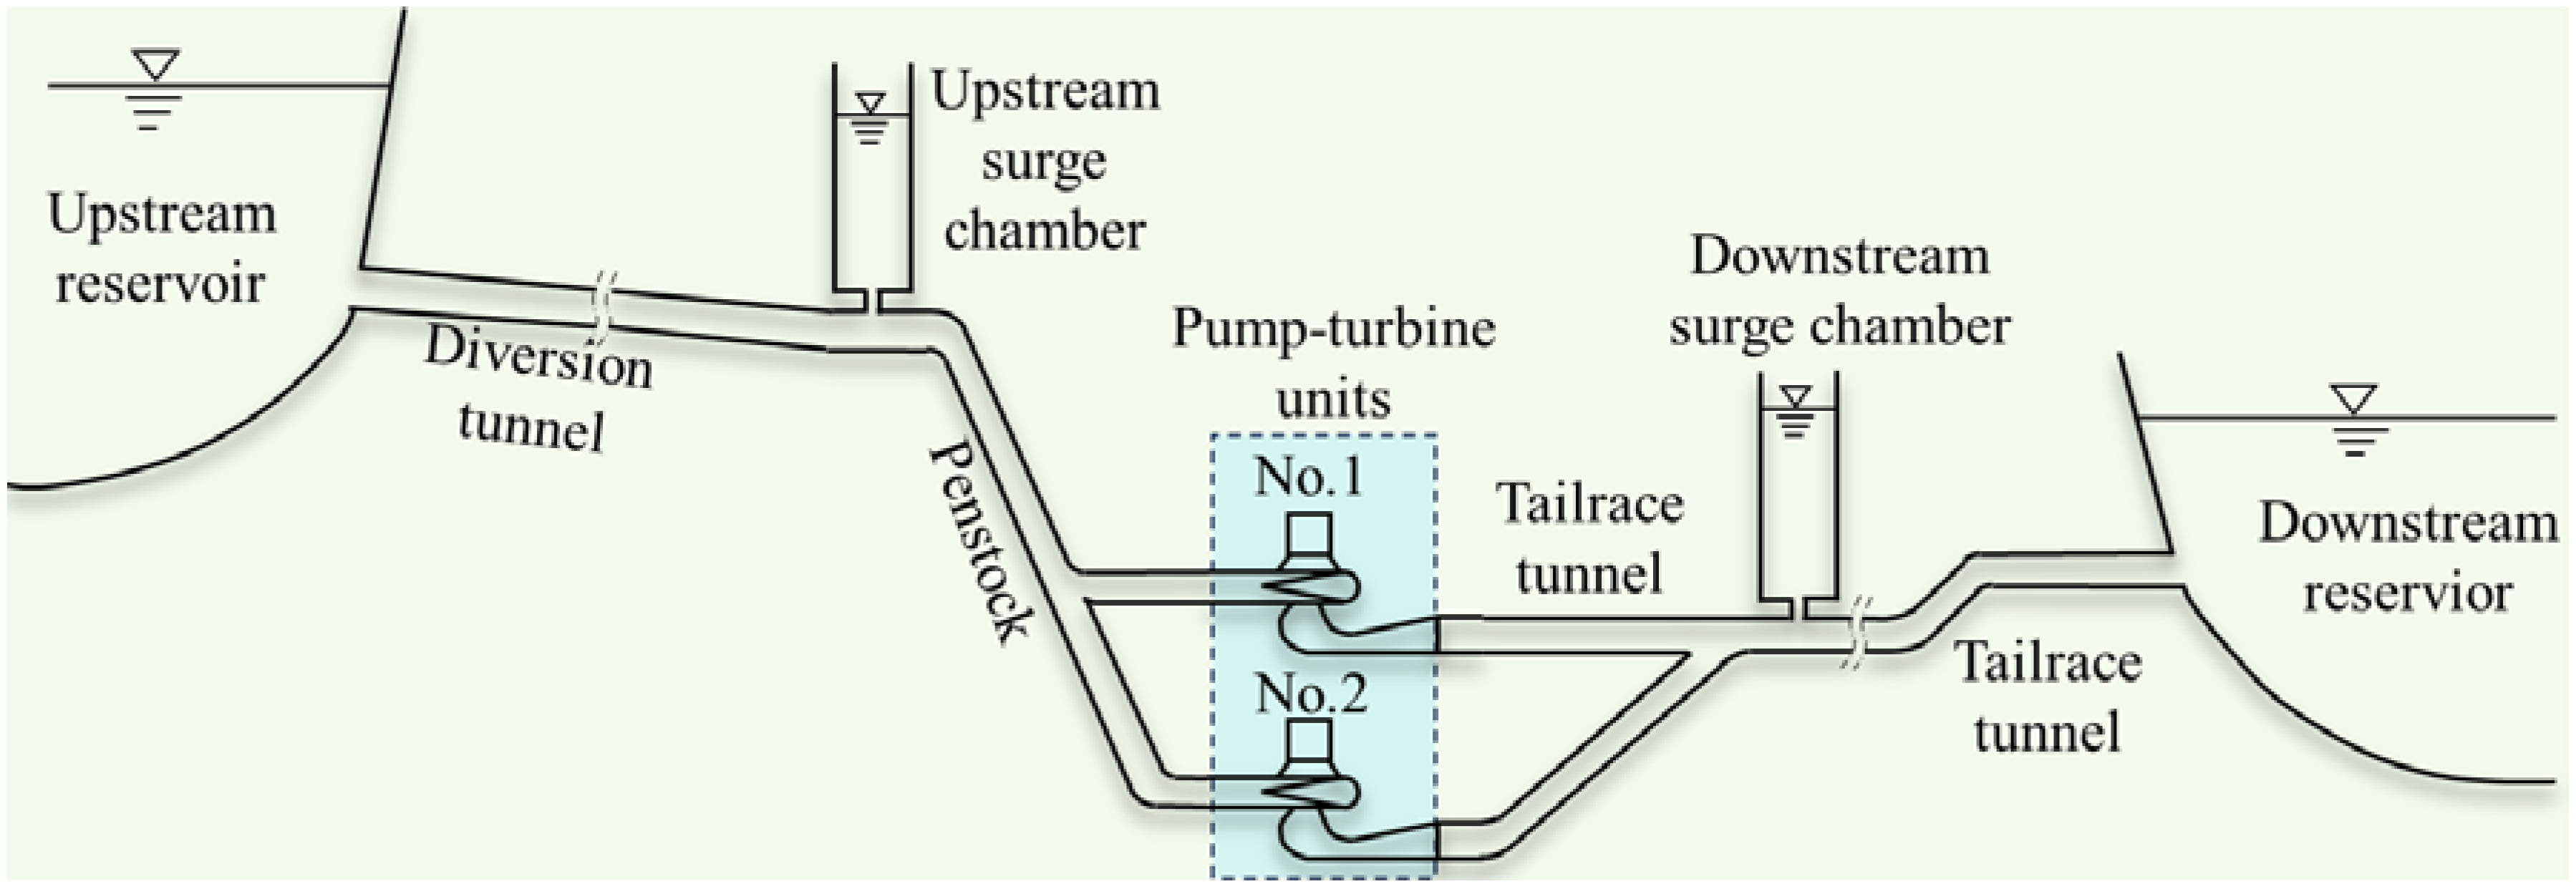
The PSPS plans to install four Francis PTUs with a single capacity of 350 MW, and a total installed capacity of 1400 MW. They undertake the tasks of peak regulation, valley filling, energy storage, frequency regulation, phase regulation, and emergency backup in the power grid. The power station consists of an upstream reservoir, diversion system, underground workshop, switch station, and downstream reservoir. The normal water level of the upper reservoir is 1667 m, and the regulation capacity is 6.51 million m3. The diversion system adopts the layout of “one diversion tunnel with two PTUs”, which is composed of the inlet/outlet of the upstream reservoir, diversion tunnel, upstream surge chamber, penstock, downstream surge chamber, tailrace tunnel, and the inlet/outlet of the downstream reservoir. The normal water level of the downstream reservoir is 1085 m, and the regulation capacity is 7.16 million m3. The layout of one hydraulic unit is shown in Figure 4, and the main parameters of the PTU are shown in Table 2.
Figure 4.
Diagram of one hydraulic unit of the PSPS.
Table 2.
Main parameters of PTU in power generation mode.
4. Results and Discussion
4.1. Transient Process of Start-Up and On-Load
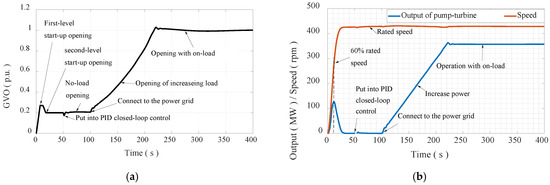
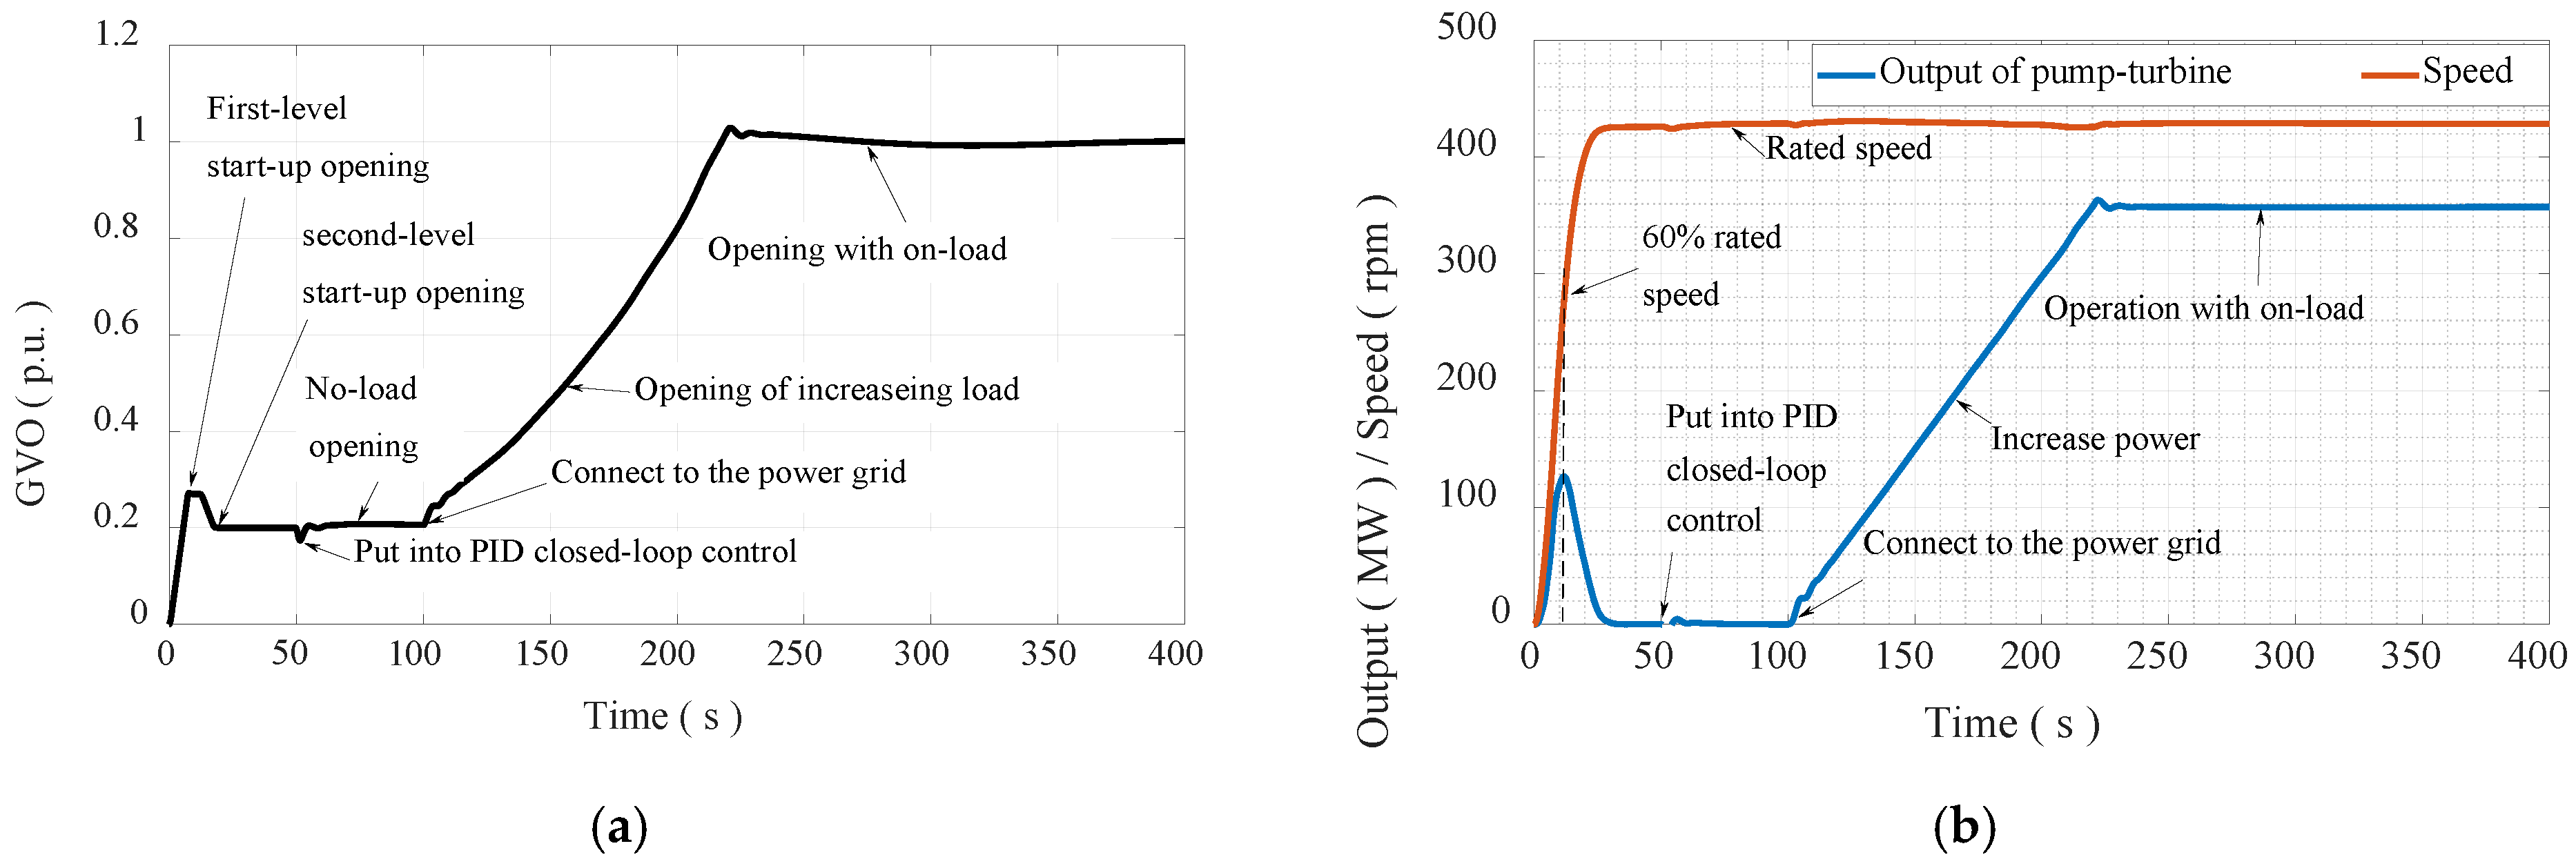
The start-up transient process is shown in Figure 5. Firstly, the GVO is set at the first-level start-up opening (1.5 to 2.0 times no-load opening) in order to accelerate the start-up process of the PTU. When the rotational speed rises to 60% rated speed, the GVO setting is called back to the second-level start-up opening (no-load opening) to reduce the acceleration of the PTU. When the rotational speed rises to 95% rated speed, the governor PID control (frequency regulation mode priority) is put into work, and the PTU will quickly reach the rated speed and enter no-load operation. Once the rotational speed of the PTU is stable, the generator circuit breaker closes, the PTU is connected to the power grid, and then the PTU runs from no-load to rated load within 2 min to complete the on-load process of the start-up.
Figure 5.
Transient process of start-up and on-load. (a) GVO. (b) Output and rotational speed of PT.
Since the diversion tunnel is shared by two PTUs, there is strong hydraulic interference between the two PTUs. Therefore, there were seven schemes of peak staggered valley filling to be carried out to optimize the start-up process, and the description of the schemes is given in Table 3.
Table 3.
Description of the schemes.
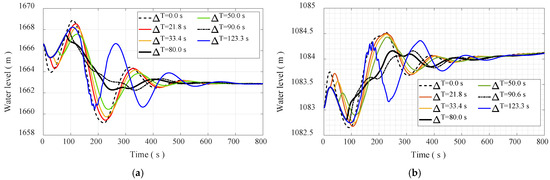
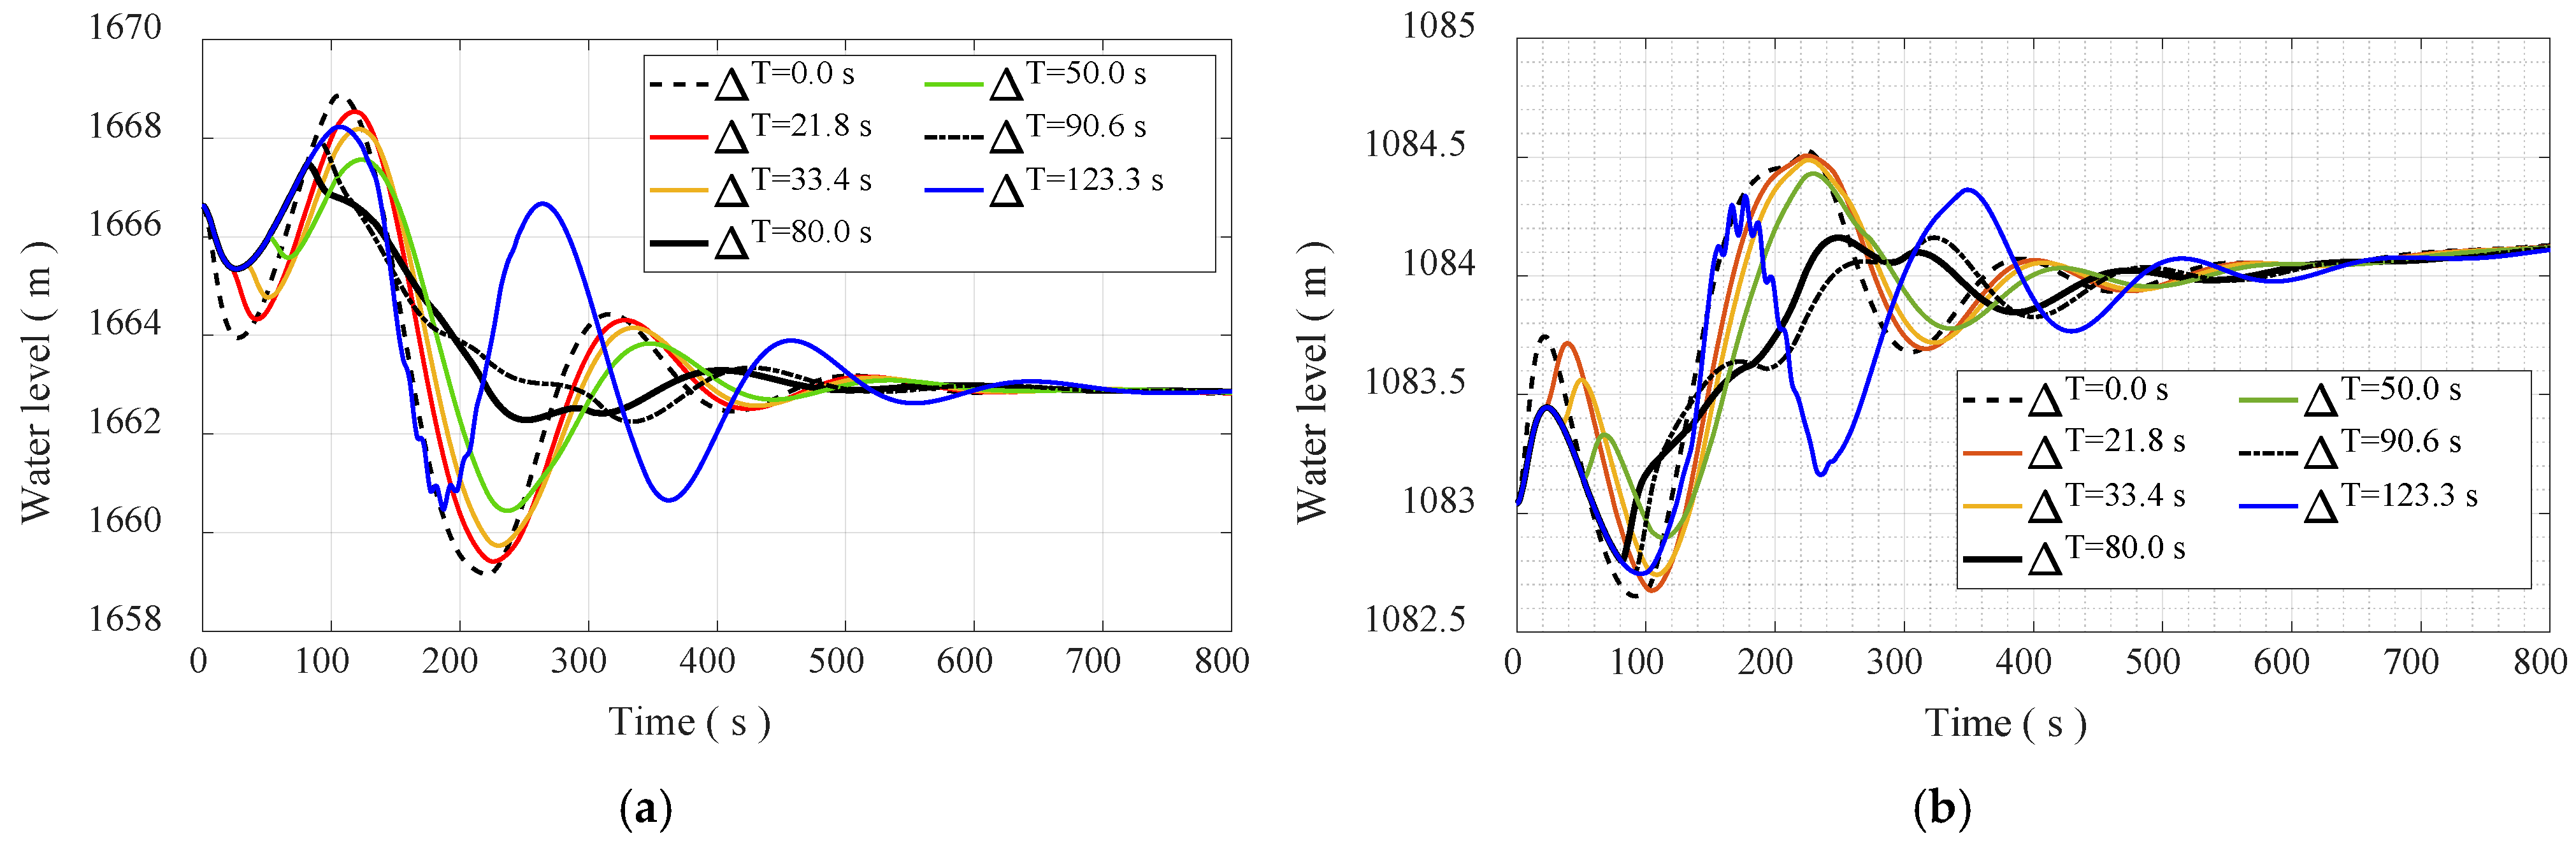
The water level fluctuation in the upstream and downstream surge chambers is shown in Figure 6 and listed in Table 4 during the start-up process. The interval time of start-up between the two PTUs is defined as ∆T in Figure 6.
Figure 6.
Water level fluctuation in surge chambers during start-up process. (a) Upstream surge chamber. (b) Downstream surge chamber.
Table 4.
Comparison of water levels in surge chambers.
When two PTUs are started up at the same time (∆T = 0.0 s), the water level fluctuation amplitude in the surge chamber is large due to the variation in large discharge. It can be seen from Table 4 that the water level differences in the upstream and downstream surge chambers reach 9.71 m and 1.88 m, respectively, which leads to a long fluctuation duration.
The results show that after PTU No.1 is started up, when the discharge flowing into the upstream surge chamber is the largest (scheme 4, ∆T = 80.0 s), then PTU No.2 is started up, and the water level fluctuation in the upstream surge chamber is the smallest. Correspondingly, the water level difference in the upstream surge chamber is 5.17 m, which is only 53.24% of the water level difference when the two PTUs are started up at the same time. The water level difference in the downstream surge chamber is 1.37 m, which is 72.87% of the water level difference when the two PTUs are started up at the same time. Accordingly, the appropriate start-up interval time is very important for suppressing the water level fluctuation of in the surge chambers and improve the dynamic characteristics of the PTUs.
4.2. The Transient Process of Load Regulation Under Power Generation Mode
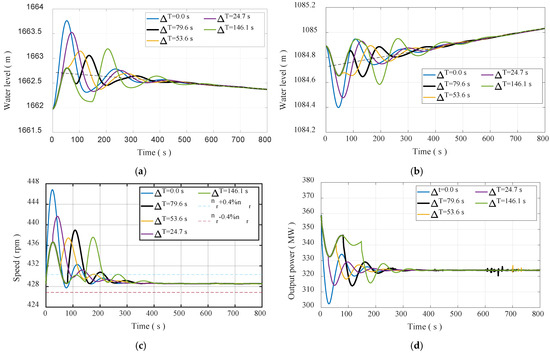
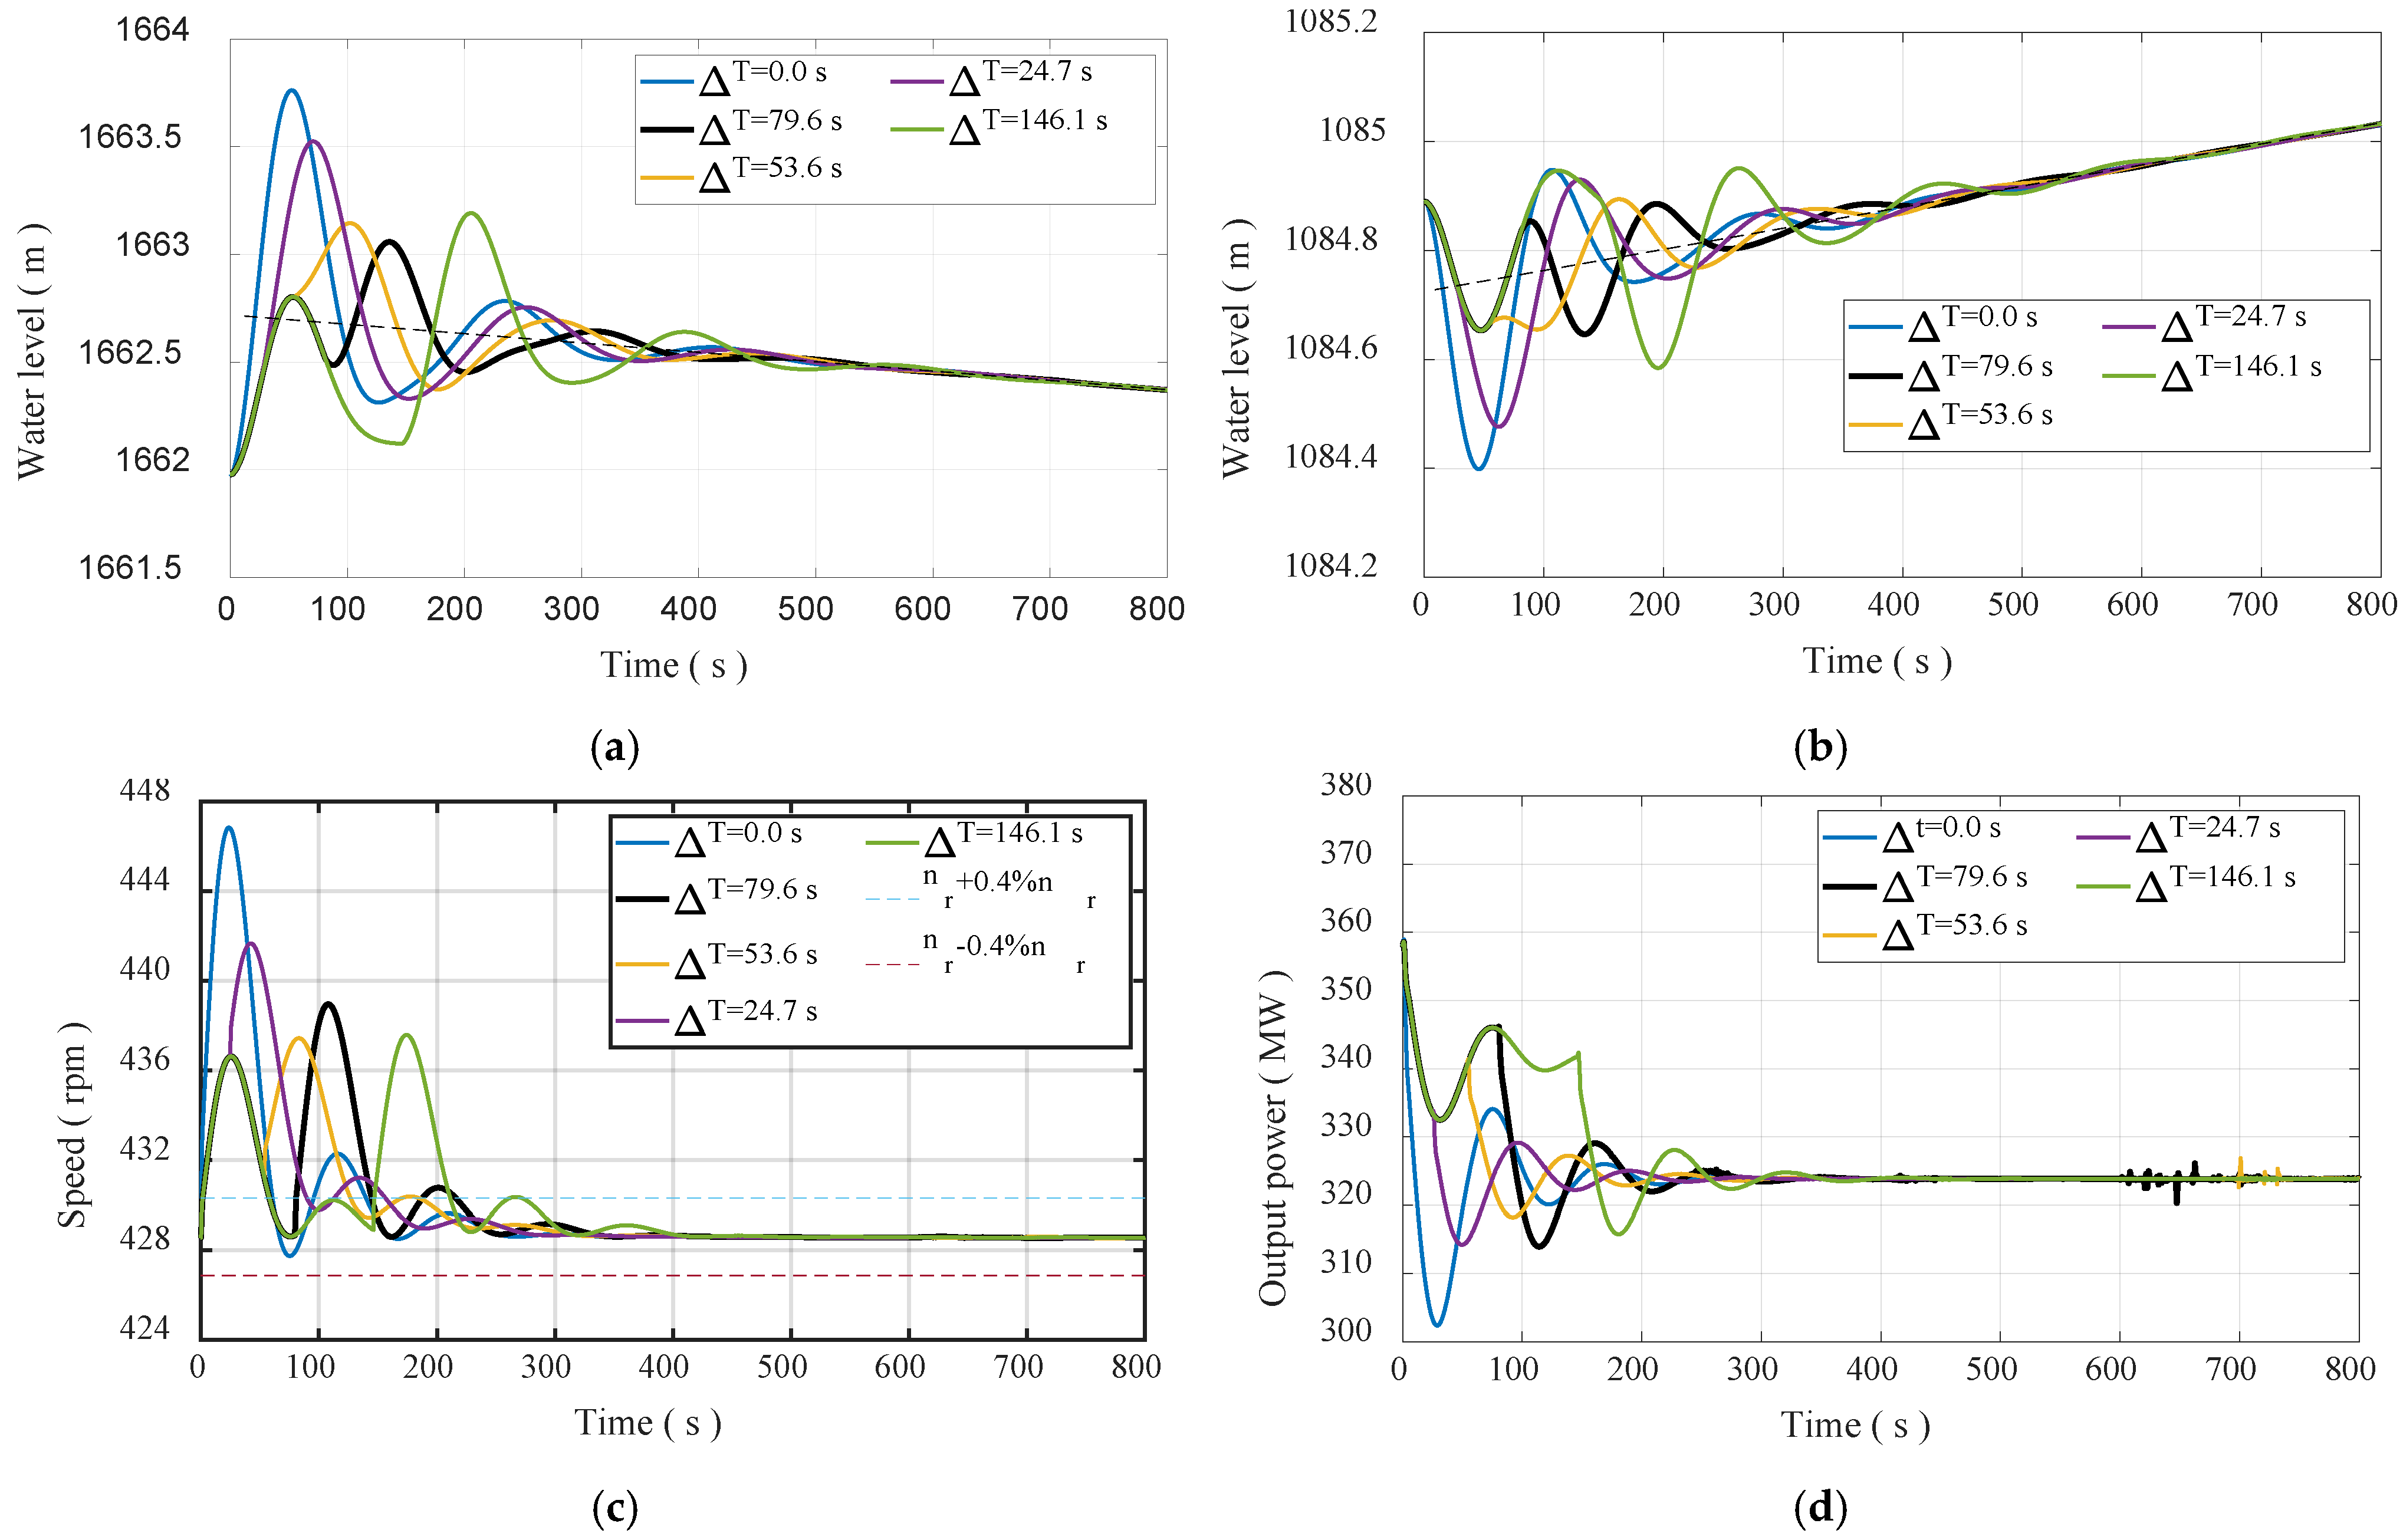
Taking the rated head, rated power, isolated power gird operation, and 10% load reduction as an example, the results are shown in Figure 7 and Table 5. When the load of two PTUs is reduced at the same time, the water level fluctuation amplitude in the upstream/downstream surge chambers is the largest. Similarly, the method of peak staggering and valley filling can suppress the fluctuation amplitude of the water level in the surge chamber, reduce the fluctuation amplitude of the rotational speed of the PTU, and improve the transient characteristics of the PT regulating system. After the load of PTU No.1 is reduced, once the discharge flowing out the upstream surge chamber is the largest, the load of PTU No.2 is reduced, i.e., ∆T = 79.6 s (in Figure 7), the water level fluctuation amplitudes in the upstream and downstream surge chambers are the smallest, and the rotational speed regulation time of the PTU is relatively short.
Figure 7.
Transient process of 10% load reduction. (a) Upstream surge chamber. (b) Downstream surge chamber. (c) Rotational speed of the PTU. (d) Output power of PT No.2.
Table 5.
Calculation results of rotational speed and regulation time.
On the other hand, Figure 7c,d show that after the load of PTU No.1 is reduced, when the discharge flowing in and out the upstream surge chamber is zero, that is, the load reduction interval time between the two PTUs is 53.6 s (scheme 3), the rotational speed and power fluctuation amplitudes of the PT are the smallest, which is only 48.46% of scheme 1, and the regulation time is the shortest, which is only 126.40 s. Consequently, it is difficult to achieve the minimum amplitude of water level fluctuation and rotational speed fluctuation at the same time by using the peak staggering and valley filling, because the water level fluctuation period of the surge chamber is not synchronized with the rotational speed fluctuation period of the PTU. Therefore, during the load regulation process, priority should be given to suppressing rotational speed fluctuation to ensure power quality.
4.3. Transient Process of Load Rejection
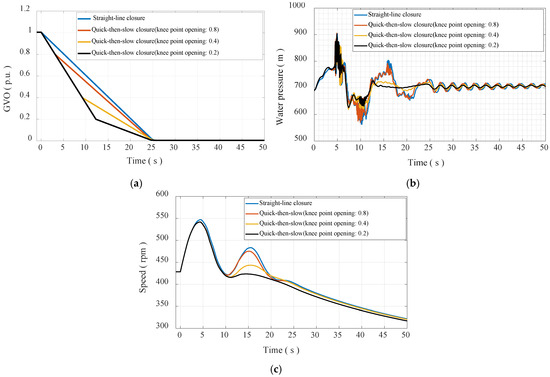
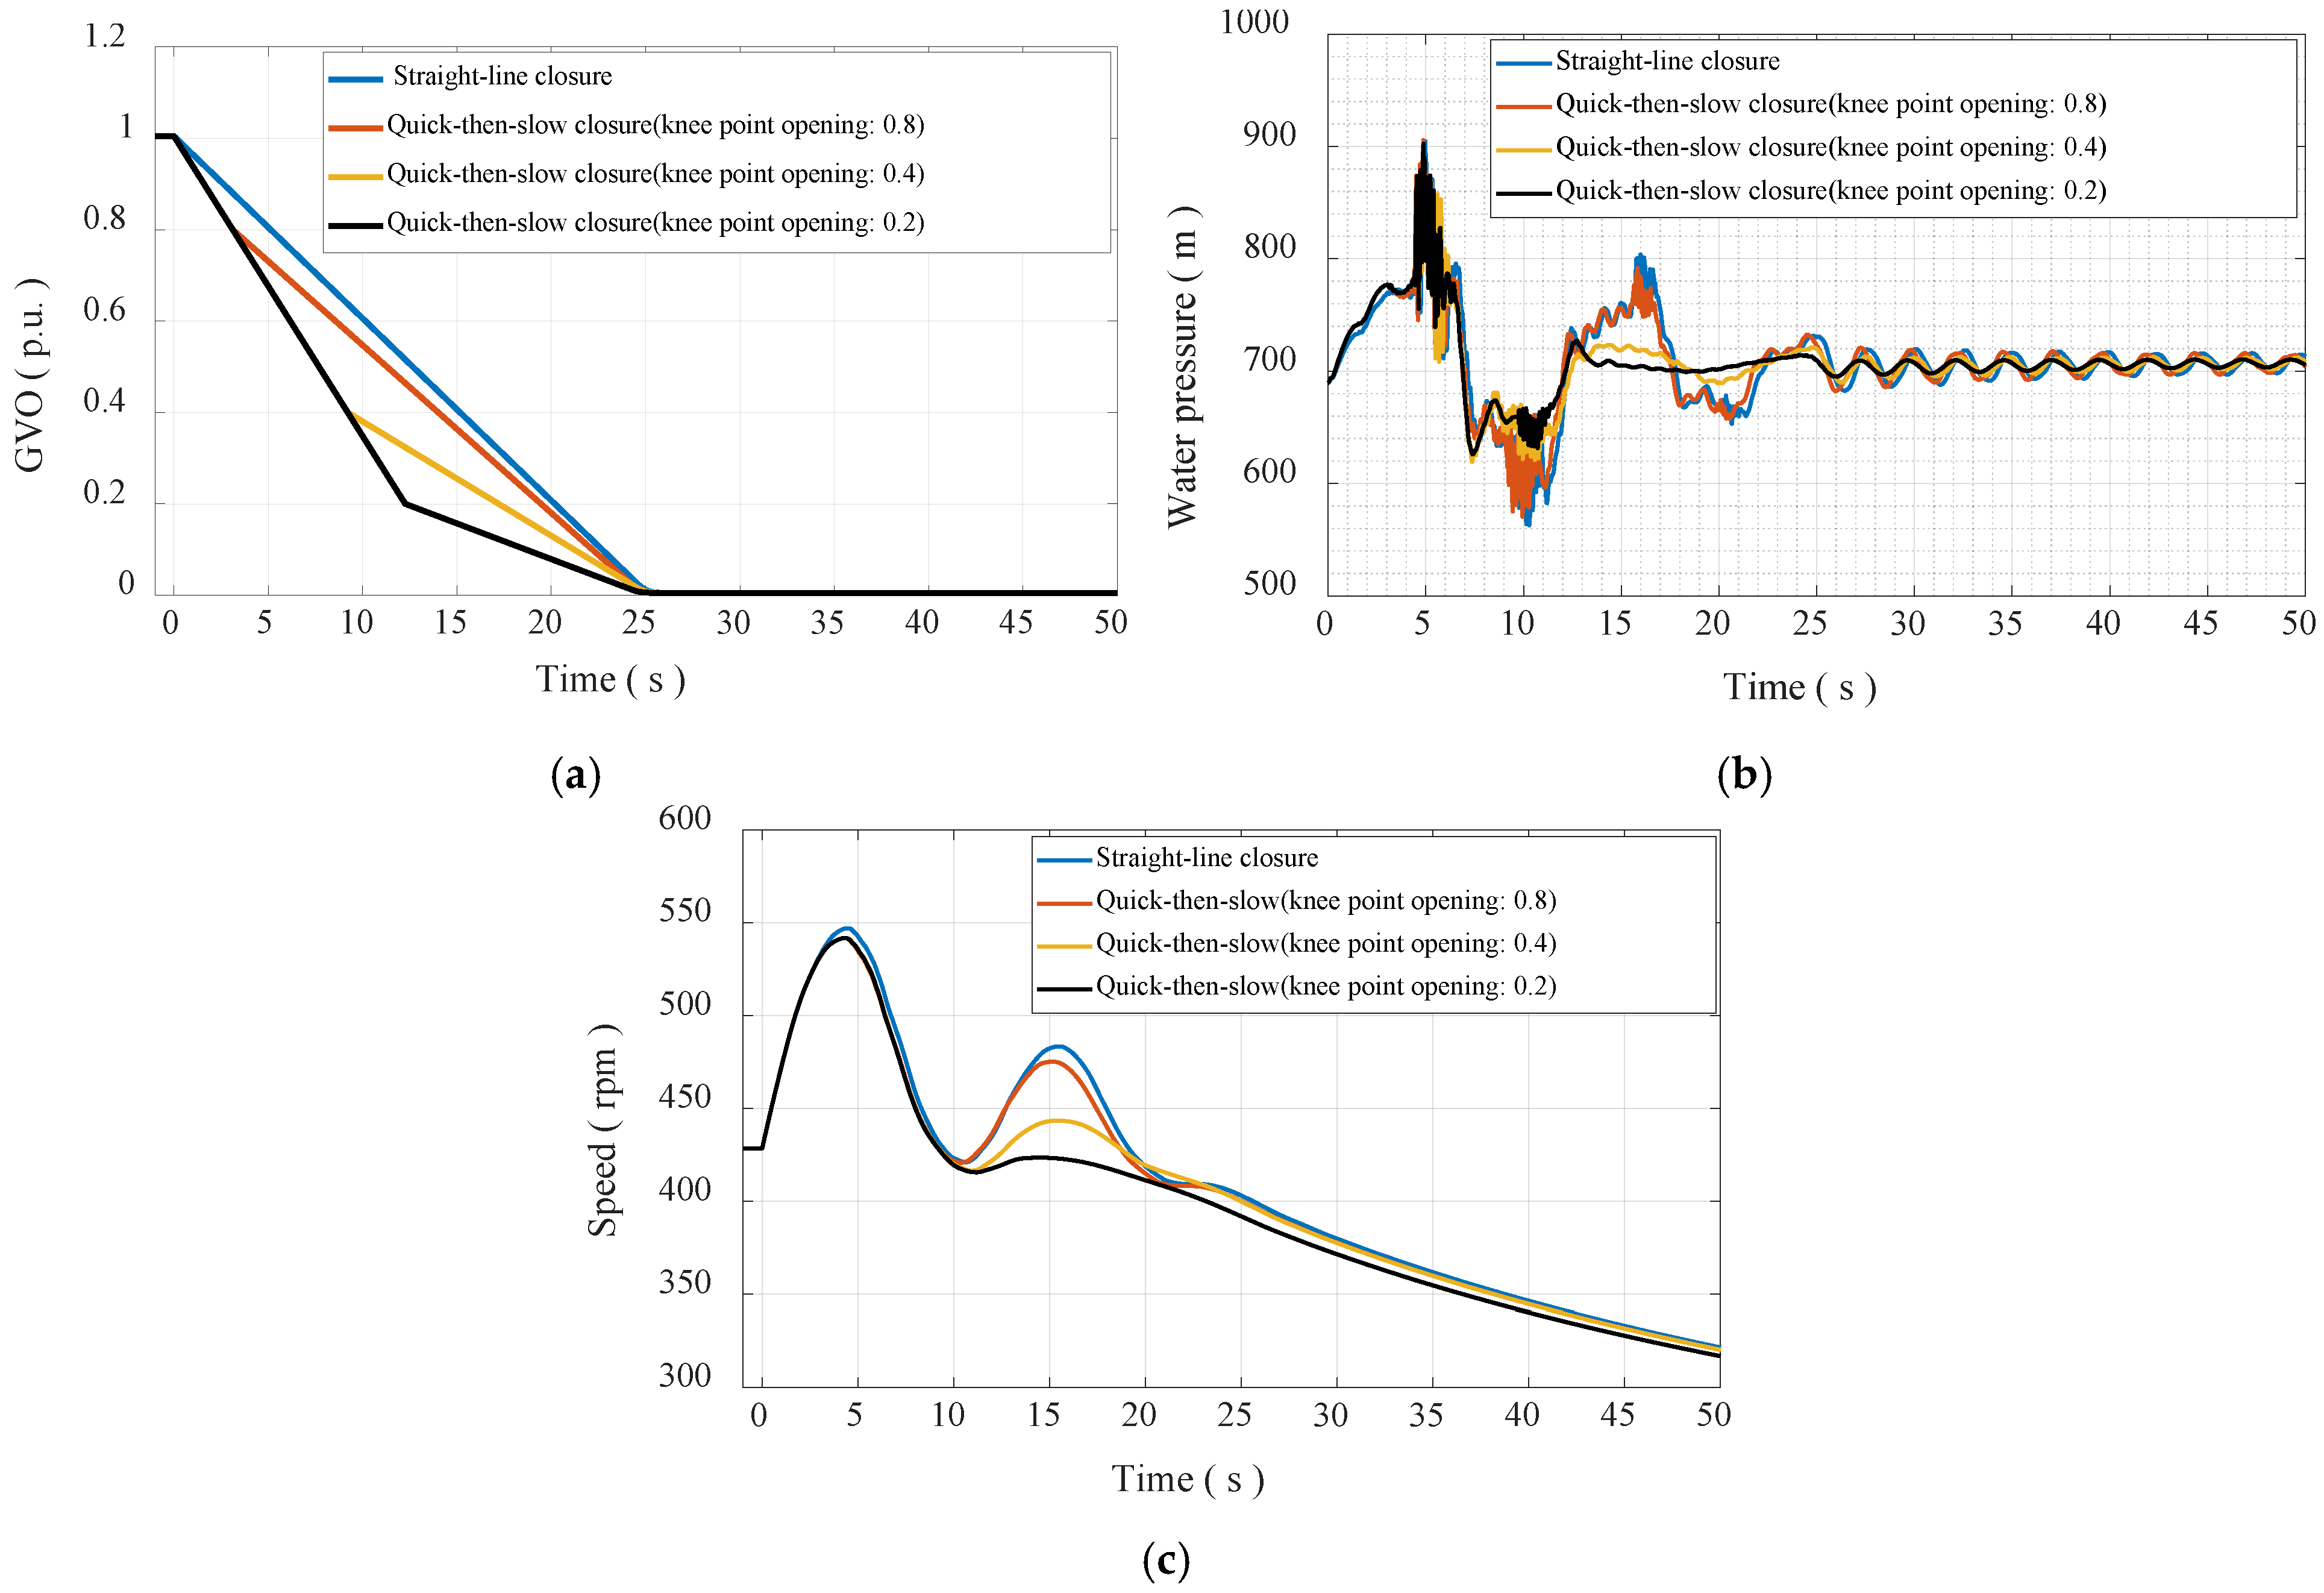
Due to the inverse “S” characteristic curve of the PT, a large pulsating pressure often occurs after load rejecting, resulting in the serious vibration of the PTU [25]. In this section, the straight-line closure law and the quick-then-slow closure law of the guide vanes are compared, and the knee point opening of the quick-then-slow closure law is optimized. The guide vane closure laws are shown in Figure 8a, and the corresponding knee point openings are listed in Table 6. When the GVO is 100%, the corresponding total closure time is 25.0 s. Under the rated operating condition, when two PTUs reject the full load at the same time, the pressure in the spiral case and the rotational speed of the PTU are shown in Figure 8b,c and Table 7.
Figure 8.
Transient process of load rejection. (a) Closure law of guide vanes. (b) Water pressure in spiral case. (c) Rotational speed of the PTU.
Table 6.
Knee point opening of guide vanes.
Table 7.
Maximum water pressure in spiral case and maximum rotational speed after load rejection.
When the straight-line closure law (scheme 1) is adopted, the maximum water pressure (water hammer pressure + pulsating pressure) in the spiral case is 904.78 m, the PTU stays in the reverse “S” zone for a long time, and the pulsating pressure duration is about 22.0 s, as shown in Figure 8b. The maximum rotational speed of the PTU is 547.04 rpm, and there are three rotational speed wave peak values, as shown in Figure 8c. When the quick-then-slow closure law is adopted, with the decrease in the knee point opening, the duration of the water pressure and pulsation pressure gradually decreases, and the numbers of rotational speed wave peak and the second peak value also decrease. When the knee point opening is 20.0%, the duration of pulsating pressure is only about 12.0 s, and the second-wave peak of rotational speed is close to disappearing. Obviously, the quick-then-slow closure law shows a significant improvement on the transient process of load rejection.
5. Conclusions
In this paper, the variable time step model of the pump–turbine regulation system of the PSPS with the layout of “one diversion tunnel with two PTUs” is developed, and the typical transient processes of start-up, load regulation, and load rejection in the power generation mode are calculated, and the following conclusions are obtained:
- (1)
- The appropriate start-up interval time is very important for suppressing the water level fluctuation of the surge chambers and improve the transient characteristics of the PTUs. The results show that after one PTU is started up, when the discharge flowing into the upstream surge chamber is the largest, then another PTU is started up, the transient characteristics of the PTUs are the best.
- (2)
- Using the peak staggered valley filling method makes it difficult to minimize the water level fluctuation amplitude of the surge chamber and the rotational speed fluctuation amplitude of the PTU simultaneously, because their fluctuation periods are not consistent. Therefore, during the load regulation process, frequency fluctuation should be controlled as a priority to improve the transient characteristics of the PTU.
- (3)
- Compared with the traditional characteristic line method, the presented method captures the pulsating pressure well. The quick-then-slow closure law, especially the knee point opening of the guide vanes is within 40% during load rejection, can significantly improve the characteristics of the transient process and shorten the duration of the pulsating pressure.
Author Contributions
Methodology, M.Z.; Software, M.Z.; Validation, M.Z., J.L. and J.Y.; Investigation, J.Y.; Data curation, M.Z. and J.L.; Writing—original draft, J.L.; Writing—review & editing, M.Z.; Visualization, J.Y.; Supervision, C.N.; Project administration, C.N. All authors have read and agreed to the published version of the manuscript.
Funding
This work was supported by the National Natural Science Foundation of China (Number No. 62072081).
Data Availability Statement
The original contributions presented in this study are included in the article. Further inquiries can be directed to the corresponding author.
Conflicts of Interest
The authors declare no conflict of interest.
References
- Available online: https://www.nea.gov.cn/2024-01/26/c_1310762246.htm (accessed on 15 August 2024).
- Zhang, Y.M.; Wang, L.; Wang, N.; Duan, L.; Zong, Y.; You, S.; Maréchal, F.; Van Herle, J.; Yang, Y. Balancing wind-power fluctuation via onsite storage under uncertainty: Power-to-hydrogen-to-power versus lithium battery. Renew. Sustain. Energy Rev. 2019, 116, 109465. [Google Scholar] [CrossRef] [Scilit]
- Zhang, Y.; Xu, Y.; Zhou, X.; Guo, H.; Zhang, X.; Chen, H. Compressed air energy storage system with variable configuration for accommodating large-amplitude wind power fluctuation. Appl. Energy 2019, 239, 957–968. [Google Scholar] [CrossRef] [Scilit]
- Zhang, Y.; Xu, Y.; Guo, H.; Zhang, X.; Guo, C.; Chen, H. A hybrid energy storage system with optimized operating strategy for mitigating wind power fluctuations. Renew. Energy 2018, 125, 121–132. [Google Scholar] [CrossRef] [Scilit]
- Xu, B.; Zhu, F.; Zhong, P.A.; Chen, J.; Liu, W.; Ma, Y.; Guo, L.; Deng, X. Identifying long-term effects of using hydropower to complement wind power uncertainty through stochastic programming. Appl. Energy 2019, 253, 113535. [Google Scholar] [CrossRef] [Scilit]
- Rahmati, I.; Foroud, A.A. Pumped-storage units to address spinning reserve concerns in the grids with high wind penetration. J. Energy Storage 2020, 31, 101612. [Google Scholar] [CrossRef] [Scilit]
- Li, Y.; Yang, W.; Zhao, Z.; Huang, Y.; Liao, Y.; Yang, J. Ancillary service quantitative evaluation for primary frequency regulation of pumped storage units considering refined hydraulic characteristics. J. Energy Storage 2022, 45, 103414. [Google Scholar] [CrossRef] [Scilit]
- Medium and Long-Term Development Plan for Pumped Storage (2021~2035) Was Issued and Implemented. Available online: https://www.gov.cn/xinwen/2021-09/09/content_5636487.htm (accessed on 20 August 2024). (In Chinese)
- Cavazzini, G.; Covi, A.; Pavesi, G.; Ardizzon, G. Analysis of the Unstable Behavior of a Pump-Turbine in Turbine Mode: Fluid-Dynamic and Spectral Characterization of the S-Shape Characteristic. ASME J. Fluids Eng. 2016, 138, 021105. [Google Scholar] [CrossRef] [Scilit]
- Chazarra, M.; Pérez-Díaz, J.I.; García-González, J.; Praus, R. Economic viability of pumped-storage power plants participating in the secondary regulation service. Appl. Energy 2018, 216, 224–233. [Google Scholar] [CrossRef] [Scilit]
- Zhao, Z.W.; Zhang, H.; Chen, D.Y.; Gao, X. No-Load Stability Analysis of Pump Turbine at Startup-Grid Integration Process. J. Fluids Eng. 2019, 141, 081113. [Google Scholar] [CrossRef] [Scilit]
- Sun, H.; Xiao, R.; Liu, W.; Wang, F. Analysis of S Characteristics and Pressure Pulsations in a Pump-Turbine with Misaligned Guide Vanes. ASME J. Fluids Eng. 2013, 135, 051101. [Google Scholar] [CrossRef] [Scilit]
- Yang, M.Q.; Zhao, W.Q.; Bi, H.L.; Yang, H.; He, Q.; Huang, X.; Wang, Z. Flow-Induced Vibration of Non-Rotating Structures of a High-Head Pump-Turbine during Start-Up in Turbine Mode. Energies 2022, 15, 8743. [Google Scholar] [CrossRef] [Scilit]
- Zeng, W.; Yang, J.D.; Hu, J.H.; Yang, J. Guide-Vane Closing Schemes for Pump-Turbines Based on Transient Characteristics in S-shaped Region. J. Fluids Eng. 2016, 138, 051302. [Google Scholar] [CrossRef] [Scilit]
- Zhao, Z.; Yang, J.; Yang, W.; Hu, J.; Chen, M. A coordinated optimization framework for flexible operation of pumped storage hydropower system: Nonlinear modeling, strategy optimization and decision making. Energy Convers. Manag. 2019, 194, 75–93. [Google Scholar] [CrossRef] [Scilit]
- Ye, J.W.; Zeng, W.; Zhao, Z.G.; Yang, J.; Yang, J. Optimization of Pump Turbine Closing Operation to Minimize Water Hammer and Pulsating Pressures During Load Rejection. Energies 2020, 13, 1000. [Google Scholar] [CrossRef] [Scilit]
- Zhang, H.; Su, D.; Guo, P.C.; Zhang, B.; Mao, Z. Stochastic dynamic modeling and simulation of a pump-turbine in load-rejection process. J. Energy Storage 2021, 35, 102196. [Google Scholar] [CrossRef] [Scilit]
- Xu, L.C.; Peng, Y.J.; Tang, W.; Liu, D.M.; Liu, X.B. Flow characteristics and pressure pulsation in the S characteristic area of model pump turbine. Chin. J. Hydrodyn. 2022, 37, 213–225. (In Chinese) [Google Scholar] [CrossRef]
- Chen, L.; Yu, X.D.; Li, G.H.; Zhang, M.; Chen, S.; Zhang, J. Influence of reverse S characteristics of pump-turbines on transient pressure during load rejection. Chin. J. Hydrodyn. 2022, 41, 112–119. (In Chinese) [Google Scholar] [CrossRef]
- Liu, C.P.; Zhao, Z.G.; Yang, J.B.; Yan, S.; Yang, J.; Yin, X. Hydraulic-mechanical-electrical coupled model framework of variable-speed pumped storage system: Measurement verification and accuracy analysis. J. Energy Storage 2024, 89, 111714. [Google Scholar] [CrossRef] [Scilit]
- Zhang, C.B.; Yang, M.J.; Li, J.Y. Detailed modelling and parameters optimisation analysis on governing system of hydro-turbine generator unit. IET Gener. Transm. Distrib. 2018, 12, 1045–1051. [Google Scholar] [CrossRef] [Scilit]
- Zhang, L.; Jiang, H.Z. Variable Step Euler Method for Real-time Simulation. In Proceedings of the 2012 2nd International Conference on Computer Science and Network Technology, Changchun, China, 29–31 December 2012. [Google Scholar]
- Zhang, C.B.; Cao, W.Z.; Xie, T.T.; Wang, C.; Shen, C.; Wen, X.; Mao, C. Operational Characteristics and Optimization of Hydro-PV Power Hybrid Electricity System. Renew. Energy 2022, 200, 601–613. [Google Scholar] [CrossRef] [Scilit]
- Pan, X.H.; Cheng, Y.C.; Wang, J.F. Research Progress of the Processing of Pump Turbine Characteristic Curve. J. Yangtze River Sci. Res. Inst. 2014, 31, 117–123. (In Chinese) [Google Scholar] [CrossRef]
- Xiao, W.; Han, C.Z.; Chen, L.; Ren, S.; Xu, L.; Cao, W. Study on the Vibration Law of Pump Turbine Unit and Powerhouse in Pumped-storage Power Station. Hydropower Pumped Storage 2023, 9, 10–19. (In Chinese) [Google Scholar] [CrossRef]

Disclaimer/Publisher’s Note: The statements, opinions and data contained in all publications are solely those of the individual author(s) and contributor(s) and not of MDPI and/or the editor(s). MDPI and/or the editor(s) disclaim responsibility for any injury to people or property resulting from any ideas, methods, instructions or products referred to in the content. |
© 2025 by the authors. Licensee MDPI, Basel, Switzerland. This article is an open access article distributed under the terms and conditions of the Creative Commons Attribution (CC BY) license (https://creativecommons.org/licenses/by/4.0/).