Article

Comprehensive Characterization and Impact Analysis of Interlayers on CO2 Flooding in Low-Permeability Sandstone Reservoirs

by
Taskyn Abitkazy
1,2,*,
Lin Yan
1,2,
Khaled Albriki
1,
Bahedaer Baletabieke
3,
Dawei Yuan
1,2,
Yingfu He
4 and
Akhan Sarbayev
5
1
Research Institute of Petroleum Exploration and Development, CNPC, Beijing 100083, China
2
Artificial Intelligence Technology R&D Center for Exploration and Development, CNPC, Beijing 100083, China
3
Engineering Technology R&D Company Limitted, CNPC, Beijing 100083, China
4
Petroleum Exploration & Production Research Institute, SINOPEC, Beijing 100083, China
5
Geology and Oil-Gas Business Institute, Satbayev University, Almaty 050013, Kazakhstan
*
Author to whom correspondence should be addressed.
Energies 2025, 18(3), 593; https://doi.org/10.3390/en18030593
Submission received: 16 December 2024 / Revised: 23 January 2025 / Accepted: 24 January 2025 / Published: 27 January 2025

Abstract

:
In low-permeability sandstone reservoirs (LPSR), impermeable interlayers significantly challenge carbon capture, utilization, and storage (CCUS) and enhance oil recovery (CO2-EOR) processes by creating complex, discontinuous flow units. This study aims to address these challenges through a comprehensive multi-faceted approach integrating geological and microscopic analyses, including core analysis, reservoir petrography, field emission-scanning electron microscopy (FE-SEM), energy dispersive spectroscopy (EDS), and well-logging response analysis, and utilizing three-dimensional (3D) geological modeling. The current comprehensive investigation systematically characterizes interlayer types, petrophysical properties, thickness, connectivity, and their spatial distribution in the reservoir unit. Numerical simulations were conducted to assess the sealing efficiency and the impact of various interlayer materials on CO2 flooding over a 10-year period. Results indicate the presence of petrophysical and argillaceous interlayers, with optimal sealing occurring in petrophysical barriers ≥ 4 m and argillaceous barriers ≥ 1.5 m thick. CO2 leakage occurs through preferential pathways that emerge in a side-to-middle and bottom-to-top direction in interbeds, with multidirectional pathways showing greater leakage at the bottom compared to the upper side within barriers. Increased interlayer thickness constraints CO2 breakthrough but reduces vertical flooding area and production ratio compared to homogeneous reservoirs. Augmented interbed thickness and area mitigate CO2 breakthrough time while constraining gravity override and dispersion effects, enhancing horizontal oil displacement. These novel findings provide crucial insights for optimizing CCUS-EOR strategies in LPSR, offering a robust theoretical foundation for future applications and serving as a key reference for CO2 utilization in challenging geological settings of LPSR worldwide.

1. Introduction

Continental low-permeability sandstone reservoirs (LPSR) have unstable sedimentary facies changes (vertical and lateral), strong diagenesis, complex reservoir structures, developed interlayers, and strong heterogeneity. These characteristics exhibit a great challenge for CO2-EOR (CO2-EOR). The presence of impermeable or ultra-low-permeability interlayers (barriers and interbeds) within LPSR results in the division of the reservoir into multiple flow units that are either discontinuous or semi-continuous. These divisions lead to a tortuous and complex fluid flow channel during the Carbon Capture, Utilization, and Storage (CCUS) processes, effectively controlling the movement of fluids within the reservoir unit. Additionally, it reduces the vertical permeability and significantly affects the geological extent and CO2 coverage within the oil reservoir. However, when subjected to temperature and pressure, CO2 undergoes a transformation into supercritical CO2 within the reservoir [1]. This supercritical CO2 applies a dominant influence along the upper portion of the reservoir during migration, leading to the occurrence of CO2 leakage from the cover layer (caprock or interlayer). Consequently, this leakage can have detrimental effects on both oilfield development and the effectiveness of CCUS efforts [2,3,4,5,6,7,8,9].
Due to their shared origin of occurrence and characteristics, the barriers and interbeds within the reservoir are commonly denoted as interlayers [10,11]. Previous research on interlayers in sandstone reservoirs has primarily concentrated on qualitative and quantitative investigations pertaining to the categorization of interlayer types, the mechanisms of their formation, methods for identification, hierarchical structure, morphological anatomy, development modes, distribution patterns, and the control of remaining oil [12,13,14,15]. These investigations have been based on seismic, well-logging, core, and production data, that have furnished a crucial foundation for the refinement of development strategies in oil and gas fields [16,17,18,19]. Multiple studies have examined the effects of interlayers on fluid migration and recovery in sandstone reservoirs using experiments and simulations. Xu et al. [4] studied the impact of interlayer orientation on supercritical CO2 migration in sandstones with clay interlayers through core experiments and simulations. They found that parallel interlayers facilitated CO2 dispersion, whereas perpendicular ones hindered it. The research also highlighted that fluid migration and storage capacity are significantly influenced by interlayer distribution, the direction of reservoir displacement, and the correlation with CO2 saturation levels [20]. Li et al. [21] studied interlayer characteristics in the LPSR, identifying breakthrough pressure patterns crucial for enhancing oil recovery through gas injection post-water flooding. Xu et al. [5] identified porosity, orientation, extent, and injection direction as governing CO2 migration in the porous media, with aligned interlayers enabling CO2 trapping. Chai et al. [22] utilized a hybrid approach combining numerical simulation and random forest method (RFM) to analyze interlayer interference and recovery factors. Key influencers include interlayer permeability, pressure difference, gas layer thickness, saturation, and production rate. Wei et al. [23] have found that interlayers, especially longer ones, hinder steam chamber growth in the Steam Assisted Gravity Drainage (SAGD) process, requiring more time for stable output. This is because gas tends to bypass the sides of the interlayers and migrate to the reservoir top. Yang et al. [24] showed interlayers reduced fracture complexity and growth, especially with higher thickness ratios. Recent studies have highlighted the need to optimize CO2 flooding schemes by considering layer grouping, well pattern and spacing adjustment, gas channeling plugging, and mobility control measures to increase the CO2 swept volume, as well as pressure control and injection-production optimization to improve oil displacement efficiency [25,26,27].
Interlayer configurations play a pivotal role in the dynamics of CO2 and fluid movement, displacement efficiency, fracture propagation, and overall reservoir recovery [2,3,28]. Significantly, the sealing capacity of interlayers is a determinant factor in shaping various development strategies for CO2 flooding processes within reservoirs. The efficiency of this sealing mechanism is influenced by a complex interplay of parameters, including interlayer type, petrophysical properties, thickness, areal extent, shape, and continuity.
This study focuses on the interlayers of low-permeability sandstone reservoirs as its primary research subject. We aim to characterize these interlayers both qualitatively and quantitatively by employing a suite of analytical techniques. These include energy dispersive spectroscopy (EDS), thin section casting equivalence, and field emission-scanning electron microscopy (FE-SEM). In conjunction with utilizing well-logging response characteristics, we further utilize 3D geological modeling to elucidate the spatial distribution and characteristics of these interlayers. We aim to investigate the sealing capacity and impact of different interlayer types under reservoir conditions (90 °C, 17 MPa). The obtained dynamic model is based on the characterized interlayer parameters. This model enables us to analyze the sealing capacity and influence characteristics of various interlayer types during the CO2 flooding process (Figure 1). The main aim of this research is to provide substantive theoretical guidance based on an integrated study for assessing the CCUS-EOR applications.

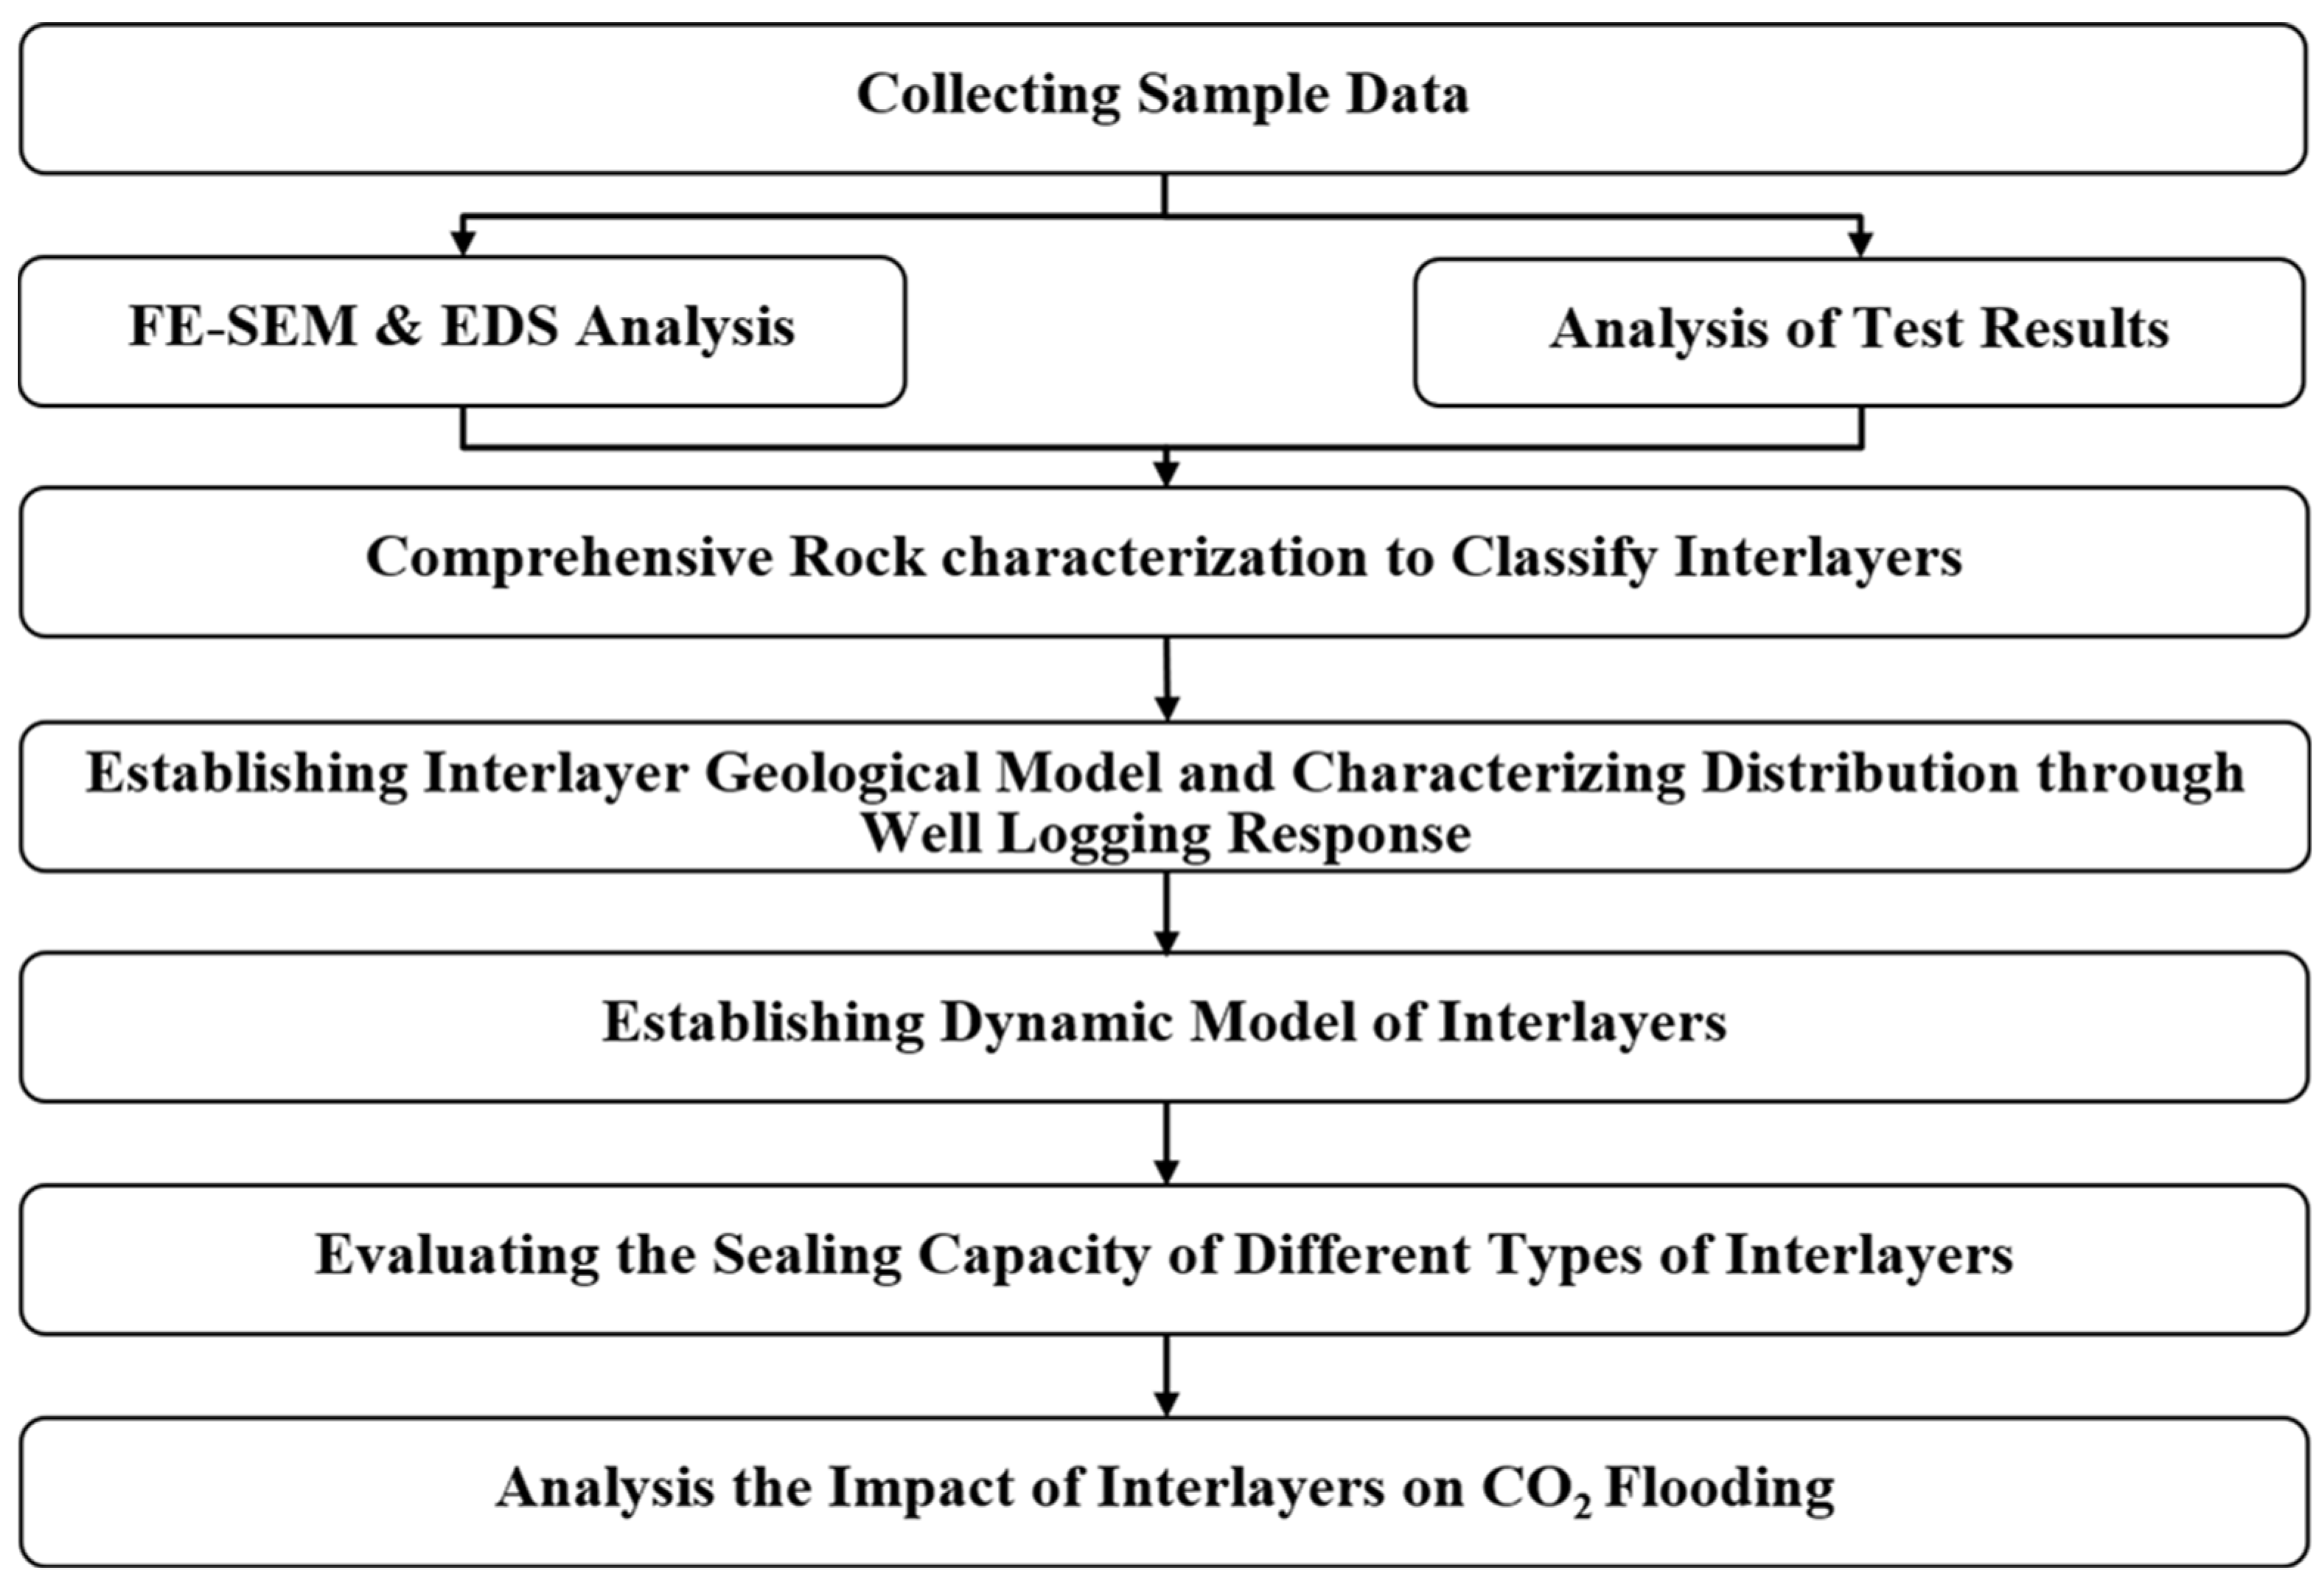
2. Materials and Methods
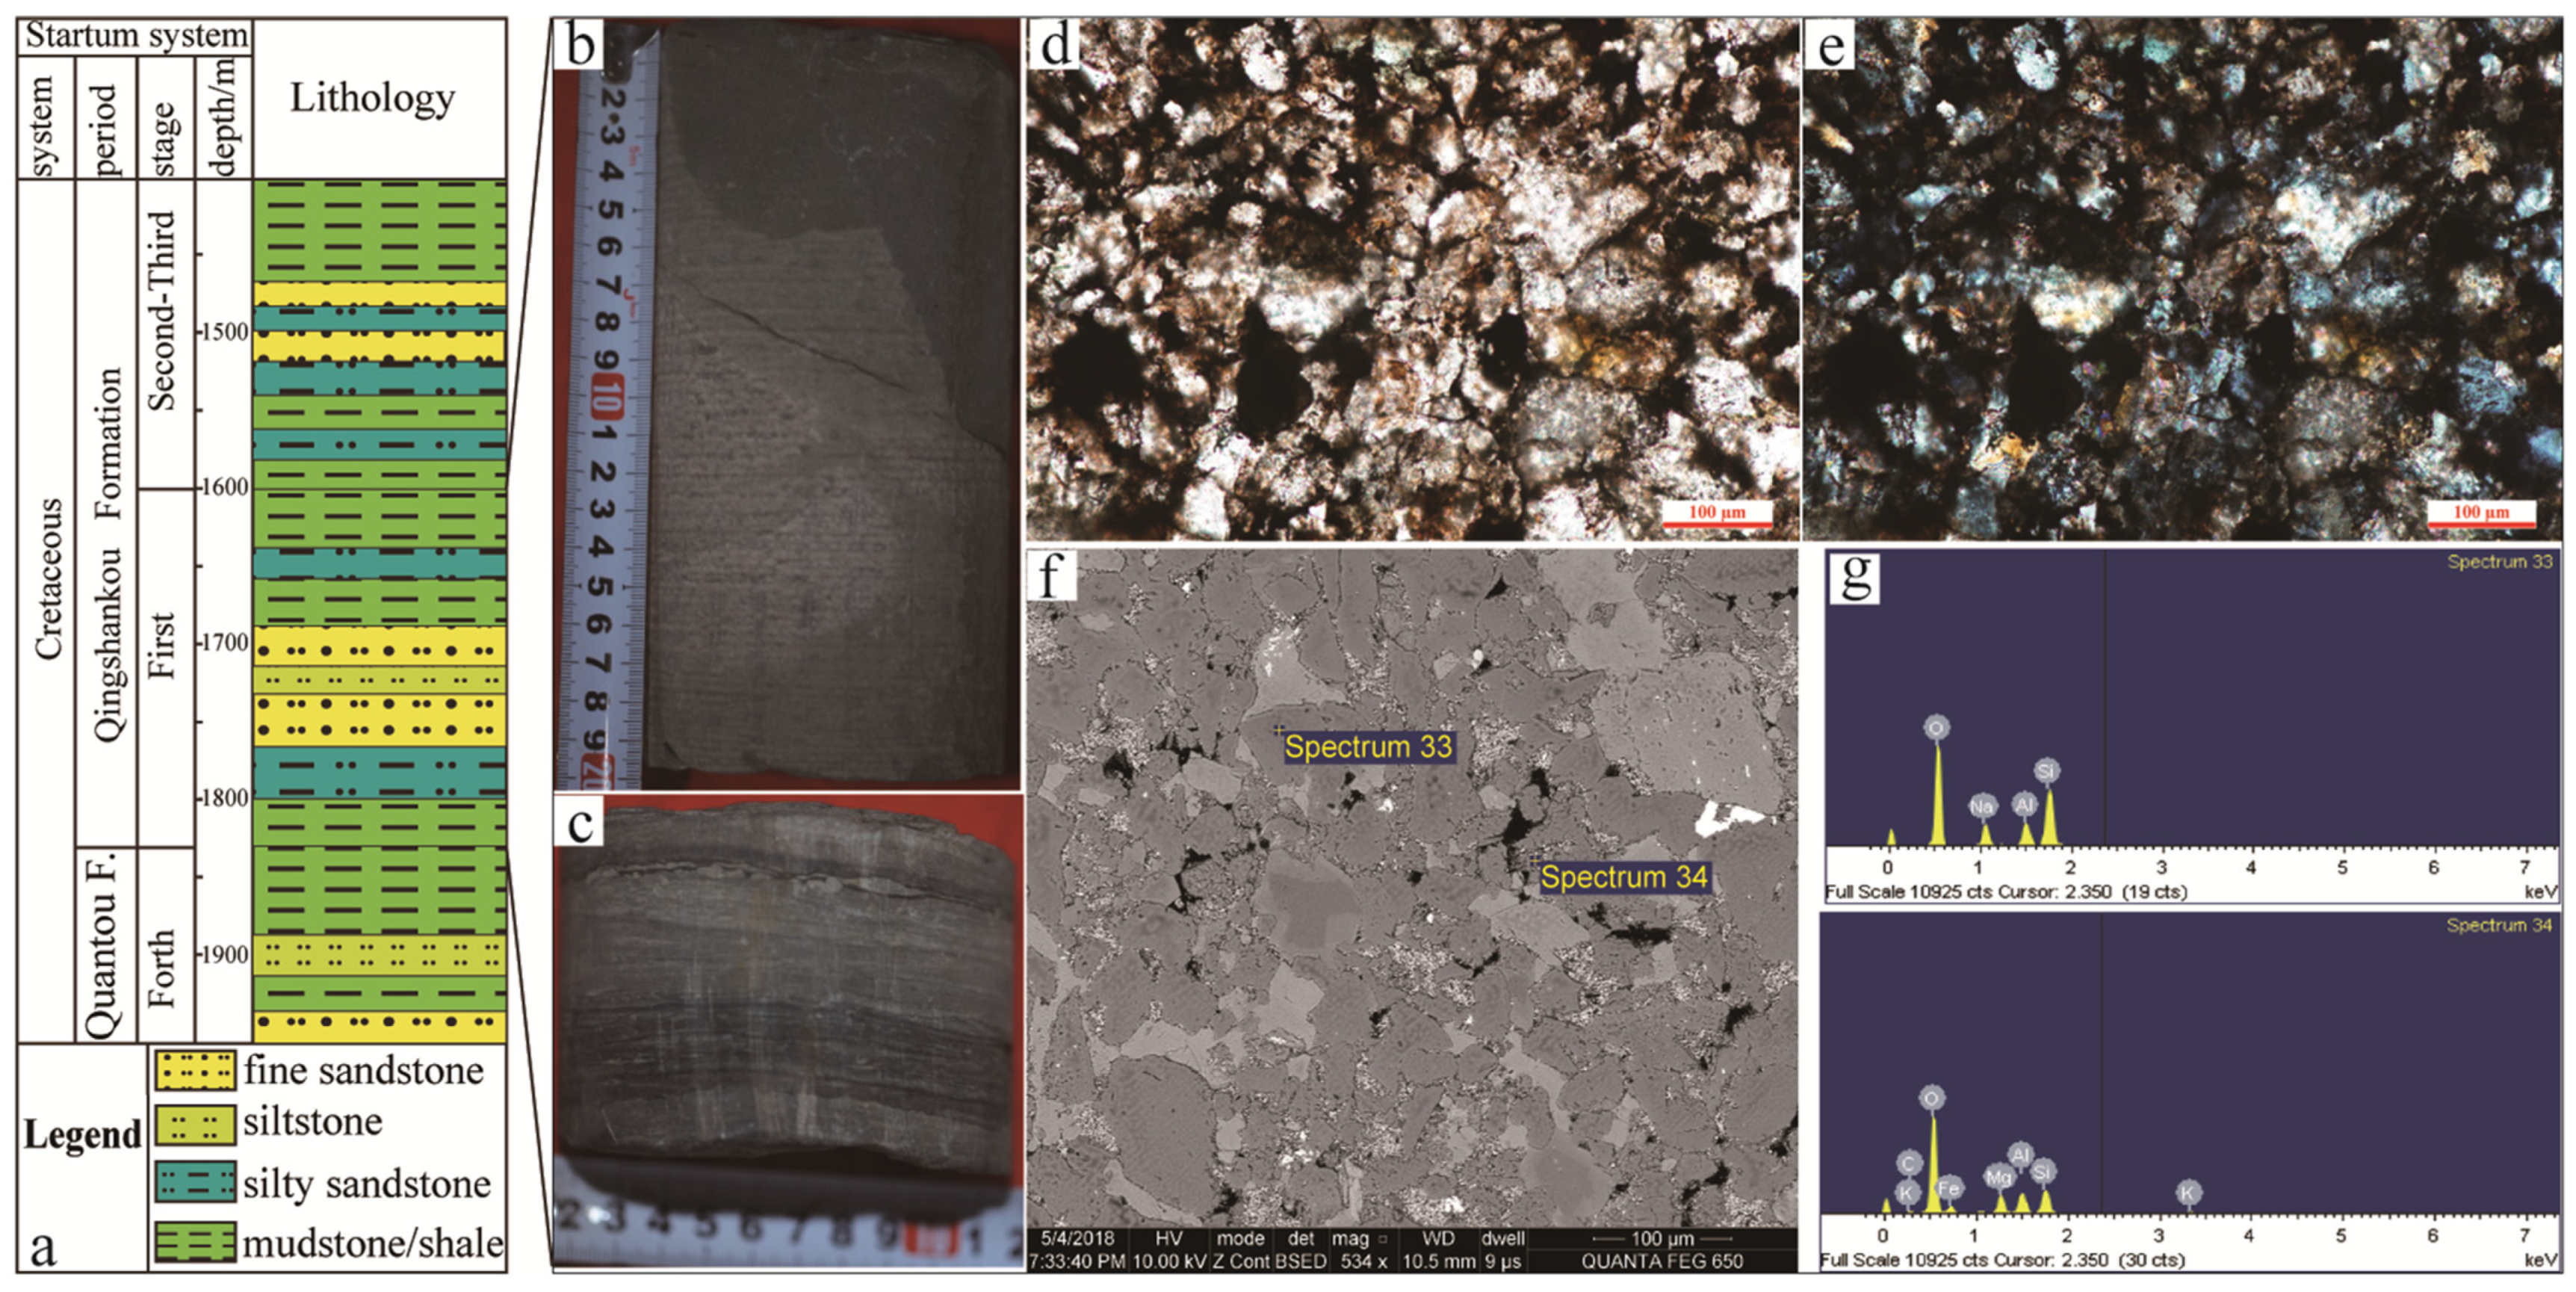
2.1. Samples

This study utilized core samples from three wells penetrating the LPSR in the Qingshankou Formation, Songliao Basin, China (Figure 2a). The average sampling depth was 1800 m. A total of 80 core plugs, each 5 cm in length and 2.5 cm in diameter, were subjected to porosity and permeability measurements to characterize the presented reservoir’s petrophysical properties. A representative core plug was selected for detailed analysis, exemplifying the formation’s average characteristics.

2.2. Rock Characterization

Numerous methods exist for identifying interlayers within geological formations, yet core observation remains one of the most direct and accurate approaches to closely measure and investigate the reservoir’s geological properties [29,30]. This method, when combined with microscopic techniques such as FE-SEM and EDS, offers an intimate view of the different interlayers. The FE-SEM and EDS results provide a detailed examination that reveals the intricate microstructure and elemental composition of these interlayers (Figure 2b–g).
Therefore, based on core and microscopic observations, as well as petrophysical property test data results, the interlayers within the study area have been classified into two distinct types: petrophysical and argillaceous. The analysis of cores from four wells in the study area has revealed distinct characteristics for each type. Petrophysical interlayers and argillaceous interlayers each exhibit unique features that contribute to a comprehensive understanding of the complex subsurface geology. Through careful core analysis and the application of microscopic techniques, a bright picture of the geological details is established, highlighting the diverse nature of these interlayers and their significance in the context of reservoir properties.

2.2.1. Petrophysical Interlayers

Petrophysical interlayers are fine, gray barriers deposited during the reservoir formation, like a thin veil separating sand bodies. These interlayers, predominantly found draping the outer edges of underwater natural levees, exhibit a story of changing sedimentary dynamic conditions (unstable depositional process). Their increased mud content gives them a distinctly finer texture compared to the surrounding reservoir rocks, almost like finding a silk ribbon woven into a coarse fabric. Under the microscope, these interlayers reveal a world of tiny particles locked in a clayey matrix. The rock is primarily composed of muddy siltstone, where silt-sized grains are suspended in a clay-rich matrix, creating a texture reminiscent of sand grains floating in a mud body (Figure 2b). This muddy silt structure dominates the landscape at the microscopic level. Zooming in further, we find clay minerals, predominantly illite, with an estimated presence of 38% to 60% within the entire rock material. These clay minerals form a complex network, weaving between the larger grains like a microscopic tapestry. Dispersed within this clayey background are particles of quartz and feldspar, angular survivors of the weathering process, constituting about half of the rock’s composition. These debris particles, mostly ranging from 0.02 to 0.2 mm in size, show a uniformity that explains the consistent energy of the depositional environment. Their sub-round to medium-round shapes also describe a story of transport and abrasion, with the clear, glassy grains of monocrystalline quartz being the most common sight.

2.2.2. Argillaceous Interlayers

The argillaceous interlayers appear as thin, dark bands marking the tops of subaqueous distributary channel sand bodies or separating distinct channel deposits. These layers are the geological equivalent of a full stop, marking pauses in the high-energy depositional events that formed the sand bodies. Peering closely, one finds a range of fine-grained rocks: claystone, muddy siltstone, and silty mudstone. The structure of these rocks is dominated by mud, creating a smooth, almost uniform appearance. However, this apparent uniformity is interrupted by the presence of delicate horizontal bedding (Figure 2c). Each line tells a story of quiet deposition in calm waters. The mineral composition of these layers is a testament to the low-energy environment in which they formed. Clay minerals, again predominantly illite, dominate the presence. When viewed under high magnification, these clay minerals appear as a sea of tiny, overlapping, flaky plates, creating a complex, interwoven structure (Figure 2d). Interspersed within this clay-rich matrix are sparse debris particles, making up only about a third of the rock. These particles, mainly quartz and feldspars, are smaller than their counterparts in the petrophysical interlayers, ranging from 0.02 to 0.1 mm in size (Figure 2e). Their good sorting and sub-round to medium-round shapes indicate the environmental origin of such particles. As with the petrophysical interlayers, monocrystalline quartz is the primary debris component, with its clear grains standing out against the muddy background (Figure 2f).

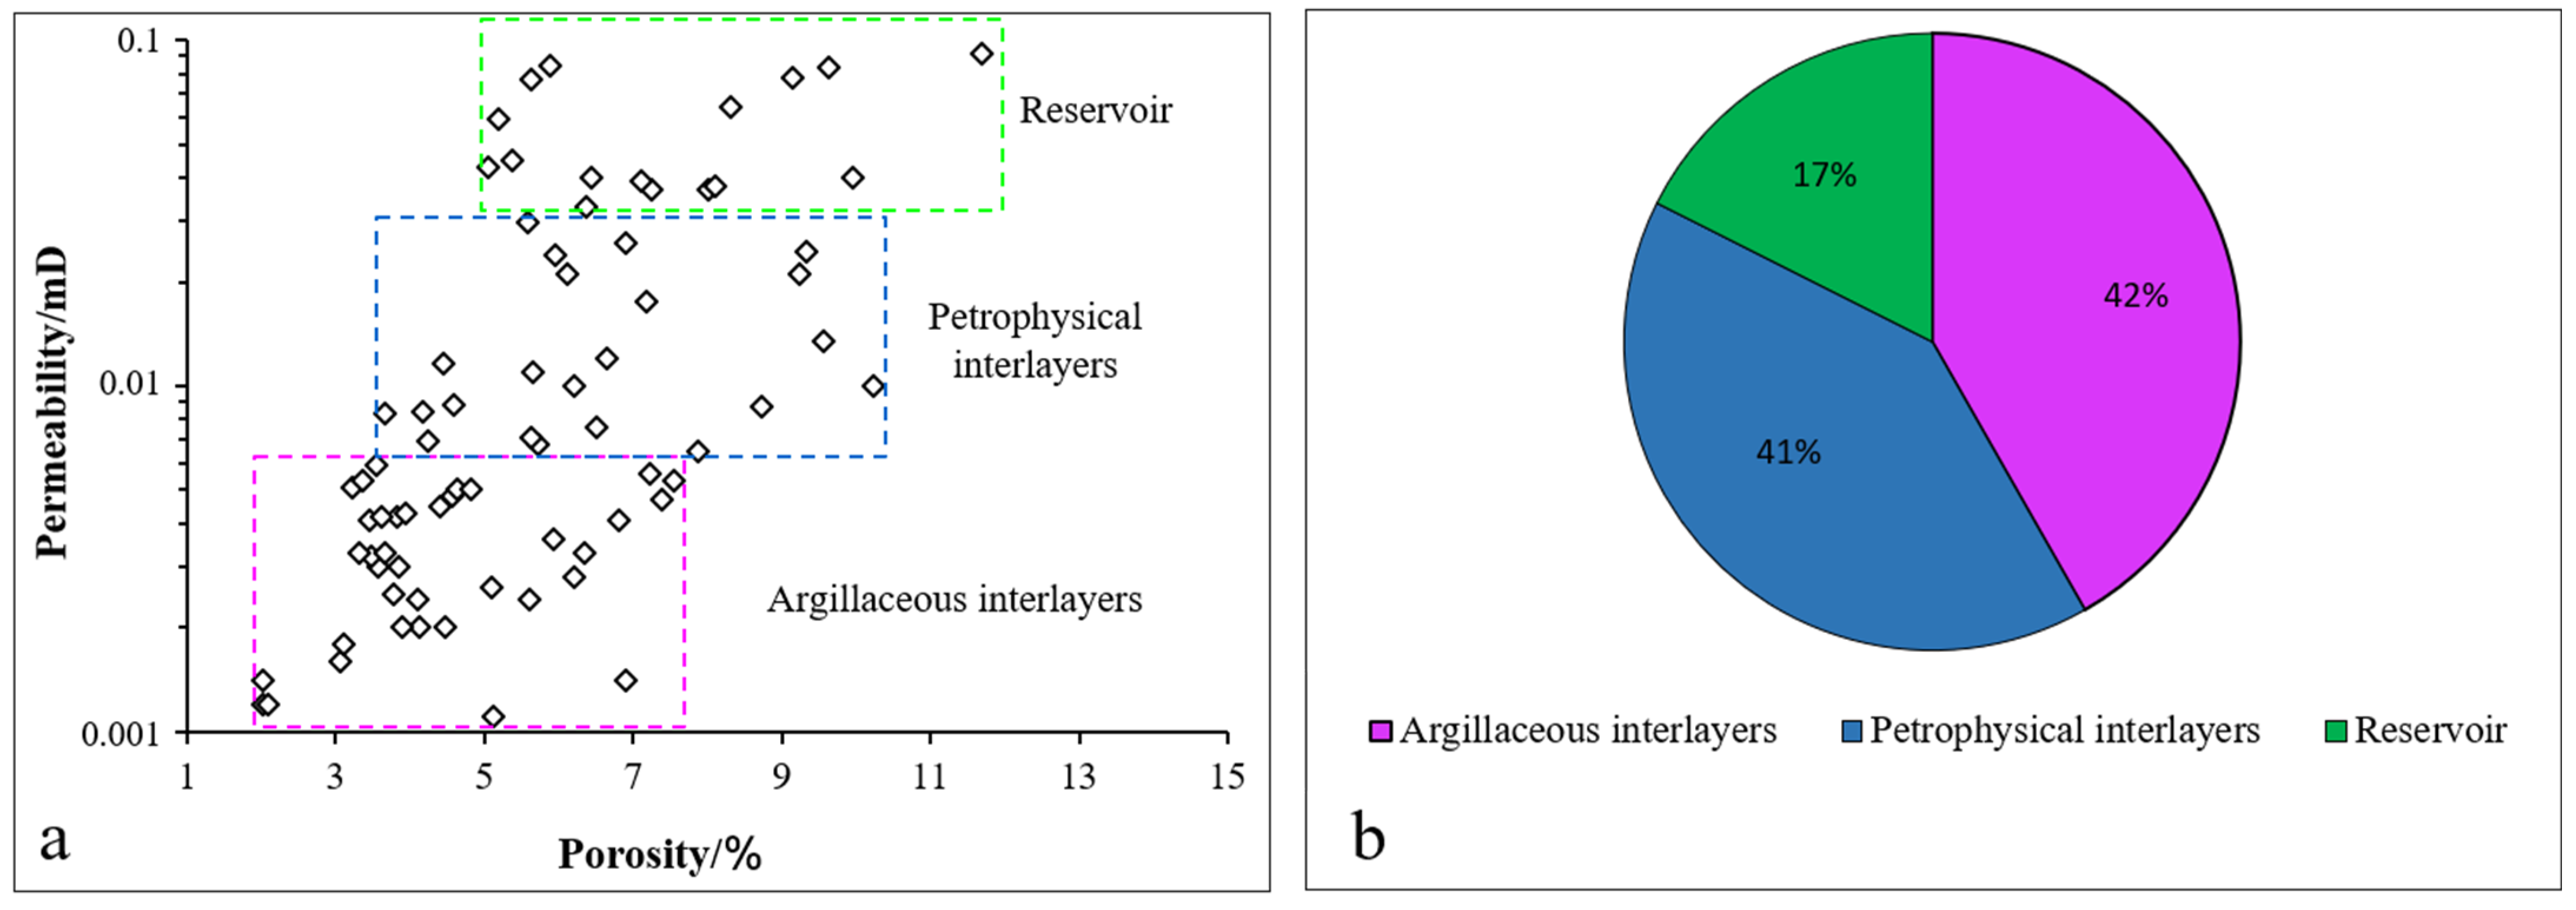
2.2.3. Interlayers Petrophysical Property

The petrophysical properties of the core samples were evaluated using gas permeability and gas porosity methodologies. Analysis of the results reveals a wide distribution range in reservoir permeability, indicating significant heterogeneity within the formation. Multiple interlayer samples were subjected to a detailed examination, revealing that the overall permeability was less than 0.03 mD, and the porosity was less than 12% (Figure 3a). The petrophysical interlayers exhibited porosity values below 11%, with permeability ranging from 0.006 to 0.03 mD (Figure 3b). Argillaceous interlayers exhibited distinctively low permeability characteristics, effectively rendering them impermeable barriers within the reservoir system. The porosity of the argillaceous interlayers ranges from 1% to 8%, with permeability values spanning from 0.001 to 0.005 mD. Notably, these samples represent 42% of the total analyzed, indicating a significant presence of these ultra-low-permeability zones within the reservoir (Figure 3b). This high proportion of argillaceous interlayers contrasts with the overall effective reservoir properties. The flow data analysis for the entire sample set reveals an average porosity of approximately 8% and a mean permeability of approximately 0.06 mD. The prevalence and low permeability of these argillaceous interlayers likely play a crucial role in compartmentalizing the reservoir and influencing fluid flow patterns.

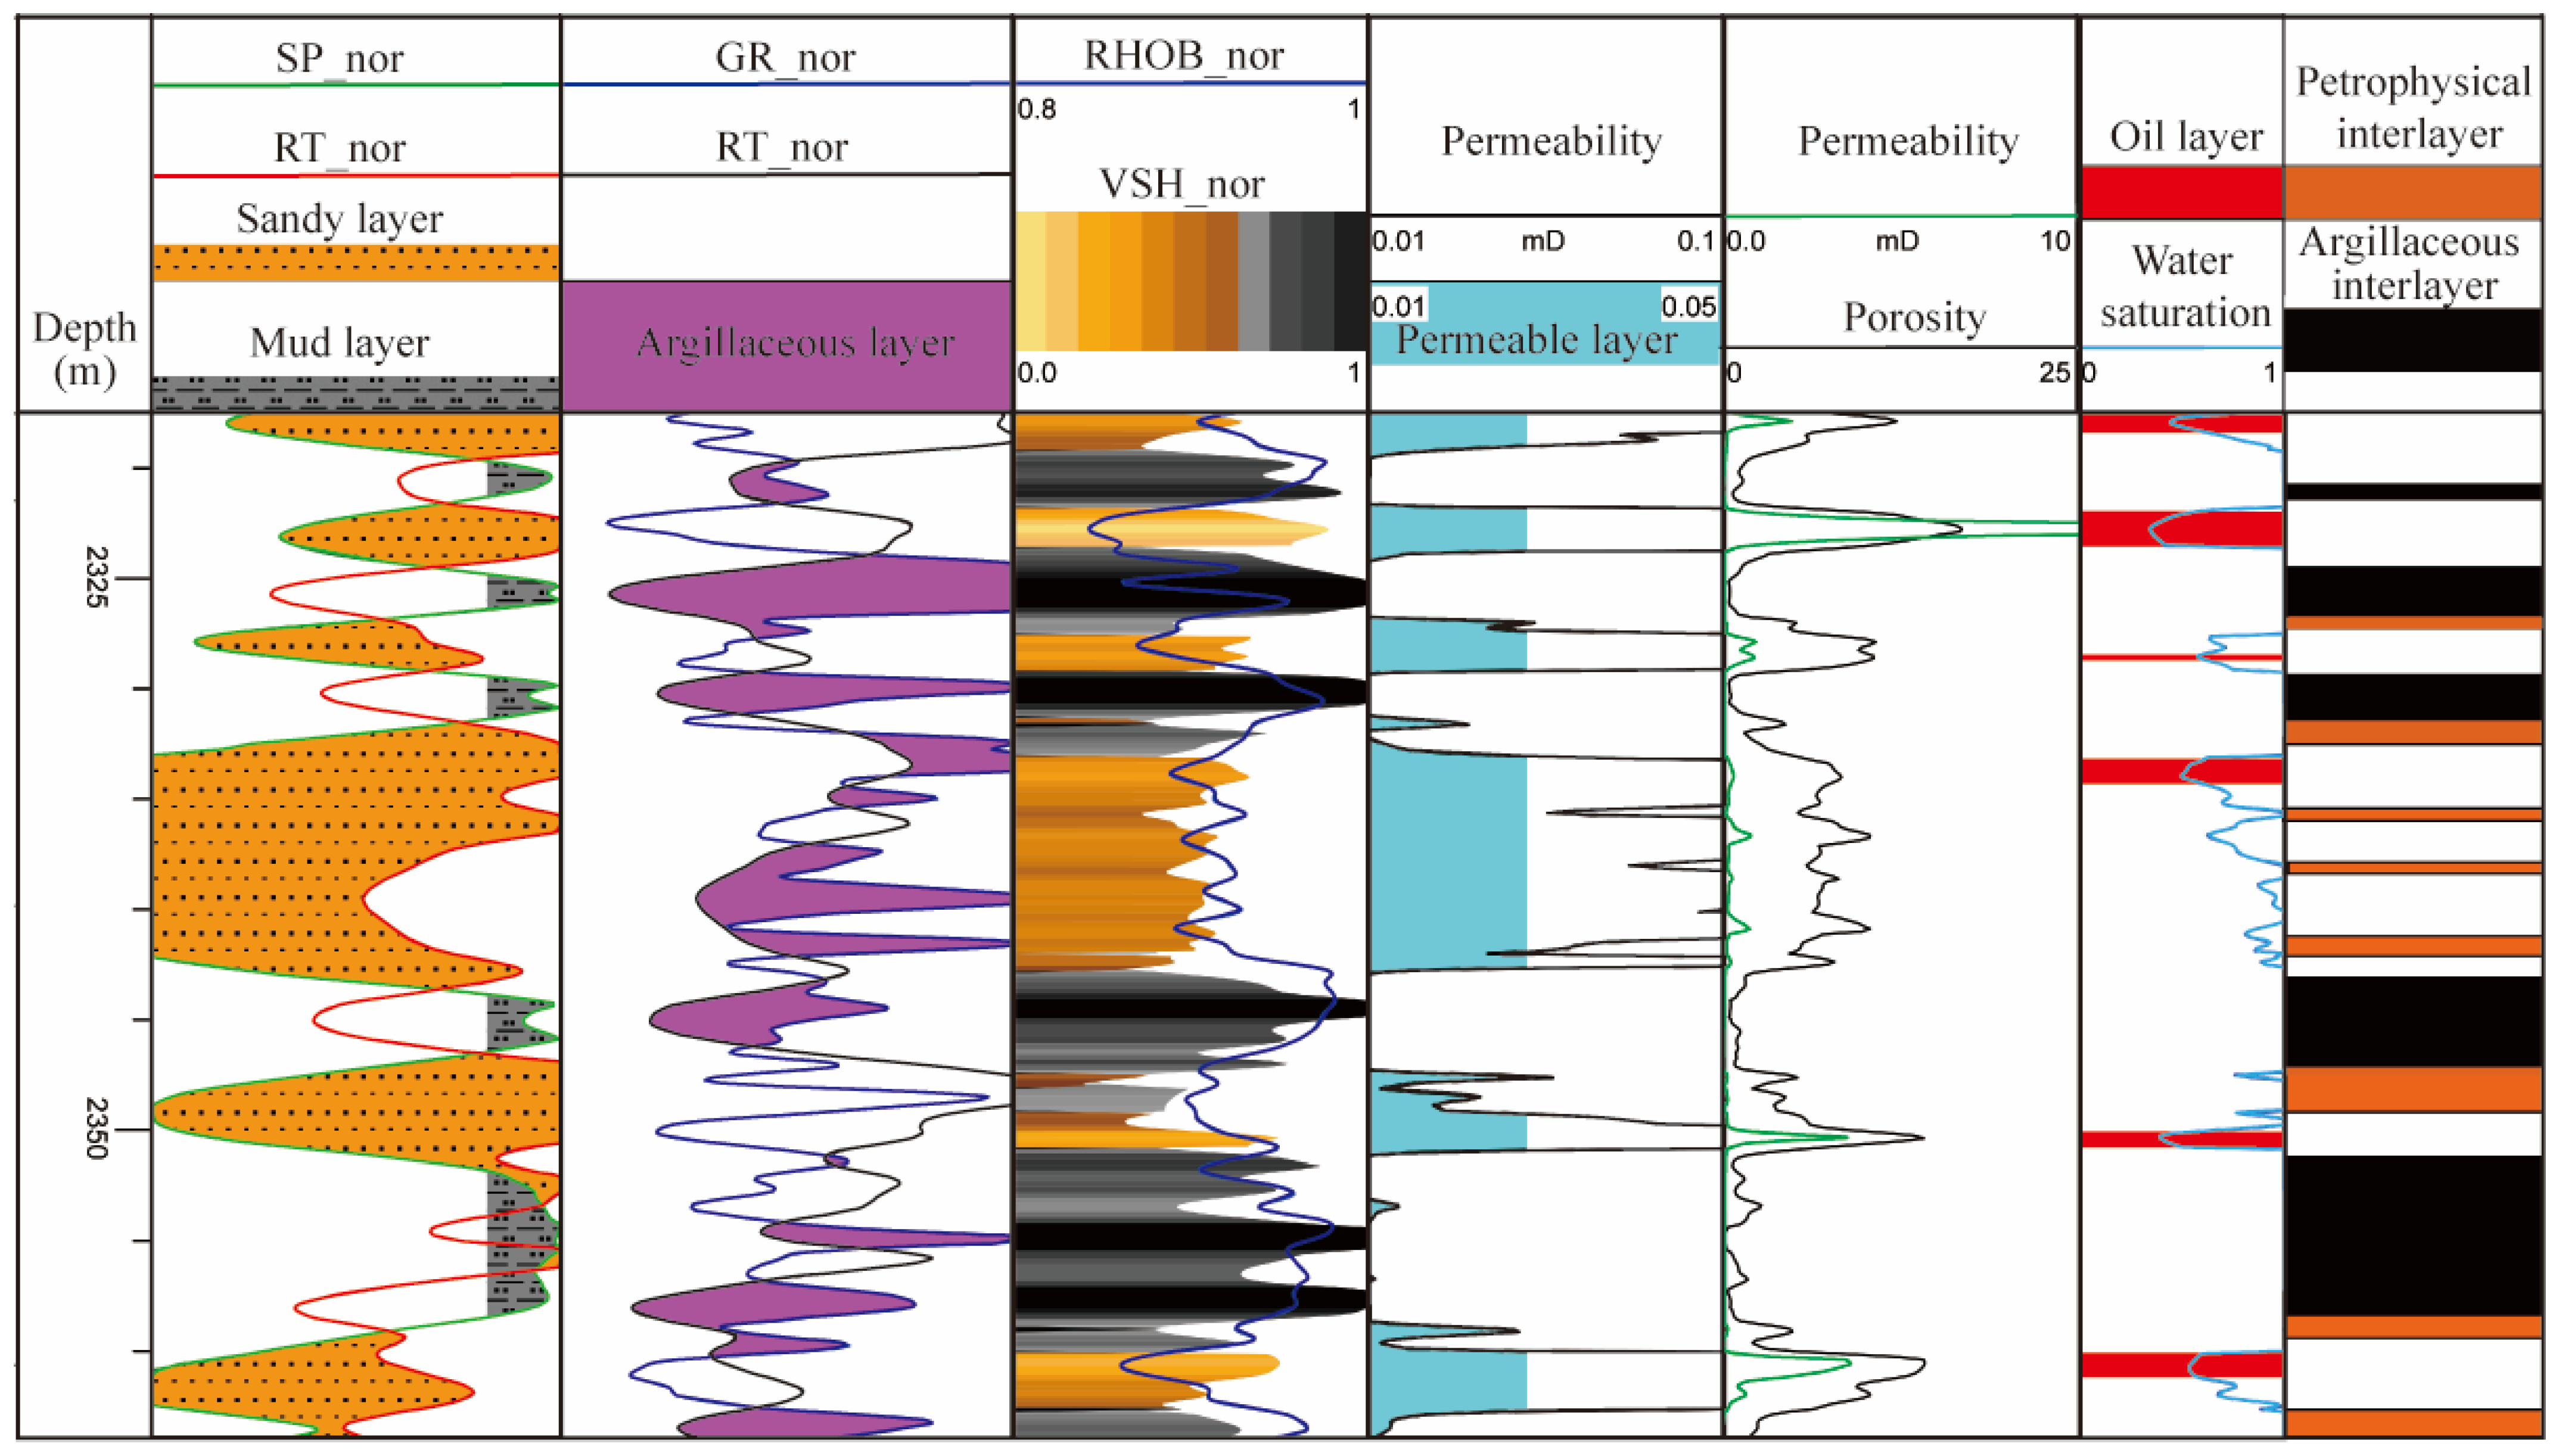
2.3. Well-Logging Response

The analysis of well-logging response characteristics serves as a crucial method for investigating the spatial distribution of interlayers. By integrating comprehensive conventional well-logging curves available in the designated study area, distinct interlayers are identified through the synthesis of acoustic, radioactive, electrical, and petrophysical property characteristics.
Given the limited core data obtained from cored wells in the study area, well-logging data provides a more comprehensive and abundant dataset, effectively compensating for the scarcity of core samples. However, due to the prolonged development history of the oilfield, well-logging data were measured using different instruments across various locations, resulting in diverse response characteristics for different types of interlayers. Even after environmental corrections, discrepancies, and errors persist in the dimensionality of new and old logging data due to variations in instruments, calibration standards, and operational methods, as well as the influence of drilling mud and borehole diameter. Consequently, the comparability of original logging data from different wells is relatively poor [21].
To address these challenges, this study selects sensitive curves for identifying different types of interlayers. Based on the normalization technique of well-logging curves to eliminate dimensionality, we prioritize well-logging curves that demonstrate a good response to two types of interlayers and have complete data, including the curves of spontaneous potential (SP), gamma ray (GR), resistivity (RT), density (RHOB), and volume of shale (VSH). The normalization process is conducted using the following Equation (1) [14]:
X1 = (X − Xmin)/(Xmax − Xmin)
where X1 is the normalized well-logging curve and value X is the original well-logging curve value of the American Petroleum Institute (API); Xmax is the maximum logging value in the processed interval (API); Xmin is the minimum logging value in the processed interval (API). This normalization strictly constrains the well-logging curve values between 0 and 1, enabling comparison and computation between different types of logging curves. This enhancement improves the comparability of logging data across multiple wells and increases the precision and accuracy of log interpretation.
Combining the analysis of logging response characteristics for different interlayer types, we prioritize the use of normalized GR (GR_nor), SP (SP_nor), RT (RT_nor), RHOB (RHOB_nor), and other logging data. These parameters are cross-plotted in pairs and integrated with rock petrophysical characteristics to establish comprehensive cross-plot templates for identifying various interlayer types (Figure 4). This approach forms a quantitative identification standard for interlayers, which is subsequently applied to recognize and delineate interlayers in non-cored well sections within the study area.

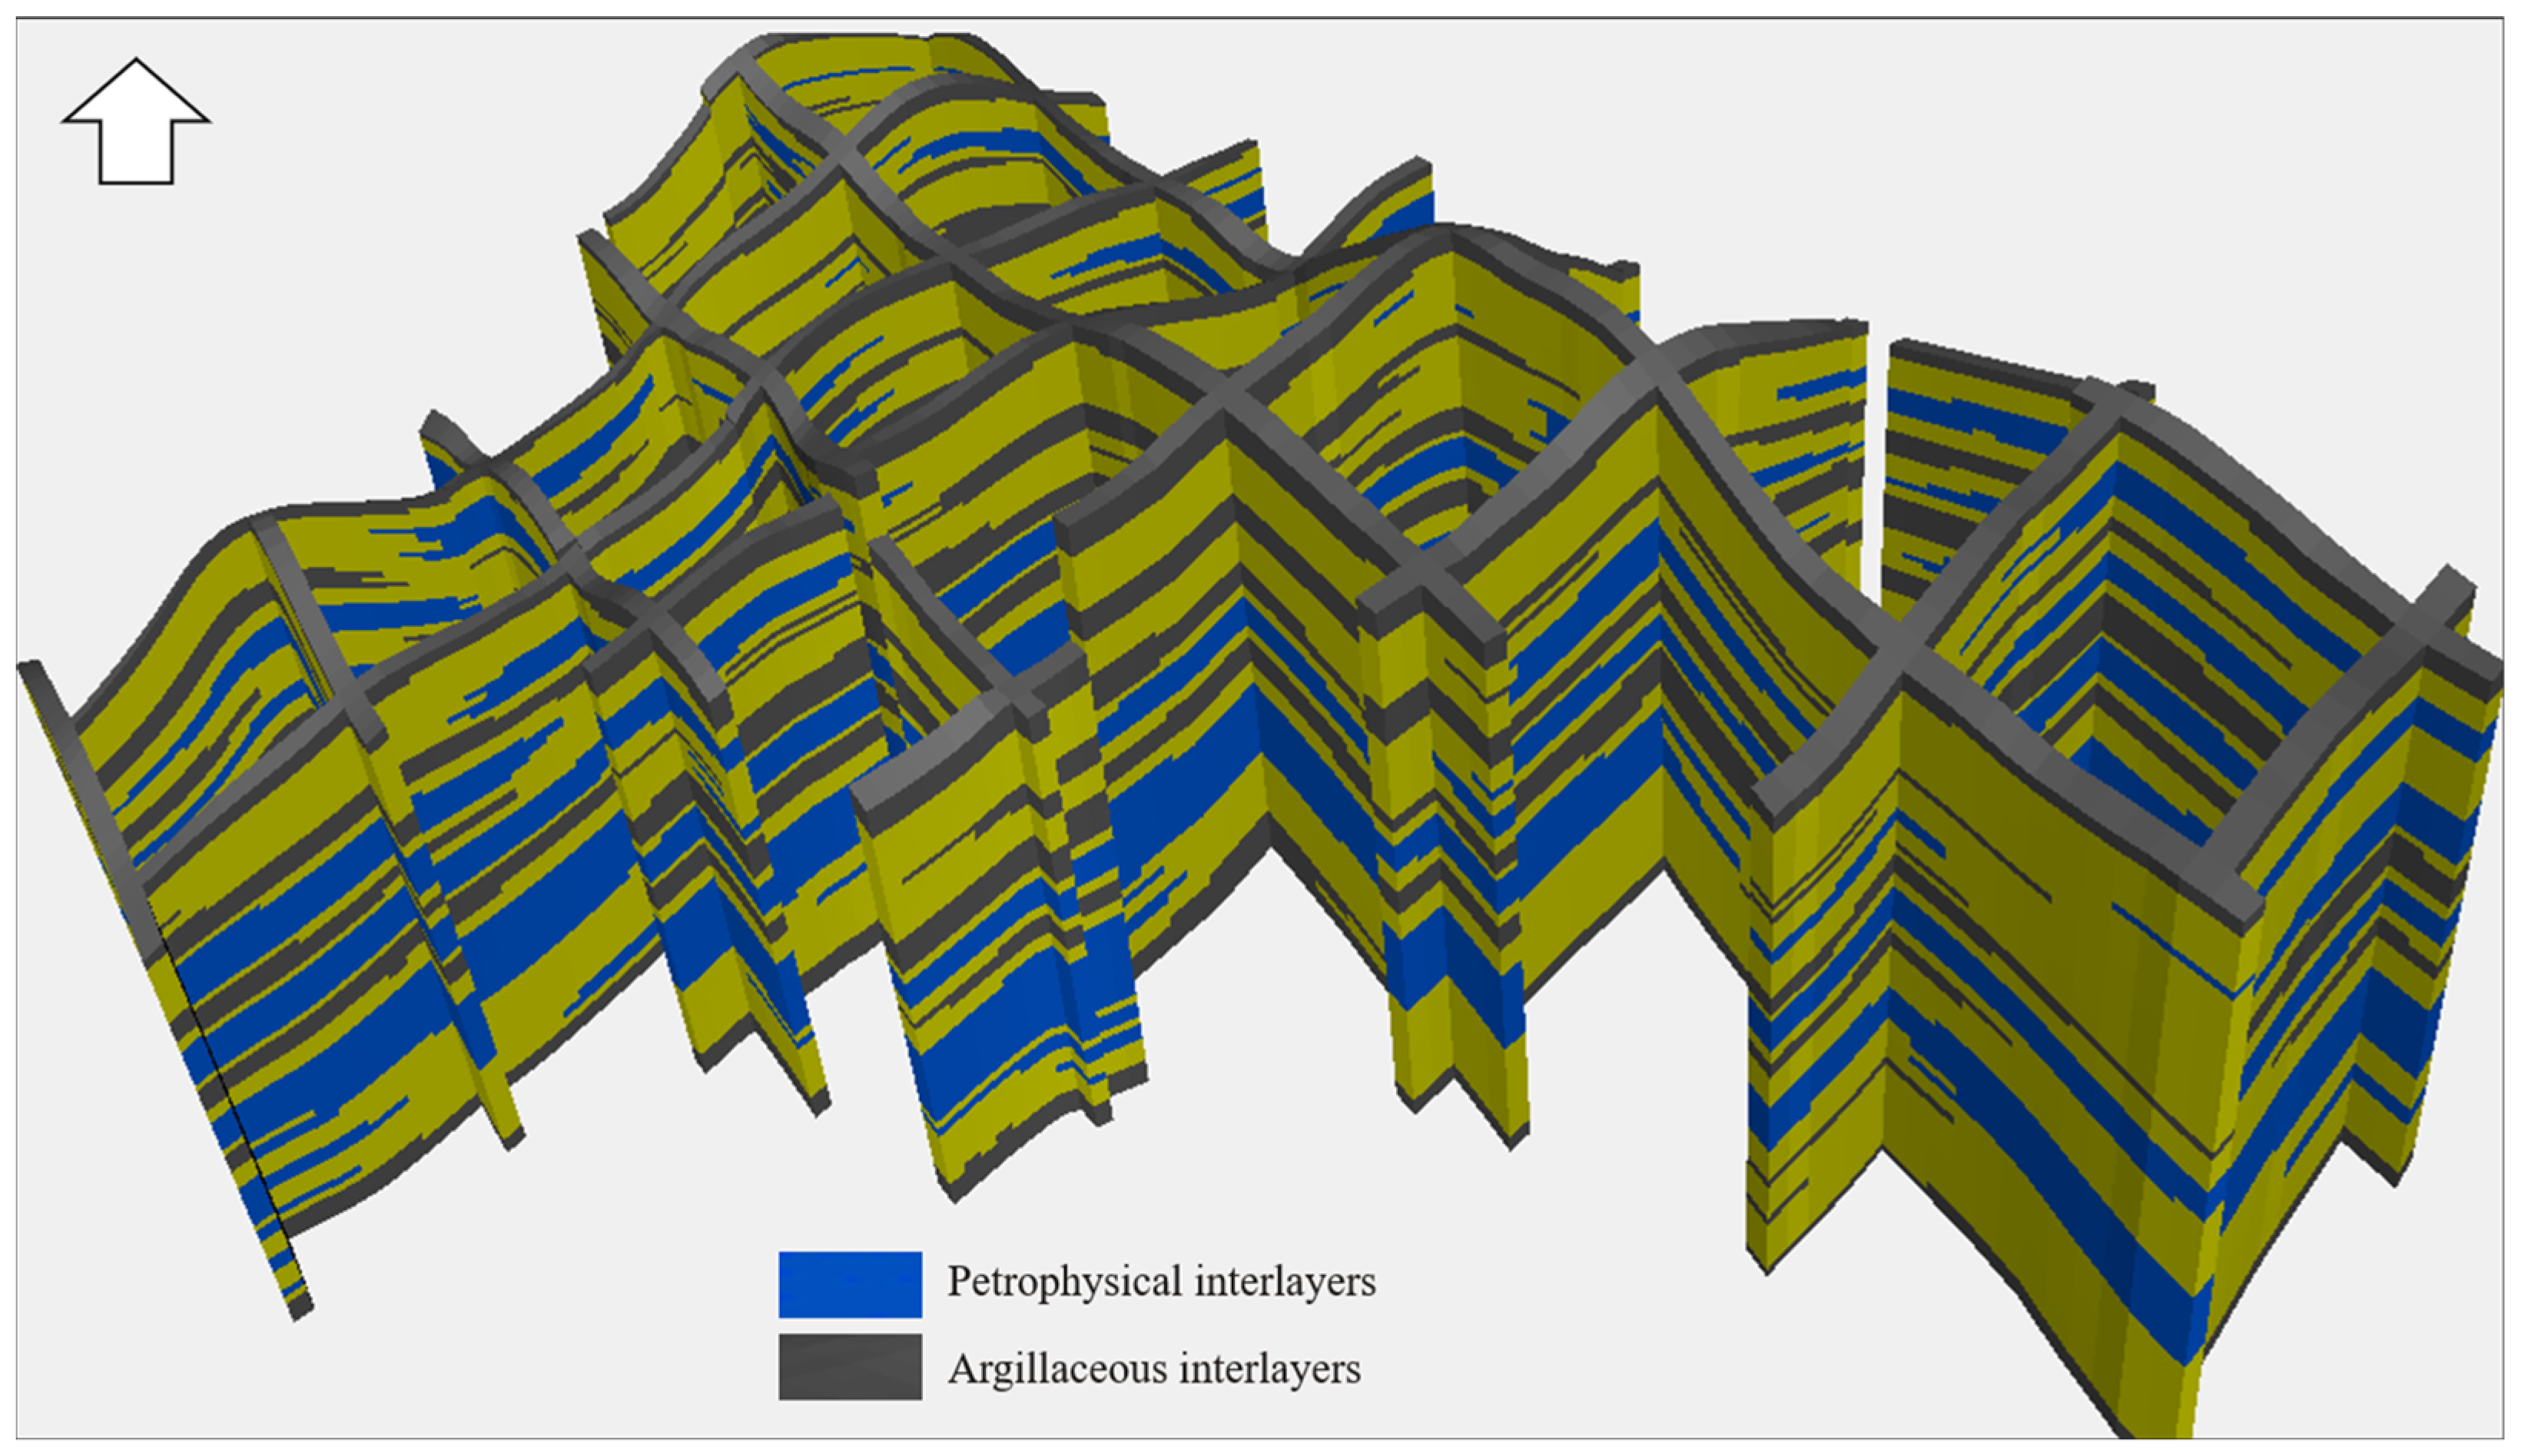
2.4. 3D Distribution

The spatial distribution characteristics of interlayers in the geological model primarily reflect the comprehensive geological understanding of the study area. Utilizing the HiSimR 4.0 software [31], which is a highly integrated multi-dimensional reservoir simulator, we established a 3D model to analyze the spatial distribution characteristics of interlayers within the geological framework. Notably, argillaceous and petrophysical interlayers exhibit conspicuous presence, occurring in alternating layers with stable distribution and excellent continuity, thus demonstrating significant heterogeneity within the reservoir system. In contrast, the development of interbeds is characterized by instability, dispersion, a certain degree of randomness, and limited continuity, typically manifesting with relatively smaller thicknesses (Figure 5).
Argillaceous barriers predominantly occur between layers, serving as marker beds for stratigraphic delineation. Conversely, petrophysical barriers are primarily found within individual layers, exhibiting a strong correlation with reservoir sections. Despite their rapid lateral variability, these petrophysical barriers maintain consistent thickness and display localized regional distribution characteristics.
A notable trend in the spatial configuration of interlayers is the gradual thickening from west to east across the study area. This pattern is primarily attributed to variations in the depositional environment. The eastern region, being proximal to the sediment source, is dominated by subaqueous distributary channels and mouth bar deposits. Westward, there is a transition to distal, fine-grained sedimentation, characterized by decreasing sand body thickness and an increasing trend in mud content. These lateral facies variation significantly influences the distribution and characteristics of interlayers, with thicker, more pronounced interlayers in the east gradually thinning and becoming less distinct towards the west.
Merely conducting qualitative analysis on the types and spatial arrangement of interlayers in oilfield development is insufficient; a quantitative assessment of the spatial distribution of various interlayer types is imperative. To achieve a more comprehensive understanding of the spatial distribution of these interlayers, we employed high-resolution image processing techniques to perform image segmentation on multiple sections within the 3D model of the study area. This approach allowed us to extract detailed data from the east-west and north-south sections. Subsequently, we conducted statistical analysis on parameters such as dip angle, thickness, and length of interlayers belonging to the same category (Table 1). This quantitative assessment provides a more accurate representation of the spatial distribution characteristics of different types of interlayers, which is crucial for understanding their impact on fluid flow and reservoir performance.
The results of the characterization parameter indicate that the distribution dip angle (0°, horizontal, measured counterclockwise from the east) of both barrier and interbed is primarily between 0–10° and 170–180°. The petrophysical interbeds have a minimum thickness of 0.41 m, while the argillaceous interbeds have a minimum thickness of 0.27 m. The maximum thickness for petrophysical interbeds is 3.3 m and above, while for argillaceous interbeds, it is more than 2.4 m. On average, the thickness is greater than 1m. There are significant differences in the maximum thickness between physical and argillaceous barriers. The petrophysical barrier exhibits a maximum thickness of 17.11 m, a minimum thickness of 0.25 m, and an average thickness of 4.34 m. Particularly, barriers with less than 4m thickness constitute 80% of the total petrophysical barrier (Figure 6). In contrast, the argillaceous barriers surpass the petrophysical barrier in thickness, with a maximum measurement of 18 m, a minimum measurement of 0.33 m, and an average measurement of 5.93 m.
The planar distribution range of the interlayer is determined by its length, which includes the extension length in both the X and Y directions. The length of the interlayer is consistent with the length of the study block and the section length. By default, the inter-layer is defined as the interbed with a certain thickness and stable distribution between the injection well and the production one. To conduct numerical simulation research on reservoirs in the later stage, it is necessary to examine the length distribution characteristics of interlayers within a 250 m range.

2.5. Dynamic Model Establishment

To investigate the impact of interlayers on CO2 flooding, a three-dimensional dynamic model was constructed using the HiSimR 4.0 reservoir simulator. The model was simulated over a 10-year period and featured a five-spot well pattern with a well spacing of 180 m. The grid dimensions were 40 × 40 × 19 cells, with a grid size of 4.5 m in the X and Y directions and 1 m in the Z direction (Figure 7). The interlayers were represented by grid cells 5 to 7 and 12 to 14, while the oil layers were represented by grid cells 1 to 4 and 15 to 19. The initial reservoir conditions were set at a 17 MPa pressure and 90 °C temperature. The petrophysical parameters for the interlayers were assigned as follows: argillaceous interlayers had a porosity of 5% and a permeability of 0.005 mD, while petrophysical interlayers had a porosity of 7% and a permeability of 0.02 mD. The production strategy involved pressure-constrained constant rate injection and pressure-constrained constant liquid volume production. For specific details regarding the simulation configuration and petrophysical parameters of the dynamic model, please refer to Table 2.
To accurately simulate the behavior of CO2 in the reservoir, we standardized the diffusion coefficient of CO2 in rocks with varying permeabilities using a combination of experimental determination, theoretical calculation, data standardization, and result validation. Laboratory experiments were conducted under reservoir conditions (90 °C, 17 MPa) to measure the diffusion coefficient of CO2 in rocks with different permeabilities. Theoretical models and experimental data were then used to calculate the diffusion coefficients of CO2 in crude oil (9.69 × 10⁻⁷ m2/s) and formation water (1.59 × 10⁻⁷ m2/s). These coefficients were standardized across different rock permeabilities by considering factors such as temperature, pressure, and chemical composition. The standardized diffusion coefficients were validated against field data to ensure their applicability across diverse reservoir conditions. Furthermore, Table 3 presents the specific formation fluid-related parameters used in the simulation. The oil-water relative permeability data, obtained from cored wells in the Y area, were utilized to determine the relative permeability curves.

3. Results and Discussion

3.1. Petrophysical Interlayer Sealing Capacity

The efficiency of CO2 flooding for enhancing displacement productivity and increasing the rate of recovery in low-permeable oil reservoirs is contingent upon the reservoir’s independence and integrity. In light of the characterization findings pertaining to interlayers within the study area, a minimum interlayer thickness of 0.3 m is established, with subsequent increments until the interlayer achieves a proper sealing capacity for the reservoir. Their planar distribution is discontinuous, exhibiting strong randomness and significant lithological variations. The dissimilar petrophysical properties of petrophysical and argillaceous interbeds result in varying impacts on CO2 diffusion at different thicknesses and scales. For this investigation, two sets of interbeds with consistent thickness were used in the study area, with lengths and widths of 45 m, 90 m, and 135 m, respectively. A simulation was conducted to replicate CO2 flooding over a period of 10 years. The simulation results depicted in Figure 8, Figure 9, Figure 10 and Figure 11 illustrate the cross-sectional flow characteristics of CO2 within petrophysical and argillaceous interlayers of different thicknesses, spanning from the injection well (located on the right side) to the production well.

3.1.1. Petrophysical Barriers

As shown in Figure 8, the presence of the petrophysical barrier with a thickness of 0.3 m in the reservoir has minimal impact on CO2 diffusion prior to breakthrough. Over a period of 10 years of CO2 flooding, the barrier does not function as a seal. However, when the physical barrier thickness ranges from 0.9 to 3.3 m, it effectively restricts the longitudinal diffusion of CO2. Following 10 years of CO2 flooding, CO2 diffuses longitudinally at both ends of the petrophysical barrier with this thickness, ultimately escaping from the barrier in close proximity to the production well. When the petrophysical barrier thickness is equal to or more than 4 m, CO2 maintains a relatively stable distribution range over an extended period. This effectively prevents the supercritical CO2 from migrating towards the upper layers in the form of gravitational override. This is attributed to the permeability of the petrophysical barrier, which allows CO2 to penetrate smaller pores in the upper and lower sections of the barrier during a 10-year CO2 flooding process, resulting in a reduction in the effective barrier thickness. Although there is minimal CO2 leakage near the injection well, the interlayer functions as a comprehensive seal between layers.
Figure 8. Mole fraction distribution in various thicknesses of petrophysical barriers during 10 years of CO2 flooding.
Energies 18 00593 g008

3.1.2. Petrophysical Interbeds

In this study, two sets of interbeds were positioned between the production well and the injection well, as shown in Figure 9. The migration characteristics of CO2 in petrophysical interbeds with varying areas (45 m, 90 m, and 135 m) were examined. The presence of the gravity overriding effect and the permeability of the petrophysical interbed facilitated preferential leakage of CO2 in the upper interbed, particularly in the thinner (0.9 m) interbed, upon CO2 injection. However, when the petrophysical interbed thickness exceeded 2 m (2.1 m, 3.3 m, 4.5 m), CO2 bypassed the thicker petrophysical interbed and continued its upward movement or proceeded towards the production well. With the progressive escalation of CO2 injection, the interbed exhibits a preference for leakage primarily within the injection section, generally occurring from both lateral sides towards the central and lower regions. The magnitude of the interbed area directly correlates with the resistance encountered by the longitudinal and horizontal displacement of CO2, concurrently alleviating premature gas production in production wells, impeding the longitudinal diffusion of CO2, and promoting the homogeneous diffusion of CO2 within oil strata. The simulation results also confirmed the formation of the super critical-CO2 channel by the sand component, while the interbed effectively impeded fluid flow [5]. Additionally, the inclusion of various interbeds was found to extend the duration of stable production and mitigate production decline during this period [23].
Figure 9. Mole fraction distribution in various thicknesses of petrophysical interbeds during 10 years of CO2 flooding.
Energies 18 00593 g009

3.2. Argillaceous Interlayer Sealing Capacity

3.2.1. Argillaceous Barriers

As illustrated in Figure 10, the argillaceous barriers show significant differences compared to the petrophysical barriers. Specifically, the 0.3 m-thick argillaceous barriers are not effective as a seal during a 10-year CO2 flooding period. The gas primarily propagates horizontally along the lower section of the barrier and diffuses upwards by infiltrating smaller pores within the barrier, without escaping from the entirety of the barrier, prior to gas breakthrough in the production well. When the CO2 injection period lasts for 10 years, the dominant CO2 phenomenon under specific temperature and pressure conditions leads to the upward diffusion of gas, thereby compromising the sealing function of the lower section of the barrier. However, when the thickness of the argillaceous barrier is equal to or greater than 1.5 m, gas breakthrough in the production well is prevented even after 10 years of gas injection, indicating the continued effectiveness of the entire barrier as a caprock. In a similar manner, the infiltration of CO2 is observed in smaller pores at the upper and lower sections of argillaceous barriers when their thicknesses are 2.1 m, 2.7 m, and 3.3 m, respectively. This results in thinning of the barrier, although it still acts as a barrier preventing gas breakthrough between layers. It should be noted that not all continuous barriers exhibit a strong sealing capacity, as highlighted by Fan et al. [32], and this characteristic is influenced by barrier type, petrophysical properties, thickness, and other geological features.
Figure 10. Mole fraction distribution in various thicknesses of argillaceous barriers during 10 years of CO2 flooding.
Energies 18 00593 g010

3.2.2. Argillaceous Interbeds

As shown in Figure 11, the migration characteristics of CO2 in mudstone interbeds with varying dimensions (length, and width of 45 m, 90 m, and 135 m) exhibit similarities to petrophysical interbeds. However, due to the low-quality petrophysical properties of argillaceous interbeds, CO2 leakage towards the injection well of the interbed occurs. Nevertheless, when the thickness exceeds 1.5 m (2.1 m, 3.3 m, 4.5 m), this phenomenon effectively restricts the gravity-overriding effect of CO2, thereby impeding the longitudinal diffusion of CO2 and promoting its uniform diffusion within the oil layer. The uniform flow of supercritical CO2 in the oil layer is influenced by the direction and size of CO2 injection, as well as the interlayer direction or size, as indicated by previous studies [5]. Furthermore, the thickness of various interbed types plays a significant role in the movement of CO2 within the interbed.
Figure 11. Mole fraction distribution in various thicknesses of argillaceous interbeds during 10 years of CO2 flooding.
Energies 18 00593 g011

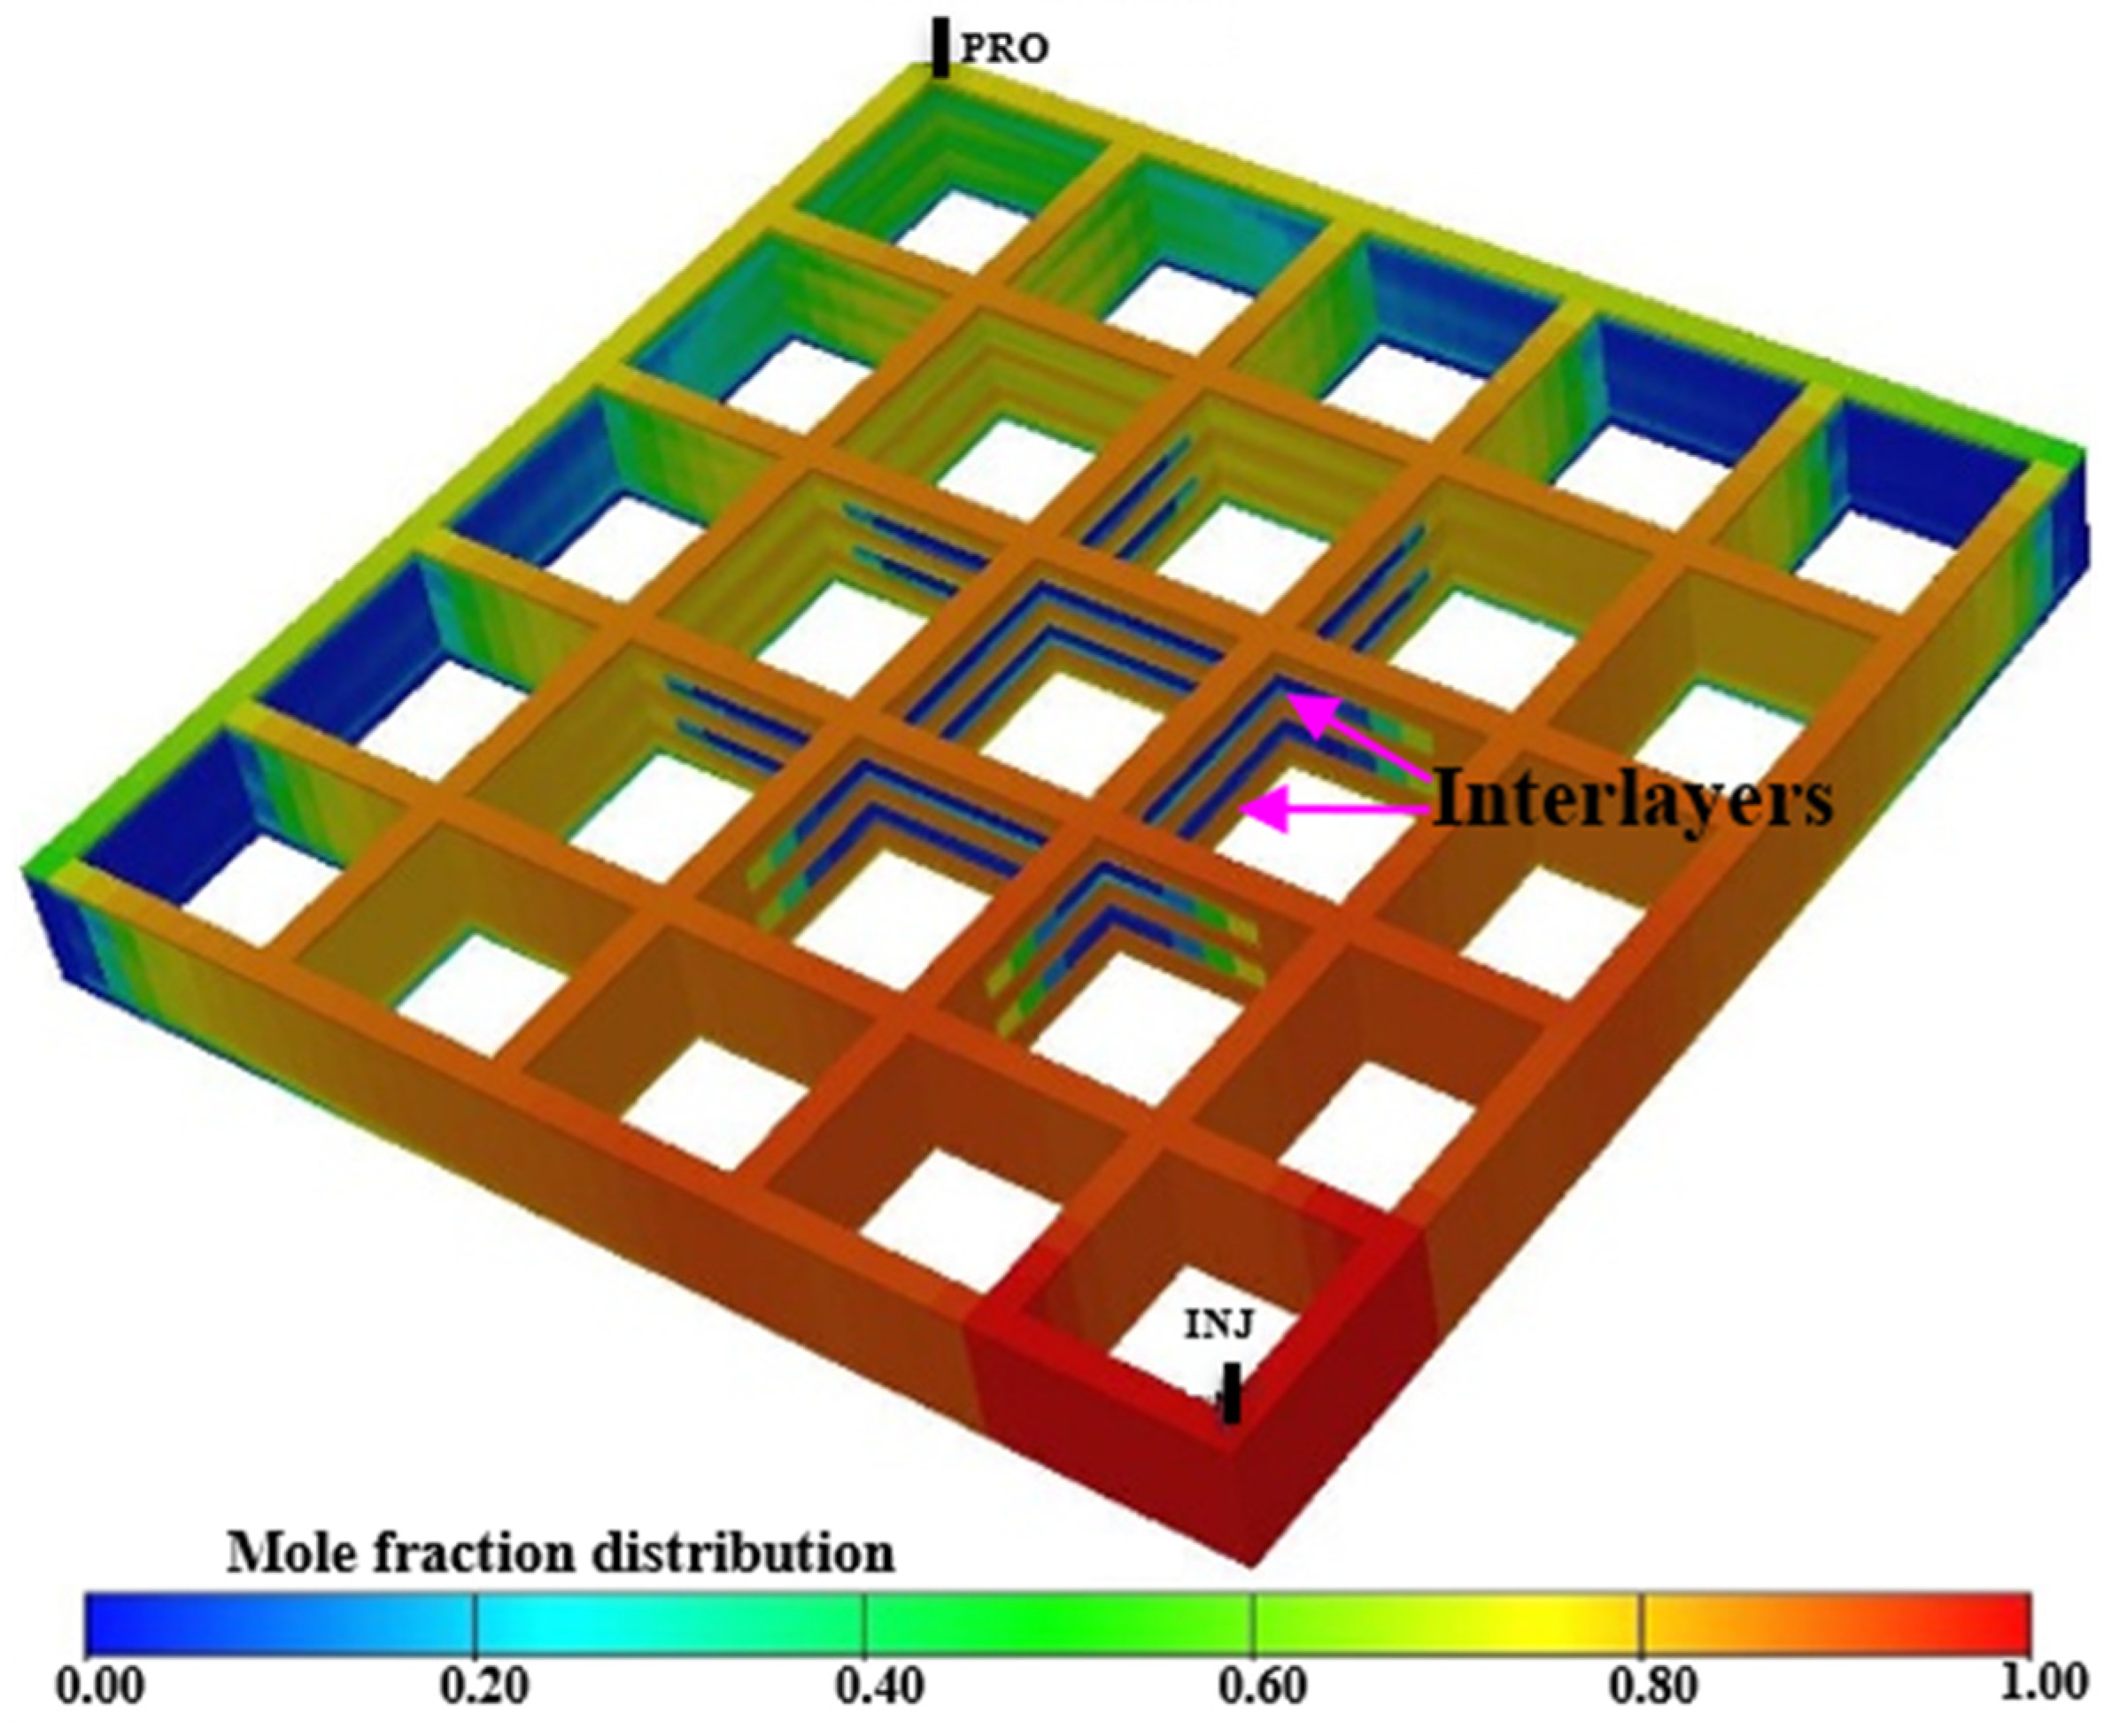
3.3. Impact of Interlayers on CO2 Flooding

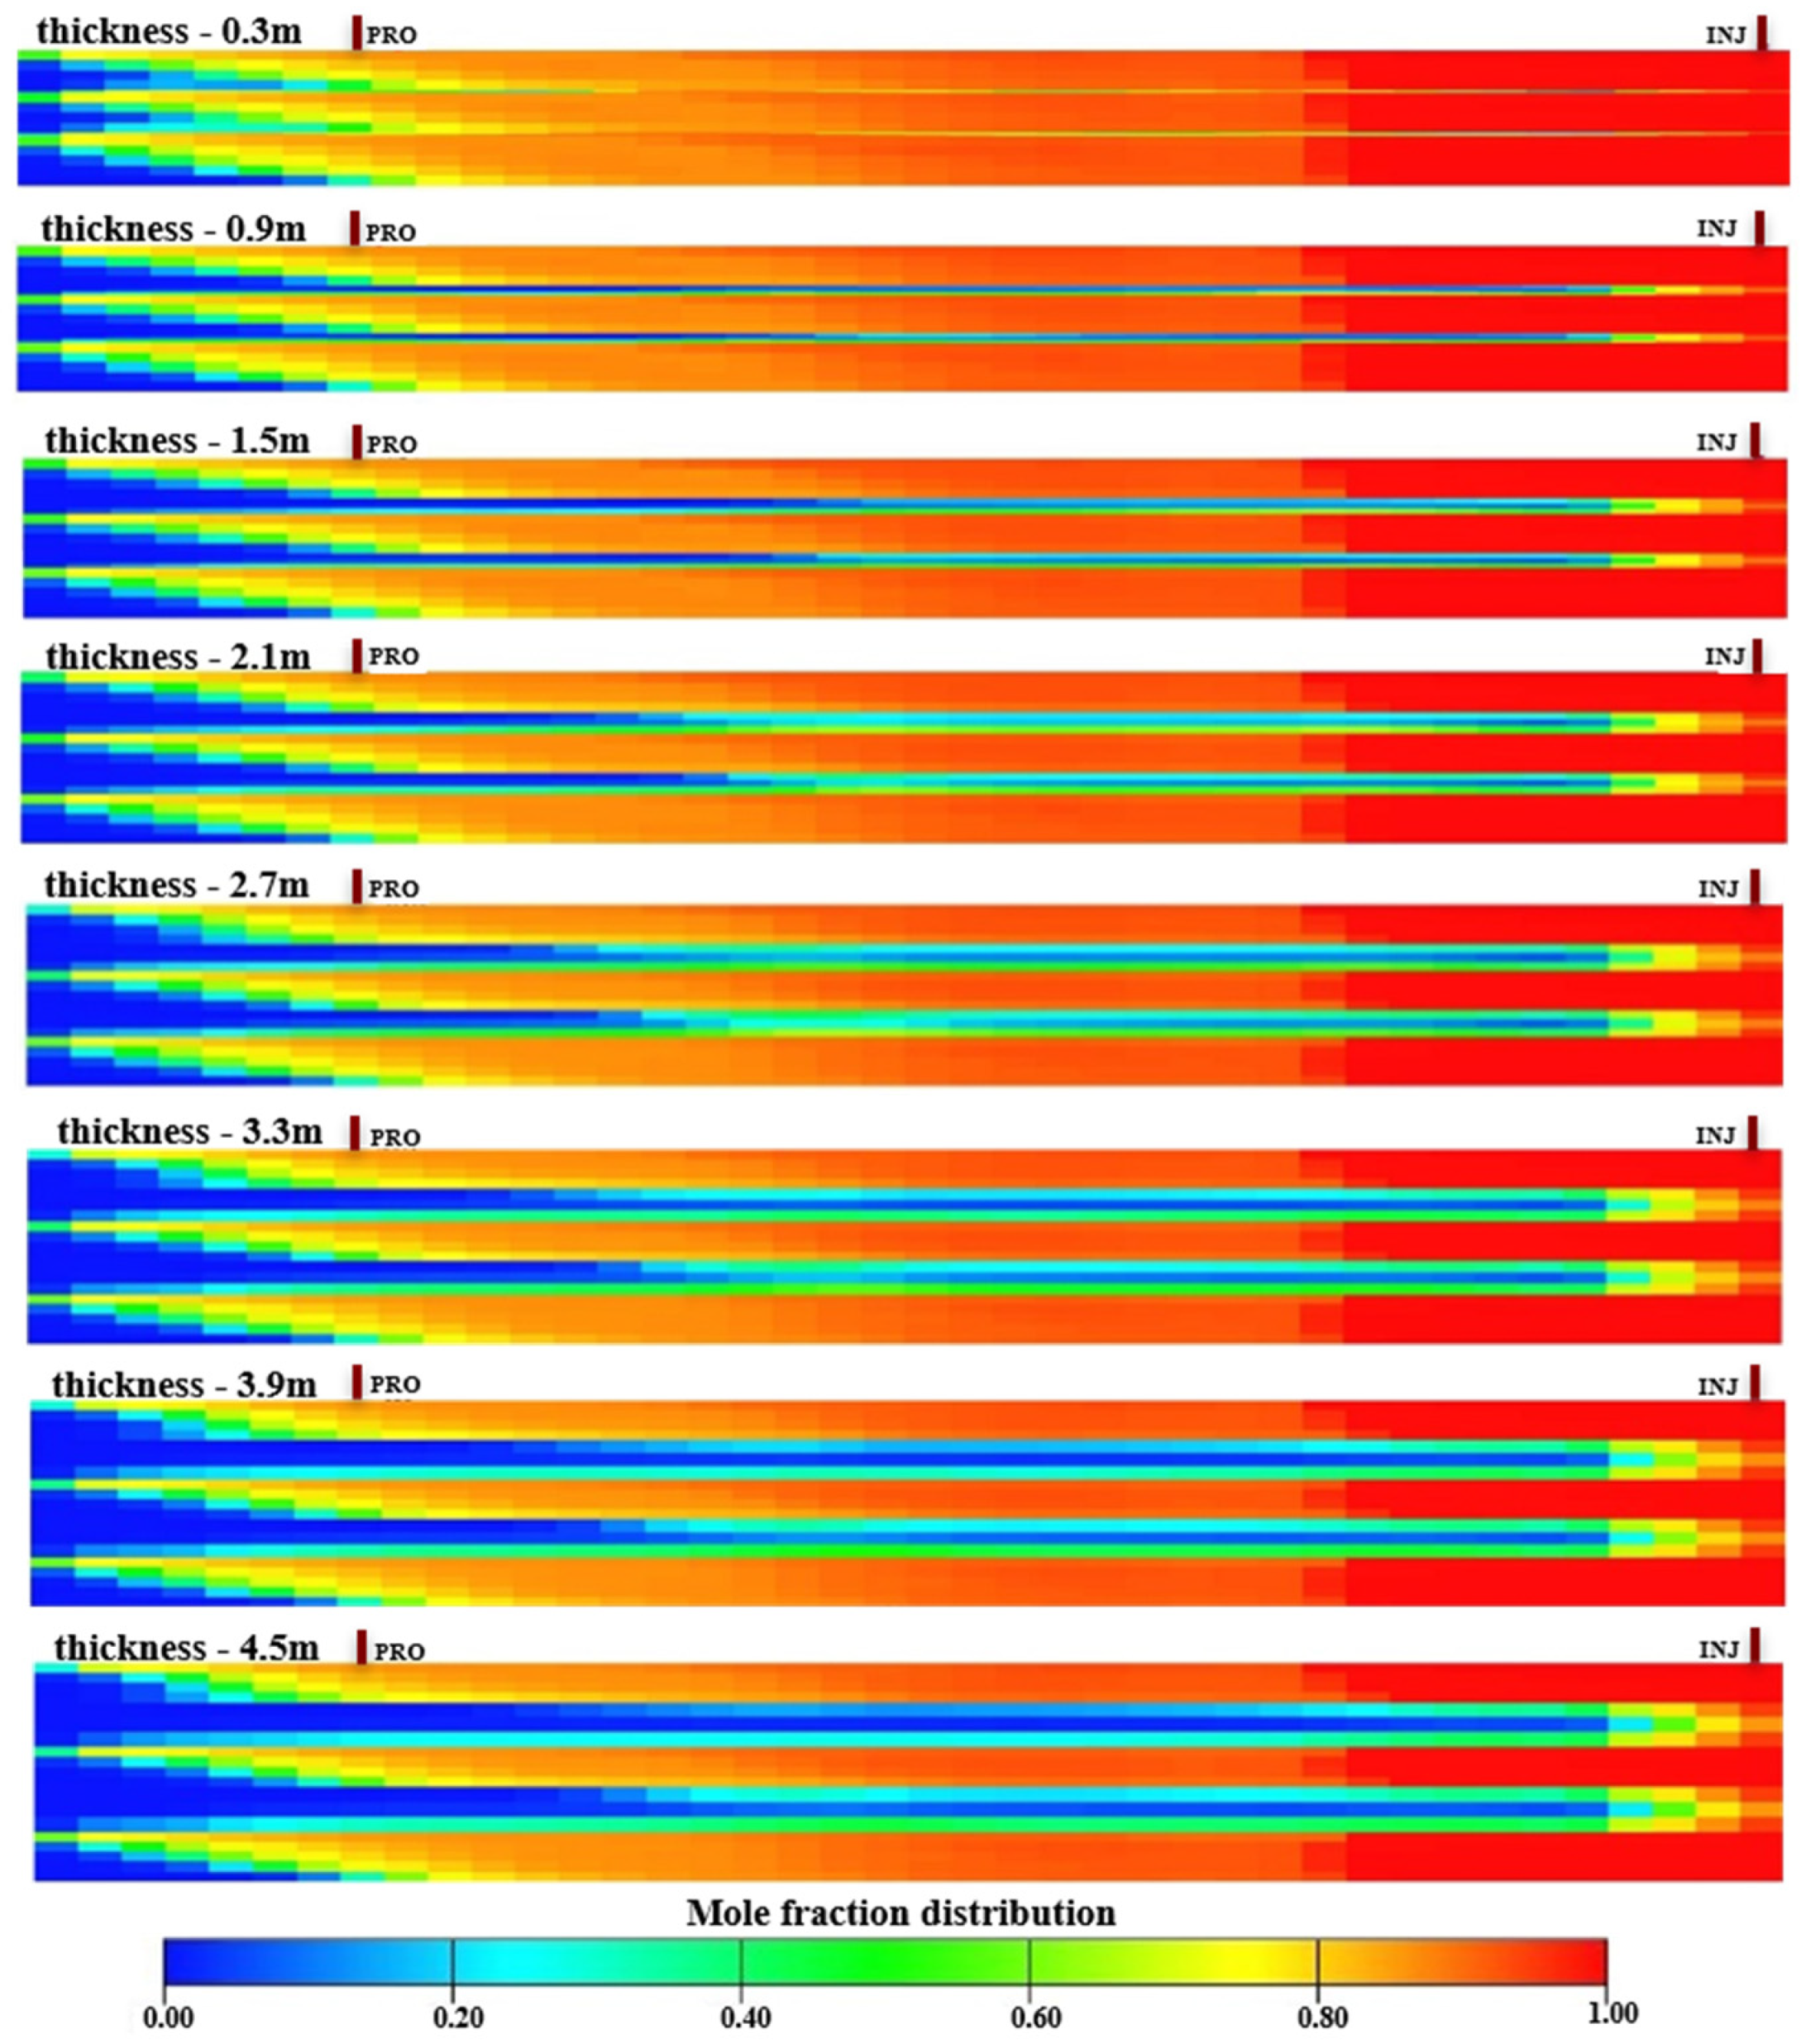
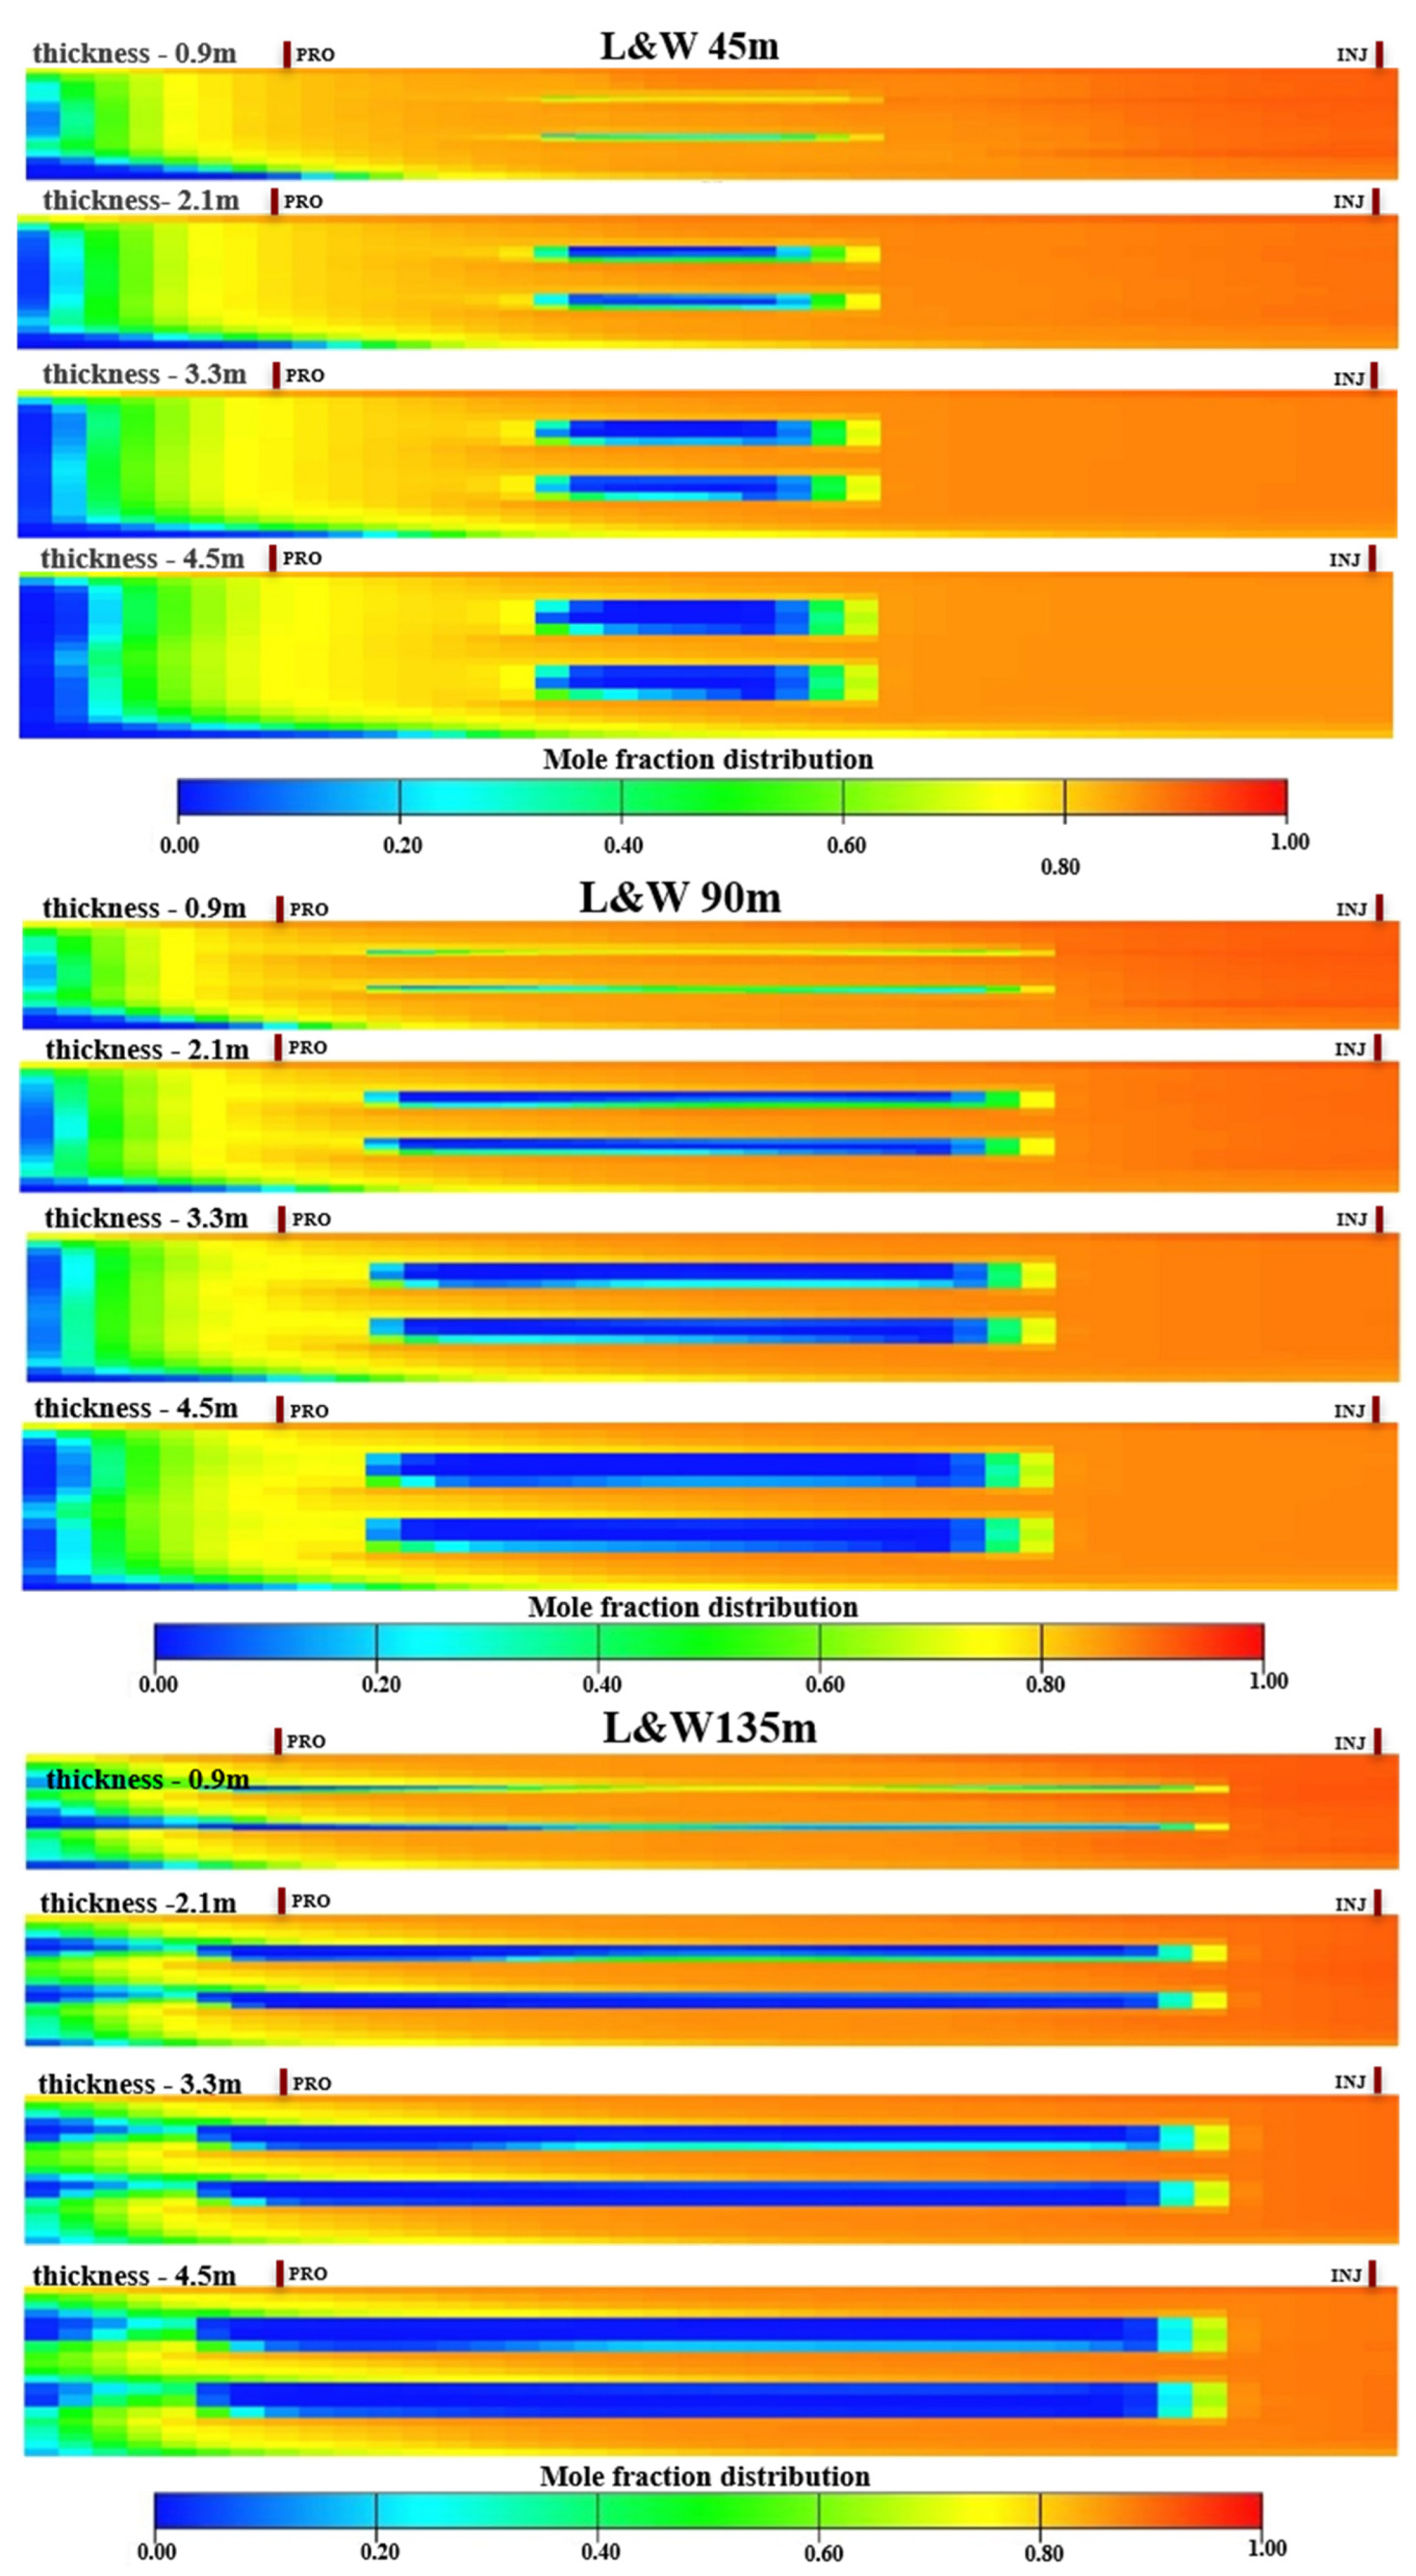
3.3.1. Impact of Barriers on CO2 Flooding

The seepage characteristics of CO2 in LPSR are primarily influenced by the flow path and effective area of CO2 within the pores. This phenomenon is notably impacted by structural heterogeneity, as demonstrated in [33]. Furthermore, the self-sealing effect of the caprock becomes more distinct with increasing thickness of the reservoir and clay mineral content amount. The effective sealing thickness is correspondingly enhanced, as highlighted in [34]. The above results reveal that the various types and thicknesses of barriers within the study area exert distinct influences on the diffusion characteristics of CO2 flooding. This phenomenon is characterized by the horizontal movement of CO2, the restriction of vertical diffusion height, the reduction of effective oil displacement thickness in the oil layer, and the resulting variations in the efficacy of CO2 flooding. For example, when compared to barriers composed of clay under equivalent thickness and area conditions, CO2 breakthrough occurs earlier in such argillaceous barriers, leading to earlier detection of gas at the production well (Figure 12a). The flow characteristics of CO2 in the oil layer, as depicted above, reveal that the gravity-overriding effect exhibits variations in the impact of CO2 flooding for barriers with distinct stable thicknesses despite identical injection conditions (pressure and time). The CO2 flooding outcomes of stable argillaceous barriers with varying thicknesses exhibit two distinct aspects. Firstly, in thinner barriers, CO2 permeates through the upper oil layer prematurely, thus impeding breakthrough or causing CO2 to be observed in the production well (Figure 12b). Further research has substantiated that in oil reservoirs with prevalent bottom-water drive, augmenting the quantity and thickness of barriers within the formation has been shown to significantly mitigate the water cut in the output of production wells [35]. This reduction can be primarily attributed to the interlayer’s role as an effective barrier that hinders the upward seepage of bottom water, thereby curbing the advance of water cones and concomitantly decreasing the water proportion in the produced fluids. Through the adept management of water inflow via the strategic positioning and enhancement of these interlayers, it is possible to increase the rate of oil production, culminating in a more favorable oil recovery factor. Alternatively, with increasing barrier thickness, CO2 exhibits enhanced horizontal flow within oil layers, strategically restricting gravity overriding, which consequently leads to a reduced vertical flooding area under stable barrier conditions and results in lower cumulative oil production compared to homogeneous reservoirs (Figure 12).
The above results reveal that the various types (petrophysical and argillaceous) and thicknesses (argillaceous ≥ 1.5 m, petrophysical ≥ 4 m) of barriers within the study area exert distinct influences on the diffusion characteristics of CO2 flooding only for 10 years. For CCUS operations, the integrity of barriers is crucial for long-term CO2 storage. The capillary sealing mechanism of interbeds relies on the narrow pore throats to generate strong capillary pressure, which prevents the upward migration of CO2 [36]. Any alteration in the pore structure and wettability of these interbeds due to CO2-brine-rock interactions can impact their capillary sealing capability [37,38], potentially affecting the long-term safety of CO2 storage [26,31,32,33,34,35,36,37,38,39,40].
Indeed, the argillaceous barriers’ heterogeneous permeability characteristics induce significant variations in CO2 flooding dynamics. At lower barrier thicknesses, CO2 tends to channel through high-permeability zones, potentially bypassing oil reservoirs and compromising displacement efficiency, thereby precipitating premature breakthroughs and constraining the oil recovery window [41]. Conversely, increased barrier thickness modulates CO2 flow patterns, enhancing horizontal migration while strategically restricting gravity override, which simultaneously improves displacing efficiency and imposes vertical flooding limitations.
The barrier’s structural integrity emerges as a critical determinant in CO2 storage and EOR processes. By functioning as natural geologic seals, these layers mitigate upward CO2 migration risks while simultaneously introducing reservoir heterogeneity that fundamentally influences gas distribution and coverage, ultimately manifesting as reduced cumulative production compared to more uniform reservoir configurations.

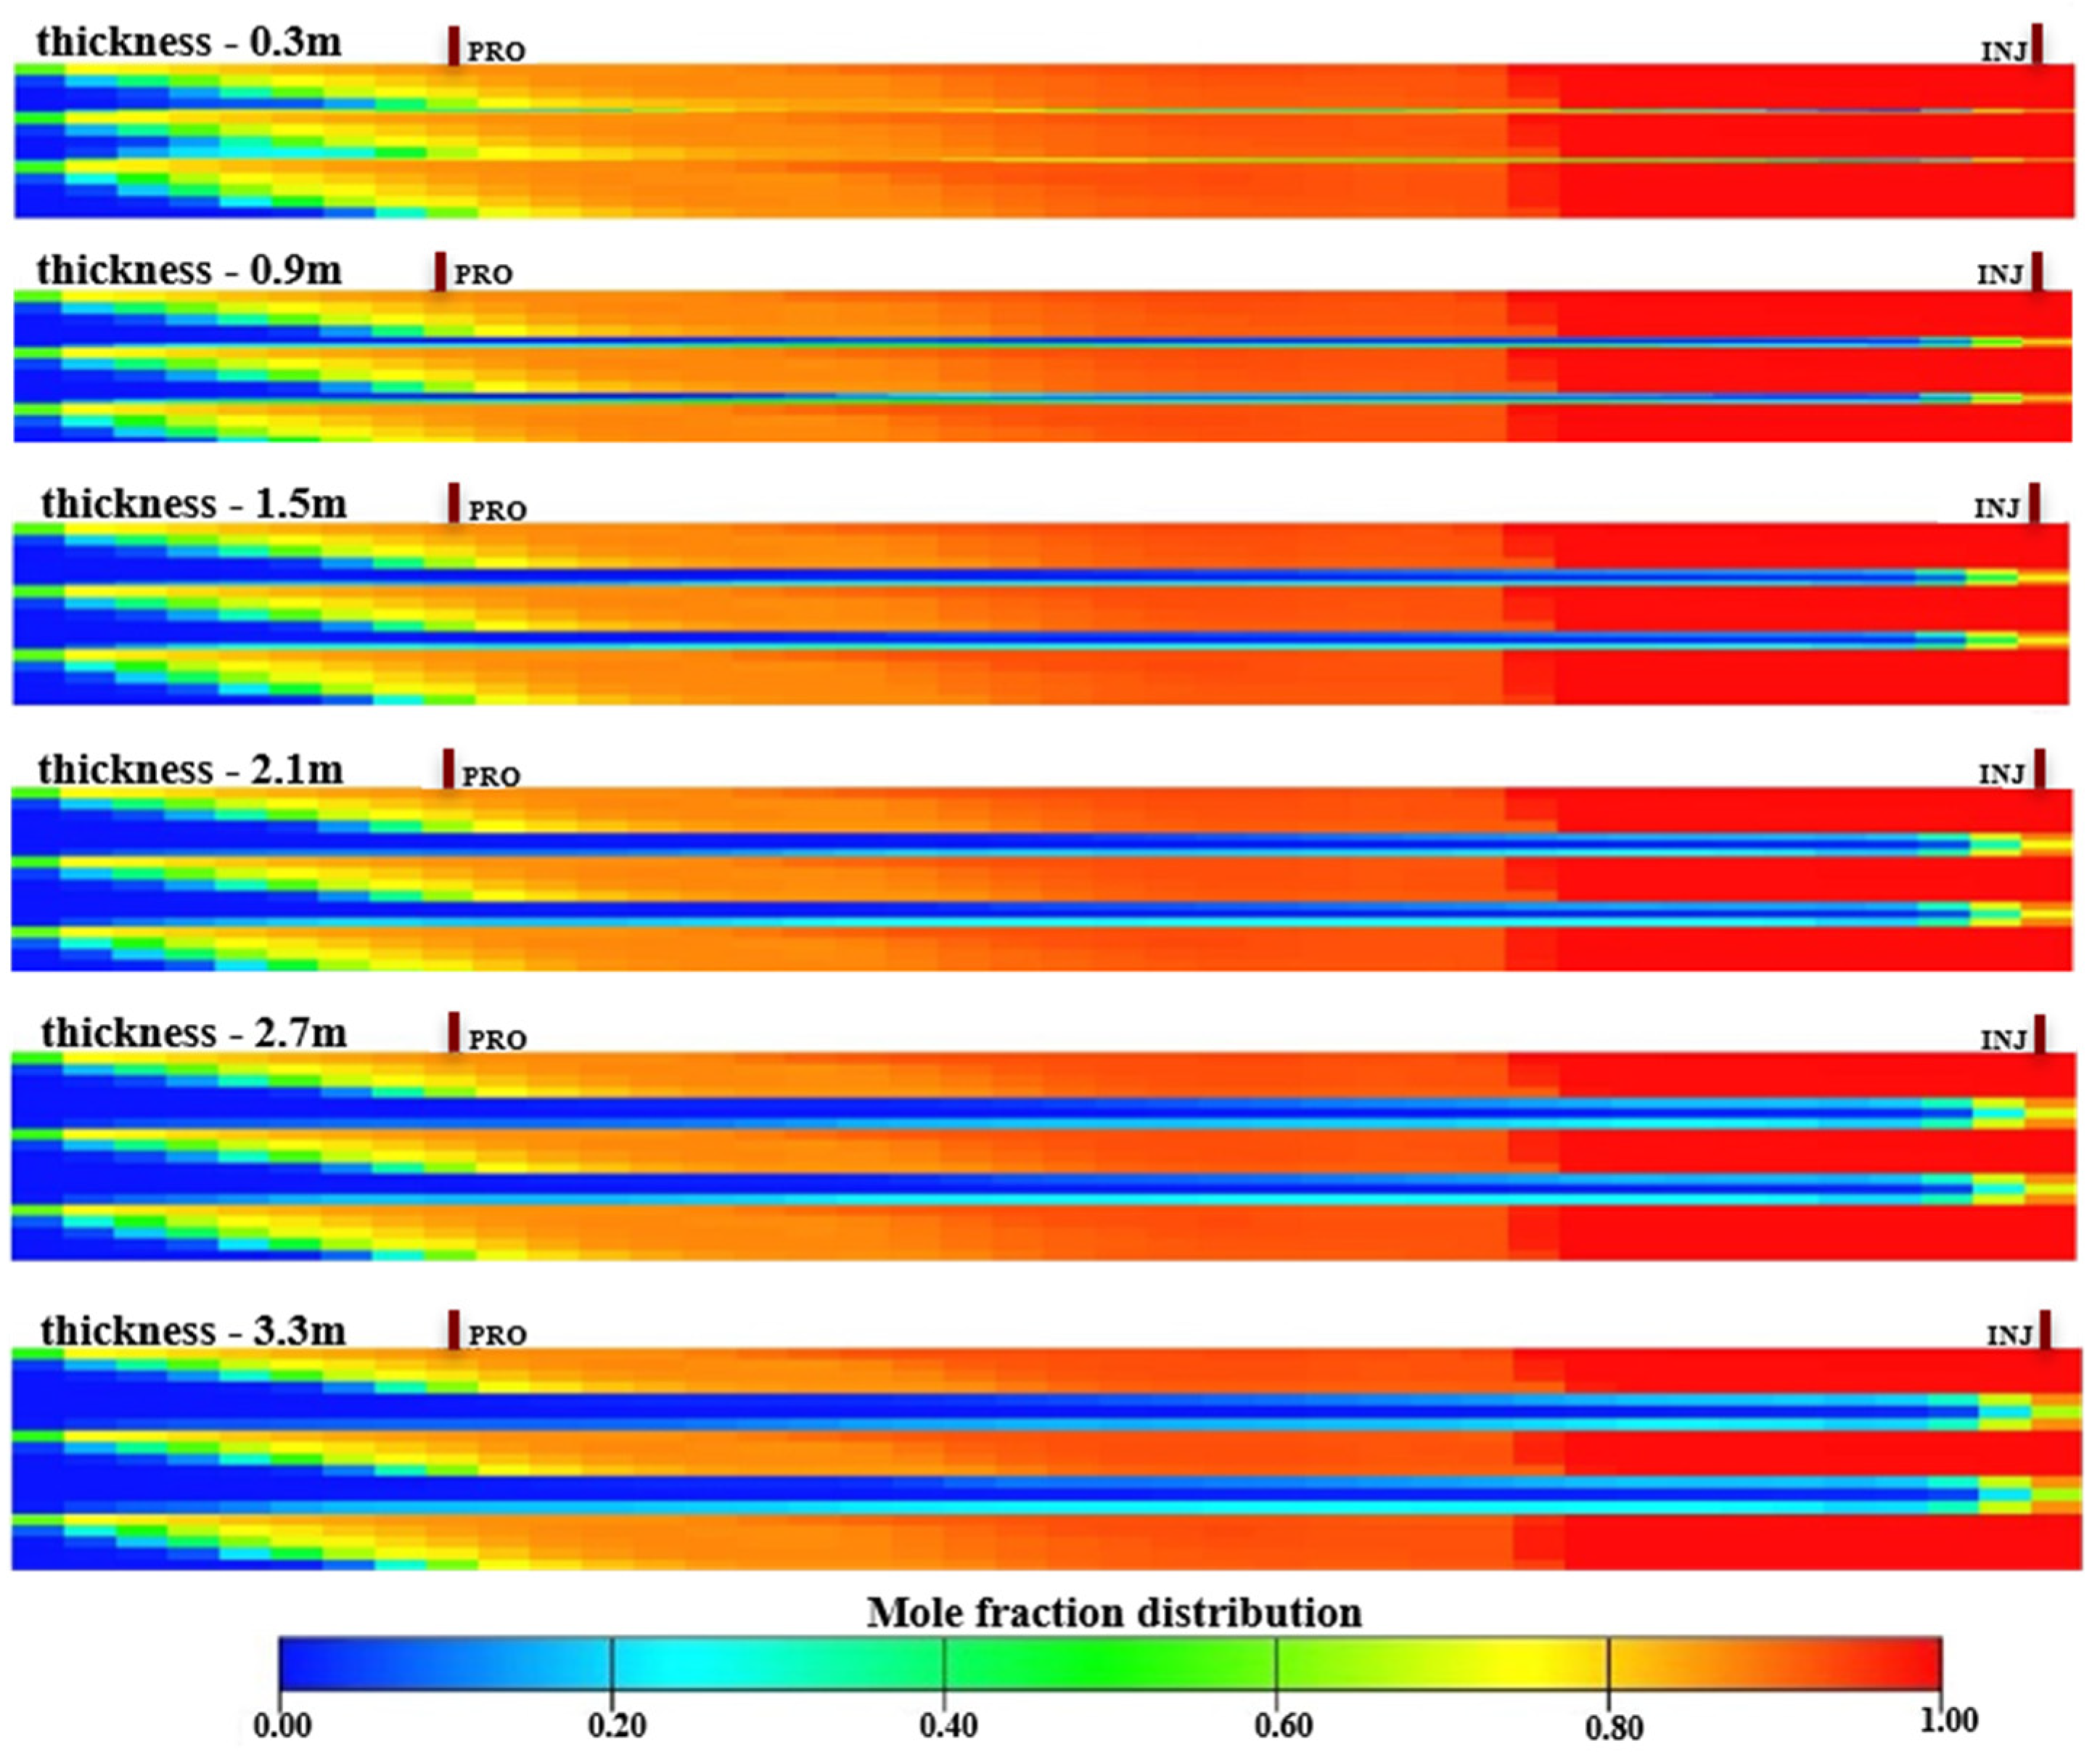
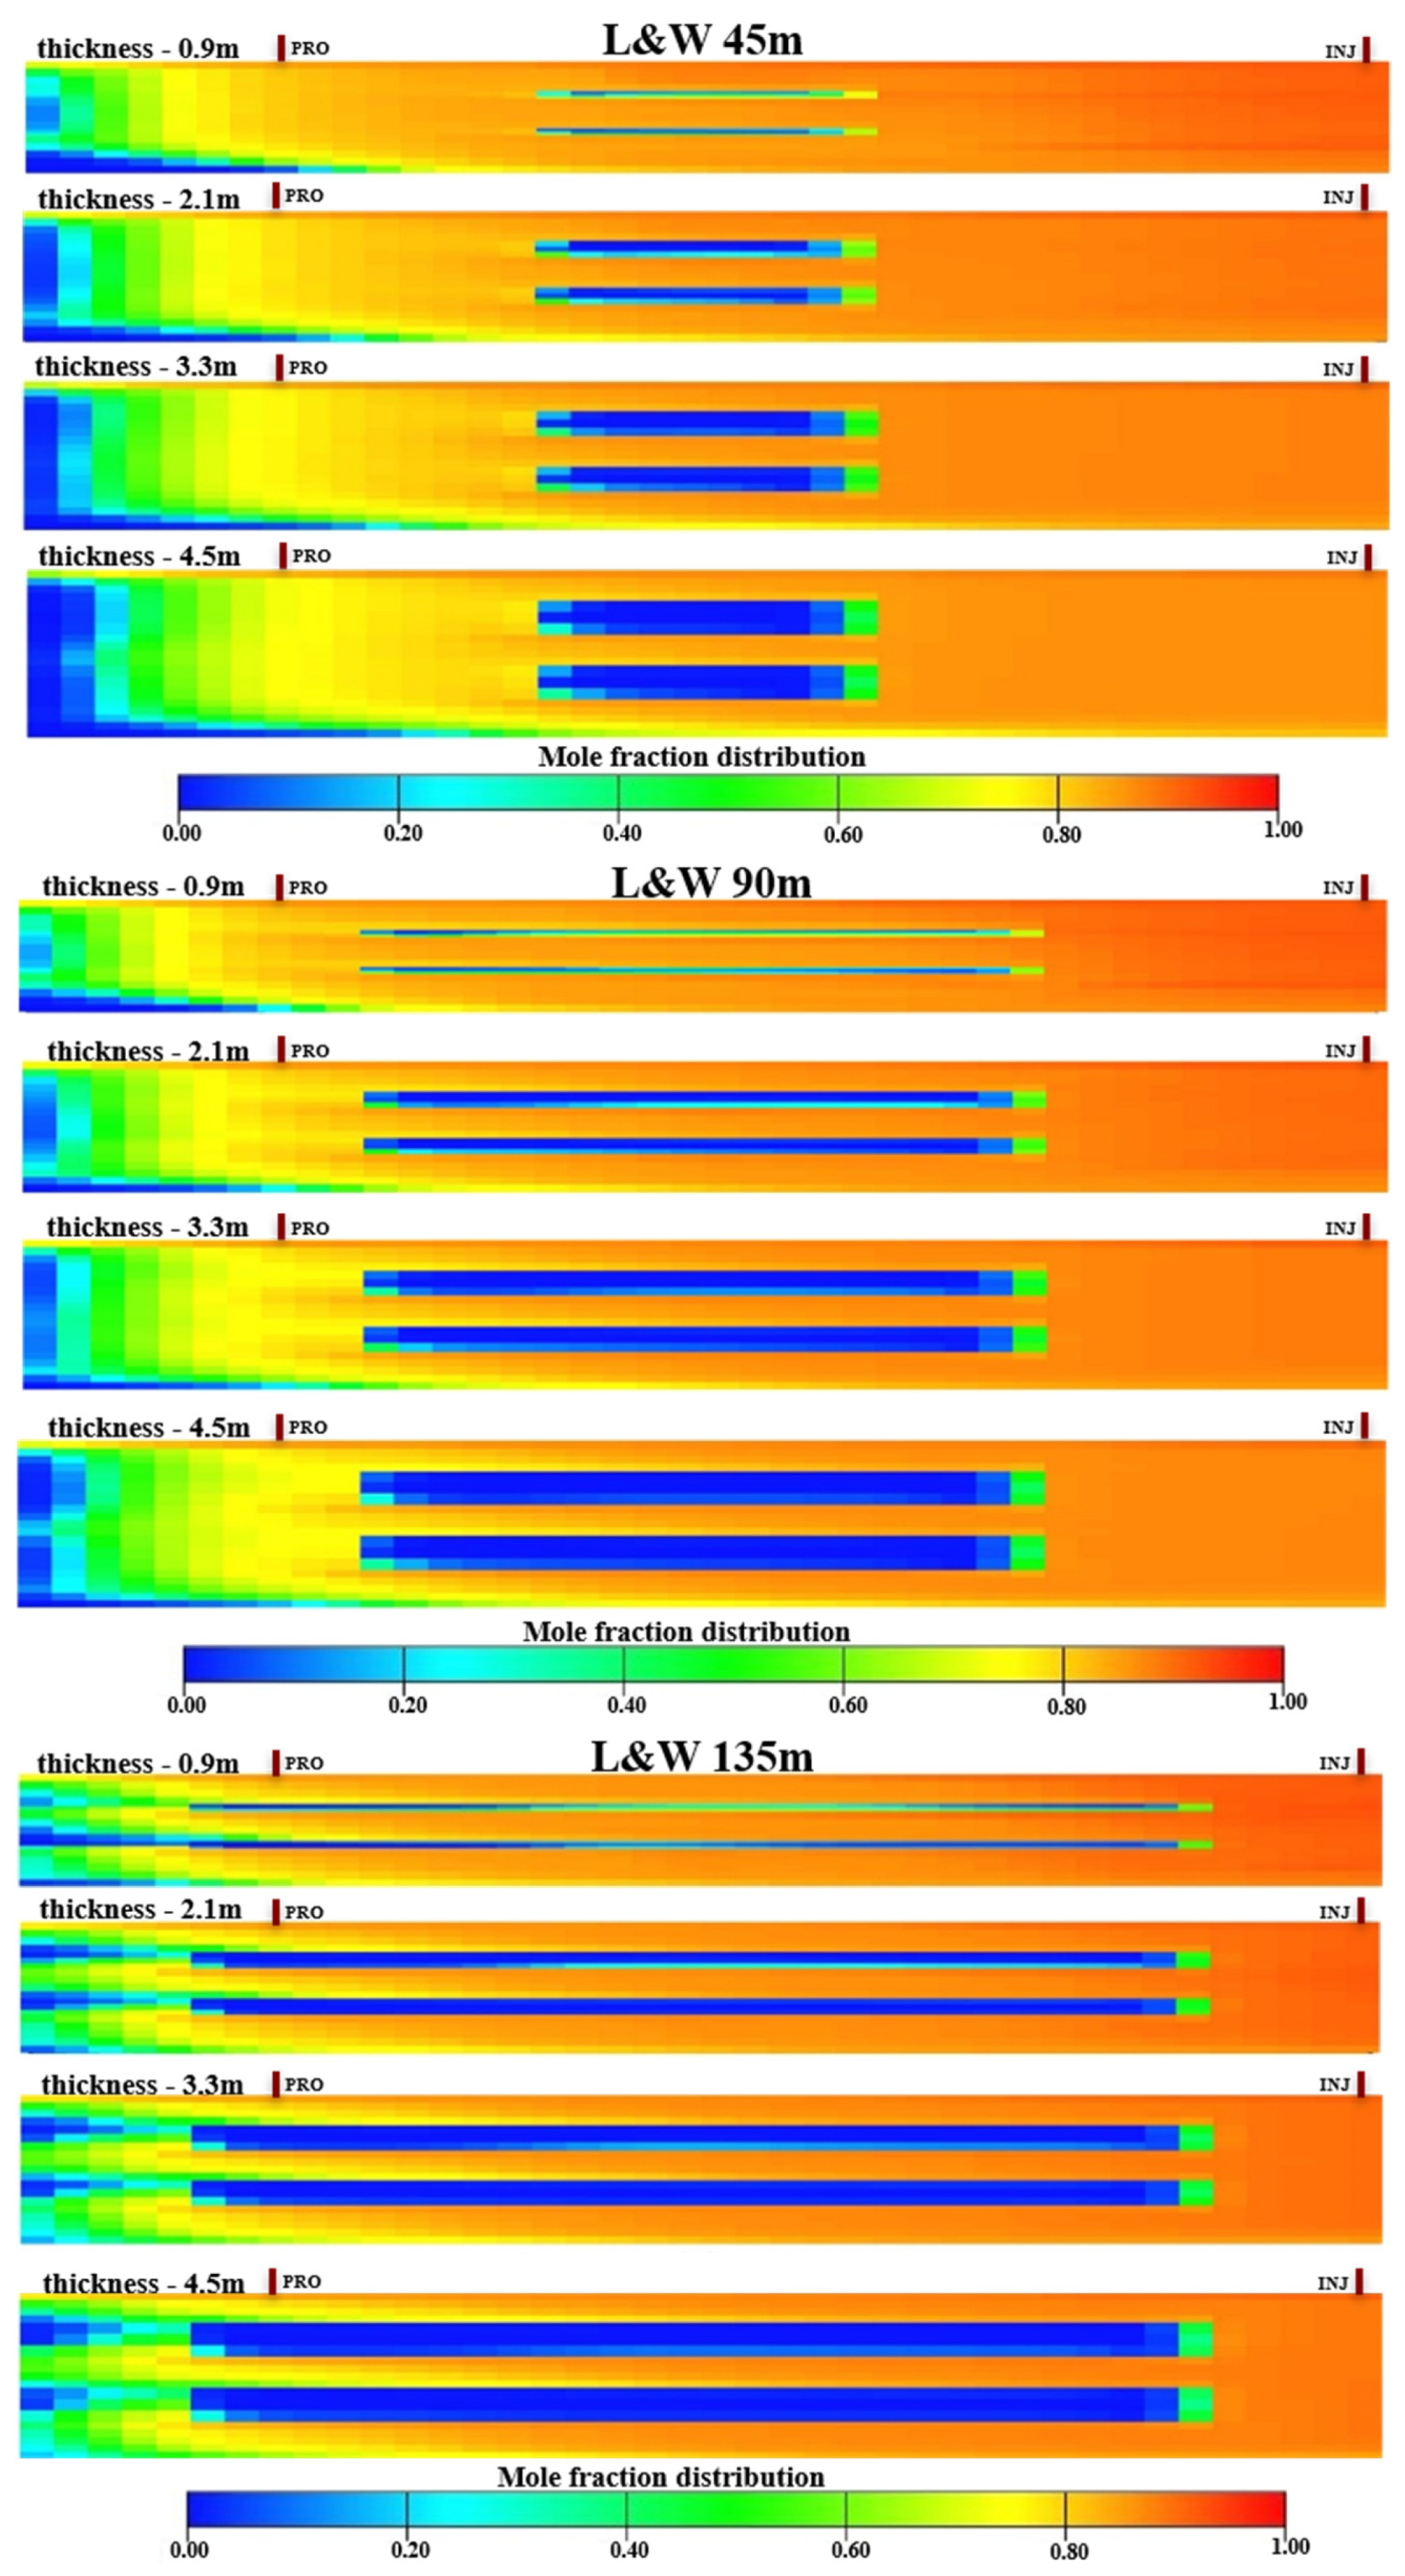
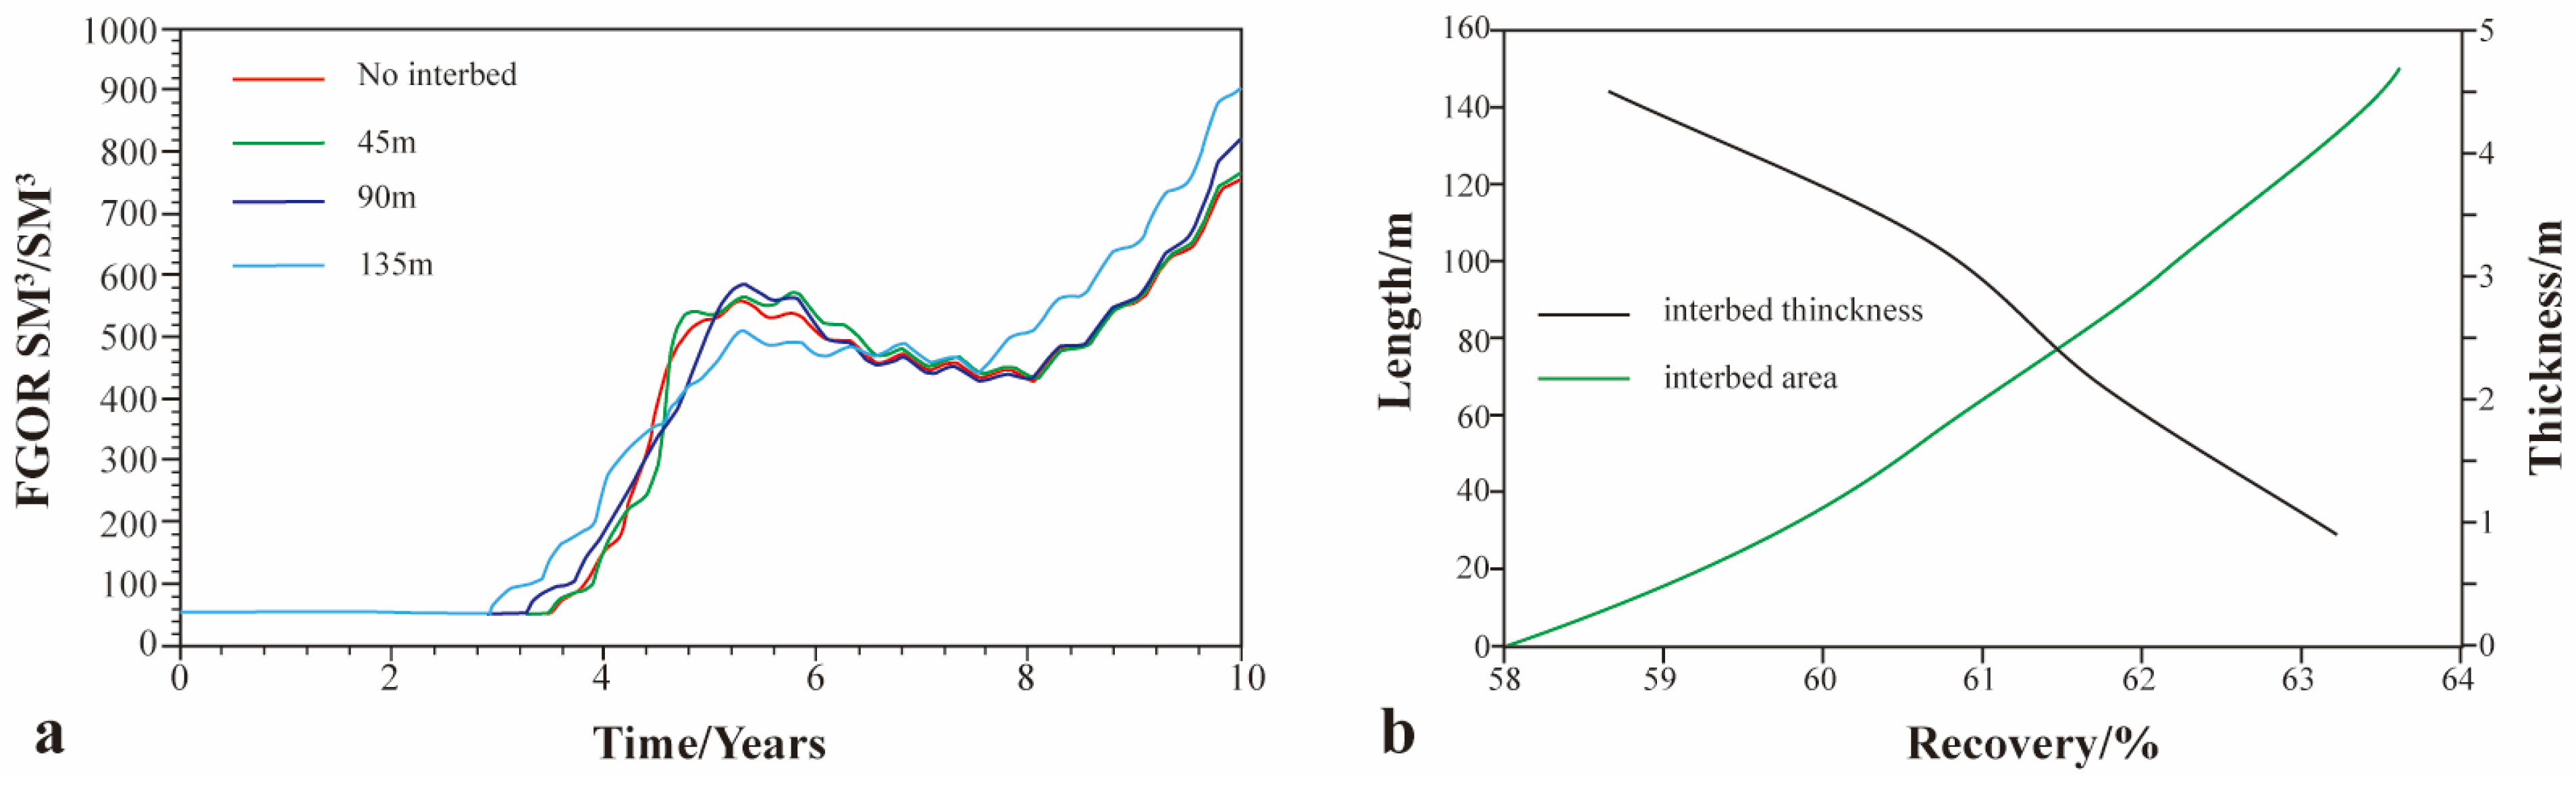
3.3.2. Impact of Interbeds on CO2 Flooding

The diffusion characteristics of CO2 flooding are influenced by various types and thicknesses of interbeds, leading to variations in the effectiveness of CO2 flooding. Specifically, lithological interbeds with a width and length of 90 m exhibit an increase in field gas-oil ratio (FGOR) as interbed thickness decreases (Figure 13a), suggesting that thinner interbeds are more susceptible to gas infiltration. Furthermore, the cumulative production decreases as interbed thickness decreases, indicating that the thinner interbed (0.9 m) fails to provide a consistent sealing function within a 10-year timeframe. The phenomenon known as the gravity overriding effect induces the premature seepage of gas along the upper oil layer, thereby preventing breakthrough or channeling. As a result, the horizontal extent of CO2 flooding is reduced, leading to lower cumulative oil production (COP) compared to thicker interbeds (Figure 13b). Thicker interbeds provide a more stable sealing function, allowing for more consistent and extensive lateral CO2 migration, which enhances the overall efficiency of the flooding process and prevents early gas breakthrough. This is in line with the findings that gravity overriding can significantly reduce the development effect due to CO2 channeling in the reservoir.
The impact of CO2 flooding is found to be inconsistent for interbeds of varying length and width, even when the thickness remains constant. A comparison of characteristics after 10 years of gas flooding reveals that interbeds with a thickness of 0.9 m of different lengths and widths (45 m, 90 m, 135 m, and no interbed) do not exhibit a consistently stable gravity-overriding effect on CO2. The detected CO2 behavior tends to move through the interbed of the reservoir, resulting in preferential gas flow observed at the production well (Figure 14a). Contrary to the assumption, not all CO2 is directed through the interbed. Instead, the interbed serves to restrict the gravitational override of gas and facilitates a horizontal uniform gas flooding system. Generally, when the injection direction aligns with the interbed, it exhibits a dispersing effect, causing CO2 to disperse to both sides of the interbed with minimal crossflow [42]. Consequently, the presence of an interbed with a consistent thickness and substantial effective area is a significant factor that influences the migration of CO2 within the reservoir. Additionally, it plays a crucial role in determining the movement of displacement fluids and the overall effectiveness of flooding. The study also confirmed that not only does the heterogeneity of core-scale permeability have a strong control on the flow paths and distribution of CO2 [31,32,33,34,35,36,37,38,39,40,41,42,43], but the macroscopic heterogeneity (presence of interlayers) similarly affects the ultimate recovery rate.
The integrity of interbeds within low-permeability reservoirs is crucial for the success of CO2-EOR and CCUS initiatives. Studies have shown that the orientation and continuity of interlayers play a crucial role in CO2 migration and oil displacement efficiency, as they significantly influence CO2 distribution, sweep efficiency, and successful storage security operation [44]. These interbeds, with distinct petrophysical properties, generate strong capillary pressure that prevents the upward migration of CO2, ensuring the long-term safety of CO2 storage [26]. However, the positioning, contact angles with reservoir sections, and the presence of multiple interlayer sets can affect CO2 flow patterns and storage efficiency, necessitating further research to optimize CO2 injection strategies.
Our understanding of the influence of interbedded reservoir type and nature on CO2 flooding is still under continuous comprehensive integrated studies, future studies should focus on the effects of varied interlayer positioning and multiple interlayers set to develop more efficient and environmentally friendly CO2 utilization processes. Improving our comprehension of CO2 behavior in complex geological settings will support the optimization of CO2-EOR processes and inform broader CCUS strategies, contributing to the development of technological applications for carbon dioxide utilization, which is essential for achieving large-scale CO2 reduction and meeting the goals set by the Paris Agreement [45].

4. Conclusions

In this study, we comprehensively characterized interlayer features in LPSR from a geological perspective, employing data integration techniques based on core analysis, petrography, and electron microscopy. Through numerical simulations, we strategically positioned two sets of interlayers between injection and production wells. The research meticulously analyzed the significant impact of interlayer thickness and area on CO2-EOR and CCUS processes, providing a crucial theoretical foundation for CCUS implementation. Moreover, it illuminates future research directions, such as exploring interlayer configurations at various positions, angles, and random arrangements to further optimize development strategies and enhance CCUS effectiveness.
Our findings reveal two distinct interlayer types in LPSR: petrophysical interlayers (porosity < 11%, permeability 0.006–0.03 mD) and argillaceous interlayers (porosity 1–8%, permeability 0.001–0.005 mD). Interbeds average over 1 m in thickness, with a minimum thickness below 0.5 m. Petrophysical interbeds shorter than 90 m constitute 65% of the total, while primary argillaceous interbeds range from less than 45 m to 135–250 m in length. The maximum petrophysical barrier thickness is 17.11 m, with 80% of barriers ≥4 m, and an average argillaceous barrier thickness of 5.93 m. These characteristics significantly influence reservoir fluid dynamics and CO2-EOR process efficiency.
Numerical simulations show that interlayer properties (type, thickness, lateral continuity) are critical in determining CO2 sealing capacity and oil displacement efficiency. Optimal sealing occurs with petrophysical barriers ≥ 4 m and argillaceous barriers ≥ 1.5 m thick, promoting lateral CO2 diffusion. Partial CO2 leakage into the upper interbed occurs when petrophysical interbed thickness exceeds 2 m, despite argillaceous interbed thickness being ≥ 1.5 m. Thin barriers (0.3–0.9 m) demonstrate inadequate sealing capacity, with CO2 predominantly leaking from sides towards the middle and bottom through sandy channels, subsequently spreading upwards along high-permeability zones and causing gas override.
In LPSR, increased barrier thickness restricts CO2 breakthrough, but the presence of barriers diminishes the longitudinal CO2 flooding area, resulting in lower production ratios compared to homogeneous reservoirs. Nevertheless, augmenting interbed thickness and area can mitigate CO2 invasion time while constraining gravity override and dispersion effects, enabling horizontal oil displacement and consequently enhancing production.

Author Contributions

T.A.: Conceptualization, Methodology, Writing—review and editing, Investigation, Project administration, Funding acquisition; L.Y.: Validation, Supervision; K.A.: Review and editing, Visualization; B.B.: Formal analysis, Data curation, Software; D.Y.: Data curation, Validation, Resources; Y.H.: Software, Investigation, Supervision; A.S.: Data curation, Investigation. All authors have read and agreed to the published version of the manuscript.

Funding

This research was funded by the High-end Foreign Experts Recruitment Plan of China, grant number QN2022060001L.

Data Availability Statement

The data presented in this study are available on request from the corresponding author.

Acknowledgments

We extend our sincere gratitude to the Research Institute of Petroleum Exploration and Development (RIPED) and the Artificial Intelligence Technology R&D center for Exploration and Development at CNPC for their outstanding support and provision of superior facilities for this project. We also express our heartfelt thanks to the reviewers for their valuable comments and suggestions, which have greatly enhanced the quality and academic rigor of this research.

Conflicts of Interest

Authors Taskyn Abitkazy, Lin Yan, Khaled Albriki, Bahedaer Baletabieke and Dawei Yuan were employed by CNPC. Yingfu He was employed by SINOPEC. The remaining authors declare that the research was conducted in the absence of any commercial or financial relationships that could be construed as a potential conflict of interest.

References

  1. Liu, Y.; Yi, Y.-S.; Qi, L. A Study on Interlayers in Thick Oil Reservoir in Anpeng Mainbody Area of Zhao-Oilfield. China’s Manganese Ind. 2016, 5, 19–22. [Google Scholar]
  2. Pruess, K. Leakage of CO2 from geologic storage: Role of secondary accumulation at shallow depth. Int. J. Greenh. Gas Control 2008, 2, 37–46. [Google Scholar] [CrossRef]
  3. Rinaldi, A.-P.; Rutqvist, J.; Cappa, F. Geomechanical effects on CO2 leakage through fault zones during large-scale underground injection. Int. J. Greenh. Gas Control 2014, 20, 117–131. [Google Scholar] [CrossRef]
  4. Xu, L.; Myers, M.; Li, Q.; White, C.; Zhang, X.-Y. Migration and storage characteristics of supercritical CO2 in anisotropic sandstones with clay interlayers based on X-CT experiments. J. Hydrol. 2020, 580, 124239. [Google Scholar] [CrossRef]
  5. Xu, L.; Li, Q.; Myers, M.; White, C.; Tan, Y.-S. Experimental and numerical investigation of supercritical CO2 migration in sandstone with multiple clay interlayers. Int. J. Greenh. Gas Control 2021, 104, 103194. [Google Scholar] [CrossRef]
  6. Fu, L.; Ren, Z.; Si, W.; Ma, Q.; Huang, W.; Liao, K.; Huang, Z.; Wang, Y.; Xu, P. Research progress on CO2 capture and utilization technology. J. CO2 Util. 2022, 66, 102260. [Google Scholar] [CrossRef]
  7. Alcalde, J.; Flude, S.; Wilkinson, M.; Johnson, G.K.; Edlmann, K.; Bond, C.E.; Scott, V.; Gilfillan, S.M.V.; Ogaya, X.; Haszeldine, R.S. Estimating geological CO2 storage security to deliver on climate mitigation. Nat. Commun. 2018, 9, 2201. [Google Scholar] [CrossRef]
  8. Zhang, X.; Wei, B.; Shang, J.; Gao, K.; Pu, W.; Xu, X.; Wu, C.; Sun, L. Alterations of geochemical properties of a tight sandstone reservoir caused by supercritical CO2-brine-rock interactions in CO2-EOR and geosequestration. J. CO2 Util. 2018, 28, 408–418. [Google Scholar] [CrossRef]
  9. Ji, M.; Kwon, S.; Choi, S.; Kim, M.; Choi, B.; Min, B. Numerical investigation of CO2-carbonated water-alternating-gas on enhanced oil recovery and geological carbon storage. J. CO2 Util. 2023, 74, 102544. [Google Scholar] [CrossRef]
  10. Zhang, J.; Zhang, L.H.; Hu, S.Y.; Nan, L. The Genesis and Characteristics and Identification of Intercalations in Non-marine Reservoir with Clastic Rock. Well Logging Technol. 2003, 27, 221–224. [Google Scholar] [CrossRef]
  11. Zhang, W.; Xie, Z.J. Research on reservoir bed heterogeneity, interlayers and seal layers and controlling factors of 2+3 sands of upper second member, Shahejie Formation, in the west of the Pucheng Oilfield. Pet. Sci. 2008, 5, 135–144. [Google Scholar] [CrossRef]
  12. Sun, T.J.; Mu, L.X.; Zhao, G.L. Classification and characterization of barrier-intercalation in sandy braided river reservoirs: Taking Hegli Oilfield of Muglad Basin in Sudan as an example. Pet. Explor. Dev. 2014, 41, 125–134. [Google Scholar] [CrossRef]
  13. Han, R.B.; Liu, Q.; Jiang, T.W.; Xu, B.M.; Xu, C.H.; Zhao, L.; Lei, C.; Zhang, P.-C. Feature origin and distribution of calcareous interlayers: A case of Carboniferous Donghe sandstone in Hade Oil Field Tarim Basin NW China. Pet. Explor. Dev. 2014, 41, 475–484. [Google Scholar] [CrossRef]
  14. Wang, Y.; Liu, J.; Wang, J.G.; Shi, K.-B.; Liu, B. Major controlling factors for the formation of inter-layer of Donghe sandstone of Donghe1 reservoir in Tarim Basin and its fluid source. Acta Pet. Sin. 2015, 36, 174. [Google Scholar] [CrossRef]
  15. Wang, Z.-Y.; Pan, M.; Shi, Y.-M.; Dong, Y. Interlayer identification and spatial distribution in onshore sandstone Donghe 1 reservoir Tarim Basin. Acta Pet. Sin. 2015, 36, 966. [Google Scholar] [CrossRef]
  16. Wang, X.Y.; Jiang, Z.X.; Yue, D.L.; Wang, X.; Wang, X.B. Patterns of barrier-interlayers in mouth bar of fluvial dominated delta reservoirs. J. Southwest Pet. Univ. 2017, 39, 9–17. [Google Scholar]
  17. Guo, J.; Wang, W.; Tan, J.; Peng, Q.; Zhang, D. Fine characterization method for interlayers in complex meander river sandstone reservoir: A case study of Um7 sand of C oilfield in bohai bay area. Int. J. Geosci. 2019, 10, 14. [Google Scholar] [CrossRef]
  18. Yu, H.M.; Song, Y.C.; Peng, Y.T.; Liu, B.; Li, T.; Shi, K.B. Characteristics, Genesis and Distribution of Interlayers in E31 Reservoir of Gasikule Oilfield, Qaidam Basin. Spec. Oil Gas Reserv. 2021, 28, 79–87. [Google Scholar] [CrossRef]
  19. Cheng, C.; Yu, W.; Bai, X. The research on method of interlayer modeling based on seismic inversion and petrophysical facies. Petroleum 2016, 2, 20–25. [Google Scholar] [CrossRef]
  20. Li, Y.; Yang, Y. Pore Scale Dynamic 3D Imaging of Water-Alternating-Gas Flooding and CO2-foam Flooding in a Double Layer Core, Computational and Experimental Simulations in Engineering. Proc. ICCES 2023, 143, 775–782. [Google Scholar] [CrossRef]
  21. Li, T.; Long, A.L.; Liu, B.; Ding, X.; Yu, H.; Lu, S.; Song, Y.; Shi, K.B. Breakthrough pressure and development strategy for gas injection in interlayers in low-permeability sandstone reservoirs: A case study of the Gasikule E31 reservoir Qaidam Basin. Acta Pet. Sin. 2021, 42, 1364. [Google Scholar] [CrossRef]
  22. Chai, X.; Tian, L.; Dong, P.; Wang, C.; Peng, L.; Wang, H. Study on recovery factor and interlayer interference mechanism of multilayer co-production in tight gas reservoir with high heterogeneity and multi-pressure systems. J. Pet. Sci. Eng. 2022, 210, 109699. [Google Scholar] [CrossRef]
  23. Wei, S.; Duan, Y.; Wei, M.; Ren, K.; Lu, C.; Zhan, J.; Tang, Y. Experimental study on the effect of different distributed interlayer on SAGD performance. J. Pet. Sci. Eng. 2022, 209, 109827. [Google Scholar] [CrossRef]
  24. Yang, Y.; Li, X.; Yang, X.; Li, X. Influence of reservoirs/interlayers thickness on hydraulic fracture propagation laws in low-permeability layered rocks. J. Pet. Sci. Eng. 2022, 219, 111081. [Google Scholar] [CrossRef]
  25. Zhang, L.; Li, C.; Zhang, Y.; Wang, X.; Yao, X.; Sun, Y.; Li, F.; Yang, H. CO2-EOR and storage in a low-permeability oil reservoir: Optimization of CO2 balanced displacement from lab experiment to numerical simulation. Geoenergy Sci. Eng. 2024, 243, 213325. [Google Scholar] [CrossRef]
  26. Zhang, Y.Q.; Yang, S.l.; Bi, L.F.; Gao, X.Y.; Shen, B.; Hu, J.T.; Luo, Y.; Zhao, Y.; Chen, H.; Li, J. A technical review of CO2 flooding sweep-characteristics research advance and sweep-extend technology. Pet. Sci. 2024; in press. [Google Scholar] [CrossRef]
  27. Du, S.; Bai, L. Future potential research hotspots on the precise integration of geology and engineering in low-permeability oil reservoirs. Adv. Geo-Energy Res. 2024, 14, 4–7. [Google Scholar] [CrossRef]
  28. Zhao, X.; Chen, Z.; Zhang, L.; Liao, X.; Awotunde, A.A. Leakage risk assessment on sealing efficiency of caprock during CO2 huff-n-puff for safe sequestration. Geoenergy Sci. Eng. 2024, 240, 213056. [Google Scholar] [CrossRef]
  29. Abitkazy, T.; Du, S.; Xu, F.; Shi, Y. Pore structure characterization of clay minerals in the Lower Karamay formation conglomerate reservoir in the Junggar basin and its impact on hydrocarbon storage and seepage. Acta Geol. Sin.-Engl. Ed. 2021, 95, 558–569. [Google Scholar] [CrossRef]
  30. Du, S.; Xu, F.; Abitkazy, T.; Zhou, B.; Kou, G.; Shi, Y. Anisotropy characteristics of element composition in Upper Triassic “Chang 8” shale in Jiyuan district of Ordos Basin, China: Microscopic evidence for the existence of predominant fracture zone. Fuel 2019, 253, 685–690. [Google Scholar] [CrossRef]
  31. Li, Q.; Ning, Z.; Wu, S.; Wang, B.; Li, Q.; Li, H. A Multiphase and Multicomponent Model and Numerical Simulation Technology for CO2 Flooding and Storage. Energies 2024, 17, 3222. [Google Scholar] [CrossRef]
  32. Fan, K.; Zhu, W.Q.; Zhou, D.Y.; Gao, S.S.; Zhao, G.Q.; Hu, Z.M. Effect of interlayers in thick sandstone reservoir for gas injection: A case study of Donghe 1 Carboniferous oil reservoir in Tarim Basin. Acta Pet. Sin. 2015, 36, 475–481. [Google Scholar] [CrossRef]
  33. Wei, N.; Gill, M.; Crandall, D.; Mcintyre, D.; Wang, Y.; Bruner, K.; Li, X.C.; Bromhal, G. CO2 flooding properties of Liujiagou sandstone: Influence of sub-core scale structure heterogeneity. Greenh. Gases Sci. Technol. 2014, 4, 400–418. [Google Scholar] [CrossRef]
  34. Ma, X.; Yang, G.-C.; Yu, Y.; Li, X.-F.; Liu, X.-T. Effect of clay mineral contents on sealing capacity of caprock of CO2 geological storage. Bull. Miner. Pet. Geochem 2019, 38, 121–129. [Google Scholar] [CrossRef]
  35. Tan, J.; Chen, J.; Zhang, Z.; Liu, C.; Zhang, W. Identification of Interlayer in strong bottom water reservoir and its influence on development effect. J. Geosci. Environ. Prot. 2022, 10, 132–138. [Google Scholar] [CrossRef]
  36. Espinoza, D.N.; Santamarina, J.C. CO2 breakthrough—Caprock sealing efficiency and integrity for carbon geological storage. Int. J. Greenh. Gas Control 2017, 66, 218–229. [Google Scholar] [CrossRef]
  37. Cui, G.; Zhan, L.; Tan, C.; Ren, S.; Zhuang, Y.; Enechukwu, C. Injection of supercritical CO2 for geothermal exploitation from sandstone and carbonate reservoirs: CO2–water–rock interactions and their effects. J. CO2 Util. 2017, 20, 113–128. [Google Scholar] [CrossRef]
  38. Abitkazy, T.; He, Y.; Chen, F.; Yuan, D.; Li, X.; Bai, Y.; Omarbekov, B.; Sarbayev, A. Research on the influence of mineral heterogeneity under different CO2 injection schemes in low permeability reservoirs. Nat. Gas Ind. B 2024, 11, 291–302. [Google Scholar] [CrossRef]
  39. Cheng, Q.; Tang, J.; Liu, Y.; Lu, Y.; Jia, Y.; Zhang, H.; Gong, T.; Zhao, G. Capillary sealing capability alteration of shale caprock induced by CO2-brine-rock interaction: Implication for CO2 geological storage. Geoenergy Sci. Eng. 2024, 41, 213149. [Google Scholar] [CrossRef]
  40. Zhang, Q.; Xu, Q.; Yang, Y.; Iglauer, S.; Liu, J.; Liu, F.; Yao, J. Permeability heterogeneity effects on density-driven CO2 natural convection and carbon sequestration efficiency. Fuel 2024, 363, 130871. [Google Scholar] [CrossRef]
  41. Chen, B.; Li, Q.; Tan, Y.; Zhang, Y.; Yu, T.; Ma, J.; Zhong, Y.; Li, X. Caprock sealing integrity and key indicators of CO2 geological storage considering the effect of hydraulic-mechanical coupling: X field in the Bohai Bay Basin, China. Eng. Geol. 2024, 342, 107741. [Google Scholar] [CrossRef]
  42. Al-Bayati, D.; Saeedi, A.; Myers, M.; White, C.; Quan, X. Insights into immiscible supercritical CO2 EOR: An XCT scanner assisted flow behaviour in layered sandstone porous media. J. CO2 Util. 2019, 32, 187–195. [Google Scholar] [CrossRef]
  43. Gao, X.; Yang, S.; Shen, B.; Tian, L.; Li, S.; Zhang, X.; Wang, J. Influence of Reservoir Spatial Heterogeneity on a Multicoupling Process of CO2 Geological Storage. Energy Fuels 2023, 37, 14991–15005. [Google Scholar] [CrossRef]
  44. Kim, K.; Makhnenko, R.Y. Short-and long-term responses of reservoir rock induced by CO2 injection. Rock Mech. Rock Eng. 2022, 55, 6605–6625. [Google Scholar] [CrossRef]
  45. United Nations Framework Convention on Climate Change the Paris Agreement. Available online: https://unfccc.int/process-and-meetings/the-paris-agreement (accessed on 27 April 2021).
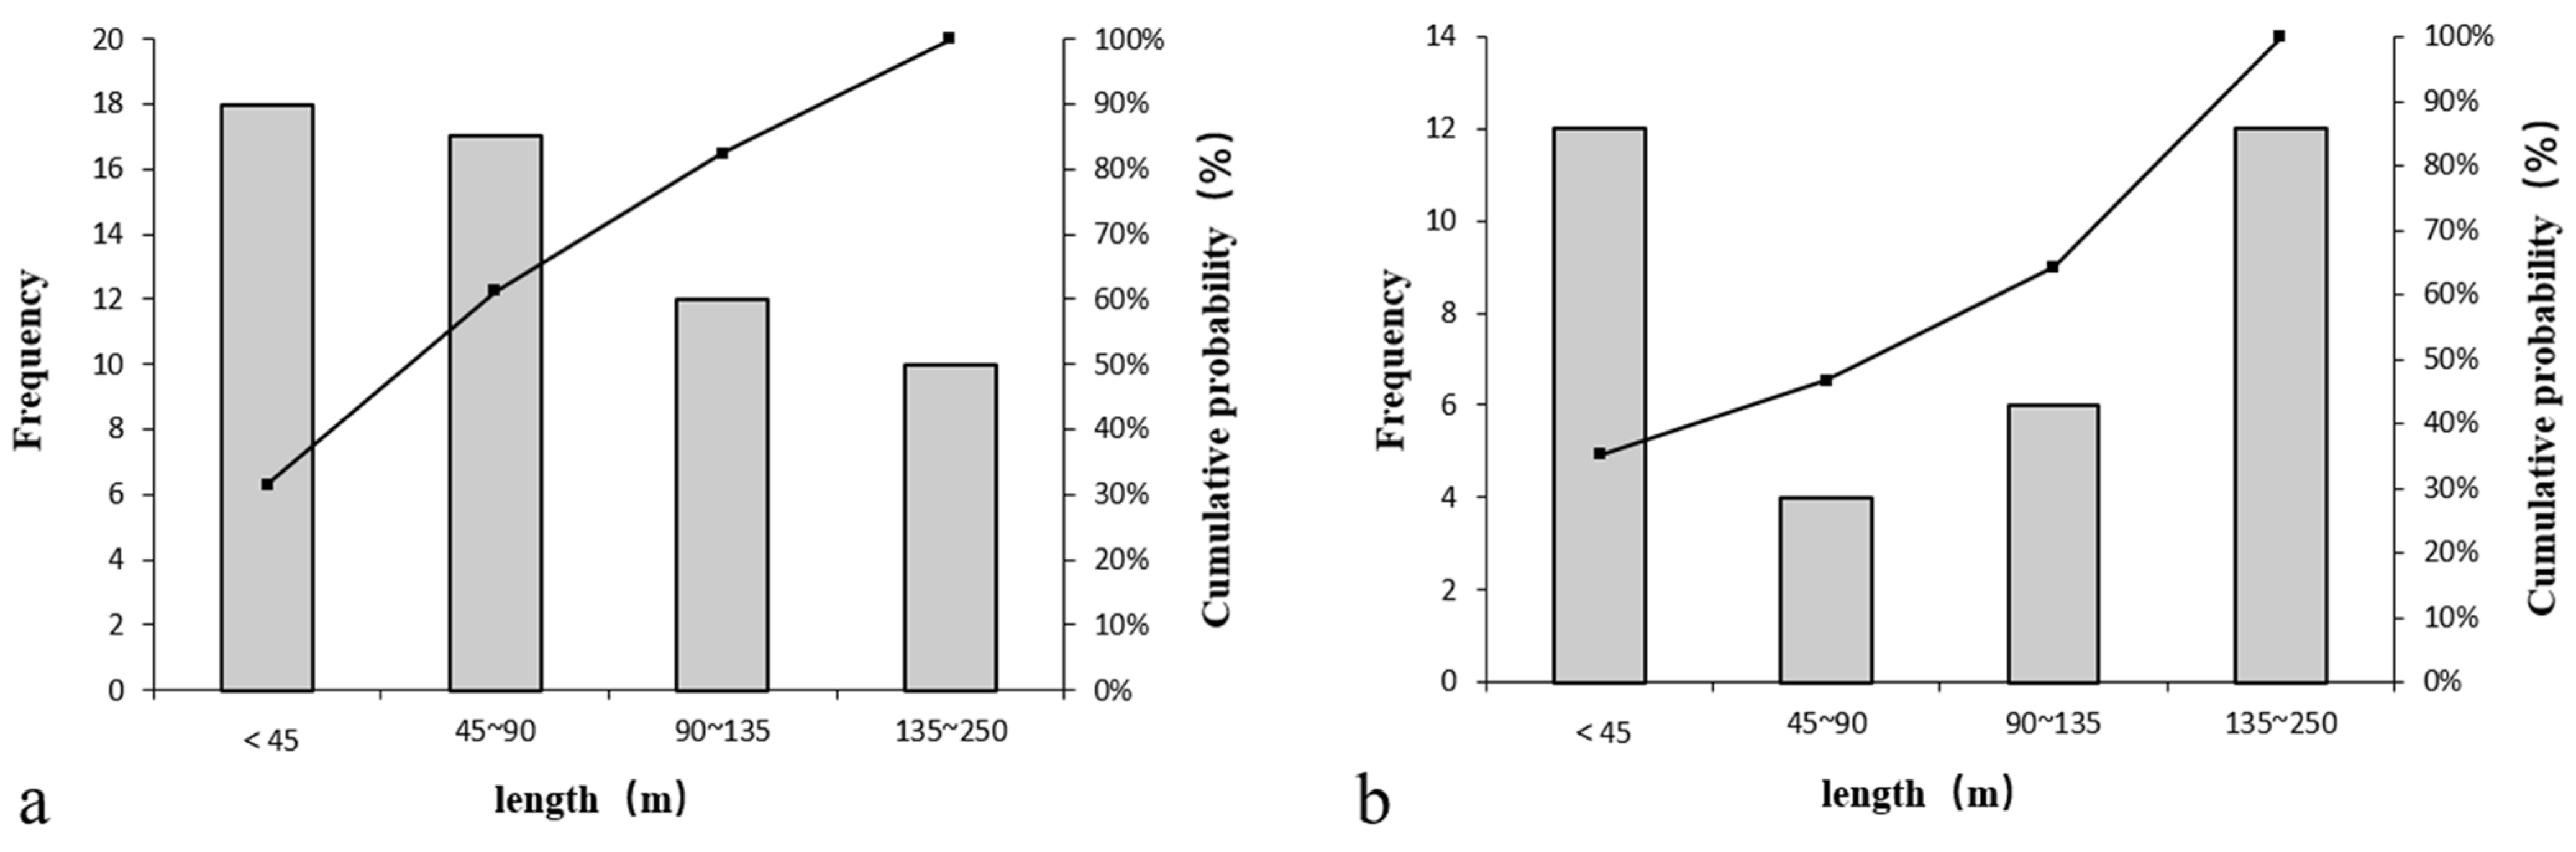
Figure 1. Simplified steps undertaken to investigate the impact of the interlayer on CO2 flooding.
Energies 18 00593 g001
Figure 2. Rock characteristic images of interlayers. (a) The lithology of Qingshankou formation. (b) petrophysical interlayer. (c) Argillaceous interlayers. (d) Argillaceous interlayer plane light characteristics. (e) Argillaceous interlayer cross-polarized light characteristics. (f) Argillaceous interlayer SEM characteristics. (g) Argillaceous interlayer FE-EDS analysis results.
Energies 18 00593 g002
Figure 3. Petrophysical property characteristics demonstration. (a) A plot between the porosity and permeability shows the substantial portion of the reservoir. (b) The total analyzed samples by their types.
Energies 18 00593 g003
Figure 4. Well-logging response characteristics of petrophysical and argillaceous interlayers. SP_nor: normalized spontaneous potential (SP); GR_nor: normalized gamma ray (GR); RT_nor: normalized resistivity (RT); RHOB_nor: normalized density (RHOB); VSH_nor: normalized volume of shale (VSH).
Energies 18 00593 g004
Figure 5. Distribution characteristics of different types of interlayers on the spatial distribution.
Energies 18 00593 g005
Figure 6. Frequency distribution of the characteristics of different types of interbeds in different areas. (a) Petrophysical interbeds. (b) Argillaceous interbeds.
Energies 18 00593 g006
Figure 7. Three-dimensional schematic diagram showing the established interlayer dynamic model.
Energies 18 00593 g007
Figure 12. Effects of different types (a) and different thicknesses (b) of barriers on 10 years of CO2 flooding.
Energies 18 00593 g012
Figure 13. Effects of different thicknesses of interbeds with length and width of 90 m on FGOR (a) and cumulative oil production (b).
Energies 18 00593 g013
Figure 14. The effects of interbeds on FGOR at different areas under 0.9 m thickness (a), and cumulative production with varying areas and thicknesses (b).
Energies 18 00593 g014
Table 1. Summarizing interlayer characterization parameters.
Interlayer TypeInclination (°)Maximum Thickness (m)Minimum Thickness (m)Mean Thickness (m)Maximum Length (m)Minimum Length (m)
petrophysical interlayers0–10
170–180
17.100.254.30--
petrophysical interbeds0–10
170–180
3.330.411.059816.40
argillaceous barriers0–5
170–180
180.335.90--
argillaceous barriers0–5
170–180
2.440.271.22181324
Table 2. Simulation configuration and petrophysical parameters of the dynamic model.
CategoryParameterValue
Model ConfigurationSimulation duration10 years
Number of wells1 injection well,
1 production well
Well spacing180 m
Grid dimensions40 × 40 × 19 cells
Grid sizeX, Y: 4.5 m; Z: 1 m
Formation conditionsPressure 17 MPa;
Temperature 90 °C
Interlayer representationGrid cells 5–7 and 12–14
Oil layer representationGrid cells 1–4 and 15–19
Petrophysical ParametersArgillaceous interlayer porosity5%
Argillaceous interlayer permeability0.005 mD
Petrophysical interlayer porosity7%
Petrophysical interlayer permeability0.02 mD
Table 3. Formation fluid-related parameters of the dynamic model.
PropertyValue
Property value density of water at surface condition (g/cm3)1
Viscosity of formation water at original reservoir condition (MPa·s)10.55
Formation water compressibility at original reservoir condition (×10−6 MPa−1)2.30
Formation water formation volume factor at original reservoir condition1.01
Diffusion coefficient in formation water (×10−7 m2/s)1.59
CO2 diffusion coefficient in crude oil (×10−7 m2/s)9.69
CO2 mass transfer coefficient in gas phase (×10−6 m2/s)1.27
Disclaimer/Publisher’s Note: The statements, opinions and data contained in all publications are solely those of the individual author(s) and contributor(s) and not of MDPI and/or the editor(s). MDPI and/or the editor(s) disclaim responsibility for any injury to people or property resulting from any ideas, methods, instructions or products referred to in the content.

