The engine tests aimed to assess the influence of fuel properties on the main energetic parameters of the engine, such as effective power, effective torque, maximum cylinder pressure, hourly fuel consumption, BSFC, injection timing, and duration.
From an ecological perspective, the monitored parameters included particle emissions (weight, smoke number), NOx, HC, CO, and CO2. The results described below focus first on the influence of the tested fuels on energetic parameters, followed by descriptions of their effects on engine emissions when operating with alternative fuels.
3.1. Energetic Parameters
The first series of tests aimed to investigate the behavior of the engine fueled with alternative fuels under 100% load. The analysis of the engine’s energy parameters, such as effective power, torque, and BSFC, is described below.
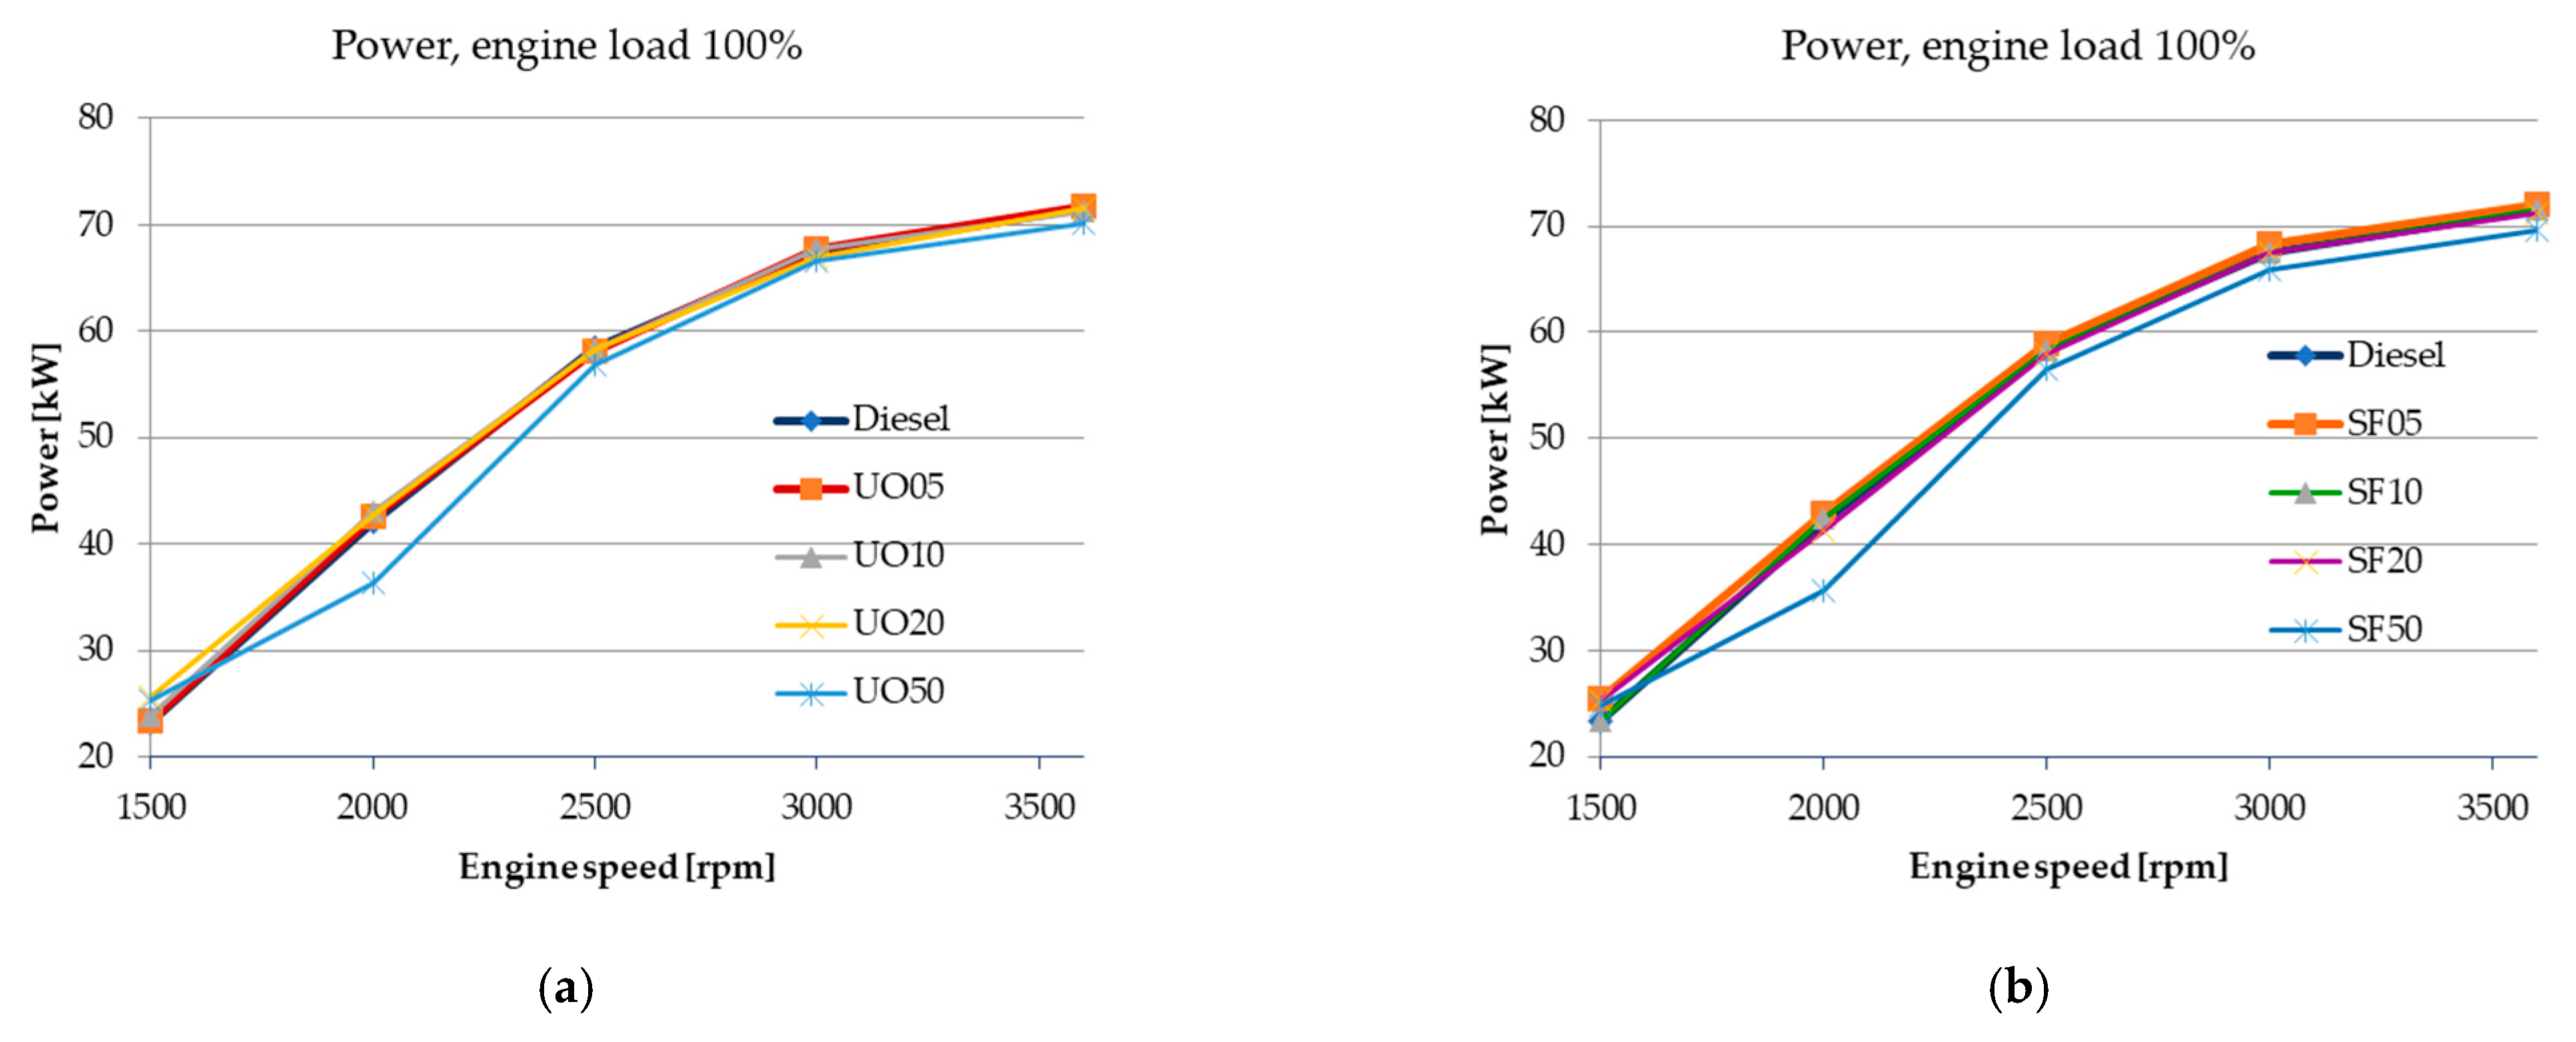
It can be observed in
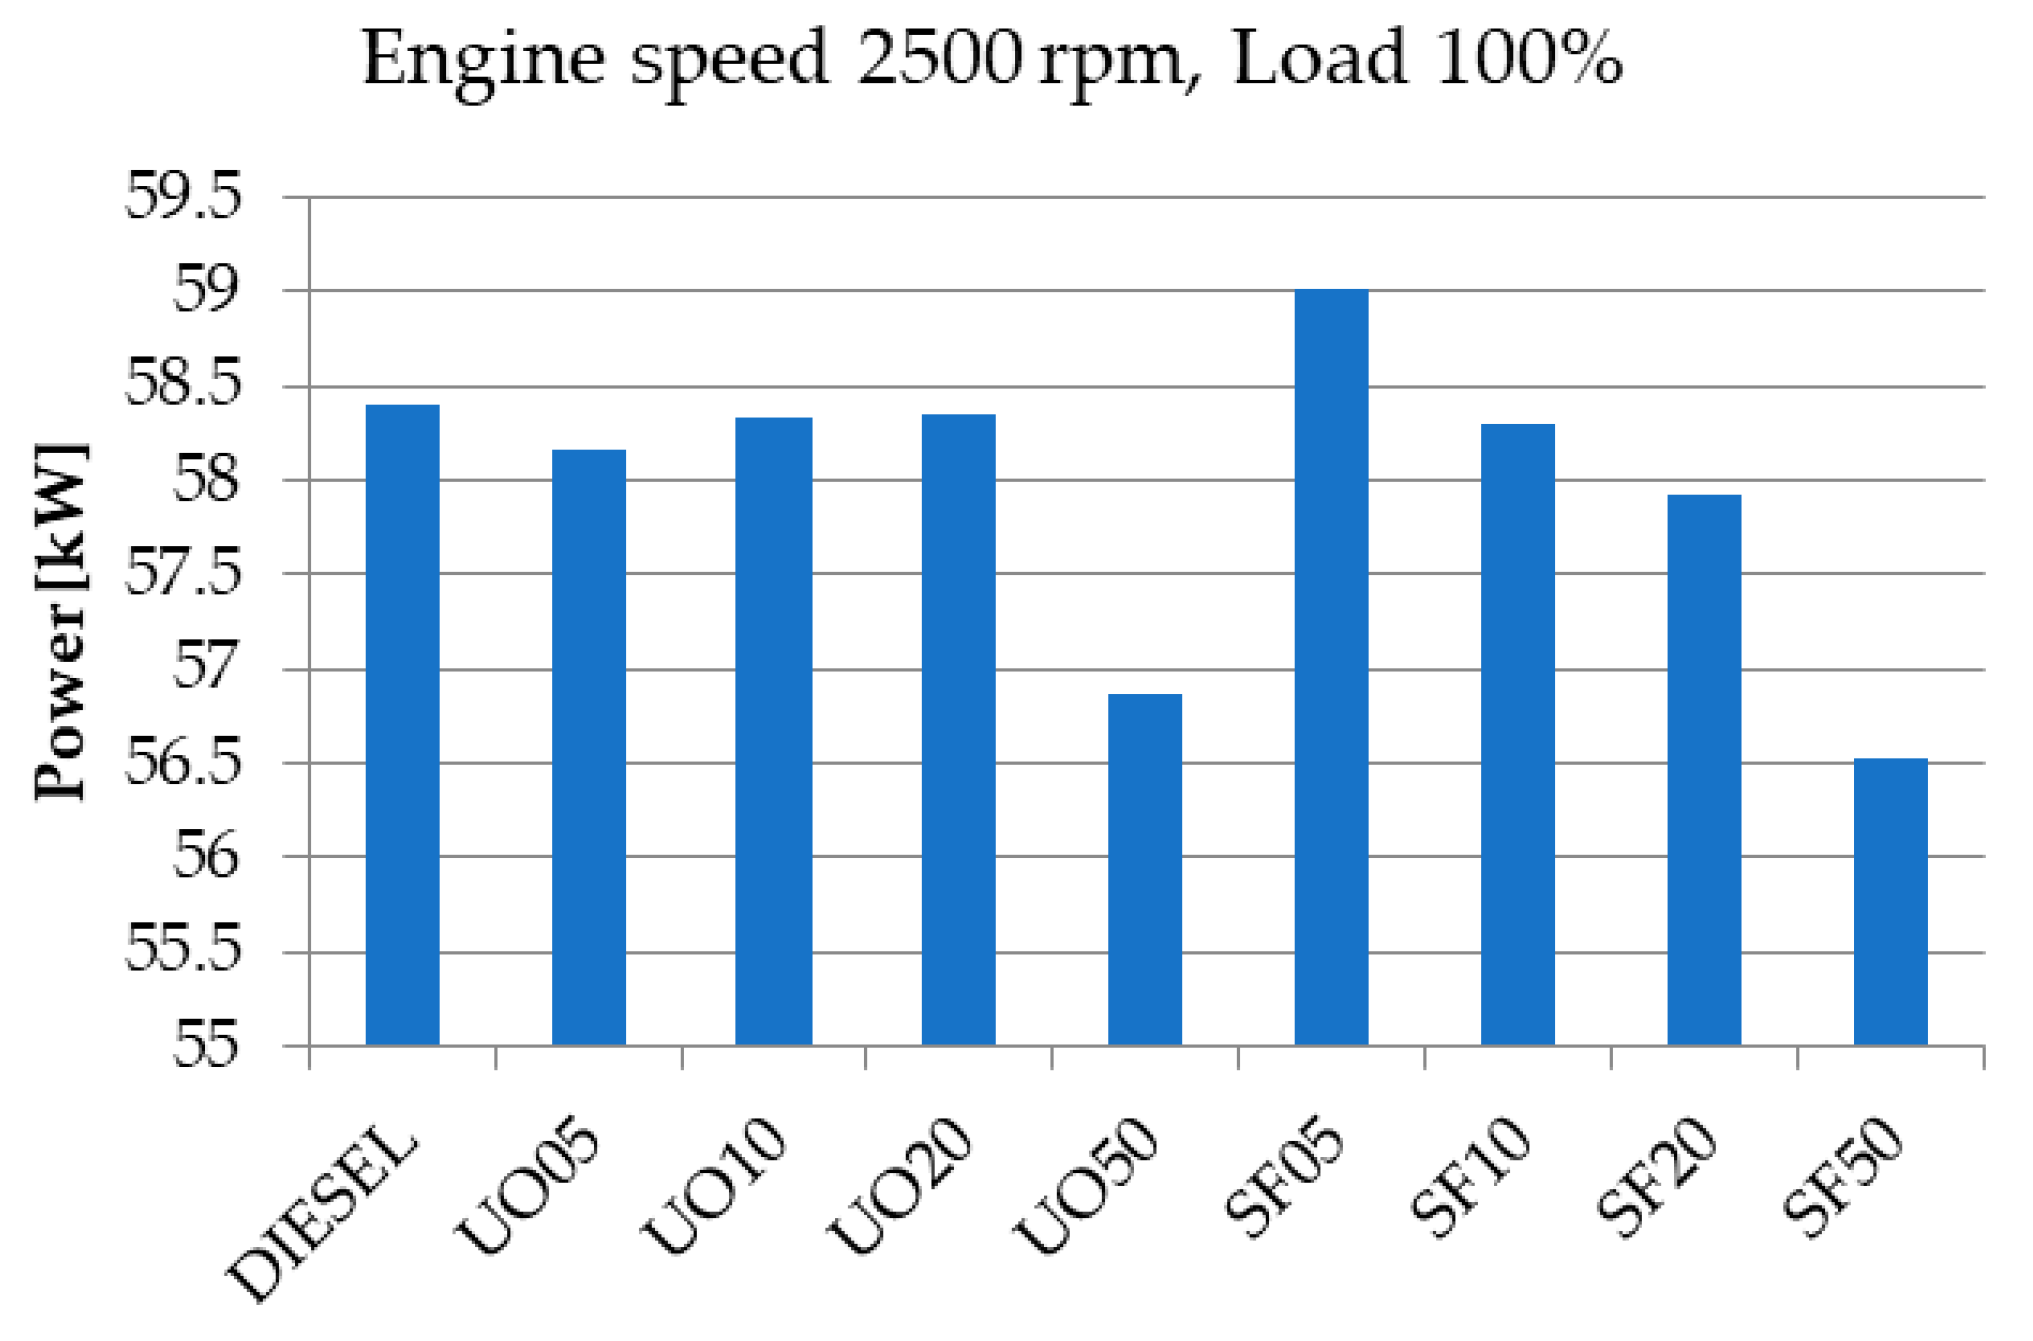
Figure 6 that the effective power is influenced by the fuel used as follows. In the case of the SF biodiesel blend, there is a tendency for power to decrease with the increase in the concentration of biodiesel in the blend, up to 3.18%. Regarding the UO biodiesel blend, there is no clear trend up to a concentration of 20%, with differences in effective power ranging between 0.09% and 0.4%. Additionally, it can be noted that for a concentration of 50%, a more pronounced decrease in effective power is observed, with a reduction of 2.61% for UO50 and 3.18% for SF50 compared to diesel.
The percentage of biodiesel in a diesel mixture does lead to a slight reduction in engine power compared to 100% diesel, as seen in
Figure 6. However, the power reduction is relatively small and may not be noticeable. Furthermore, biodiesel blends offer environmental benefits that might outweigh the minor power loss in many applications.
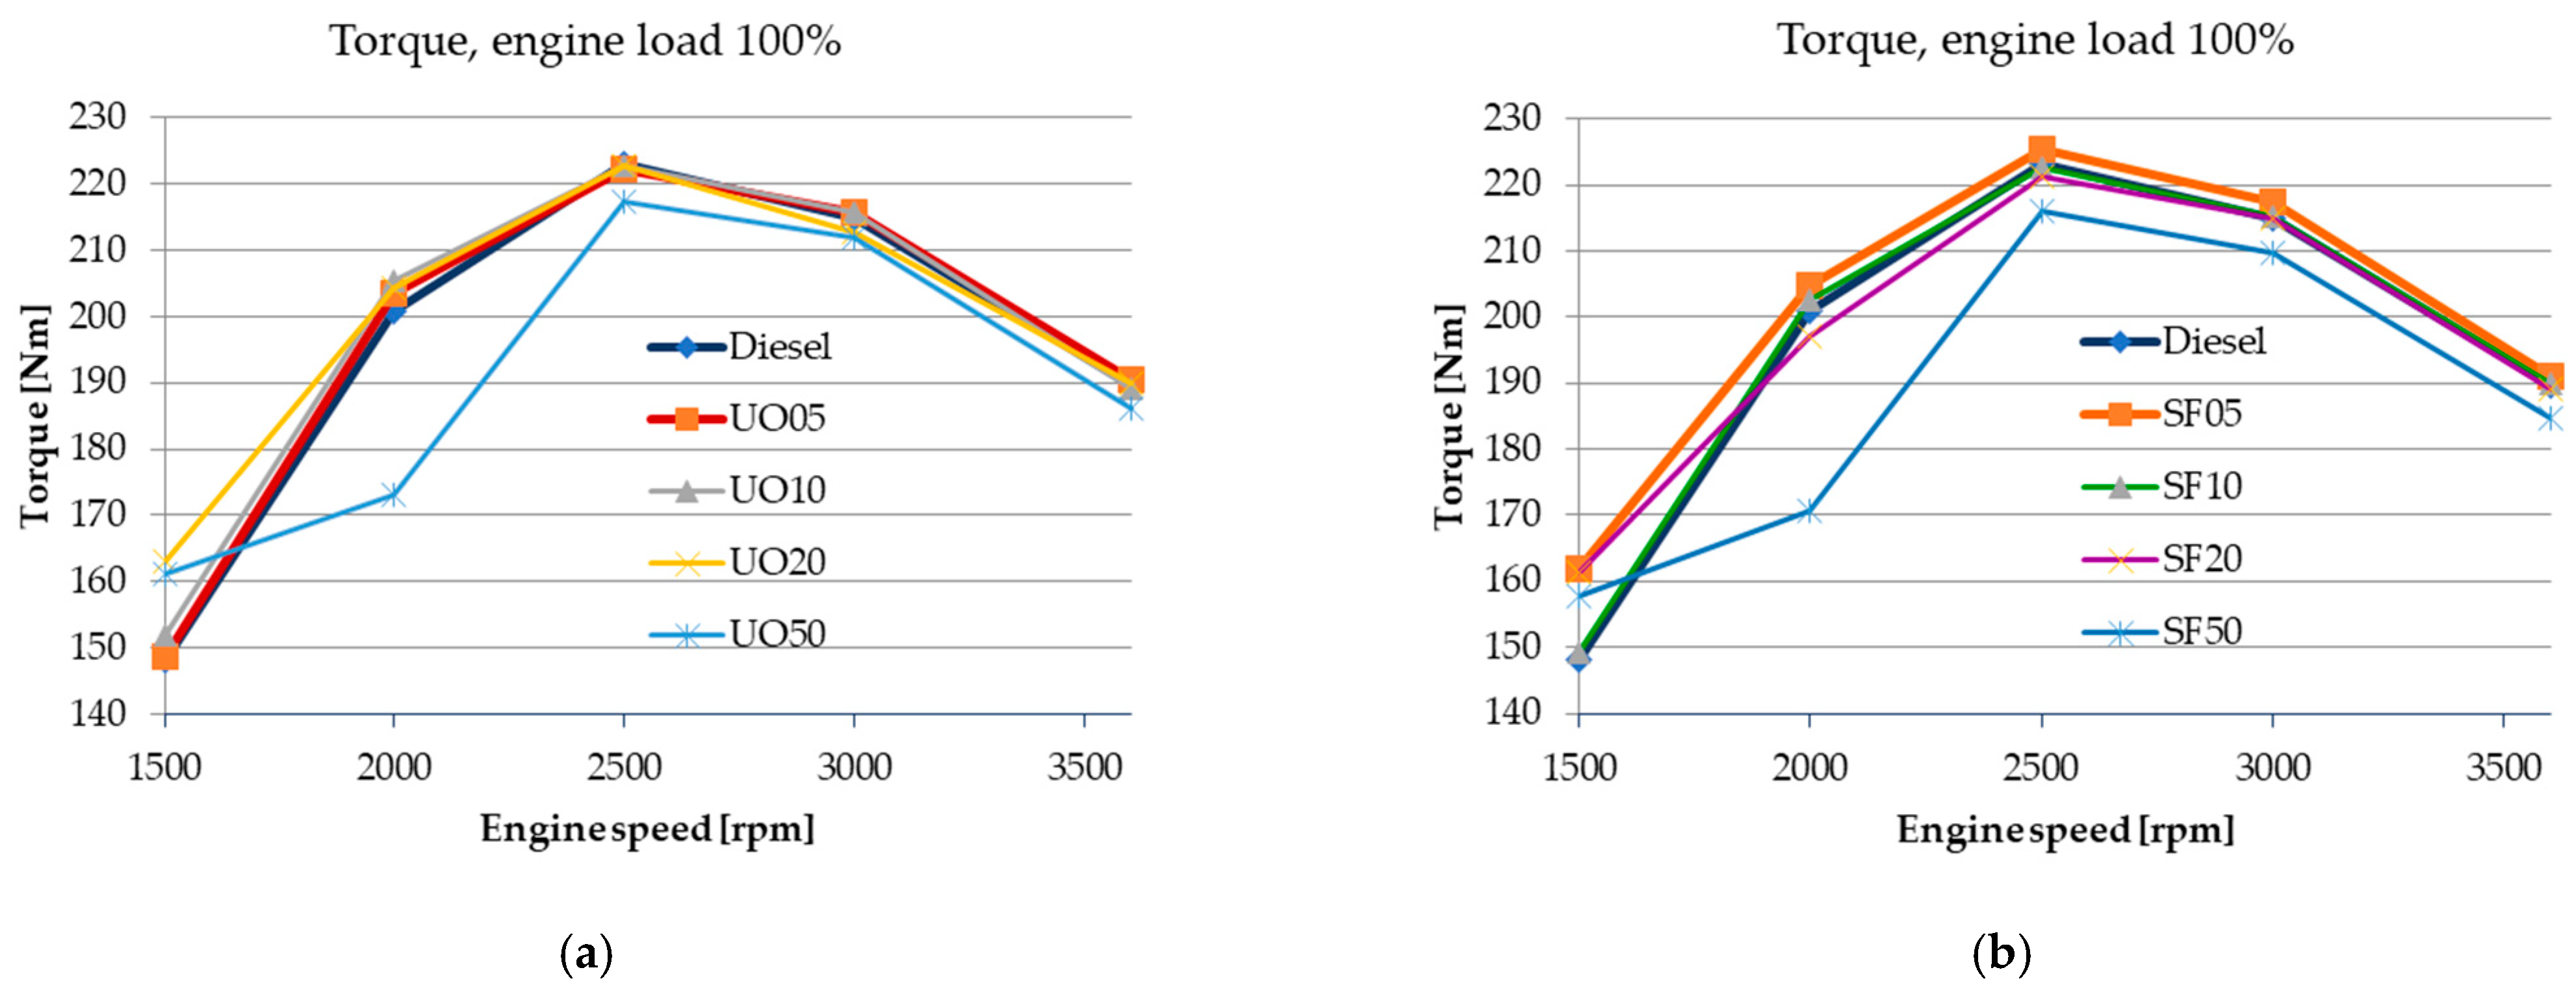
While higher biodiesel concentrations tend to reduce engine torque due to lower energy content and other combustion factors, the observed impact is generally minor for lower blend percentages and more significant for UO50 and SF50. However, torque loss is often balanced by the environmental benefits of biodiesel.
Fuels with higher carbon contents can enhance the power output of an engine due to their increased energy density. From
Table 2 and
Figure 6 it can be observed that the difference in the percentage of carbon content between diesel fuel and 50% biodiesel blends of UO and SF is less than 3%, and the power output is almost the same as that exhibited in the 100% diesel fuel tests. Biodiesel contains a lower carbon content than traditional diesel, leading to reduced PM and CO emissions while providing renewable energy benefits.
Lower biodiesel content fuels may have less impact on performance and emissions since the characteristics of the blend are closer to those of conventional diesel regarding density.
Generally, a higher diesel index leads to better engine performance with smoother operation, improved fuel efficiency, and lower PM emissions.
The lower calorific value provided in
Table 2, corroborated with the engine power diagram in
Figure 6, clearly demonstrates the influence of this parameter, especially at high biodiesel concentrations, such as 50%. As the calorific value decreases, the engine’s developed power also decreases. Fuels with higher calorific values release more energy per unit of fuel burned, which can result in higher CO
2 emissions if combustion is complete.
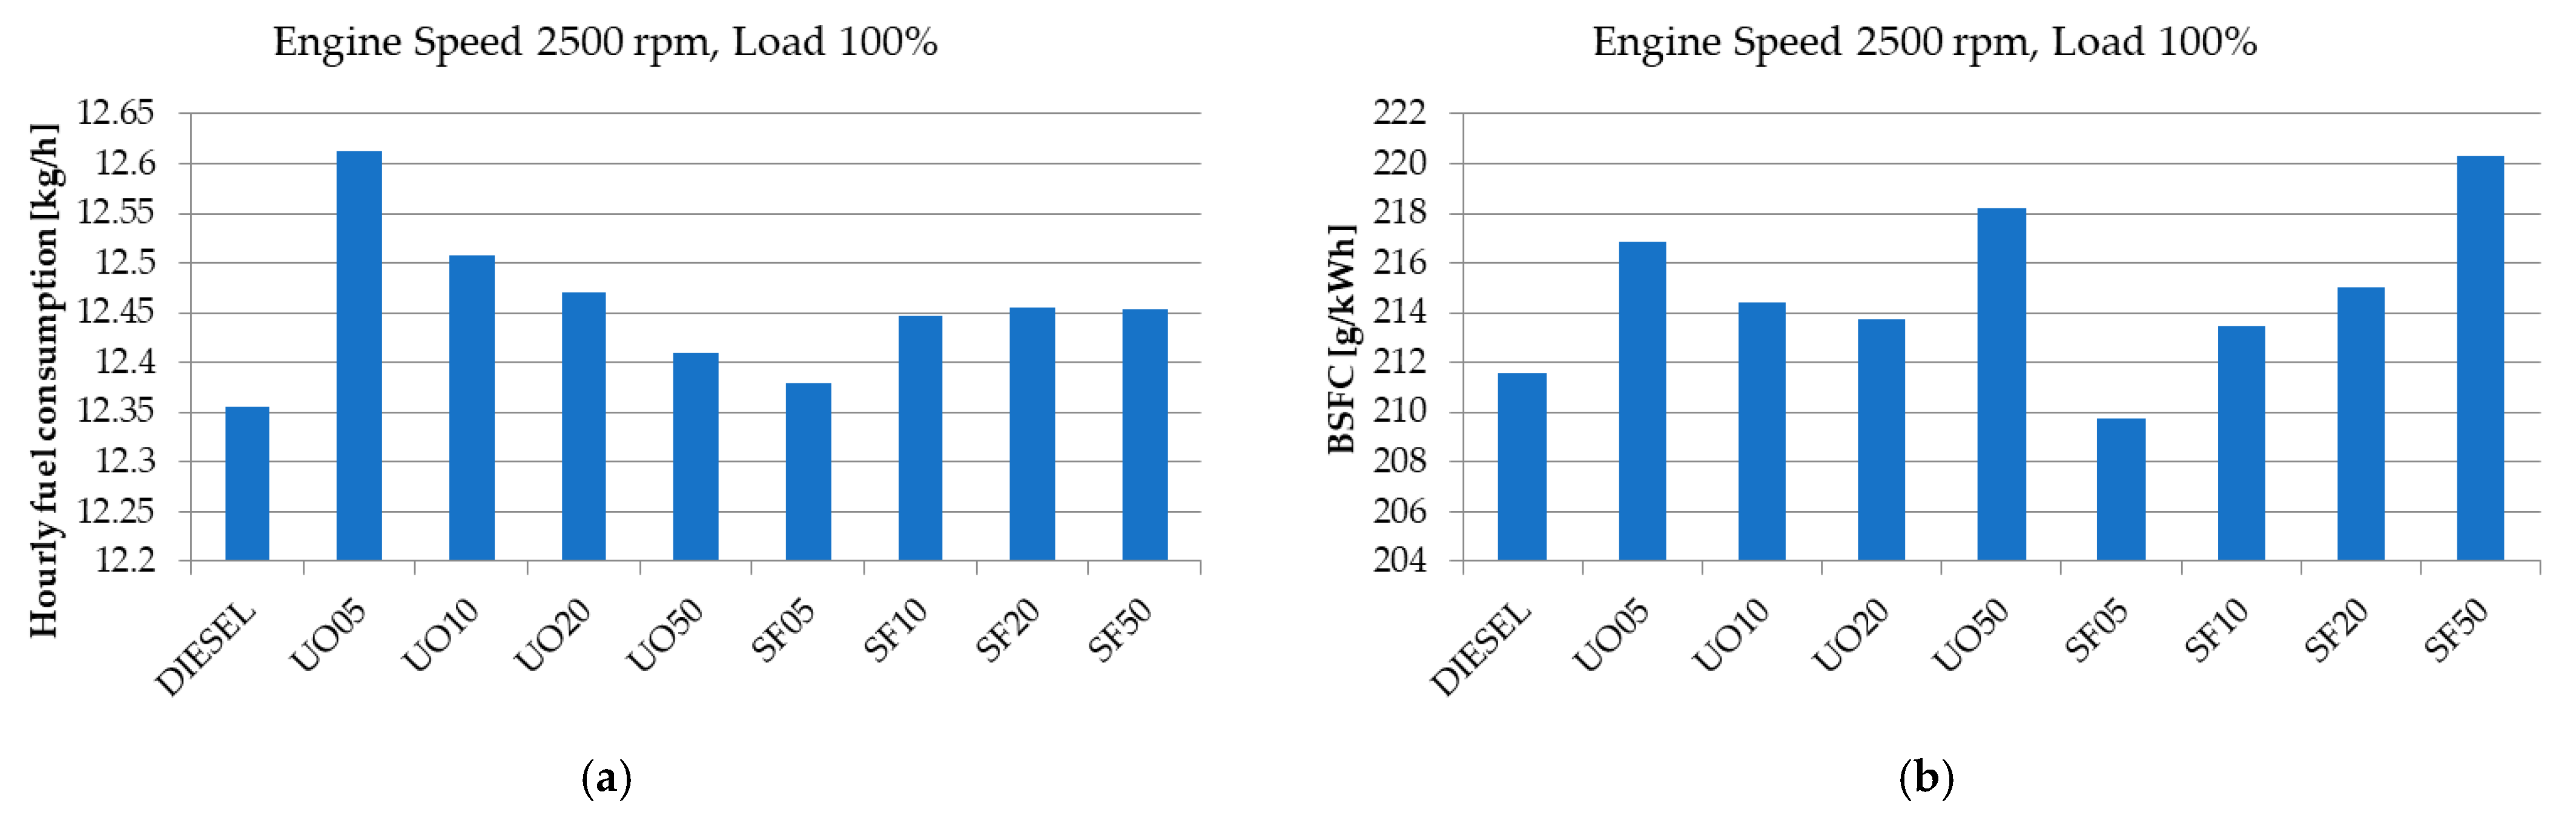
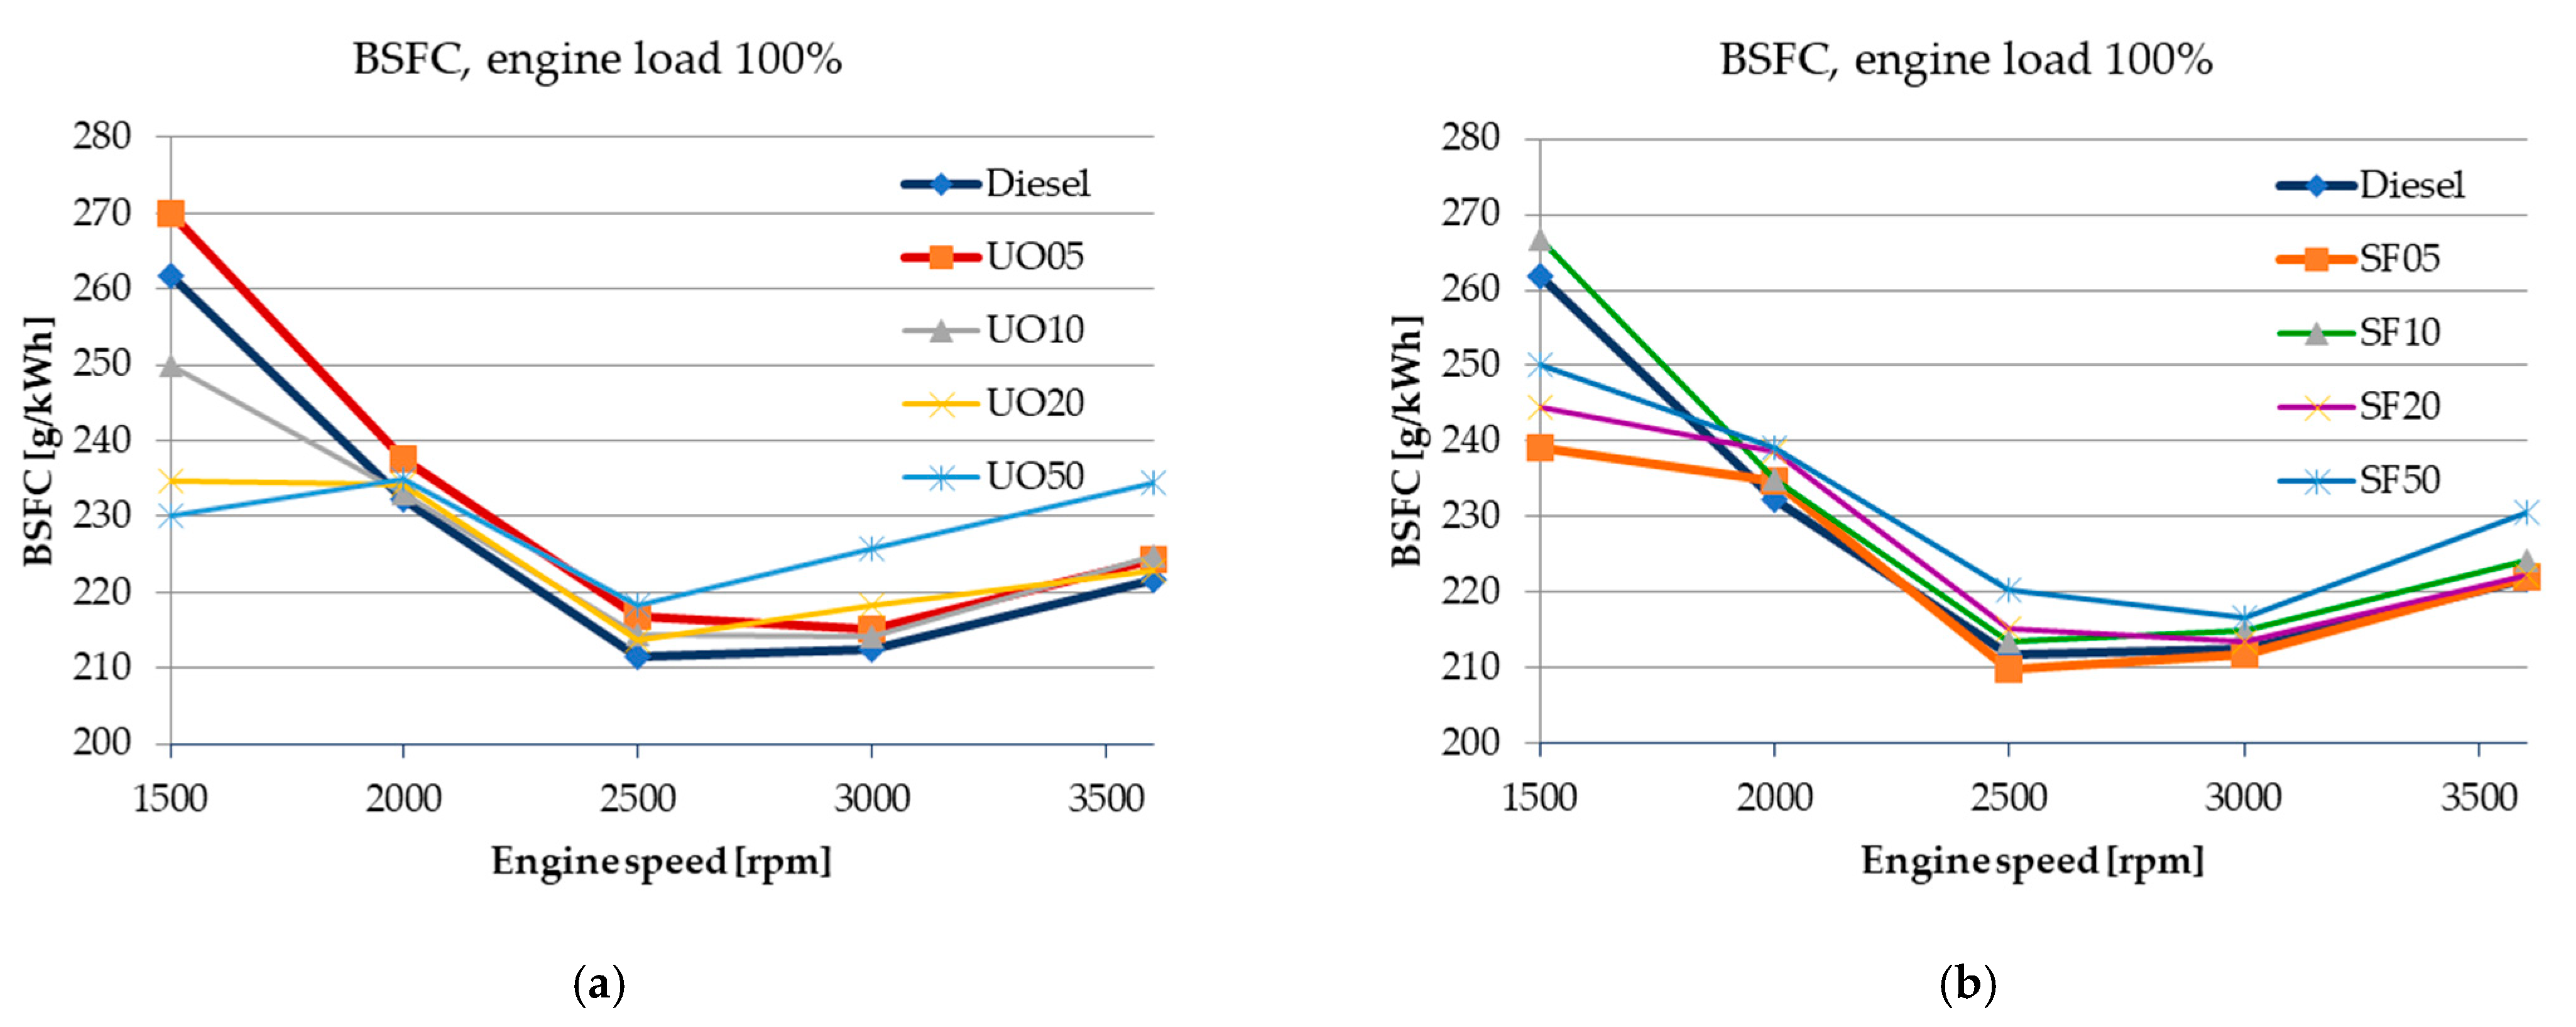
Regarding the hourly fuel consumption, it can be observed in
Figure 7a that for the used cooking oil-based fuel, the consumption decreases with the increase in the concentration of biodiesel in the blend. Compared to diesel, this varies between 2.08% for UO05 and 0.43% for UO50. The BSFC is influenced by the type of fuel, with the influence attributed to its density, which varies between 835–854 kg/m
3 for the biofuels used in these experiments (
Table 2).
From
Figure 7b, it can be observed that with the increase in the concentration of biodiesel in the blend, in the case of sunflower biodiesel, the BSFC also increases, correlated with a decrease in effective power.
Biodiesel generally presents a higher fuel consumption compared to 100% diesel due to its lower energy content, different combustion properties, and factors like viscosity and volatility.
It can be observed from
Figure 7a that UO-based biodiesel shows a trend of decreasing hourly fuel consumption as the percentage of UO increases, which can be explained by the high content of monounsaturated fats. Similarly, SF—based biodiesel, which predominantly contains more polyunsaturated fats, exhibits higher fuel consumption as the percentage of SF oil biodiesel in the blend increases.
From the comparative analysis of the two types of fuels, with different concentrations used, it can be observed in
Figure 6 that in the case of the blend with 5% biofuel, SF05 recorded an increased power and torque over diesel and UO05 by 1.06% and 1.46%, respectively. At a concentration of 10%, both types of biofuels, UO10 and SF10, had slightly lower values than diesel, by 0.4% and 0.17%, respectively. With the increase in biofuel concentration, it was found that biodiesel made from UO exhibits an improvement in energy parameters compared to that made from sunflower oil and a deterioration compared to diesel, by 0.1% for UO20 and 2.61% for UO50. The lowest energy performance, at 100% load and 2500 rpm speed, is exhibited by SF50, which is 3.18% lower than that of diesel.
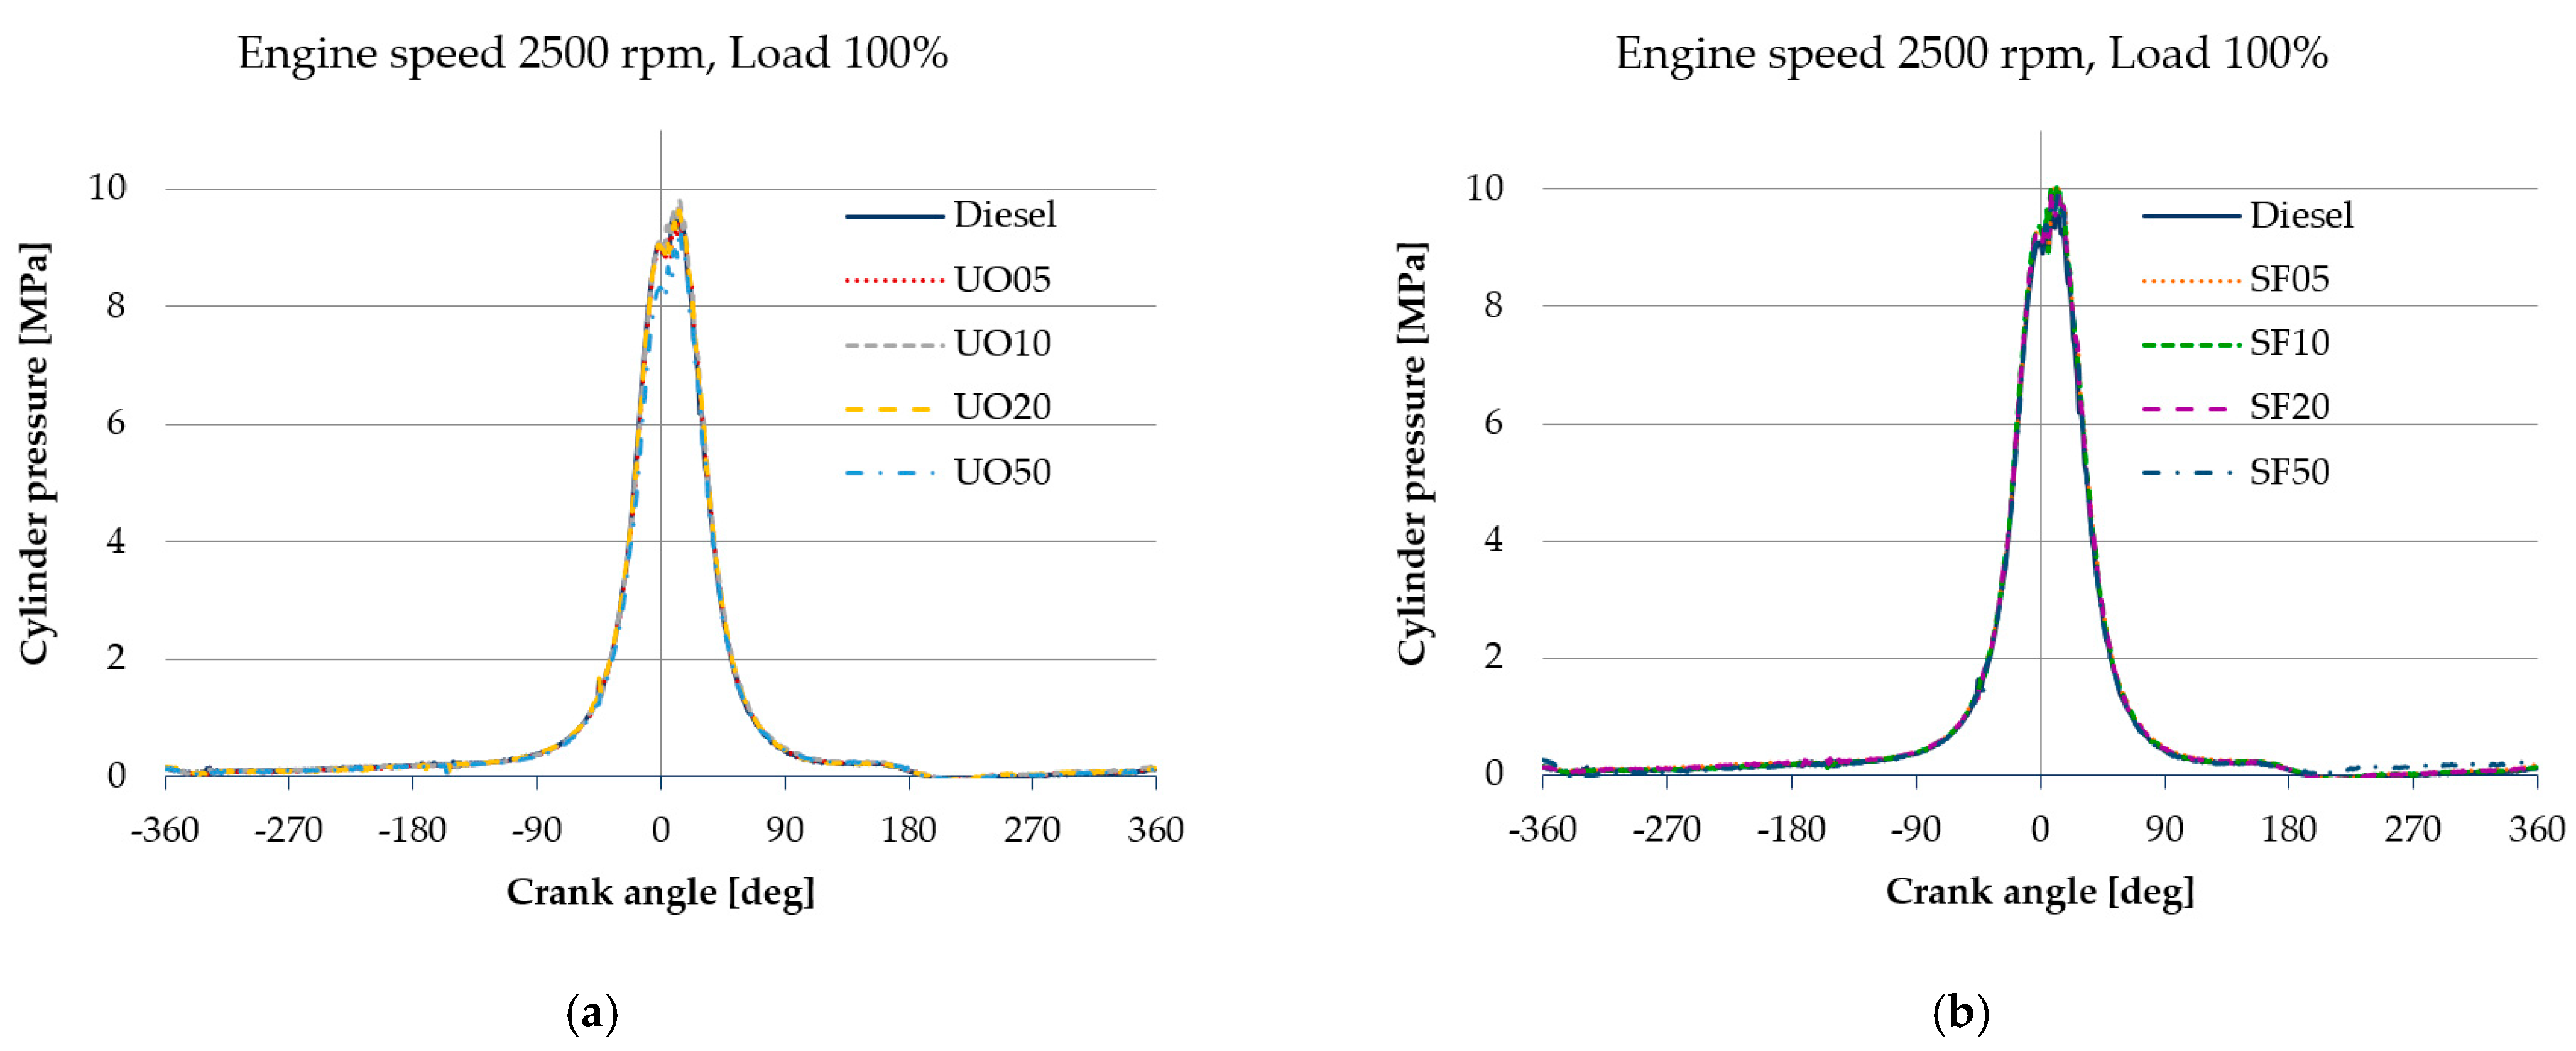
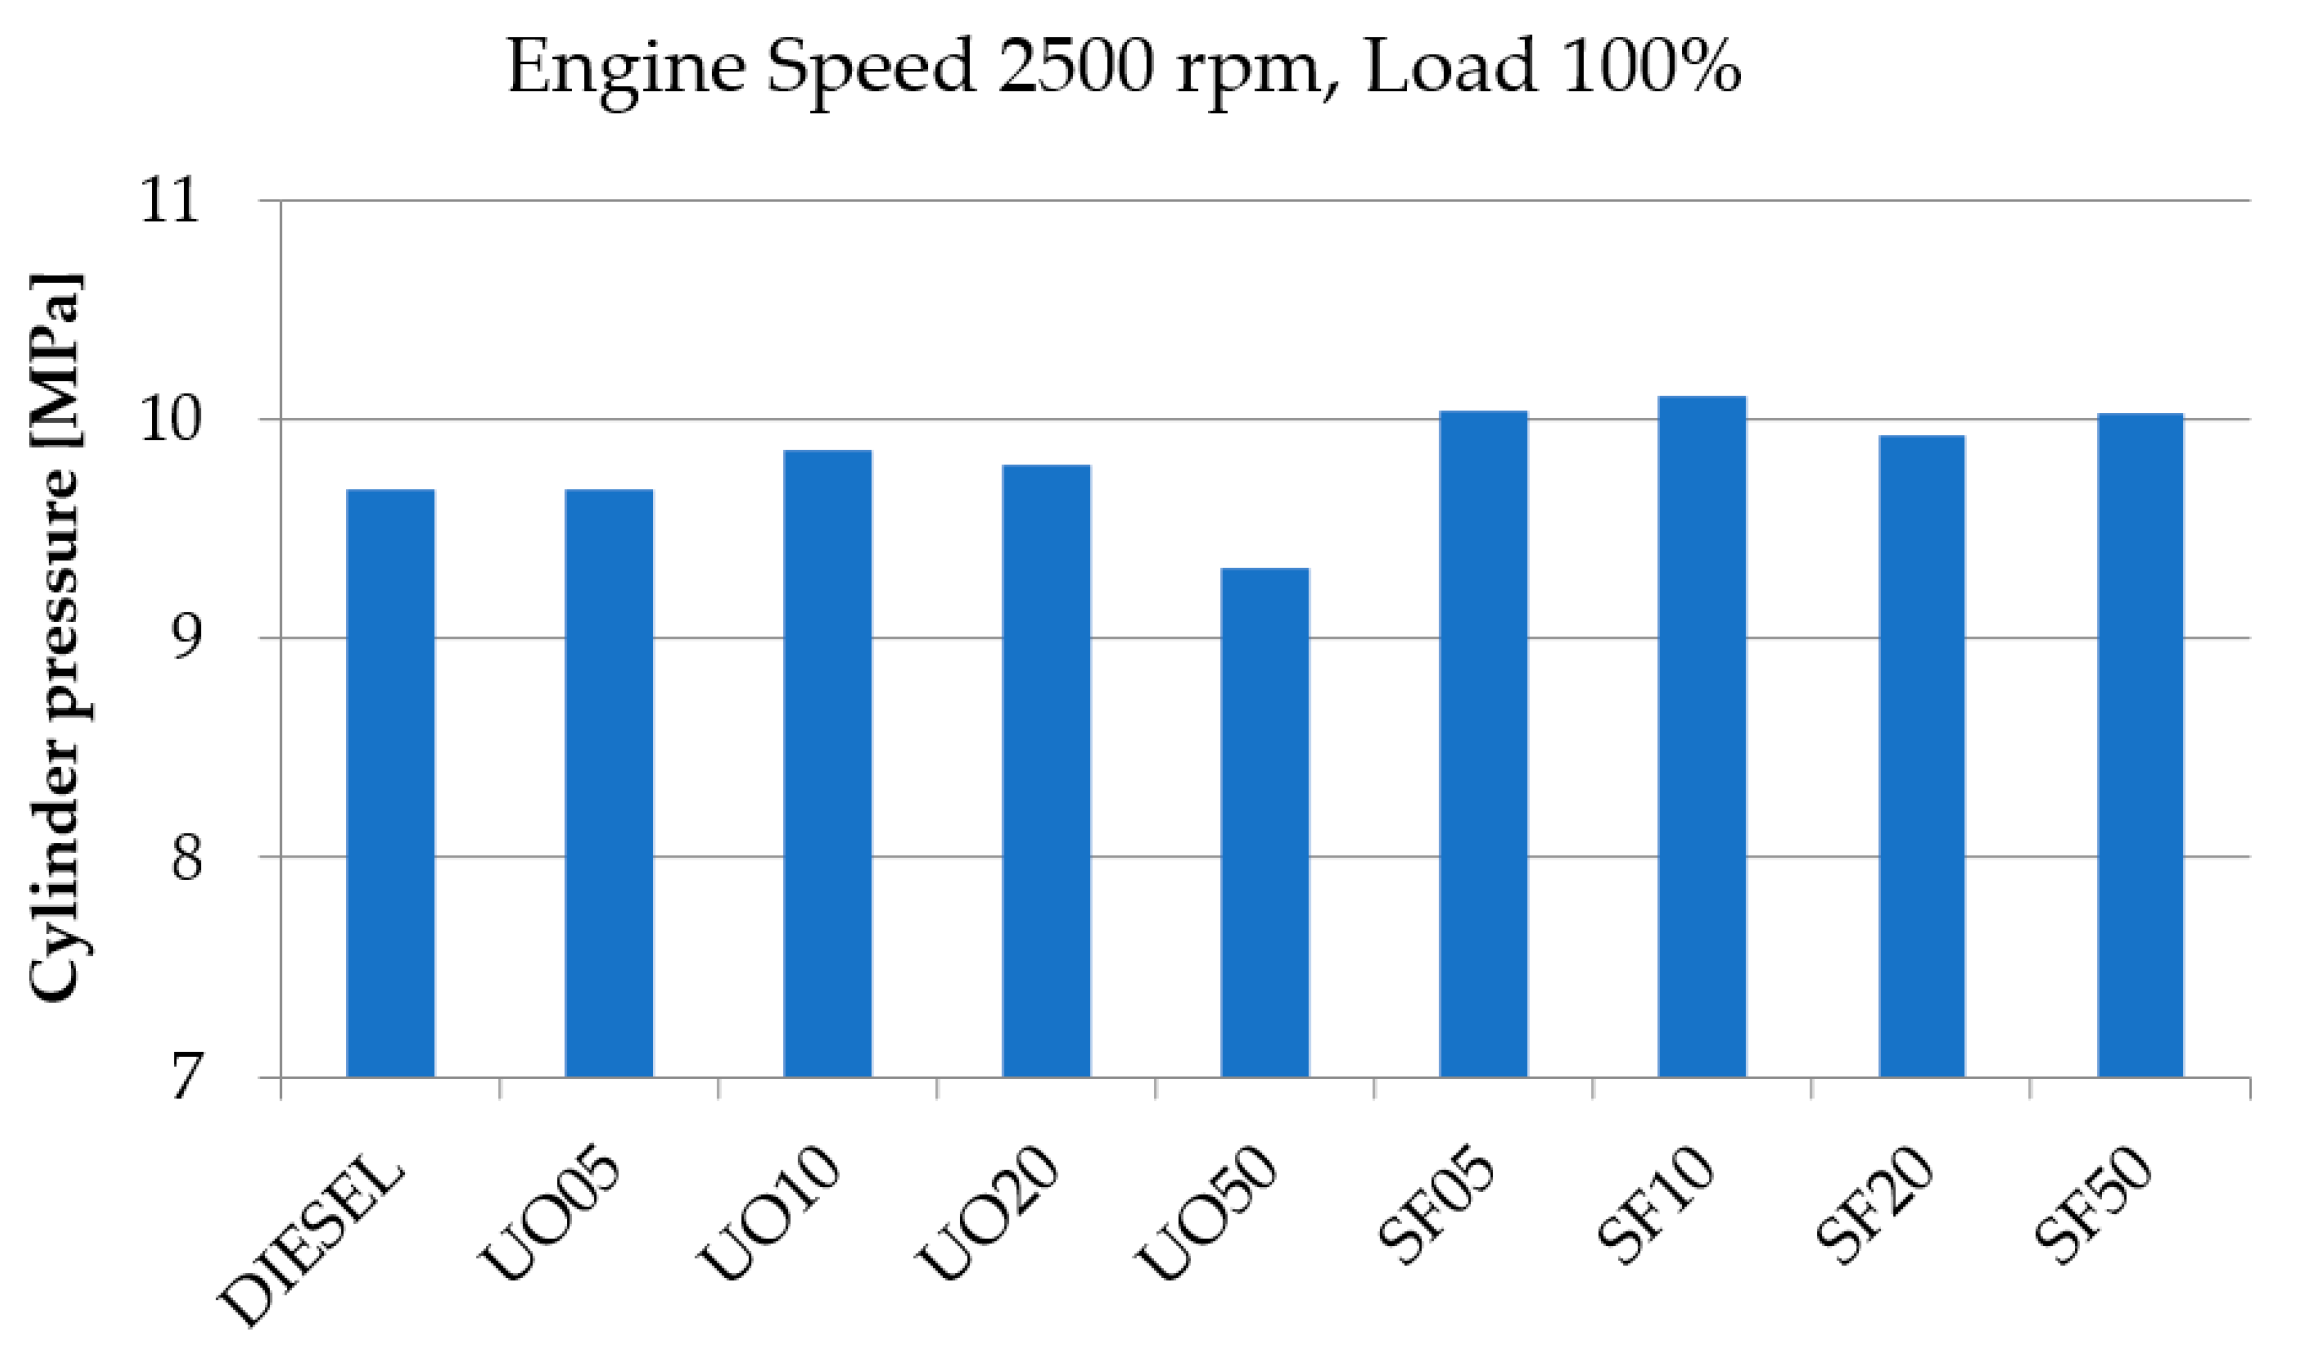
Figure 8 illustrates the variation of cylinder pressure curves depending on the concentration of biodiesel in the blend.
The cylinder pressure varies depending on the raw material from which the biodiesel was produced. Thus, in the case of sunflower biodiesel, it is observed that the maximum cylinder pressure is approximately 2.5% higher than that recorded when operating with UO biodiesel for all concentrations used.
The UO50 fuel exhibits the lowest maximum cylinder pressure compared to diesel (−3.66%), with a higher BSFC compared to the same benchmark (3.12%), as shown in
Figure 9. All mixtures of SF oil show a higher cylinder pressure than diesel.
For concentrations of 50%, namely for the fuels UO50 and SF50, a decrease in energy performance is observed, accompanied by an increase in BSFC at 2000 rpm speed. These fuels exhibit the poorest performance, with values of effective power and effective torque 13.76% lower for UO50 and 15.06% lower for SF50, respectively.
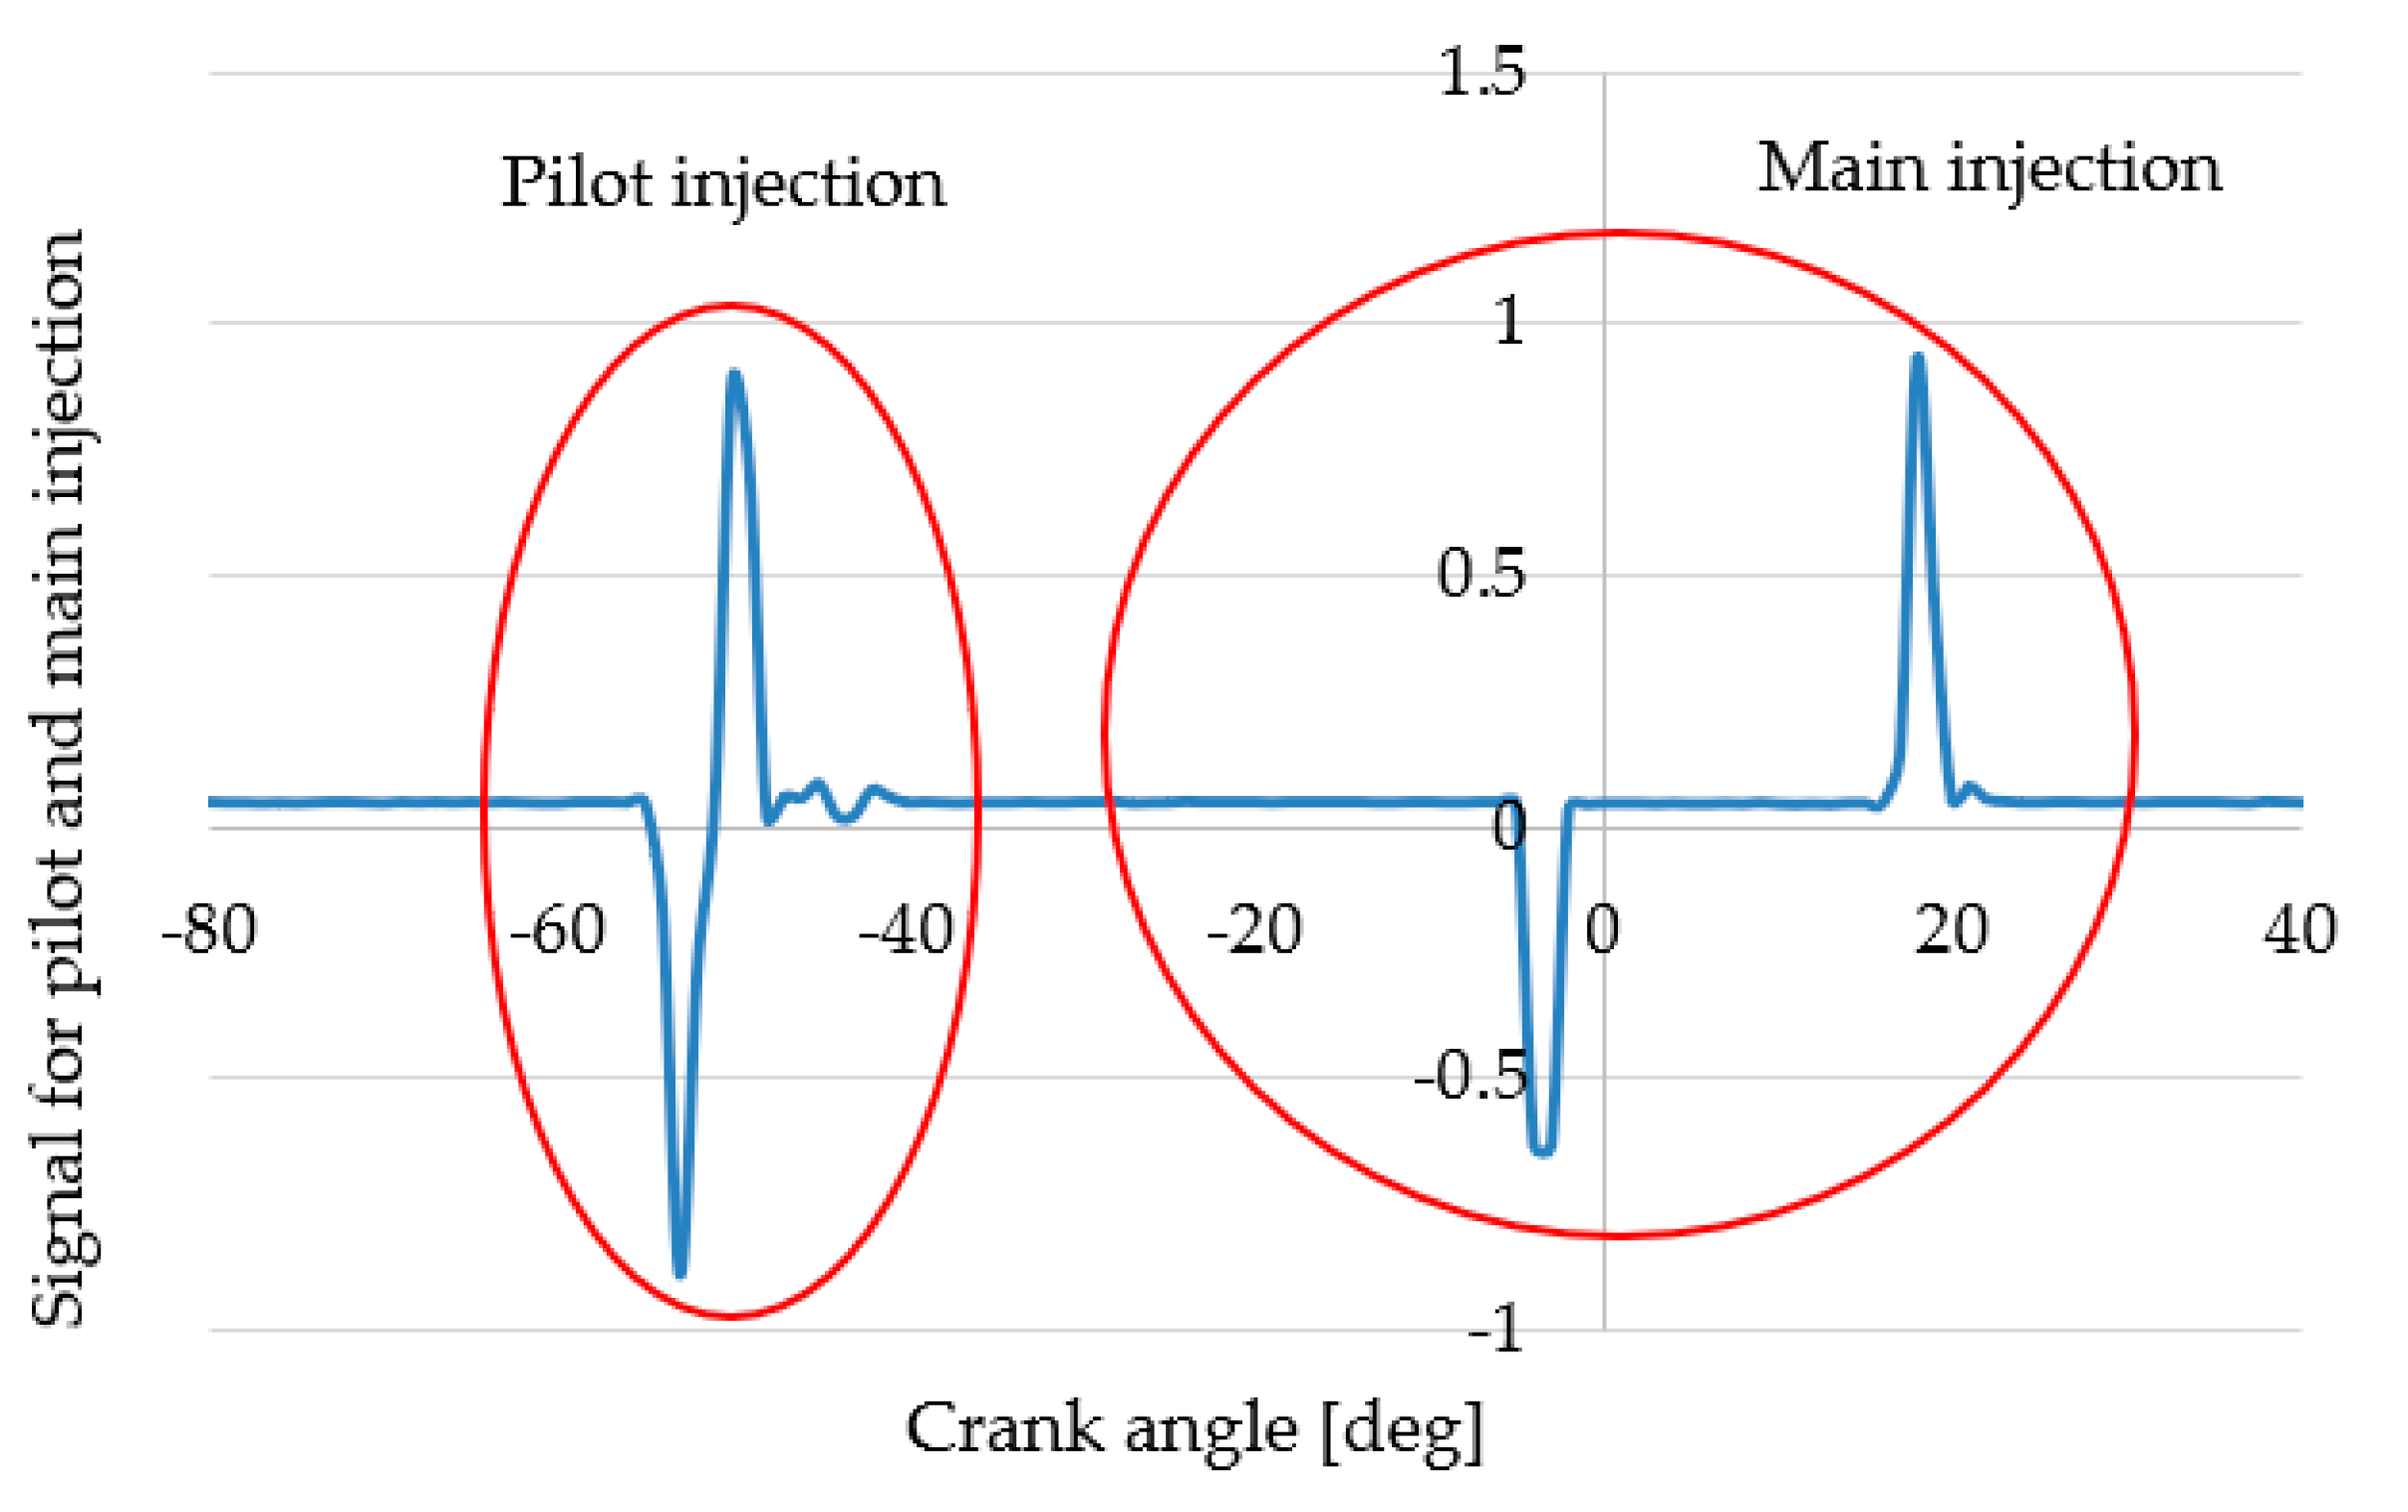
Regarding the injection start and end angles, from the analysis of the experimental data presented in
Figure 13 for 100% load and 2500 rpm speed, it can be observed that the test presents two split injections: a pilot injection lasting 3 crank angle degrees and a main injection, which is displayed graphically only for diesel fuel, but is consistent for all tested fuels, lasting 24 crank angle degrees, between −4 degrees before top dead center and +19 degrees after top dead center.
3.2. The Ecological Parameters
The analysis of ecological parameters focuses on the concentrations of NOx, CO, CO2, HC, and particulate matter in the exhaust gases. The origin of pollutant emissions in compression ignition engines is characterized by the fuel state (vapor or droplets), mixture homogeneity (local dosage coefficient), and cylinder temperature.
Nitrogen oxides form at high pressure and temperature levels in the combustion chamber. The quantity of nitrogen oxides is influenced by the amount of available oxygen. During the formation process of nitrogen oxides from the beginning of combustion, several flame nuclei are created and distributed in depth. The oxygen around these nuclei is consumed more quickly than in the areas further away. These zones, where oxygen maintains its initial concentration, are heated due to the increase in pressure and the heat radiated by the flame. The relatively high concentration and temperature lead to the formation of nitrogen oxides in these zones. An engine running on biodiesel typically produces lower levels of NOx compared to regular diesel for a few reasons related to the chemical properties of biodiesel and how it burns in the engine.
Sunflower oil biodiesel and UO biodiesel may behave differently in terms of NOx emissions primarily due to differences in their chemical composition, fatty acid profiles, and how these factors influence combustion characteristics.
Different oils have varying levels of saturated, monounsaturated, and polyunsaturated fatty acids, and these affect combustion in several ways. SF typically has a higher percentage of polyunsaturated fatty acids. These are more reactive, which can result in higher combustion temperatures when burned in the engine. Since NOx is formed at higher combustion temperatures, this can lead to increased NOx emissions. UOs have in their compositions a mixture of saturated, monounsaturated, and polyunsaturated fats, but they are often higher in monounsaturated fats than oils like SF. The presence of more monounsaturated fats can lead to more stable combustion and lower peak combustion temperatures, due to better oxidative stability, resulting in lower NOx emissions compared to diesel. From
Table 2, it can be observed that both SF and UO contain a small percentage of saturated fats, with monounsaturated and polyunsaturated fats being predominant. SF oil predominantly contains polyunsaturated fats, more than 50%, and approximately 30% monounsaturated fats. In comparison, UO contains approximately 60% monounsaturated fats and 20% polyunsaturated fats.
Saturated fatty acids have a high melting point, are more viscous, and tend to burn at higher temperatures. Fuels rich in saturated fatty acids tend to increase combustion temperatures, which can lead to higher thermal NOx emissions. NOx is produced at high temperatures in the presence of oxygen, and the higher the temperature, the greater the NOx formation.
Monounsaturated fats have one double bond in their fatty acid chains and polyunsaturated fats have multiple double bonds in their fatty acid chains. These structural differences influence how the biodiesel burns in the engine and can affect its combustion characteristics, including temperature, combustion efficiency, and emissions such as NOx. Biodiesel made from oils with monounsaturated fats in the composition tends to produce slightly lower NOx emissions compared to biodiesel made from polyunsaturated fats, due to the smoother combustion process and lower peak temperatures. If a biodiesel blend contains a higher percentage of monounsaturated fats, the smoother and more controlled combustion process can lead to lower NOx emissions. A biodiesel blend with more monounsaturated fats is likely to produce lower NOx emissions compared to one with a higher percentage of polyunsaturated fats.
Nitrogen oxide emissions are also influenced by the amount of available oxygen (from the aspirated air, correlated with the amount of oxygen in the molecule of the tested biofuels) by the temperature of the exhaust gases, which should be as low as possible, and the contact time between oxygen and the gases in the combustion chamber. Biodiesel contains more oxygen than conventional diesel fuel. The presence of oxygen helps promote more complete combustion, which can reduce the formation of NOx. During combustion, the biodiesel generally burns at a lower peak combustion temperature than petroleum diesel. Since NOx is formed at higher combustion temperatures, the cooler combustion conditions of biodiesel result in lower NOx production. The lower carbon content of biodiesel compared to diesel 100% may also help reduce the overall heat generated during combustion, indirectly contributing to lower NOx levels.
However, the impact on NOx emissions also depends on several other factors, including the specific engine design, operating conditions, and the biodiesel blend’s overall formulation. The relationship is not always linear.
A lower aniline point generally improves fuel performance by promoting better atomization, quicker ignition, and more complete combustion, leading to higher engine efficiency and lower PM and smoke emissions, but it may result in slightly higher NOx emissions due to the higher combustion temperatures associated with better combustion.
The viscosity of biodiesel has an important role in how it is injected into the combustion chamber and how efficiently it burns. The higher the viscosity, the harder it is for the fuel to atomize properly, which can affect combustion efficiency. Biodiesel derived from SF tends to have a lower viscosity compared to UO biodiesel (
Table 2) which can result in better atomization and more complete combustion. However, higher polyunsaturation levels and possible higher combustion temperatures might still lead to an increase in NOx emissions. However, other factors such as viscosity, and engine calibration can also influence the final emissions profile.
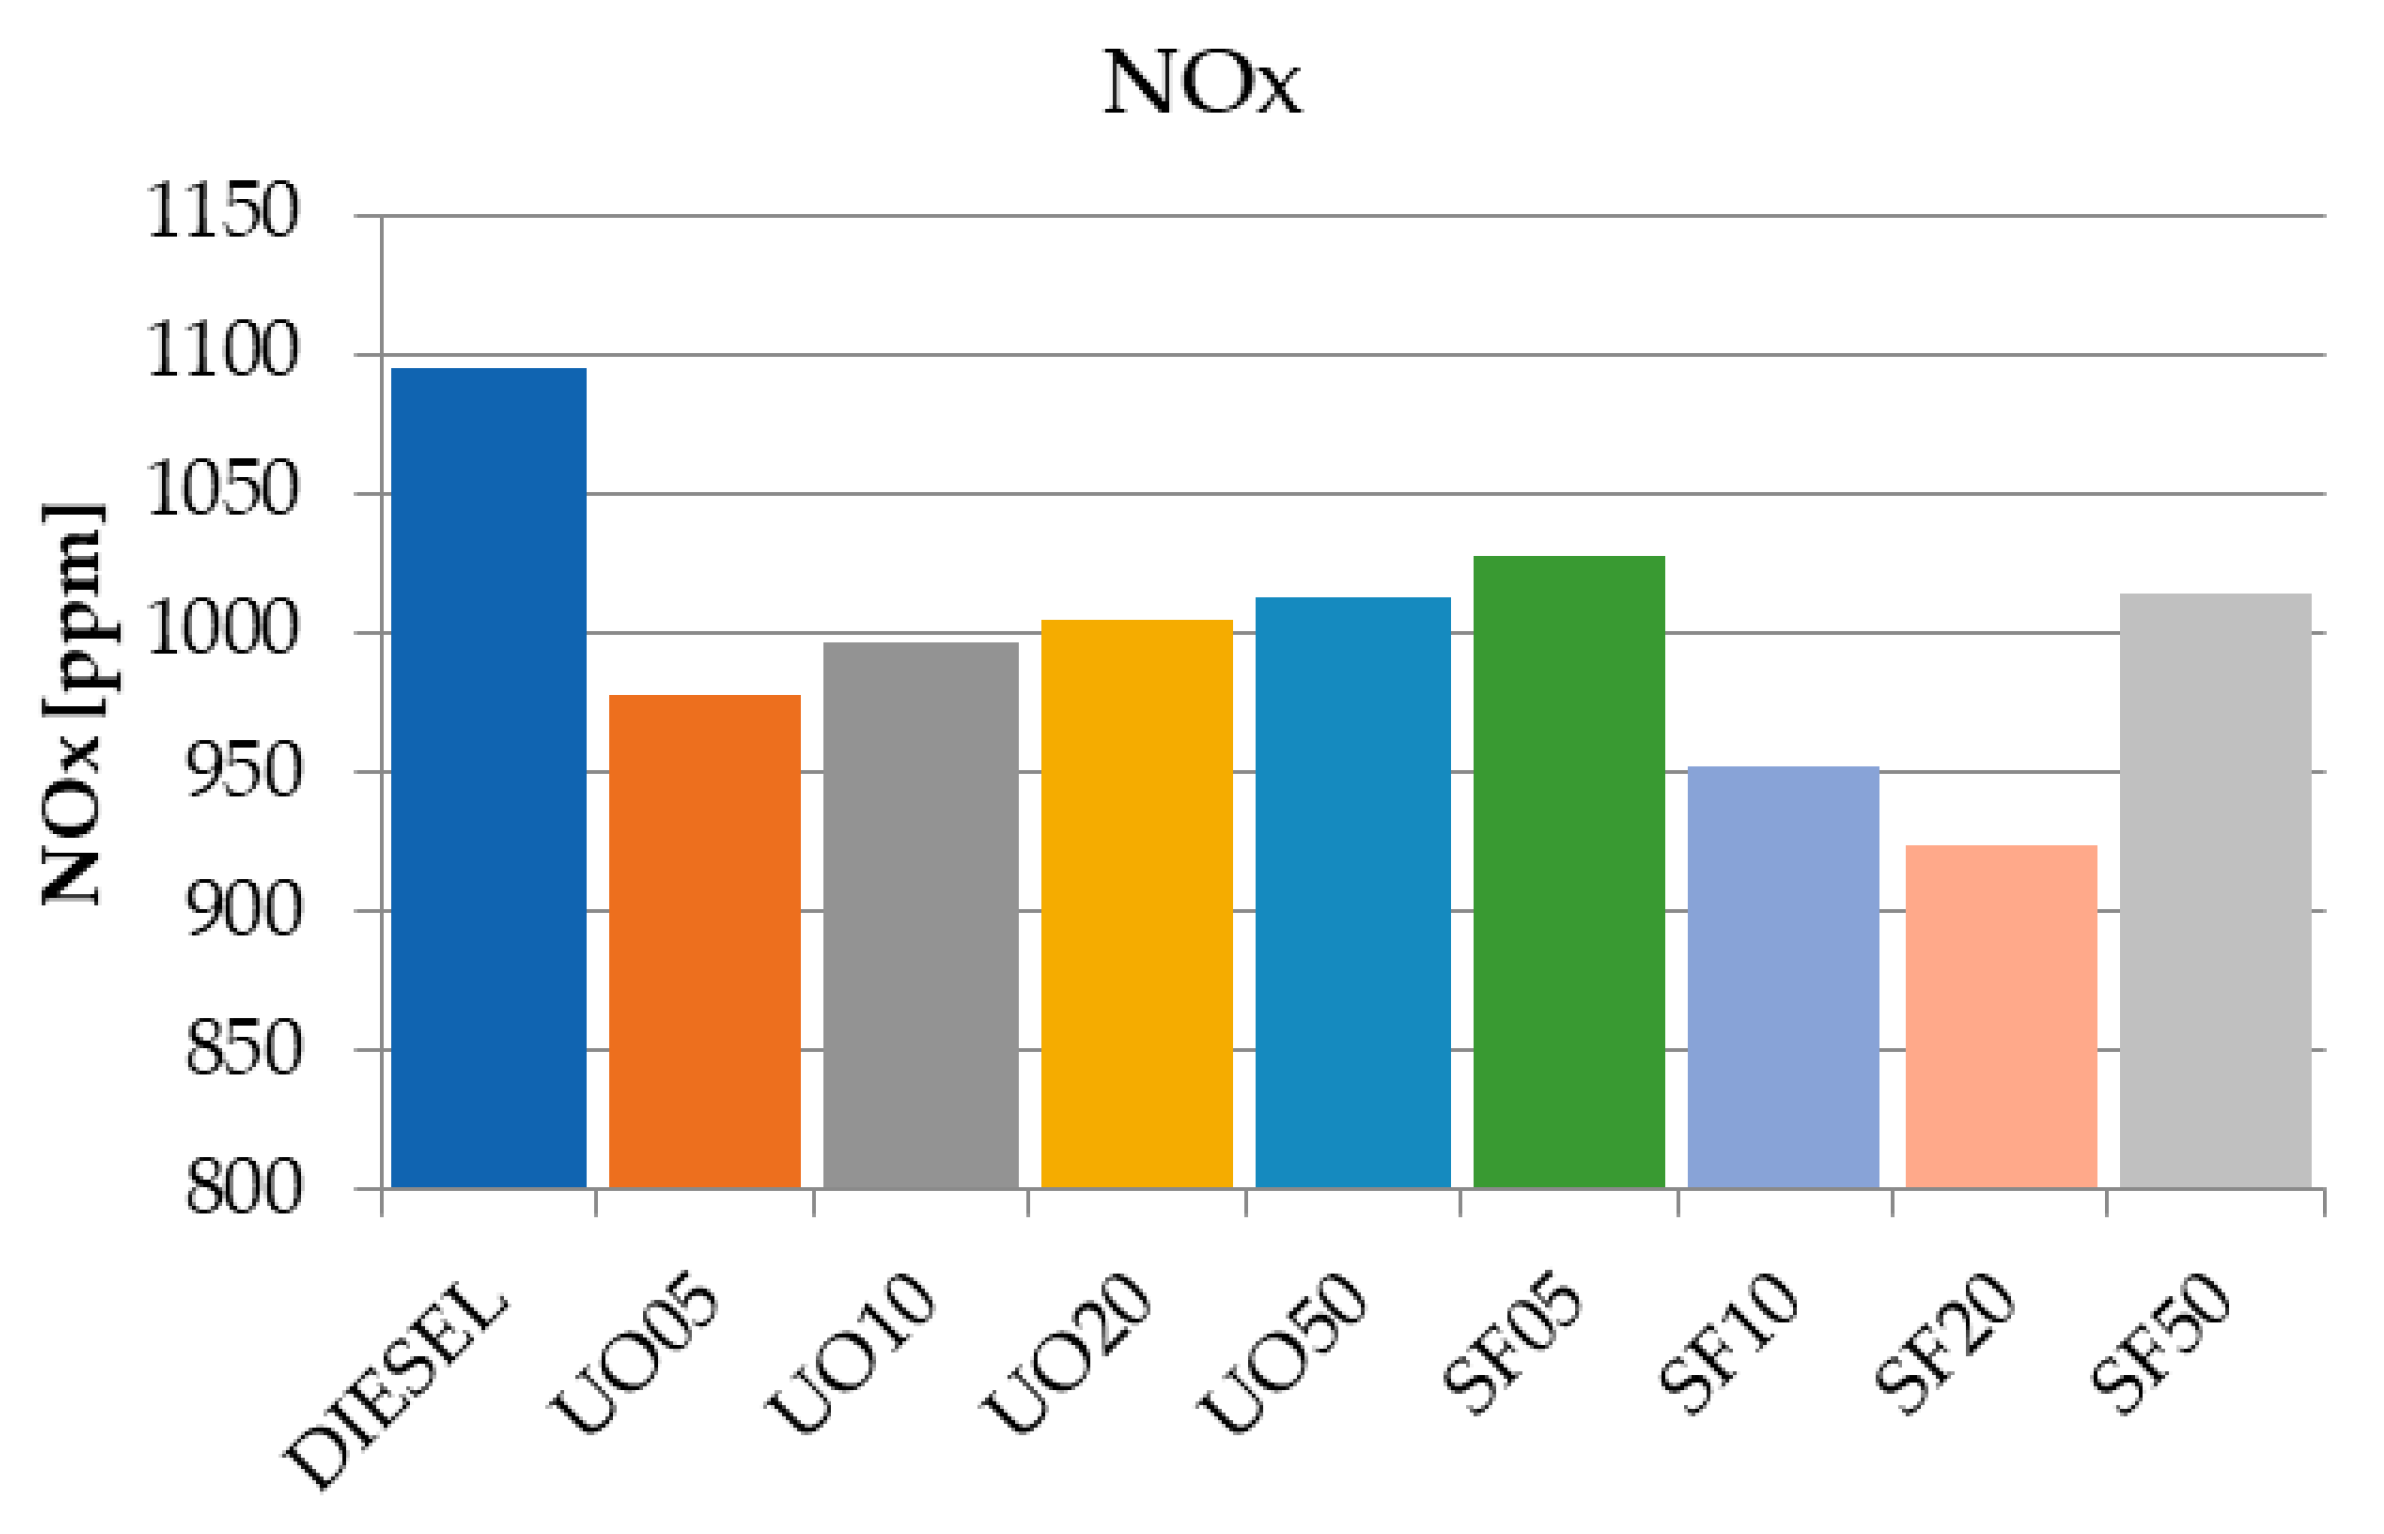
From the analysis of the graph in
Figure 14, it can be observed that NOx emissions at all concentrations of biofuels are lower than those of diesel, with percentage values ranging from 6.21% (SF05) to 15.62% (SF20).
From
Figure 14, it can be seen that NOx emissions increase with the increase in the concentration of biodiesel from UO in the blend and decrease with the concentration of biodiesel from sunflower oil. Mixtures with 50% biofuel recorded similar values, both being lower than diesel. The lower values of nitrogen oxides observed in the case of biofuels compared to diesel indicate that the maximum cycle temperatures were lower in the case of biofuel blends.
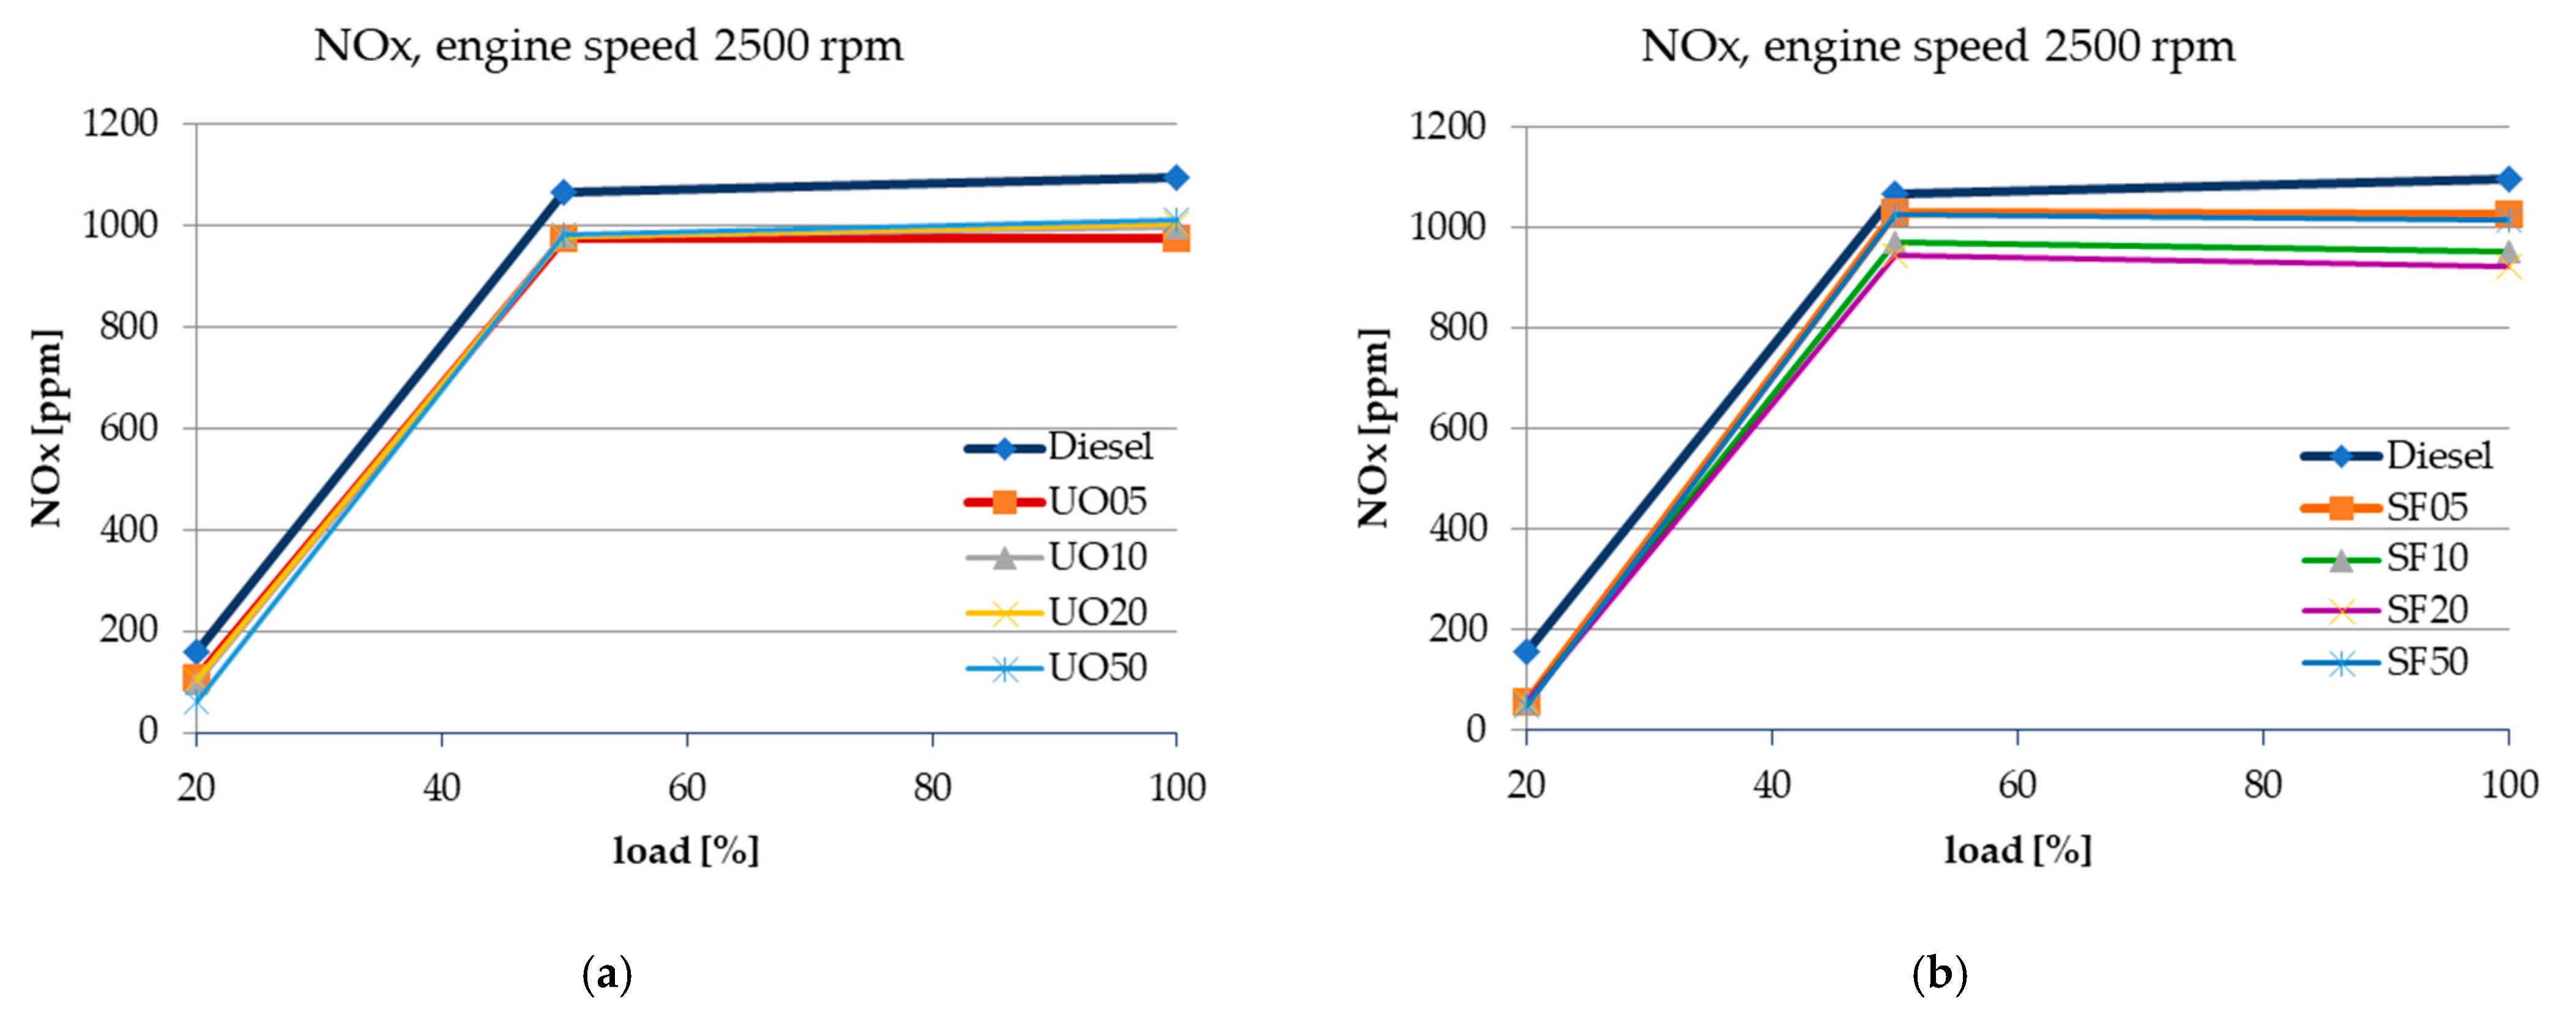
Figure 15 presents NOx emissions for a speed of 2500 rpm, varying the load. It can be observed that for all tested biofuels, these emissions are lower than those for diesel.
As the load increases, so does the pressure and maximum temperature in the combustion chamber, favoring the formation of NOx. This trend is also observed in the graphs presented in
Figure 15.
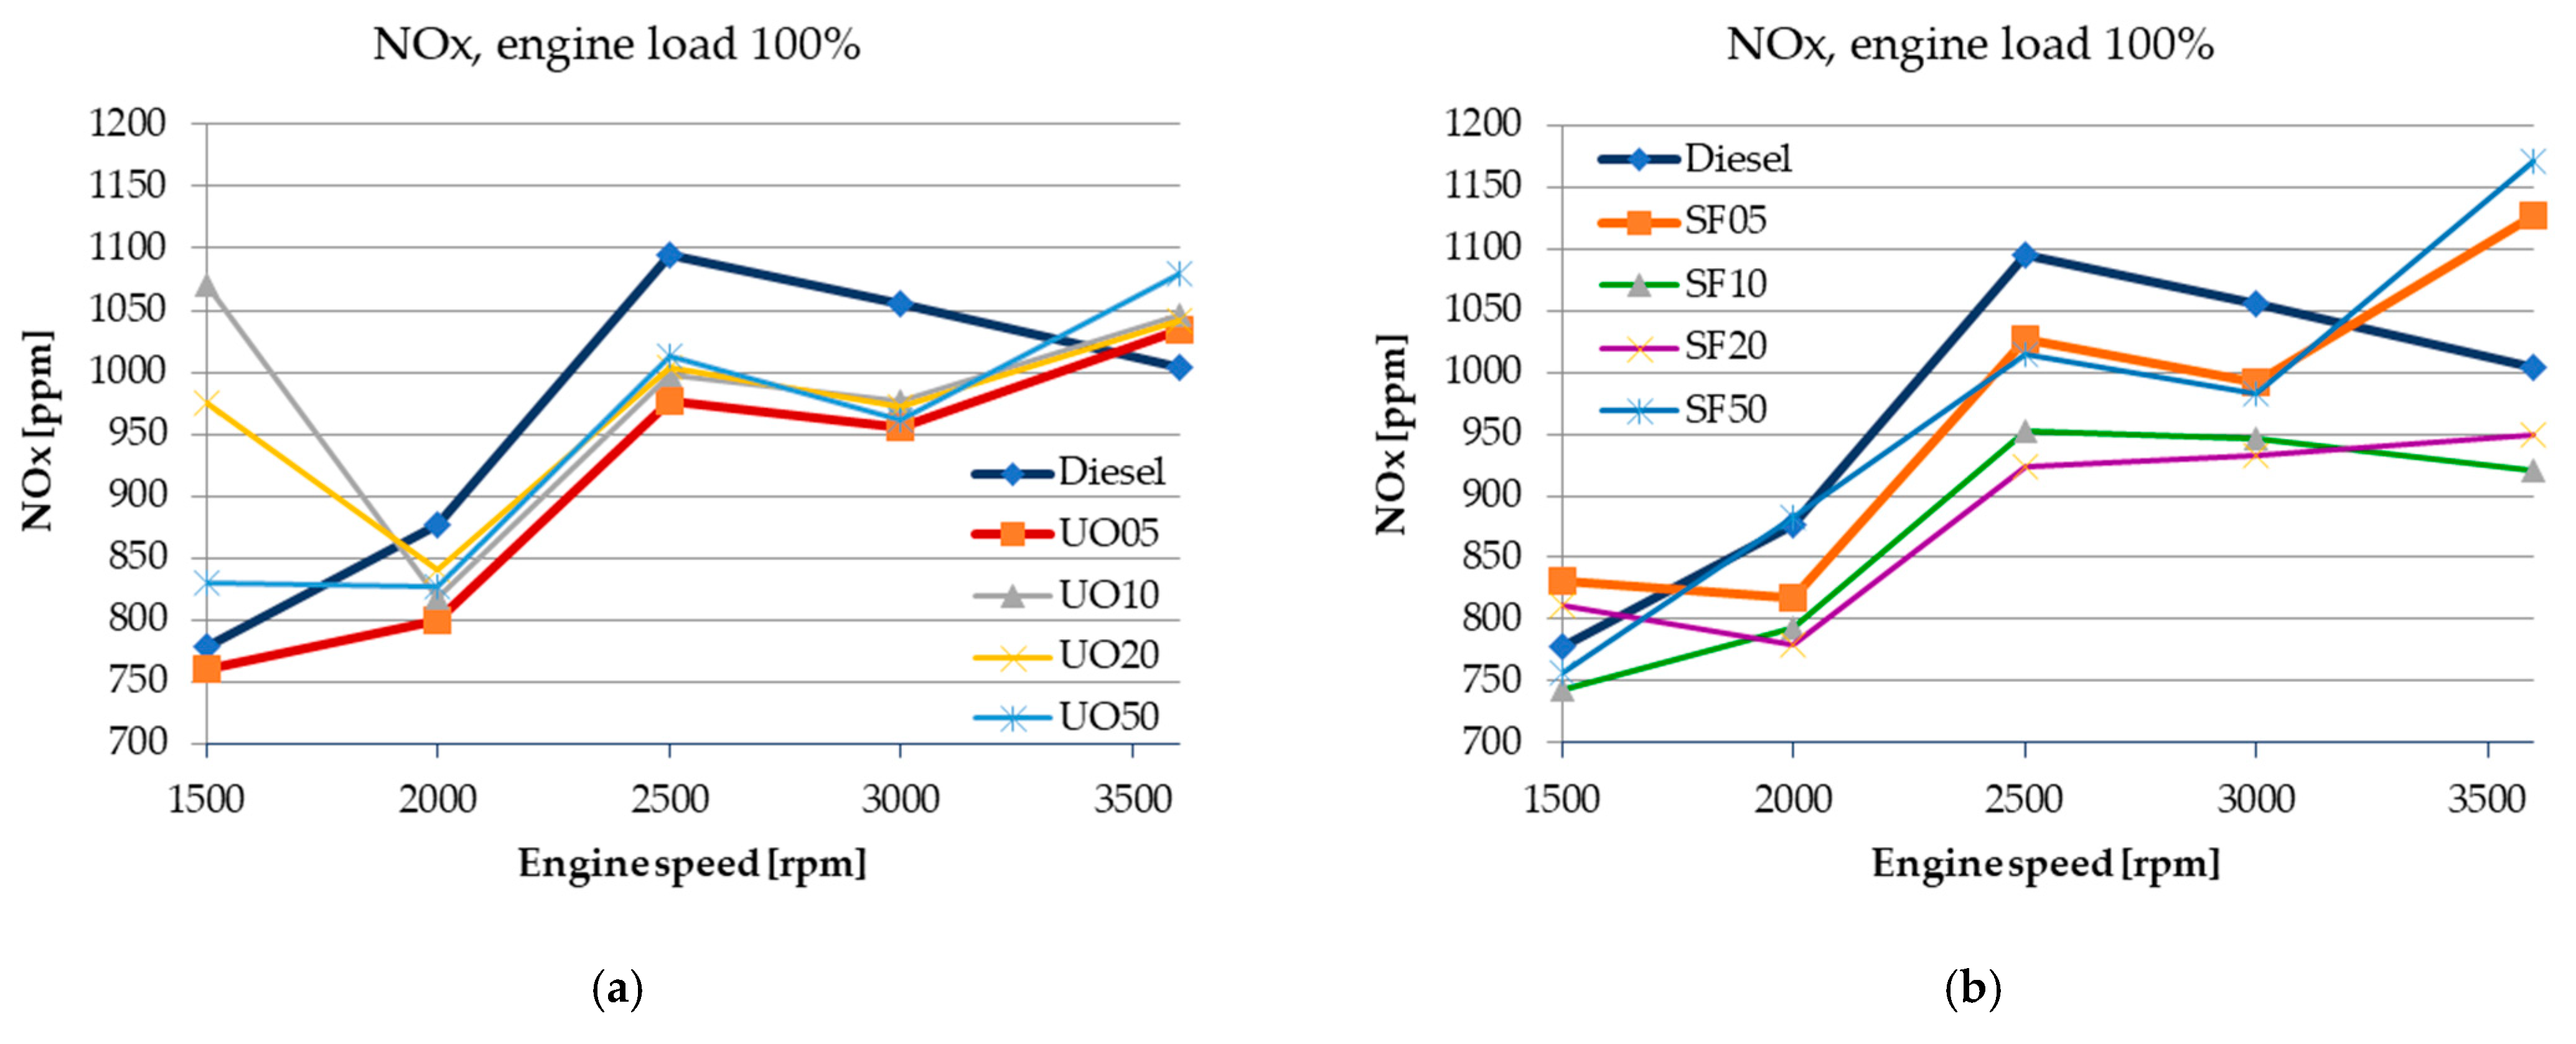
The analysis of NOx emissions at constant load confirms the previously formulated conclusions. Additionally, from
Figure 16, it can be observed that for speeds of 2000, 2500, and 3000 rpm, emissions recorded with alternative fuels are lower than those of diesel. At 3600 rpm, there is an increase in NOx emissions by 12% for SF05 and by 16.63% for SF50. For fuel UO, all concentrations were above the diesel value, ranging from 2 to 7%.
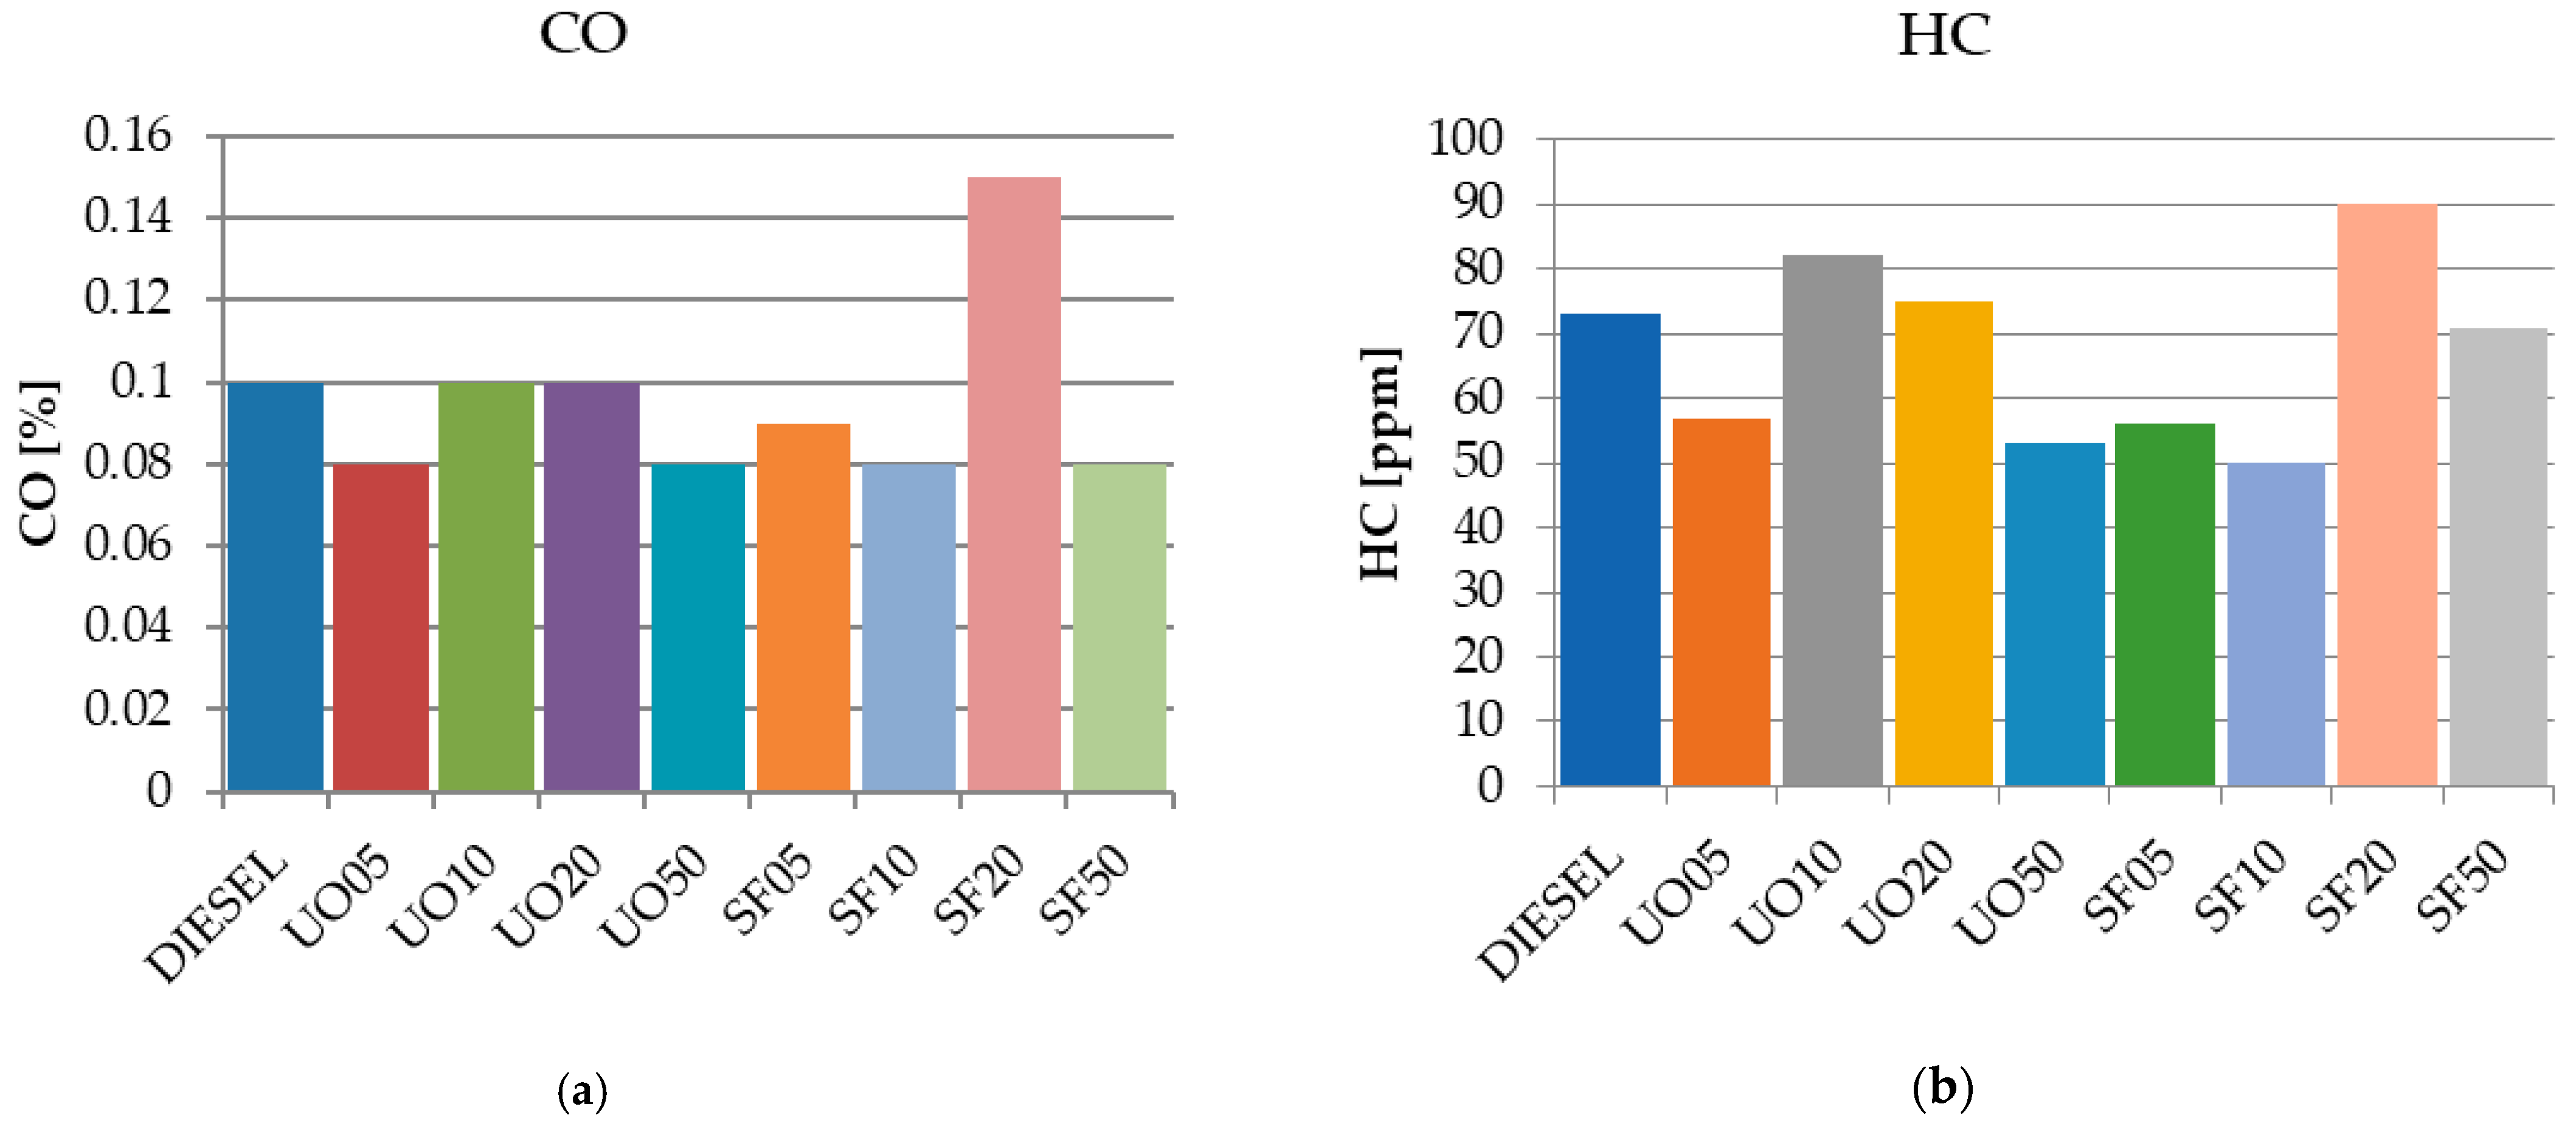
The graphs in
Figure 17 show the variation of CO and HC emissions. Apart from fuel SF20, which records a 50% increase in CO emissions compared to diesel, the other fuels register lower values than diesel, up to 20%, demonstrating good mixture formation. Also, in the case of HC, the same fuel, SF20, records an increase of 23.29% compared to diesel. Overall, from the data analysis presented in
Figure 14 and
Figure 17, it can be observed that the emissions of NOx, CO, and HC of the tested biofuels are generally lower than those recorded in the case of diesel.
Oxygen in biodiesel mixtures shows a decrease of NOx and CO values, compared with diesel, as shown in
Figure 14 and
Figure 17. Fuels with higher oxygen contents, like biodiesel, enhance combustion efficiency by promoting more complete oxidation of carbon.
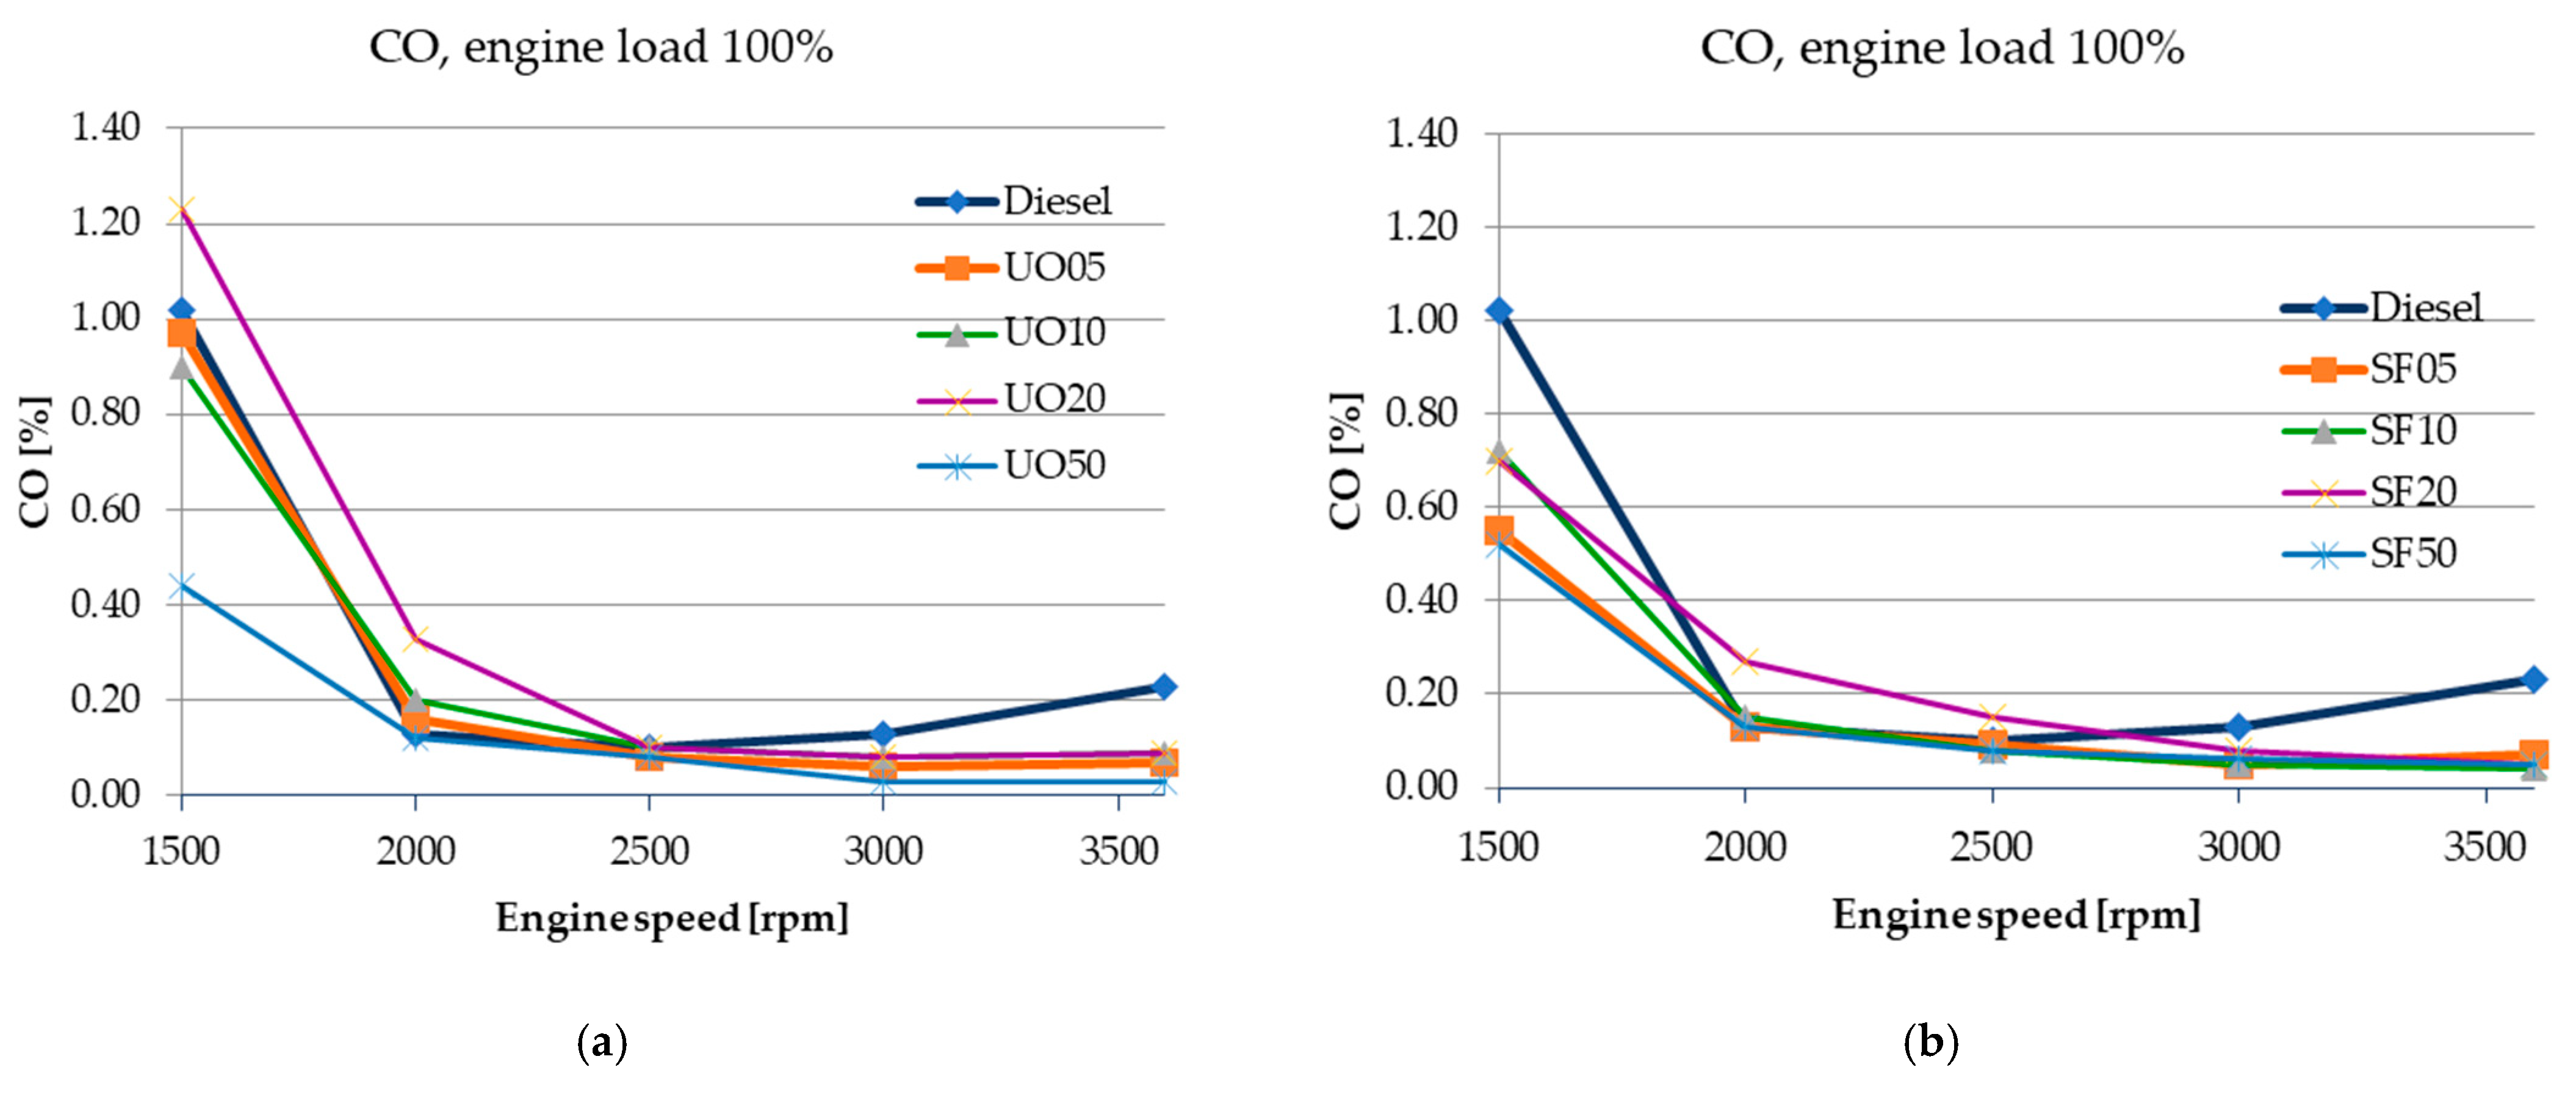
Carbon monoxide, shown in
Figure 18, is generated due to localized oxygen deficiency, low temperatures in the combustion chamber, and insufficient time for complete combustion reactions, making it a product of incomplete combustion. In general, a higher cetane number, better mixture formation due to lower viscosity, and density characteristics favoring fuel vaporization lead to a lower delay in autoignition and consequently lower CO emissions.
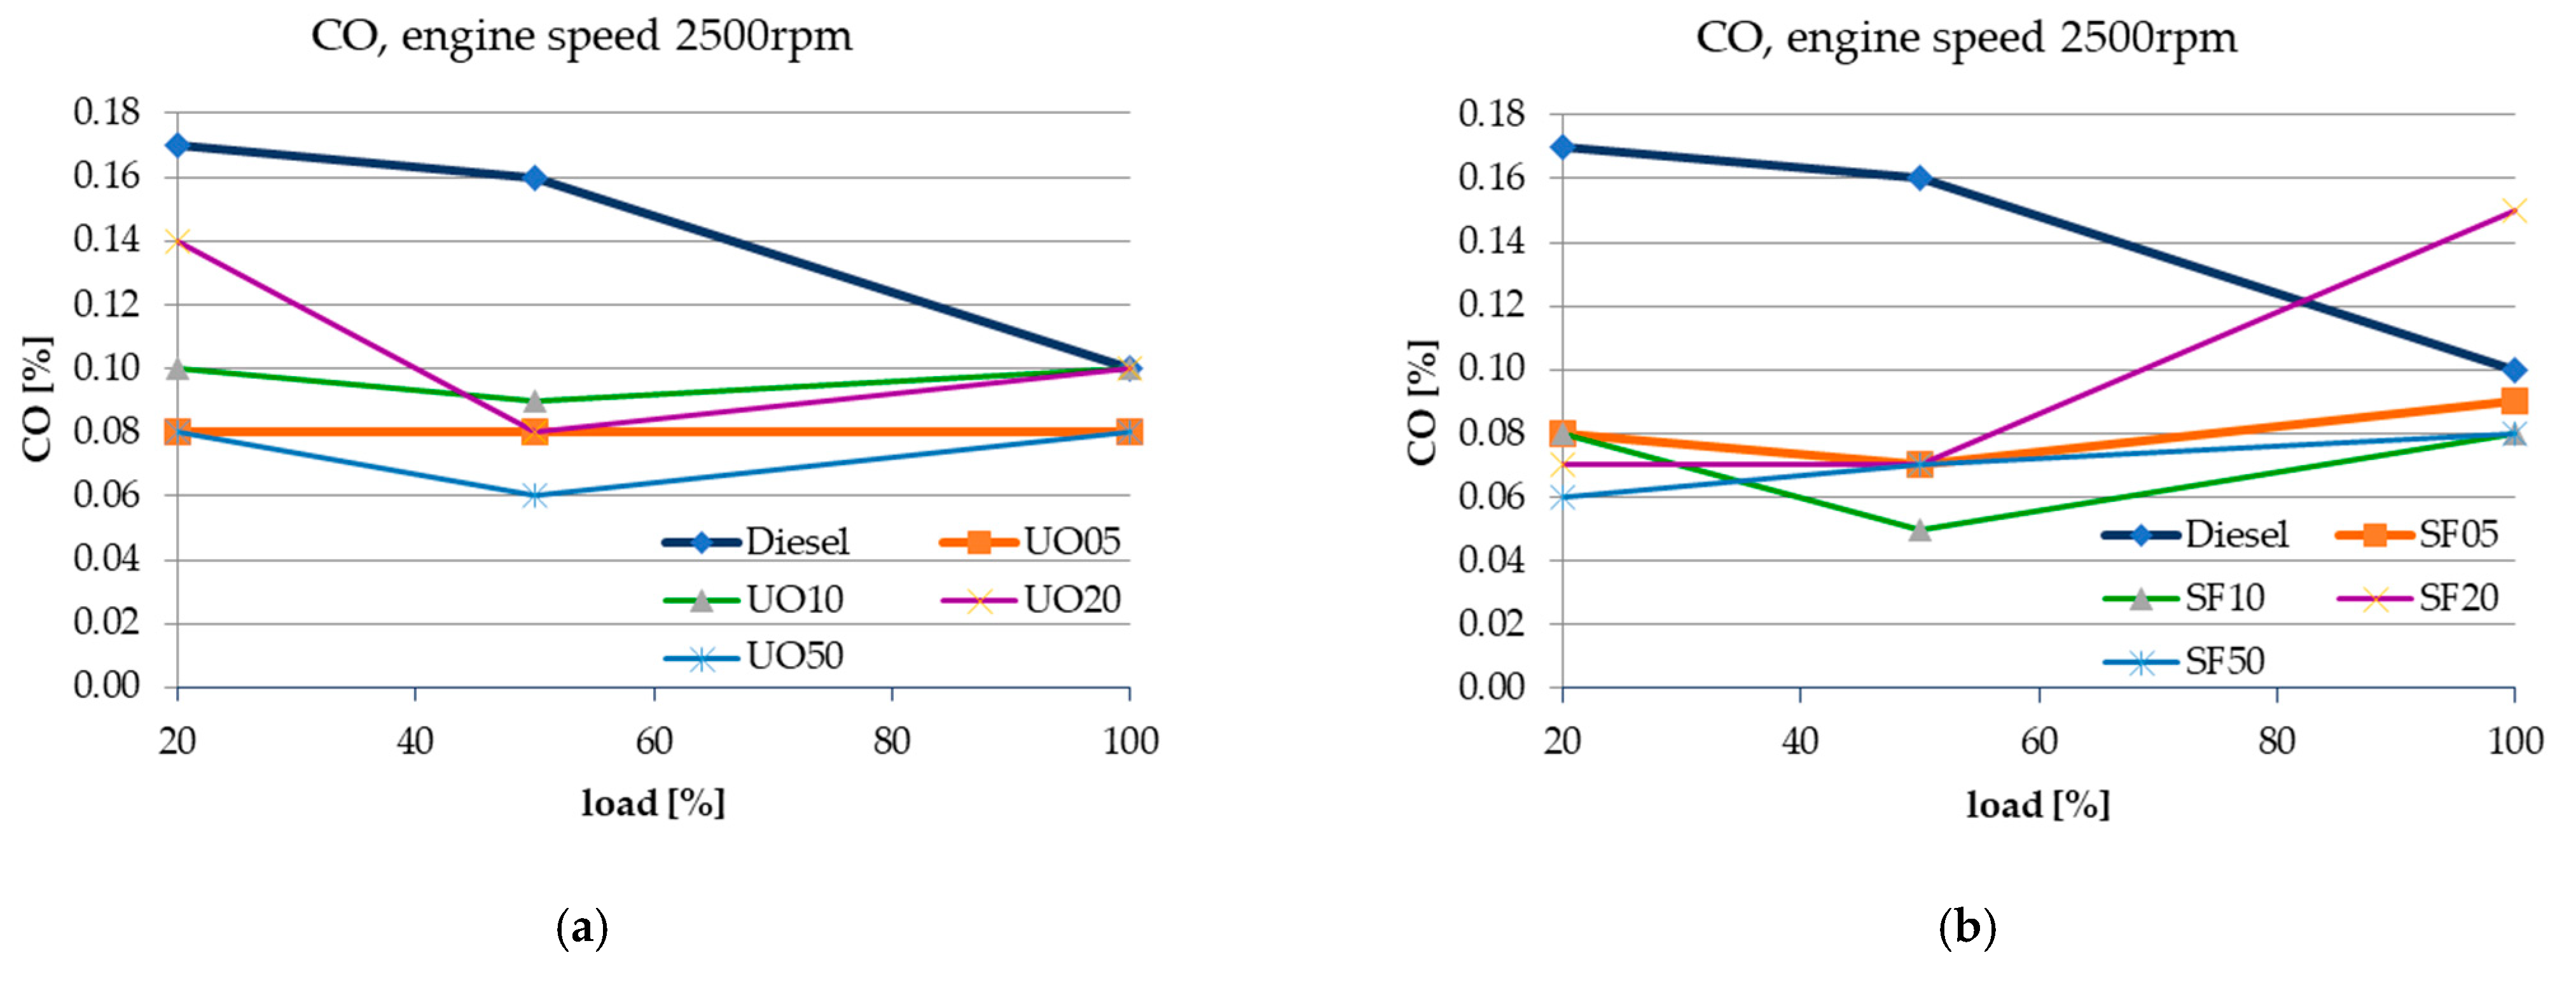
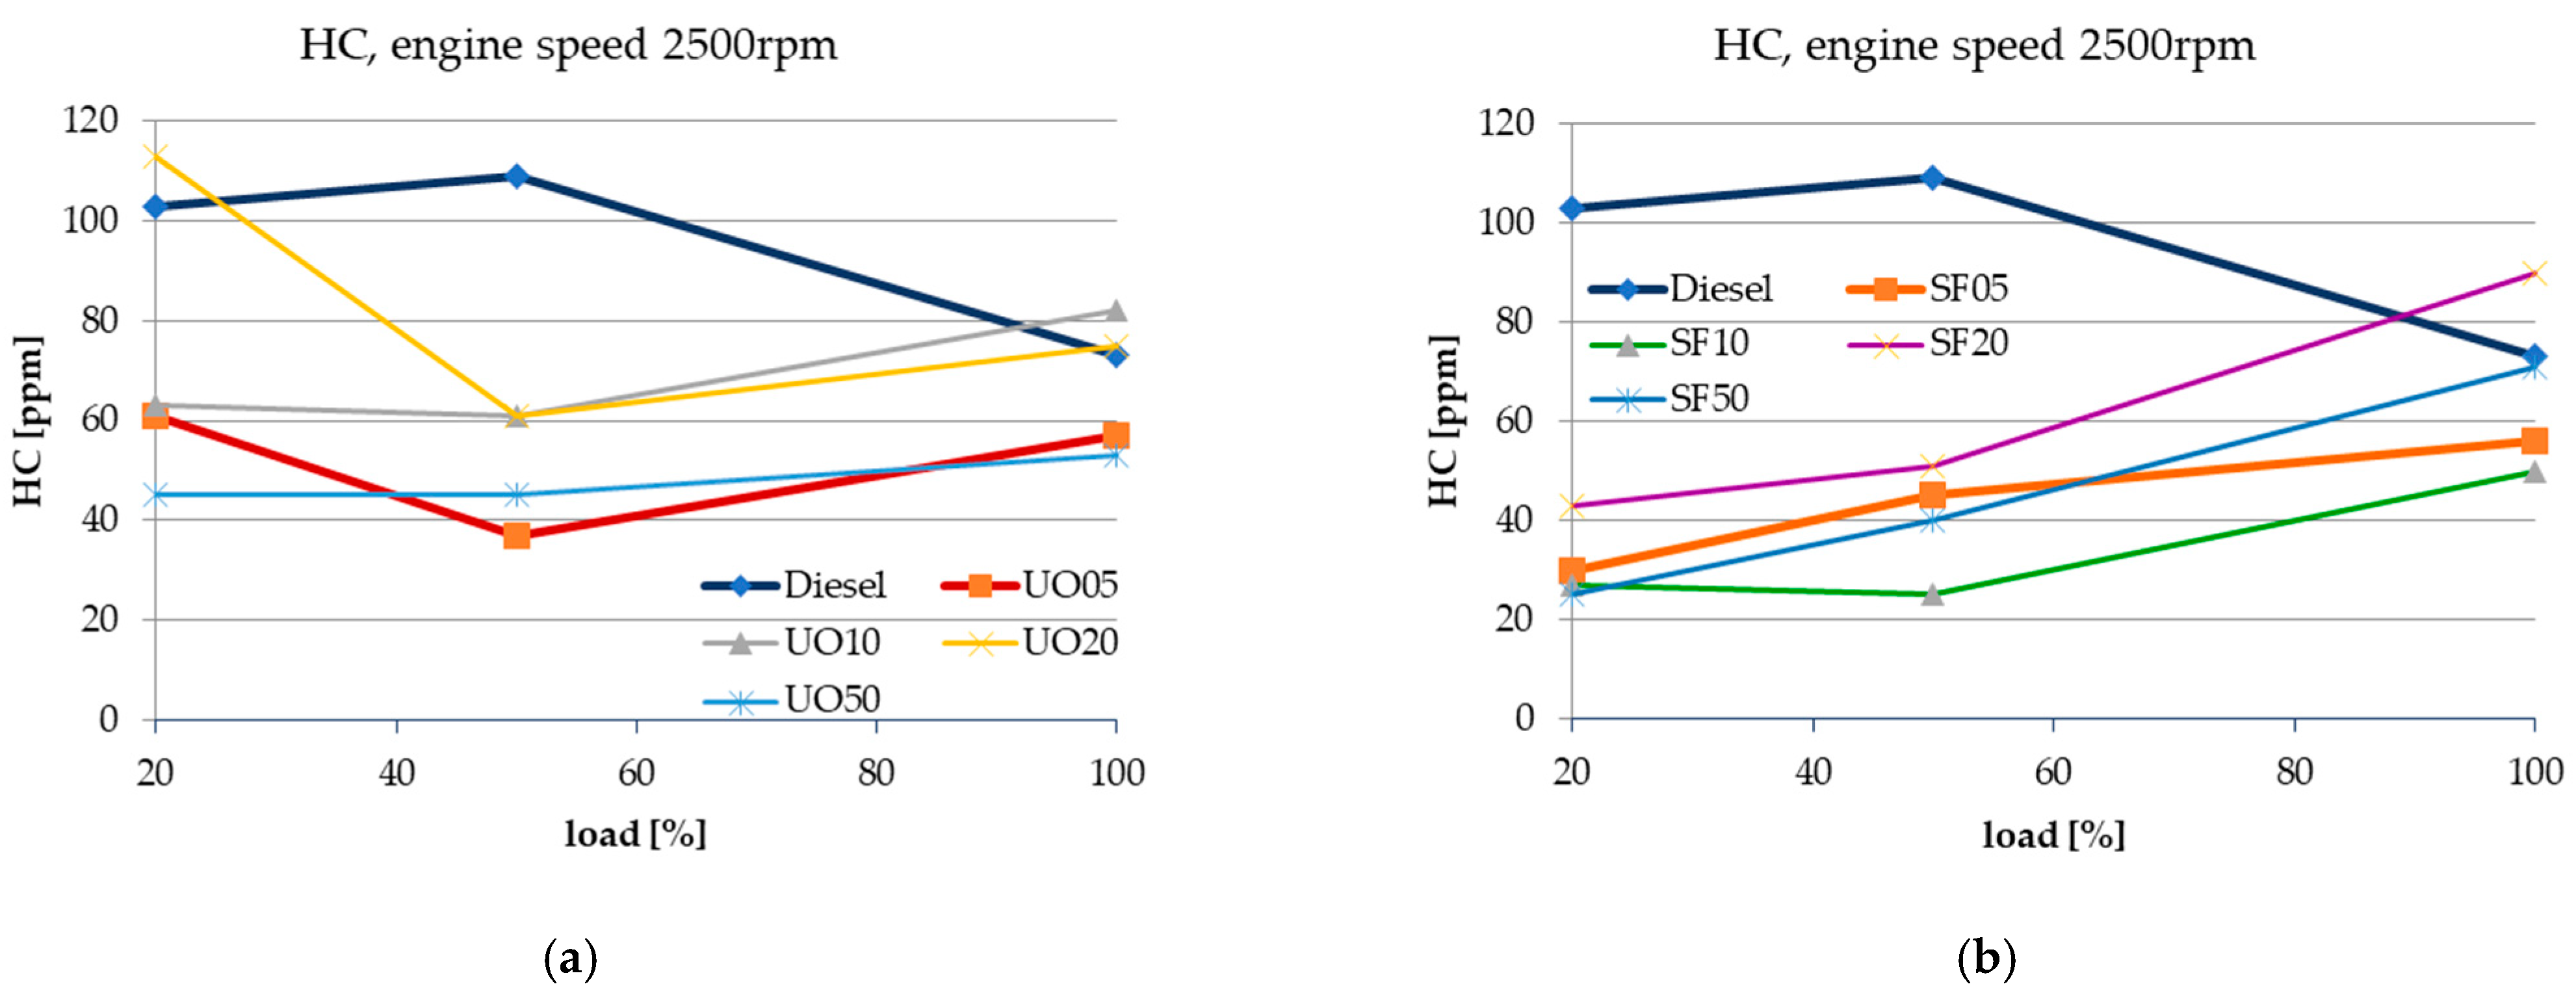
The analysis conducted at a constant speed proved that the emissions of CO and HC for the 2500 rpm engine speed point are lower for all tested fuels compared to diesel, as displayed in
Figure 19 and
Figure 20. Furthermore, from these figures, it can be stated that CO and HC emissions decrease with increasing engine speed, in both cases being lower than the values recorded for diesel.
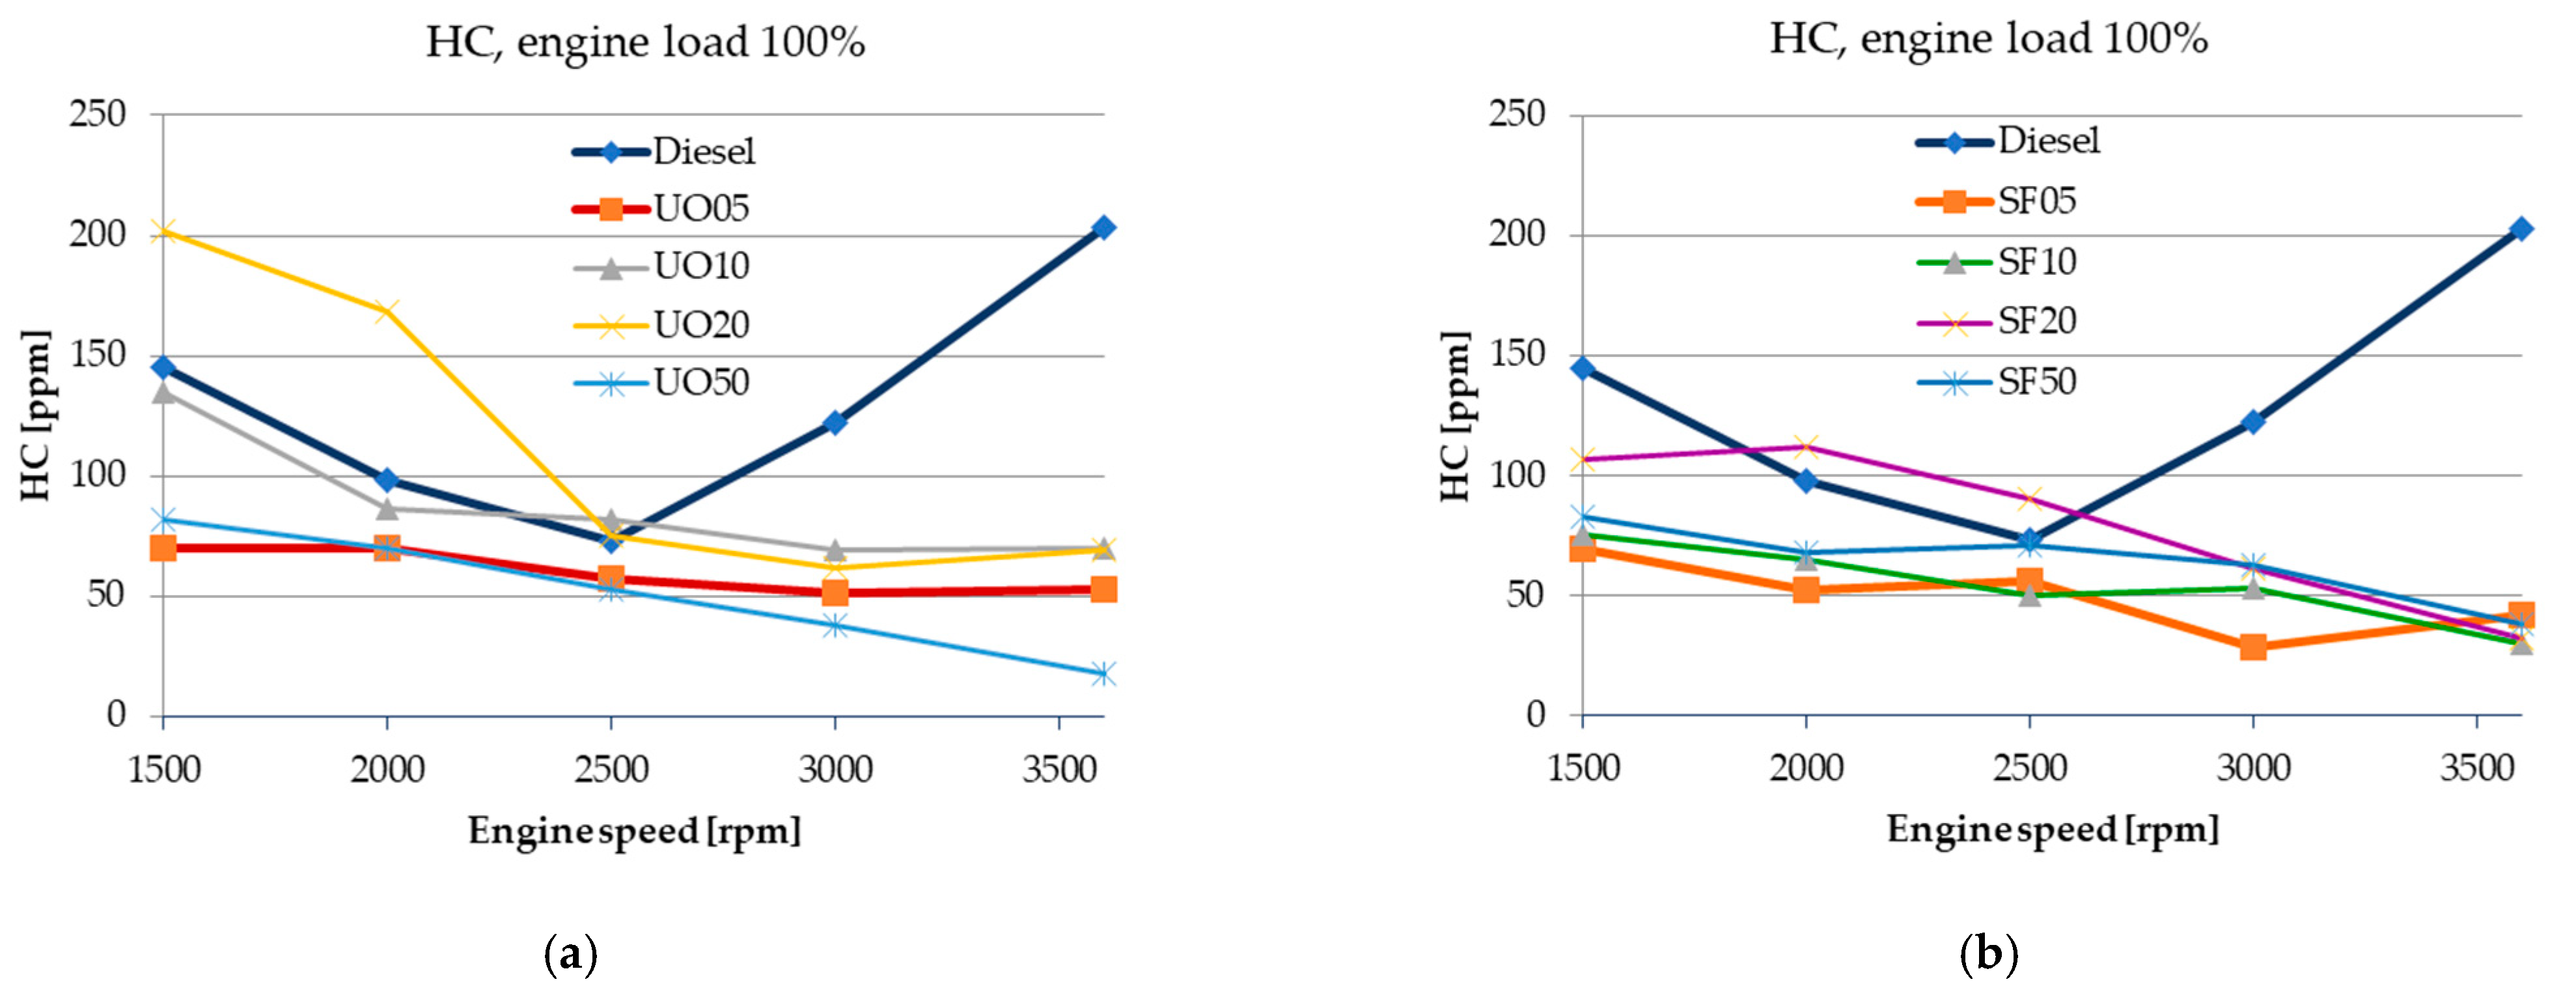
As observed in
Figure 20, at high loads, areas with a rich fuel mixture are formed in the fuel jet, where fresh air penetrates more slowly, generating higher HC emissions compared to low loads.
The hydrocarbon emissions from exhaust gases (displayed in
Figure 21) are determined by the poor propagation of the fuel-air mixture flame front. When fuel droplets reach the walls of the combustion chamber due to incomplete combustion, they undergo slow chemical transformations that lead to the formation of hydrocarbons.
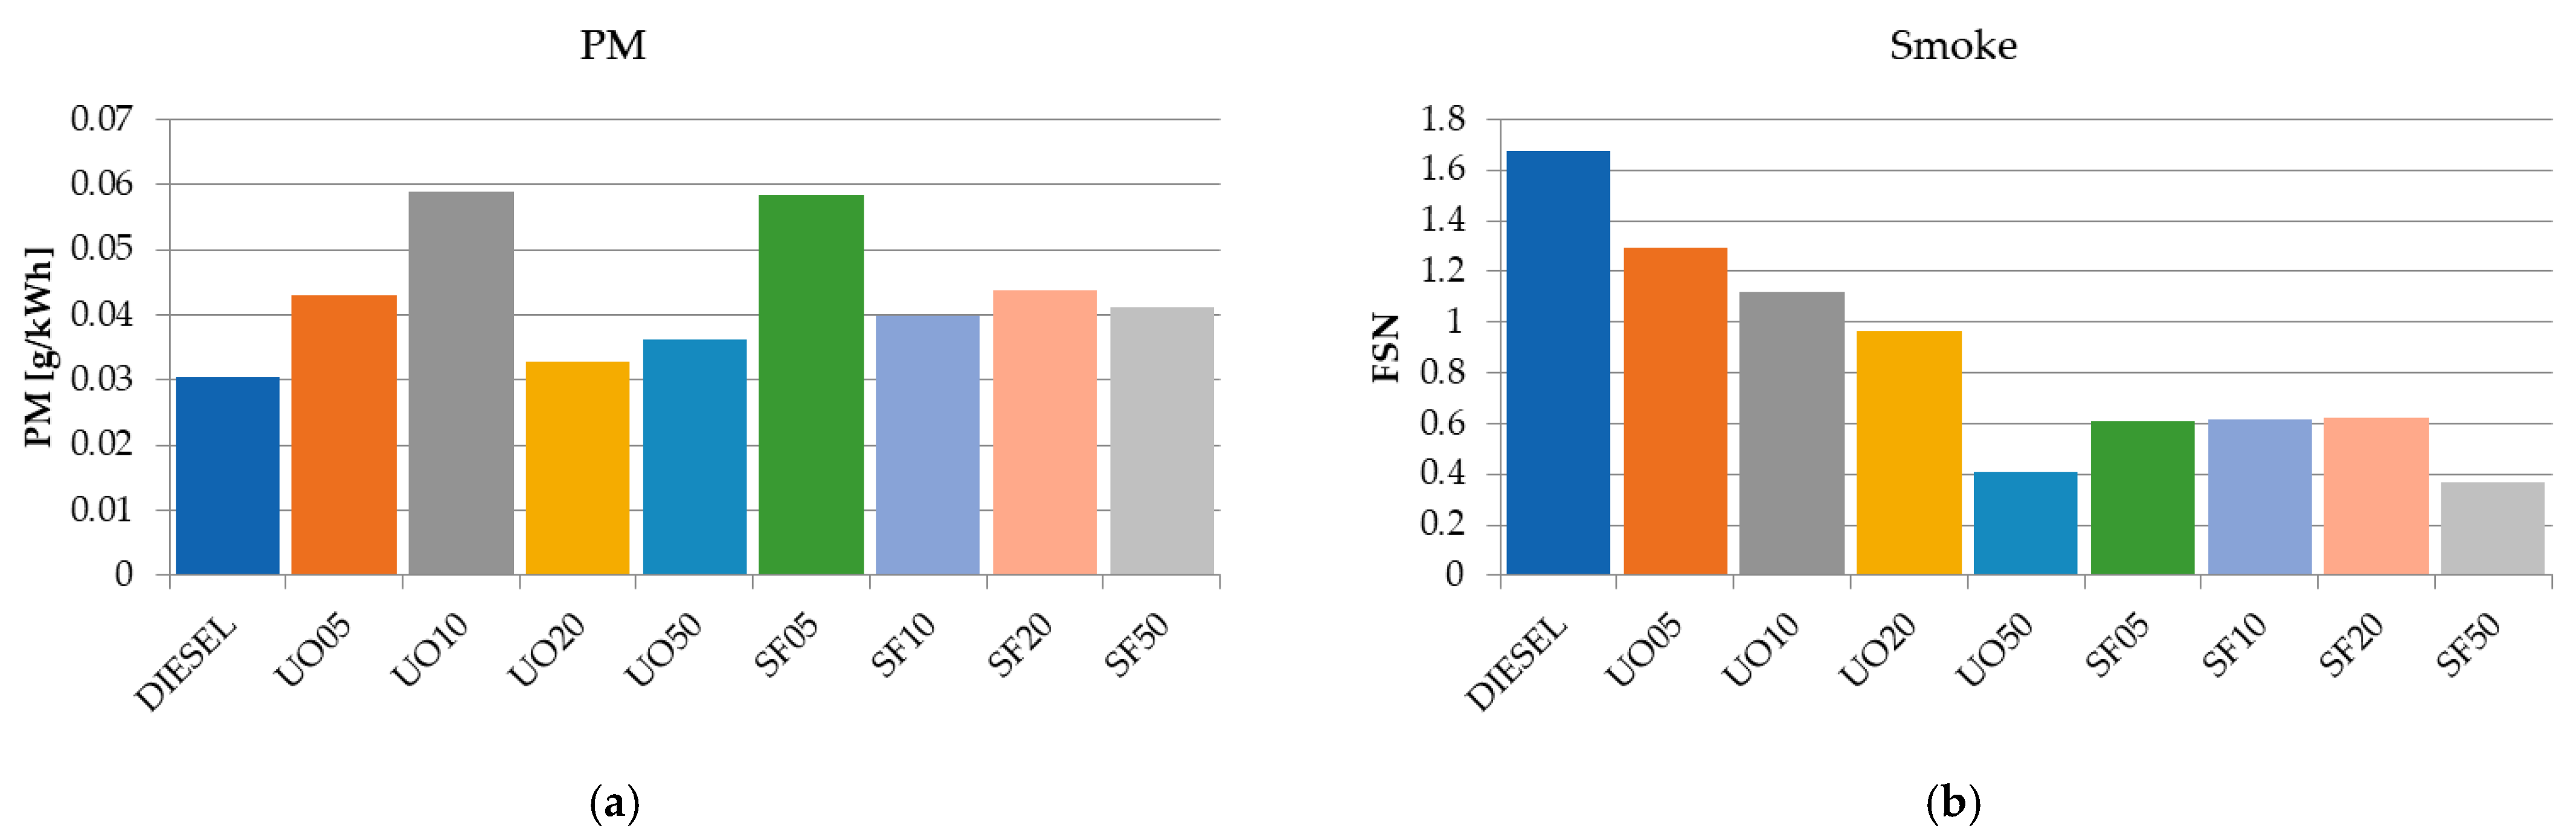
Regarding particle emissions,
Figure 22 presents measurements conducted with two different devices: an AVL SmokeMeter for determining the soot content (FSN) and a Horiba MDLT microdilution tunnel for determining particle mass.
Particle formation in compression ignition engines is linked to incomplete combustion in certain areas of the combustion chamber due to insufficient time for the formation of a homogeneous fuel-air mixture. Particles are formed from aggregates of spherical carbon particles and volatile substances, including hydrocarbons and sulfates.
Fuels with higher aromatic contents tend to increase soot and PM emissions and to potentially increase NOx emissions due to higher combustion temperatures. They may also contribute to higher HC and CO emissions because of incomplete combustion. The presence of higher polyaromatic contents in diesel fuel generally results in higher PM emissions and lower combustion efficiency.
Fuels that present a high viscosity can affect the atomization (spray pattern) of the fuel during injection. Poor atomization can lead to inefficient combustion, potentially increasing emissions of PM compared to diesel
From analyzing these data, it can be observed that regarding the soot content, the emissions from biofuels are lower compared to diesel. Moreover, there is a significant difference between the two types of alternative fuels at concentrations of 5%, 10%, and 20%. Thus, differences ranging from 22.93% (UO05) to 78.21% (SF50) compared to diesel are observed, with the highest value recorded for UO05, and the lowest values compared to diesel observed for the fuels UO50 and SF50 (75.46% and 78.21%, respectively). On the other hand, the particle mass shows an uneven trend depending on the fuel, suggesting that the differences stem from the chemical composition of the fuels.
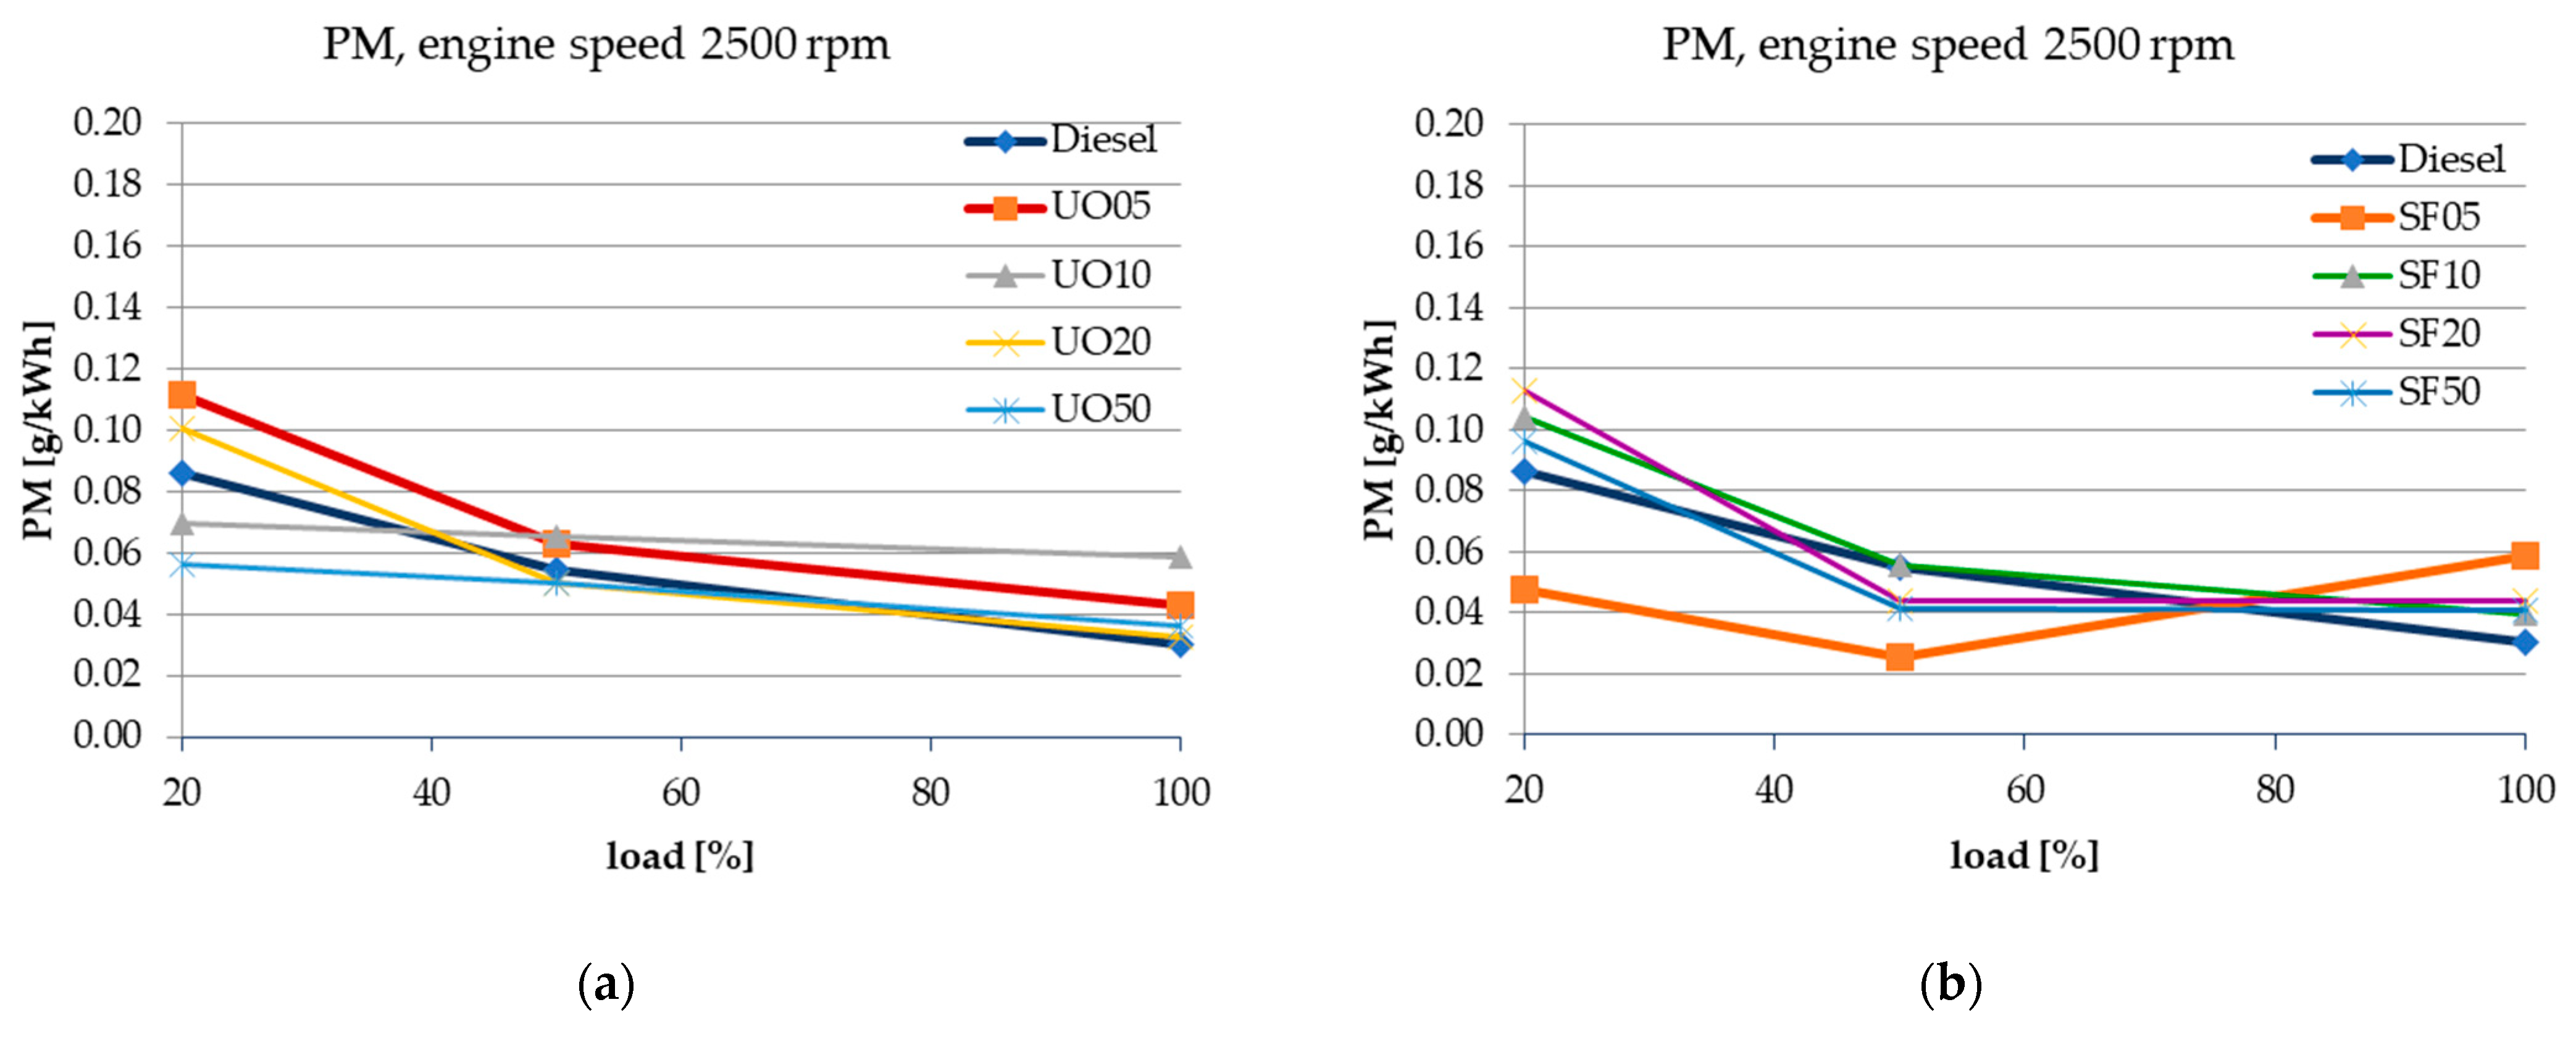
As observed in
Figure 23, as the load increases, the measured PM values for biofuels are close to diesel.
In general, there are three reasons leading to lower particle emissions when using biodiesel. Firstly, the delayed autoignition associated with biodiesel results in a longer period for soot oxidation. Secondly, the higher oxygen content in biodiesel allows for more complete combustion and assists in the oxidation of already formed soot. Thirdly, the absence of polycyclic aromatics in biodiesel composition reduces soot formation.
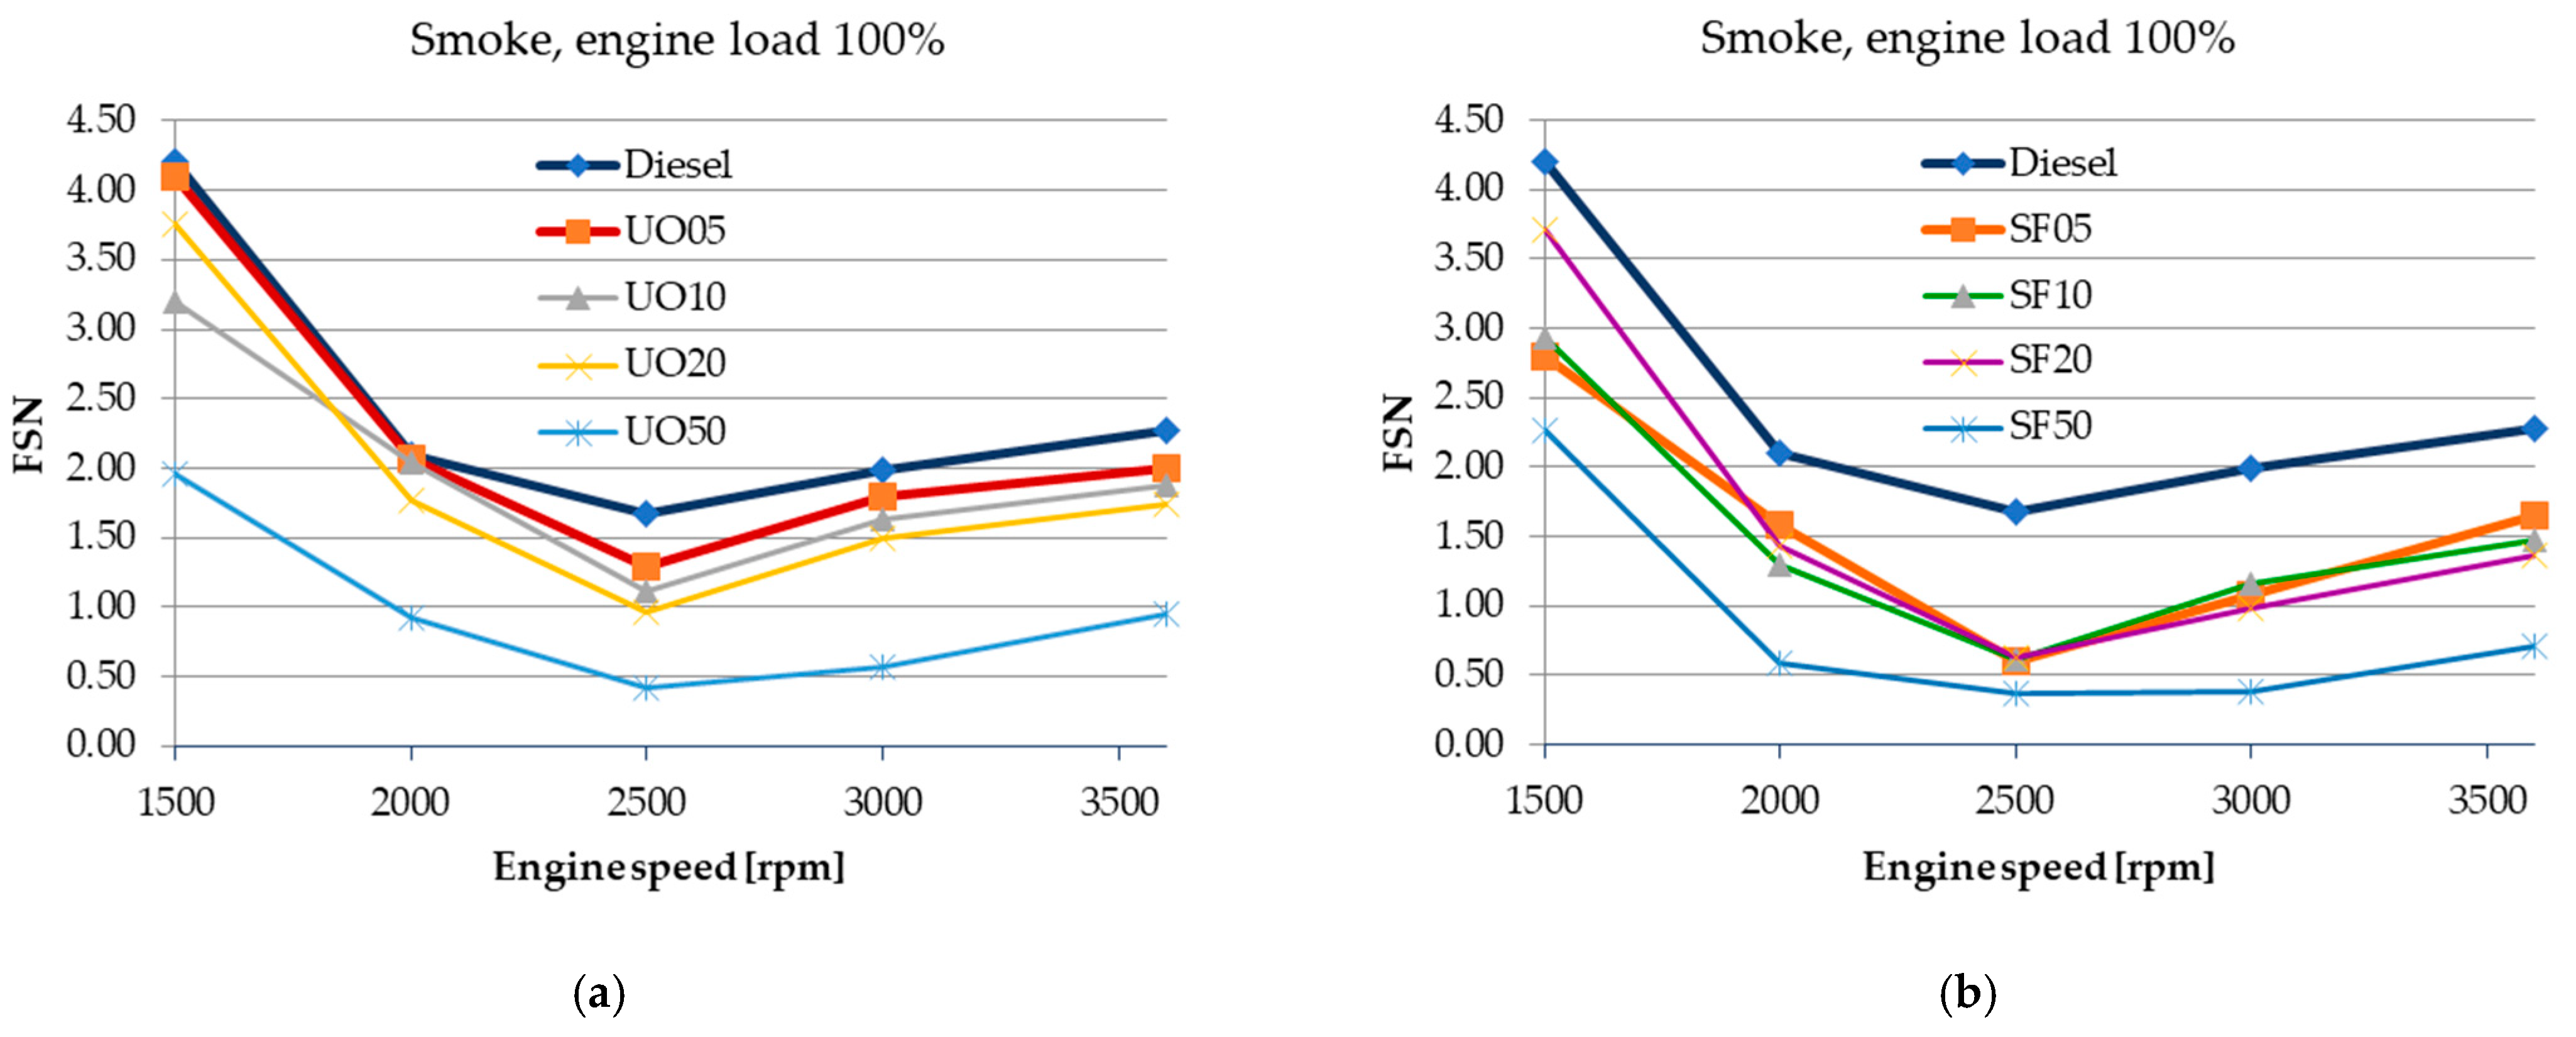
From the analysis of the data presented in
Figure 24, the uneven nature of particle mass depending on engine speed is confirmed, but with a very clear trend in the case of the FSN. For both types of fuels, lower values are recorded compared to diesel fuel. The lowest values (approximately 70% lower across the entire rpm range) are recorded for 50% biofuel concentrations in the blend, correlated with the lower energy efficiency of these fuels as well.
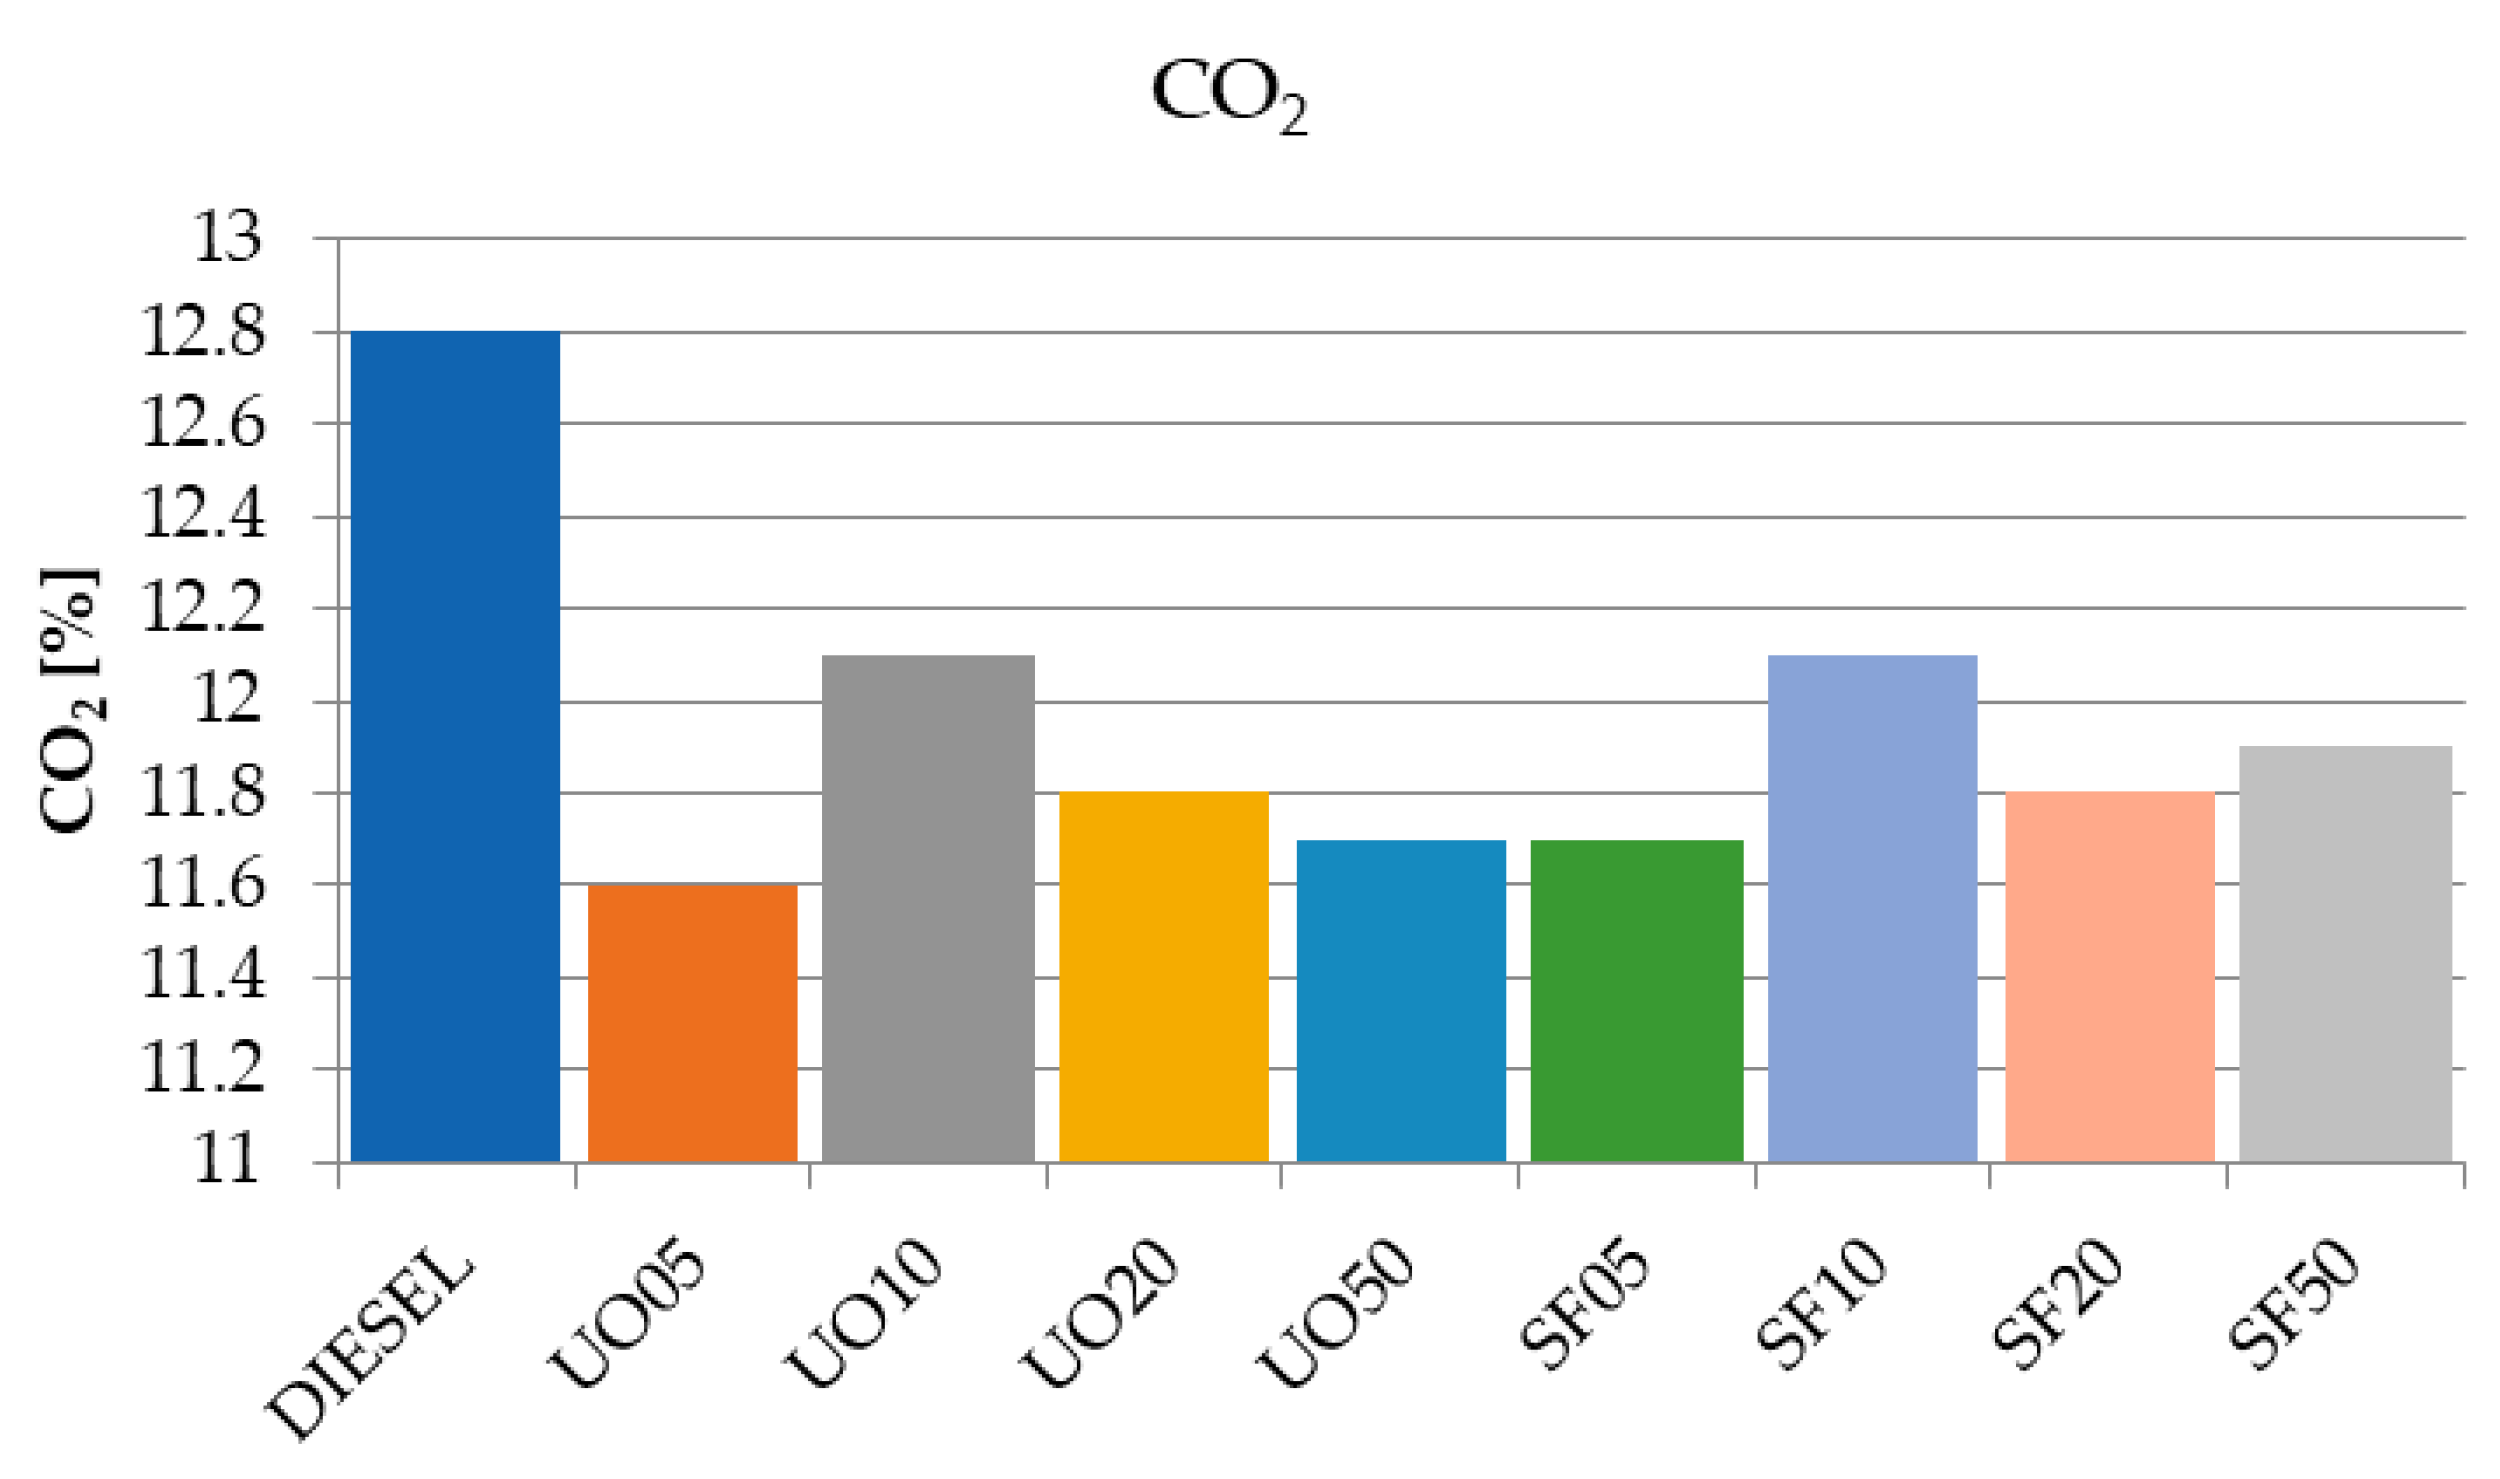
CO2 emissions do not directly affect health but are one of the components of greenhouse gases. In compression ignition engines, CO2 emissions are directly proportional to the amount of fuel injected into the cylinder, and therefore to the load.
As can be seen from
Figure 25, CO
2 emissions are also lower in the tested biofuels compared to diesel. The emissions show similar trends for both types of fuels. The lowest values are presented by fuels with a concentration of 5%. Specifically, for UO05, the value is lower by 9.38% than the value for diesel, while for SF05, the CO
2 emissions are 8.59% lower than in the case of diesel.
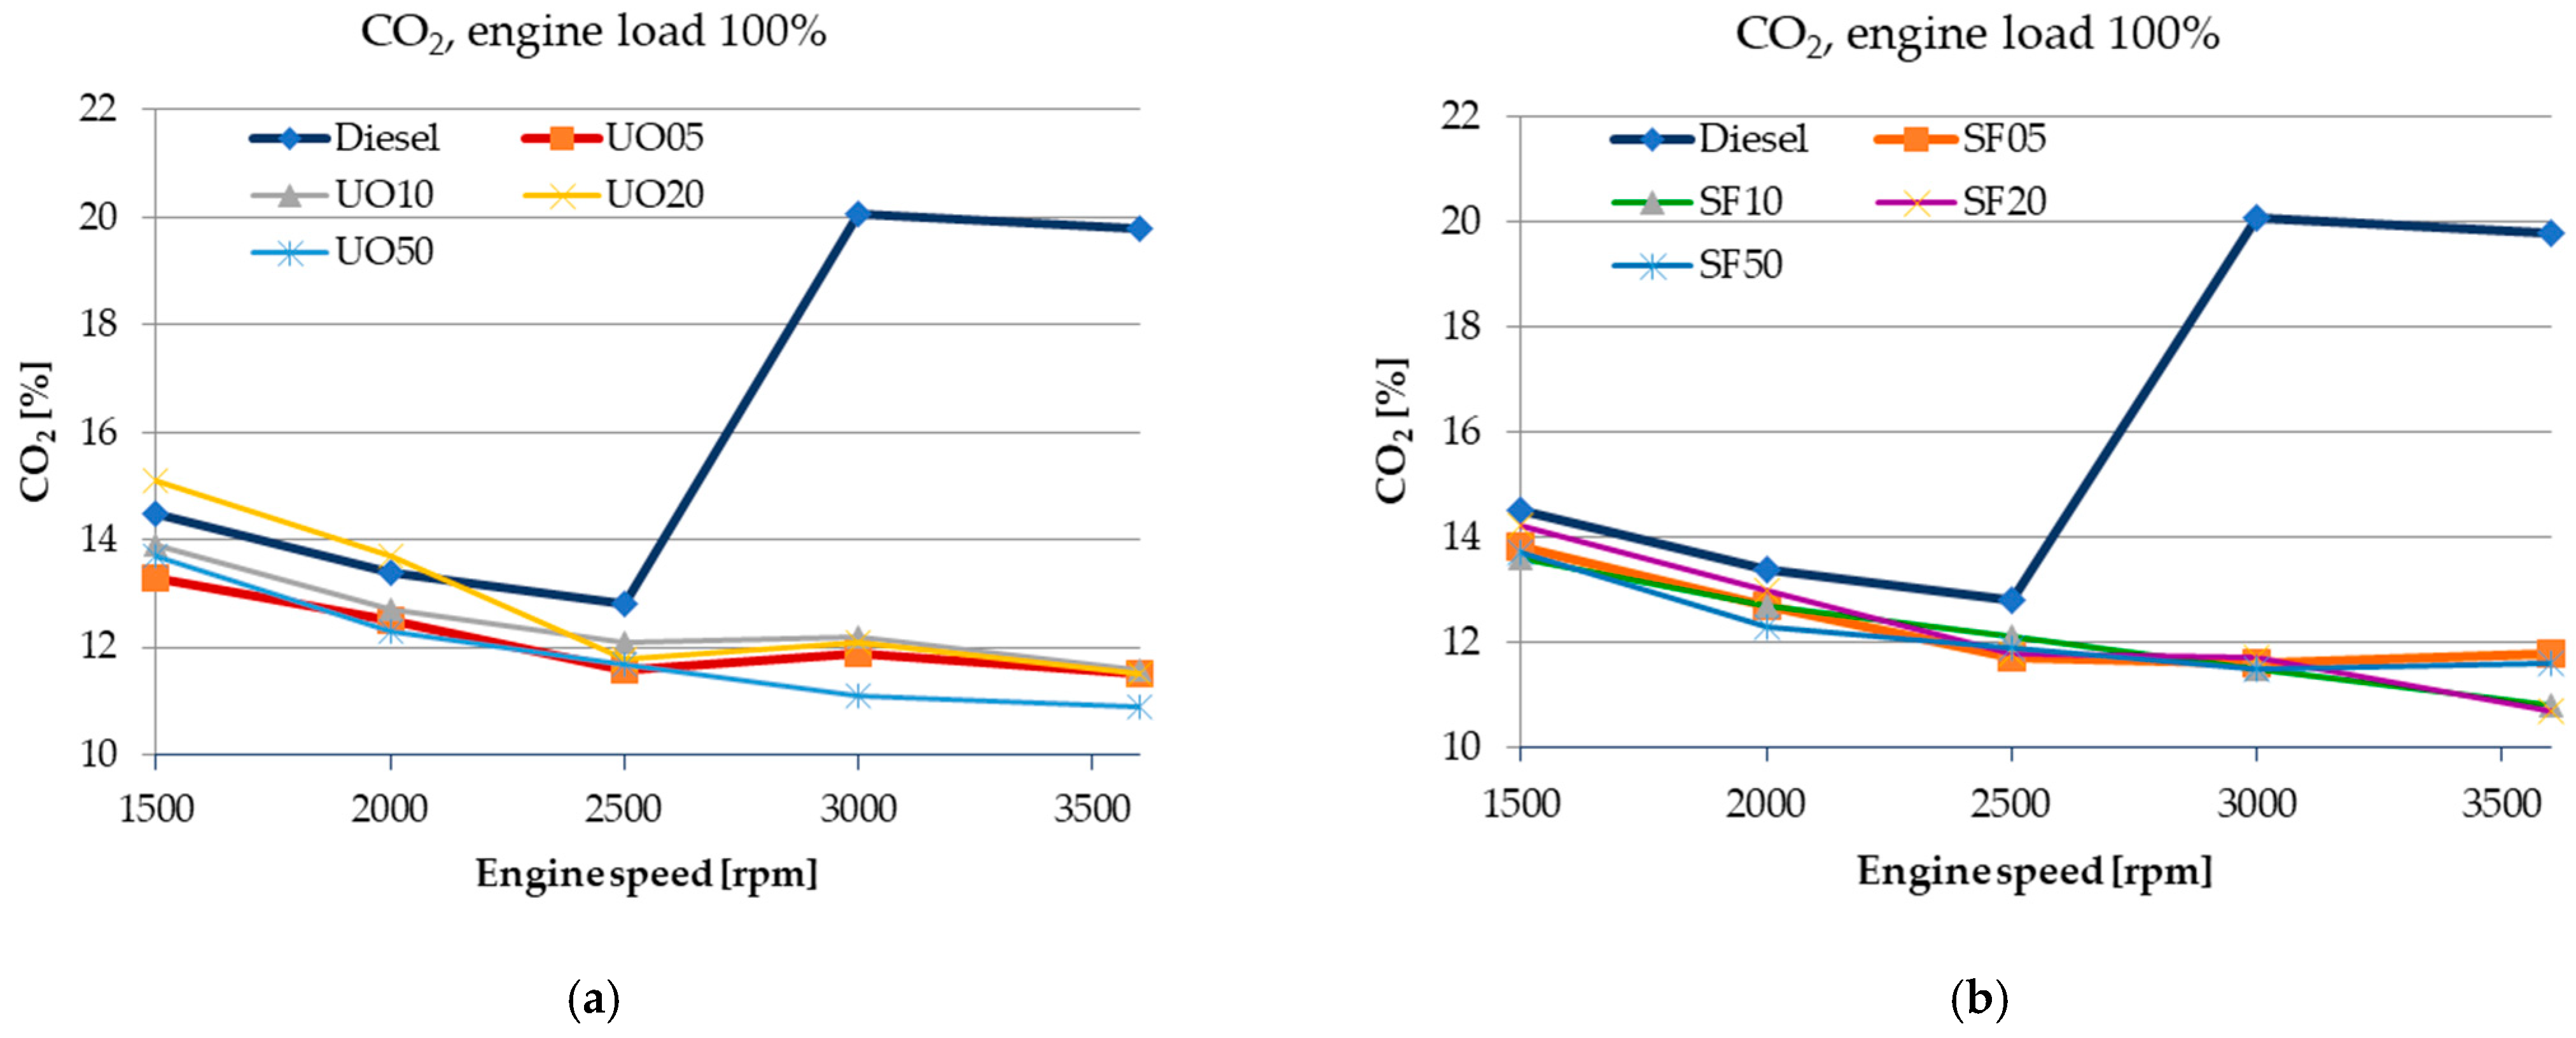
The analysis of the graphs in
Figure 26 shows that CO
2 emissions decrease with increasing engine speed at 100% load. Additionally, for both types of fuel, it can be observed that CO
2 emissions are lower than those measured for diesel across the entire range of speeds.
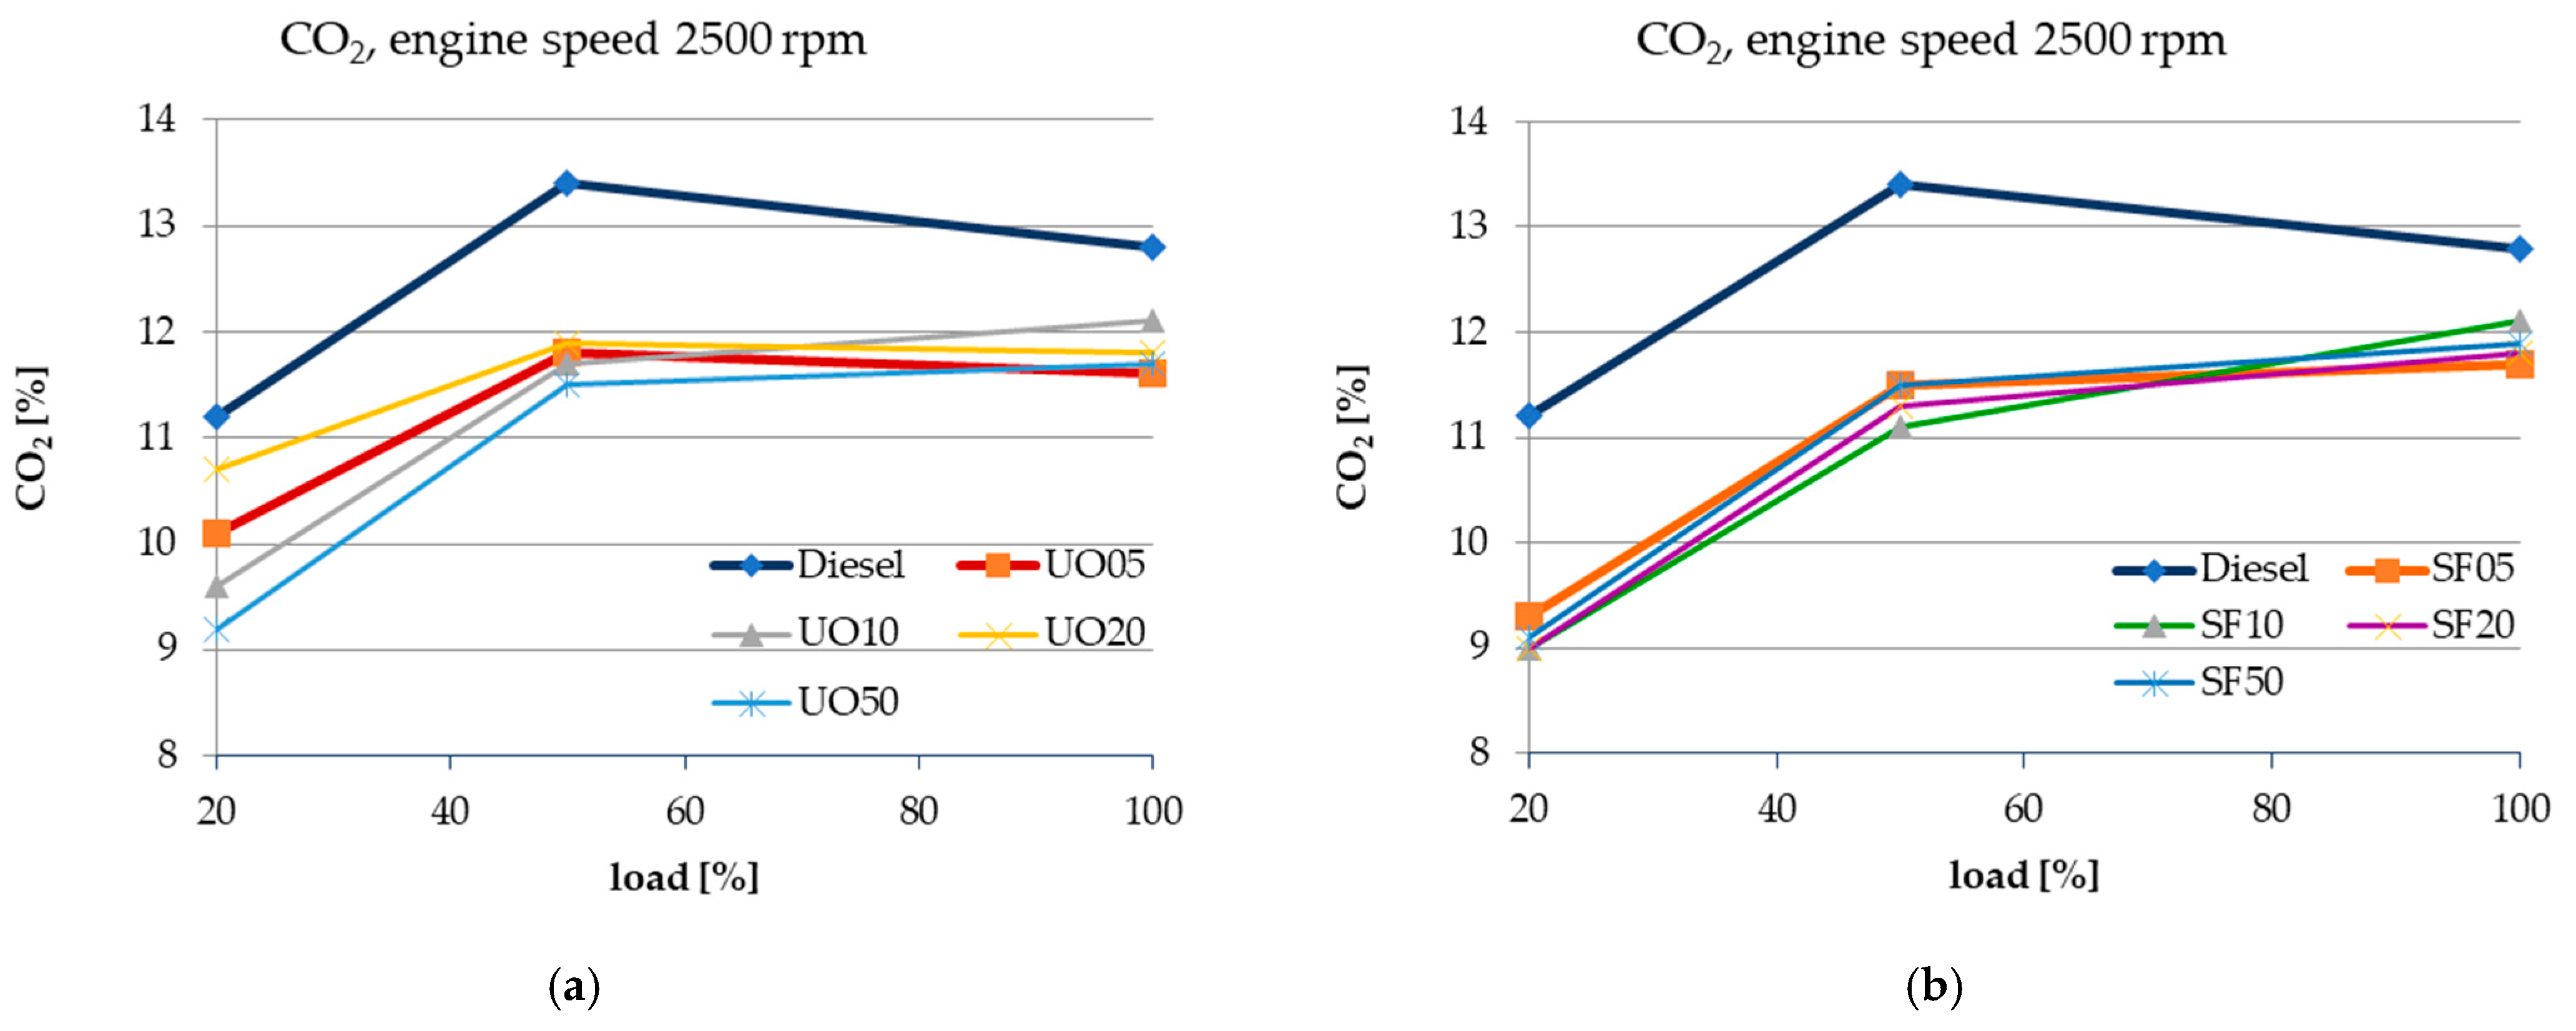
The CO
2 emission values for biofuels are noticeably lower than those for diesel, showing a tendency to increase with the load, as depicted in
Figure 27.
Higher hydrogen content in the mixture promotes better combustion, which can slightly increase NOx emissions while reducing overall CO
2 emissions due to the production of water vapor instead of CO
2 during combustion, as can be noted from the data in
Table 2 and
Figure 14,
Figure 25,
Figure 26 and
Figure 27. Additionally, biodiesel typically burns at a lower peak combustion temperature than petroleum diesel, contributing to reduced CO
2 emissions.
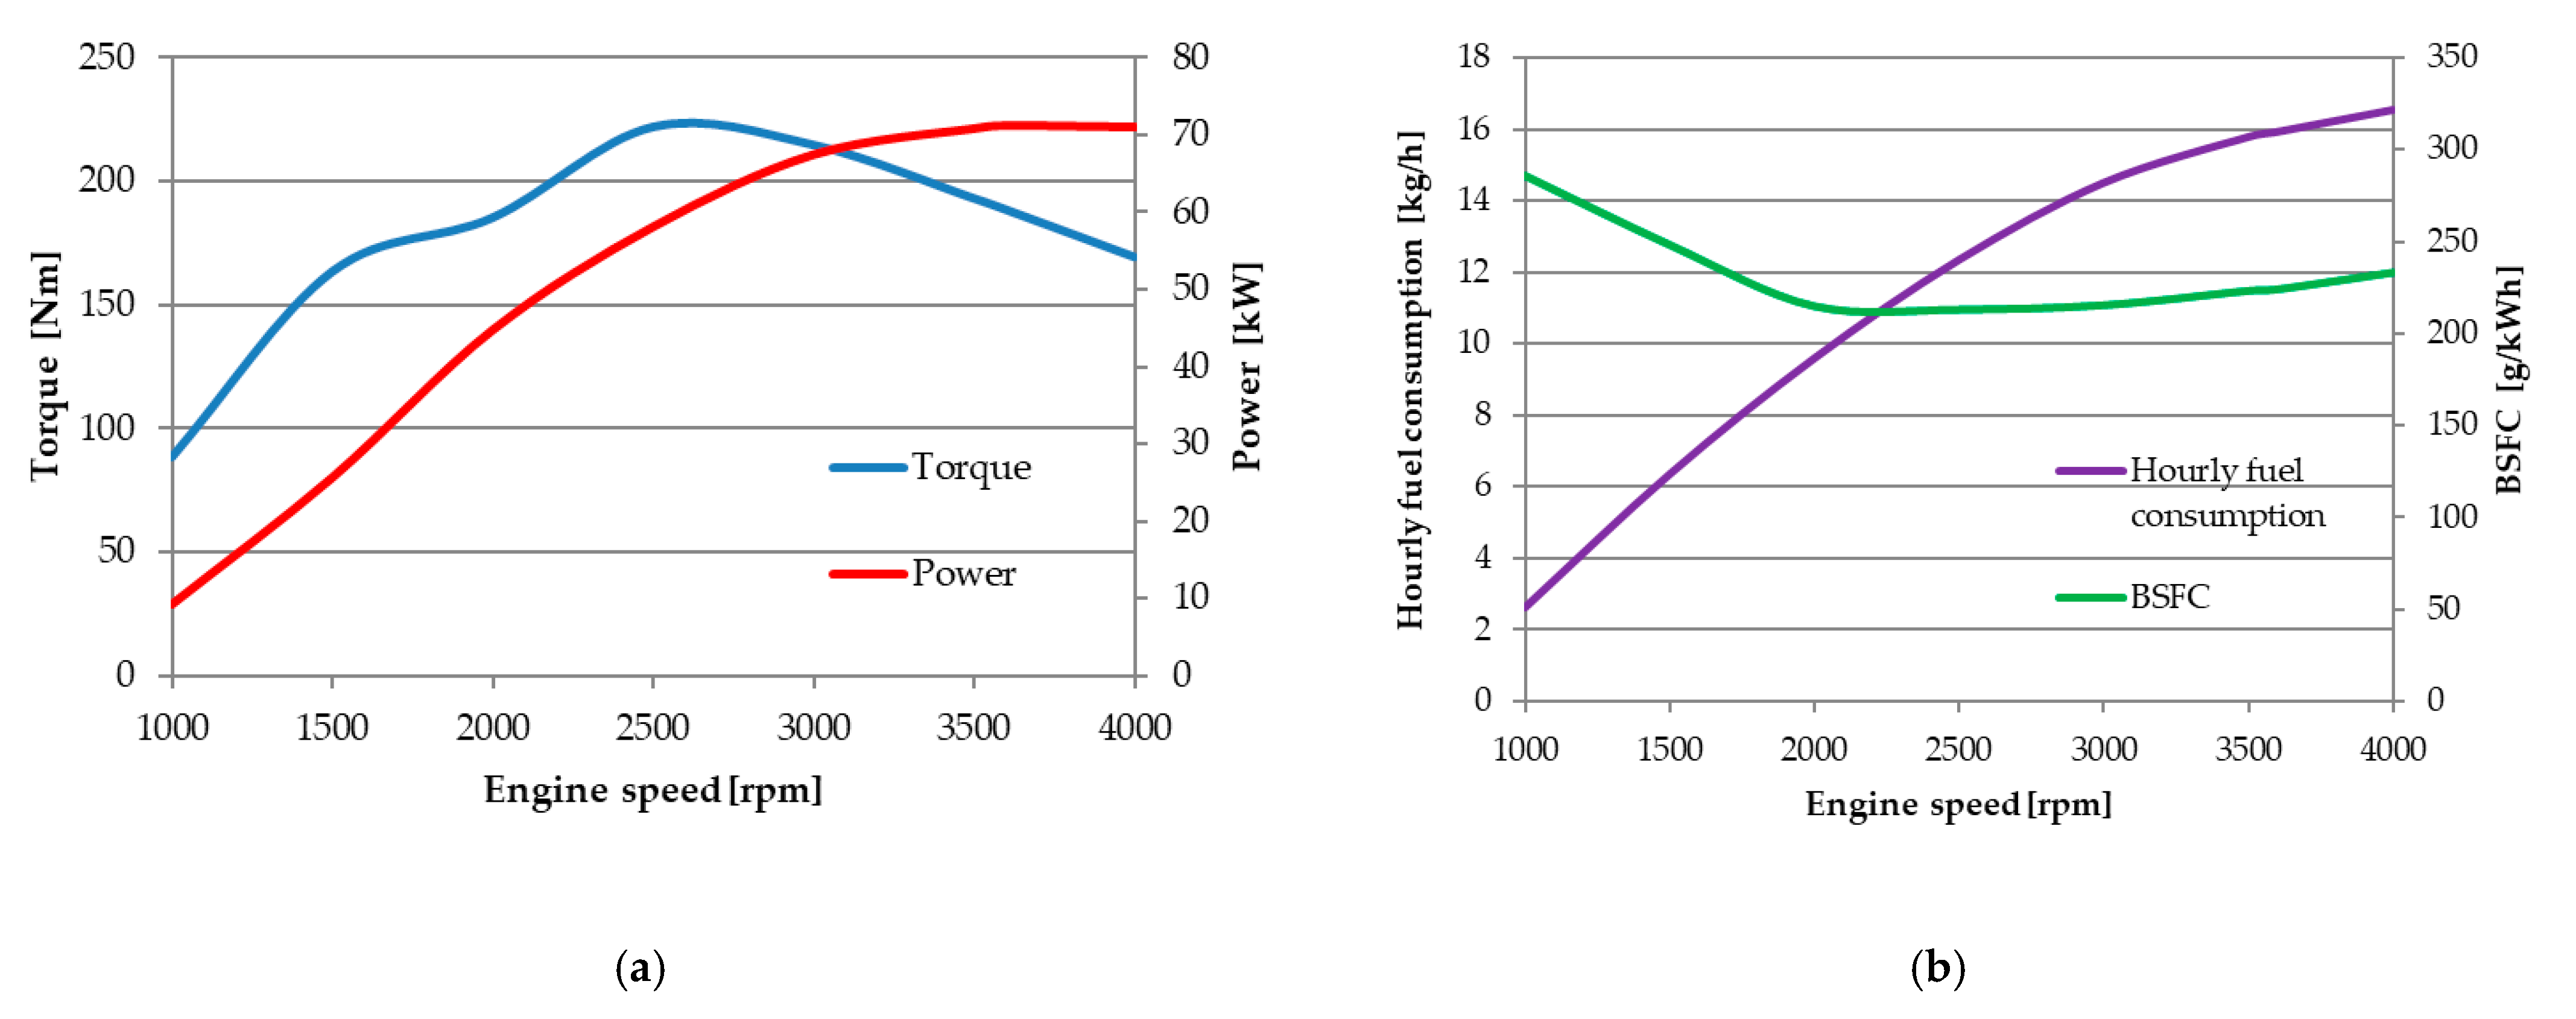
From the analysis of full load characteristics, it was observed that the maximum power was achieved at 3600 rpm, with a value of 71.11 kW in the reference tests with diesel fuel. Additionally, at 2500 rpm, the maximum engine torque of 221 Nm was obtained, along with the minimum BSFC, with a value of 212 g/kWh. From the analysis of the engine’s energetic parameters when operating with the nine tested fuels according to the research program, several key observations can be noted.
Overall, fuels based on UO displayed similar energy efficiency to diesel, with minor differences. Notable differences were observed at lower loads. At a concentration of 50%, UO50 exhibited a significant decrease compared to diesel across all speed ranges and tested loads.
Effective power decreased with increasing concentrations of SF biodiesel, with SF50 showing a 3.18% reduction at 2500 rpm. UO biodiesel shows minimal fluctuations up to UO20 but exhibits a 2.61% reduction at UO50 under the same conditions. For SF oil, Simbi et al. [
15] reported that B50 blends showed significant decreases in both torque and power. Similarly, UO biodiesel blends exhibit torque reductions ranging from 2–5% relative to diesel, as noted by Razzaq et al. [
16]. More pronounced reductions for B20 and B30 waste cooking oil blends were observed Zareh et al. [
17], while Yildiz et al. [
18] linked these decreases to the higher density and lower energy content of waste cooking oil biodiesel.
Both sets of blends showed similar energetic parameter values for the same concentrations. Used cooking oil-based fuels displayed a non-uniform trend in energy parameters with varying speed but had similar values among them. In contrast, sunflower oil-based fuels exhibited a decreasing trend in energy efficiency with increasing biofuel concentration, as confirmed by the BSFC graph, which increased with concentration.
Density is one of the properties influencing BSFC. For UO biodiesel, it ranged from 835 kg/m3 (UO05) to 853 kg/m3 (UO50), while for sunflower oil biodiesel, it ranged from 836 kg/m3 (SF05) to 854 kg/m3 (SF50), compared to diesel’s density of 832 kg/m3. The impact of density on engine performance is complex and depends on blend percentage, engine design, and operating conditions.
With regard to fuel efficiency, the hourly fuel consumption for UO decreases as the biodiesel concentration increases, with a 2.08% reduction at UO05 and a 0.43% reduction at UO50 compared to diesel. No significant changes in hourly fuel consumption were observed for SF biodiesel blends.
BSFC increases with higher concentrations of both sunflower oil biodiesel and UO biodiesel. Other studies support the increase in BSFC with biodiesel blends. For example, Mahmood et al. [
16] reported that BSFC increases with higher concentrations of waste cooking oil biodiesel blends due to a lower heating value and higher viscosity, while Mandal et al. [
17] observed similar trends for waste cooking oil biodiesel blends, with B40 and B80 blends showing increased BSFC as engine speed increased. The increase in BSFC for sunflower oil biodiesel was also confirmed by Dueso et al. [
21], who found that sunflower biodiesel blends exhibited higher BSFC than diesel.
For SF, the SF50 blend shows a 3.18% increase compared to diesel at 2500 rpm, aligned with reductions in power and torque. UO exhibits a similar trend, with the higher density of UO50 (835–854 kg/m3) contributing to increased BSFC due to its impact on combustion efficiency.
Cylinder pressure varied depending on the biodiesel’s properties. The maximum pressure for SF was approximately 2.5% higher than that recorded for UO across all concentrations. At 2500 rpm and full load, UO50 exhibited the lowest cylinder pressure, 3.66% lower than diesel.
An analysis of energy parameters by speed showed nearly equal values for all concentrations, with fuels at the 50% concentration exhibiting the largest differences compared to diesel.
Regarding the ecological parameters and their variations with speed and load during the tests, based on the concentration of biofuel in the blend, the analysis generates several conclusions.
It can be observed that NOx emissions increase with the increasing concentration of UO biodiesel in the blend and decrease with SF biodiesel concentration. The evolution of NOx emissions displayed a pronounced increase up to 50% load, after which the changes are minimal, which can be explained by the proportional modification of exhaust gases. The same trend is observed at the speed corresponding to maximum torque, 2500 rpm. Mixtures with 50% biofuel recorded similar values, both lower than diesel. The same findings were also observed by Enweremadu et al. [
22], who attributed the increase to the oxygenated nature of biodiesel, leading to higher in-cylinder temperatures, while multiple studies found that NOx increased for all waste cooking oil biodiesel blends (B40, B80) [
17,
18,
20,
22]. For SF biodiesel blends, the NOx emissions decreased with the concentration of SF biodiesel, with 50% biofuel blends showing lower NOx than diesel, as confirmed by Dueso et al. [
21] and Vergel-Ortega et al. [
34], whose NOx emissions results were slightly lower than diesel for low-concentration SF biodiesel blends, but increased at higher concentrations due to the higher oxygen content in the fuel.
Emissions of HC and CO for the 2500 rpm point are lower for all tested fuels than those of diesel. Additionally, CO and HC emissions decrease with increasing speed, both being lower than the values recorded for diesel. These observations are supported by Mandal et al. [
20], who reported a 52% reduction in CO and a 60% reduction in HC for waste cooking oil biodiesel blends compared to diesel. Yildiz et al. [
18] confirmed that HC and CO emissions were lower for waste cooking oil biodiesel, especially for B20 and B30 blends. Similar findings were reported by Iglesias et al. [
23], Venkatesan et al. [
28], and l-Dawody et al. [
37] who observed a reduction in CO and HC for SF and UO biodiesel blends. Density values (according to
Table 2) confirm this trend of reduced HC and CO emissions due to better combustion.
Lower levels of HC emissions compared to diesel demonstrate good atomization due to the lower viscosity and density of alternative fuels compared to diesel. The points where increases in these emissions are recorded above the diesel level suggest the need to improve the jet formation mechanism.
A comparison of the combustion process of SF biodiesel versus UO biodiesel indicates that the SF biodiesel typically generates a better combustion process in terms of efficiency, power output, and overall performance. SF biodiesel is made from refined sunflower oil and it mainly contains polyunsaturated fatty acids, which typically burn efficiently, contributing to better combustion. This allows for smoother combustion with more complete fuel oxidation, which improves engine performance and reduces emissions of HC and PM.
Both SF biodiesel and UO biodiesel contain oxygen within their molecular structure, which helps improve combustion by enabling more complete oxidation of the fuel. UO biodiesel may generate higher PM and HC due to its less efficient combustion, but it may produce lower NOx emissions because of the lower combustion temperatures.
SF biodiesel tends to have lower viscosity than used oil biodiesel, which promotes better atomization of the fuel in the engine’s injector system. Good atomization leads to better mixing with air, which results in more complete and efficient combustion. This efficiency generally translates to better engine performance, more power output, and less unburned fuel and lower emissions. SF biodiesel generates a better combustion process because it is cleaner, has a lower viscosity, and burns more efficiently, leading to higher combustion temperatures, better engine performance, and lower emissions of PM and HC. In summary, SF biodiesel provides a more efficient, cleaner, and more consistent combustion process, which leads to better overall engine performance compared to used oil biodiesel.
The value of particulate matter emissions displays a clear trend of decreasing with engine speed, with both types of fuels recording lower values than diesel. The lowest values (approximately 70% across the entire engine speed range) were recorded for 50% biofuel concentrations in the blend, correlated with the lower energy efficiency of these fuels. Studies indicate that PM emissions can be reduced by up to 30% when using biodiesel blends like B20, B30 [
5,
38], and B50 blends [
18], particularly with 50% biofuel concentrations at higher speeds [
32]. Vergel-Ortega et al. [
34] observed similar trends with waste cooking oil biodiesel, in which PM emissions decreased as biodiesel concentration increased. Simbi et al. [
15] and Zareh et al. [
17] confirmed that SF biodiesel exhibited a notable reduction in PM emissions.
Analysis of particle mass data reveals non-uniformity between measured values, which may be due to the different chemical compositions of the tested fuels and the particle formation mechanism influenced by several factors of the combustion process (temperature, oxygen quantity, mixture homogeneity), which vary for each point and tested fuel. Zareh et al. [
17] found that PM and opacity decreased with waste cooking oil biodiesel blends, particularly B20 and B30, with B50 exhibiting the largest reduction. Mandal et al. [
20] found lower opacity for waste cooking oil biodiesel blends (B40, B80) compared to diesel.
CO
2 emissions show lower values for the tested alternative fuels compared to diesel, both in terms of load and speed characteristics. The reduction in CO₂ emissions also depends on the life cycle assessment of the biodiesel, as CO₂ absorbed during feedstock growth offsets the emissions produced during combustion, as confirmed by multiple studies [
15,
17,
18,
20,
23].
Emission formation in a compression ignition engine is influenced by the starting point of the injection. Tests results showed that the pilot injection time for all tested fuels is equal at a speed of 2500 rpm. Although the lower advance of the pilot injection should negatively influence the ecological parameters [
39], it can be observed that the properties of the fuels play a more important role in this regard. The analysis of all load and speed points shows that the injection system self-regulates depending on the engine speed, load, and the specific properties of the tested fuel.
These findings highlight the environmental benefits and potential areas for further optimization and research in alternative fuel utilization.


