1. Introduction
As global warming intensifies, carbon neutrality policies are being implemented worldwide. In line with these policies, the transition from fossil fuel-based systems to secondary battery-based electric propulsion systems is accelerating in transportation applications, including automobiles, railway vehicles, and ships [
1]. Consequently, the large-capacity battery market is continuously expanding [
2]. Lithium-ion batteries with high energy density and power density characteristics are increasingly being applied as electric propulsion systems in transportation [
3].
However, lithium-ion batteries have disadvantages of performance degradation and increased fire risk due to aging [
4]. Propulsion batteries in transportation applicationscan cause significant damage in cases of firedue to their high capacity, making battery safety management crucial. Therefore, accurate diagnosis of battery aging state and state-of-health (SOH) is essential for safe battery operation.
To address this need for accurate battery state diagnosis, electrochemical impedance spectroscopy (EIS), an alternating current impedance measurement method, is being widely adopted as a battery SOH diagnosis method. EIS is a diagnostic method that analyzes impedance characteristics by applying small sinusoidal current or voltage of various frequencies to batteries [
5,
6,
7]. This method enables analysis of various electrochemical reactions in batteries according to frequency domains, making it possible to identify degradation mechanisms [
8,
9,
10]. Additionally, it offers high operational efficiency as diagnosis is possible without separating batteries from the propulsion system.
Particularly considering that battery impedance characteristics change differently according to aging processes, understanding degradation mechanisms is more important than simply identifying the current state. Even when batteries have the same SOH, internal resistance increase trends may differ, and they may exhibit different characteristics during thermal runaway [
11]. In this regard, EIS technology research is actively pursued for effective safety management [
12,
13,
14,
15]. This approach enables degradation mechanism identification while minimizing operational interruption.
However, conventional EIS research has been predominantly limited to single cells, presenting challenges for implementation in actual battery pack systems. Battery packs consist of modules comprising hundreds to thousands of cells connected in series and parallel [
16], where several measurement challenges arise that do not appear in single-cell measurements. Cell-to-cell variations from manufacturing tolerances affect the measurement consistency of the entire pack [
17,
18], and measurement noise with signal-to-noise ratio degradation at higher frequencies complicates accurate impedance characterization [
19,
20]. Additionally, structural elements such as bus plates, welding joints, and connection wiring are necessarily incorporated to construct the pack [
21]. These structural elements possess inherent resistance and inductance, superimposing additional impedance components onto the pure battery impedance during EIS measurements [
22,
23]. Inductive effects from interconnections and cables distort the imaginary part of impedance spectra in the high-frequency region [
24,
25], while connection resistance from terminals and fixtures shifts measurements across all frequency ranges [
19,
26].
This structural interference problem becomes particularly severe in parallel battery configurations. As the number of parallel-connected cells increases, the equivalent battery impedance decreases inversely with cell count following the parallel combination law, while the impedance contribution from bus plates and interconnections remains relatively constant or even increases due to complex current distribution through shared structural elements. This fundamental scaling mismatch causes the relative proportion of structural element impedance in total measured impedance to grow substantially in multi-parallel configurations, thereby severely degrading the reliability of battery state diagnosis. While recent research efforts have advanced embedded EIS measurement capabilities for battery management systems [
27,
28,
29], enabling in situ impedance monitoring during vehicle operation, practical methods for correcting the configuration-dependent structural interference in parallel battery modules remain underdeveloped.
To address measurement artifacts in battery EIS, several correction approaches have been conducted. In measurement science, de-embedding techniques such as fixture calibration methods [
30] have been employed to remove systematic errors. For battery applications specifically, researchers have proposed subtracting separately measured cable and connector impedances from the total measurement [
19,
31], applying post-measurement drift correction algorithms [
32], and using low-inductance twisted-pair cables to minimize magnetic coupling effects [
26,
33]. Advanced calibration workflows have also been conducted, measuring multiple impedance standards to map systematic errors across frequency ranges [
19,
34]. However, these methods face fundamental limitations when applied to parallel battery modules. First, cable-subtraction approaches assume that fixture impedances remain constant regardless of the device under test, which does not hold for parallel configurations where current distribution through structural elements depends on the number of cells and their relative positions. Second, standard-based calibration methods require impedance standards in similar ranges, typically sub-milliohm for multi-cell parallel modules, which are difficult to fabricate and maintain with sufficient accuracy [
35]. Third, and most critically, conventional methods do not account for the configuration-dependent current distribution patterns unique to parallel battery arrangements, where different parallel cells experience different current paths through shared bus plates. For practical in situ diagnostics in railway vehicles or stationary energy storage systems, methods requiring module disassembly or repeated calibration procedures are infeasible due to safety, time, and operational constraints.
To overcome these limitations, this study proposes a geometry-based correction method that requires only the physical dimensions and spatial positions of bus plateparameters readily available from module design specifications or simple non-destructive measurements. Unlike conventional calibration approaches requiring impedance standards or cable subtraction, the proposed method enables in situ impedance correction without module disassembly, additional calibration measurements beyond standard EIS, or assumptions of configuration-independent fixture behavior. This study systematically analyzes the impedance characteristics of bus plates, the primary structural elements in parallel battery modules, and develops a correction algorithm to extract pure battery impedance by removing bus plate effects from measurement data. The algorithm explicitly accounts for configuration-specific current distributions in 2P, 3P, and 4P parallel arrangements by deriving current distribution factors based on geometric parameters. The developed algorithm was experimentally validated across various battery chemistries including NCA and LFP in 1S-2P, 1S-3P, and 1S-4P configurations, confirming improved reliability of EIS measurements of battery modules for practical diagnostic applications.
The organization of this paper is as follows.
Section 2 describes EIS measurement principles and parallel battery module architecture. It explains the measurement distortion mechanism by structural elements and presents the proposed correction algorithm framework.
Section 3 develops the correction algorithm by analyzing impedance characteristics through standalone bus plate EIS measurements. Prediction equations are established and correction factors accounting for current distribution effects and frequency dependence in parallel configurations are derived.
Section 4 validates the algorithm on parallel modules of NCA and LFP batteries and analyzes the results. Finally,
Section 5 summarizes the findings and suggests future research directions.
2. Background and Correction Algorithm Framework
EIS is a diagnostic method that noninvasively measures electrochemical phenomena inside batteries through impedance characteristic analysis in the frequency domain. However, conventional research has been predominantly conducted on single cells. For implementation in actual battery modules and packs, the effects of structural elements such as bus plates must be considered. This section describes EIS measurement principles and battery module architecture. The measurement distortion mechanism caused by structural elements is analyzed, and the overall framework of the correction algorithm is presented.
2.1. Electrochemical Impedance Spectroscopy (EIS)
EIS is a diagnostic method that noninvasively analyzes electrochemical characteristics inside batteries by applying small alternating current signals across various frequencies and measuring the corresponding impedance response.
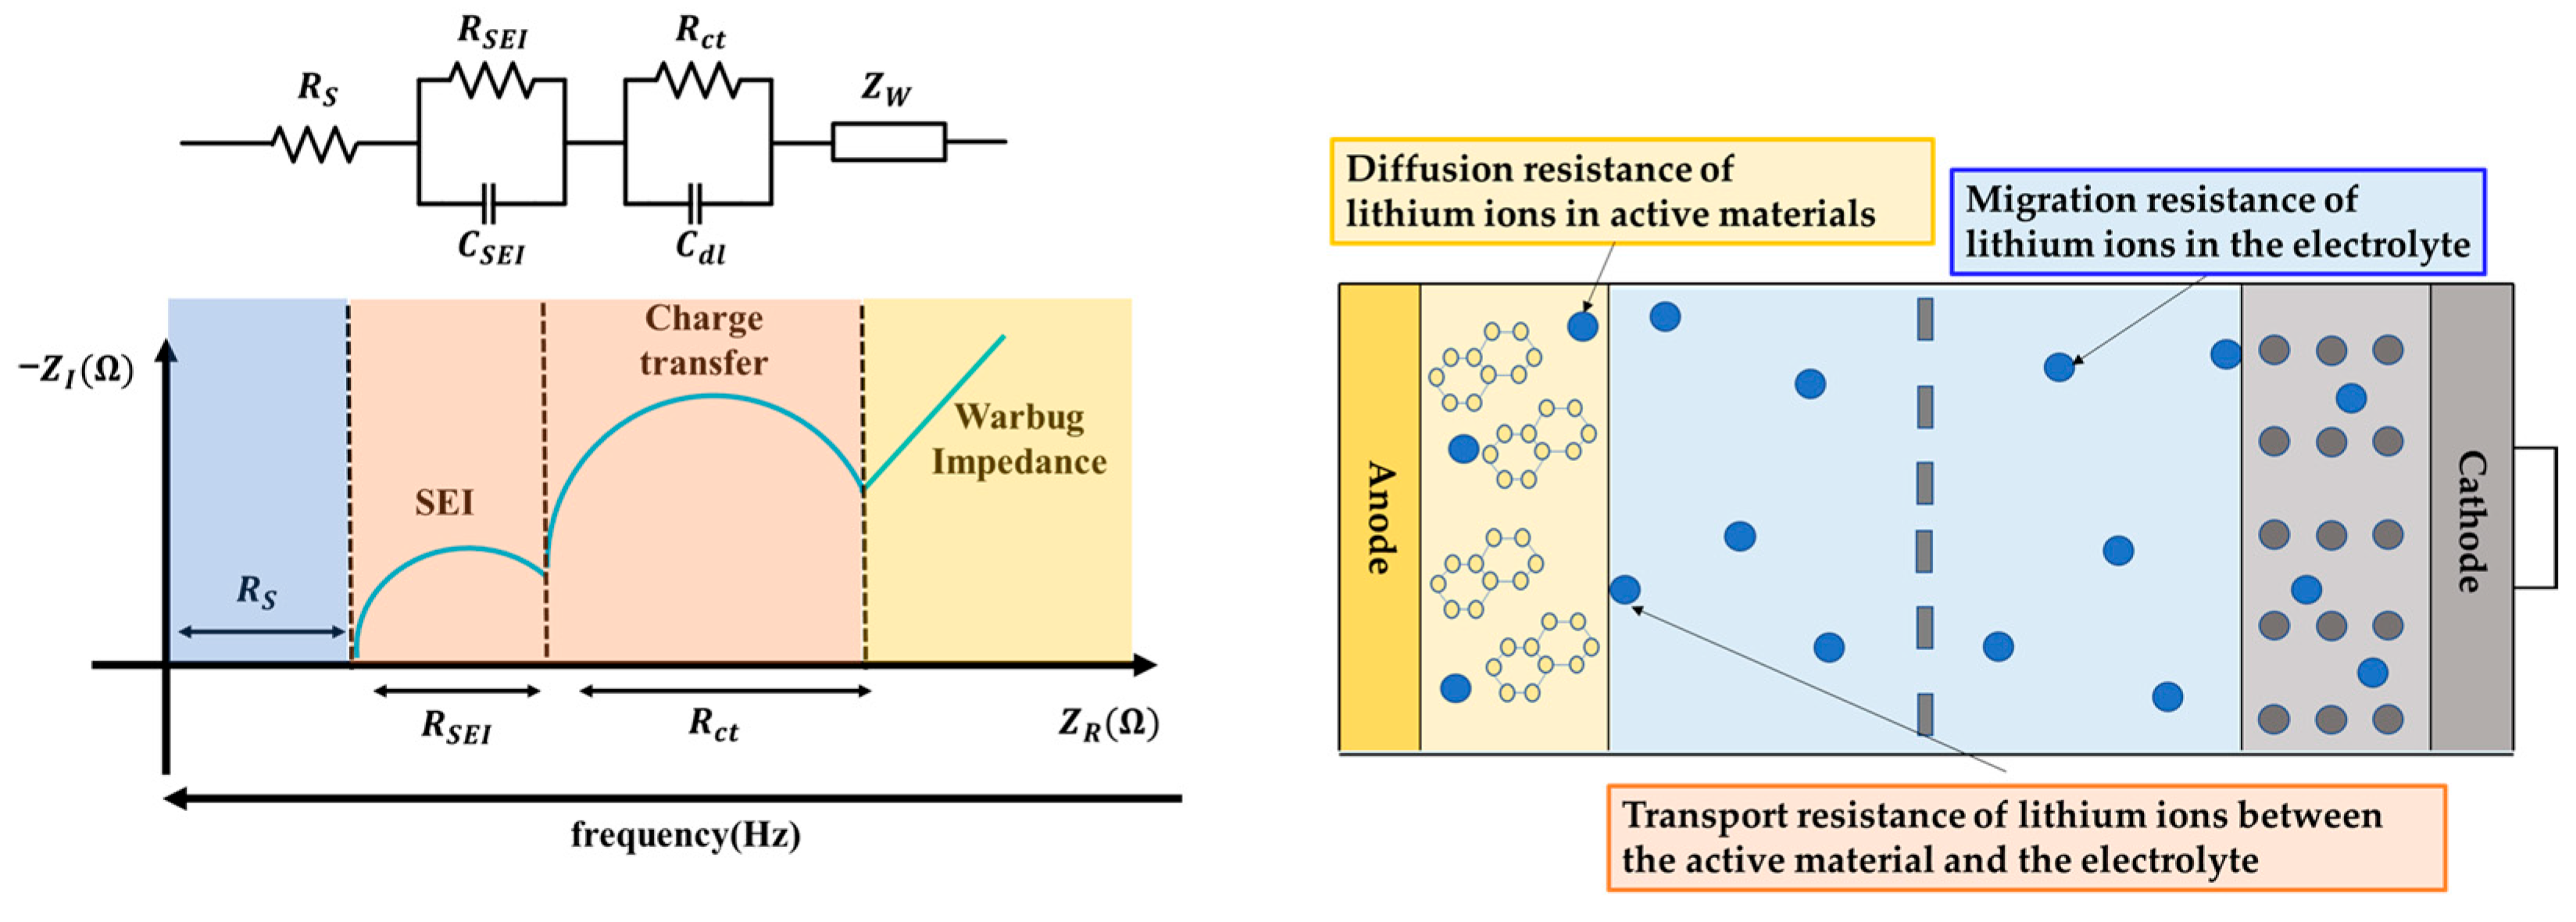
EIS measurement results are primarily visualized using Nyquist plots. The Nyquist plot displays the imaginary part of impedance against the real part, where each point represents the impedance at a specific frequency. This enables analysis of electrochemical phenomena inside the battery by distinguishing different frequency regions. The electrochemical characteristics of batteries are generally represented by an equivalent circuit model (ECM) composed of combinations of resistance (R) and capacitor (C) elements. The relationship between such ECMs and Nyquist plots is shown in
Figure 1.
The typical Nyquist plot of lithium-ion batteries exhibits distinct characteristics in different frequency regions, each reflecting specific electrochemical processes. As shown in
Figure 1, the high-frequency region (>1 kHz) corresponds to lithium-ion migration in the electrolyte and inductive components from wiring and connections, identified as the intercept with the real axis in the Nyquist plot. The mid-frequency region (1 Hz~1 kHz) reflects lithium-ion migration through the solid electrolyte interphase (SEI) layer and charge transfer processes at the electrode-electrolyte interface, appearing as semicircular arcs. The low-frequency region (<1 Hz) is dominated by solid-state diffusion of lithium ions within the active material, represented as a straight line with approximately 45° slope (Warburg impedance) in the Nyquist plot.
These frequency-dependent characteristics enable EIS to individually analyze various degradation mechanisms inside batteries. However, in parallel battery modules, structural elements such as bus plates introduce additional impedance contributions that also vary with frequency. Bus plates, being metallic conductors, possess both resistive and inductive characteristics that can overlap with battery impedance across different frequency regions. In the high-frequency region, inductive reactance from bus plates can interfere with the identification of electrolyte resistance. In the mid-frequency region, bus plate resistance can distort the semicircular arcs used for SEI and charge-transfer analysis. This frequency-dependent interference necessitates systematic correction methods to extract accurate battery impedance from parallel module measurements, which is the focus of this study.
2.2. Challenges in EIS Measurement of Battery Modules and Packs
Lithium-ion batteries are used in the form of modules and packs with multiple cells connected in series and parallel for practical applications. In the case of EV battery packs, hundreds to thousands of cells are connected in a complex hierarchical structure to implement high-voltage, large-capacity systems. When applying EIS diagnostic technology, originally developed for single cells, to actual modules and packs, measurement data distortion due to the influence of structural elements becomes a significant challenge.
Unlike single cells, modules and packs include structural elements such as bus plates, welding joints, connection wiring, and contact points for electrical interconnection between cells. These structural elements each possess inherent impedance characteristics, which superimpose on the battery impedance itself during EIS measurements, distorting the measurement data.
This problem is particularly pronounced in parallel-connected battery modules. Bus plates exhibit resistance and inductance components depending on their geometric characteristics such as length, width, and thickness. As the number of parallel cells increases, the battery impedance itself decreases rapidly in inverse proportion to the number of parallel cells. In contrast, the bus plate length increases to connect the parallel cells, resulting in increased inductance component, while the resistance component also increases proportionally to the length increase. Consequently, the proportion of the bus plate in the total measured value increases relatively with the number of parallel cells, degrading measurement reliability.
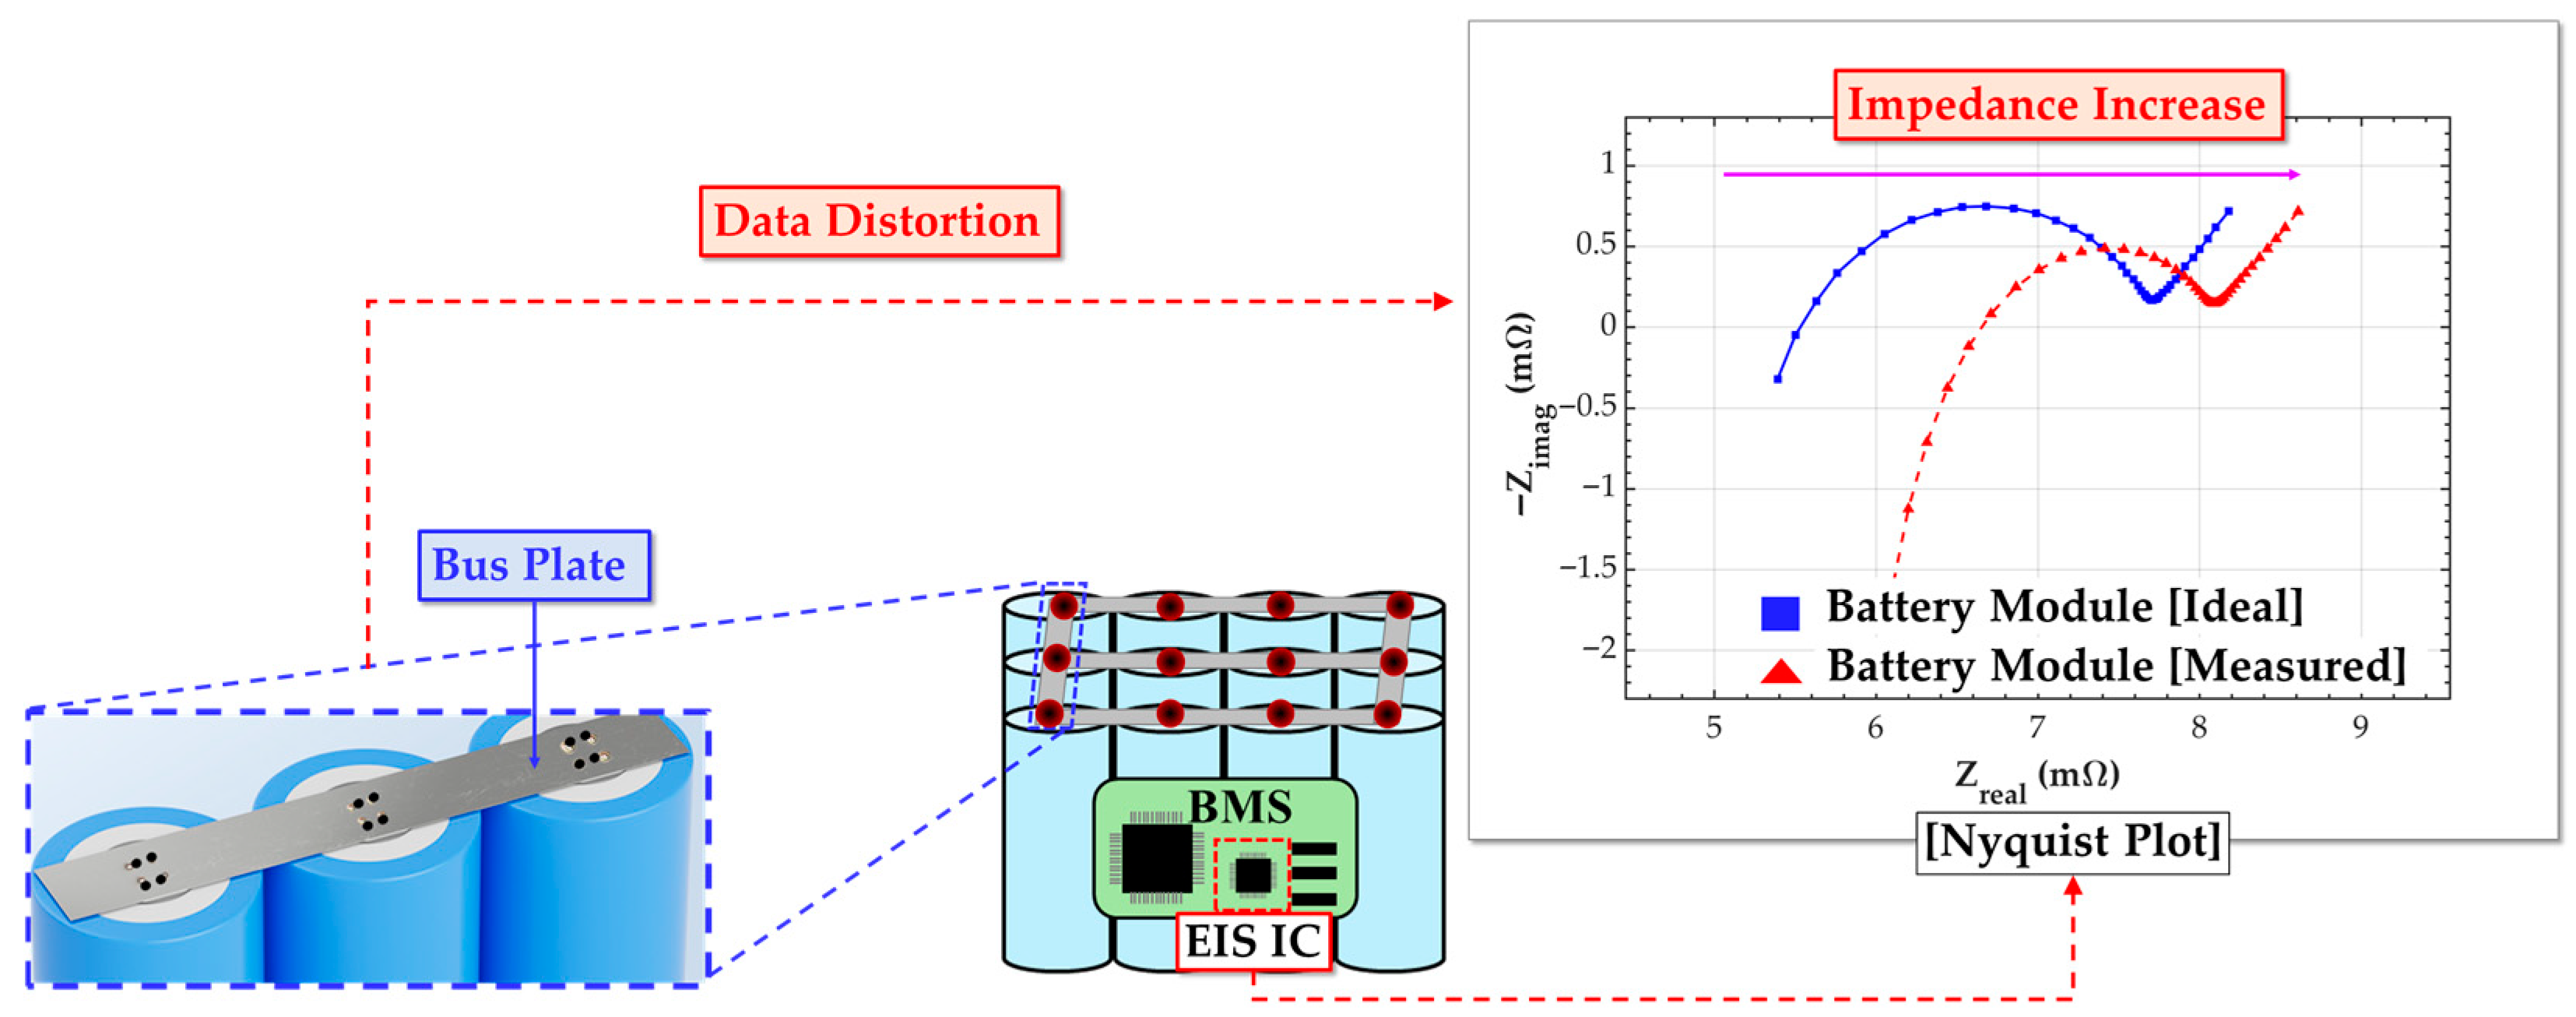
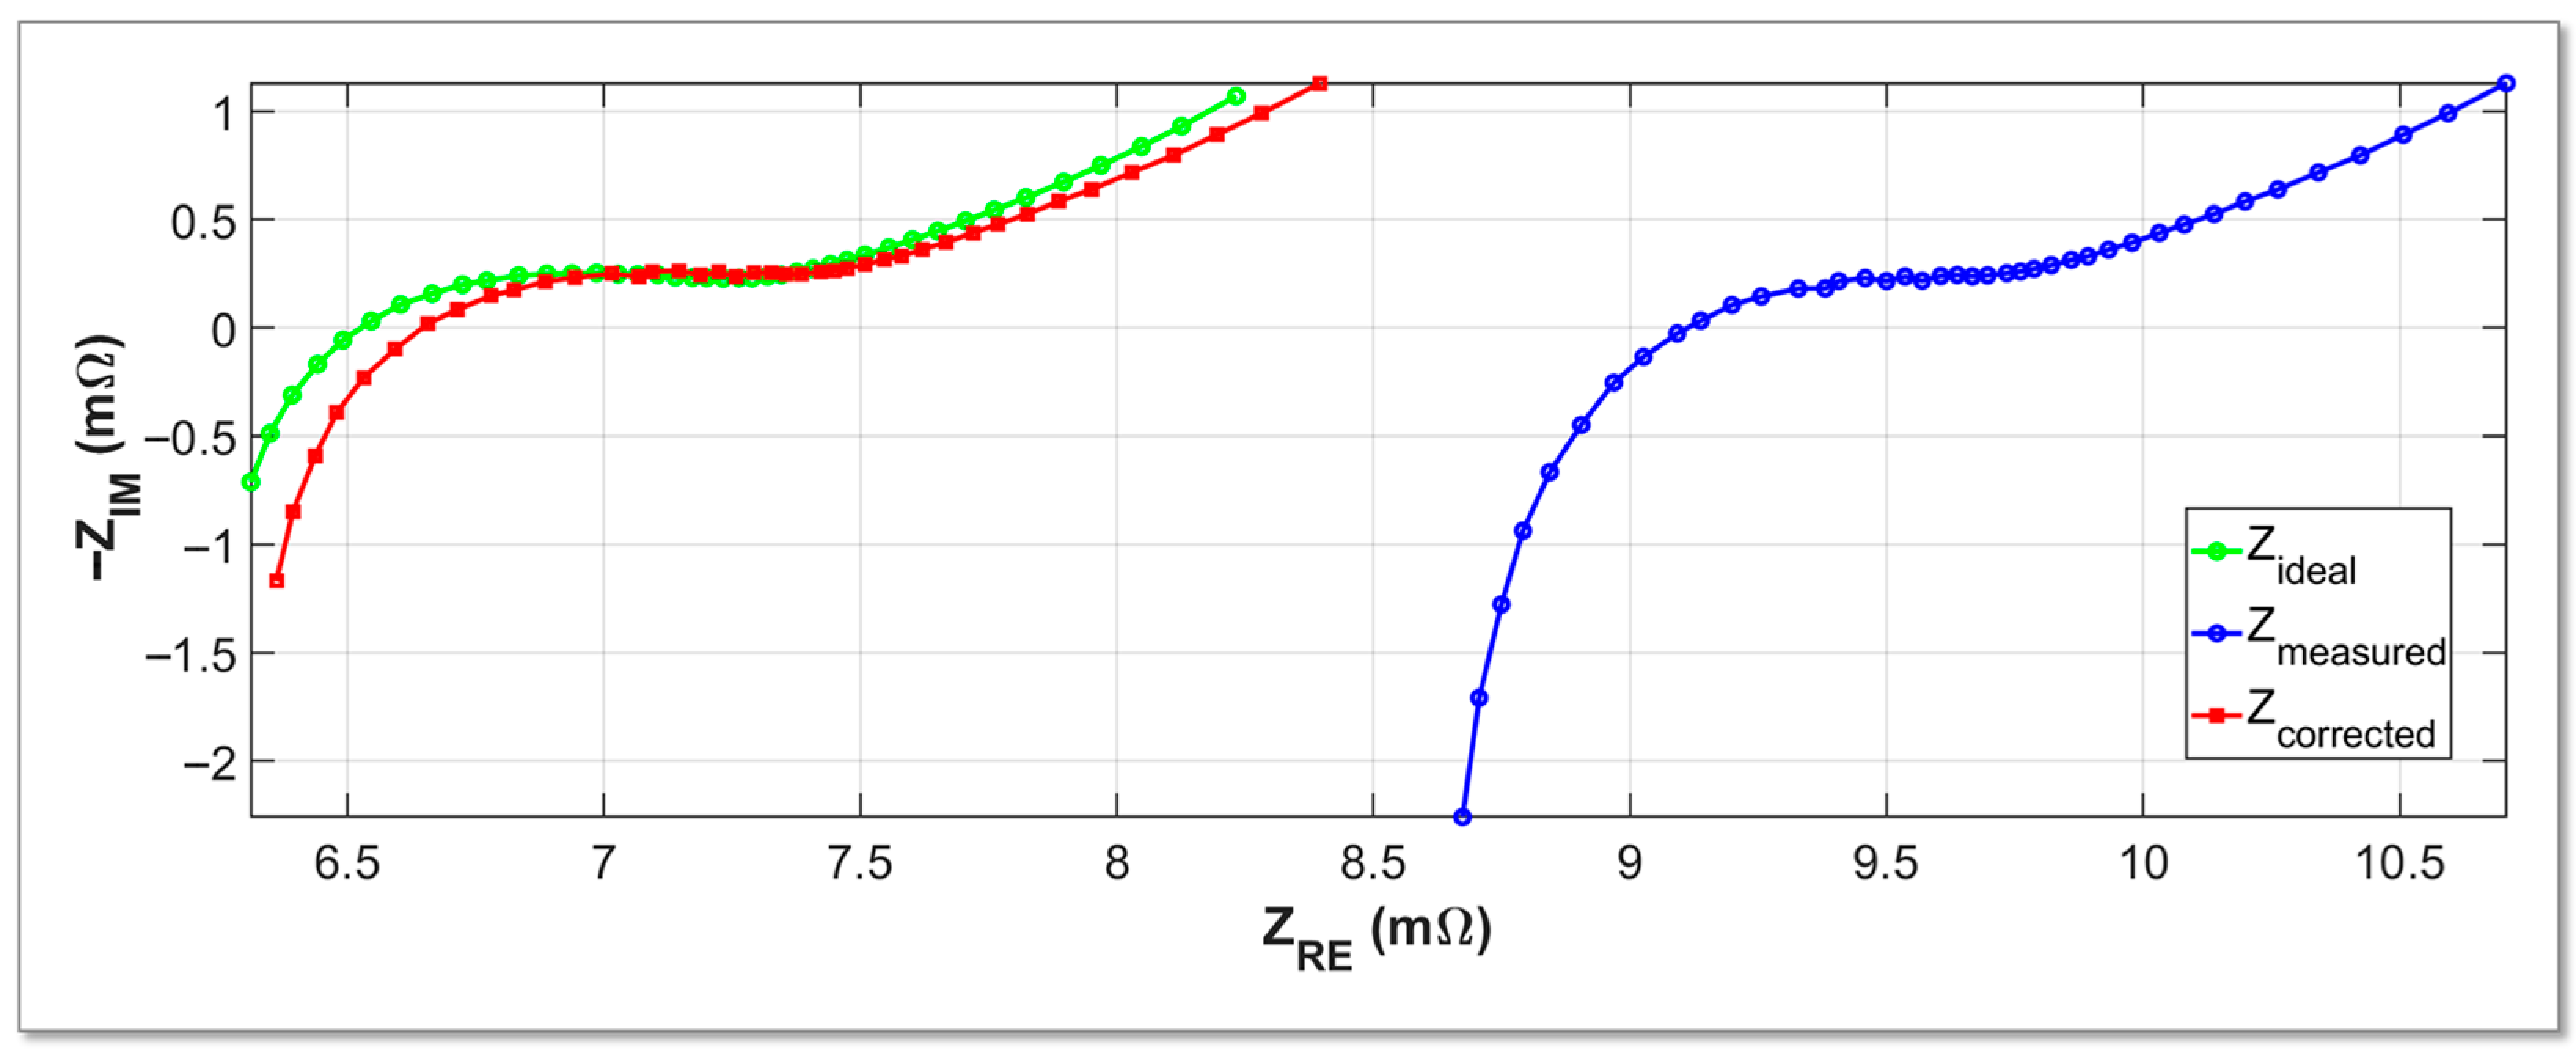
Figure 2 shows an example of measurement data distortion caused by structural elements. As shown in the figure, the actual measured value exhibits additional impedance in both real and imaginary parts compared to the ideal module impedance due to the influence of structural elements.
Furthermore, in parallel-connected configurations, current distribution to each cell can be non-uniform, causing the measured total impedance to exhibit characteristics different from the simple parallel combination calculation of individual cells.
Due to these challenges, directly applying EIS-based diagnostic algorithms validated on single cells to parallel modules and packs can result in significant errors. Therefore, accurate EIS measurements in parallel modules require an algorithm that can quantitatively analyze the effects of structural elements on measurement results and correct for these effects.
2.3. Framework of the Proposed Correction Algorithm
This study proposes a correction algorithm that extracts pure battery impedance by eliminating the influence of bus plates in EIS measurements of battery modules. The proposed algorithm calculates bus plate impedance using geometric parameters and corrects measurement data by applying correction factors that consider parallel configuration and frequency characteristics.
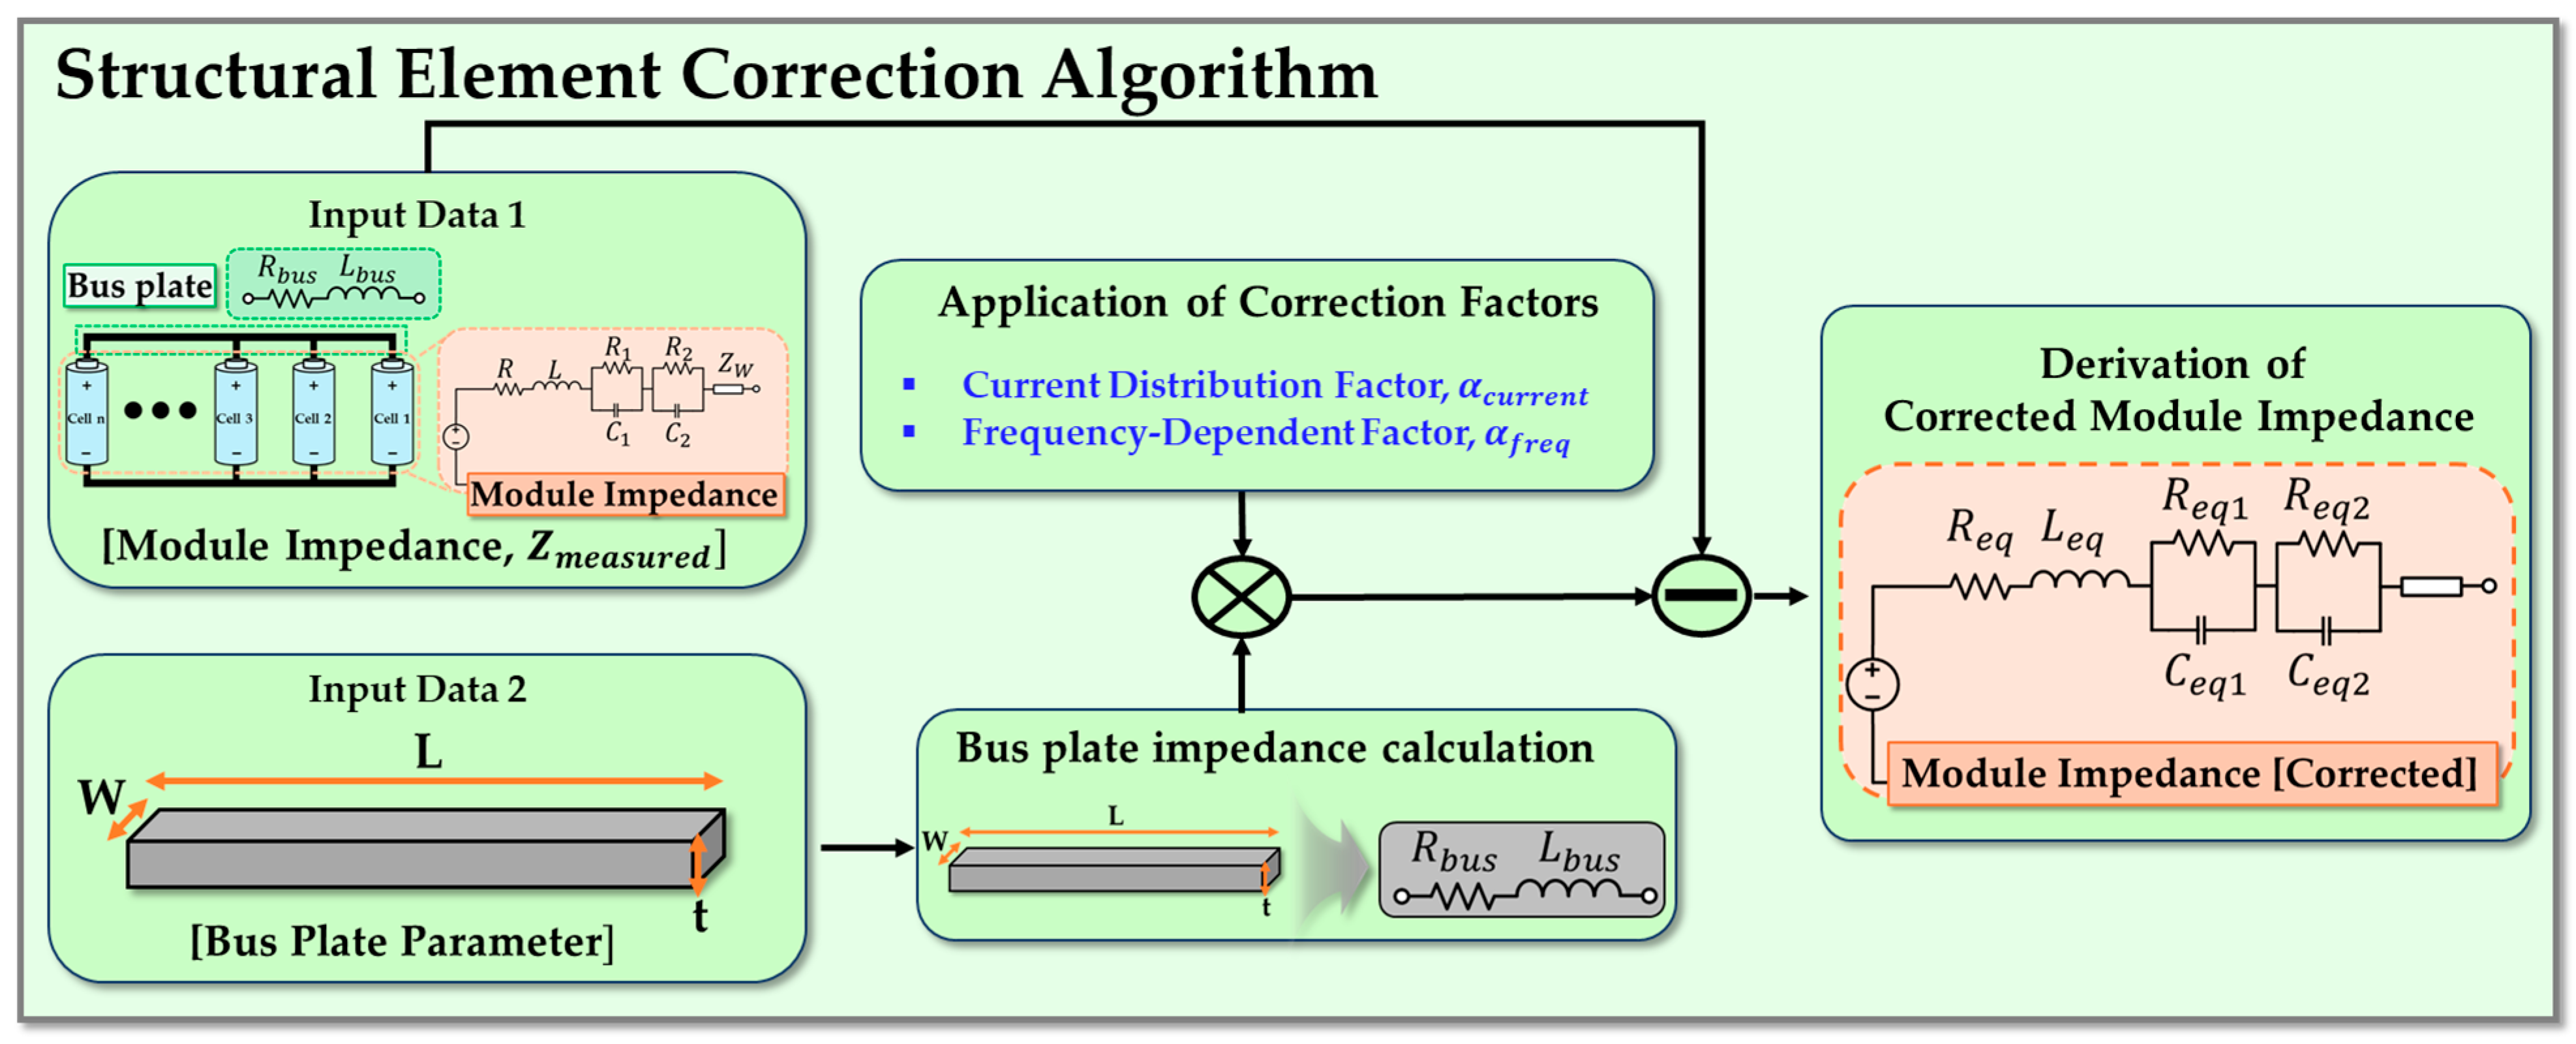
The algorithm consists of four main steps. In the first step, EIS measurement data of the battery module and bus plate parameters including length (L), width (W), thickness (t), and conductivity are input. In the second step, the impedance of the bus plate is calculated using the geometric parameters input. The resistance and inductance components of the bus plate are calculated separately to derive the impedance in the frequency domain. In the third step, correction factors reflecting current distribution effects according to the number of parallel cells and frequency dependence are calculated. These factors are multiplied with the bus plate impedance to estimate the actual influence on the measured values. In the fourth step, the corrected bus plate impedance is subtracted from the measured module impedance to extract the pure battery module impedance.
Figure 3 illustrates the overall structure of the proposed correction algorithm. As shown in the figure, the algorithm proceeds in the sequence of bus plate impedance calculation, correction factor application, and final correction after receiving measurement data and geometric parameters as inputs. Each step has a clear physical meaning.
To validate the developed algorithm, the following methodology is employed. First, EIS measurements of single cells are conducted to obtain impedance data across frequencies. These are calculated according to parallel connection theory to derive the ideal module impedance. Next, a battery module including actual bus plates is configured and EIS measurements are performed. The proposed algorithm is then applied to derive the corrected module impedance. Finally, the algorithm performance is evaluated by comparing the ideal module impedance with the corrected module impedance. Root mean square error (RMSE) and mean absolute error (MAE) are used as quantitative evaluation metrics, and the algorithm effectiveness is validated through error reduction rates before and after correction.
The algorithm offers the advantage of being applicable to various module configurations, as correction is possible using only the geometric characteristics of the bus plate.
3. Development of Structural Element Correction Algorithm
As discussed in
Section 2, structural elements such as bus plates in EIS measurements of battery modules superimpose additional impedance components onto the measurement data, degrading measurement reliability. This section develops the core components of the algorithm to quantitatively analyze and correct the influence of these structural elements.
The development of the algorithm consists of addressing three key challenges. First, equations must be established to accurately predict bus plate impedance from geometric parameters. Second, correction factors must be derived to quantify how the obtained bus plate impedance is actually reflected in the measured values of parallel modules. Third, these components must be integrated to complete the algorithm in a practically applicable form and determine the necessary parameters.
Section 3.1 analyzes bus plate impedance characteristics. A theoretical model is presented and validated through experiments, establishing impedance equations including both real and imaginary components.
Section 3.2 derives correction factors for applying bus plate impedance to actual measurement correction. The limitations of simple subtraction methods are analyzed, and a correction factor model reflecting current distribution effects and frequency dependence is proposed.
Section 3.3 presents a methodology for determining the parameters required for the algorithm.
3.1. Bus Plate Impedance Analysis
Bus plates are metallic conductors for electrical interconnection between parallel-connected battery cells, possessing inherent resistance and inductance components. For the development of the correction algorithm, equations are required to accurately predict bus plate impedance from geometric parameters such as length and thickness. This section presents a theoretical impedance model of bus plates, validates it through experiments, and establishes impedance equations including both real and imaginary components.
3.1.1. Theoretical Bus Plate Impedance Model
Bus plate impedance consists of resistance and inductance components, which can be calculated based on the physical properties of the conductor.
The resistance of a conductor is determined by the resistivity of the material and its geometric configurations. The theoretical resistance of a conductor,
, with uniform dimensions is expressed as follows:
where
is the resistivity of the material, L is the length of the bus plate, W is the width, and t is the thickness. The resistivity of the nickel bus plate used in this study is
.
A planar conductor forms a magnetic field around it when current flows, resulting in an inductance component. The inductance of the bus plate,
, increases proportionally to length and can be expressed as inductance per unit length:
where
is the inductance per unit length
. The reactance,
, due to the inductance component is affected by frequency and is expressed as follows:
Therefore, the theoretical model of bus plate impedance,
, is expressed as follows:
The proposed theoretical model is based on several physical assumptions regarding the validity conditions of the geometric-to-impedance mapping. First, mutual inductance between parallel bus plates and between parallel cells is neglected. This assumption is valid in battery EIS applications where measurements employ small-signal AC currents, typically tens to hundreds of milliamperes, and where bus plate spacing is determined by cell diameter, ranging from 18 to 21 mm for cylindrical cells. This results in spacing-to-width ratios typically exceeding 2. Under these conditions, mutual inductance remains below 10% of self-inductance and can be neglected [
37,
38,
39]. Second, the model assumes linear impedance characteristics,
, independent of current magnitude. This linearity holds when skin effect is negligible, which occurs when conductor thickness is smaller than the skin depth
. Battery EIS is typically performed in the frequency range from 0.01 Hz to 10 kHz, and within this frequency band, nickel bus plates with thickness below 0.5 mm exhibit skin depths ranging from 0.2 to 2 mm, significantly larger than the conductor thickness, ensuring uniform current distribution [
40,
41]. The experimental conditions in this study, with 0.15–0.2 mm thickness, 0.1–1 kHz frequency range, and 21,700 cylindrical cells with approximately 21 mm spacing, fall within these generally applicable conditions for battery module EIS measurements. While the theoretical model can predict impedance trends according to geometric parameters under these assumptions, experimental validation is necessary as differences from theoretical values can occur due to manufacturing non-uniformities and environmental factors such as temperature. Beyond the stated conditions, such as very high frequencies exceeding 10 kHz, high-current pulse measurements, elevated temperatures above 60 °C, or significantly different cell geometries—additional considerations for skin effect, temperature dependence, and mutual coupling may be required.
3.1.2. Bus Plate Impedance Measurement and Validation
To validate the theoretical model and analyze differences from actual measured values, standalone EIS measurements of bus plates were conducted.
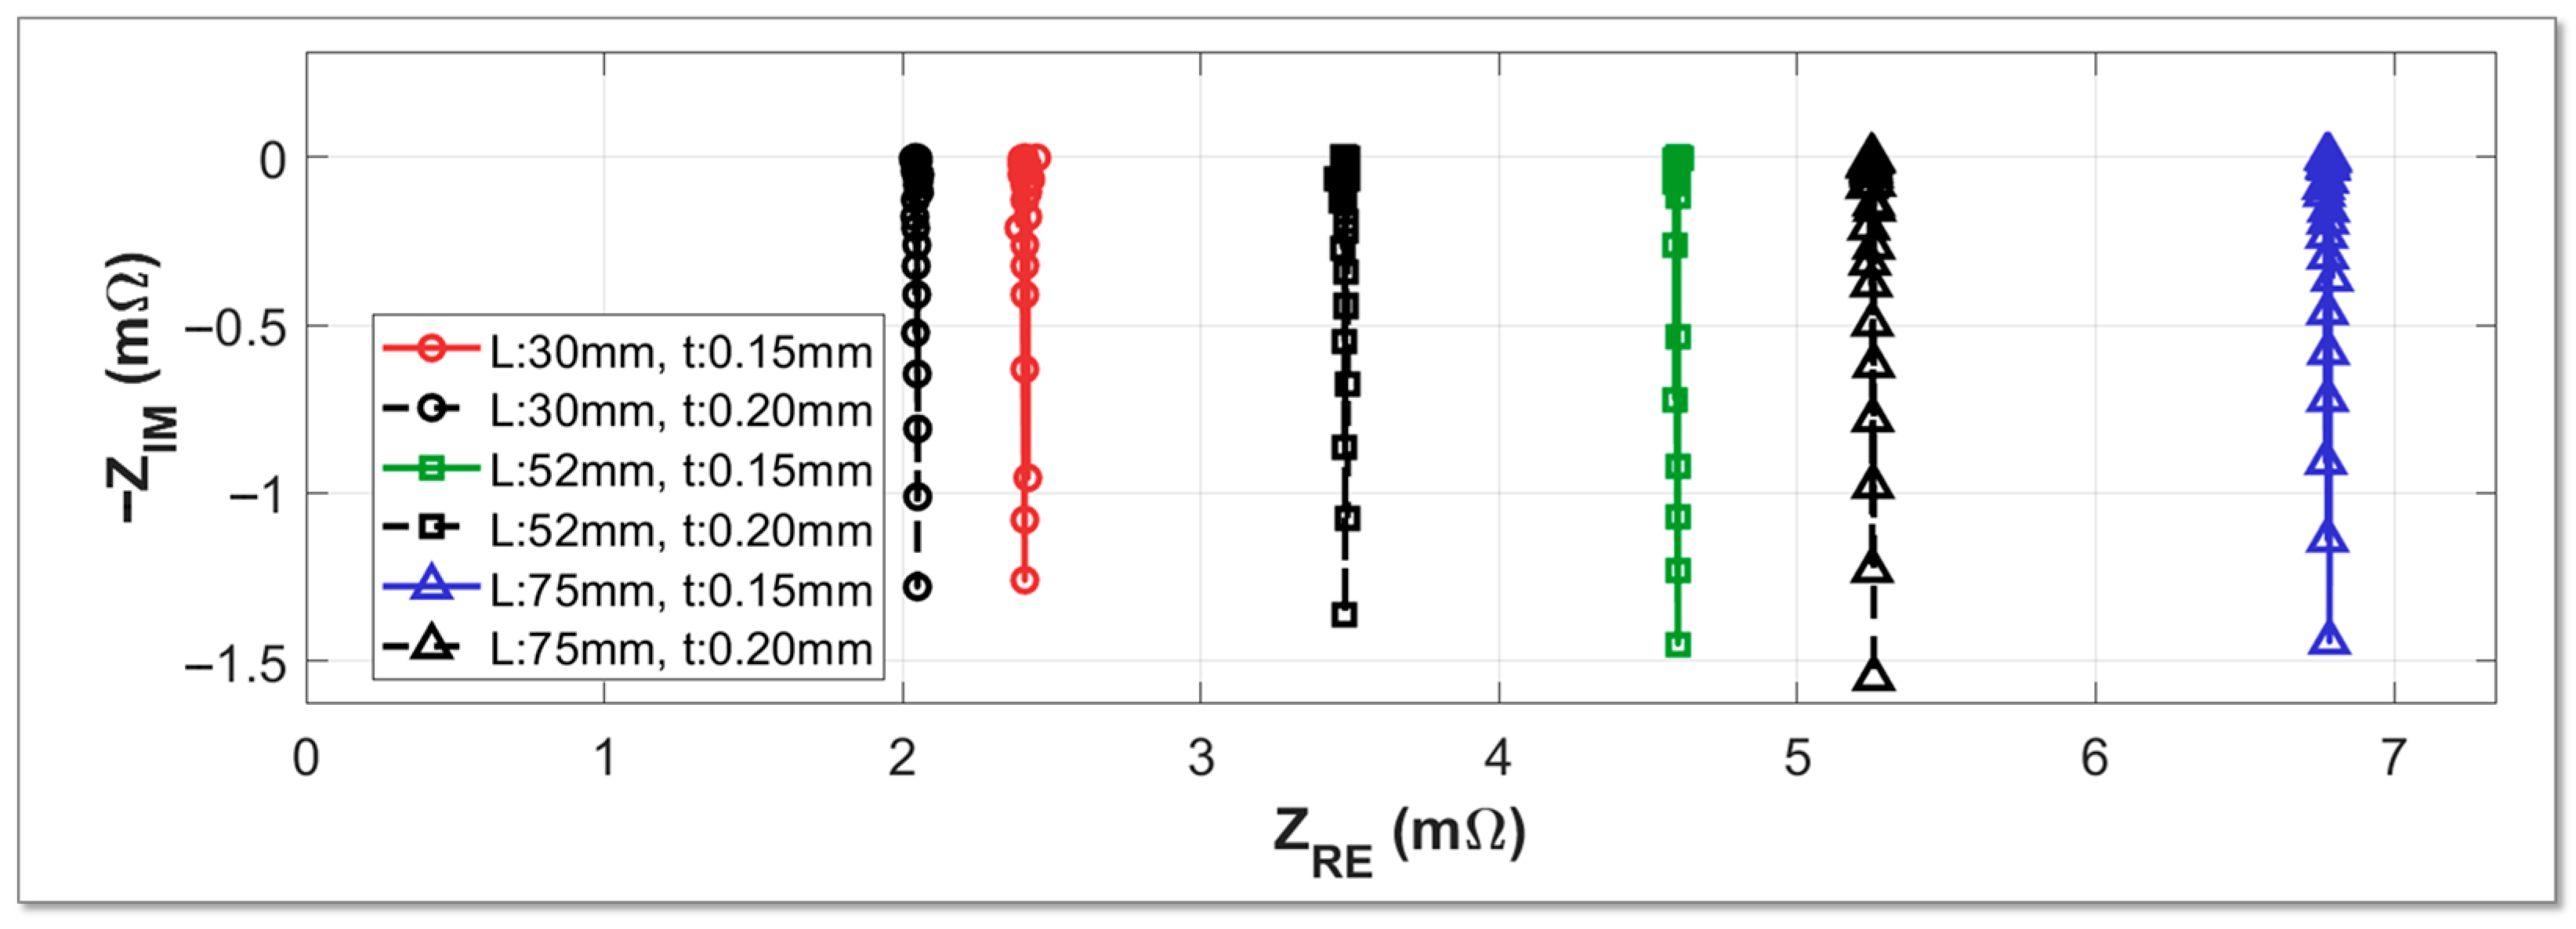
Bus plate samples with various geometric conditions were fabricated to measure impedance characteristics. Sample specifications are as follows: combinations of lengths of 30 mm, 52 mm, and 75 mm with thicknesses of 0.15 mm and 0.2 mm, totaling six cases, while the width was kept constant for all samples.
EIS measurements were performed using a Hioki BT4560-50 (HIOKI, Nagano, Japan) instrument in the frequency range from 0.1 Hz to 1 kHz. Measurement probes were connected to both ends of the bus plate to measure impedance across frequencies.
Figure 4 shows the measurement results for each case in Nyquist plots. As shown in the figure, both the real and imaginary parts increase as the bus plate length increases.
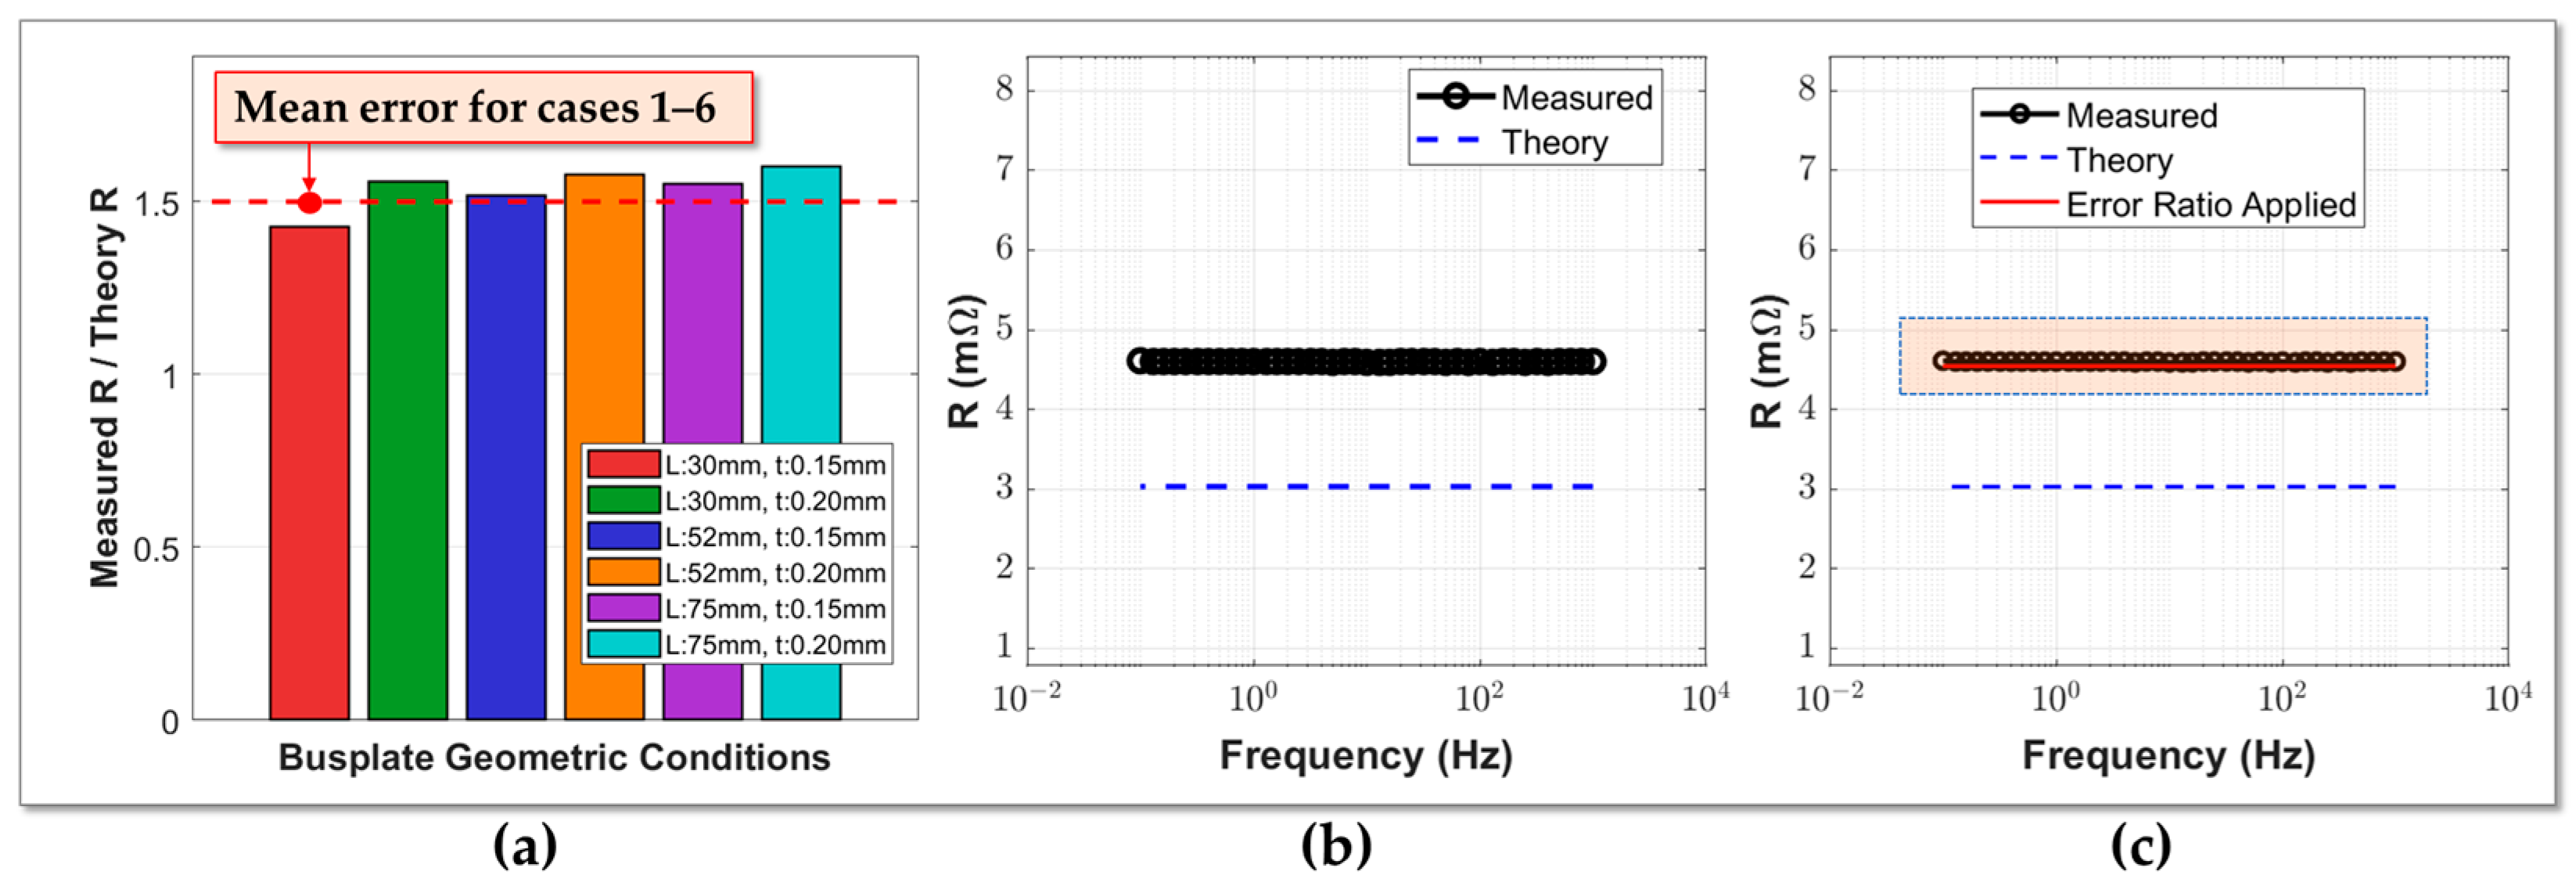
Comparing the measured real part values with theoretical values revealed a consistent error ratio across all cases.
Figure 5b shows a representative comparison between measured and theoretical values for a 52 mm length, 0.15 mm thickness sample across frequencies, confirming that measured values are consistently higher than theoretical values.
Figure 5a presents the ratio of measured to theoretical values for all six cases, showing similar error ratios across all cases. Based on these results, the average error ratio observed across the six cases was calculated and applied to the theoretical model.
Figure 5c compares the corrected values incorporating the error ratio with measured values, representatively showing the 52 mm, 0.15 mm sample. As shown in the figure, the corrected values align well with the measured values after applying the error ratio.
Subsequently, inductance characteristics of the bus plates were identified through imaginary part data analysis.
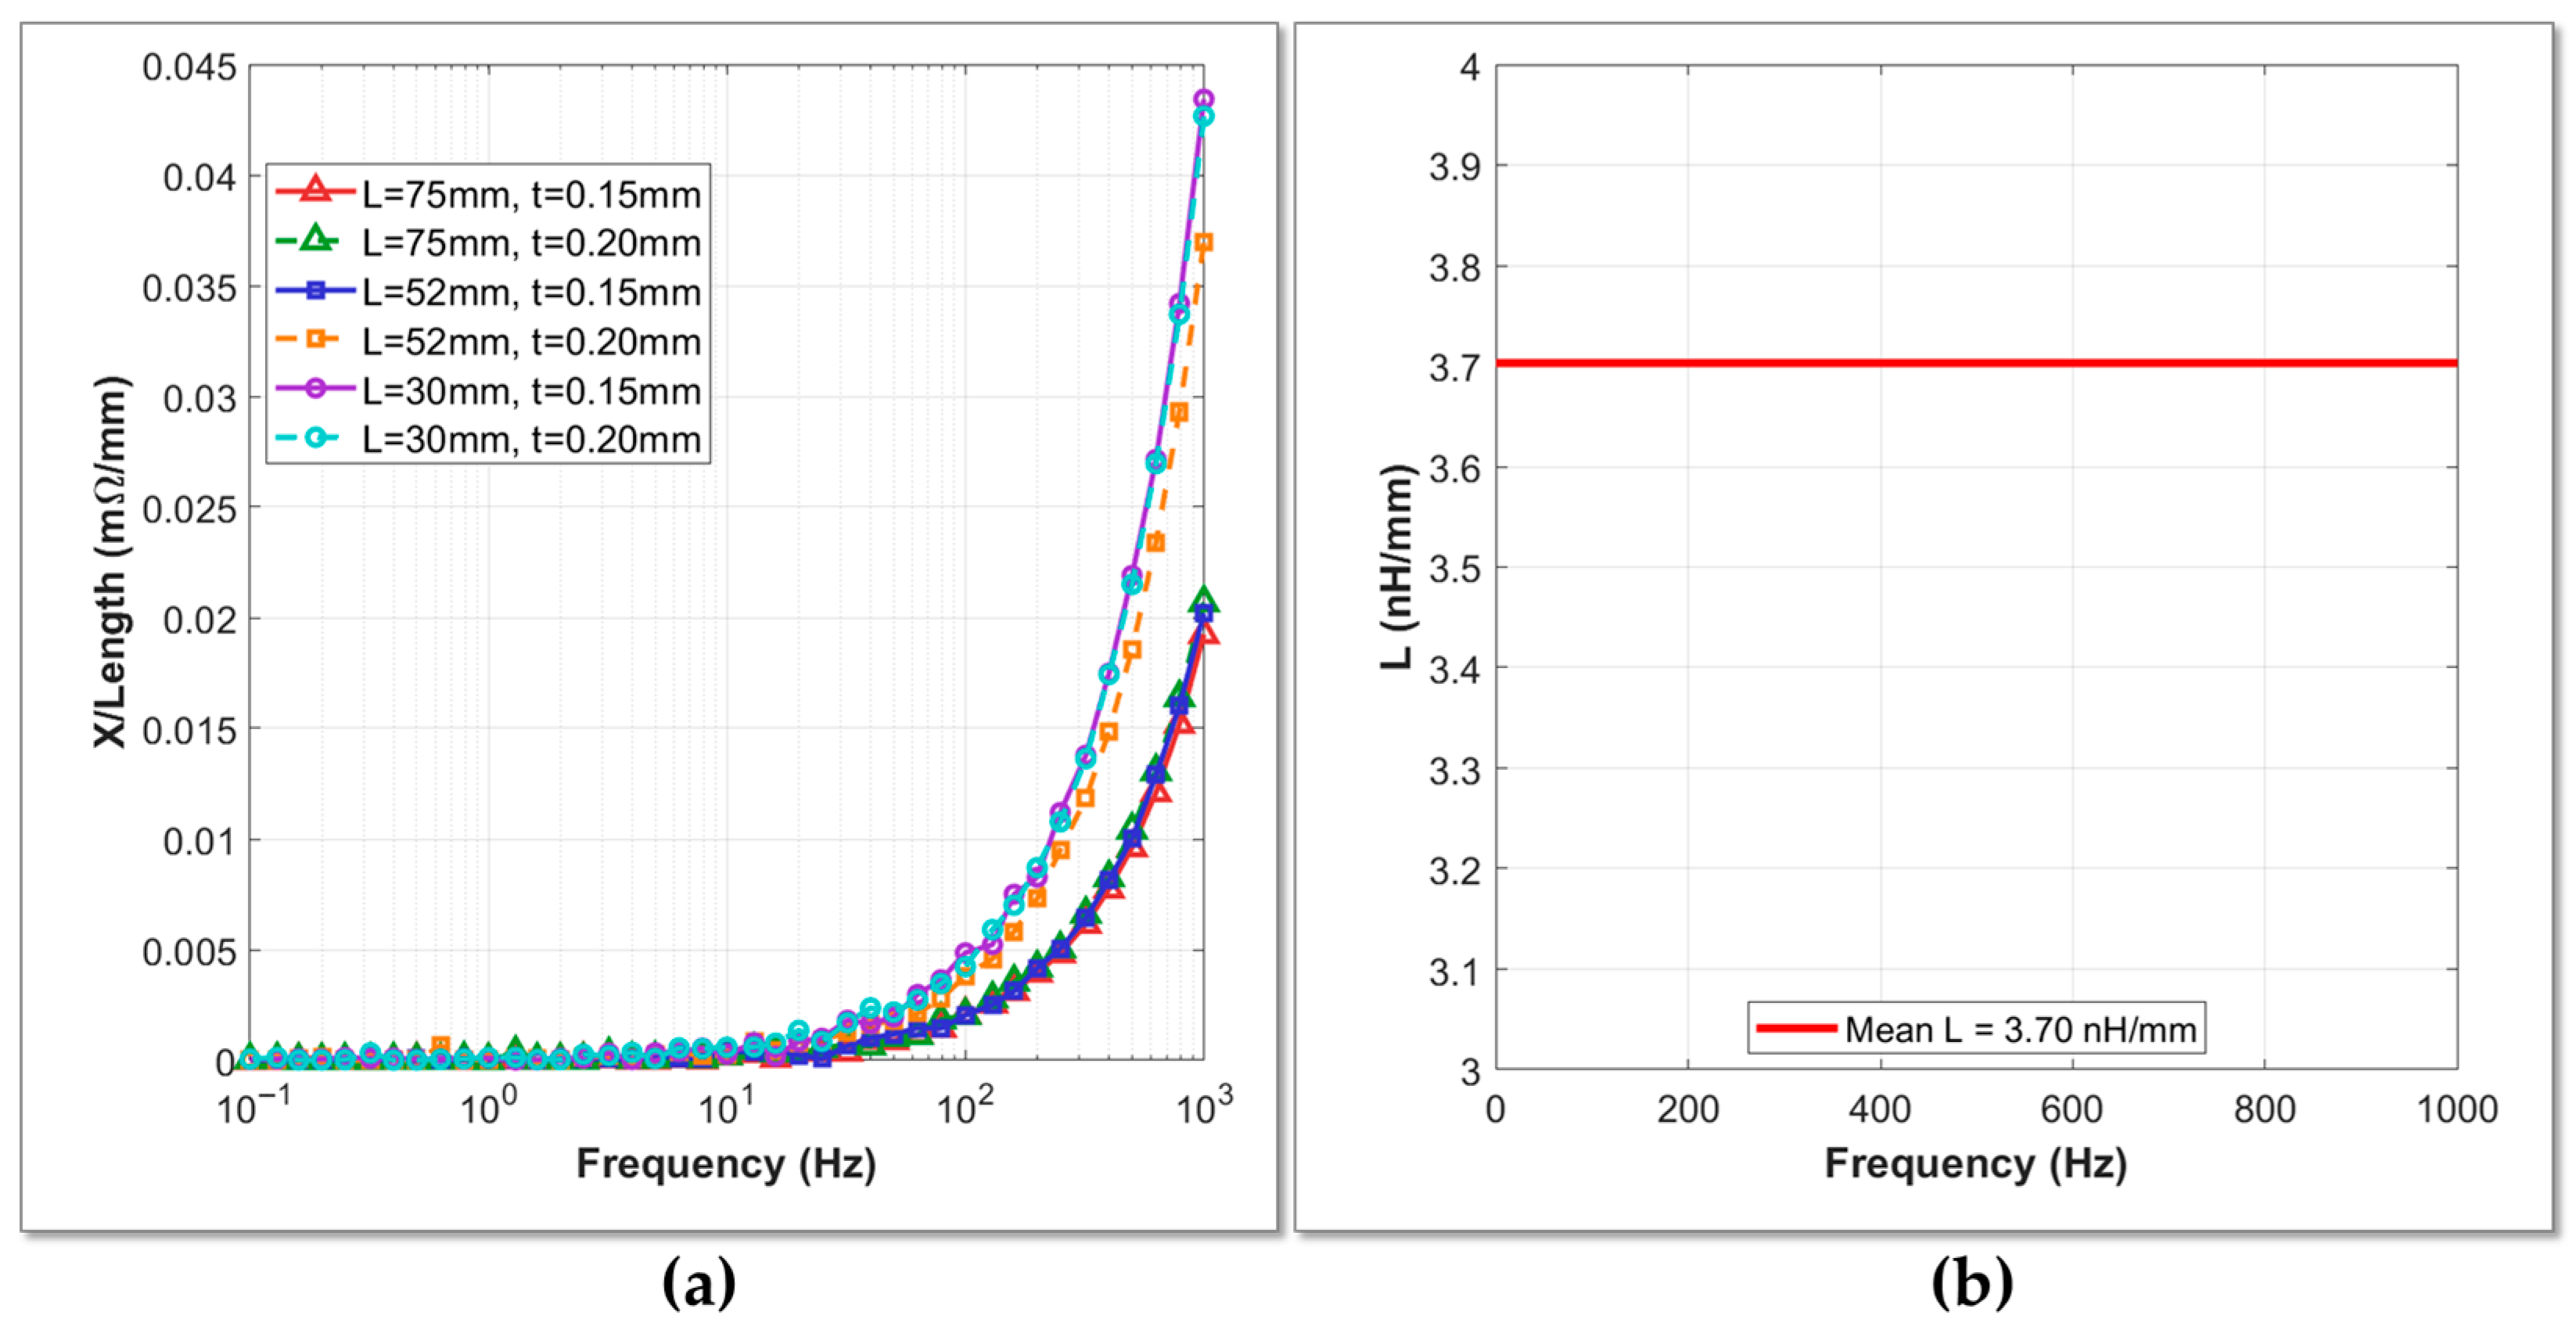
Figure 6a shows the reactance of bus plates measured through experiments according to frequency. As shown in the figure, the reactance increases as the bus plate length increases. To quantify this relationship, inductance was calculated from the reactance data of each sample and divided by the bus plate length to derive the inductance per unit length.
Figure 6b shows the average inductance coefficient per unit length calculated across the entire frequency range, L′, which is approximately 3.7 nH/mm.
Based on the analysis results, the impedance of the bus plate is finally expressed as follows:
where
is the experimentally derived resistance correction coefficient,
is the resistivity of nickel (6.99 × 10
−8 Ω·m), and
is the inductance per unit length (3.7 nH/mm). Through this equation, bus plate impedance can be predicted using only the geometric parameters of the bus plate.
3.2. Application Method of Bus Plate Impedance
The bus plate impedance equation derived in
Section 3.1 represents the electrical characteristics of the bus plate itself. However, in actual parallel modules, the influence of the bus plate on measured values does not simply appear as added impedance. Therefore, to apply the bus plate impedance derived in
Section 3.1 to the actual correction algorithm, it is necessary to derive correction factors.
To derive correction factors, experimental data that can quantitatively analyze the influence of bus plates is required. For this purpose, EIS measurements of single cells and parallel modules were sequentially performed. The batteries used in the experiments were SAMSUNG INR21700-40T NCA (SAMSUNG, Seoul, Korea) batteries, and all measurements were conducted at 50% SOC and 100% SOH.
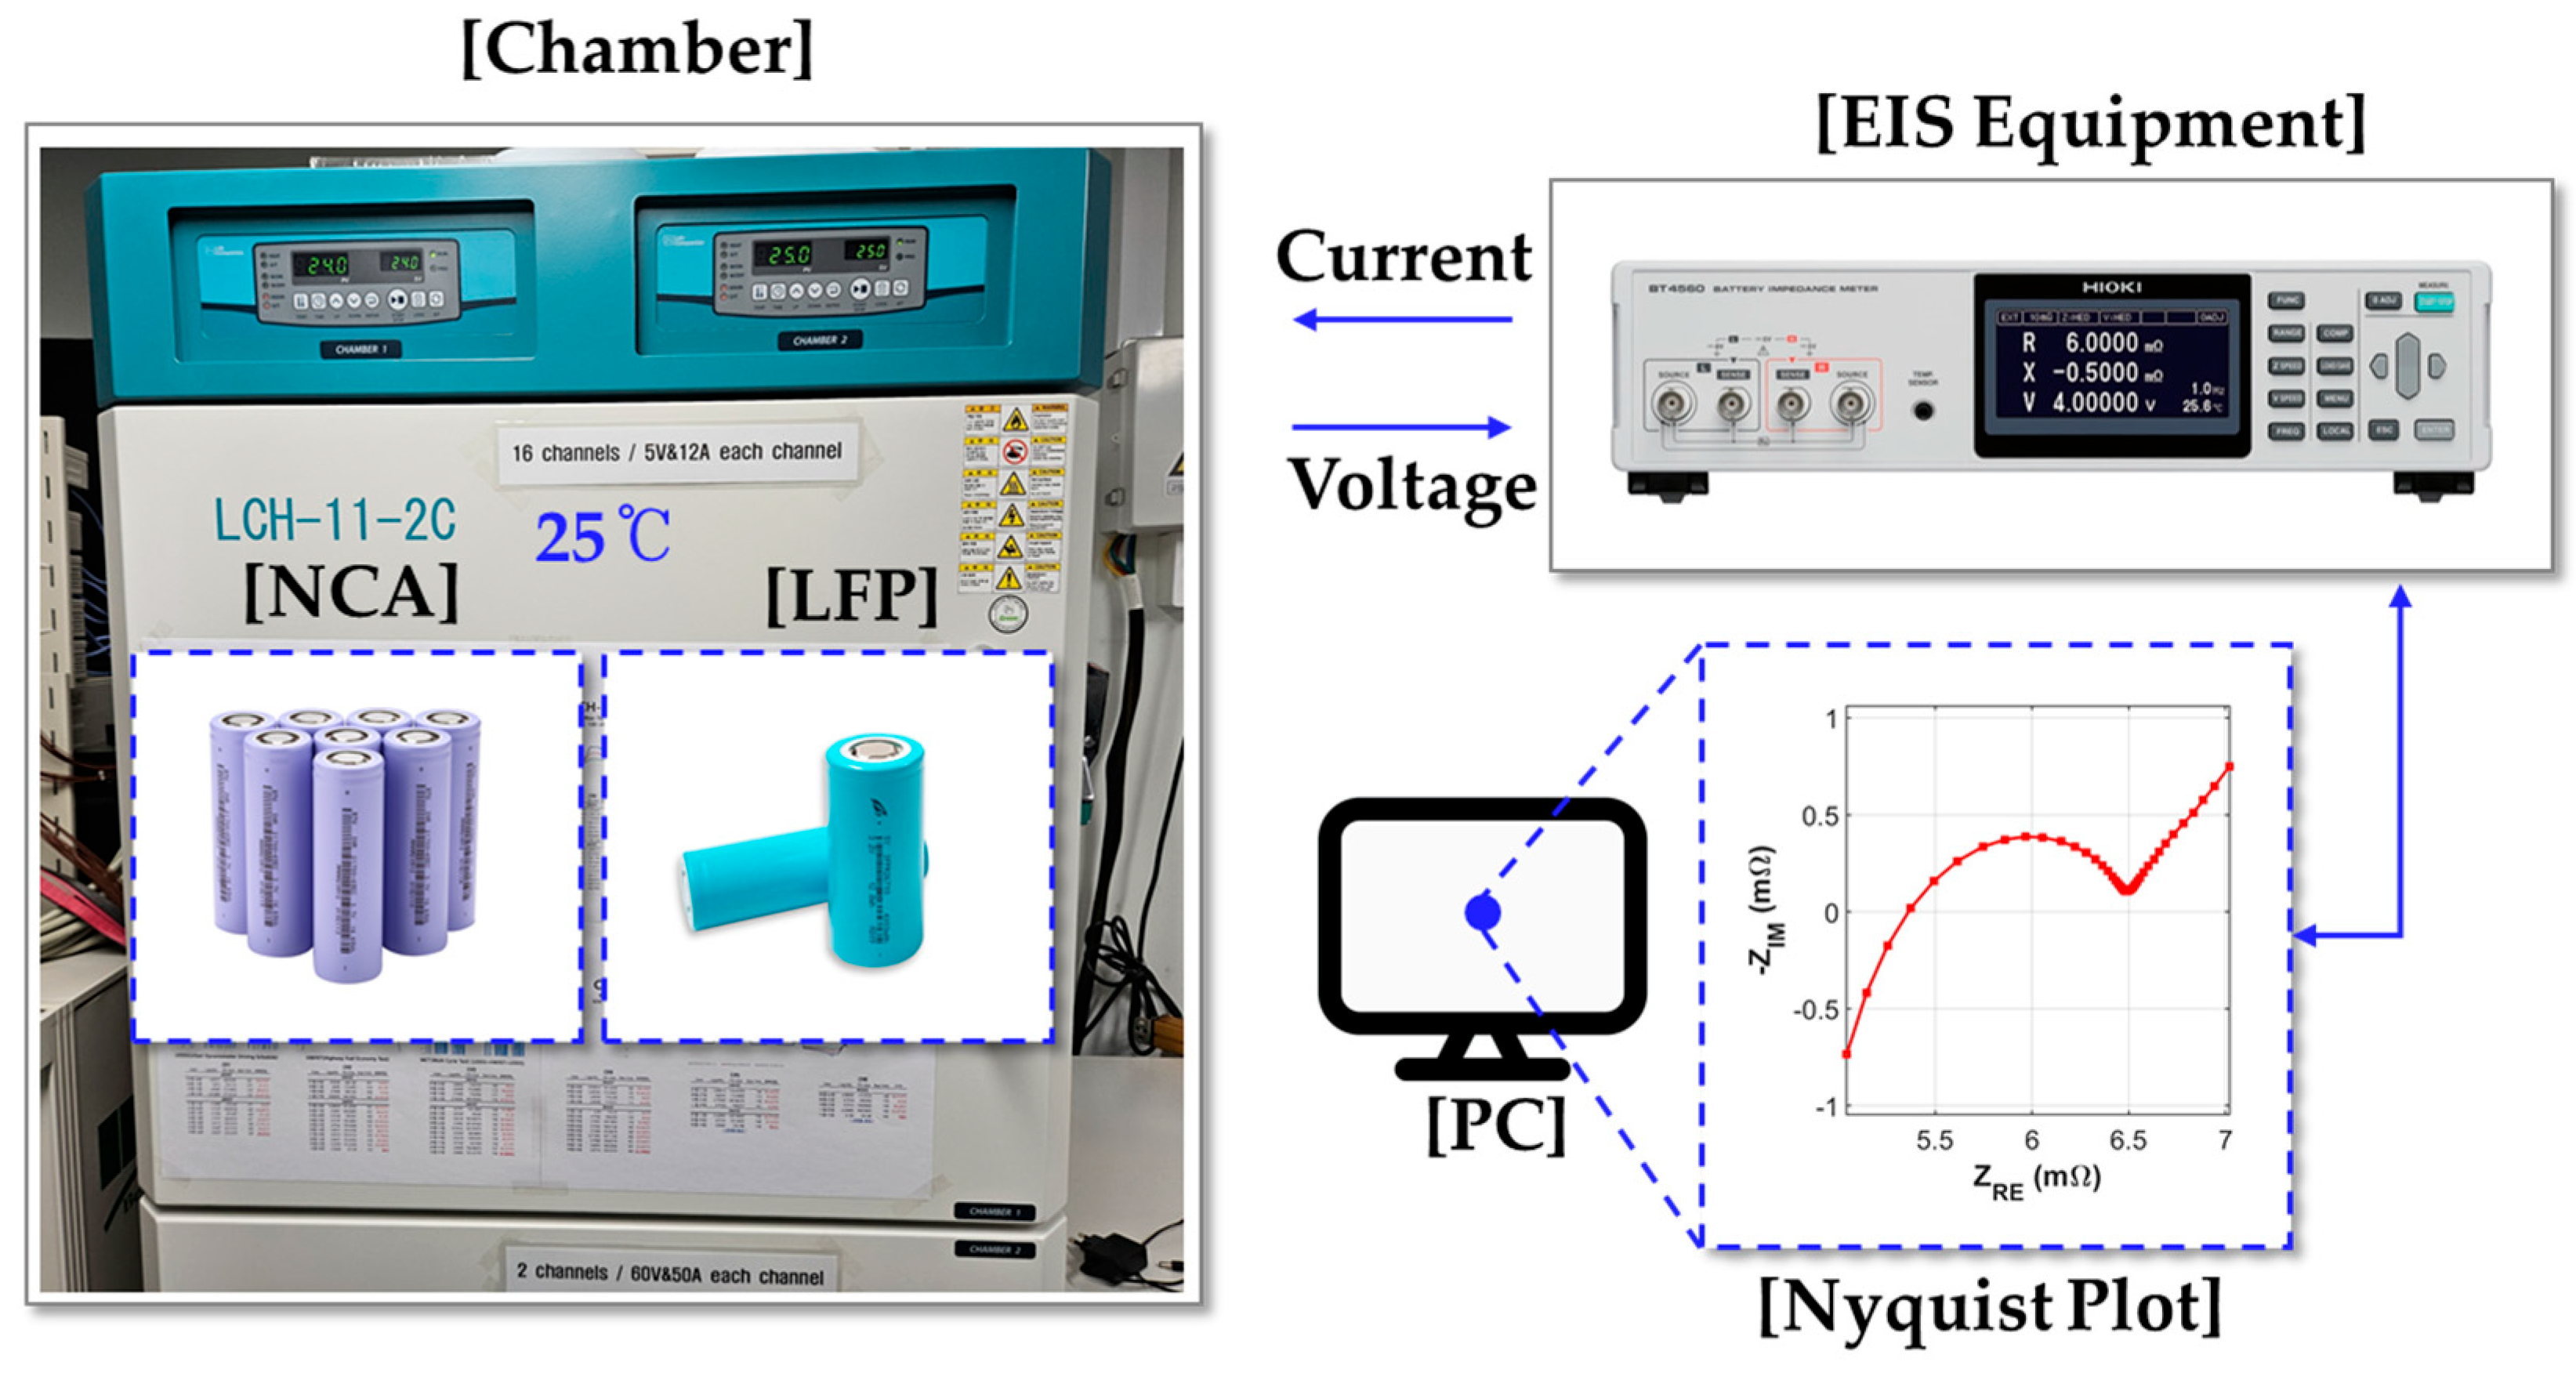
Figure 7 shows the experimental setup. EIS measurements were performed using a Hioki BT4560-50 (HIOKI, Nagano, Japan) battery impedance meter, with the frequency range set to 41 points on a logarithmic scale from 0.1 Hz to 1 kHz. Additionally, to eliminate impedance changes due to temperature, measurements were conducted while maintaining 25 °C in a temperature chamber.
The measurement protocol is as follows. First, EIS measurements of each individual cell were conducted before configuring parallel modules to obtain reference data. Subsequently, the same cells were connected in 2P, 3P, and 4P parallel configurations and EIS measurements were performed.
3.2.1. Necessity of Correction Coefficient
The most straightforward approach to eliminate the influence of bus plates is to directly subtract the bus plate impedance from the measured module impedance . This method has the advantage of simple calculation. However, overcorrection of impedance data occurs in actual application.
To verify this, EIS measurements of each individual cell constituting the parallel module were conducted, and the ideal module impedance was calculated by applying parallel connection theory. The ideal impedance for parallel connection of n cells is calculated as follows:
where
is the impedance of the i-th cell constituting the parallel module at frequency f. This ideal value represents the pure impedance of the parallel module without the influence of bus plates.
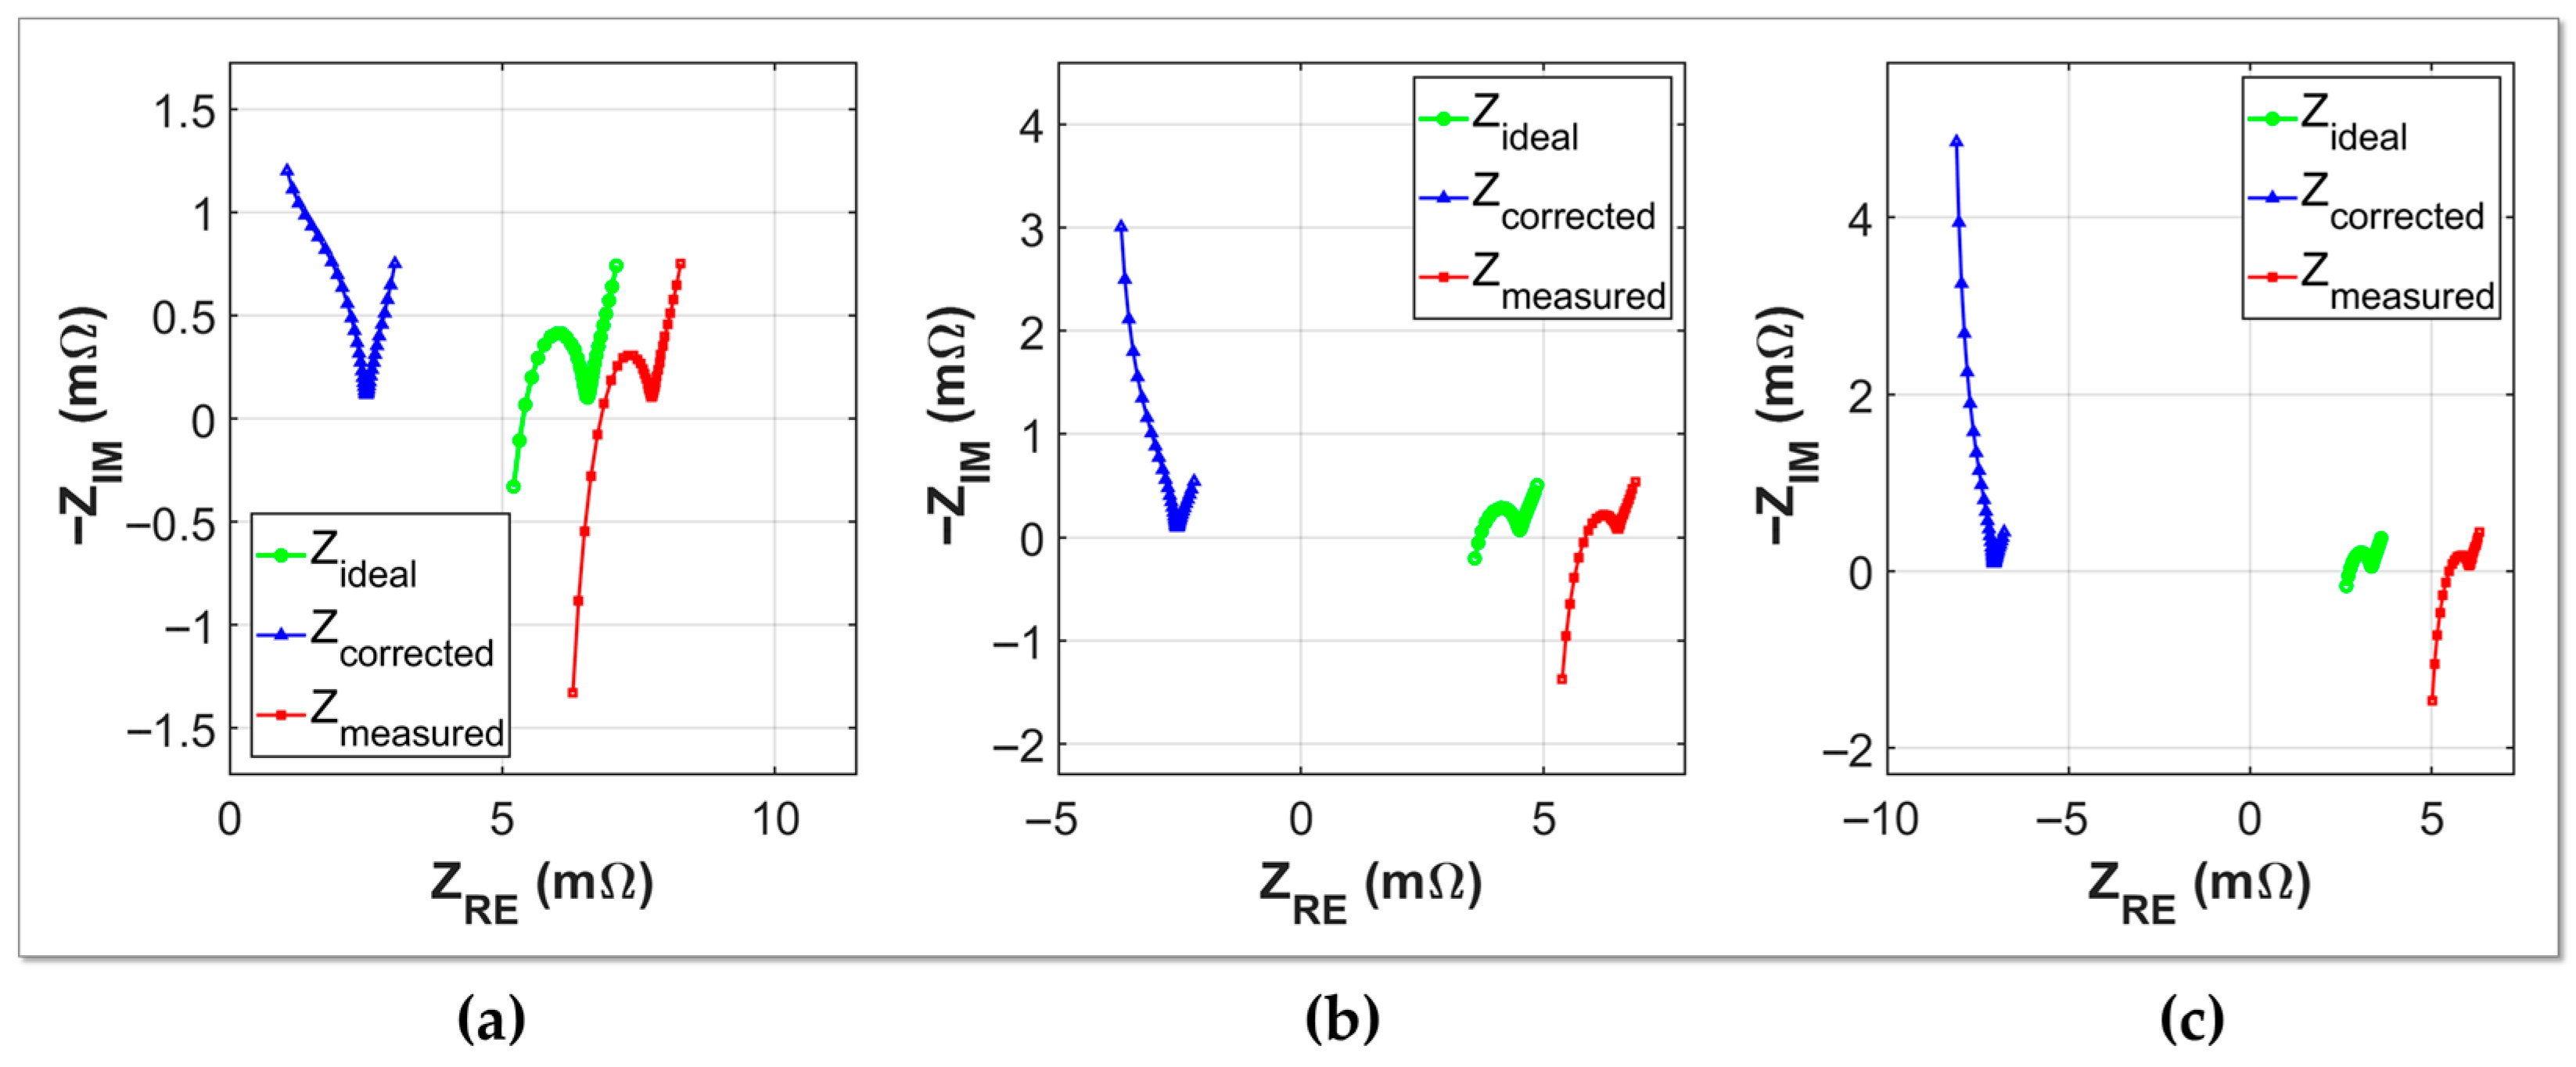
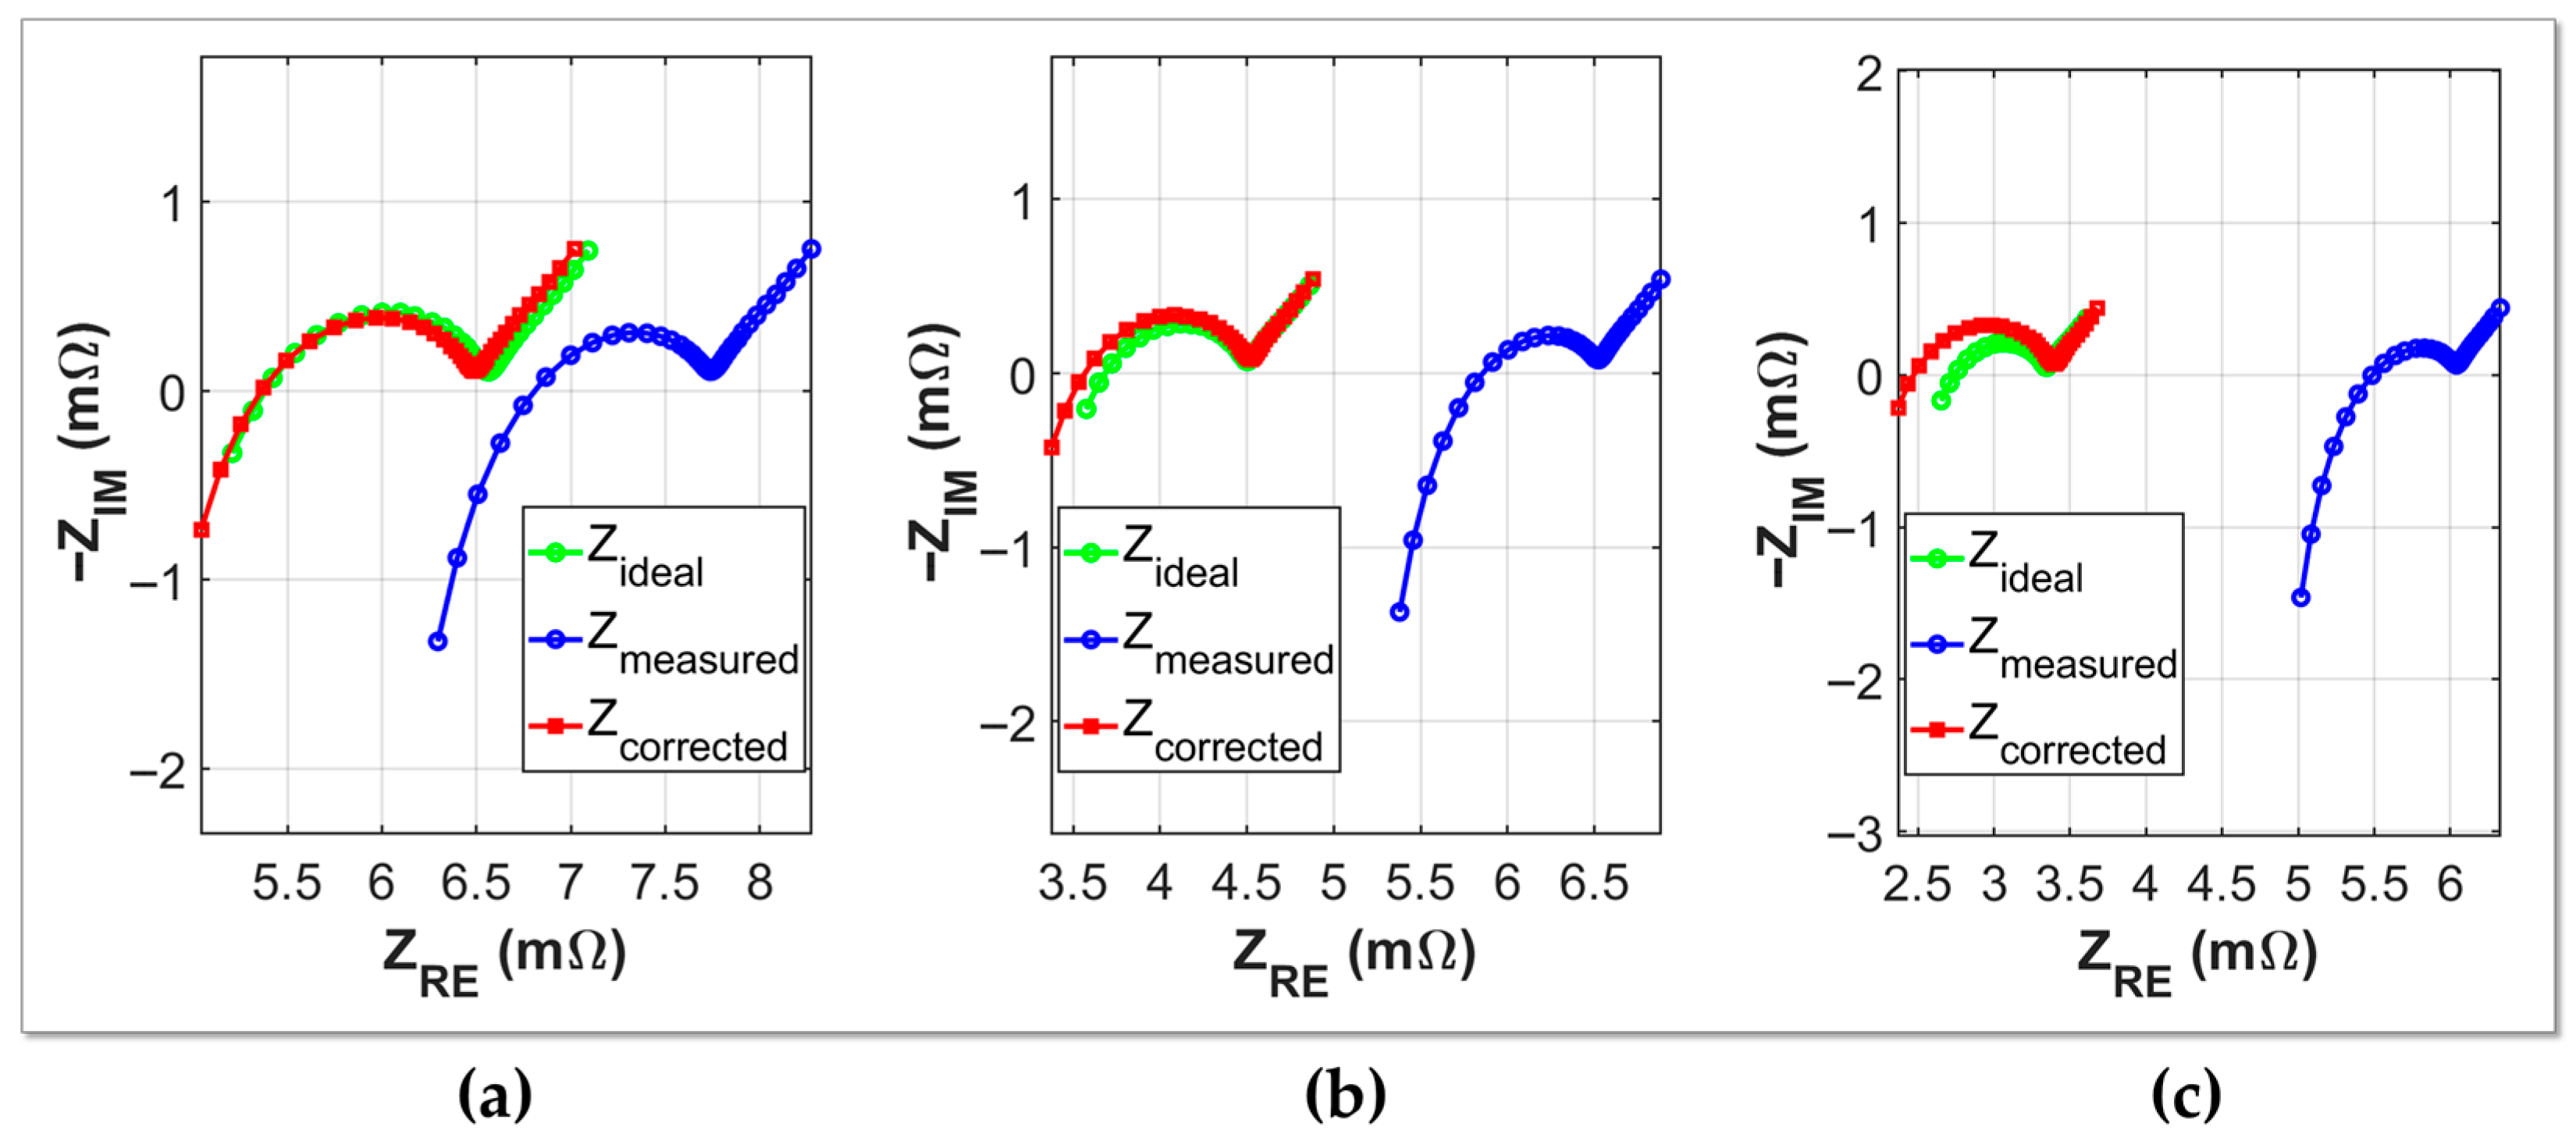
Figure 8 shows the results for verifying the overcorrection problem of the direct subtraction method. For 2P, 3P, and 4P module configurations, the actual measured values (
), corrected values with direct subtraction of bus plate impedance (
), and ideal module impedance calculated from individual cell data (
) are compared in Nyquist plots. In all three cases, the corrected values show significantly smaller values in both real and imaginary parts compared to the ideal values. In other words, the influence of bus plates is excessively removed, resulting in underestimation of impedance compared to the actual values.
This overcorrection phenomenon intensifies as the number of parallel cells increases. While module impedance decreases due to parallel connection, subtracting the bus plate impedance entirely does not accurately reflect the physical mechanism by which bus plates actually contribute to the measured values.
Therefore, application of correction factors that quantify the actual contribution of bus plates is necessary.
3.2.2. Derivation of Correction Coefficient
The overcorrection problem identified earlier indicates that the influence of bus plates cannot be simply represented as a series-connected impedance. In actual parallel modules, the extent to which bus plates contribute to measured values is determined by two primary factors.
The first factor is the current distribution effect according to the number of parallel cells.
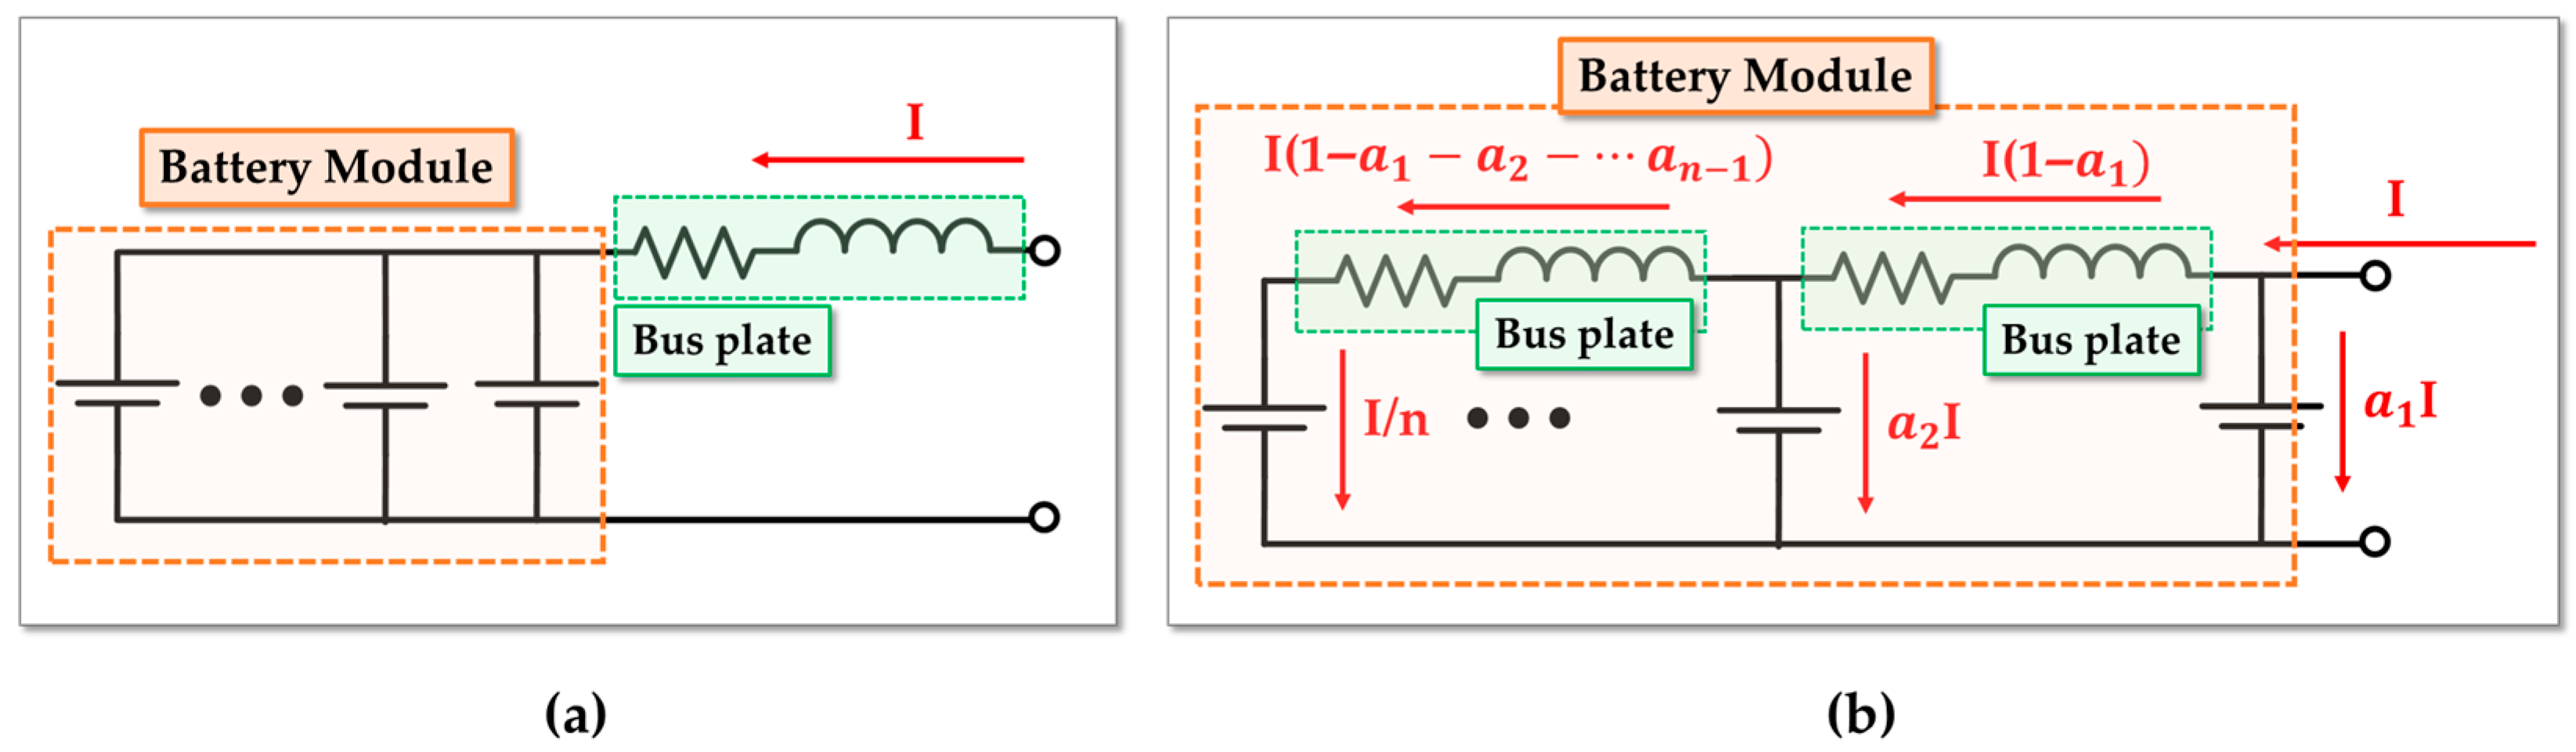
Figure 9 illustrates the difference in current distribution between the direct subtraction method and actual parallel connection.
The direct subtraction method is equivalent to assuming that the bus plate exists only at the module terminal, in which case the total current I passes through the bus plate. However, in actual parallel modules, bus plates are located between each cell, and current is distributed to the cells at each branch point.
When n parallel cells are connected, if a current of
flows to the i-th cell, the current passing through the bus plate becomes
. Due to this current distribution effect, the contribution of the bus plate decreases as the number of parallel cells increases. To quantify this, a correction factor
accounting for current distribution is defined as follows:
where
is the current distribution coefficient according to the number of parallel cells, and n is the number of parallel cells. This equation indicates that the contribution of the bus plate decreases as the number of parallel cells increases.
The second factor is frequency dependence.
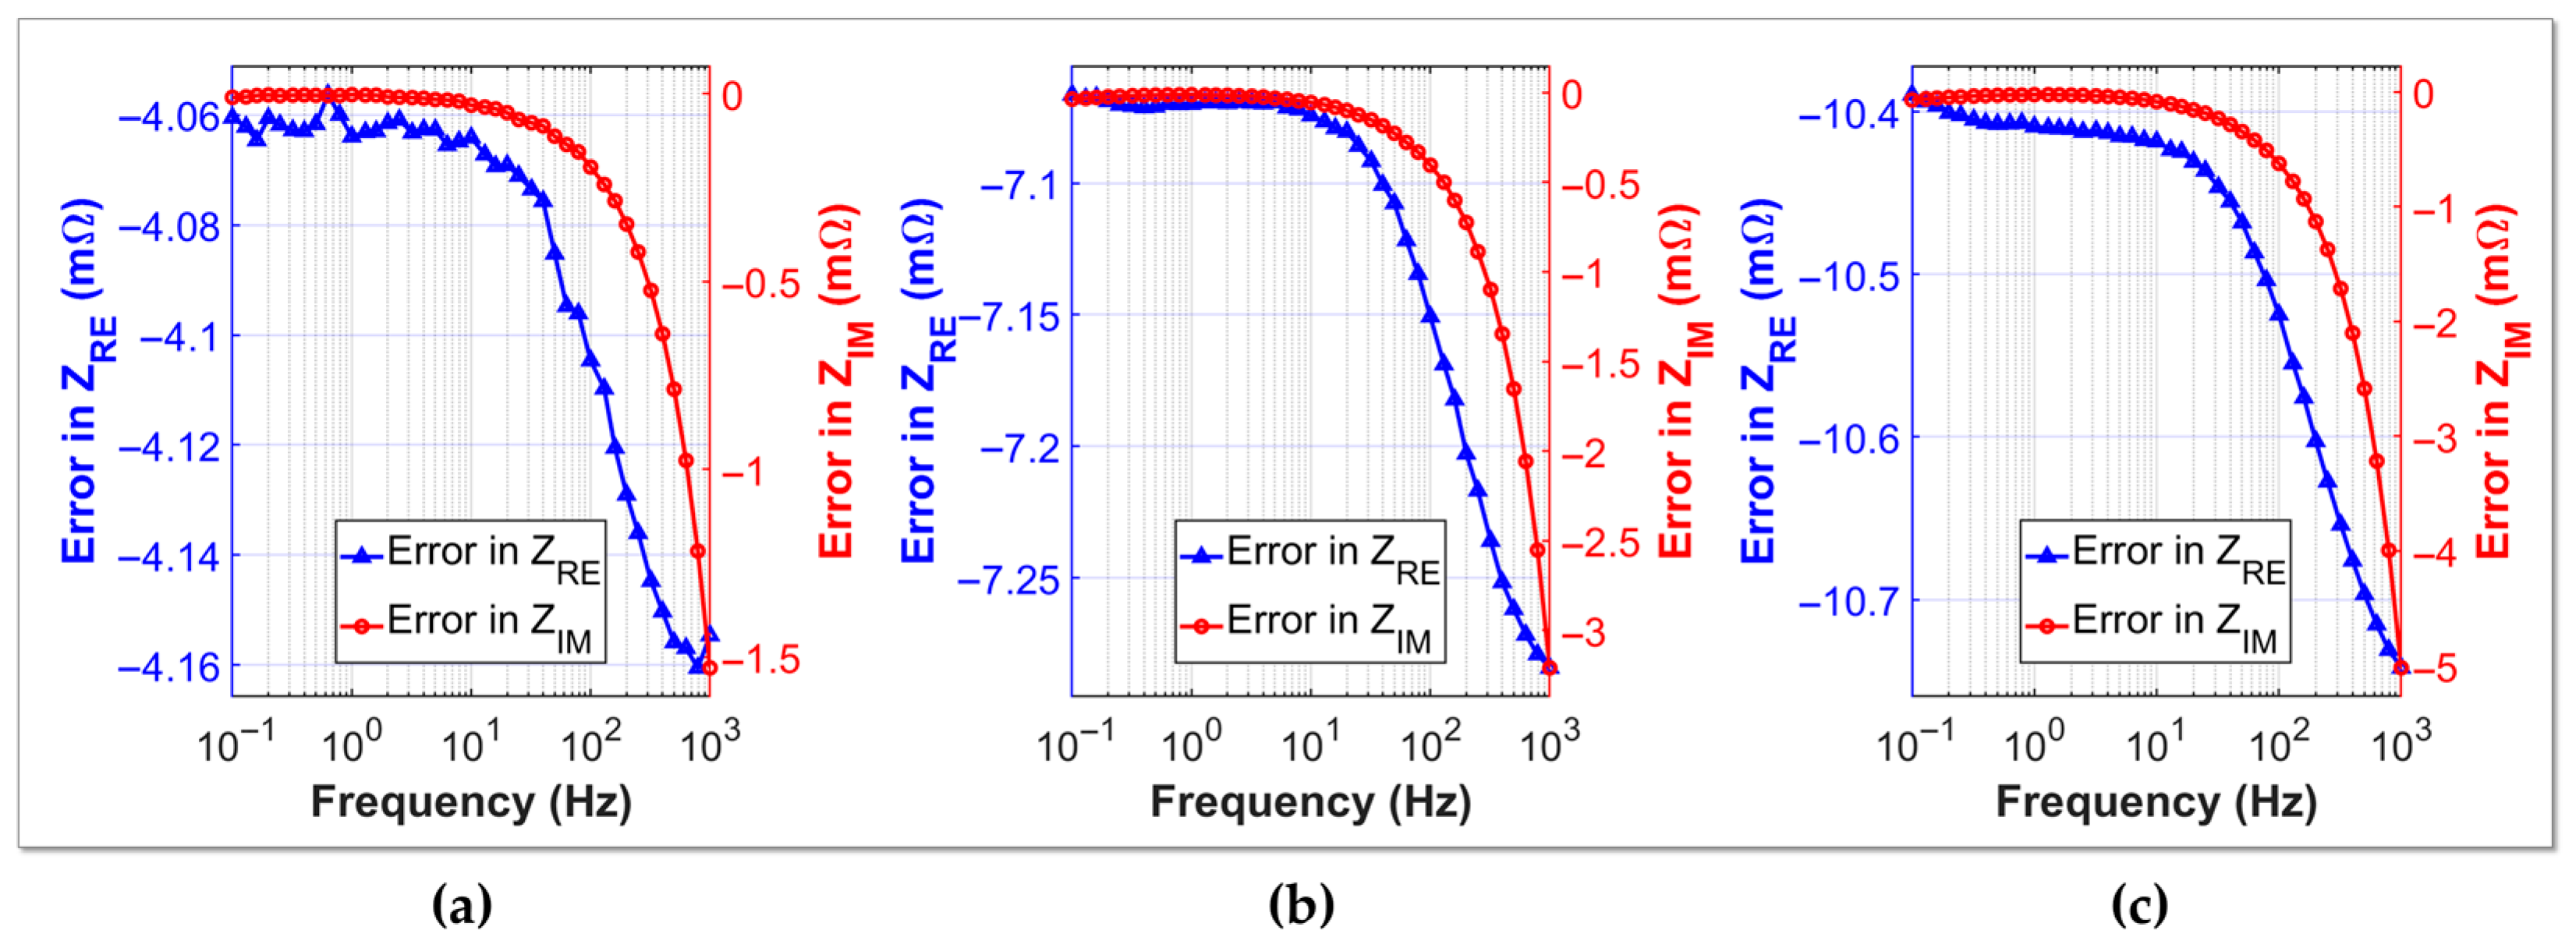
Figure 10 shows the analysis of error between corrected values calculated by the direct subtraction method and ideal values across frequencies. The error rate appears differently according to frequency in both real and imaginary parts. This is because the impedance characteristics of the bus plate and battery module change differently with frequency.
As shown in the figure, the error exhibits different trends according to frequency, with varying magnitudes of difference between the real and imaginary parts. To reflect these characteristics, different correction factors are applied in the low-frequency and high-frequency regions based on a boundary frequency
, and they are defined independently for the real and imaginary parts:
The overall correction coefficient integrating current distribution effects and frequency dependence, and the module impedance with bus plate influence removed by applying the correction coefficient, are defined as follows:
where
represents the contribution of the bus plate considering parallel configuration and frequency characteristics.
3.3. Determination of Model Parameters
The structural element correction model derived in
Section 3.2 consists of the current distribution coefficient
and frequency correction coefficients
,
,
,
. To determine these parameters, a two-step approach was employed: first, correction factors are extracted from measurement data, and then model parameters are optimized based on these results.
In the first step, correction factors are extracted using the difference between the actually measured module impedance and the ideal parallel impedance calculated from individual cells. This difference represents the influence of the bus plate, and dividing it by the bus plate impedance yields the actual contribution ratio of the bus plate reflected in the measured values:
where
represents the number of cells in the parallel configuration, and
represents each frequency point. By separating the real and imaginary parts, correction factors for each can be calculated as follows:
Through this process, actual correction coefficients are obtained for each parallel configuration and frequency combination.
In the second step, model parameters are determined by minimizing the error between the extracted correction coefficients and values calculated from the correction model proposed in
Section 3.2. An exhaustive search method was employed, with search ranges established based on measurement data analysis. The geometric attenuation parameter β was searched within 0.01 to 0.15 with a grid spacing of 0.001, and frequency-dependent coefficients c were searched within 0.20 to 0.40 with a grid spacing of 0.005, resulting in approximately 237,000 parameter combinations for the real and imaginary parts, respectively. The error function is defined as follows:
The optimization procedure evaluated all parameter combinations within the defined search space, calculating the total error across all parallel configurations (2P, 3P, 4P) and frequency points (0.1 Hz to 1 kHz). The parameter set that minimized the total error was selected as the optimal solution. It is important to note that this exhaustive search is performed only once during the algorithm development phase to determine the optimal parameter set. Once these parameters are established for a given battery module geometry, the correction algorithm becomes a simple algebraic calculation that can be applied in real-time without any iterative optimization. The optimized parameters consistently achieved relative errors below 5% across the entire measurement dataset, confirming the model’s accuracy and applicability for practical diagnostic applications.
5. Conclusions
This study analyzed the influence of bus plates that degrade the reliability of EIS measurements of battery modules and developed an algorithm to correct for this influence. An impedance model reflecting the geometric characteristics of bus plates was established, and correction coefficients considering current distribution effects according to the number of parallel cells and frequency dependence were derived to complete the correction algorithm. Model parameters were determined through back-calculation and optimization processes using measurement data, and the reliability and applicability of the proposed algorithm were validated by applying it to NCA and LFP battery modules.
The ideal parallel impedance calculated from EIS measurements of individual cells was set as the reference value, and errors before and after correction were quantitatively evaluated using RMSE and MAE. As a result, RMSE reduction rates of 88%, 95%, and 95% were achieved in 2P, 3P, and 4P modules of NCA batteries, respectively, and a 93% reduction rate was confirmed in LFP battery 3P modules. Errors after correction remained below 0.2 mΩ in all cases, demonstrating that the proposed algorithm can eliminate the influence of bus plates with high accuracy regardless of battery chemistry and parallel configuration.
These results confirm that this study can significantly improve the reliability of EIS measurements of battery modules. By accurately correcting the influence of structural elements, reliable impedance measurements become possible at the battery pack and module level, which can lead to improved accuracy in state diagnosis and lifetime prediction of large-capacity battery systems. However, several limitations and considerations should be acknowledged. The method was validated under conditions where bus plate impedance represents approximately 15–25% of total battery impedance, corresponding to fresh batteries at high SOH. This study did not validate the method under extreme conditions such as very low temperatures, extremely low SOC, or configurations with excessive numbers of parallel cells. The applicability of the correction method under such conditions will be validated in future research.
Since both bus plate resistance and battery electrochemical processes (such as SEI formation and charge-transfer resistance) contribute to the mid-frequency region of impedance spectra, concerns may arise that the correction process could potentially mask genuine battery degradation signatures. However, the algorithm developed in this study operates completely independently of the battery’s electrochemical state. Bus plate impedance is calculated based solely on geometric parameters (bus plate length, thickness, and position), and impedance changes caused by battery aging or degradation are not affected at all and remain fully preserved in the corrected data. Therefore, actual electrochemical changes within the battery, such as SEI growth and increased charge-transfer resistance, can be accurately detected even after correction. Future research is expected to further enhance the versatility of the algorithm through extended application to series-parallel hybrid configurations, various connection point geometries, and different bus plate materials, enabling more comprehensive correction capabilities for diverse battery pack architectures in practical battery systems.