1. Introduction
Against the backdrop of global climate change and energy crises, the energy consumption and carbon emissions of the transportation sector—particularly the expressway network—have garnered increasing attention. As integral components of expressway infrastructure, service areas not only provide essential amenities and rest facilities for vehicles and drivers, but also represent key nodes of energy consumption. Consequently, identifying clean and renewable energy sources to replace conventional fossil fuels and reduce carbon emissions from expressway service areas has become an urgent challenge. Among various clean energy options, solar energy offers a promising pathway for lowering carbon emissions through its application in expressway service areas.
China has adopted clear and proactive measures to address global climate change and promote green, low-carbon development, setting national targets for carbon peaking and carbon neutrality. In response, numerous researchers have focused on evaluating China’s photovoltaic (PV) potential. Qiu et al. [
1] estimated that approximately 993,000 km
2 of land in China is suitable for PV power generation. Zhang et al. [
2] investigated the spatial distribution differences of PV resources between eastern and western China. Wen et al. [
3] assessed the characteristics and development potential of China’s offshore solar PV resources. Chen et al. [
4] developed an evaluation framework for residential solar PV systems. Yang et al. [
5] conducted a life-cycle-based quantitative analysis of photovoltaic power generation. Chen et al. [
6] examined future trends in carbon offset potential over the lifetime of rooftop PV systems. Zhang et al. [
7] estimated the PV potential of noise barrier-integrated systems in China, with an installable capacity of 2.04 GW and an annual power generation of 690.74 GWh. Wang et al. [
8] evaluated the distributed solar PV potential in urban areas across China, while Yu et al. [
9] estimated the installed capacity potential for both large-scale centralized and small-scale distributed PV power stations across 449 prefecture-level cities.
In terms of solar energy potential assessment tools, researchers have predominantly employed Geographic Information System (GIS) and Google Earth Engine (GEE) technologies. Bai et al. [
10] used a GIS-based Multi-Criteria Decision Analysis (MCDA) model to estimate the development potential of floating photovoltaic (FPV) systems in China. Song et al. [
11] utilized a GIS-based approach to generate spatial distribution maps of solar radiation resources across the country. Yang et al. [
12] integrated geospatial technologies into a unified framework for evaluating PV development potential. Zhang et al. [
13] assessed rooftop PV potential in 354 Chinese cities by leveraging multi-source heterogeneous geospatial data and machine learning regression techniques. Yang et al. [
14] developed a GIS-based model incorporating 600 land conversion factors to estimate China’s large-scale PV generation potential. Chen et al. [
15] investigated the effects of cloud cover, aerosol optical depth, and specific humidity on solar irradiance variability. Wei et al. [
16] applied the Analytic Hierarchy Process (AHP) and entropy weighting method to comprehensively rank urban unit clusters. Li et al. [
17] proposed a three-stage framework combining DBSCAN clustering with cost-benefit analysis. Lyu et al. [
18] explored optimized strategies for the future development of China’s PV industry based on GEE and multi-source datasets. Zhang et al. [
19] introduced a GIS-based multi-temporal and spatial evaluation model. Chen et al. [
20] employed GIS techniques to assess the carbon reduction benefits and climate mitigation potential of photovoltaic-green roof (PV-GR) systems.
In recent years, the application of solar power technologies in the transportation sector has attracted growing attention from scholars both in China and abroad. Liu et al. [
21] investigated the technological transformation of public transportation systems into renewable energy hubs. Oh et al. [
22] used GIS to estimate the electricity generated by a solar-powered bus in operation. Ding et al. [
23] assessed the photovoltaic potential of 973 stations along 108 high-speed rail lines in China using GIS-based analysis. Ren et al. [
24] proposed a solar-powered electric bus network control strategy based on mixed-integer linear programming. In a related study, Ren et al. [
25] developed a Genetic Algorithm–Integer Linear Programming (GA-ILP) method to address high-dimensional rooftop PV planning challenges and the nonlinear optimization of PV and energy storage capacities.
As a critical component of the transportation system, expressways have become a focal point for research on solar energy applications. During the expressway route planning stage, Jiang et al. [
26] proposed a multi-criteria evaluation method based on the AHP and GIS, which enables accurate assessment of solar energy resource availability. Hammam et al. [
27] introduced an optimization method for the siting and sizing of expressway electric vehicle charging stations powered by photovoltaic and energy storage systems. In the field of photovoltaic pavement research, Zhang et al. [
28] investigated PV road surface technology, reporting that under sunny conditions, the PV modules embedded in the pavement achieved a power output of up to 0.68 kWh/m
2, with an electrical efficiency of 14.71%. Hu et al. [
29] proposed a concentrator photovoltaic panel (CPP) structure designed for road applications. They optimized the panel configuration, constructed a laboratory-scale model, and evaluated its mechanical performance and durability using a Multi-functional Material Testing System (MTS) and a Model Mobile Load Simulator (MMLS3).
In the field of solar energy deployment along expressway roadsides, Jiang et al. [
30] proposed a planning strategy that integrates solar resource maximization with roadway surface utilization. Their study demonstrated that a 500 m road segment can accurately represent solar resource availability, reducing estimation error to within 50 kWh/m
2. Ferri et al. [
31] introduced a method for mapping the photovoltaic potential distribution along roadways. G. Kakoulaki et al. [
32] employed geospatial data processing to quantify the potential for large-scale deployment of vertical solar panels along major highways and railways across Europe, estimating a potential photovoltaic capacity of 403 GWp for the European Union (EU). Zhou et al. [
33] conducted a comprehensive review of the relationship between solar radiation and asphalt pavement, addressing both its positive and negative impacts. Kim et al. [
34] proposed and evaluated a two-stage method that sequentially uses low- and high-resolution maps to identify and prioritize suitable locations for PV panel installation, thereby reducing computational load while enhancing estimation accuracy. Xie et al. [
35] examined in detail the influence of road orientation and the application of bifacial photovoltaic technology, estimating the power generation potential of PV-integrated noise barriers. Pesch et al. [
36] analyzed the optimal layout and operational strategies of toll systems along expressways. Zhang et al. [
37] proposed an integrated strategy combining photovoltaic noise barriers (PVNBS), energy storage (ES), and charging stations (CSs)—the PVNBS–ES–CS system—which facilitates local consumption of PVNBS-generated electricity and alleviates the charging demand burden on the power grid from electric vehicles.
Expressway service areas are critical energy consumption nodes along highway networks, and their distribution is typically influenced by the layout of expressway routes—usually with one service area positioned every 50 km. Some of these service areas are located in mountainous regions, where terrain-induced shading makes it particularly challenging to accurately assess their solar energy potential. In the study of terrain shadows, the Hillshade tool in ArcGIS 10.6 has proven to be highly effective. Hong et al. [
38] proposed a method for estimating rooftop PV potential by analyzing usable roof area using the Hillshade algorithm. Shuo Zhang et al. [
39] studied the self-consistent energy system of service area. Ko et al. [
40] applied Hillshade to compute hourly sun/shadow grayscale values based on building elevation data and solar azimuth and altitude angles at different times of the day. In addition to Hillshade, other methods have also been developed to evaluate terrain shadow effects. For example, Kim et al. [
41] designed a method to estimate the energy production of solar-powered trains, taking into account the train’s position, travel time, and shadowing effects from surrounding obstructions. Ferry et al. [
42] proposed a cadastral solar mapping method based on the Solar Energy on Building Envelopes (SEBE) model in QGIS, comparing solar potential between villages in plains and mountainous regions. Yilmaz et al. [
43] introduced a novel method for implementing FPV systems at hydropower stations, which accurately accounts for shading effects caused by surrounding topography.
In the fields of photovoltaic technology and sustainable architecture [
44], research methodologies for carbon emissions assessment have continued to evolve. Jiang et al. [
45] used GIS to evaluate the photovoltaic potential of 239 civil airports in China, revealing a possible installed capacity of up to 2.50 GW. Thebault et al. [
46] proposed a multi-criteria assessment method that incorporates technical, economic, and environmental factors to effectively evaluate the suitability of building-integrated PV systems. Gonocruz et al. [
47] applied linear programming to optimize the integration of agrivoltaics and battery storage, demonstrating the potential for renewable energy applications in agriculture. Huang et al. [
48] assessed the carbon reduction benefits of large-scale centralized agrivoltaic systems in Zhejiang Province, reporting annual emission reductions of 2.58 Mt and a carbon payback period of just 3.95 years. Zhang et al. [
49] proposed a digital twin-based framework for carbon accounting in residential communities, enhancing the intelligence and precision of emission assessments. Zhang et al. [
50] also developed methods for carbon emission accounting and carbon reduction potential estimation. The diversity of these methodological approaches provides effective pathways for achieving low-carbon development goals.
The innovation of this study lies in integrating terrain-based dynamic shading modeling with expressway service area datasets at the national scale, enabling the first comprehensive assessment of infrastructure-specific photovoltaic potential in China.
The main contributions of this study are as follows: (1) the total area of expressway service areas across China was evaluated and calculated; (2) prior to estimating the solar energy potential of China’s expressways, hourly shadow areas on service area surfaces caused by surrounding terrain were identified and removed using a DEM; and (3) the spatial distribution characteristics of photovoltaic-ready expressway service areas were analyzed at the provincial level. The remainder of this paper is structured as follows:
Section 2 introduces the characteristics of the study area and the basic datasets employed;
Section 3 provides a comprehensive overview of the proposed methodology;
Section 4 offers discussion and interpretation of the findings; and
Section 5 provides conclusions.
3. Methodology
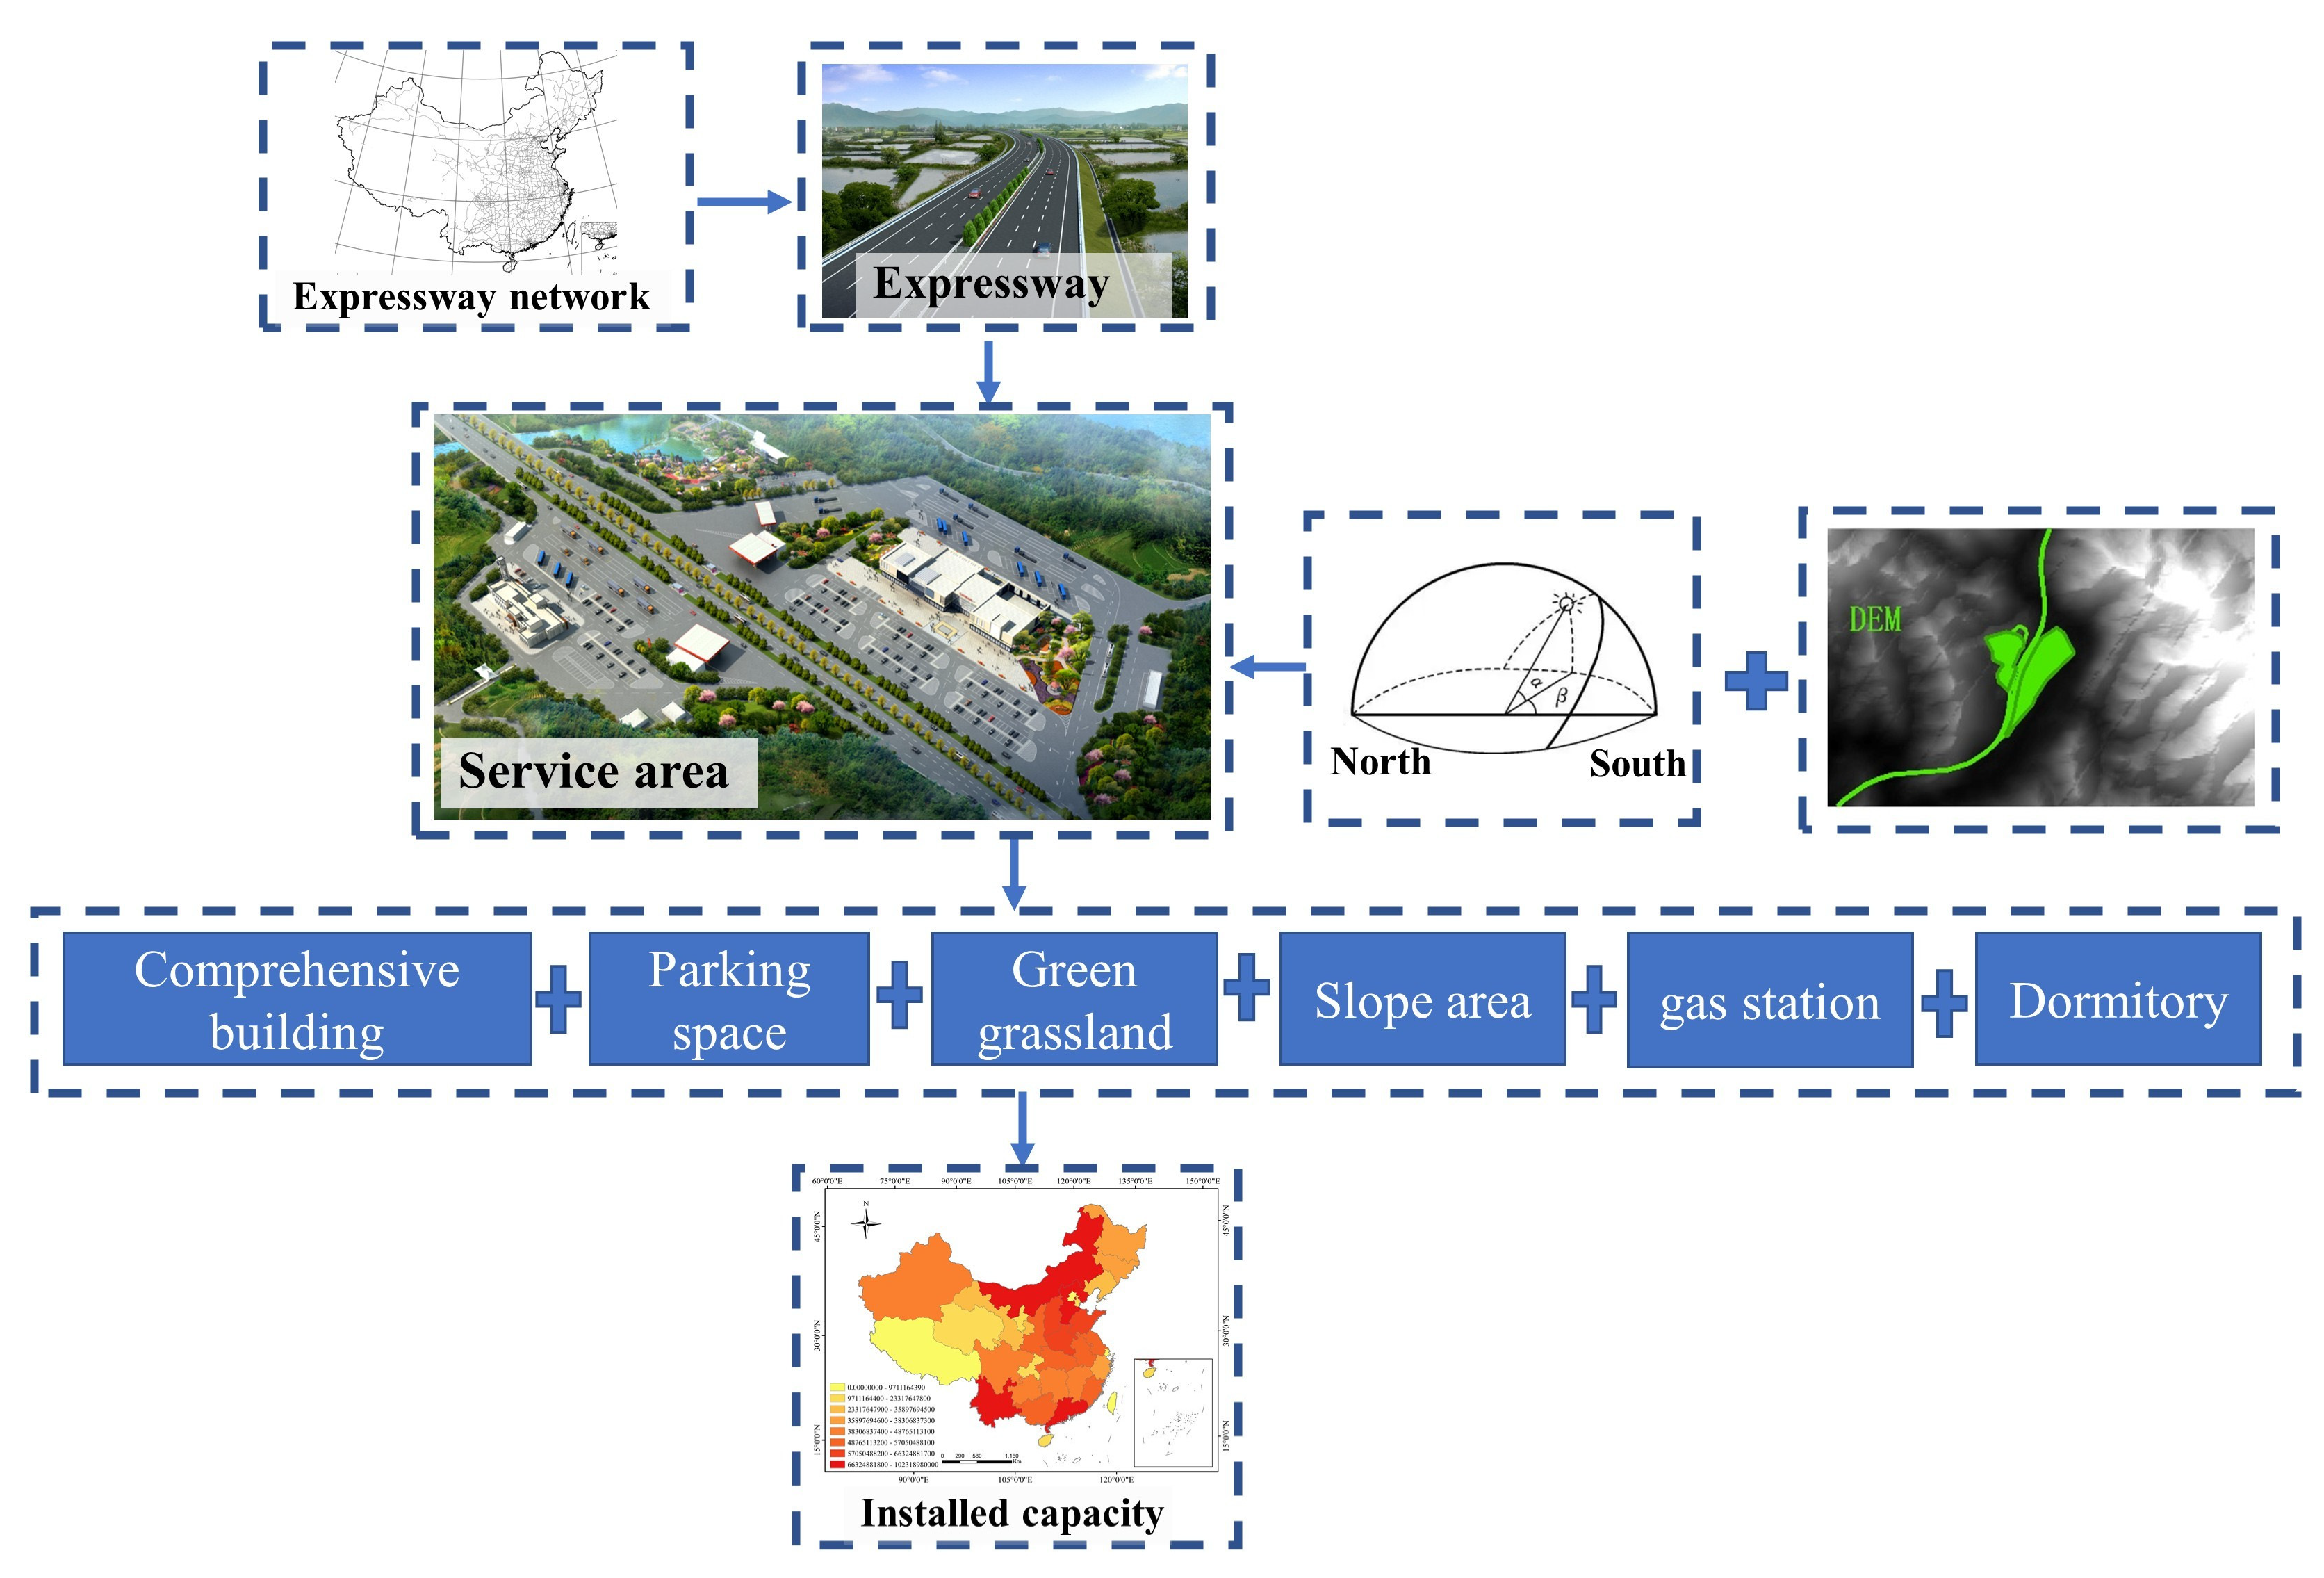
The methodology for assessing the PV potential of expressway service areas in this study is illustrated in
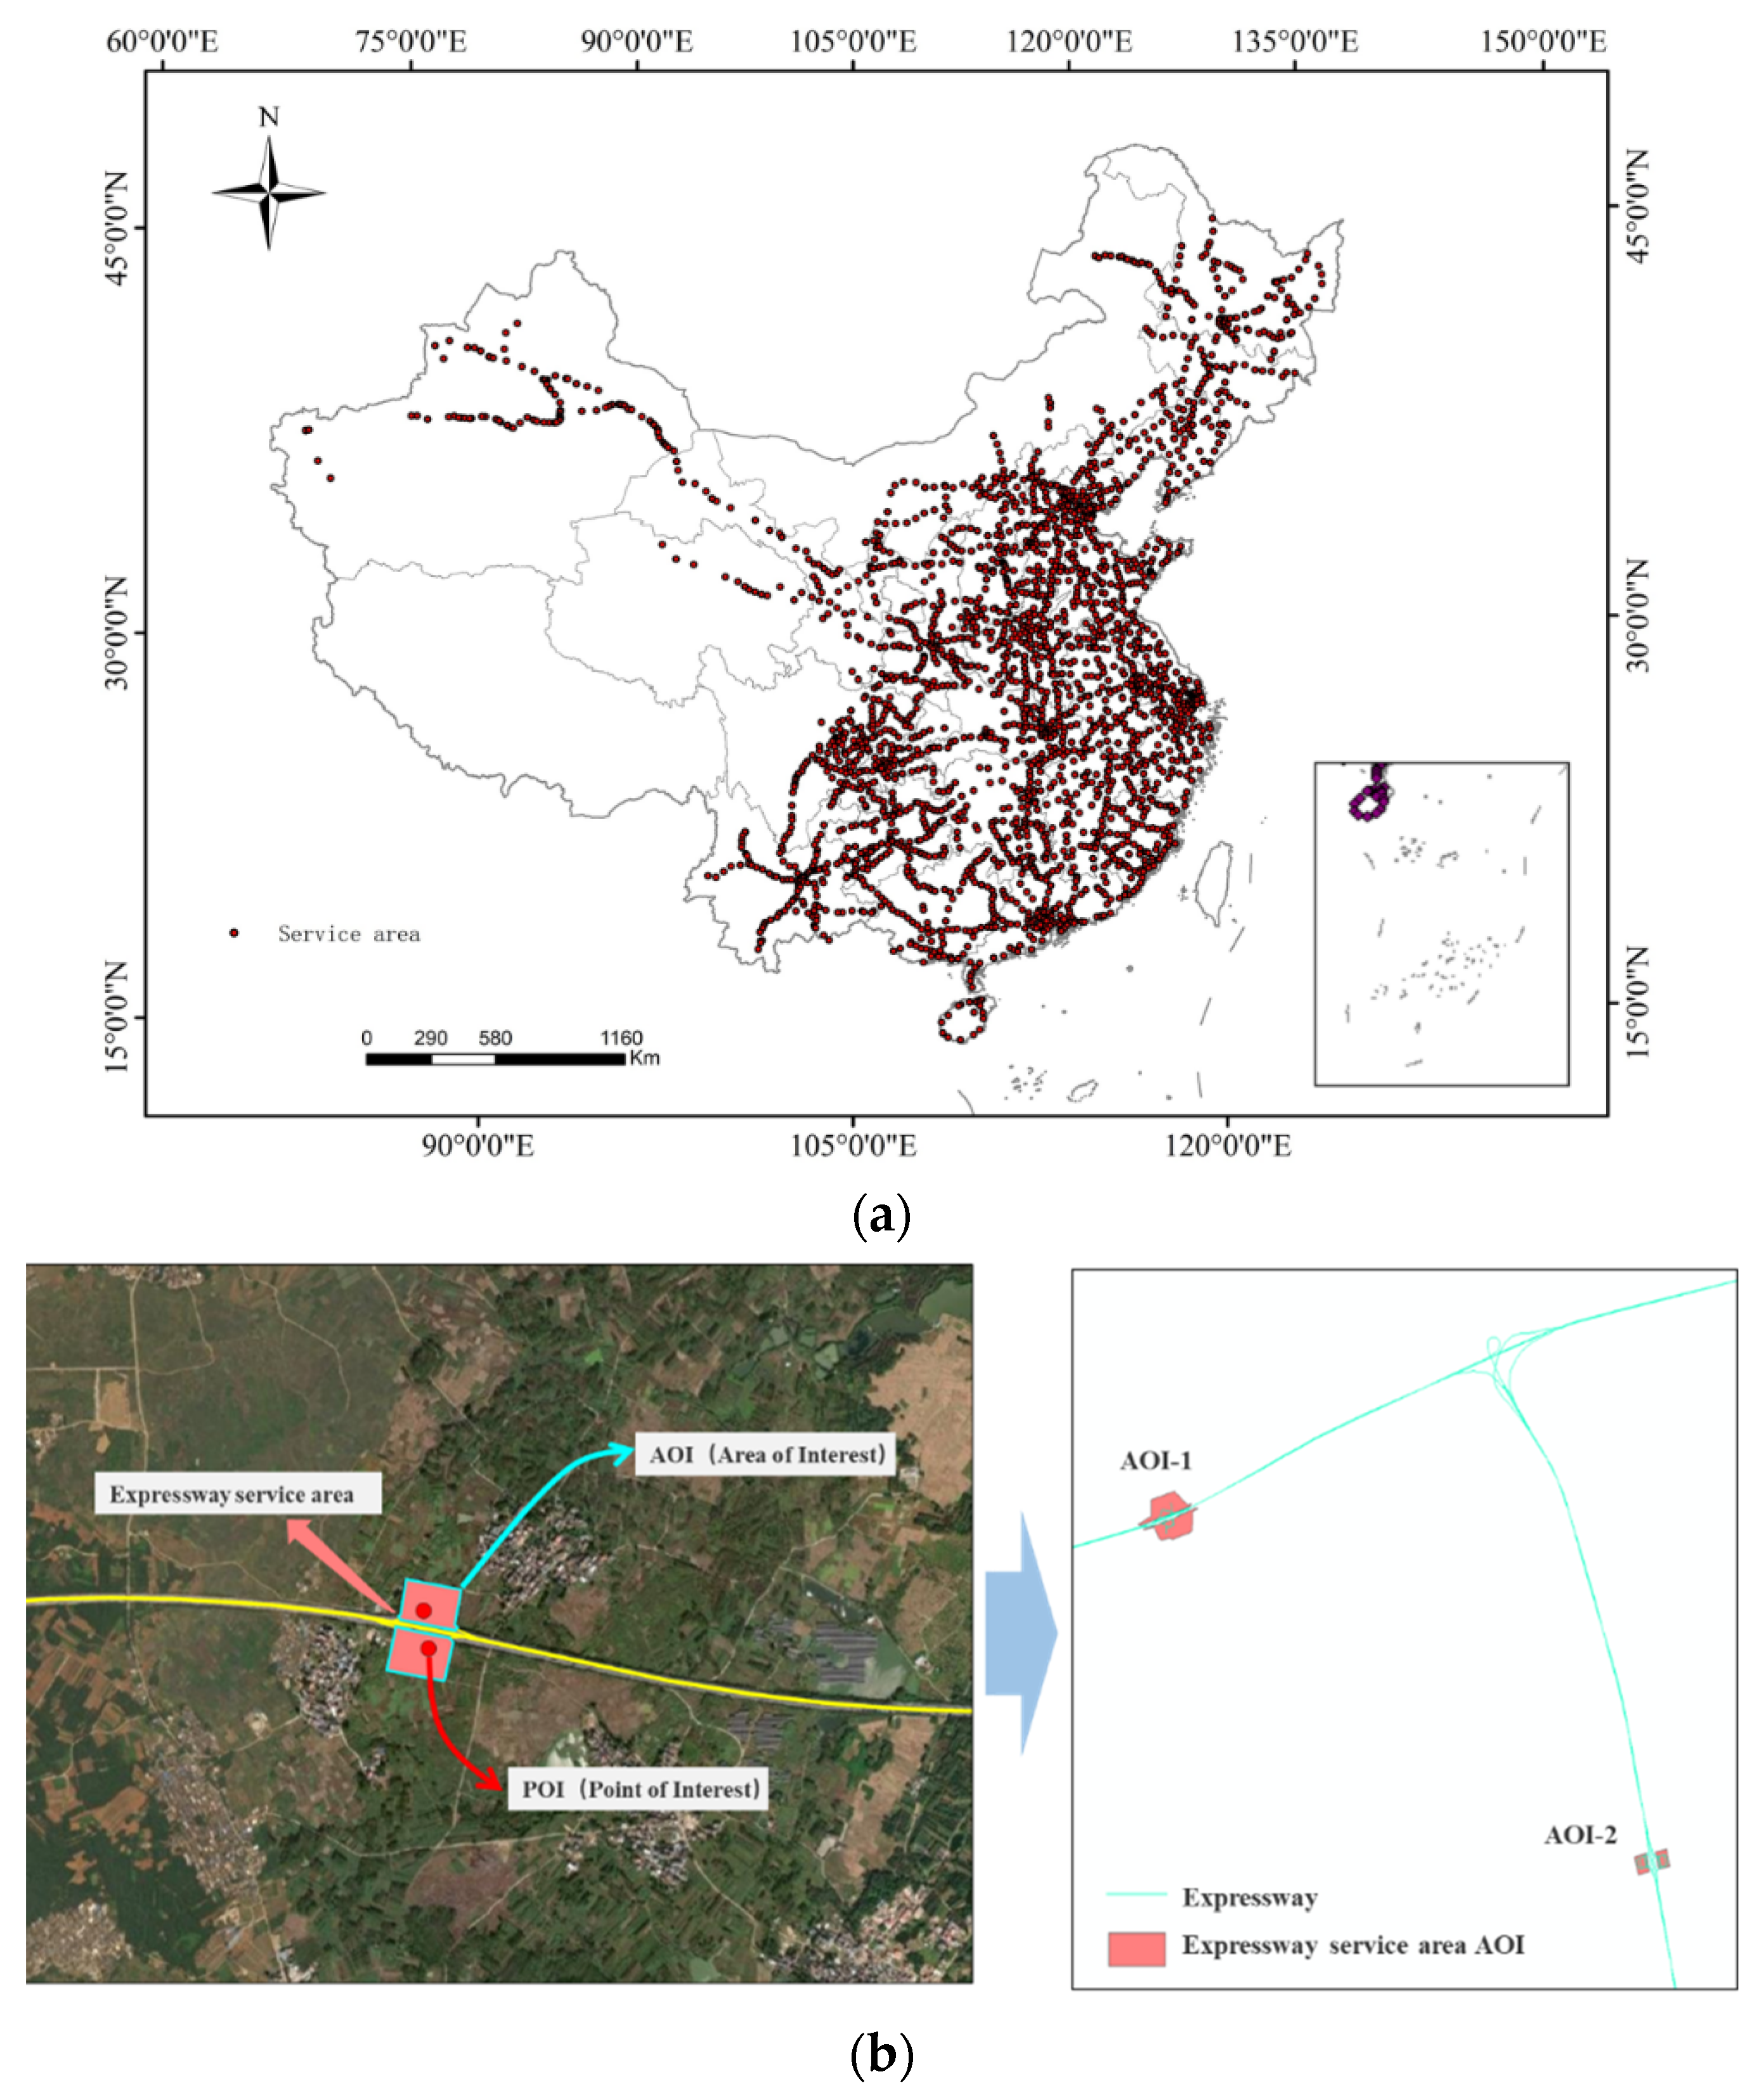
Figure 3. First, POI data for expressway service areas were obtained, and the corresponding area of each service area was determined based on the POI data. Second, the Hillshade tool was used to calculate the terrain shadowing effects caused by surrounding mountains, enabling the estimation of actual sunlight hours for each service area and thereby improving the accuracy of PV potential predictions. Finally, at the provincial scale, the total solar energy potential, installable PV capacity, estimated electricity generation, and potential carbon emission reductions of expressway service areas across China were calculated and analyzed.
The proposed spatiotemporal model improves upon conventional GIS-Hillshade frameworks by (1) introducing hourly solar position calculations to capture diurnal shadow variation, and (2) integrating Baidu AOI datasets for accurate delineation of service area boundaries, thereby enhancing spatial and temporal precision in large-scale PV potential assessment.
3.1. Calculation of Service Area Size
Accurately determining the area of expressway service areas is a prerequisite for assessing their solar energy potential. OSM does not provide area data for service areas, this study retrieved area information from Baidu Maps, while using OSM data to verify the locations and number of service areas. After preprocessing the data obtained from Baidu Maps, a total of 3225 service areas were identified nationwide (with service areas on both sides of the expressway counted as a single entity). The area of each service area was then calculated using ArcGIS 10.6.
The total area of expressway service areas was extracted from the OpenStreetMap (OSM) database and verified through satellite imagery. The spatial boundaries were processed in ArcGIS by polygon clipping and raster conversion, yielding a nationwide total service area of 259.26 km2.
Given the dense distribution of expressway service areas, their spatial characteristics are difficult to visualize on small-scale maps. Therefore, kernel density estimation was applied to convert service area counts into a continuous density surface. Kernel density analysis enables an effective evaluation of the spatial distribution of service areas across the country and helps identify clusters and underserved regions. This analysis provides insights into the density and coverage of service areas along the expressway network. The spatial distribution characteristics of China’s expressway service areas are illustrated in
Figure 4.
3.2. Influence of Terrain Shading
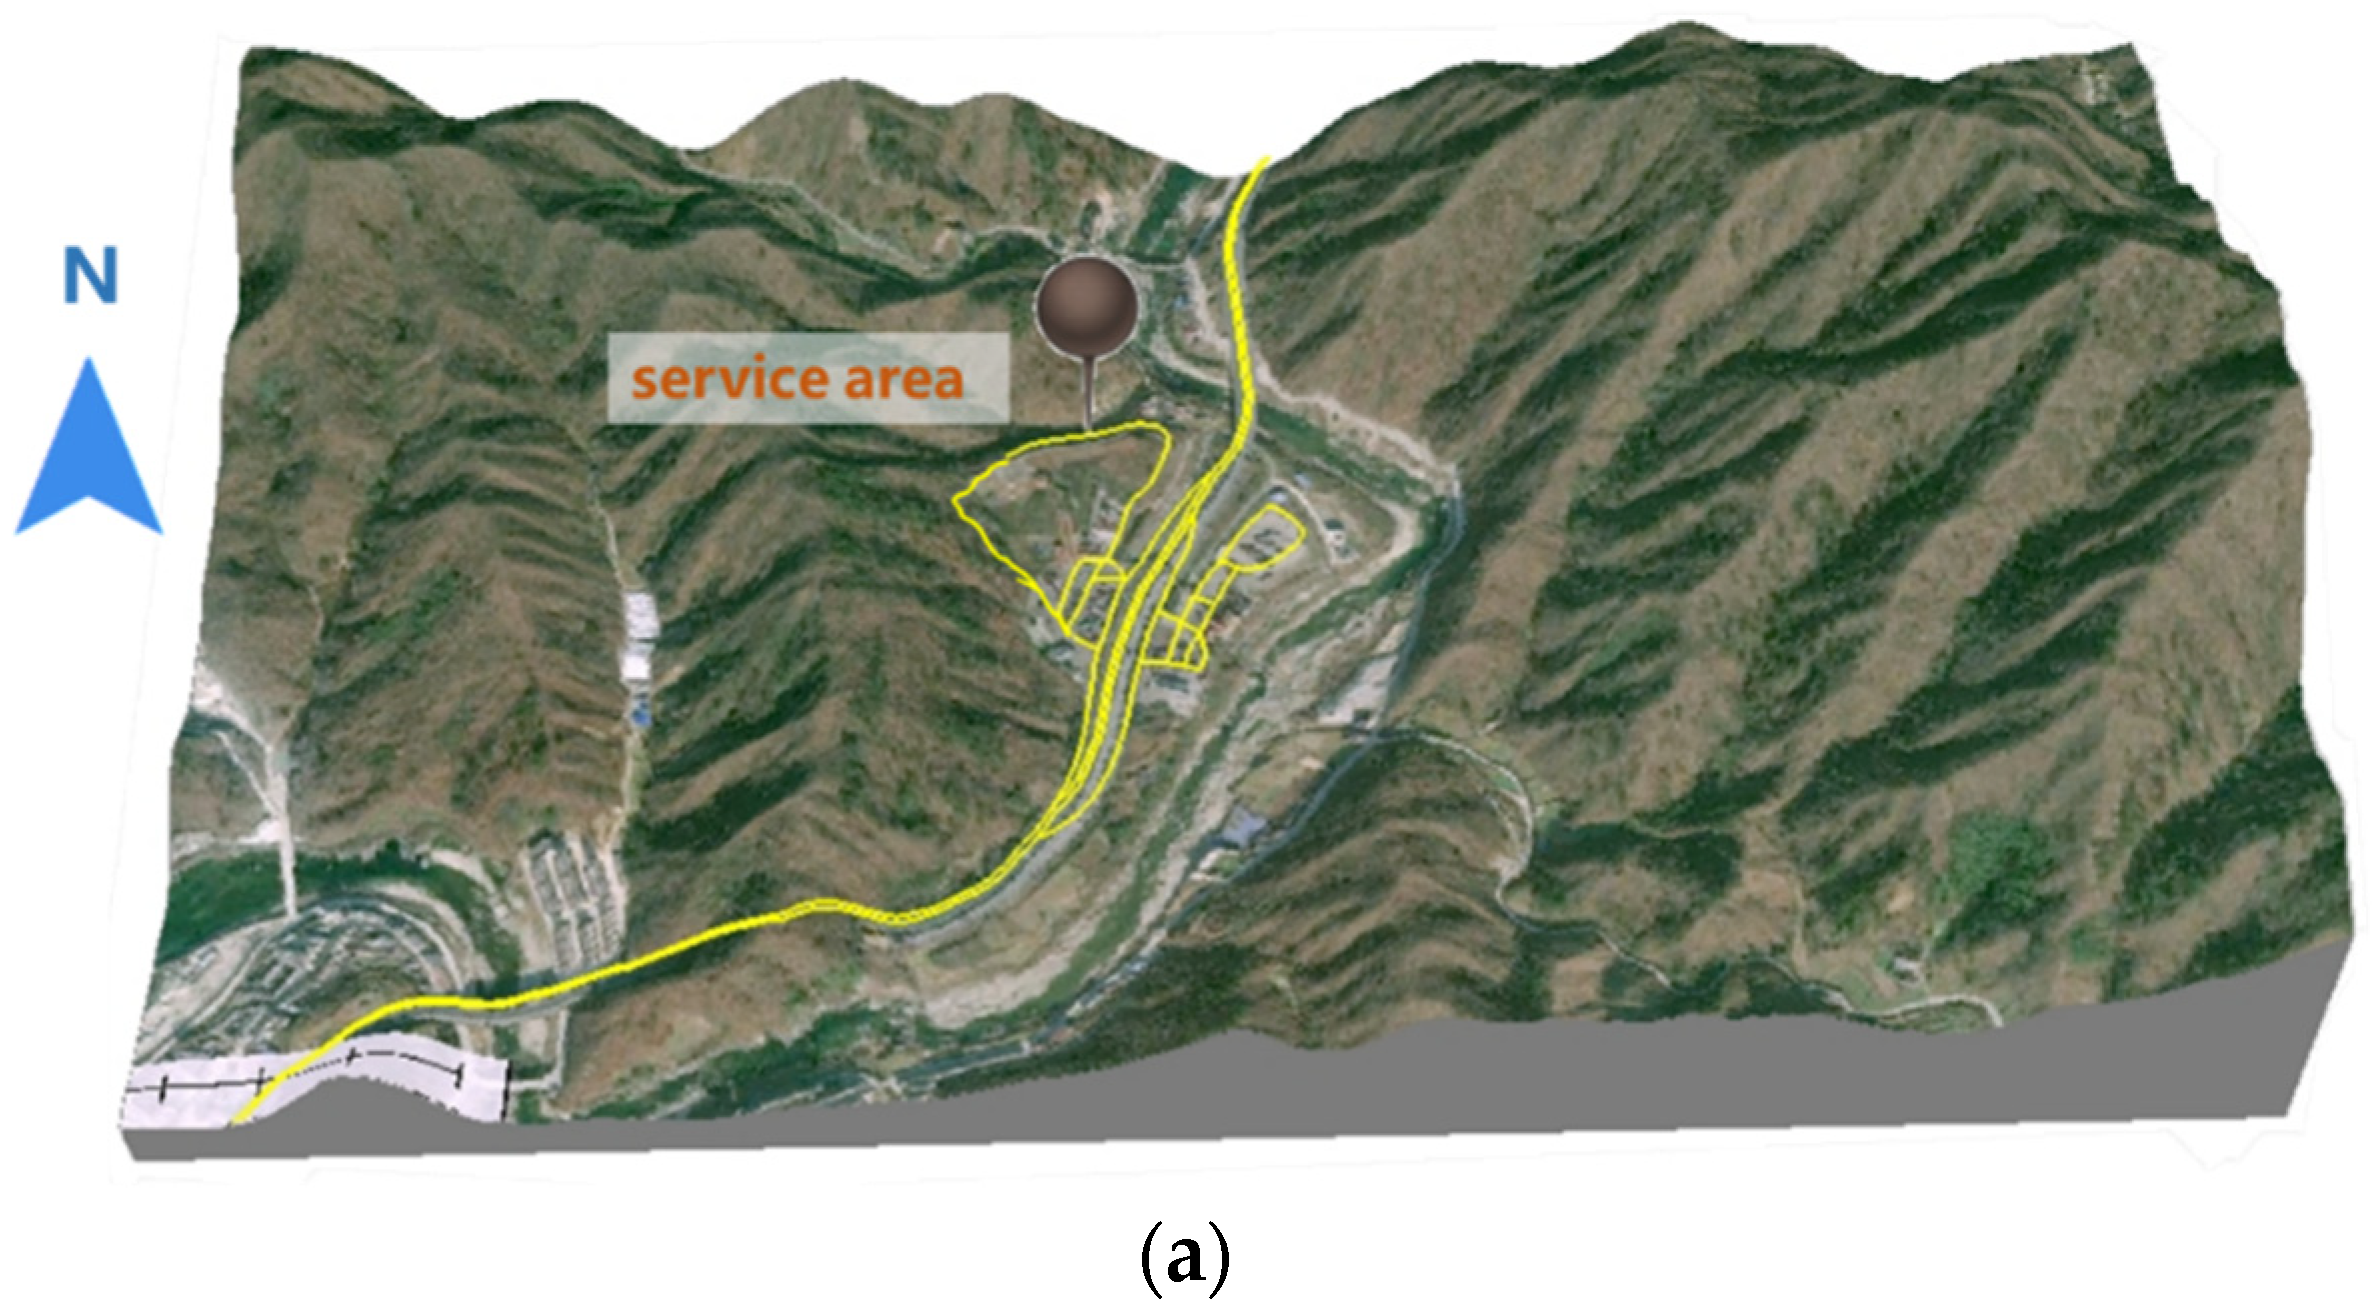
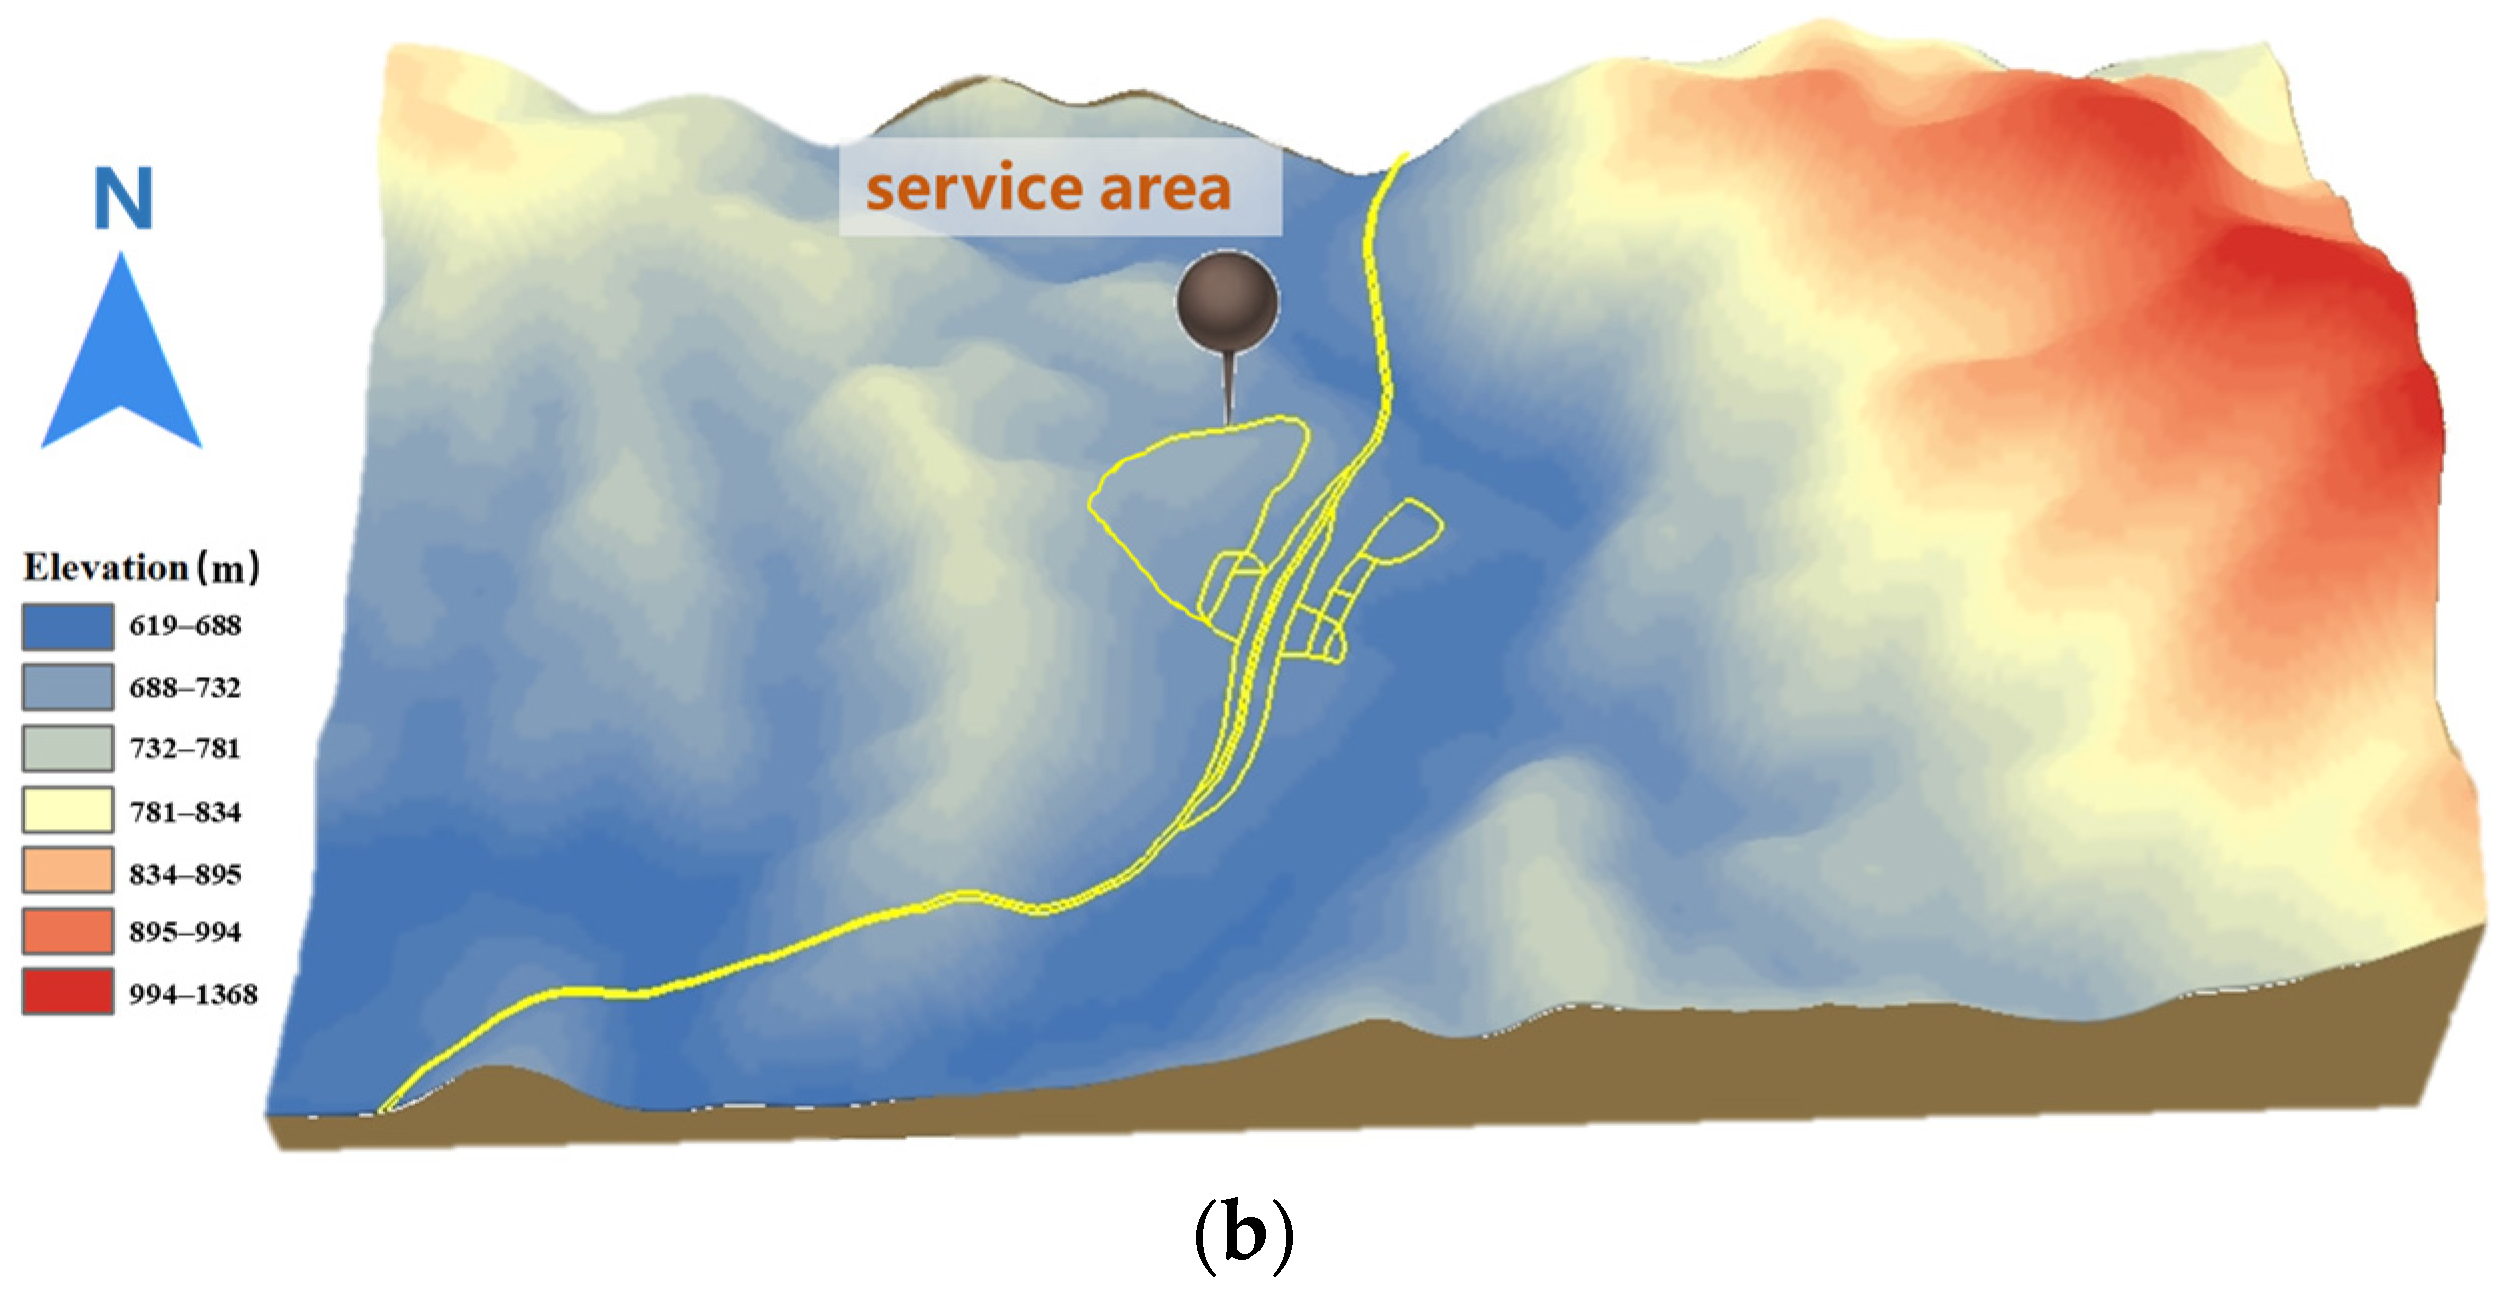
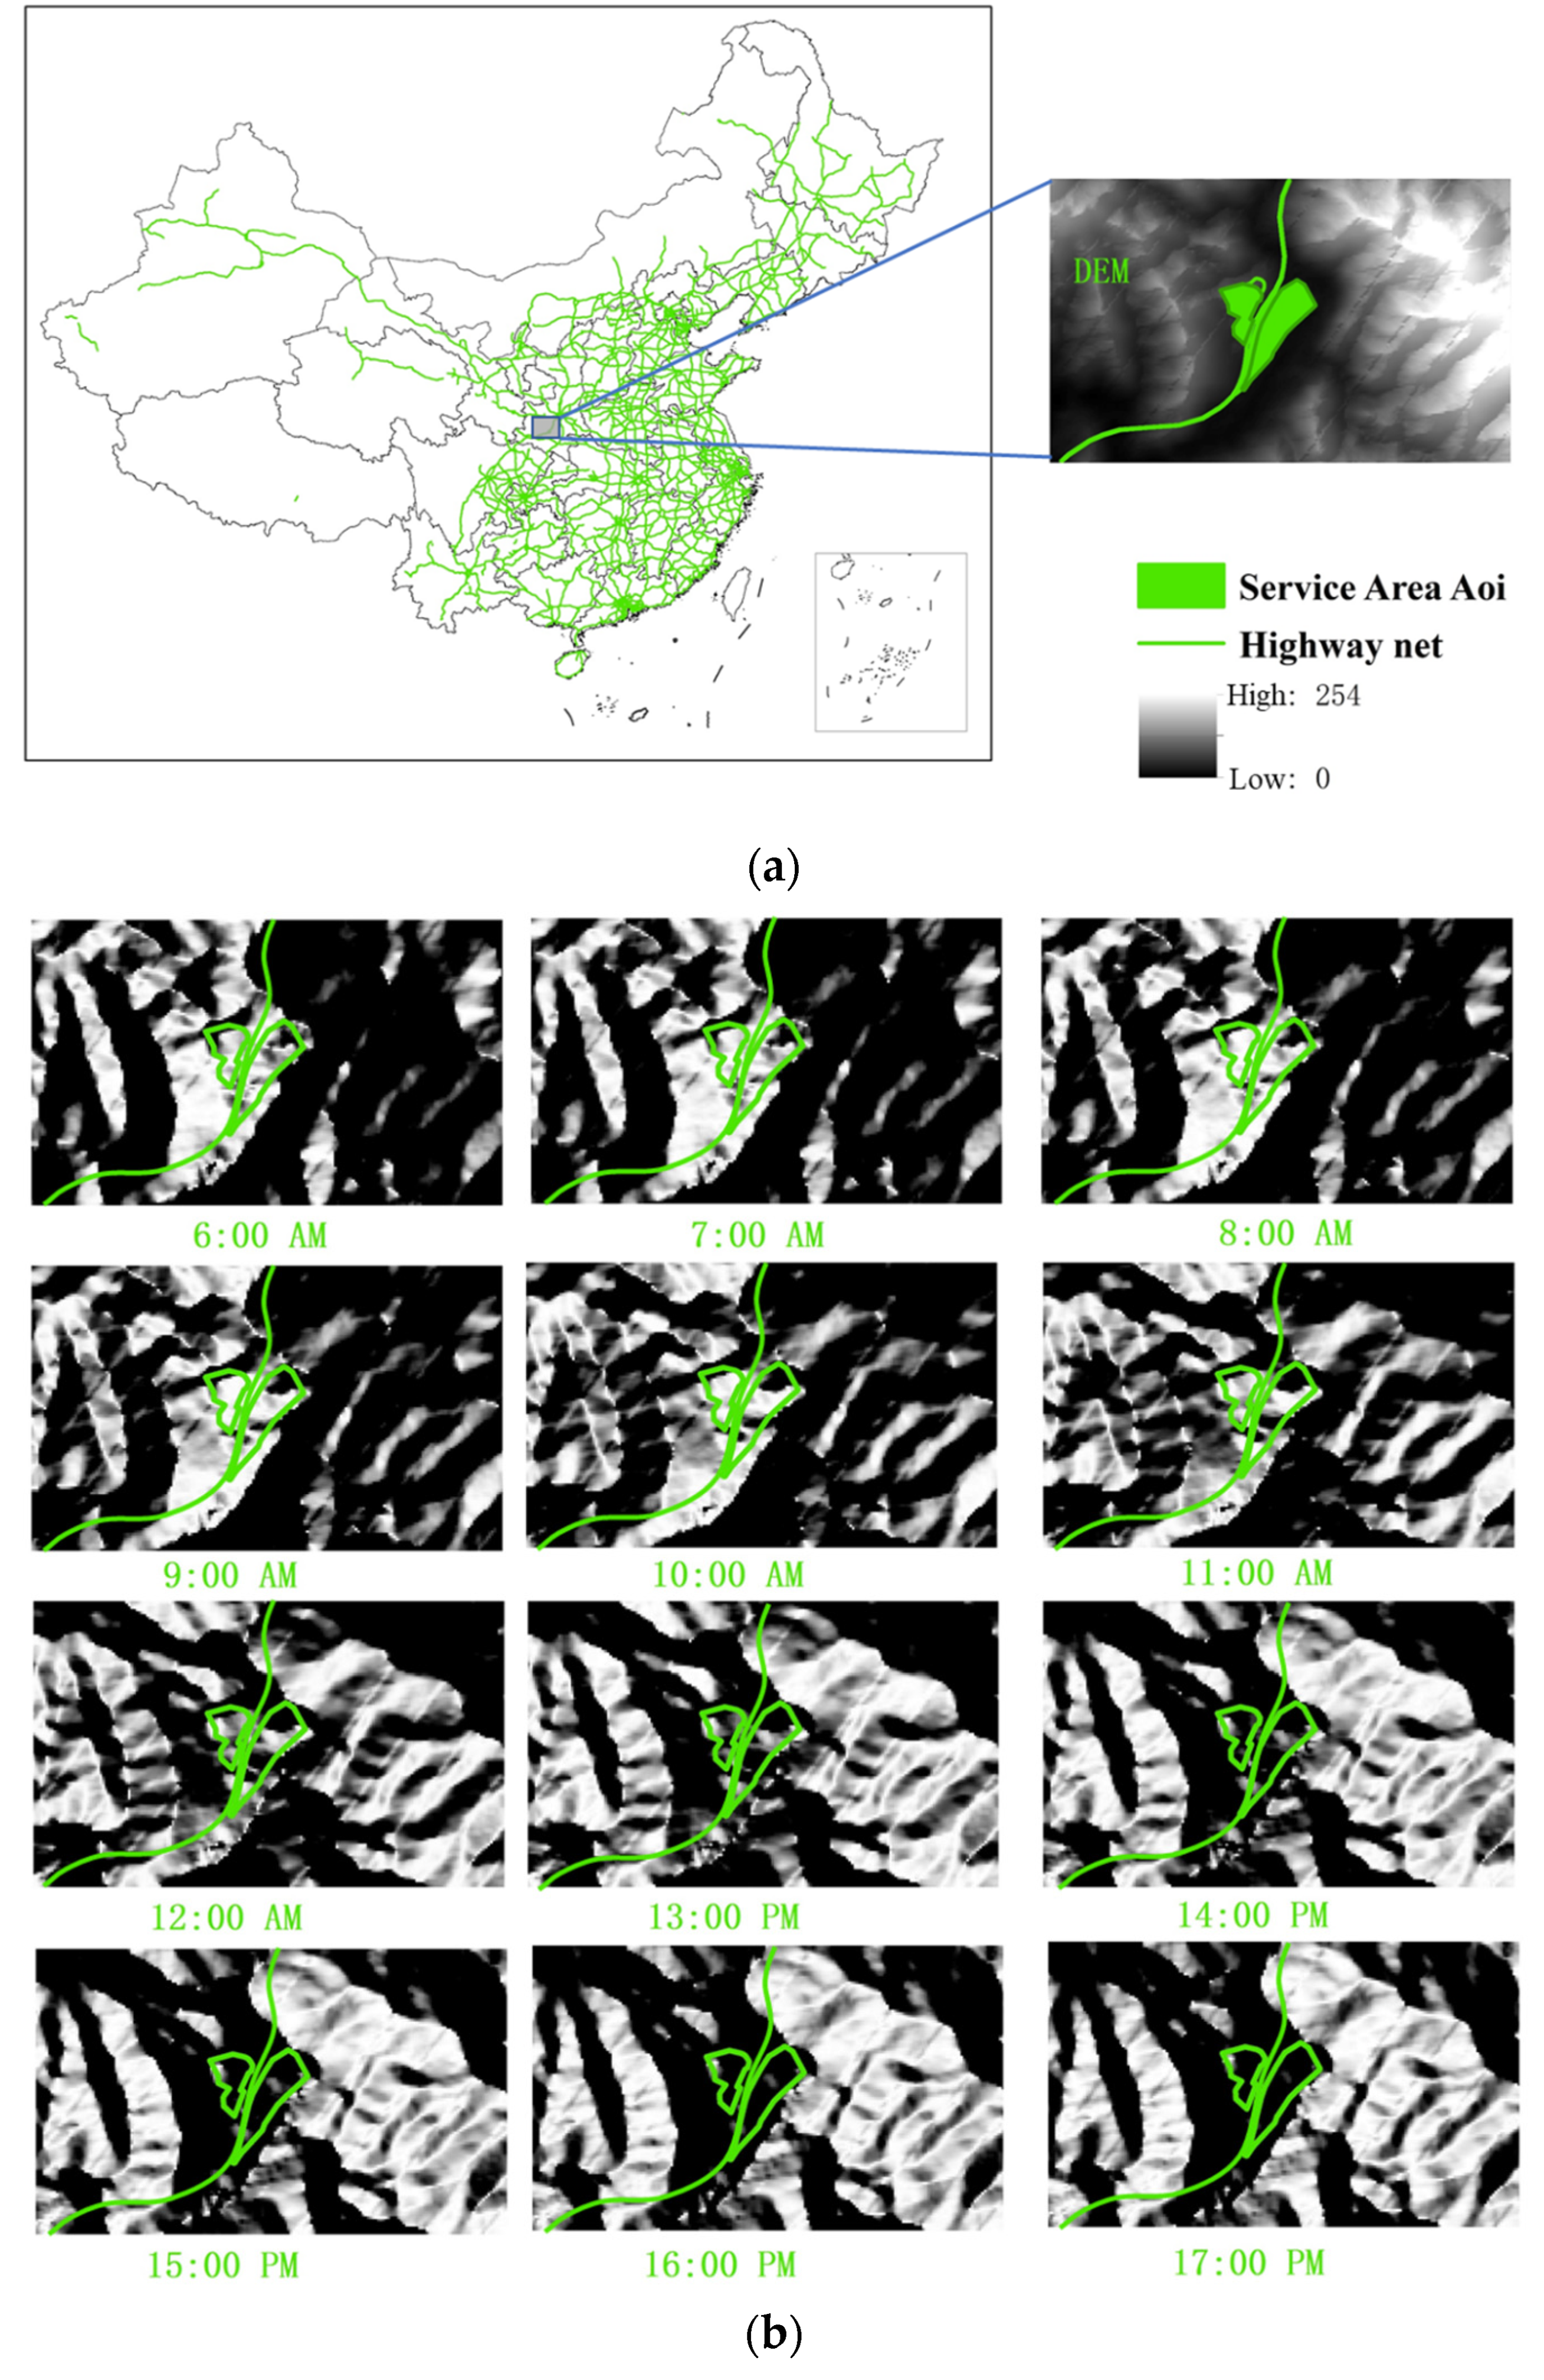
In evaluating the solar radiation received by each expressway service area, this study also accounts for shadowing effects caused by surrounding terrain. Some service areas are located in mountainous regions (as shown in
Figure 5), while others are situated in flat plains with no significant obstructions nearby (as shown in
Figure 6).
Since the position of the sun changes dynamically throughout the day, the shadow coverage on service areas located in mountainous terrain also varies accordingly. As the sun moves, the shaded area on the surface of a service area changes, affecting the actual amount of solar radiation received. Therefore, to accurately assess solar radiation exposure, it is essential to consider the impact of terrain-induced shading on the service area surface.
However, real-time computation of dynamic shading patterns requires significant computational resources and time. To address this challenge while maintaining accuracy, this study estimates the shadow area of each expressway service area on an hourly basis. This approach allows for a more realistic and efficient measurement of the actual solar energy received by each site.
In addition, the wide geographic distribution of expressway service areas in China—spanning approximately 60 degrees of longitude—introduces significant longitudinal variation, resulting in substantial time zone differences across regions. These temporal discrepancies pose a challenge to accurately analyzing shading effects on a national scale. To mitigate the impact of time zone variation, both the DEM and expressway service area datasets were divided into multiple spatial blocks, each measuring 0.5° × 0.5°. After gridding the DEM and expressway service area data, the two layers were overlaid, and DEM blocks that did not intersect with any expressway service areas were excluded. This approach aimed to reduce the computational load by limiting analysis to relevant regions. As a result, a total of 1215 paired DEM and service area data blocks were extracted for this study.
Each data block was then subjected to a Hillshade analysis using ArcPy 3.4. The Hillshade tool generates shaded relief from surface raster data by simulating the effects of illumination angle and topographic shading. The resulting raster values range from 0 to 255, with shadowed cells assigned a value of 0. In this study, any cell within a service area that had a Hillshade value of 0 was considered to be in shadow. Hourly Hillshade analyses were conducted for each block pair between sunrise and sunset. Compared with conventional models assuming flat-surface irradiation, the spatio-temporal model incorporating terrain dynamic shadowing effectively reduces overestimation errors in complex terrains, improving solar potential estimation accuracy by 8–15% based on validation against measured solar radiation data.
Because estimating shadow coverage for all service areas across China over an entire year is computationally intensive, a representative-day strategy was adopted. Specifically, a mid-month day was selected for each month to perform shading analysis. During this analysis, the solar zenith angle and solar altitude angle were identified as key parameters influencing shadow area estimation. Using the latitude information provided by the DEM, solar zenith angles, altitude angles, and hour angles were calculated for each block. These parameters were then used to estimate the shadow area of each service area on an hourly basis throughout the representative day. The Hillshade tool in ArcGIS was employed for the entire shading analysis process.
Before determining the hourly shadow coverage of each expressway service area, it was necessary to calculate, for every hour of the representative day, the solar azimuth and altitude angles, the Z-factor, and the times of sunrise and sunset.
The solar declination angle
δ is calculated using the following formula [
51]:
where
N is the day of the year (with January 1st as day 1).
The hour angle (
H) is computed as follows [
52]:
Here, H represents the angular displacement of the sun relative to local solar noon; T is the local solar time in hours, where noon is 12:00.
The solar altitude angle
α is calculated by [
53]:
where
ϕ is the observer’s latitude (in radians),
δ is the solar declination angle, and
H is the hour angle.
The solar azimuth angle
A is computed by:
The sunrise
Trise and sunset
Tset times are calculated as [
51]:
where
λ is the longitude of the service area.
Using the above equations, the hourly solar azimuth and altitude angles were calculated, along with sunrise and sunset times for representative days of each month. Based on these results, the shadow coverage of each expressway service area at different times throughout the year was estimated.
3.3. Solar Energy Potential Assessment Methods
Once the hourly shadow area for each expressway service area is determined, the surface solar radiation received by the service area can be calculated by combining this with hourly solar irradiance data of matching temporal resolution. According to previous studies, the solar radiation received by flat rooftops and road surfaces in a given region is generally very similar to that received by natural ground surfaces. Therefore, the solar radiation on expressway service areas is considered equivalent to that on the general land surface of China.
Solar irradiance data from 2007 to 2014 were initially preprocessed. However, due to extensive data gaps in most years, only the datasets from 2009 and 2014 were deemed sufficiently complete. As a result, the hourly irradiance data from these two years were averaged to serve as the radiation input for estimating solar radiation levels across expressway service areas in China.
By integrating the shadow analysis results with hourly irradiance data, the solar energy received by each expressway service area was calculated on an hourly basis. The total annual solar energy potential for each service area was then obtained by summing the hourly values throughout the year.
3.4. Installed Capacity and Power Generation Estimation
To estimate the installed PV capacity and annual power generation of expressway service areas, a commonly available commercial solar panel was used as a reference. The assumed panel has dimensions of 1.3 m × 2.5 m and a rated power output of 590 W.
The formula for calculating the installed capacity is as follows:
In the above formula, P represents the rated power of a single solar panel, and N is the number of panels installed. In this study, the photovoltaic system is assumed to have a rated power density of 200 W/m2. The photovoltaic installation density was assumed to range between 150 and 250 W/m2, consistent with empirical values reported for ground-mounted and rooftop systems in previous national-scale assessments. A representative value of 200 W/m2 was used for the baseline scenario, meaning that the number of panels (N) is derived from the total available surface area of the expressway service area.
The photovoltaic potential estimation was conducted using representative parameters of crystalline silicon modules (η = 20%, power density = 200 W/m2 under standard test conditions (STCs)), consistent with typical large-scale installations in China.
The annual power generation of the PV system is calculated using the following formula [
54]:
where
EP is the annual electricity generation of the photovoltaic system (in kWh),
PAZ is the installed PV capacity (in kW),
K is the overall performance ratio of the PV system, typically assumed to be 0.8, and
H is the average daily peak sunshine hours at the service area, which can be derived from the previously calculated solar energy potential.
3.5. Carbon Emission Reduction Estimation
The reduction in carbon emissions resulting from photovoltaic power generation is calculated using the following formula [
45]:
where
ERCO2 is the total lifecycle CO
2 emission reduction,
EP is the annual electricity generation of the photovoltaic system,
EFCFPP is the emission factor of coal-fired power plants, assumed to be 817 g CO
2/kWh, and
EFPV is the emission factor of photovoltaic power generation, assumed to be 81 g CO
2/kWh.
4. Results and Discussion
4.1. Service Area Surface Area Estimation
Based on the quantified results for expressway service areas in China, the total expressway length and cumulative service area surface area in 2022 were approximately 169,000 km and 285.64 km
2, respectively.
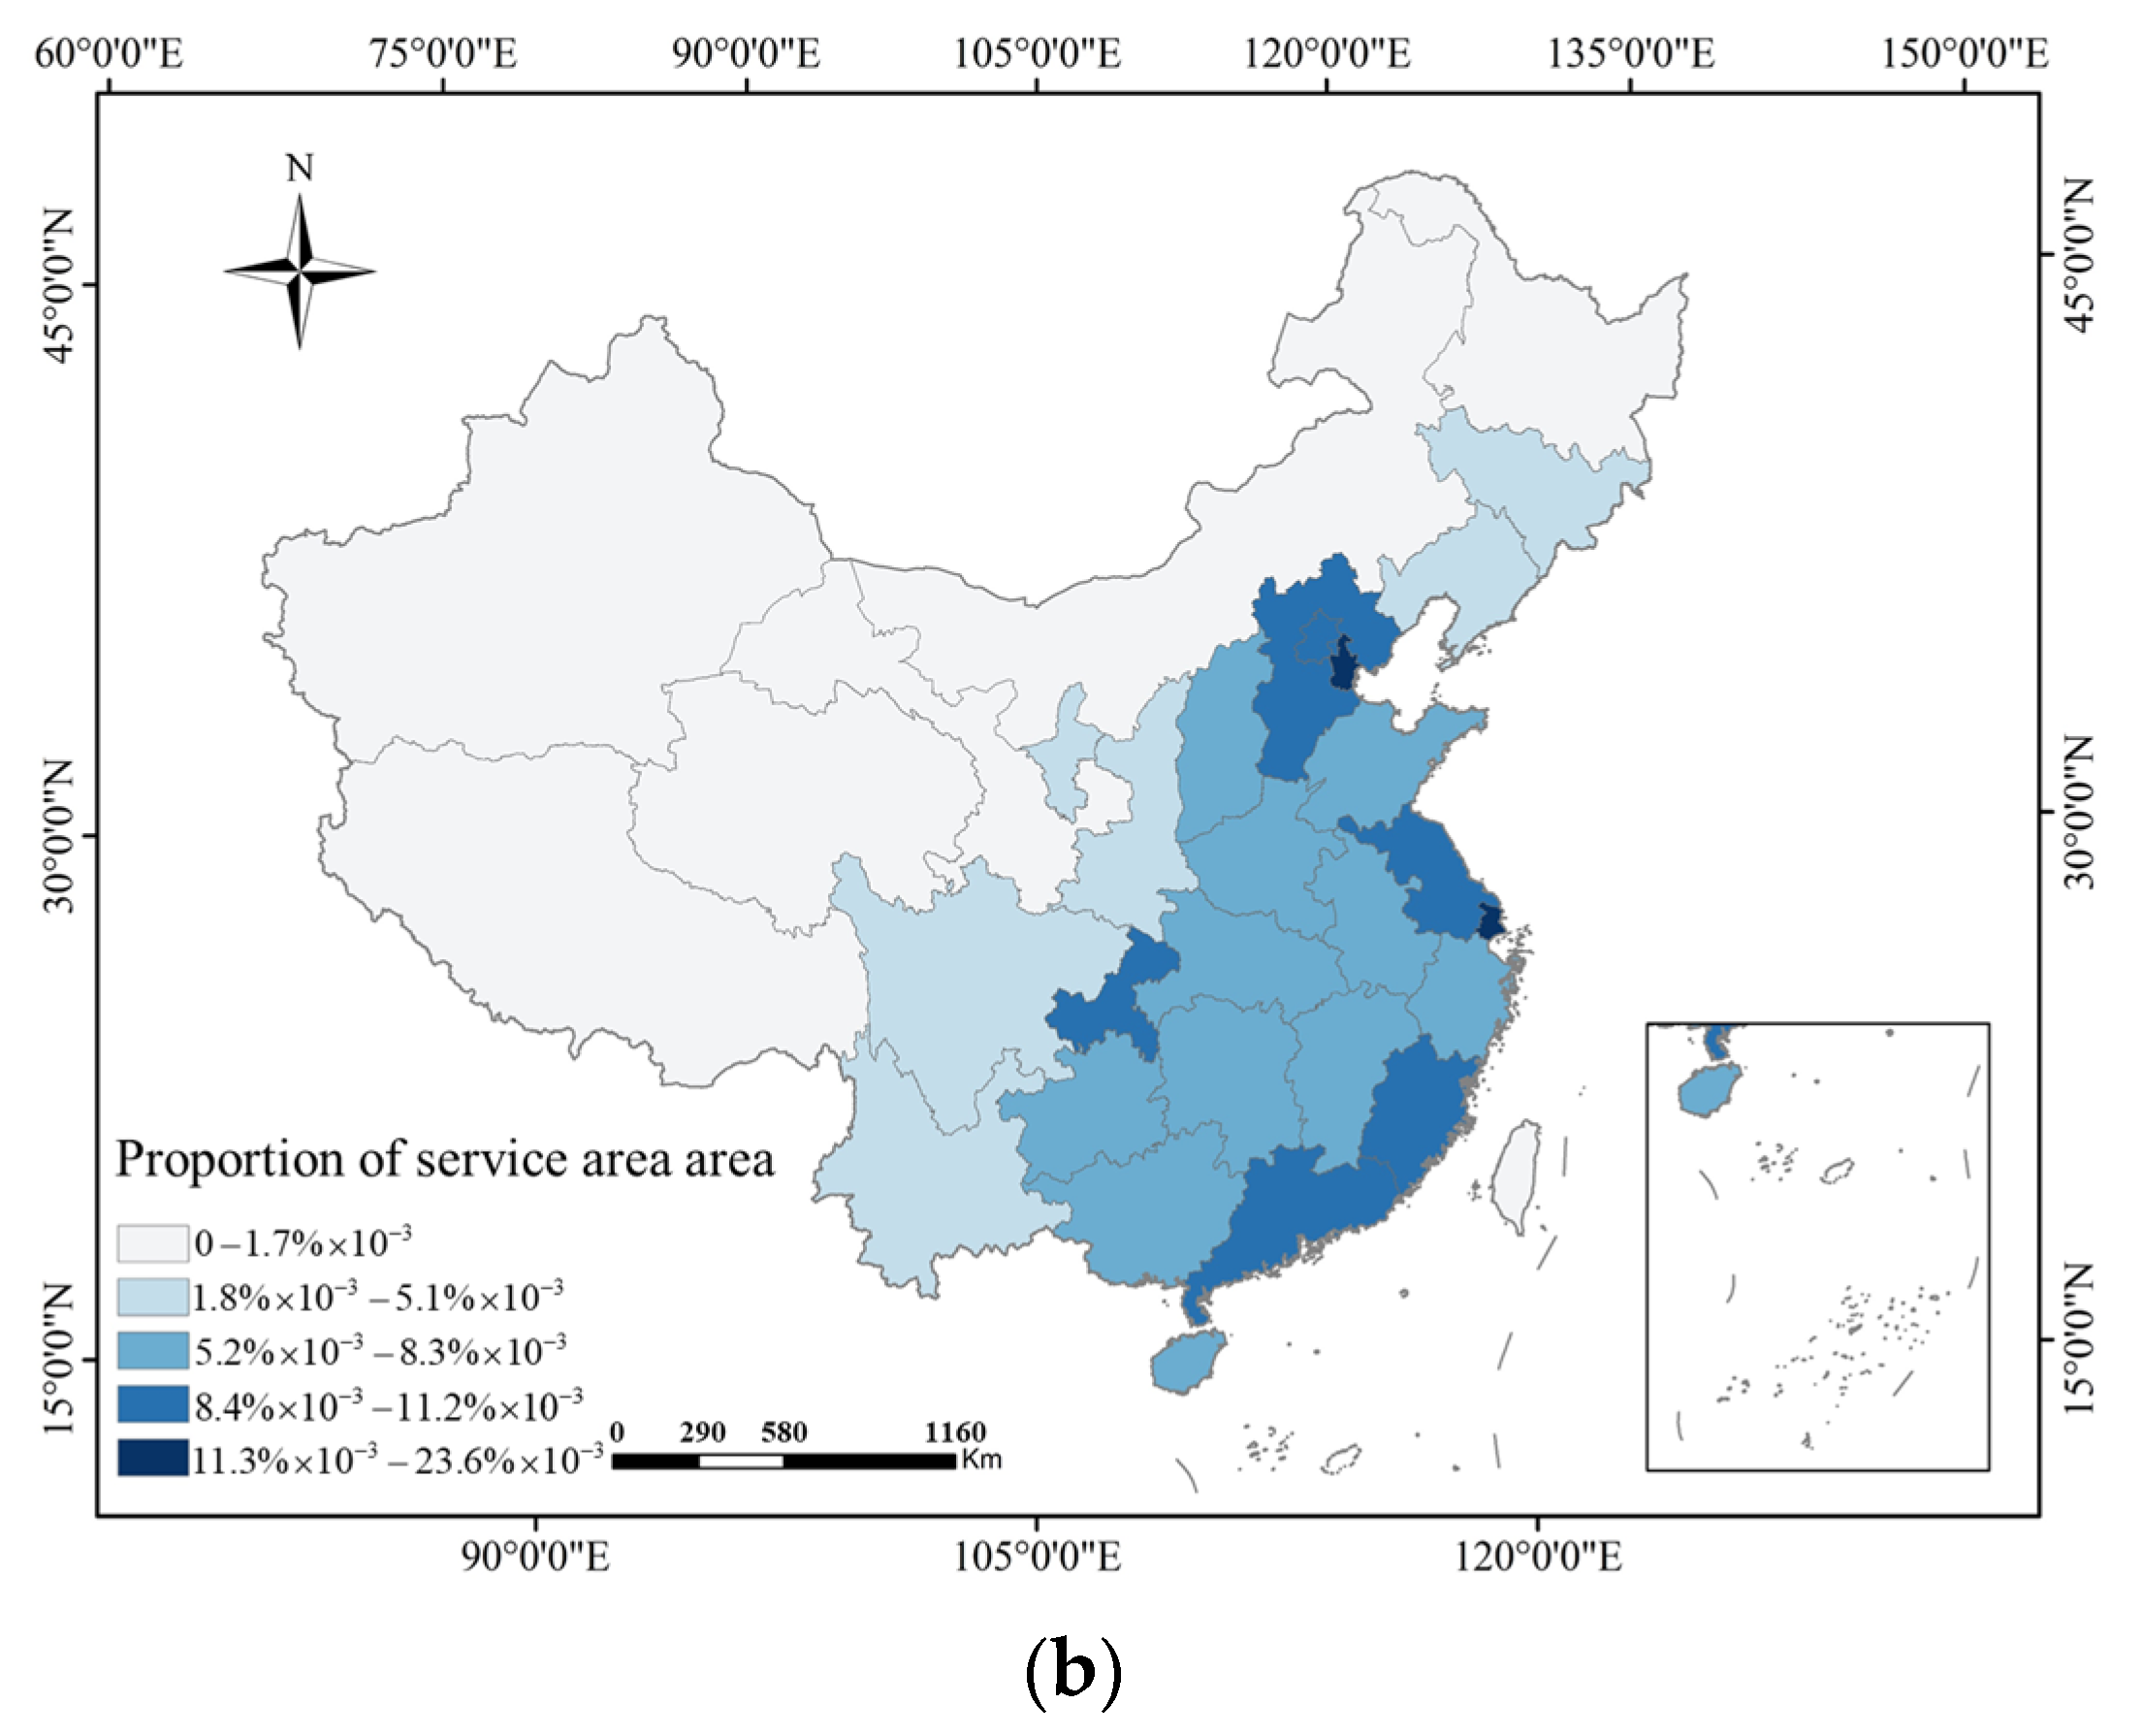
Figure 7a presents the distribution of expressway service area surface area across prefecture-level cities in China. As shown in the figure, Hebei Province and Guangdong Province have the largest total service area sizes among all regions.
By calculating the proportion of service area surface area relative to the administrative area for each prefecture-level city, the spatial distribution characteristics of expressway infrastructure in China can be more intuitively assessed.
Figure 7b illustrates the spatial distribution of expressway service area coverage as a percentage of each province’s administrative land area.
The results indicate that provinces in central and eastern China exhibit a relatively high proportion of land devoted to expressway service areas. In contrast, cities in northern, northwestern, and southwestern China show much lower ratios. This discrepancy can be attributed to several factors, including lower population density, less industrial activity, and reduced demand for passenger and freight transport in these regions. Additionally, the longer distances between urban centers and the high cost of highway construction in mountainous and remote areas contribute to the lower density of expressway infrastructure. As a result, the share of service area land in these regions is significantly lower than in the more developed and densely populated southeastern provinces.
4.2. Terrain Shading Impact Assessment
The solar energy potential of expressway service areas is significantly influenced by shadowing effects caused by surrounding terrain. In this study, a total of 1215 paired blocks of DEM data and expressway service areas were used to calculate the hourly shadow area across various regions of China.
As a case study, a service area located in a mountainous region of central China (longitude: 108.23°, latitude: 33.39°) was selected to illustrate the dynamic variation of shadow coverage over the course of a day.
Figure 8 shows the hourly shadow area evolution for this mountainous service area from sunrise to sunset.
Table 1 presents the corresponding solar altitude and azimuth angles for different hours of the day in this region.
To understand the long-term effects of shading, the daily shadow area from sunrise to sunset was computed for this service area throughout the entire year. By calculating the ratio of shadow area to total service area at different times, the degree of shading impact on solar energy availability was quantitatively assessed. This approach enables a clear evaluation of how topographic conditions affect the photovoltaic potential of expressway service areas under various solar positions.
4.3. Solar Energy Potential Assessment
After obtaining the surface area and hourly shadow area of each expressway service area, the hourly solar energy potential for each location was calculated. By aggregating the hourly solar energy values over an entire year, the annual solar energy potential of each expressway service area was determined. Using this approach, the annual solar radiation potential of all 1215 spatial blocks was summed to estimate the total annual solar energy potential for expressway service areas across China. The provincial distribution of this annual potential is illustrated in
Figure 9.
According to the results, the total solar energy potential of China’s expressway service areas is approximately 1400.72 TWh. The total annual solar irradiation potential (1400.72 TW) represents the available solar energy received by all service areas, from which an estimated installable PV capacity of 51.85 GW was derived. Assuming an average annual equivalent full-load duration of approximately 1280 h, the potential annual electricity generation is 66.37 TWh.
As shown in
Figure 9, provinces with the highest solar potential in expressway service areas are primarily located in southeastern, northern, and south-central regions of China. These regions benefit from both favorable solar irradiance conditions and a relatively high density of expressway infrastructure, making them particularly suitable for large-scale photovoltaic deployment in service areas.
4.4. Installed Capacity and Power Generation Potential
Installed capacity and electricity generation are key parameters for evaluating the development potential of PV systems. Based on the calculated solar energy potential of expressway service areas, the total PV installable capacity and electricity generation potential of China’s expressway service areas can be estimated.
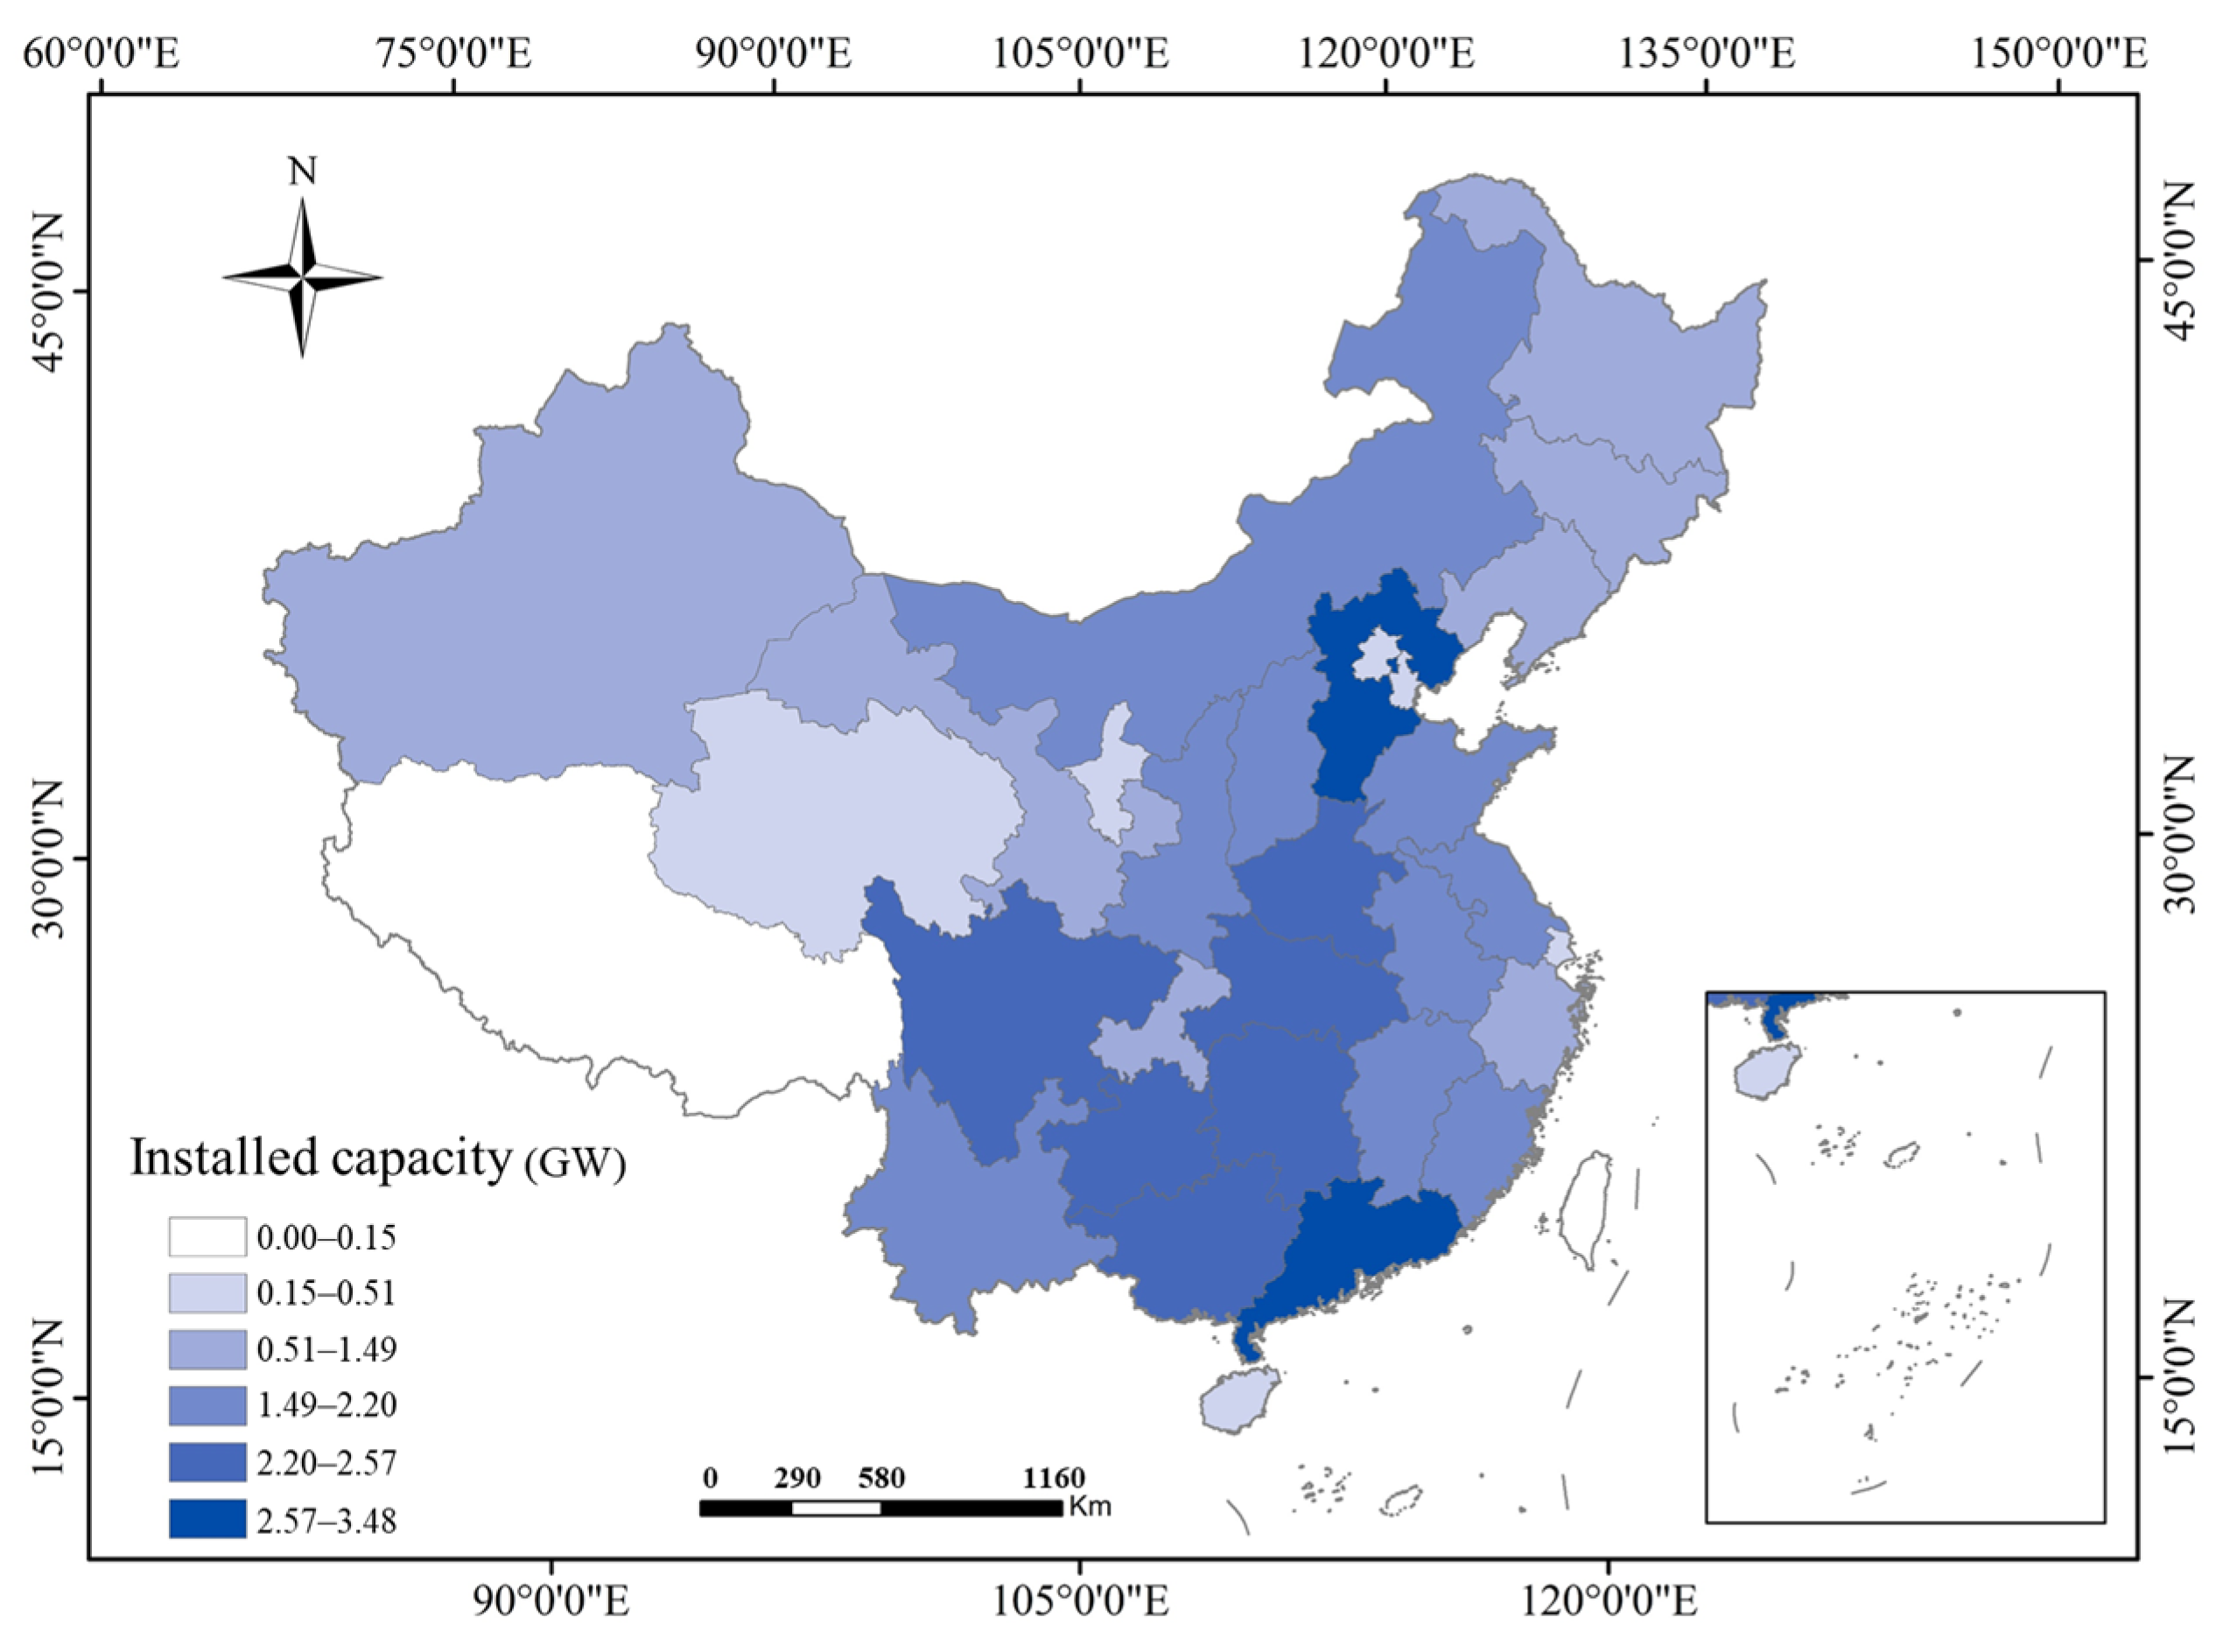
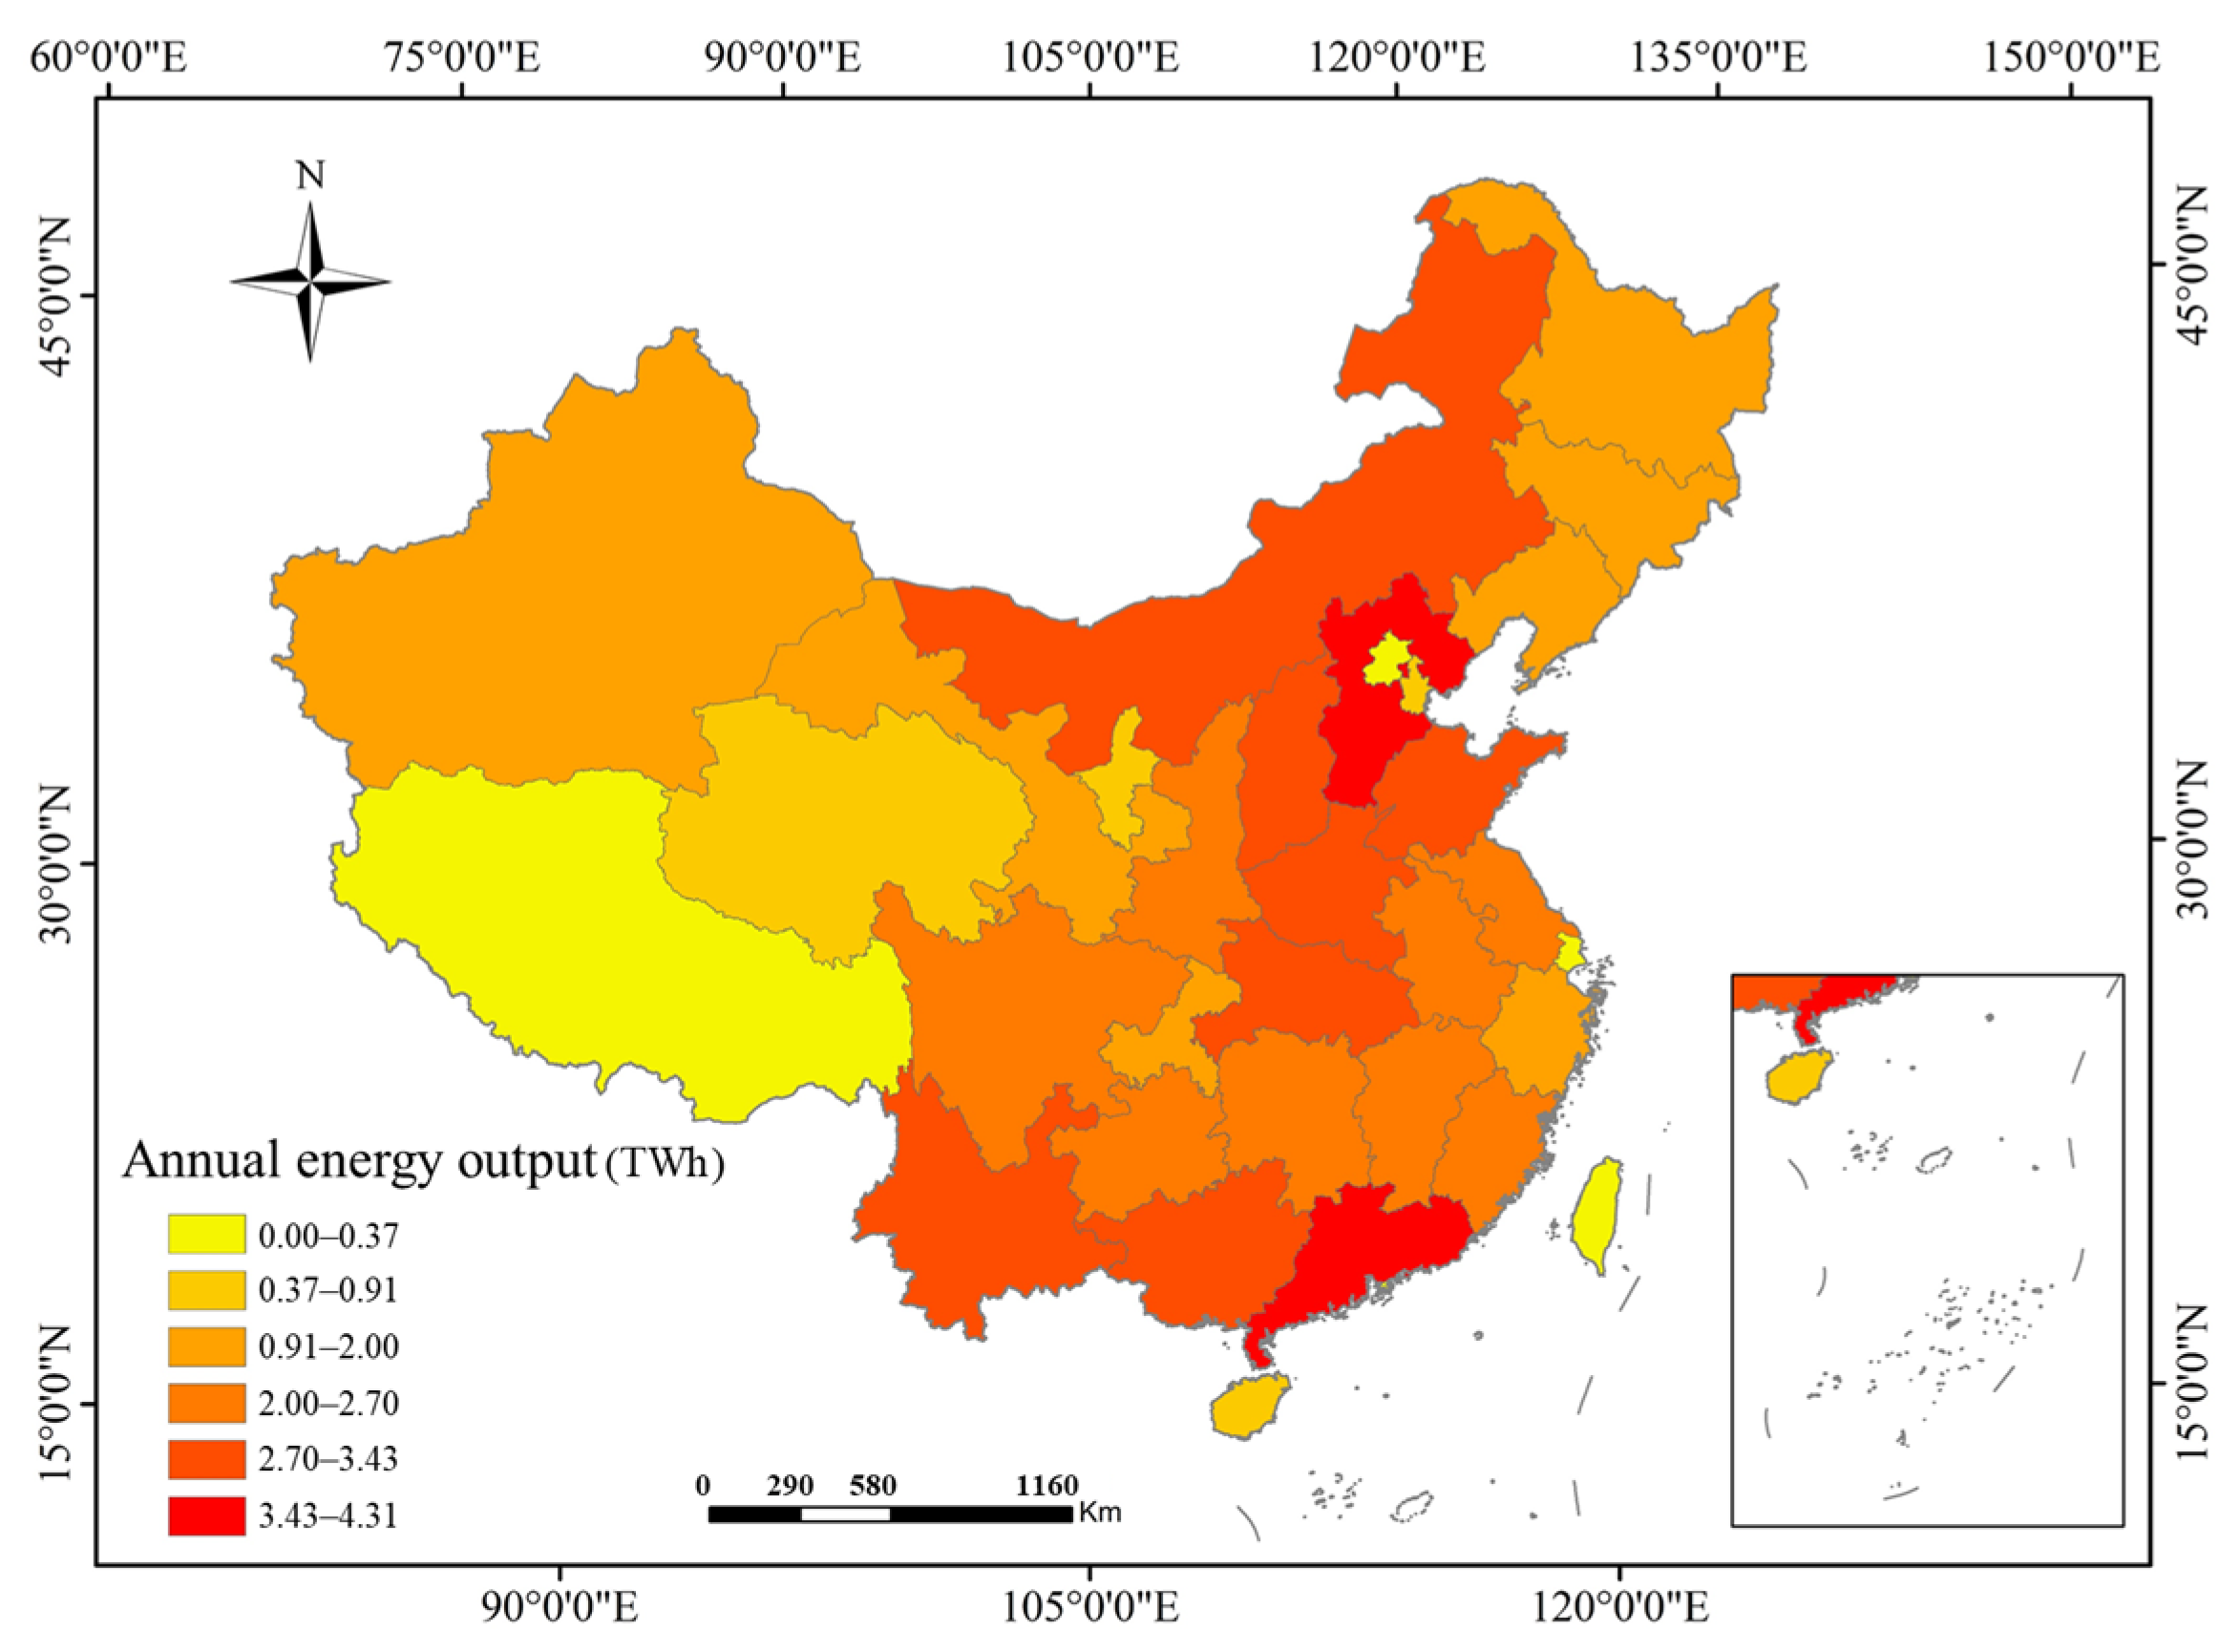
If solar PV panels were installed across all expressway service areas nationwide, the total installable capacity would reach approximately 51.85 GW, with an estimated annual electricity generation of up to 66.37 TWh.
Figure 10 and
Figure 11 present the spatial distribution of installed capacity and electricity generation across China’s provinces.
The estimated photovoltaic potential (51.85 GW capacity; 66.37 TWh/year generation) is consistent with previous national-scale assessments [
51], showing similar specific yields (1.1–1.3 MWh/m
2/year). This consistency validates the reliability of the model outputs.
From a spatial perspective, the provinces with the greatest PV potential—both in terms of capacity and generation—are primarily located in southern and northern China. The top four provinces in terms of total annual electricity generation from expressway service areas are Inner Mongolia, Hebei, Yunnan, and Guangdong. These provinces benefit from either high solar irradiance, extensive service area coverage, or both—making them key regions for large-scale solar deployment along expressways.
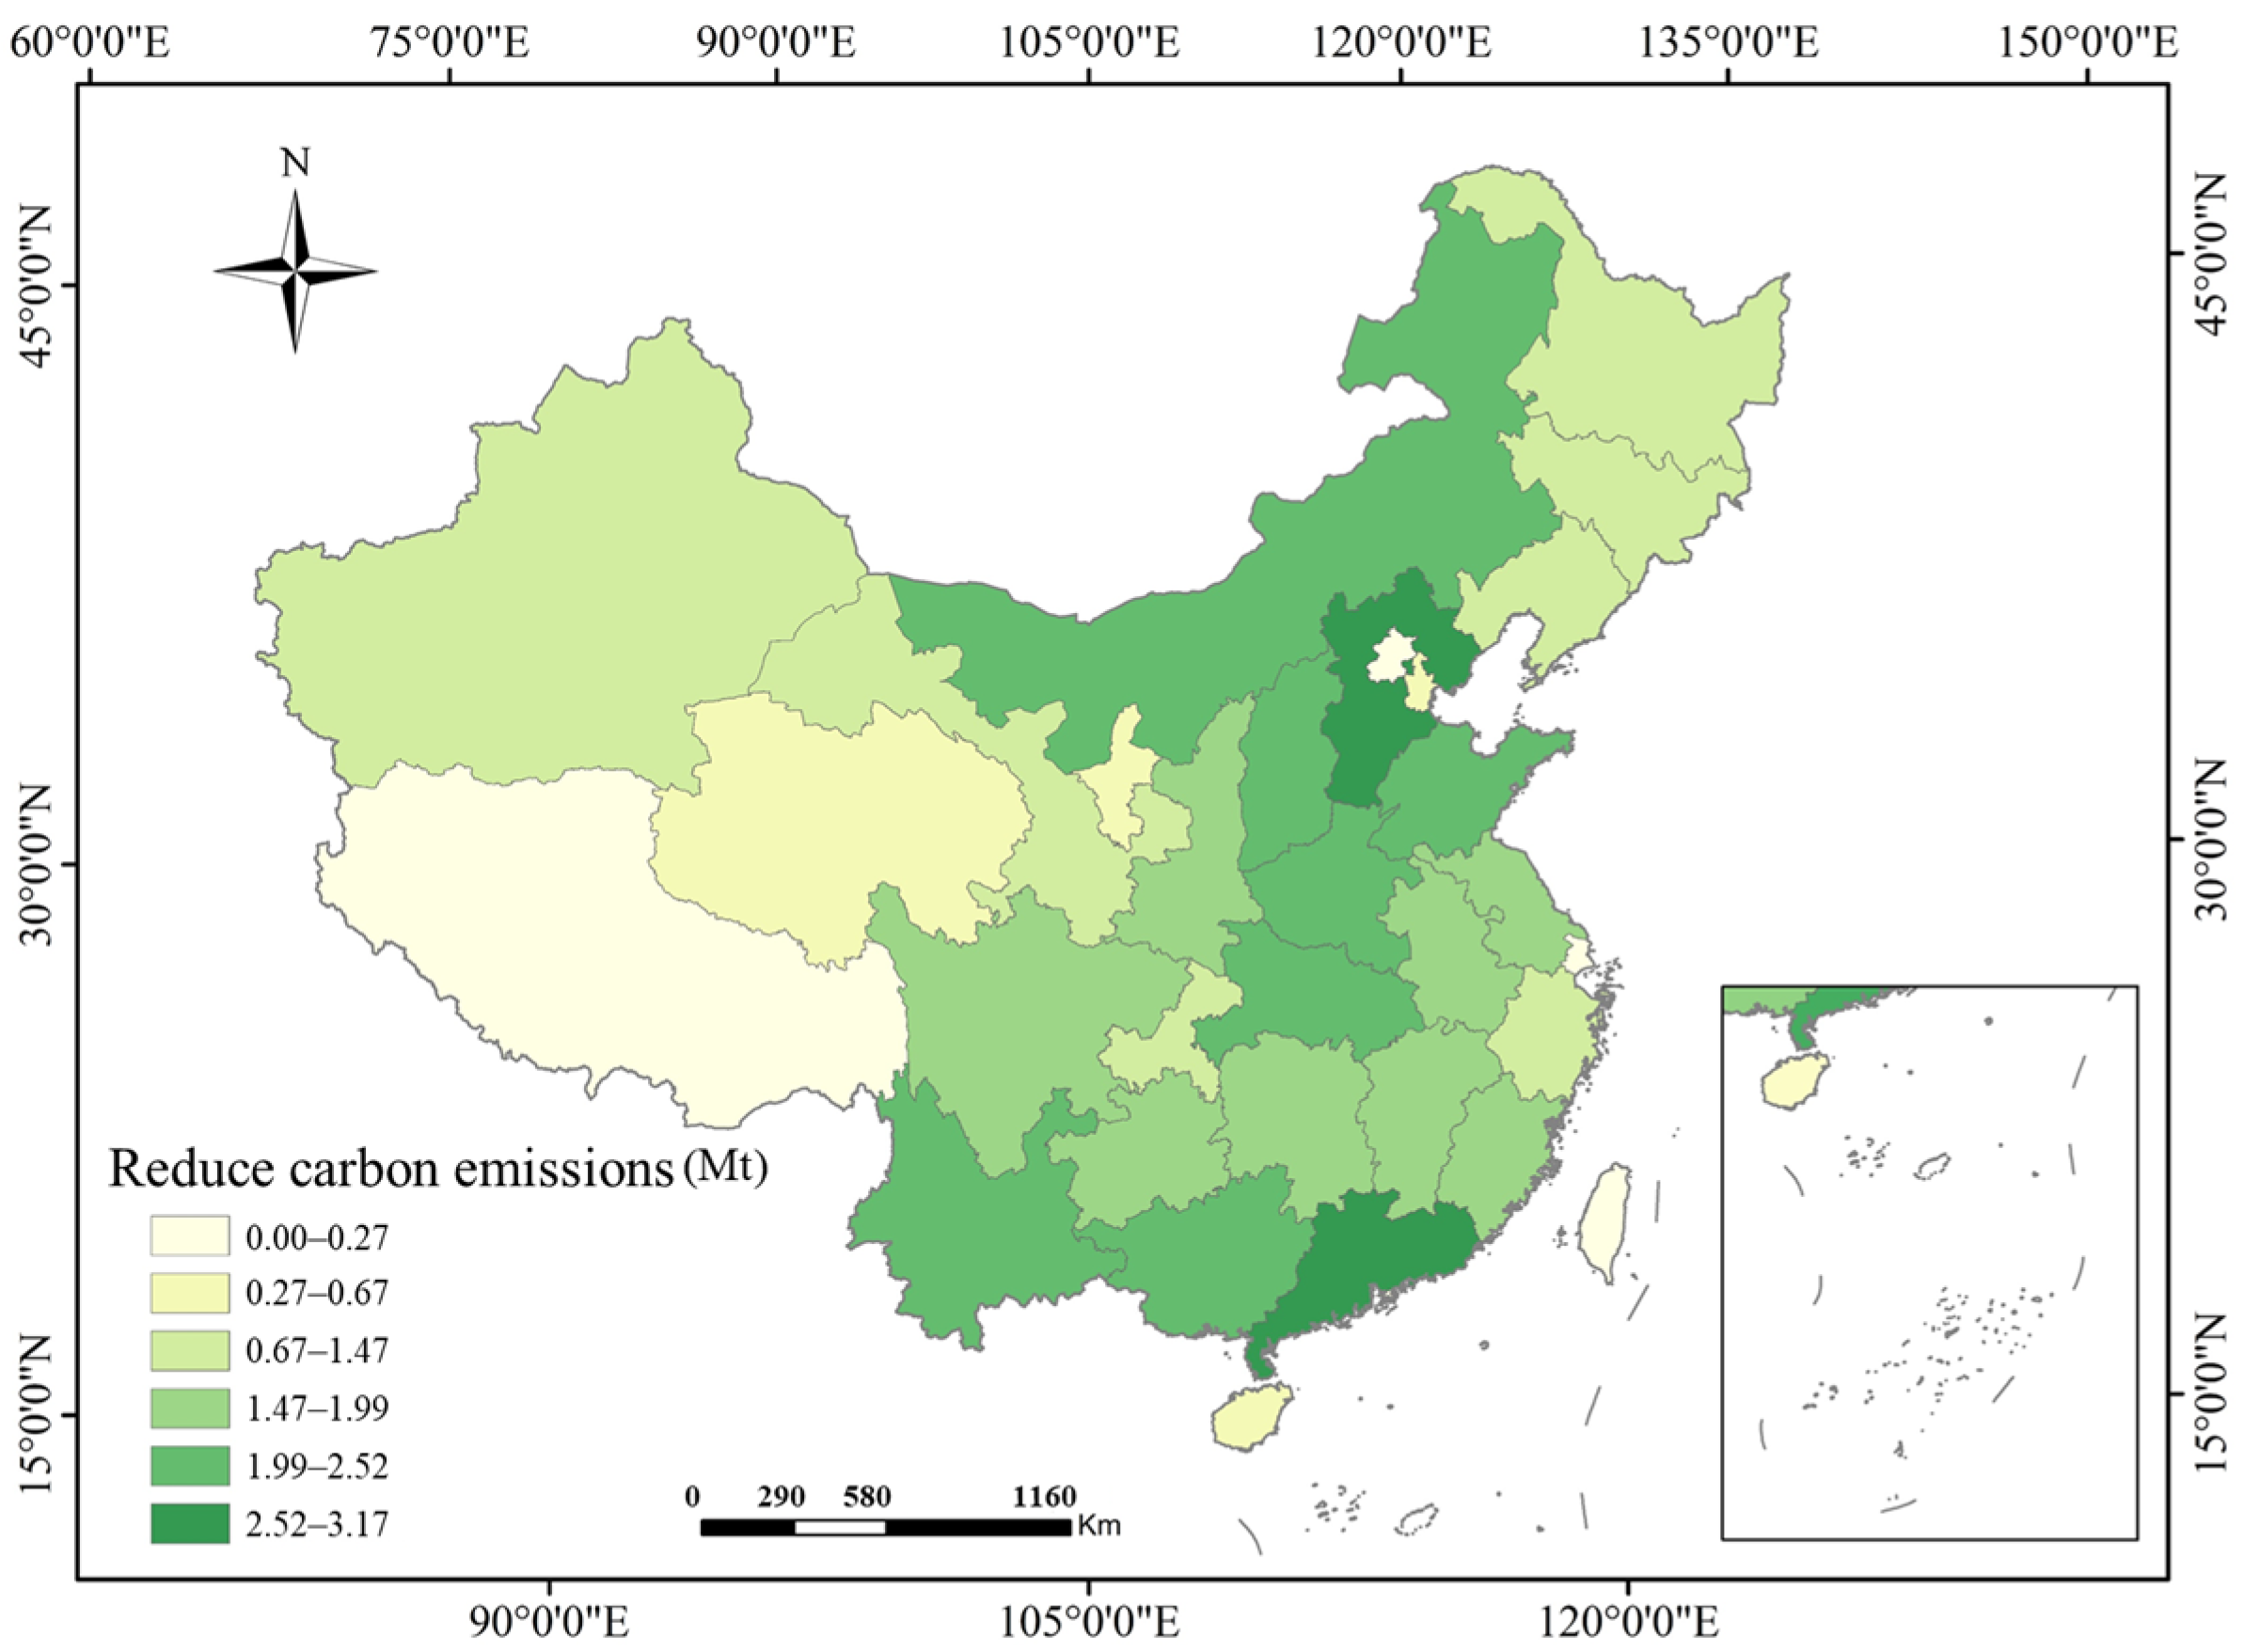
4.5. Carbon Emission Reduction Assessment
The estimated carbon emission reduction resulting from photovoltaic deployment in expressway service areas across China is illustrated in
Figure 12. The total potential reduction in CO
2 emissions is approximately 48.85 million tonnes.
The spatial distribution of emission reductions closely mirrors that of electricity generation potential, as regions with higher solar power output naturally correspond to greater displacement of fossil fuel-based electricity. This further reinforces the role of expressway service areas—particularly in high-potential provinces—as valuable assets in supporting China’s carbon neutrality goals through large-scale solar energy integration.
4.6. Discussion
Assessing the PV power generation potential of expressway service areas poses significant challenges due to limitations in data availability and the cost of data collection. Although this study accounts for terrain-induced shading when estimating hourly-scale solar PV potential, certain factors remain unaddressed. For instance, the natural topography of a service area is often altered during construction to meet engineering requirements—such as through land grading, excavation, and backfilling—to ensure flat and stable foundations. These modifications are not reflected in the original DEM data, potentially introducing deviations in shadow analysis. The years 2009 and 2014 were selected as representative years to reflect typical meteorological conditions. Although year-to-year variability may cause local deviations, the overall spatial distribution pattern remains consistent, ensuring the representativeness of the results. As most expressway service areas feature flat terrain or low-slope rooftops, the differences in tilt and orientation have limited impact on total irradiance (<5%). Therefore, assuming the same irradiance as the horizontal surface is reasonable for regional-scale analysis.
A uniform PR value of 0.8 was adopted as a representative average based on national PV performance standards. While PR values typically range from 0.75 to 0.85 depending on climate and system type, sensitivity analysis shows that this variation introduces less than ±6% difference in total generation estimates, which does not significantly affect spatial potential patterns.
Hebei Province shows the highest potential due to its extensive service area and favorable topography, while Guangdong ranks second owing to its high solar irradiance levels and dense expressway distribution.
Despite these limitations, the results of this study indicate that China’s expressway service areas possess considerable photovoltaic development potential. However, widespread deployment of solar systems in service areas has yet to be realized. On the one hand, high human and vehicle traffic in these locations necessitates careful consideration of user comfort and safety. On the other hand, service area architecture often features regionally distinctive landscape designs, with aesthetic rooftop elements that limit the suitability of those surfaces for PV installation. Additionally, the economic feasibility of PV integration into service areas remains underexplored and warrants further investigation.
Nonetheless, with ongoing advancements in PV technology and decreasing system costs, expressway service areas are expected to play an increasingly important role in supporting the development of intelligent transportation systems, EV infrastructure, and related services. In the context of China’s carbon peaking and carbon neutrality goals, the demand for sustainable energy solutions is intensifying. As smart transportation and EV deployment continue to grow, so too will their associated energy demands—further driving the need for clean, localized power sources such as solar PV systems in service areas.
Although this study focuses on regional photovoltaic potential assessment, the influence of semiconductor surface morphology and oxidation-induced changes on photovoltaic efficiency is noteworthy. The evolution of fractal and statistical surface parameters during oxidation can alter light absorption and charge transport properties of semiconductor layers [
55,
56].
This study focuses on the spatial estimation of photovoltaic potential using monthly mean irradiance data. Temporal variation plots at daily or hourly scales were not included due to data resolution constraints, but will be addressed in future work employing high-temporal-resolution datasets.
If all expressway service areas deploy PV systems, the annual CO2 reduction potential (48.85 Mt) would offset about 4.3% of the total emissions from China’s highway sector, providing a valuable supplementary pathway toward the national ‘carbon peaking and carbon neutrality’ objectives.
Future research will focus on evaluating the economic viability and ecological benefits of PV deployment in expressway service areas. In particular, we will explore decision-making models that match service area energy loads with available installation area, aiming to support optimized, site-specific PV integration strategies.

