Article

Design and Performance Evaluation of Car Seat Heat Pump for Electric Vehicles

1
Department of Mechanical Engineering, Graduate School, Kookmin University, Seoul 02707, Republic of Korea
2
TSB Development Team, Seoul Laboratory, Hylium Industries, Inc., 2F, 3F, 128 Baumoe-ro, Sechi-gu, Seoul 06754, Republic of Korea
3
School of Mechanical Engineering, Kookmin University, Seoul 02702, Republic of Korea
*
Author to whom correspondence should be addressed.
Energies 2025, 18(23), 6197; https://doi.org/10.3390/en18236197
Submission received: 2 November 2025 / Revised: 21 November 2025 / Accepted: 24 November 2025 / Published: 26 November 2025
(This article belongs to the Section J: Thermal Management)

Abstract

This study proposes and evaluates a car seat-integrated heat pump as localized air conditioning system for electric vehicles (EVs). The proposed system uses R1234yf and comprises a compressor, microchannel heat exchangers, an electronic expansion valve, and a four-way reversing valve for bidirectional operation, delivering conditioned air through the internal seat ducts to the cushion and backrest. A horizontal twin-rotary compressor was developed, which exhibits high isentropic and volumetric efficiencies. The compact module, with a height of 145 mm, a width of 330 mm, a length of 484 mm, and a mass of 20 kg, can be installed under the seat while satisfying the standard SgRP/H30 envelope constraints. Testing was conducted in controlled environmental chambers across representative operating conditions with various airflow rates at different temperatures of 30 °C and 35 °C for cooling and 7 °C and 15 °C for heating. At a typical compressor speed of 4000 rpm, the proposed system achieved coefficient of performance (COP) values of 3.5–5.5 and 4.5–8 in cooling and heating modes and cooling and heating capacities of 650–900 W and 400–600 W, respectively. Concentrating thermal control at the seat is expected to provide rapid, occupant-level cooling/heating with favorable efficiency, indicating a practical path to EV energy savings and thermal comfort.

1. Introduction

The transportation sector is a major contributor to global fossil fuel consumption and greenhouse gas (GHG) emissions. Accounting for approximately one-third of the total annual fossil energy consumption, it ranks second only to the power generation sector [1]. In the transportation sector, cars alone emit more than 300 million tons of carbon dioxide (CO2) annually because of their internal combustion engine [2].
Transportation accounts for approximately 23% of the total energy-related CO2 emissions worldwide, with road transport responsible for approximately 28% of these emissions [3,4,5]. The burning of fossil fuels in vehicles releases various pollutants, including nitrogen oxides, sulfur dioxide, and particulate matter, all of which have adverse environmental and health consequences [6].
Electric vehicles (EVs) provide a promising solution to these environmental challenges by producing zero tailpipe emissions and providing potential reductions in overall GHG emissions [7,8]. As technological innovations continue to drive advancements in battery technology and electric power trains, EVs are becoming a more feasible alternative to conventional fossil fuel-powered vehicles. The EV market is projected to expand rapidly, driven by the urgent need to decrease reliance on fossil fuels, particularly in densely populated urban areas where air quality is a pressing concern [9].
However, one of the significant challenges faced by EVs is their energy consumption related to auxiliary systems, particularly the heating, ventilation, and air conditioning (HVAC) systems [10,11]. HVAC systems can account for a substantial portion of the energy use of an EV, leading to a decreased driving range typically estimated to be as much as 35% to 50% under certain conditions [12]. Unlike internal combustion engines that provide waste heat that can be harnessed for cabin heating, EVs lack significant onboard heat sources, thereby necessitating energy-intensive heating solutions [13].
In cold climates, cabin heating in EVs typically relies on positive temperature coefficient heaters because of their simple structure and rapid thermal response. These heaters typically operate at voltages up to 800 V and can reach surface temperatures of up to 172 °C [14]. This system has low efficiency and high-power consumption and can reduce the vehicle driving range by up to 40% at 0 °C [15]. Heat pump systems have emerged as a promising approach for thermal management, offering enhanced efficiency by maintaining the battery temperature within a manageable range and controlling the vehicle cabin temperature more efficiently [16]. The advantages of heat pump technology in vehicles include improved energy efficiency, extended driving range, and enhanced cabin comfort [17].
Heat pump systems are extensively acknowledged for their high efficiency [18], making them a more reasonable alternative to conventional air conditioning technologies. However, these systems still exhibit the limitation of relatively high-power consumption in both heating and cooling modes, because substantial energy is required to regulate the temperature of the entire cabin. To advance more energy-efficient solutions, a car seat air conditioning system has been proposed.
A car seat air conditioning system is a localized thermal management system that is integrated directly into the seat structure. The air supply feeds the internal ducts of the seat so that the conditioned air is discharged directly to the occupant’s body through the cushion and backrest, enabling rapid, localized thermal control with reduced HVAC workload. By embedding a flexible air conditioner beneath seat surfaces, these systems provide both high-efficiency cooling and heating. This approach reduces dependence on full-cabin HVAC, improves passenger thermal comfort, and supports energy savings and an extended driving range, which is particularly beneficial for EVs.
Thermoelectric modules have been applied as an air conditioning system capable of providing both cooling and heating effects. The integration of thermoelectric technology in car seat air conditioning systems has emerged as a significant innovation that enhances passenger comfort. Thermoelectric modules, driven by the Peltier effect, can provide localized heating and cooling, thereby offering a tailored thermal environment for occupants without relying heavily on the main air conditioning system of the vehicle [19].
Although thermoelectric systems demonstrate unique advantages for localized air conditioners in vehicles, they exhibit low efficiency compared with the compression refrigeration technology. This limitation highlights the need for alternative technologies that can deliver higher performance and energy savings in EVs. In this study, a heat pump system for seat air conditioning systems is designed and developed. Our compact heat pump unit can be positioned beneath a vehicle seat and distributes conditioned air through internal ducts within the upholstery, ensuring direct interaction with occupants.
The seat-integrated heat pump module is engineered for the limited volume available inside an automotive seat base, adopting a compact, self-contained layout that fits the target seat architecture without affecting ergonomics. The refrigerant circuit is arranged around a central compressor and a four-way reversing valve, enabling bidirectional operation for cooling and heating. Performance tests of the heat pump are conducted under various operating conditions, including airflow rates, cabin temperatures, and compressor speeds. The performance characteristics of the compact heat pump system applied to seat air conditioning are analyzed, and its applicability is evaluated.

2. Development of Car Seat Heat Pump System

2.1. Heat Pump System

To enhance thermal comfort while reducing energy consumption, manufacturers are moving beyond the exclusive reliance on conventional air conditioning systems and are developing seats with integrated microclimate ventilation that regulates the temperature through controlled airflow at the contact interface between the seat surface and the occupant’s body [20]. Directing airflow toward the seat backrest can reduce the temperature more effectively than conventional methods, thereby resulting in improved and more efficient thermal comfort [21,22]. Building on these advancements, this study extends the concept by developing a car seat heat pump system as a more comfortable and energy-efficient thermal management solution.
The heat pump system is installed beneath the car seats to directly target the passengers’ bodies, enhancing thermal comfort and minimizing energy consumption. Our heat pump system draws air from inside the vehicle cabin and processes it through a heat pump cycle before recirculating it to the seat backrests and cushions. As the conditioned air passes through the porous layers of the seats, it comes into direct contact with the passenger’s body, providing localized cooling or heating as required, as shown in Figure 1. This mechanism achieves thermal comfort without lowering the temperature of the entire cabin, thereby reducing the overall cooling load and improving energy efficiency.
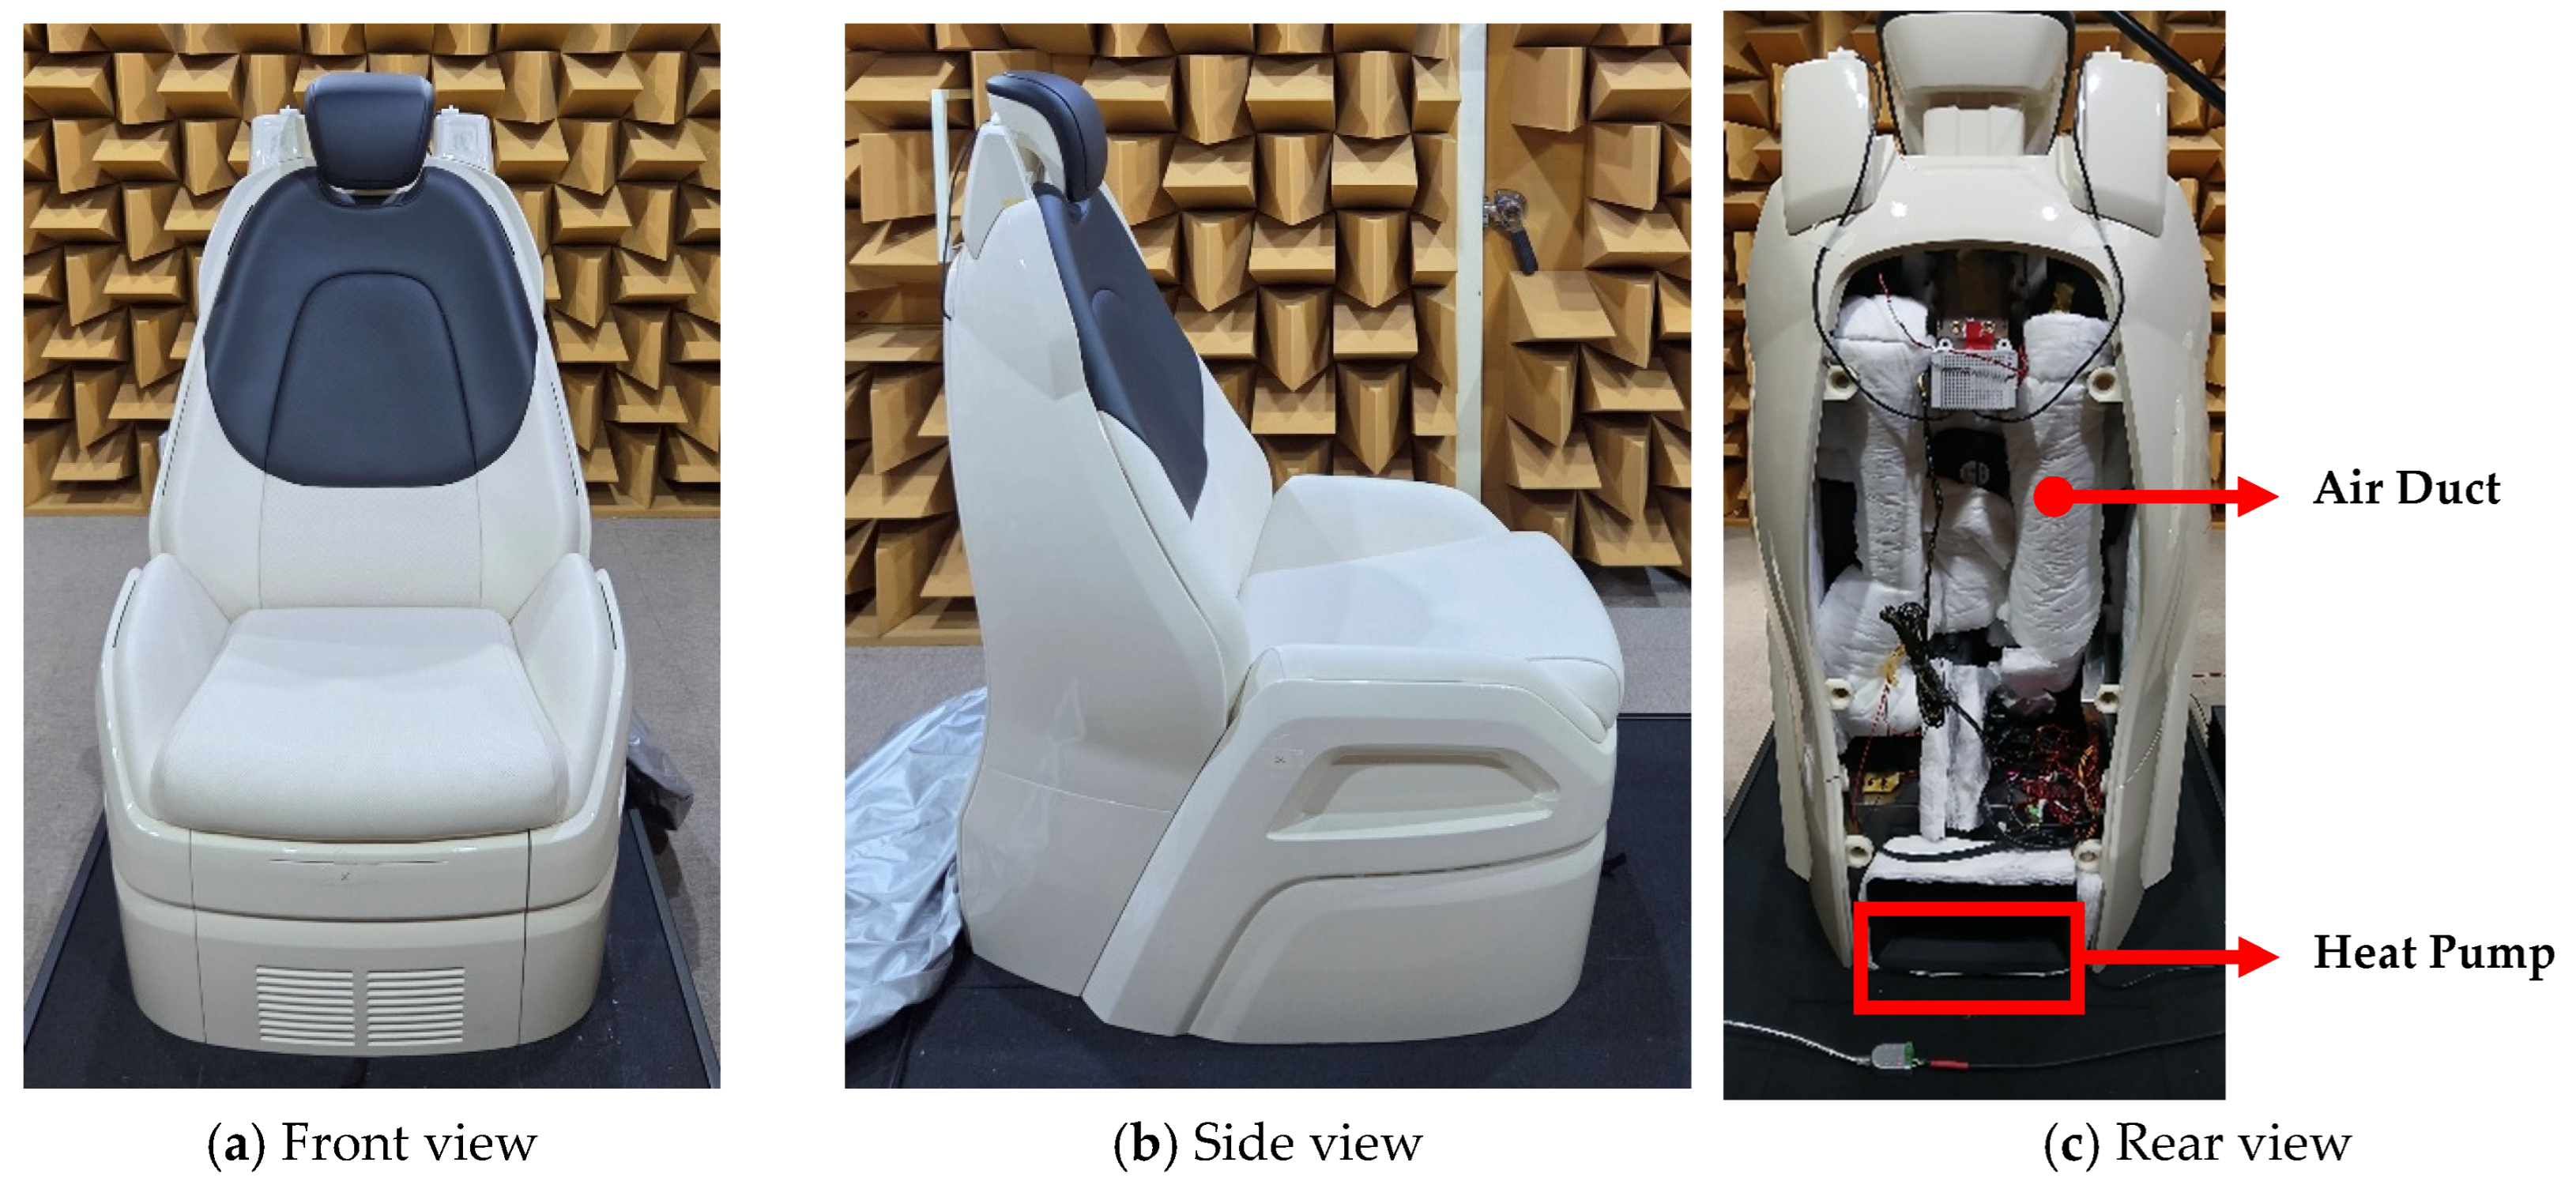
The present study evaluates the performance of the seat-integrated heat pump system installed on a seat test rig, not in a full vehicle. The experiments were conducted inside a thermal environmental chamber that simulates representative cabin temperature and humidity conditions. The photos of seat-integrated heat pump, where heat pump system is installed beneath the car seat is shown in Figure 2.
Developing a car seat heat pump system requires selecting an architecture and components to realize an optimal configuration under tight packaging and energy constraints. The heat pump design is constrained by the under-seat packaging envelope. Vertical clearance is dictated by the seating reference point (SgRP) to hip point (H30) interval of 127–405 mm [23] depending on the vehicle type. Given the small seat envelope, the components must be compact and lightweight with shortened refrigerant lines to reduce the pressure drop and facilitate integration into the seat model.
The principal components of a car seat heat pump system include five primary components: a compressor, a condenser, an evaporator, an expansion device (electronic expansion), and a four-way reversing valve as shown in Figure 3. In addition to these components, the system requires a fan or blower to drive the air flow, along with temperature sensors and electronic control units, for stable operation.
The car seat heat pump system has dimensions of 145 mm (height) × 330 mm (width) × 484 mm (length). Its internal architecture includes a primary equipment bay at the base with a height of 145 mm, which houses core components such as the compressor, heat exchangers, and fans. In addition, a rear sub compartment with a length of 161 mm is designated for the blower assembly. The system has a total mass of 20 kg. Compared with the SgRP envelope, the design satisfies the vertical and under-seat packaging constraints.

2.2. Electric Compressor

The compressor is a critical component in the heat pump system and is responsible for circulating and compressing the refrigerant to enable efficient cooling and heating cycles. The development of an appropriate compressor is essential to ensure system performance, energy efficiency, and thermal comfort for seat occupants. For integration into a car seat, the compressor must feature a compact size that fits within the confined space of the seat. A dual twin-rotary compressor was developed in a horizontal configuration for placement in low spaces under a seat as shown in Figure 4. Furthermore, the developed compressor is equipped with pressure and thermal protection, which automatically shut down the unit when any operating parameter exceeds the specified safety thresholds. The allowable safety limit is shown in Table 1.
Isentropic efficiency is a key performance metric that indicates how effectively a compressor converts input energy into useful work while minimizing entropy generation. The rotary design achieves high isentropic efficiency through optimized internal geometry and component arrangement, maintaining favorable compression ratios while minimizing energy loss. Volumetric efficiency is another important metric that represents the ratio of the actual mass of the refrigerant compressed to the theoretical maximum achievable under ideal conditions. The dual twin-rotary compressor excels at maintaining high volumetric efficiency because of its tight sealing and minimal internal leakage.
Table 2 compares and summarizes the technical specifications of the developed compressor and the ASPEN compressor. The developed compressor has a compact configuration, with a width of 120.1 mm, height of 80.1 mm, and length of 295.3 mm, compared with the Aspen compressor, which measures 122.1 mm, 79.5 mm, and 316.4 mm in width, height, and length, respectively. The developed unit features a displacement of 5.7 cc/rev, which is slightly higher than that of the Aspen compressor (5.6 cc/rev). Both compressors use a 2,3,3,3-Tetrafluoropropene (R1234yf) refrigerant and share an identical weight of 2.4 kg and a rated power of 440 W.
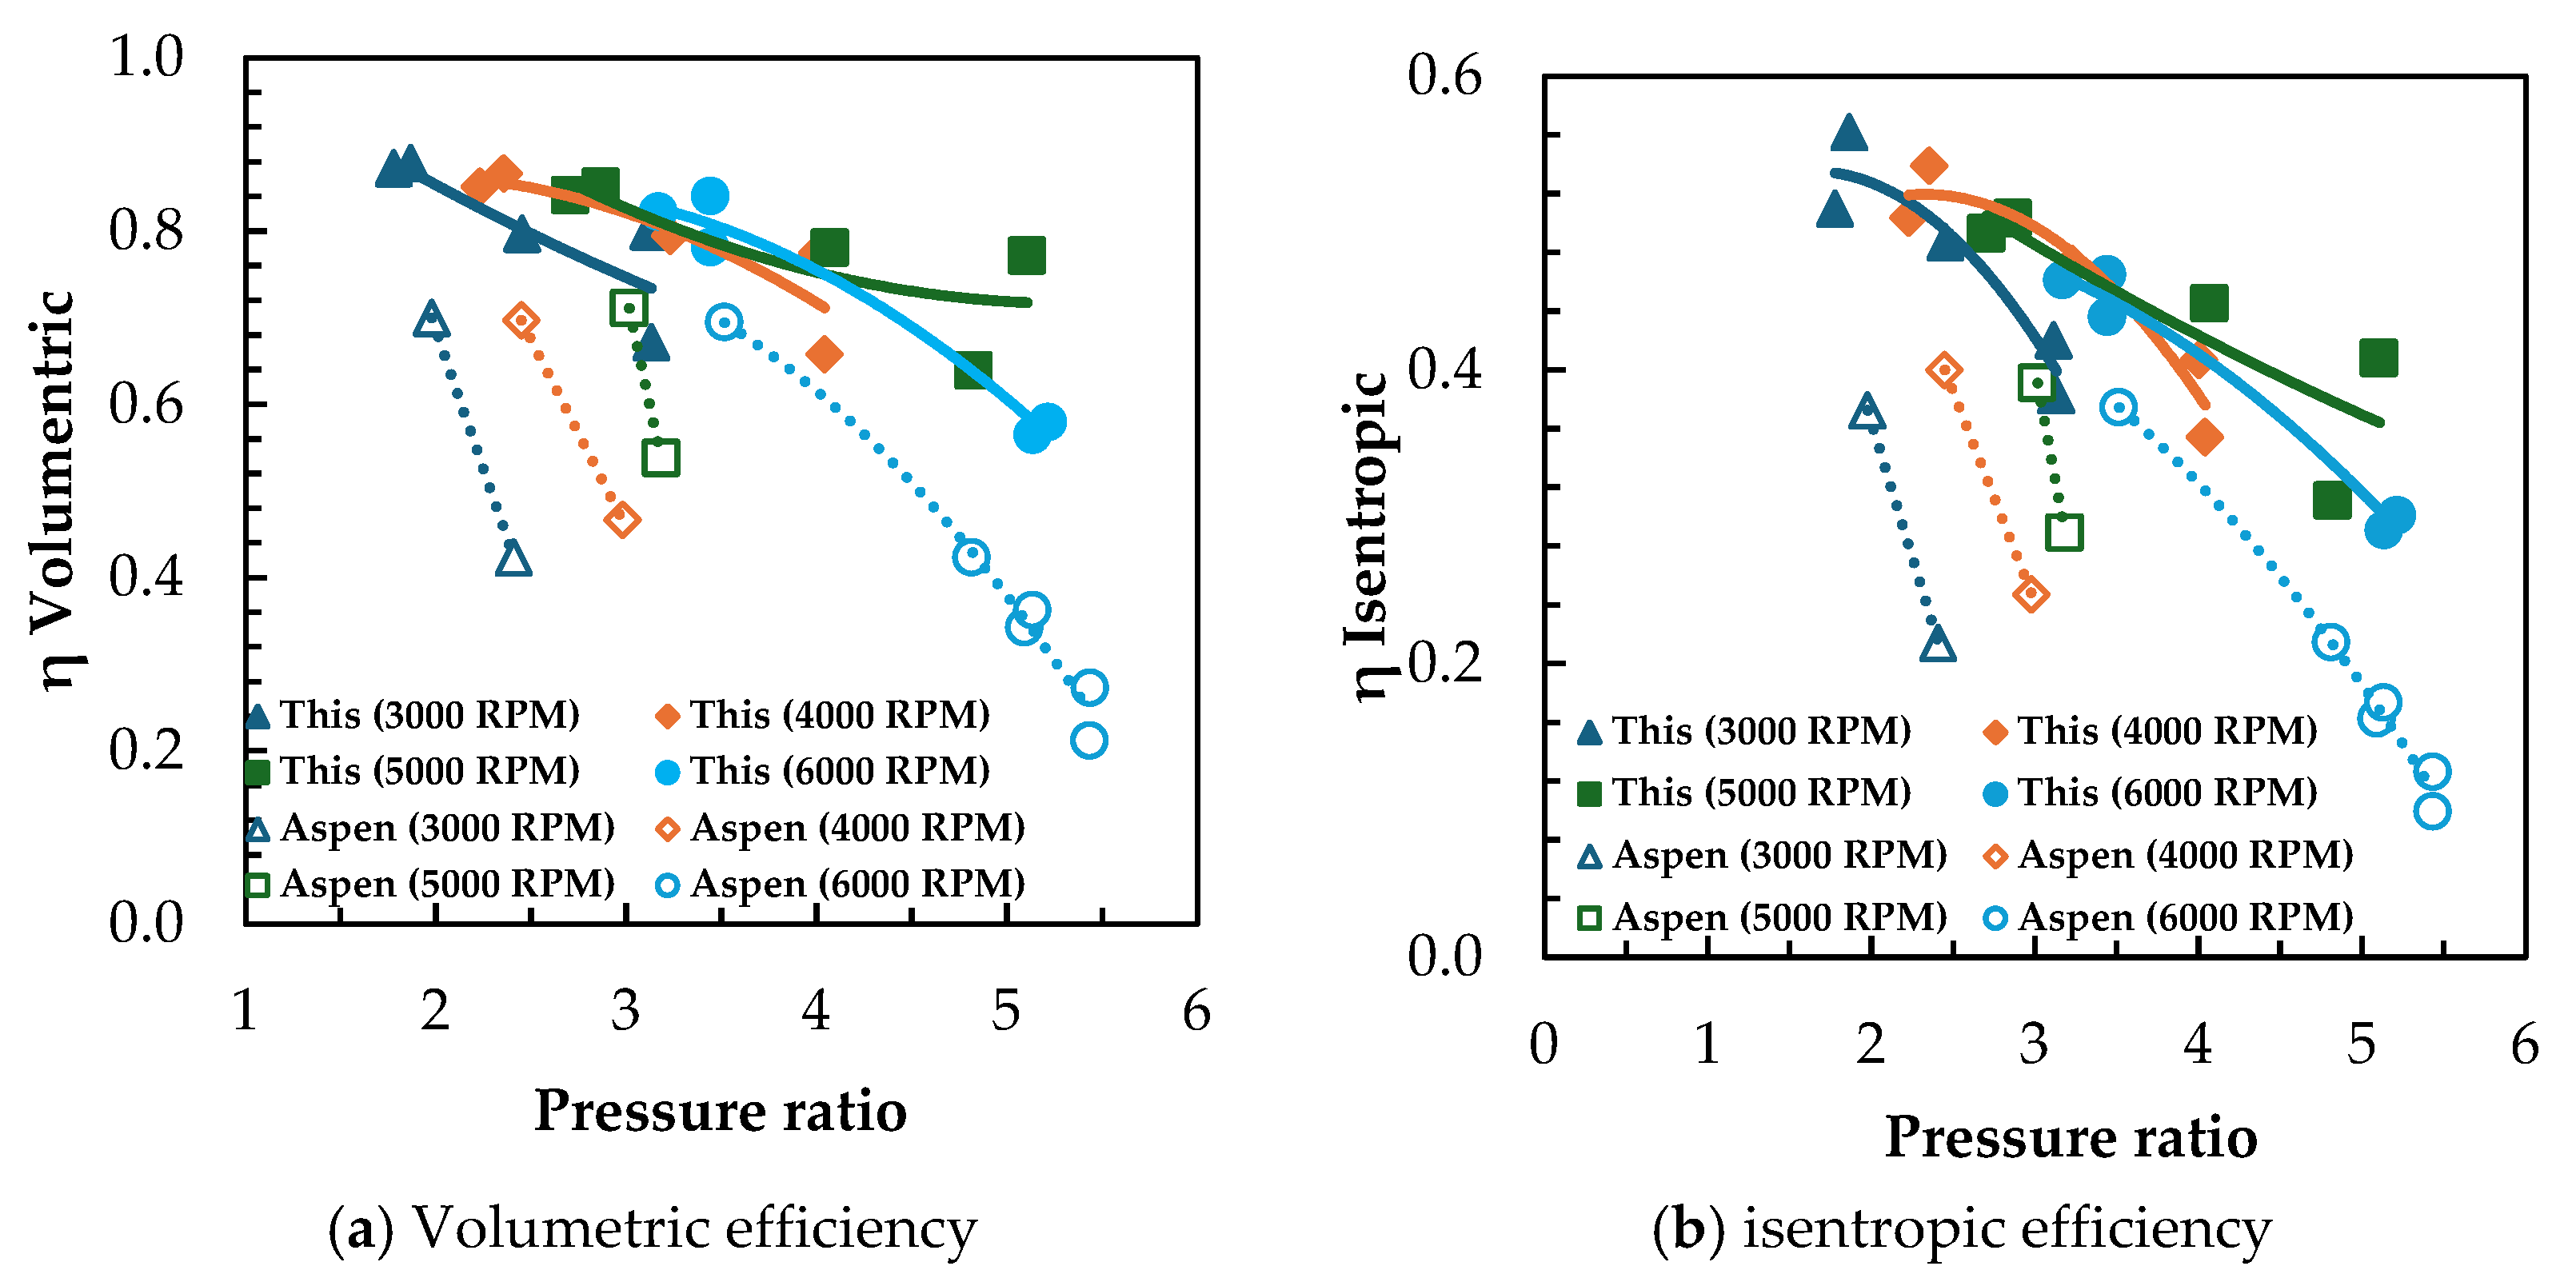
Figure 5 compares the volumetric and isentropic efficiencies of the developed compressor with those of Aspen over a range of pressure ratios and rotational speeds. The compressor in this study operates within a rotational speed range of 2000~6000 rpm and a compression ratio between 2~5. Under the operating range, the volumetric efficiency of the developed compressor is in the range of 0.6~0.9 and the isentropic efficiency of 0.3~0.6, it has superior performance compared to the existing ASPEN compressor (LLC, Marlborough, MA, USA), so better system performance can be expected than the system equipped with an ASPEN compressor.
Overall, the developed compressor can be regarded as a suitable compressor for a car seat heat pump system, owing to its higher volumetric efficiency and smaller physical dimensions than conventional compressors, which enable efficient performance and easy integration into compact under-seat thermal management systems.

2.3. Heat Exchangers

The compact design of microchannel heat exchangers (MCHXs) allows for simpler integration into various vehicle components while ensuring that weight and space requirements remain in line with the standards set for EVs. Therefore, the use of MCHXs is highly relevant in the development of car seat heat pump systems, where heat transfer efficiency and space limitations are crucial factors. The development of MCHXs plays a critical role in enhancing heat pump systems. The compact and efficient design of MCHXs not only facilitates improved energy utilization but also aligns with the design constraints inherent in car seat heat pumps.
In order to arrange the heat pump system in a limited space under the seat, various configurations with different specifications of heat exchangers were considered. Among them, four representative models of system configurations are shown in Figure 6, where layout, size and number of condenser and evaporator coil layers were systematically varied. The performance of the selected heat exchangers was analyzed using Coil Designer [26,27], which is widely used for heat exchanger performance analysis.
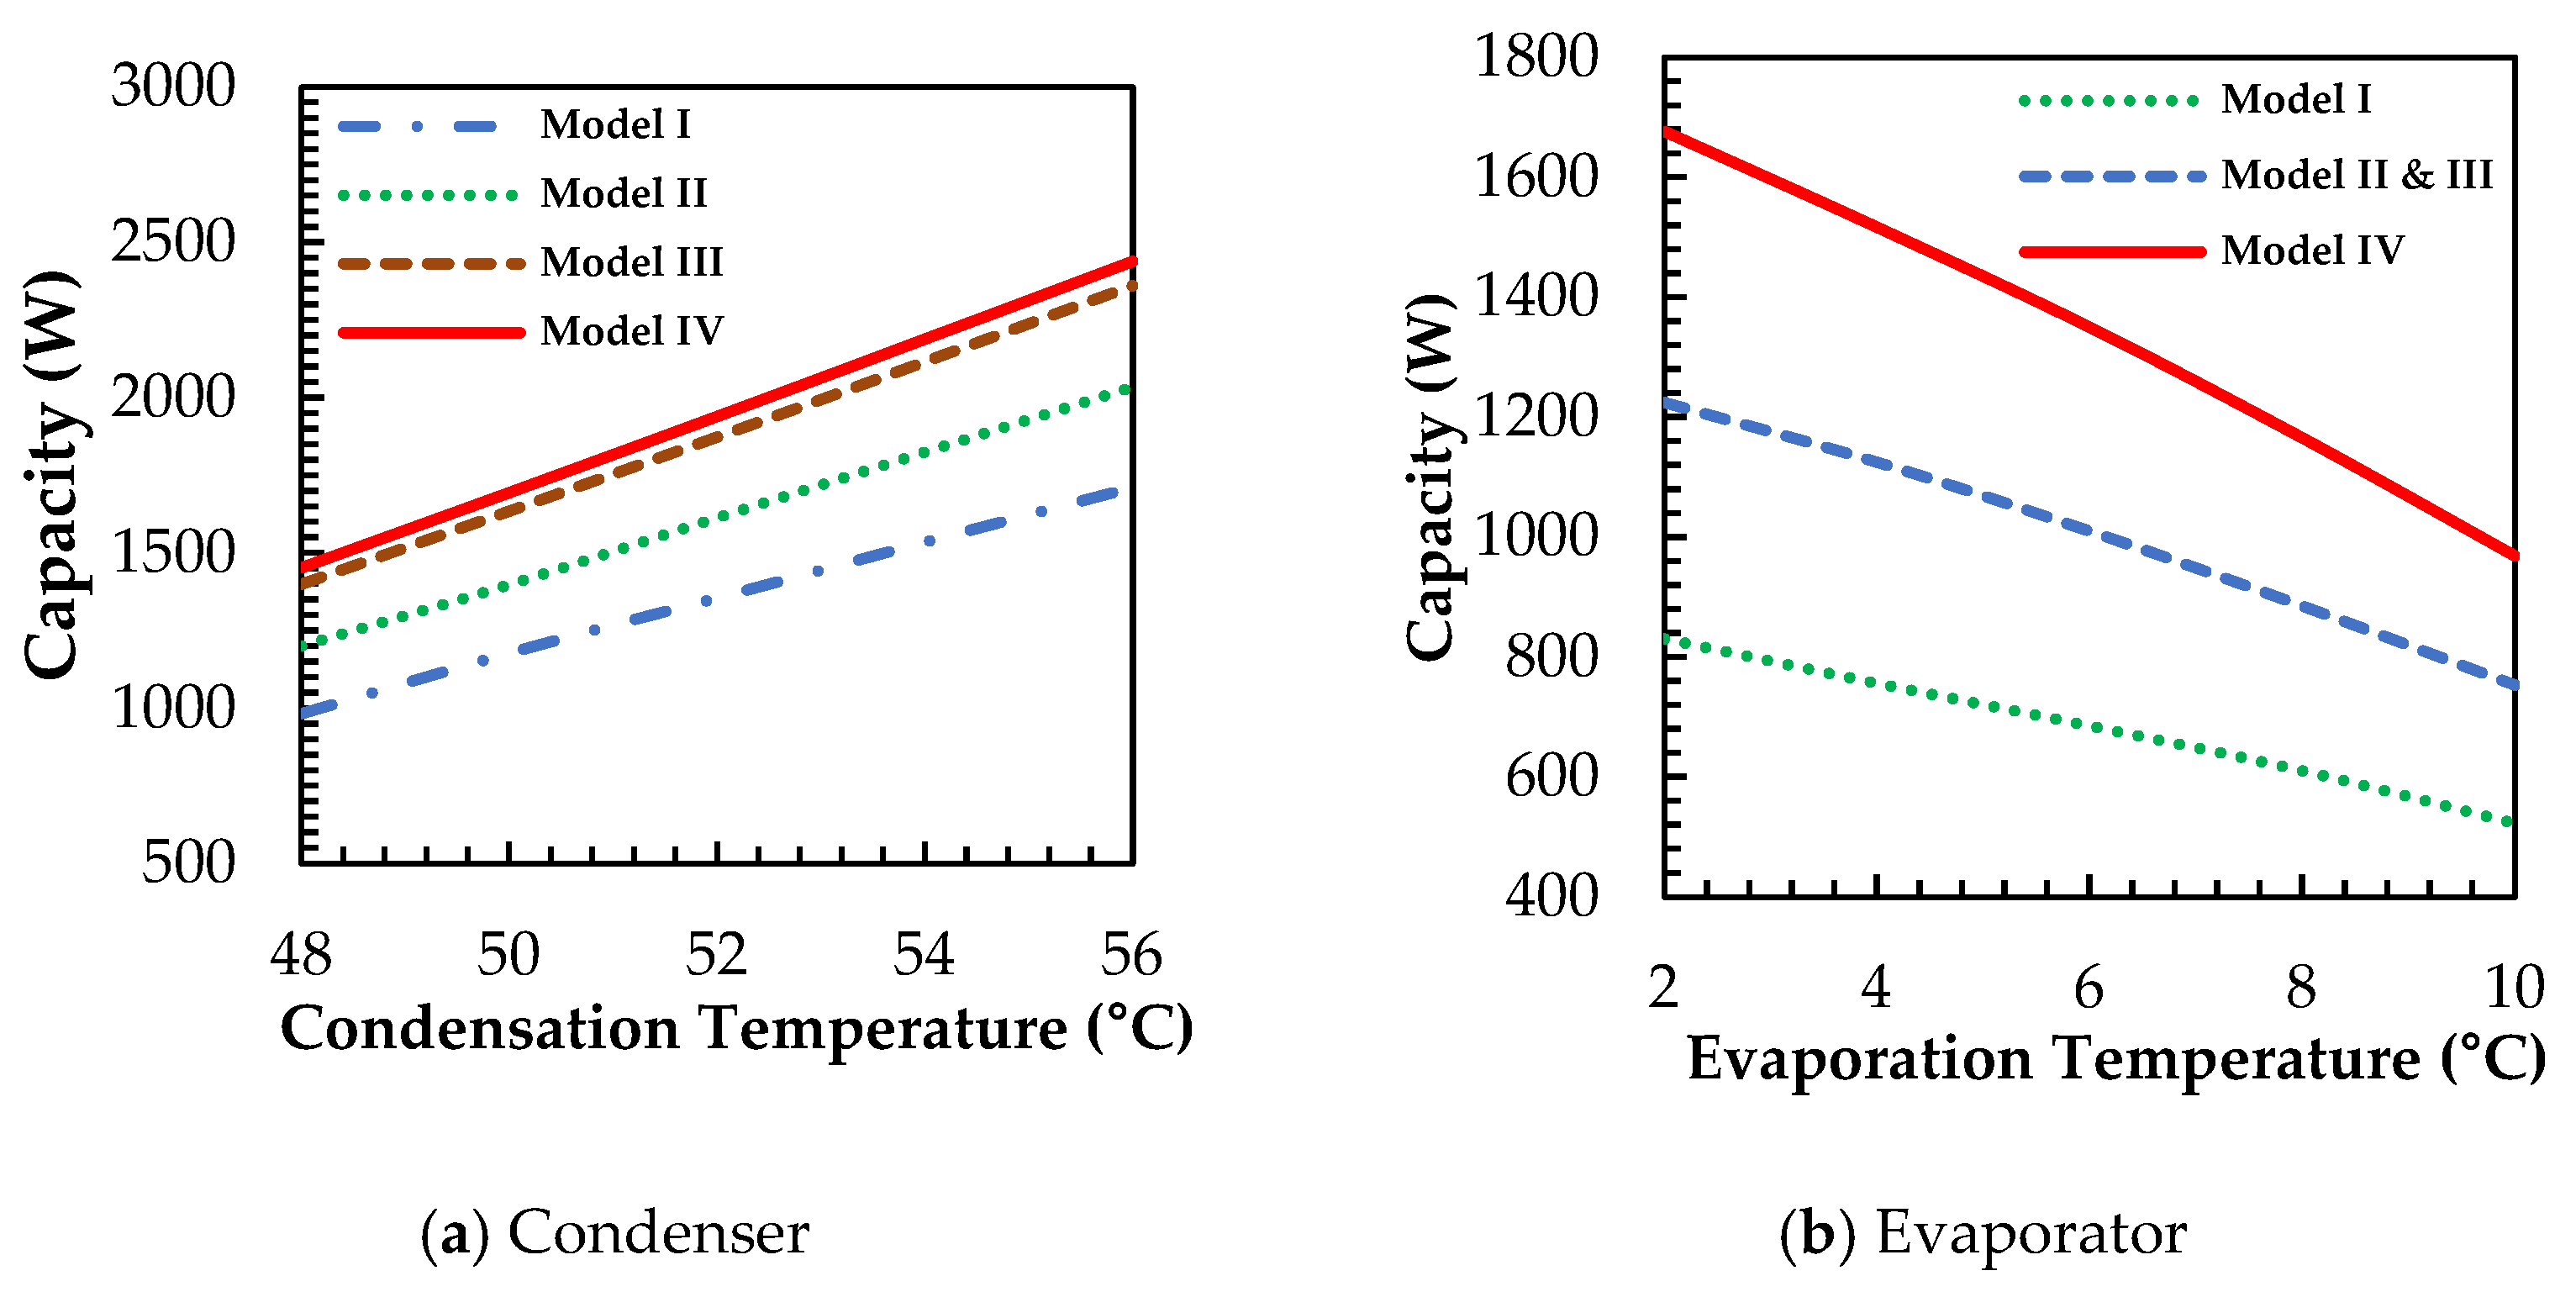
Figure 7 shows the system performance for the different heat exchanger models, when the condensation temperature of the condenser increases under conditions where the air temperature and air flow rate are kept constant, the temperature difference between the refrigerant and air increases, and the amount of heat transfer in the condenser increases. In the case of evaporator, on the contrary, as the evaporation temperature decreases, the temperature difference between the air and the refrigerant increases, so the amount of heat transfer in the evaporator decreases. The specifications and layout of the heat exchangers in this study were determined so as to maximize the capacity of heat exchanger for achieving higher system performance. Model IV was identified as the highest design configuration and was selected for subsequent experimental testing considering limited space.
The heat exchangers designed in this study incorporate a condenser with two layers and an evaporator with three layers for cooling operation as shown in Figure 8. During the heating operation, the refrigerant flow direction and the function of the heat exchangers are reversed. In other words, the roles of the condenser and evaporator are reversed between cooling and heating operations.
The specifications of the heat exchanger used in this study are summarized in Table 3. The table contains the main design parameters, including the core geometry, tube arrangement, and fin configuration, for the evaporator and condenser during cooling operation. These specifications form the basis for performance evaluation and ensure that the selected design is consistent with the compactness and efficiency requirements for integration into the car seat heat pump system.

2.4. Auxiliary Components

In the car seat heat pump system, several auxiliary components play a role in supporting overall performance while ensuring passenger comfort. The electronic expansion valve regulates the flow of the refrigerant to the evaporator with an optimal superheat setting, enabling the system to respond quickly to changes in the thermal load and improve efficiency.
The blower evaporator circulates air over the evaporator surface, thereby enabling effective heat absorption while maintaining the microclimate around the passenger’s body. In addition, the condenser fan supports the heat release process by circulating air through the condenser, thereby ensuring efficient refrigerant condensation.
The four-way (reversing) valve reconfigures the refrigerant flow paths to render the two heat exchangers functionally interchangeable. The seat-side unit serves as a condenser in heating mode and as an evaporator in cooling mode, and vice versa. This circuit reconfiguration enables rapid transitions between heating and cooling modes without physical modifications to the circuit.

3. Test Setup and Conditions

3.1. Test Setup

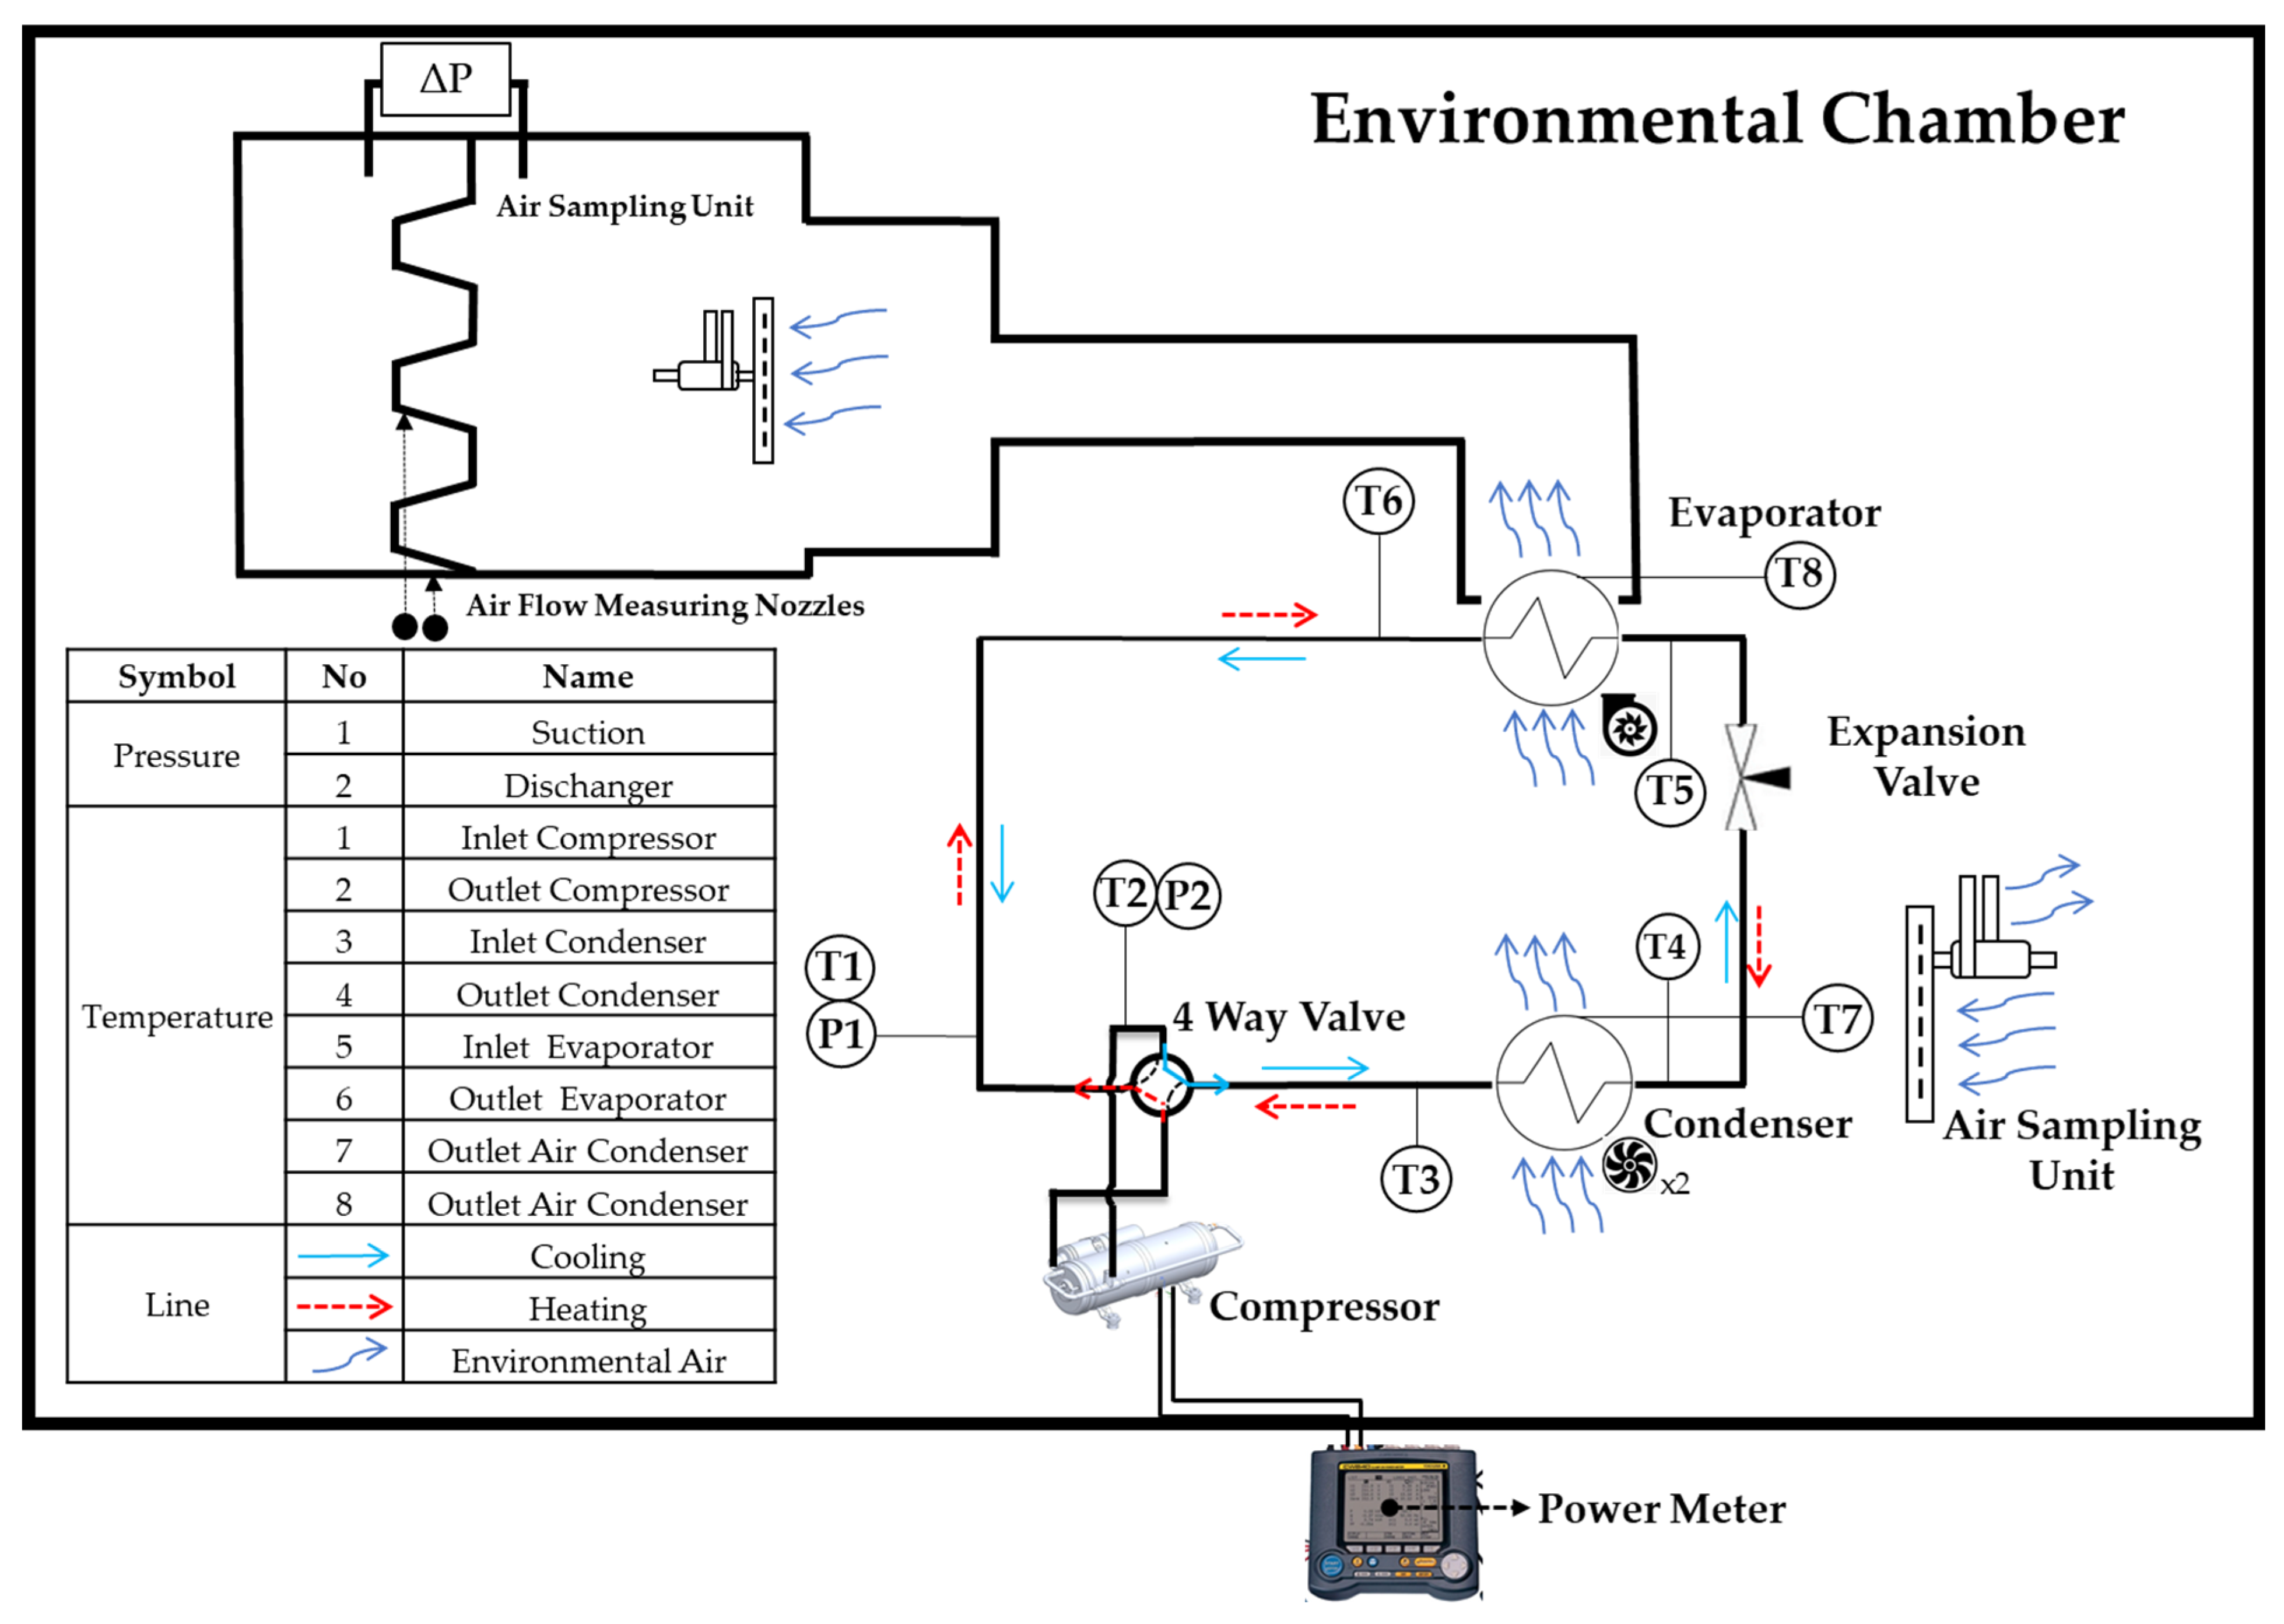
The performance test of the proposed heat pump system is conducted in an environmental chamber in which the temperature and humidity can be controlled. The wind tunnel is equipped with a resistance temperature detector (RTD) to measure both the dry and wet bulb temperatures, allowing for accurate temperature readings and humidity levels. Furthermore, the wind tunnel features four nozzles with different diameters, which are used to calculate the airflow by measuring the pressure drop across the nozzle.
Figure 9 shows a schematic of the test setup for the heat pump system, including the installation of temperature and pressure sensors. Temperature sensors are placed at the inlets and outlets of the evaporator, condenser, and compressor. Furthermore, temperature sensors are installed on the air side to monitor changes in the air temperature at the condenser and evaporator. The data obtained from these sensors are used to monitor the thermal conditions of the refrigerant and air and serve as input for the control system in regulating the expansion valve, fan, and compressor speed.
Pressure sensors are installed on the low-pressure line (suction line before the compressor) and the high-pressure line (discharge line after the compressor). The pressure measurement results were used to determine the refrigerant operating conditions and calculate important thermodynamic parameters, such as superheat and subcooling. The integration of temperature and pressure data enables more effective control of the heat pump system. In addition, a power meter is installed in the compressor supply circuit, enabling the determination of the system COP from the measured cooling and heating capacities and power consumption.

3.2. Test Conditions

System performance is evaluated under controlled, representative cabin conditions. The test factors comprise the dry and wet bulb temperatures, conditioned airflow rates of 150 and 200 CMH, and compressor speeds ranging from 2000 to 6000 rpm, as summarized in Table 4. The car seat heat pump system is installed beneath the vehicle seat, and both of its heat exchangers draw recirculated cabin air.
These conditions were selected to represent realistic hot and cold cabin scenarios, to provide two reference points per mode for sensitivity assessment, and to maintain the system within a stable operating envelope. The conditioned airflow serves as a practical operating range (low–high). Under these conditions, the influence on the COP (used as the primary indicator of energy efficiency) and the conditioned air temperature (an indicator of thermal comfort) is analyzed.

3.3. Data Reduction

The cooling capacity, calculated on the air side, is expressed as follows:
Q c = m ˙ a i r i a i r , i n i a i r , o u t .
The enthalpy difference between the inlet and outlet air across the evaporator is used in computing the cooling capacity of the system. The enthalpy of the inlet air ( i a i r , i n ) and outlet air ( i a i r , o u t ) are determined from the dry and wet bulb temperatures at the inlet and outlet of the air stream.
The heating capacity was also calculated on the air side by considering the air mass flow rate, the specific heat of air, and the difference in the dry bulb temperatures between the outlet and inlet of the heat exchanger. The heating capacity is expressed as follows:
Q h = m ˙ a i r c p a i r T a i r , o u t T a i r , i n .
The COP is used to evaluate the efficiency of the heat pump system in both cooling and heating modes. In the cooling mode, the cooling COP (COPc) is defined as the ratio of the cooling capacity ( Q c ) to compressor power consumption ( W c o m p c ), which can be expressed as follows:
C O P c = Q c W c o m p c .
In the heating mode, the heating COP (COPh) is calculated as the ratio of the heating capacity ( Q h ) to the compressor power consumption ( W c o m p h ), which can be expressed as follows:
C O P h = Q h W c o m p h .

3.4. Uncertainty Analysis

The uncertainty of the derived parameters is estimated using the method of error propagation for multivariable functions [28]. The uncertainty analysis can be expressed as follows:
Y Y   =   ( x i x i Y x i x i ) 2  
The performance of the air conditioner is quantified by measuring the dry/wet temperatures on the inlet/outlet air sides at multiple locations of the setup. Table 5 provides information about the sensors and their measurements.

4. Result and Discussion

4.1. Optimal Refrigerant Charge

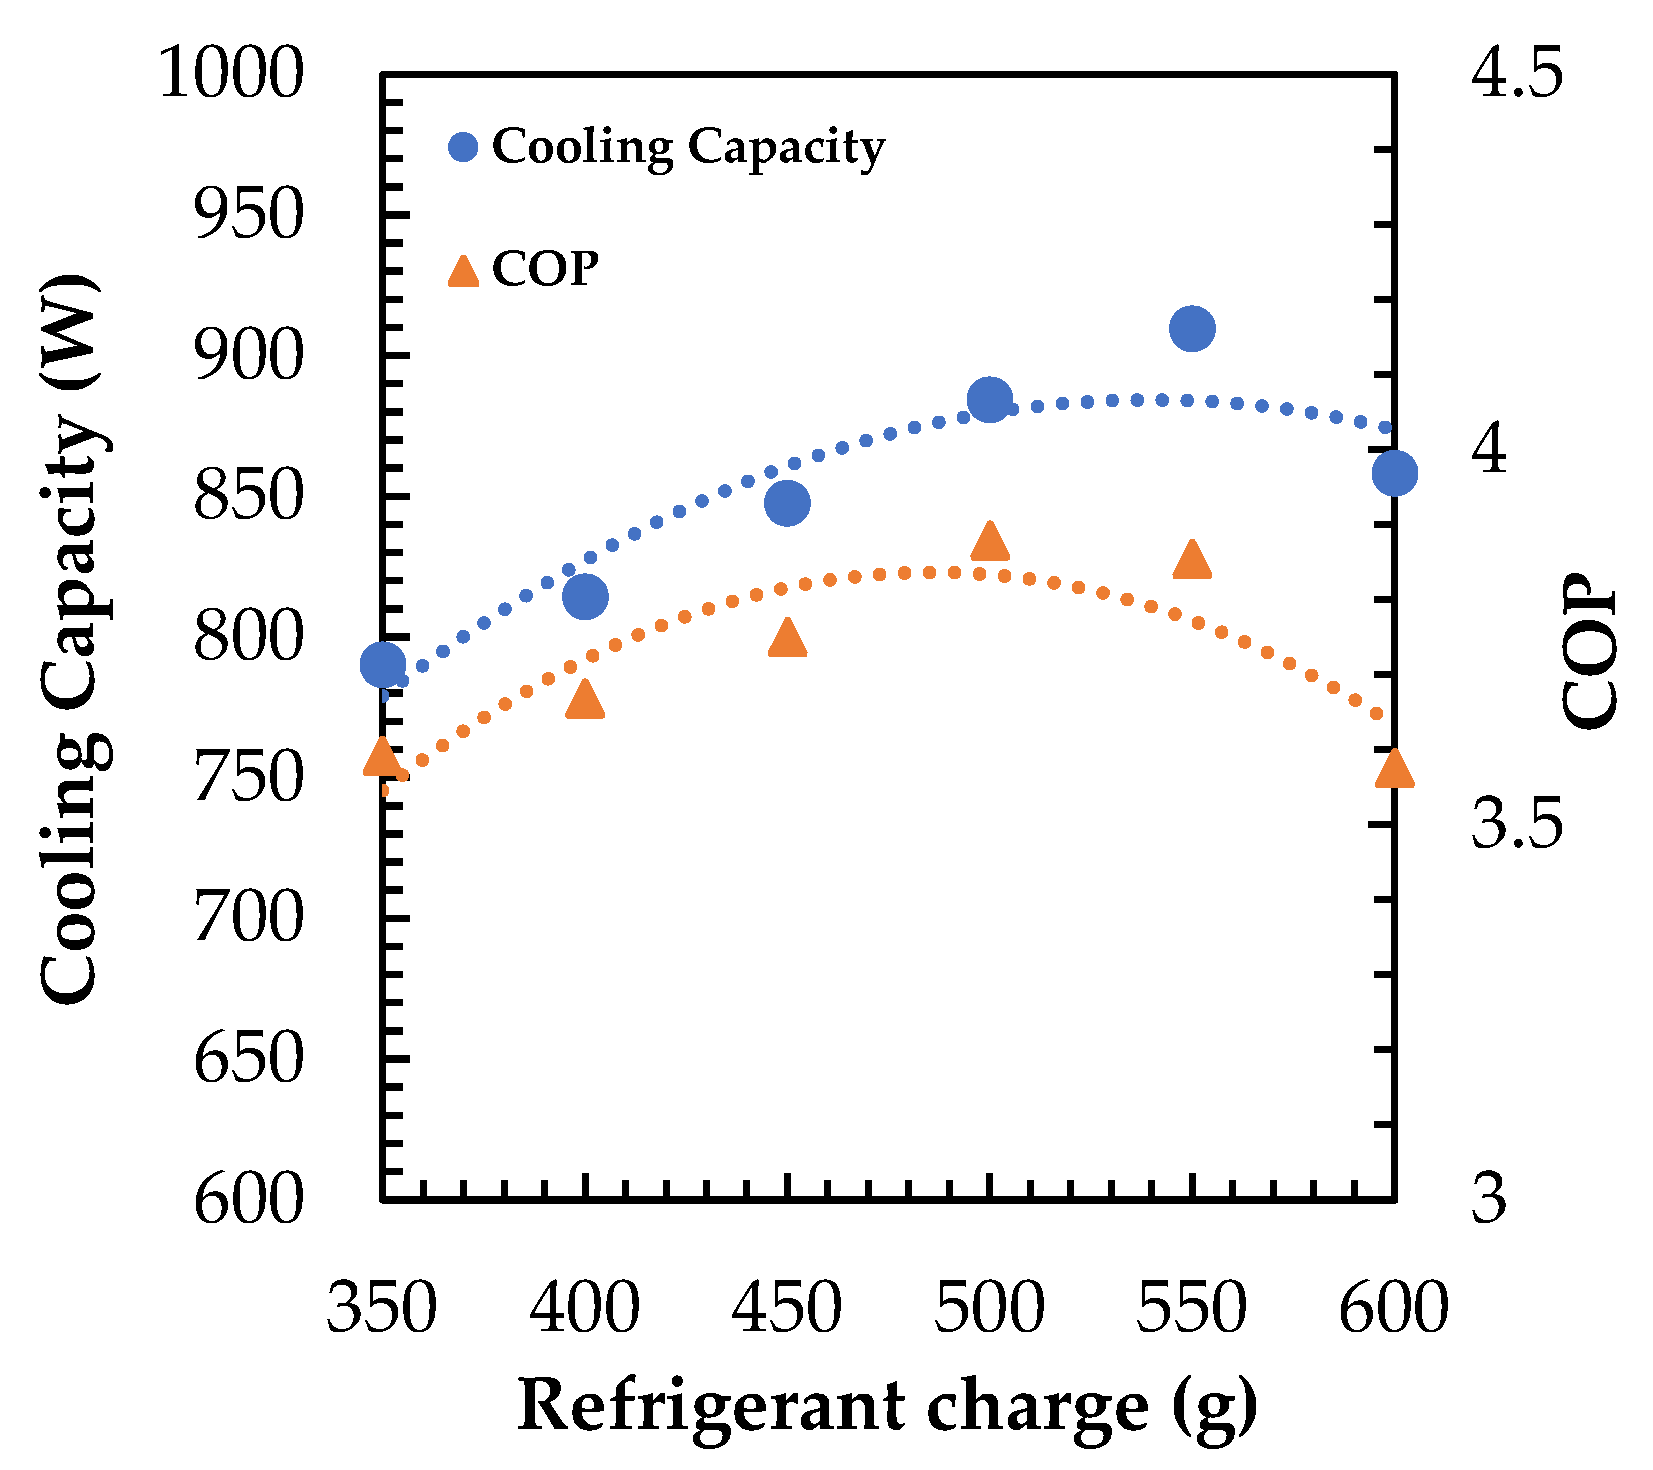
The refrigerant charge directly affects heat pump performance; it is optimized to achieve high cooling capacity and COP, both of which are required for higher system performance.
As shown in Figure 10, a 500 g charge of the R1234yf refrigerant demonstrates the optimal thermal capacity for cooling compared with the other refrigerant charge levels. Based on these findings, a refrigerant charge of 500 g was used in the subsequent experimental evaluations to ensure consistency and reliability in the system performance analysis.

4.2. Cooling Performance

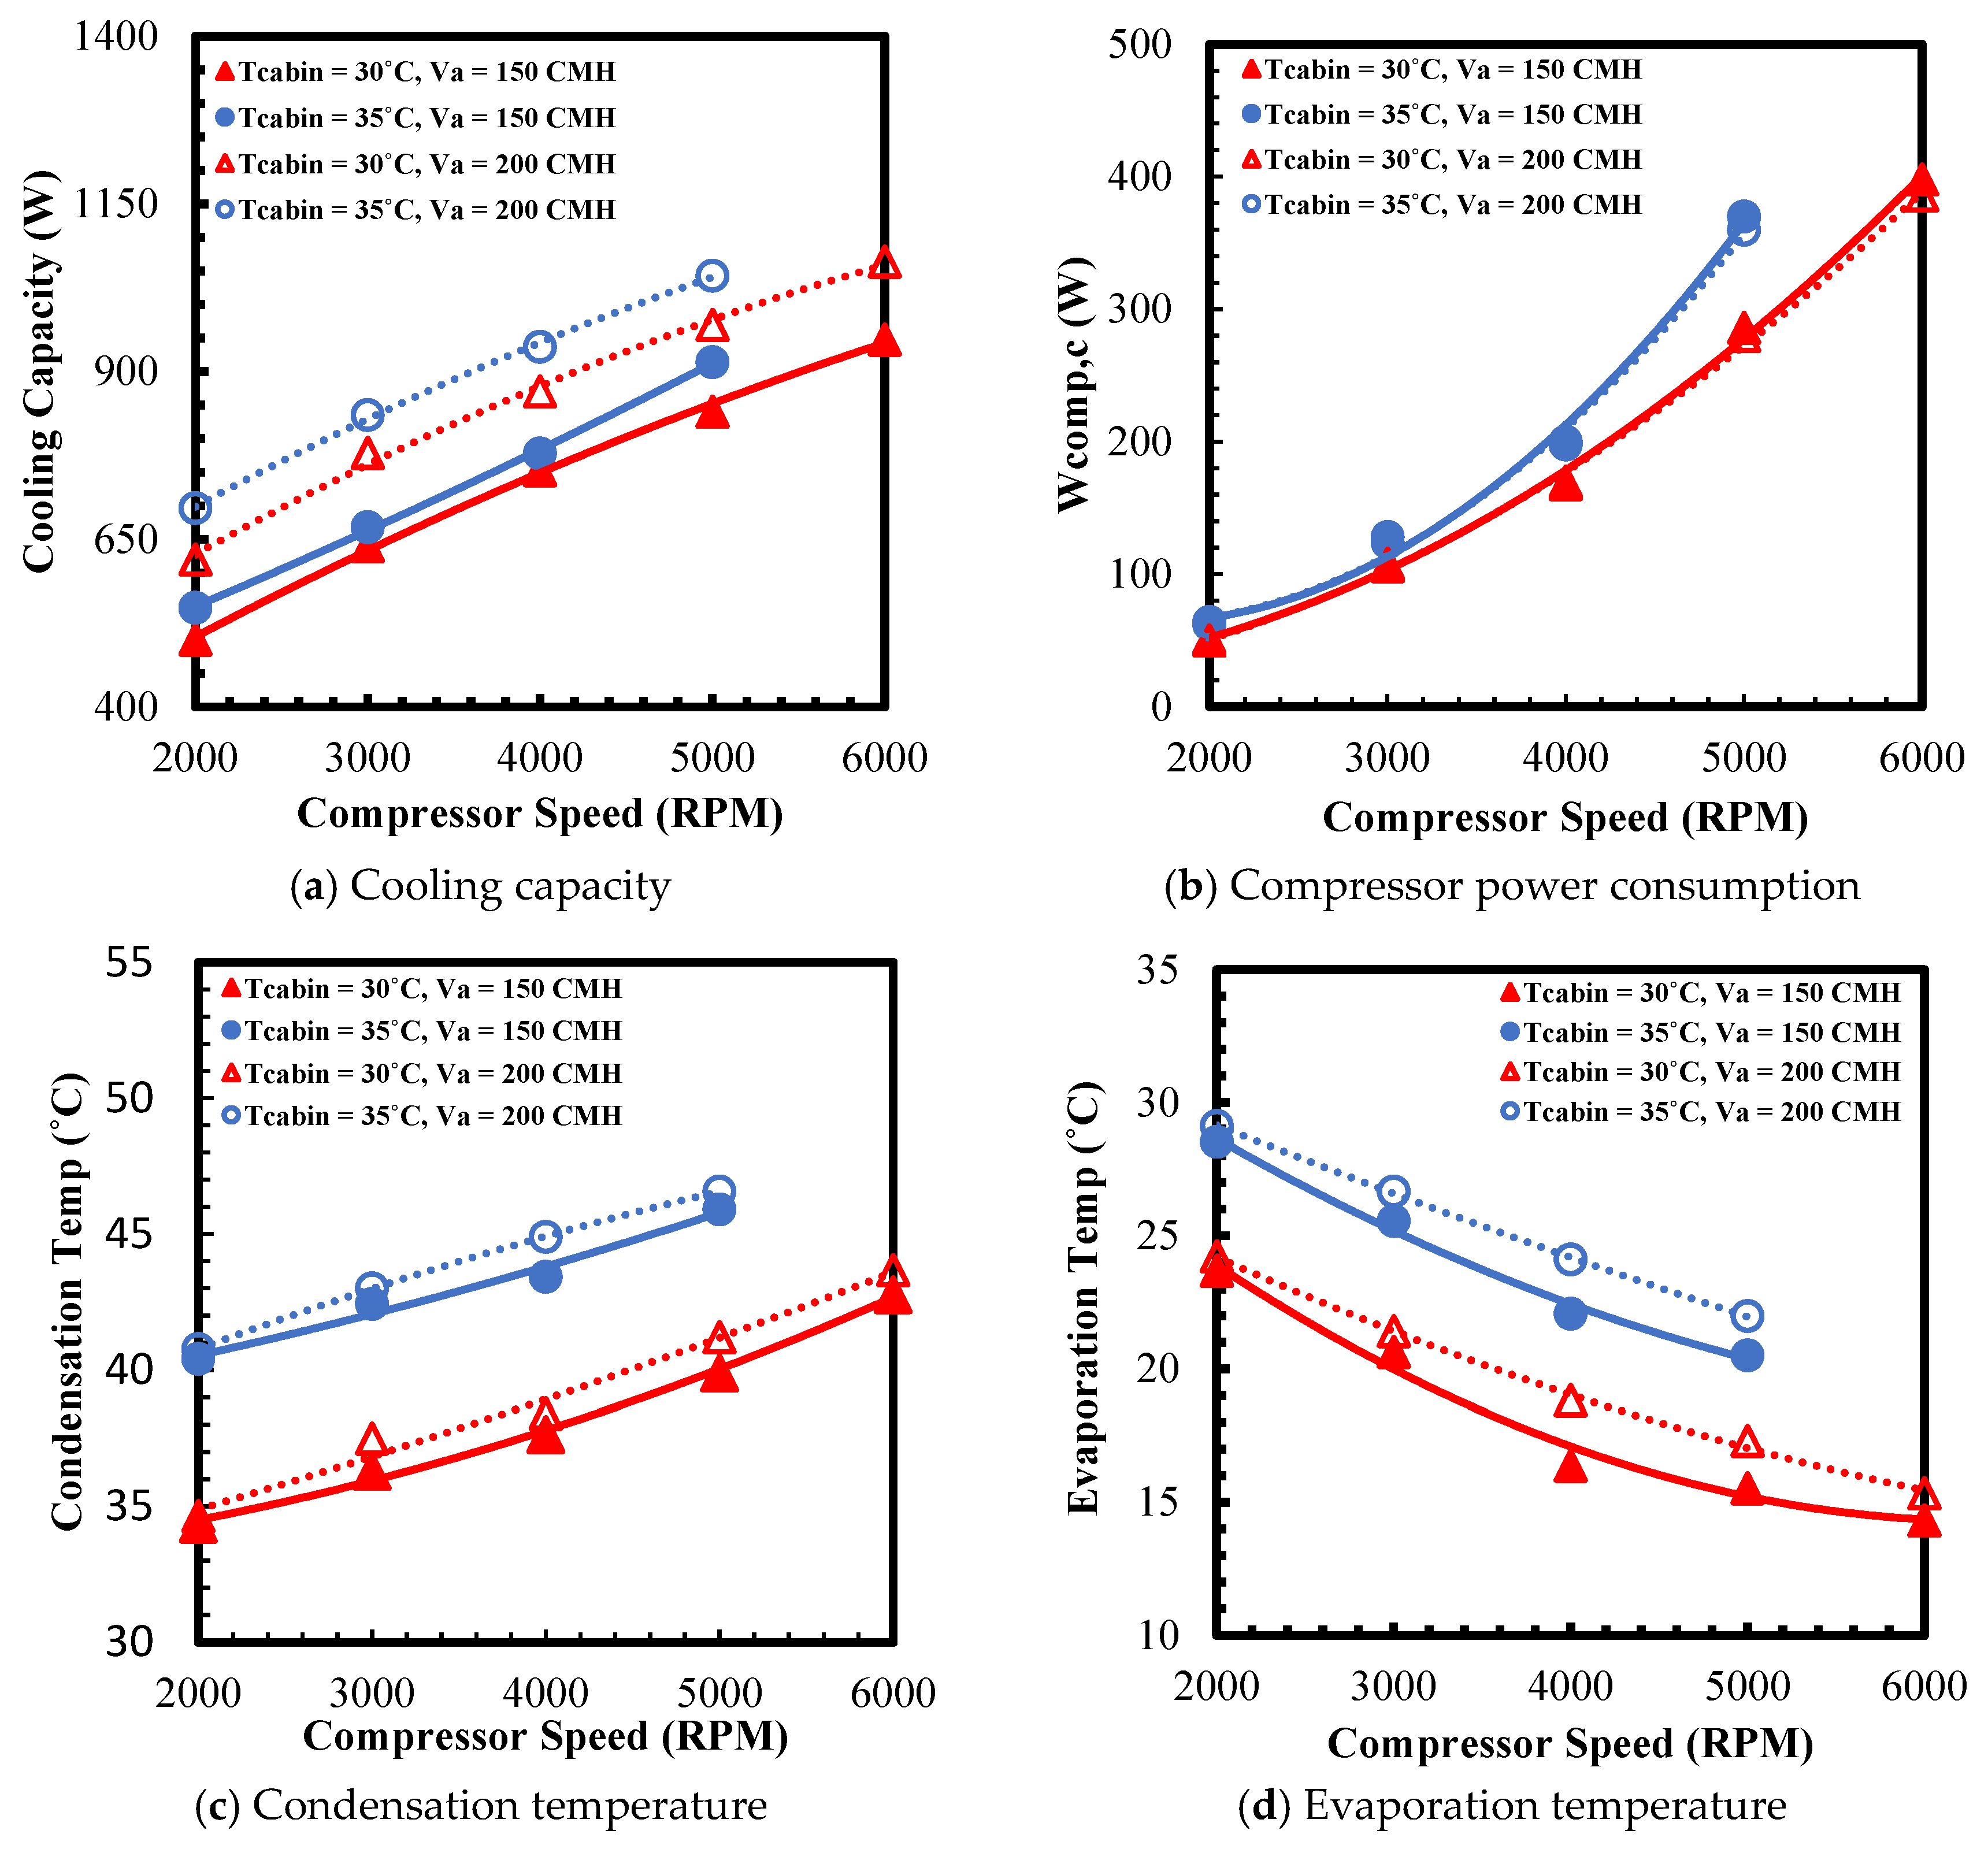
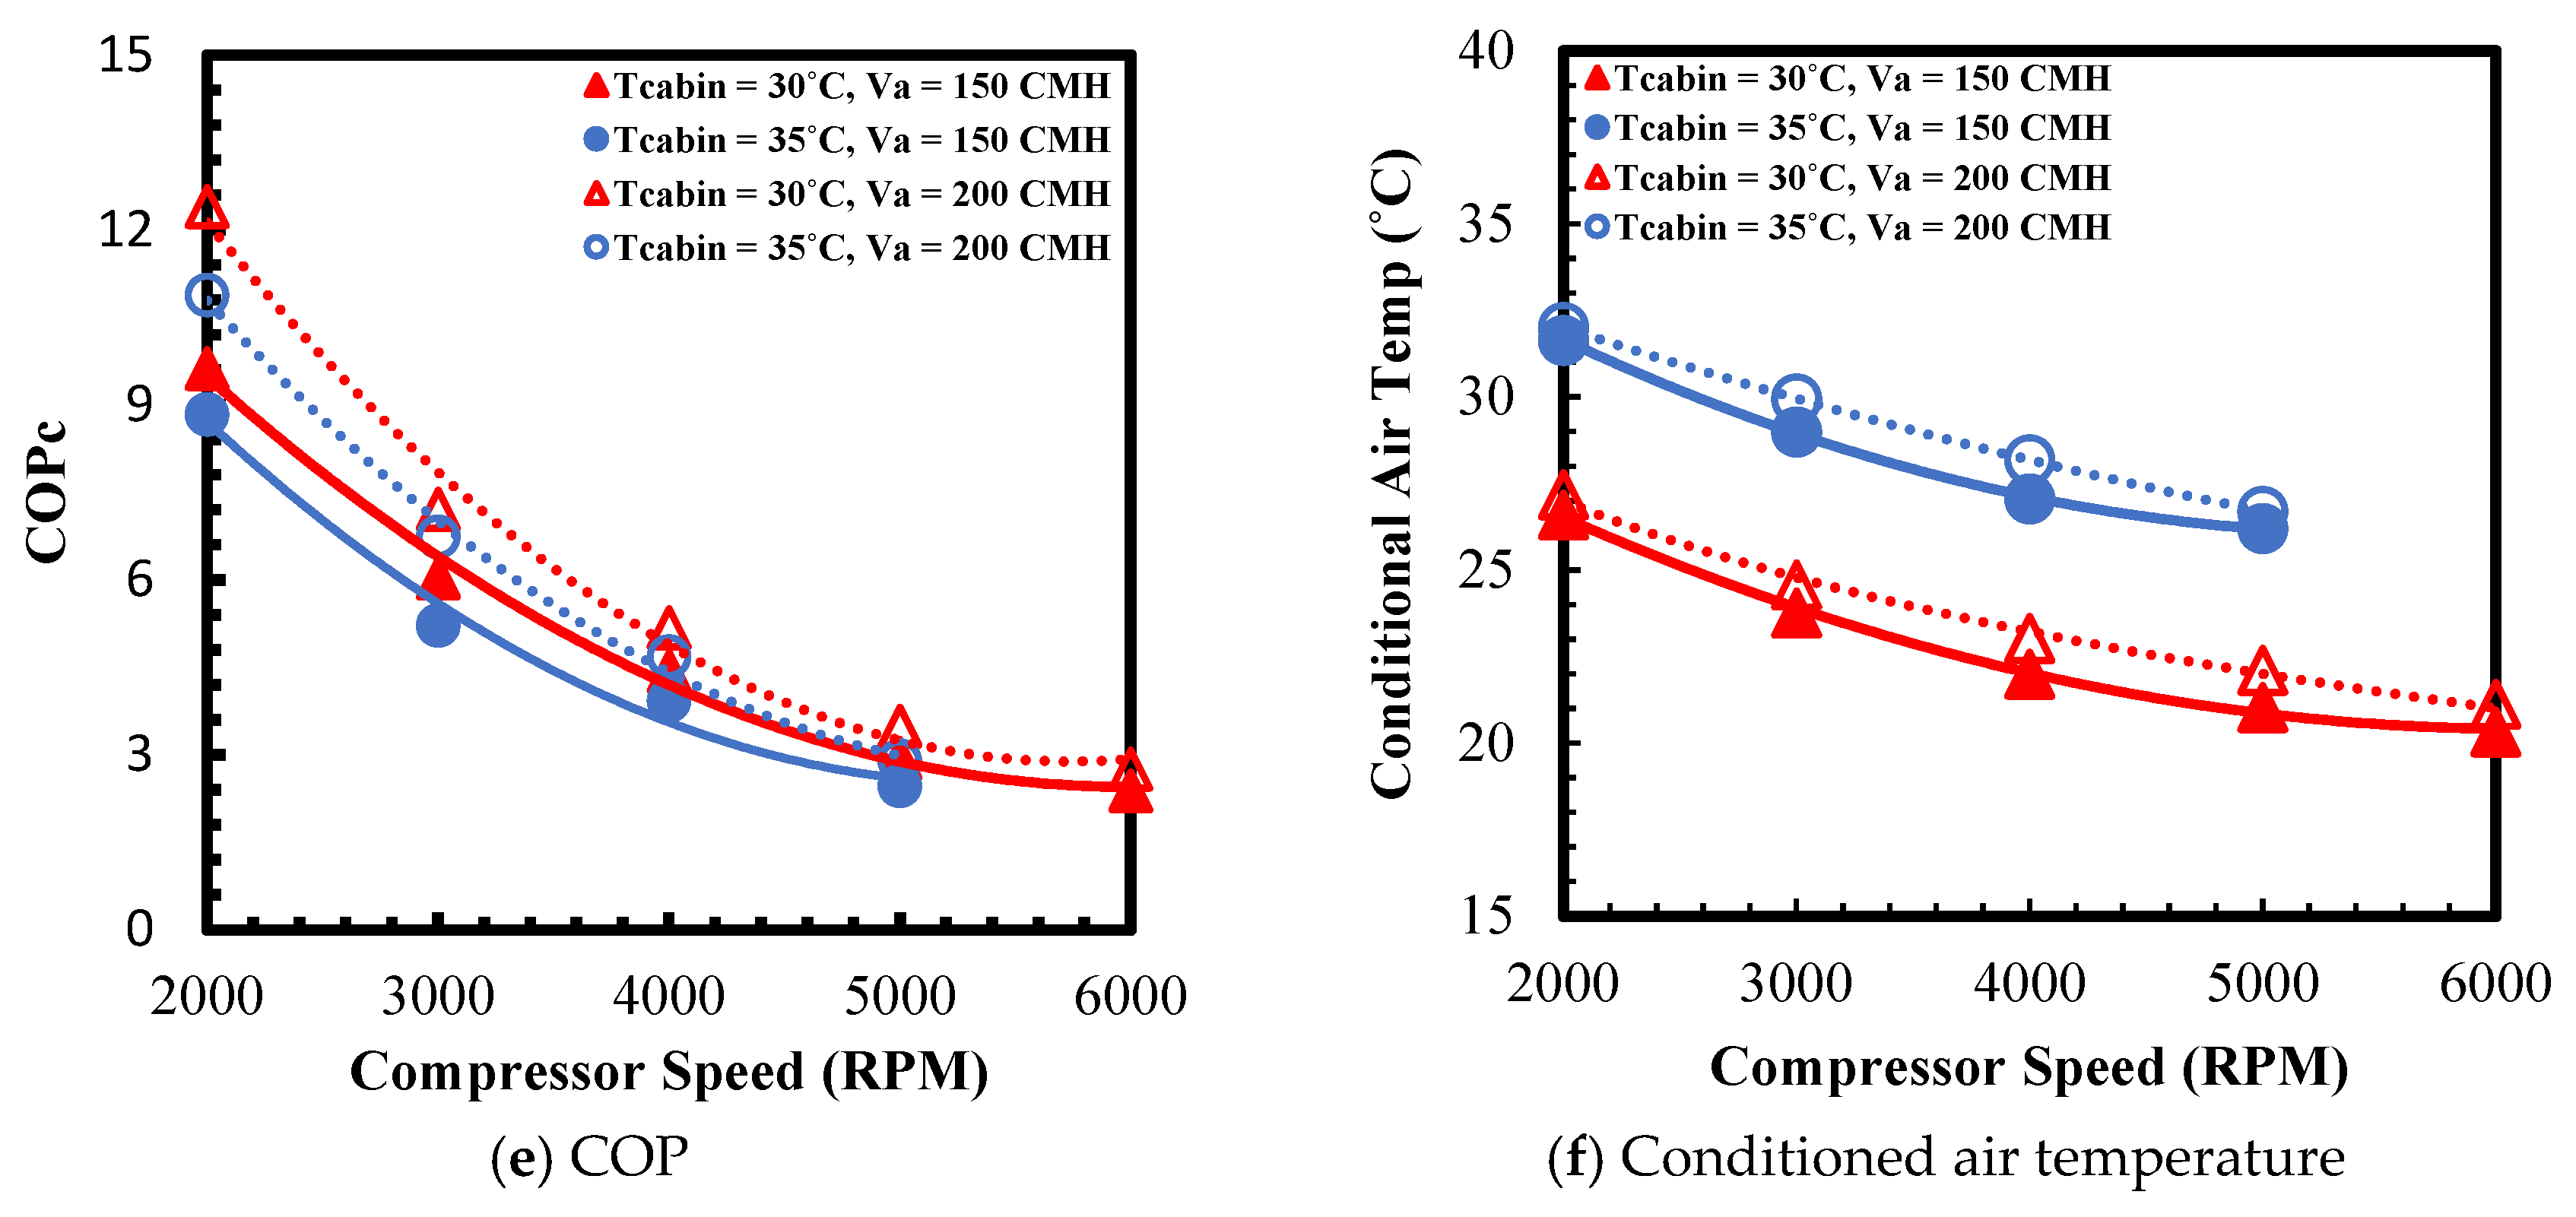
Figure 11 analyzes the cooling–cycle performance of the heat pump system, showing the cooling capacity, compressor power consumption, COP, condensation temperature, evaporation temperature, and conditioned air temperature as functions of the compressor speed. Two primary parameters were examined: the cabin air temperature representing the thermal conditions inside the cabin, and the conditioned airflow rate to seat (CMH), which governs the thermal comfort of passengers. The combination of operating conditions provides a comprehensive map of system behavior across a practical operating range. The highest compressor speed of 6000 rpm at a cabin temperature of 35 °C could not be tested. As the unit approached the compressor safety limit, further increases in the speed were halted to protect the compressor.
The electrical power consumption of the compressor increases from 52 W at 2000 rpm to 398 W at 6000 rpm, with an average increase of approximately 86.5 W per 1000 rpm. The compressor consumption is calculated as the refrigerant mass flow rate multiplied by the specific compression work, with adjustment for the isentropic efficiency of the compression process and the electromechanical efficiency of the motor and inverter. At higher speeds, three effects occur simultaneously: the mass flow rate increases, the pressure ratio between suction (evaporation) and discharge (condensation) increases, thereby increasing the specific compression work, and the compressor efficiencies tend to decrease due to leakage and other losses. Collectively, these factors cause the power consumption to increase at a higher rate than the capacity.
The condensation temperature increases from 34.4 °C to 42.8 °C under the nominal condition, with an average increase of approximately 2.1 °C per 1000 rpm. The condenser must reject a larger heat load because the rejected heat equals the sum of the cooling capacity and the compressor power consumption. Under constant inlet air and overall heat transfer capability (UA) conditions, the system increases the driving temperature difference, which manifests as a higher condensation temperature to pass more heat through the same heat exchanger surface. Conversely, the evaporation temperature decreases from 23.7 °C to 14.3 °C, with an average decrease of approximately 2.3 °C per 1000 rpm. Under constant air flow and inlet air conditions, a higher cooling capacity results from a greater temperature driving force in the evaporator, which increases heat transfer rate. The system achieves this by lowering the saturation temperature of the evaporator, thereby increasing the temperature difference with air. The saturation temperature difference between the condenser and evaporator (temperature lift) increases from 10.7 °C at 2000 rpm to 28.5 °C at 6000 rpm. This wider operating temperature span necessitates higher specific compression work, which rapidly increases compressor power consumption.
The  C O P c , defined as the ratio of cooling capacity to compressor electrical power, decreases from 9.6 at 2000 rpm to 2.4 at 6000 rpm. This decline occurs because the compressor power increases rapidly with increasing refrigerant mass flow rate, pressure ratio, and losses, whereas an increase in the capacity is constrained by the shrinking evaporation enthalpy difference despite an increase in the refrigerant mass flow rate. At a compressor speed of 4000 rpm, the system exhibits a cooling capacity of 650–900 W and COPc of 3.5–5.5.
The conditioned air temperature decreases as the compressor speed increases, because a higher cooling capacity enhances heat removal from the cabin air. The air temperature is reduced from 26 °C to 20 °C under the nominal condition by increasing the compressor speed. The conditioned air temperature is a major parameter that determines the comfort of passengers, along with the air flow rate. Finally, the optimum airflow rate and temperature according to the cabin temperature should be evaluated for human comfort.
When the cabin temperature is increased from 30 °C to 35 °C, the capacity at a given speed is consistently higher than that at 30 °C. Averaged over 2000–5000 rpm, the increase in capacity is approximately 43.7 W. Because the cabin air is supplied to both the evaporator and the condenser at the same temperature, the evaporation and condensation temperatures increase with increasing cabin air temperature. As the evaporation temperature increases, the density of the refrigerant at the inlet of the compressor increases, thereby increasing the cooling capacity as the mass flow rate of the refrigerant increases.
The compressor power consumption increases when the cabin air temperature increases from 30 °C to 35 °C. At 35 °C, the power consumption increases from 52 W at 2000 rpm to 398 W at 5000 rpm. This rate of increase becomes steeper at higher compressor speeds. When the cabin air temperature increases to 35 °C, the condensation and evaporation temperatures are approximately 5 to 6 K higher than those at 30 °C, respectively. A higher refrigerant mass flow rate at higher evaporation temperatures and an increased pressure ratio resulting from a higher condensation temperature increases the specific compression work and magnifies the losses. Consequently, power consumption increases faster than the cooling capacity.
The COPc at 35 °C is lower than that at 30 °C, with a reduction from 0.791 at 2000 rpm to 0.468 at 5000 rpm. When the cabin air temperature increases from 30 °C to 35 °C, the cooling capacity rises, but a disproportionate increase in power consumption, driven by a higher condensation temperature, pressure ratio, and losses, lowers the capacity-to-power ratio and results in a warmer conditioned air temperature at every compressor speed.
Increasing the airflow from 150 CMH to 200 CMH results in a consistent improvement in system performance. The cooling capacity increases at every speed, whereas the compressor consumption remains the same or slightly decreases. Specifically, the capacity increases from 500.6 W at 2000 rpm to 620.0 W at 6000 rpm, whereas compressor consumption increases from 398 W at 200 rpm to 386 W at 6000 rpm. Consequently, the COPc increases from 2.94 to 3.49 at 6000 rpm.
Table 6 compares the performances of the thermoelectric systems reported in References with the heat pump system developed in this study under comparable inlet air temperatures (≈30 °C). Elarusi et al. reported a thermoelectric system operating at air flow rate of 10.2 CMH, cooling capacity of 18.6 W, COP of 0.45, and air outlet temperature of 16.2 °C. Su et al. optimized design at air flow rate of 26.4 CMH, cooling capacity of 43~55 W, COP range of 0.53~1.2, and outlet-air temperature of 25.4~27.7 °C. In the present study, the seat-integrated heat pump was tested with higher air flow rate of 200 CMH, delivering 800~900 W of cooling capacity, with COP in the range of 4~5.5 and outlet air temperature of 21~24 °C. Thus, for similar air conditions, the developed system exhibits a substantially higher COP and cooling capacity while maintaining outlet air temperatures with sufficient air flow rate for thermal comfort.

4.3. Heating Performance

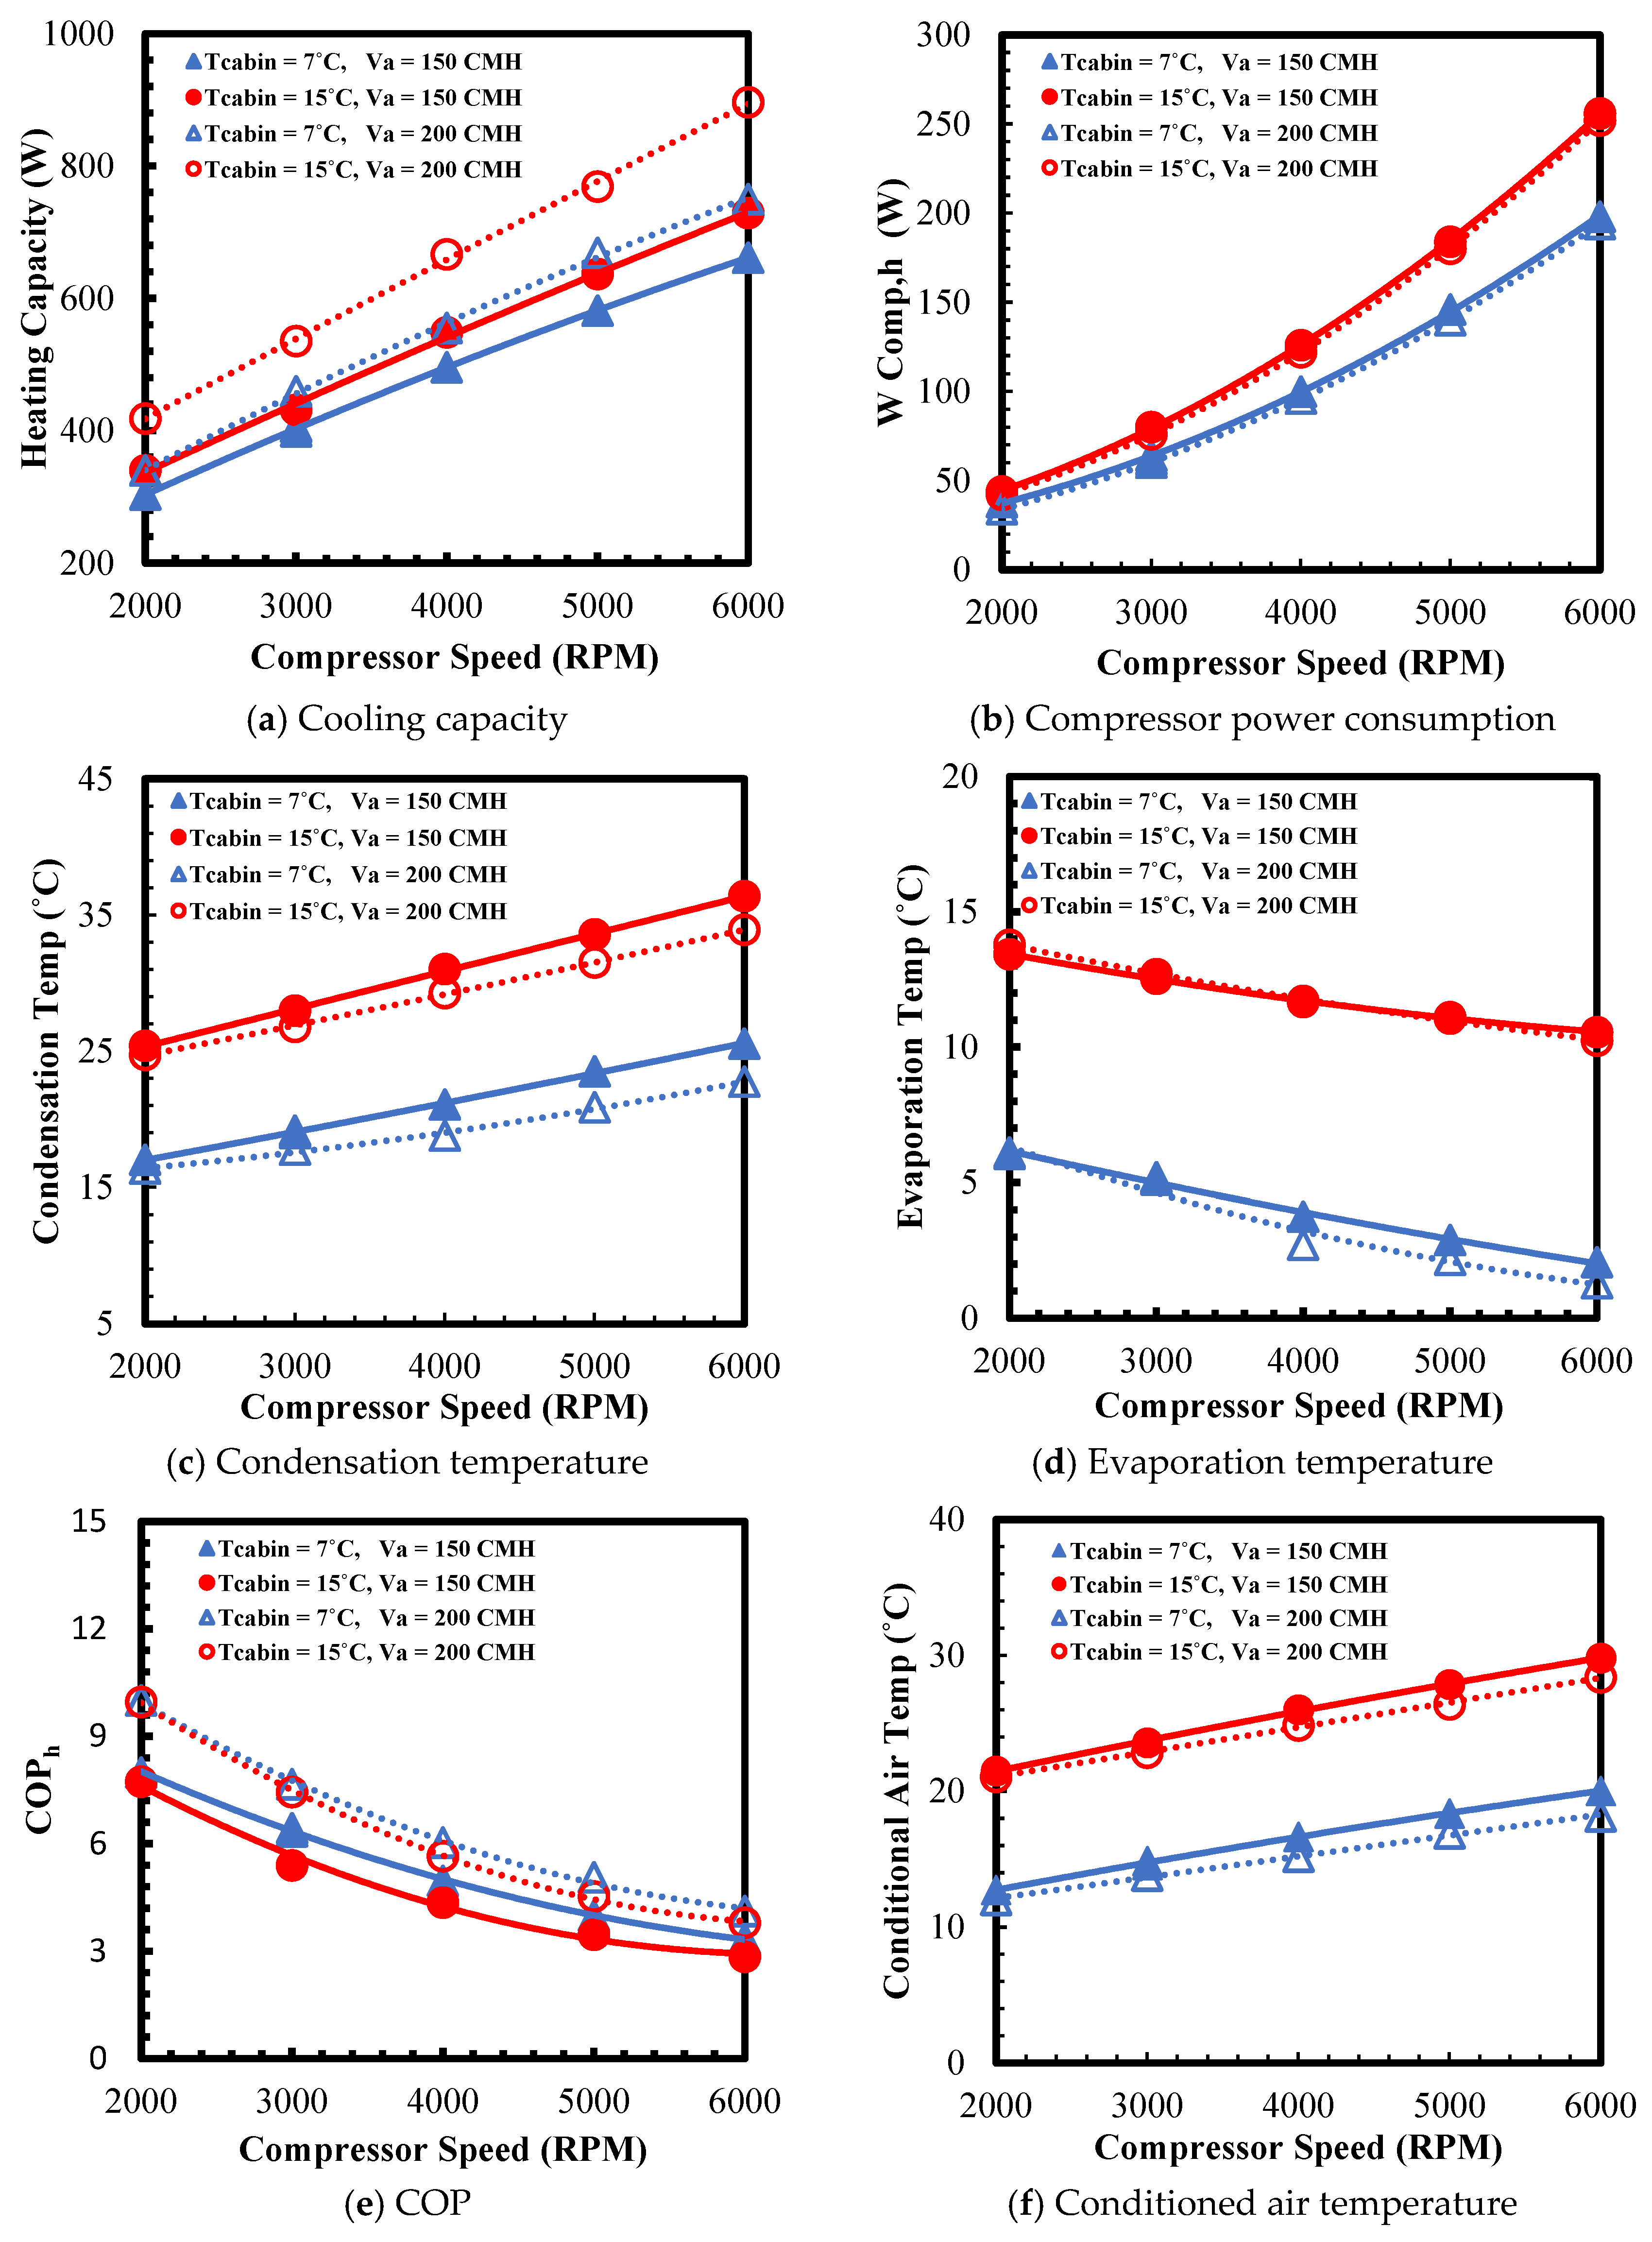
Figure 12 analyzes the car seat heat pump system was further examined in heating mode by varying the inlet air temperature at 7 °C and 15 °C while adjusting the airflow rates to 150 and 200 CMH. The experiments were conducted across the compressor speed range of 2000–6000 rpm.
Under the selected nominal heating conditions of a cabin air temperature of 15 °C and an airflow rate of 150 CMH, increasing the compressor speed from 2000 to 6000 rpm increases the heating capacity from 340.4 to 728.9 W. The average gain was approximately 97 W per 1000 rpm, but the growth tapered at the highest speed. This indicates that the added heat released per unit refrigerant mass could not keep pace with the increase in the refrigerant mass flow rate due to the increase in the condensation temperature. The heating capacity is the sum of the energy supplied to the compressor and the heat absorbed from the evaporator. A condenser operating at a higher saturation temperature level discharges more heat to the cabin, whereas a slightly lower evaporation temperature level preserves the driving temperature difference on the source side. The net results demonstrate that capacity growth is dominated by mass flowrate increases, with a relatively smaller contribution from enthalpy change per kilogram at higher speeds.
Under the same heating conditions, the compressor electrical power consumption increases from 44 W at 2000 rpm to 256 W at 6000 rpm, which is an average increase of approximately 53 W per 1000 rpm. The trend reflects a combination of higher mass flowrate and a larger pressure ratio, which is consistent with the widened temperature span, with compressor losses increasing at higher speeds. The impact on efficiency is clear: the COPh decreases from 7.74 at 2000 rpm to 2.85 at 6000 rpm because the power increases more rapidly than the capacity, reducing the capacity-to-power ratio. At a compressor speed of 4000 rpm, the heating capacity is 400–600 W, the COPh is 4.5–8.
As the compressor speed increases, the condensation temperature moves upward from 25.4 °C to 36.8 °C, whereas the evaporation temperature shifts slightly downward from 13.4 °C to 10.6 °C under the nominal heating conditions, thereby widening the operating span. The conditioned air temperature downstream of the hot coil follows the trend of the heating capacity and increases with speed from 21.5 °C at 2000 rpm to 29.8 °C at 6000 rpm.
Lowering the cabin air temperature from 15 °C to 7 °C at 150 CMH reduces the capacity from 728.9 to 661.4 W at 6000 rpm. The reduction in the heating capacity relies on a decrease in the refrigerant mass flow rate because the evaporation temperature decreases from 10.6 °C to 2.7 °C at 6000 rpm. The condensation temperature decreases from 36.4 °C to 25.5 °C at 6000 rpm; thus, the operating span narrows slightly. The compressor power decreases at all speeds from 256 to 198 W at 6000 rpm. With a narrower span and lower compression work, the COPh increases from 2.85 to 3.34 at 6000 rpm, demonstrating that the reduction in the compression burden outweighs the capacity loss.
Increasing the airflow rate from 150 to 200 CMH at 15 °C increases the capacity from 728.9 to 896.2 W at 6000 rpm. This is accompanied by a slight decrease in the condensation temperature (approximately 1–3 °C) and a minimal change in the evaporation temperature, thereby modestly narrowing the span. The compressor power remains the same or decreases slightly from 256 W to 252 W at 6000 rpm. Because the capacity increases while the power remains constant, the COPh increases from 2.85 to 3.80 at 6000 rpm and from 7.74 to 9.97 at 2000 rpm.

5. Conclusions

This study presents the design, development, and experimental evaluation of a car seat heat pump system as an efficient, localized thermal management solution for EVs. The system employs the R1234yf refrigerant and comprises five primary components, namely, a compressor, condenser, evaporator, and an electronic expansion device, along with a four-way reversing valve. The compact unit is mounted beneath the seat (145 mm in height, 330 mm in width, 484 mm in length, and a mass of 20 kg) and satisfies the SgRP/H30 standard for under-seat installation, making it suitable for integration within modern automotive seat architectures. The compressor was developed with a horizontal twin-rotary configuration for compact heat pump system, which has superior efficiency than existing similar ASPEN compressor.
Performance testing of our car seat heat pump system was performed in an environmental chamber under representative operating conditions. The airflow rates of 150 and 200 CMH and the cabin temperatures of 30 °C and 35 °C (cooling) and 7 °C and 15 °C (heating) were evaluated, with the compressor speeds varied from 2000 to 6000 rpm. This test matrix enabled a comprehensive performance map under hot and cold cabin conditions.
During cooling operation under nominal conditions at 4000 rpm, the system delivered a capacity of 650–900 W and a COPc of 3.5–5.5. Overall, these findings demonstrate high efficiency and strong, passenger-targeted cooling performance with meaningful implications for vehicle-level energy savings.
In heating mode under nominal conditions at 4000 rpm, the seat-integrated heat pump exhibits a heating capacity of 400–600 W and a COPh of approximately 4.5–8. Collectively, these outcomes indicate that the passenger-focused heating function achieves effective thermal conditioning while offering substantial energy-saving potential.
Future work should include subjective human comfort and thermal-perception assessments at various airflow set points and outlet temperatures for different metabolic rates and clothing levels, along with spatial mapping of temperature non-uniformity across the back and thigh regions using established standards. In addition, the vehicle HVAC should be integrated with a control strategy that adjusts the airflow based on the cabin temperature. This coordinated approach enables load sharing, improving energy efficiency and passenger comfort as required by users.

Author Contributions

A.H.M.: Writing of original draft, and Data Analysis; F.: Performance test and Data process; F.Z.A.H.: Development of electrical compressor speed and Heat exchanger; H.K.: Development of electrical compressor speed and Heat exchanger; S.H.P.: Development of electrical compressor speed and Heat exchanger; Y.S.C.: Supervision and Funding acquisition. All authors have read and agreed to the published version of the manuscript.

Funding

This research was funded by the Ministry of Trade, Industry & Energy (MOTIE, Korea). This work was supported by the Technology Innovation Program (or Industrial Strategic Technology Development Program-Development of Automotive Industry Technology) (20018706, Development of 500-W indoor-mounted low-noise compact heat pump system technology for improving xEV local air conditioning performance and efficiency).

Data Availability Statement

The data presented in this study are available on request from the corresponding author due to privacy reasons.

Conflicts of Interest

F.Z.A.H., H.K. and S.H.P. were employed by Hylium Industries, Inc. The remaining authors declare that the research was conducted in the absence of any commercial or financial relationships that could be construed as a potential conflict of interest.

Abbreviations

The following abbreviations are used in this manuscript:
COPCoefficient of Performance
CMHCubic Meter per Hour
HVACHeating, Ventilation, and Air Conditioning
EVElectric Vehicle
MCHXMicrochannel Heat Exchanger
RTDResistance Temperature Detector
RPMRevolutions Per Minute
SgRPSeating Reference Point
H30Hip Point (SAE H-point)
R1234yf2,3,3,3-Tetrafluoropropene (refrigerant)
DBTDry Bulb Temperature
WBTWet Bulb Temperature
QcCooling Capacity
QhHeating Capacity
m ˙ a i r Mass Air Flow Rate
i a i r , i n Enthalpy Air Inlet
i a i r , o u t Enthalpy Air Outlet
c p a i r Specific Heat at Constant Pressure
T a i r , i n Temperature Air Inlet
T a i r , o u t Temperature Air Outlet
C O P c Coefficient of Performance of Cooling
C O P h Coefficient of Performance of Heating
WInput Power (compressor)
GHGGreenhouse Gas
CO2Carbon Dioxide
F.SFull Scale
VAVolumetric Air
CMHCubic Meter per Hour
WWatt

References

  1. Dong, J.; Liu, X.; Xu, X.; Zhang, S. Comparative life cycle assessment of hydrogen pathways from fossil sources in China. Int. J. Energy Res. 2016, 40, 2105–2116. [Google Scholar] [CrossRef]
  2. Endiz, M.S. A Comparison of Battery and Hydrogen Fuel Cell Electric Vehicles for Clean Transportation. Orclever Proc. Res. Dev. 2023, 2, 10–17. [Google Scholar] [CrossRef]
  3. Mobasheri, R.; Aitouche, A.; Mumputu, J.B.; Li, X.; Peng, Z. Effect of Intake Charge Temperature on Oxy-Fuel Combustion in an HCCI Diesel Engine Under Different Carbon Dioxide Dilutions. J. Eng. Gas Turbines Power 2023, 145, 011012. [Google Scholar] [CrossRef]
  4. Khan, A.; Khattak, K.S.; Khan, Z.H.; Khan, M.A.; Minallah, N. Cyber physical system for vehicle counting and emission monitoring. Int. J. Adv. Comput. Res. 2020, 10, 181–193. [Google Scholar] [CrossRef]
  5. Yang, C.; Wu, H.; Guo, Y.; Hao, Y.; Wang, Z. Promoting economic and environmental resilience in the post-COVID-19 era through the city and regional on-road fuel sustainability development. NPJ Urban Sustain. 2022, 2, 33. [Google Scholar] [CrossRef]
  6. Lee, S.; Kim, H.S.; Park, J.; Kang, B.M.; Cho, C.-H.; Lim, H.; Won, W. Scenario-based techno-economic analysis of steam methane reforming process for hydrogen production. Appl. Sci. 2021, 11, 6021. [Google Scholar] [CrossRef]
  7. Pyakurel, P.; Quintal, F.; Auger, J.; Hanna, J. Analysis of carbon saving by the adoption of electric vehicles in a region where electricity generation is dominated by thermal power plants. Strateg. Plan. Energy Environ. 2020, 39, 117–130. [Google Scholar] [CrossRef]
  8. Akar, M.; Eker, M.; Akin, F. BLDC Motor Design and Application for Light Electric Vehicle. Afyon Kocatepe Univ. J. Sci. Eng. 2021, 21, 326–336. [Google Scholar] [CrossRef]
  9. Kailashkumar, B.; Elanchezhiyan, M. Powering Ahead: Current Landscape of Electric Vehicles (EV) in India. Int. J. Environ. Clim. Change 2024, 14, 639–647. [Google Scholar] [CrossRef]
  10. Chang, T.B.; Sheu, J.J.; Huang, J.W. High-efficiency hvac system with defog/dehumidification function for electric vehicles. Energies 2021, 14, 46. [Google Scholar] [CrossRef]
  11. Kulkarni, A.; Brandes, G.; Rahman, A.; Paul, S. A Numerical Model to Evaluate the HVAC Power Demand of Electric Vehicles. IEEE Access 2022, 10, 96239–96248. [Google Scholar] [CrossRef]
  12. Lesage, M.; Chalet, D.; Migaud, J.; Krautner, C. Holistic approach to improve cabin air quality in electric vehicles and energy savings. In Proceedings of the 36th International Conference on Efficiency, Cost, Optimization, Simulation and Environmental Impact of Energy Systems, ECOS 2023, Las Palmas de Gran Canaria, Spain, 25–30 June 2023; pp. 2402–2413. [Google Scholar] [CrossRef]
  13. Bayram, H.; Sevilgen, G.; Kılıç, M. Advances on heat pump applications for electric vehicles. Adv. Automot. Eng. 2018, 1, 79–104. [Google Scholar] [CrossRef]
  14. Shin, Y.H.; Ahn, S.K.; Kim, S.C. Performance characteristics of PTC elements for an electric vehicle heating system. Energies 2016, 9, 813. [Google Scholar] [CrossRef]
  15. Cho, C.; Kim, G.; Pyo, Y.L.W. The Development of an Energy-Efficient Heating System for Electric Vehicles; IEEE: Busan, Republic of Korea, 2016. [Google Scholar]
  16. Habash, R.; Ilis, G.G.; Ünal, Ş.; Saha, B.B. Enhancing COP of electric vehicle cooling systems using adsorption heat pumps. Therm. Sci. Eng. Prog. 2025, 64, 103788. [Google Scholar] [CrossRef]
  17. Wong, H.; Ramadhan, H.; Milhim, A.B.; Sadjadi, H. Using Charge Determination Design of Experiments to Develop Refrigerant-based Heat Pump System Charge Models. Annu. Conf. PHM Soc. 2023, 15, 1–6. [Google Scholar] [CrossRef]
  18. Qi, Z. Advances on air conditioning and heat pump system in electric vehicles—A review. Renew. Sustain. Energy Rev. 2014, 38, 754–764. [Google Scholar] [CrossRef]
  19. Sukarno, R.; Maldini, A.A.; Musyaffa, R.; Yoga, N.G.; Syaka, D.R.B. Preliminary study of the thermoelectric cooler and heat pipe application for the cooling system in cabin pickup car. J. Phys. Conf. Ser. 2024, 2866, 12090. [Google Scholar] [CrossRef]
  20. Zhang, T.; Ren, J.; Zhang, H. Simulation Analysis of Seat Ventilation Performance Considering Deformation during Human Occupancy. SAE Int. J. Passeng. Veh. Syst. 2025, 18, 119–132. [Google Scholar] [CrossRef]
  21. Kawaguchi, K.; Kase, D. Temperature Reduction in a Car Cabin under Summer Solar Radiation (Temperature Reduction around Driver’s Seat by Examination of Blowing Direction). Jpn. J. Inst. Ind. Appl. Eng. 2020, 8, 214–221. [Google Scholar] [CrossRef]
  22. Bayram, H.; Sevilgen, G.; İbiş, A. Otomobillerde Yenilikçi Hava Kanallı Koltuk Tasarımının Deneysel ve Sayısal Olarak İncelenmesi. Gazi Üniv. Bilim. Derg. Part C Tasarım Teknol. 2022, 10, 63–76. [Google Scholar] [CrossRef]
  23. SAE J1 100; Motor Vehicle Dimensions. SAE International: Warrendale, PA, USA, 1984.
  24. Compressor Aspen. June 2023. Available online: https://www.aspencompressor.com/copy-of-horizontal-compressors (accessed on 2 October 2025).
  25. Kim, H.; Al Hakiem, F.Z.; Park, S.H. Development of Low Noise and High Efficiency Small Refrigerant Compressor Technology for Indoor Mounted Local Air-Conditioning and Optimization of Small Heat Pump System. 2025 Summer Academic Conference. Available online: http://conf2025s.sarek.or.kr/ (accessed on 23 October 2025).
  26. Center for Environmental Energy Engineering (CEEE); CoilDesigner|Center for Environmental Energy Engineering; Center for Environmental Energy Engineering, University of Maryland. Available online: https://ceee.umd.edu/software/coildesigner (accessed on 20 November 2025).
  27. Jiang, H.; Aute, V.; Radermacher, R. CoilDesigner: A general-purpose simulation and design tool for air-to-refrigerant heat exchangers. Int. J. Refrig. 2006, 29, 601–610. [Google Scholar] [CrossRef]
  28. Moffat, R.J. Describing the Uncertainties in Experimental Results. Exp. Therm. Fluid Sci. 1988, 1, 3–17. [Google Scholar] [CrossRef]
  29. Elarusi, A.; Attar, A.; Lee, H. Optimal Design of a Thermoelectric Cooling/Heating System for Car Seat Climate Control (CSCC). J. Electron. Mater. 2017, 46, 1984–1995. [Google Scholar] [CrossRef]
  30. Su, C.; Dong, W.; Deng, Y.; Wang, Y.; Liu, X. Numerical and Experimental Investigation on the Performance of a Thermoelectric Cooling Automotive Seat. J. Electron. Mater. 2018, 47, 3218–3229. [Google Scholar] [CrossRef]
Figure 1. Integration of heat pump system into car seat.
Energies 18 06197 g001
Figure 2. Photos of seat-integrated heat pump.
Energies 18 06197 g002
Figure 3. Car seat of heat pump system.
Energies 18 06197 g003
Figure 4. Twin rotary compressor.
Energies 18 06197 g004
Figure 5. Compressor efficiencies according to compressor speed and pressure ratio [25].
Energies 18 06197 g005
Figure 6. Selected system configurations for heat exchanger design.
Energies 18 06197 g006
Figure 7. Performance according to heat exchangers models.
Energies 18 06197 g007
Figure 8. MCHXs.
Figure 8. MCHXs.
Energies 18 06197 g008
Figure 9. Test setup of car seat heat pump.
Energies 18 06197 g009
Figure 10. System performance variations according to refrigerant charge under cooling operation.
Energies 18 06197 g010
Figure 11. Performance variation according to compressor speed under cooling operation.
Energies 18 06197 g011aEnergies 18 06197 g011b
Figure 12. Performance variation according to compressor speed under heating operation.
Energies 18 06197 g012
Table 1. Compressor safety limit.
Safety LimitValues
Max condensing temp. range (°C)71
Max discharge temp. range (°C)100
Max ambient temp. range (°C)49
Max dome temp. (°C)100
Max operation pressure (MPa)2.4
Table 2. Technical specification of compressor.
NameAspen [24]This Study [25]
TypeHorizontalHorizontal
Width (mm)122.1120.1
Height (mm)79.580.1
Length (mm)316.4295.3
Displacement (cc/rev)5.65.7
Max. Speed (rpm)65006000
RefrigerantR1234yfR1234yf
Weight (kg)2.42.4
Rated Power440 W440 W
Operating Voltage (V)4848
Table 3. Design specifications of microchannel evaporator and condenser.
NameEvaporatorCondenser
Heat ExchangerWidth (mm)60 53
Height (mm)150 130
Length (mm)205280
Number of rows32
TubeLength (mm)118230
Width (mm)1620
Thickness (mm)1.31.4
Spacing (mm)9.39.4
Number/row1222
Positionverticalhorizontal
Pass distribution10/10/10/10/10/106/6/6/6
FinTypeLouverLouver
Width (mm)1618
Height (mm)8.18.1
Pitch (mm)1.31
Table 4. Experiment conditions.
ParametersCoolingHeating
Inlet air temperature (Tdry (°C)/Twet (°C))30/22, 35/2615/11, 7/6
Conditioned air flow rate (CMH)150, 200150, 200
Compressor rotational speed (RPM)2000~60002000~6000
Table 5. Measurement uncertainty.
ParameterMeasurementUncertainty
Dry bulb RTD Air dry temperature ±0.25 °C of calibration
Wet bulb RTD Air wet temperature ±0.25 °C of calibration
Pressure transducer Pressure in refrigerant pipes±0.25% of F.S
Nozzle differential pressure Pressure drop at nozzle±0.25% of F.S
Power meterCompressor power consumption±0.3% of F.S
  m ˙ a i r Result of measurement10.17%
  Q c Result of measurement12.50–14.00%
  Q h Result of measurement10.47–10.50%
  W c o m p , c Result of measurement1.28–8.12%
  W c o m p , h Result of measurement0.84–4.72%
  C O P c Result of measurement14.06–14.90%
  C O P h Result of measurement10.53–11.48%
Table 6. The performance comparison with TE system.
ParameterElarusi et al. [29]Su et al. [30]This Study
Temperature [°C]27.33030
Air flow rate [CMH]10.2 26.4 200
Input Power [W]4036~104400
Cooling capacity [W]18.643–55800~900
COP0.450.53–1.24~5.5
Conditioned air temperature [°C]16.225.4–27.721~24
Disclaimer/Publisher’s Note: The statements, opinions and data contained in all publications are solely those of the individual author(s) and contributor(s) and not of MDPI and/or the editor(s). MDPI and/or the editor(s) disclaim responsibility for any injury to people or property resulting from any ideas, methods, instructions or products referred to in the content.