1. Introduction
One of the most critical challenges in vehicle design is the suppression of noise and vibration sources. With ongoing electrification and the continuous advancement of vehicle systems, numerous new challenges have emerged [
1]. More powerful drive systems, distributed across multiple axles or even individual wheels, together with the replacement of manual operations by automated maneuvers—such as seat and headrest adjustments—have significantly increased the number of electric machines used in modern vehicles. Even traditional components, previously driven by belt mechanisms, are now increasingly powered by electric actuators.
The implementation of electric machines necessitates dedicated control units, which, in turn, generate additional noise and vibrations due to Pulse Width Modulation (PWM) effects [
2]. According to the Environmental Noise Guidelines for the European Union [
3], noise is a major environmental factor affecting public health, and its impact is expected to continue increasing.
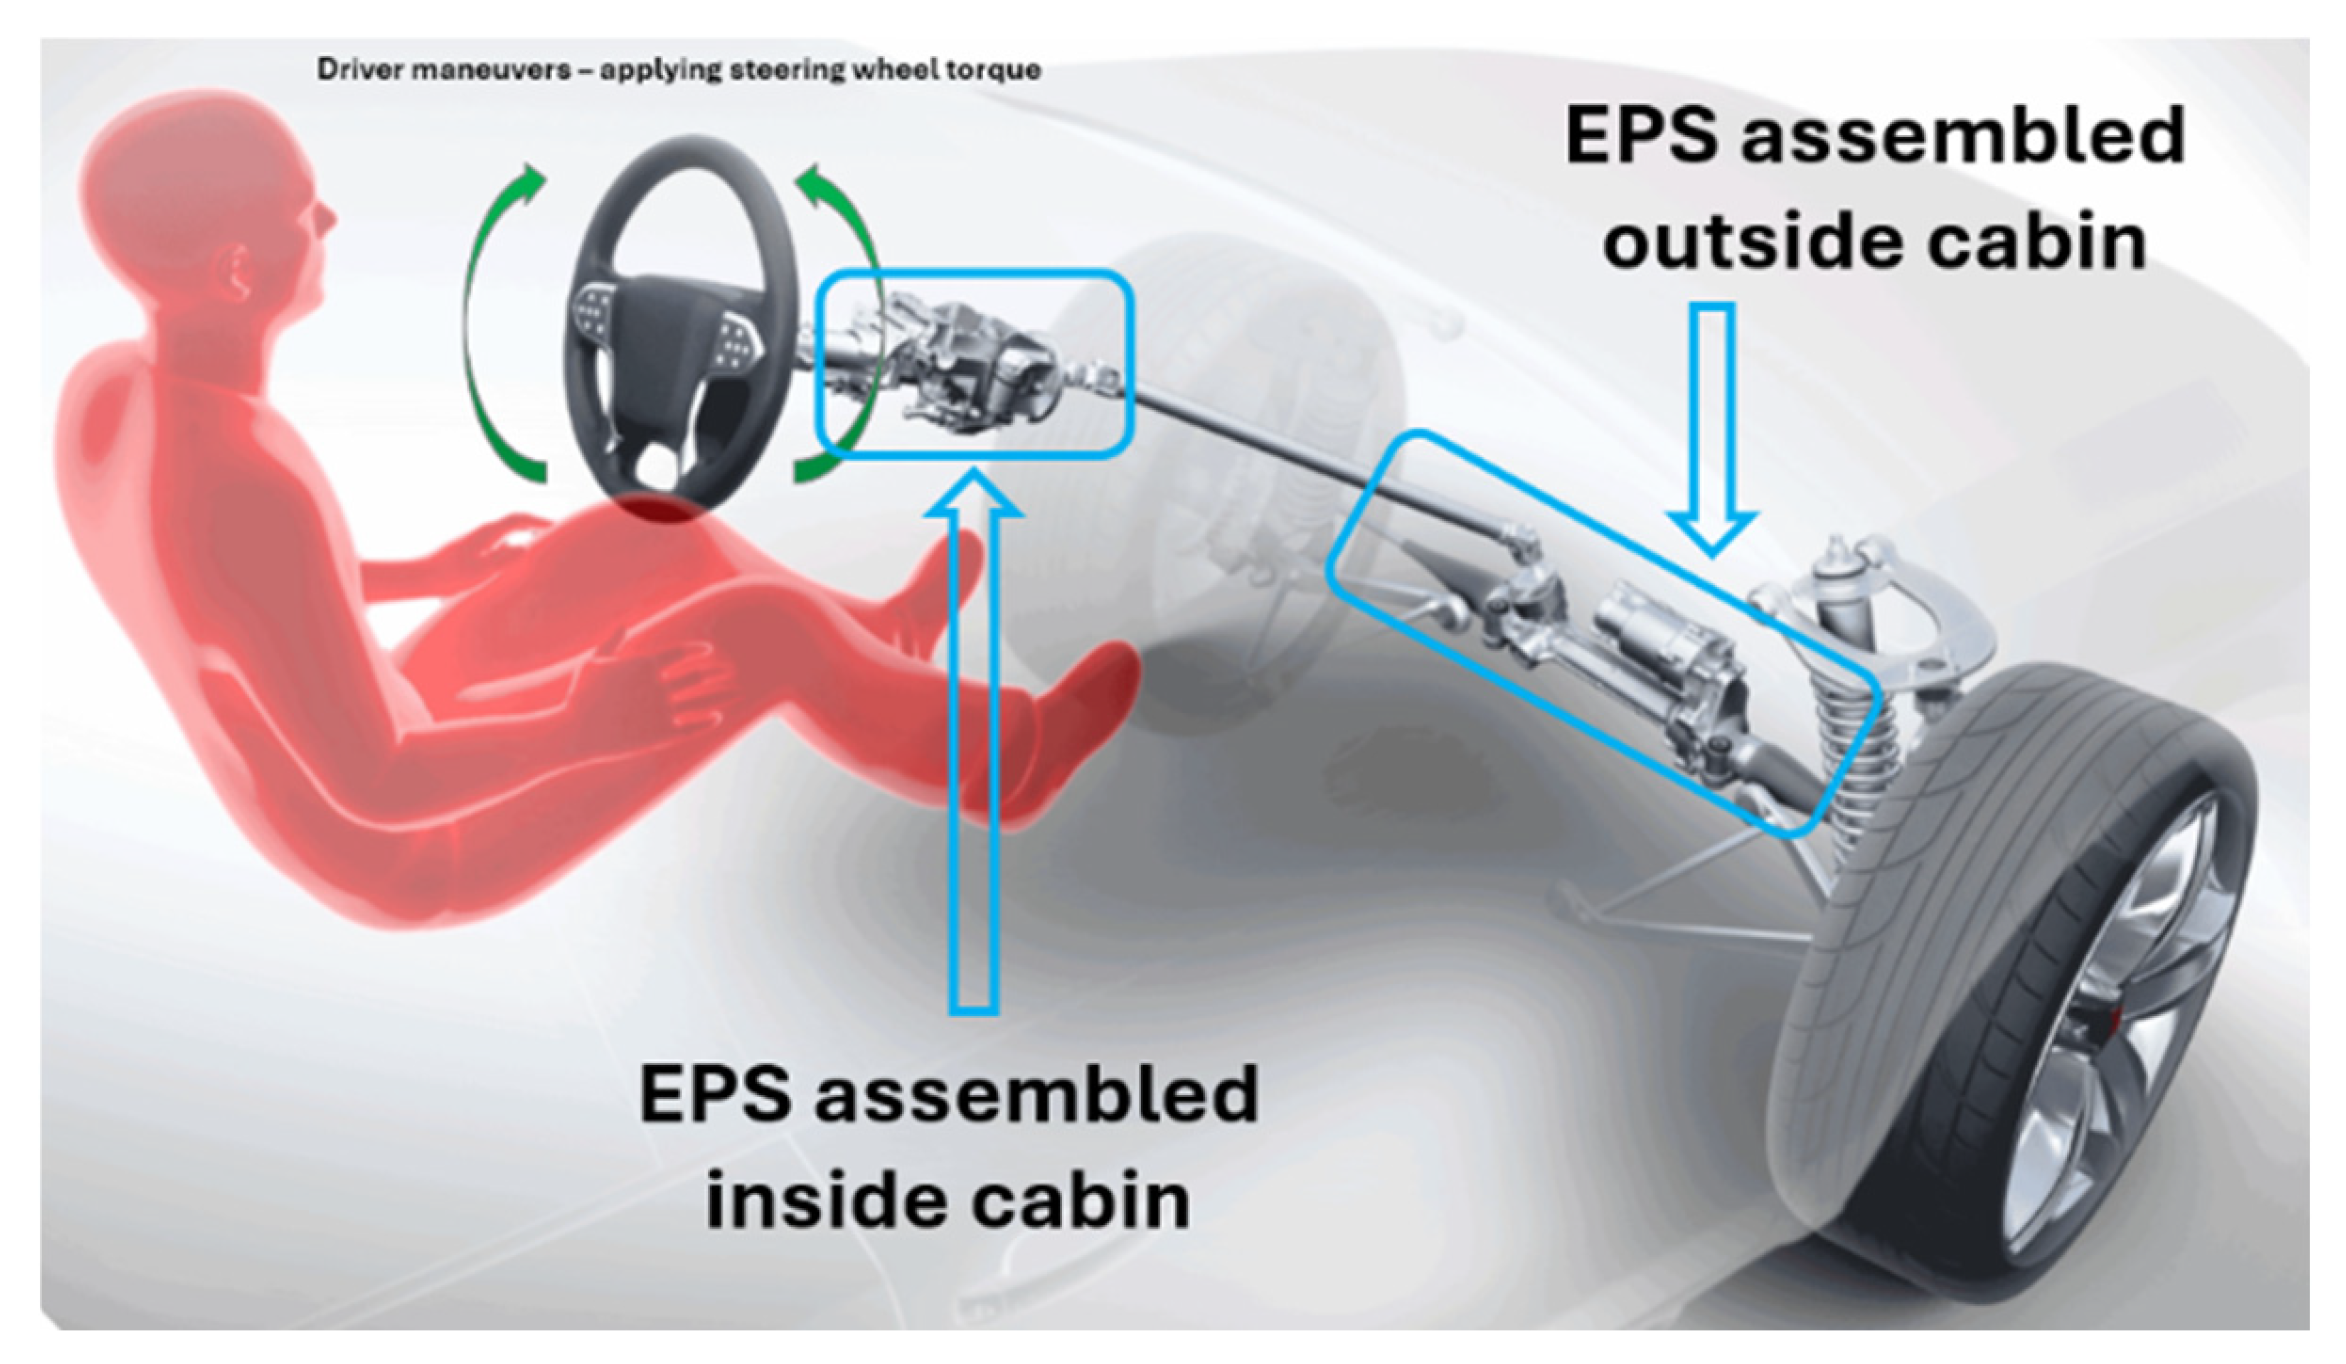
Given these developments, noise suppression in vehicles has become both a necessity and a major engineering challenge. This study focuses specifically on noise generated by the electric motor used in EPS systems, whose primary function is to assist the driver during steering maneuvers in passenger and light commercial vehicles. From the NVH perspective, EPS systems can be classified into two main configurations: those integrated within the passenger cabin and those installed outside it (
Figure 1).
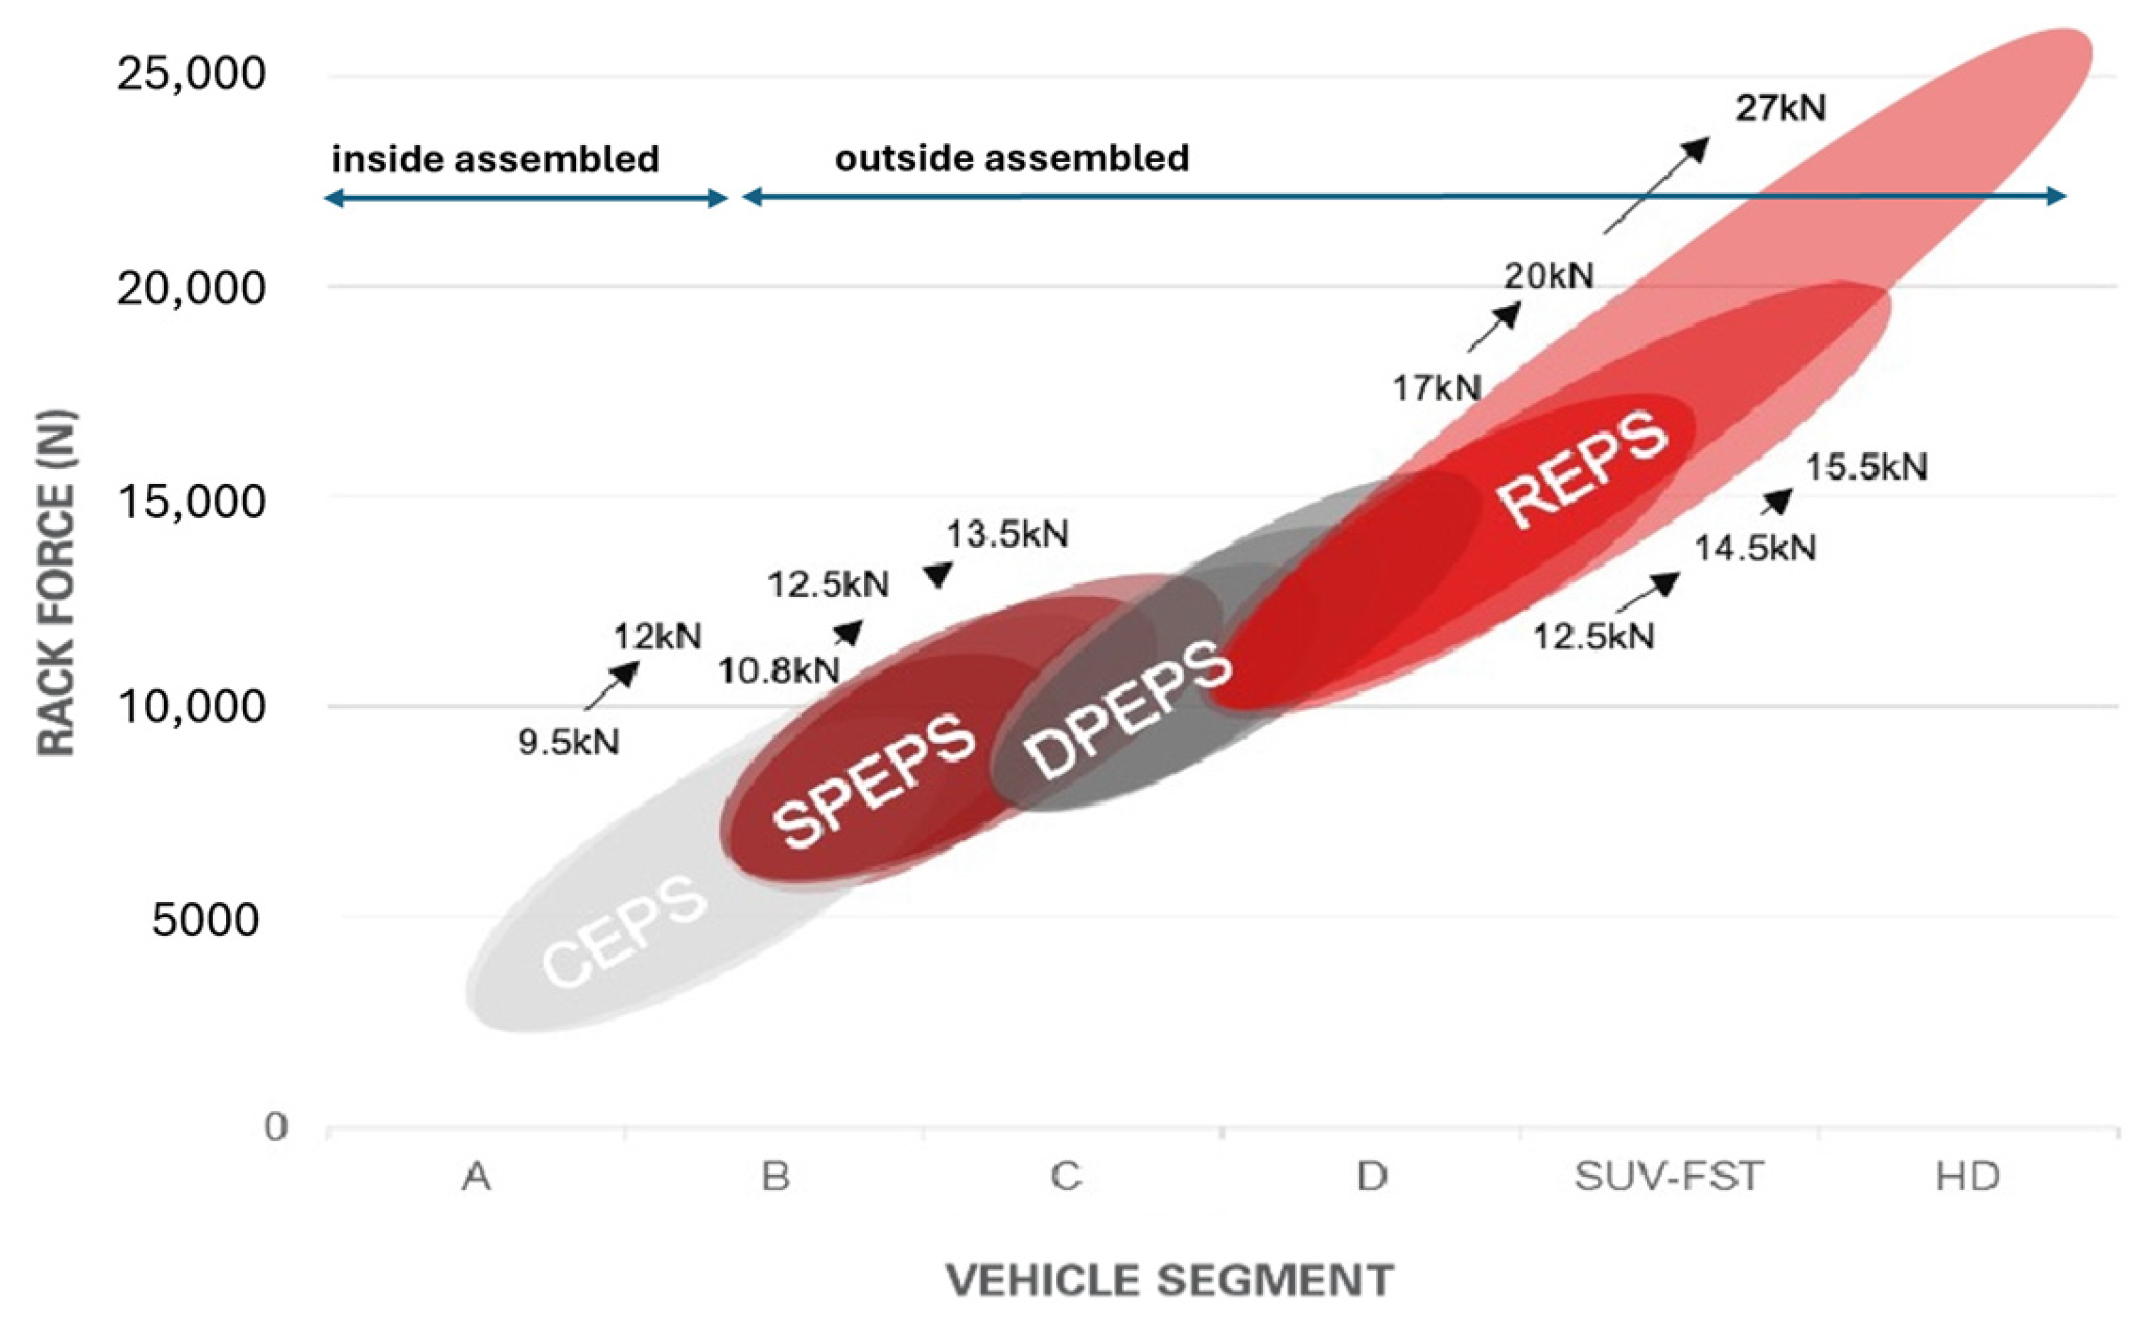
Between the outside assembly cabin and the driver, there is a cockpit along with interior components that act as a cover, significantly reducing the amount of sound that enters the cabin. Moreover, the distance between the sound source and the occupants further attenuates the acoustic waves reaching the driver’s and passengers’ ears. However, systems assembled outside the cabin are generally designed to meet higher performance requirements compared to those installed inside, due to differences between vehicle segments, as shown in
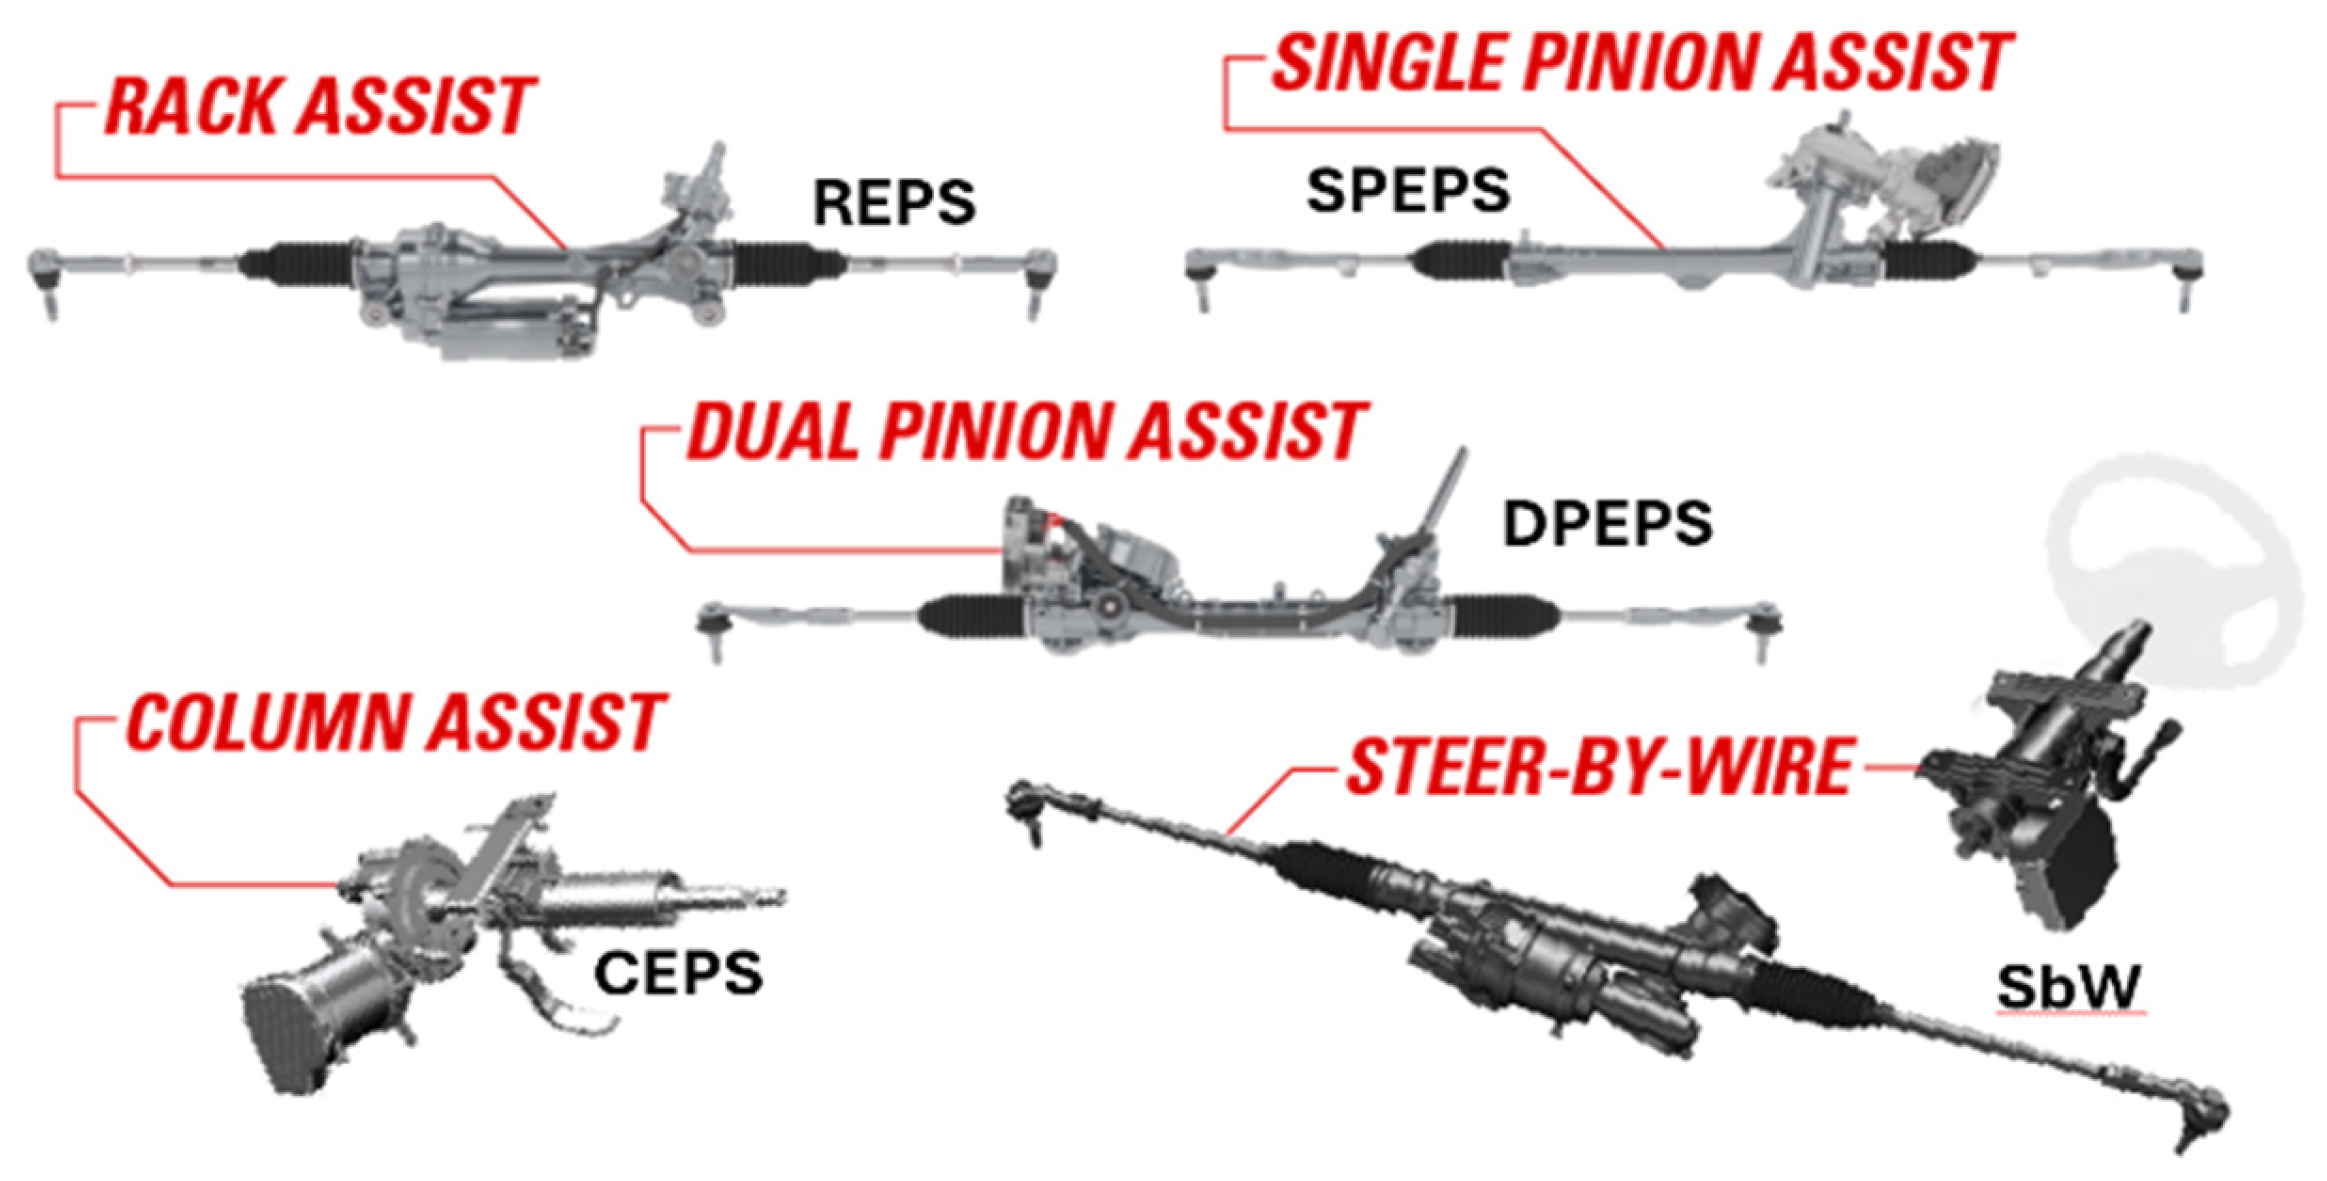
Figure 2. Additionally, the general representation of the EPS abbreviations is presented in
Figure 3. Nevertheless, in terms of rotational acoustics—that is, noise related to steering wheel maneuvers—systems assembled inside the cabin are typically more challenging to manage acoustically. In
Figure 2, the only system assembled inside is the Column Electric Power Steering (CEPS). It also has a variant, Brush Electric Power Steering (BEPS), which is largely derived from CEPS but uses a brush motor as its drive system instead of a permanent magnet machine. The main advantage of BEPS is its low cost, while its disadvantage lies in the increased acoustic emissions caused by the commutation process of the brush motor. Therefore, this type of system is mainly applied in emerging markets at early development stages, particularly in certain countries in Asia and South America.
Fundamental knowledge and the classification of modern steering systems are discussed by Harrer and Pfeffer in their classic position [
4]. Systems assembled outside the cabin are more susceptible to rattle noise, primarily due to the use of at least two gears—typically a worm gear and a pinion gear. The relationship between tribology and noise generation is elaborated by Menday [
5]. Regarding rattle noise specifically, Wrobel et al. [
6,
7] described methods for both numerical and experimental investigations, as well as provided an updated classification of modern EPS systems. The complexity of rattle noise and its relationship to the worm gear life cycle are discussed by Głąb and Franiasz [
8].
When considering the rotational noise of the CEPS system, several primary sources can be identified in addition to the motor’s intrinsic magnetic noise [
9]. The sound generated by the worm gear and its engagement is particularly significant, as any deviations introduced during the manufacturing process become evident in the resulting noise. Moreover, the electric motor shaft is connected to the worm via a coupling, which requires a proper level of alignment. If this condition is not met, higher harmonics of the fundamental frequencies may occur, leading to additional challenges in noise suppression.
The airborne magnetic noise originates from the deformation of the stator’s oval structure and represents a direct response to excitation by the electromagnetic forces generated during motor operation [
10]. The interaction between the magnetic field of the permanent magnets mounted on the rotor surface and the magnetomotive force induced in the stator windings produces forces acting upon the inner surface of the stator stack [
11,
12,
13]. This phenomenon can be simulated and is being studied by researchers [
14,
15], with some using genetic algorithms [
16,
17]. This interaction ultimately generates vibro-acoustic effects within the entire stator housing of the electric motor [
18]. The effects of manufacturing tolerances on the cogging torque characteristics of electric power steering permanent magnet synchronous motors were systematically investigated [
19,
20].
Before the complete CEPS system is released for production, it is essential to select an appropriate configuration to mitigate potential challenges throughout the project’s lifetime. Regarding noise, the frequency range of magnetic forces must be carefully analyzed to ensure that the rotational speed of the steering wheel maneuvers—expressed in rotations per second (RPS) and transmitted to the rotor shaft through the worm gear—does not coincide with any of the stator’s natural frequencies. In the worst-case scenario, such resonance conditions would result in a persistent occurrence of magnetic noise, audible within the vehicle interior. The most significant orders to consider during the development phase pertain to the number of magnetic poles, pole pairs, stator slots, and the resultant main magnetic order, as described in subsequent sections. These are principal design challenges, largely dictated by the machine’s size and power range. A notable advantage of this low-power electric machine is that it does not require a fan directly attached to the rotor shaft, unlike synchronous machines such as automotive alternators that convert mechanical to electrical energy. Therefore, airflow harmonics—which can be difficult to suppress, especially at rotational speeds exceeding 5000 RPM in belt-driven machines—are not present. Furthermore, the compact dimensions minimize problems associated with rotor shaft unbalance and misalignment, which might otherwise induce higher magnetic harmonics. Another benefit of applied electric machines in EPS applications is the typically limited duration of full-load operation, occurring mainly during parking maneuvers; driving school vehicles is an exception.
To prevent magnetic forces and stator mode resonance under standard EPS operating conditions, the most effective approach to preventing such phenomena is to simulate the magnetic forces using the Maxwell stress tensor method [
21] before advancing the system to the prototype stage. The corresponding formulas are as follows:
where
Bt,
Bn,
Ft,
Fr represent the tangential and normal components of the magnetic flux density and the tangential and radial components of the electromagnetic force, respectively.
With these values, the pressure can be calculated. However, as concluded by Deng and Zuo [
22], the stator vibration level is related to the amplitude of the electromagnetic forces. Therefore, a comparative analysis of similar machines with respect to their acoustic parameters can be performed based on the force analysis.
This approach, while simplified, effectively highlights the differences between similar designs and can be conducted using 2D simulations in the present case; however, a physical electric motor assembled into the CEPS system is available. Moreover, data acquisition can be carried out at the vehicle level, allowing the collection of raw experimental data for analytical purposes.
2. Materials and Methods
In parallel with the development of the next-generation vehicle model, and under continuous market-driven cost-reduction pressures, a newly designed, internally assembled steering system was introduced. This modification alters the system’s acoustic characteristics, potentially leading to customer concerns due to the emergence of new noise phenomena. Preliminary observations indicated that the steering system might be the primary source of these acoustic events, as the noise signatures correlated with steering wheel maneuvers. To confirm or refute this hypothesis, a vehicle-level investigation was conducted.
The primary objective of the field measurements was to acquire airborne noise data in conjunction with signals from the EPS system, specifically monitoring the electric motor speed. The steering wheel excitation was defined as a sweep across the typical operational range, from near-zero rotational speed to conditions representative of emergency maneuvers of approximately 120 RPM at the steering wheel.
In practical driving conditions, customers generally do not perceive variations in acoustic levels at the higher end of this range. Therefore, laboratory tests were typically limited to a maximum steering wheel input of 90 RPM, with measurements at 120 RPM conducted only in exceptional cases.
An important factor during data acquisition is ensuring a sufficiently high sampling frequency. Although analysis benefits from data obtained at 120 RPM, the rotational speed of the system must be measured with consideration for higher transient values. This requirement arises because manual maneuvers performed by the test engineer may fluctuate during testing. To prevent post-processing data distortion and to capture the complete acoustic behavior of the system, a minimum measurement capability corresponding to 300 RPM steering wheel speed was adopted. This accounts for temporary increases in maneuver speed over short steering angles, which may locally reach up to 240 RPM within a 10° range.
Given the known architecture of the EPS system, the components necessary for calculation and analysis include the mechanical gear ratio, the number of rotor magnetic poles, the number of pole pairs, the number of stator slots, and the number of motor phases. The respective values are 31, 8, 4, 12, and 3.
where these components have already been unveiled and give the final result of
fx equal to or higher than 1240 Hz. This value led to the conclusion that the speed signal obtained from the CAN protocol is not sufficient for this particular setup and test, in which the signal is sampled at 0.5 kHz (ISO standard) [
23]. When using an analog inductive coil sensor, however, the issue of insufficient sampling is overcome.
2.1. Vehicle-Based Field Data Acquisition
Data acquisition for this study was conducted using two types of vehicles: one powered by an Internal Combustion Engine (ICE) and the other by an electric motor (EV). Both vehicles were equipped with the same EPS-type system. Wheel and tire size may influence the system load, as differences in the contact surface area of the tires and the mass of the wheels affect performance. Consequently, at identical steering wheel rotational speeds, the load experienced by the EPS system may vary. Both vehicles were tested with 17-inch alloy wheels and 16-inch steel wheels. In addition, the ICE vehicle was also tested with 17-inch steel wheels. The distribution of the test vehicles according to powertrain type and wheel configuration is presented in
Table 1. The selection reflects manufacturer stock availability; all samples were tested.
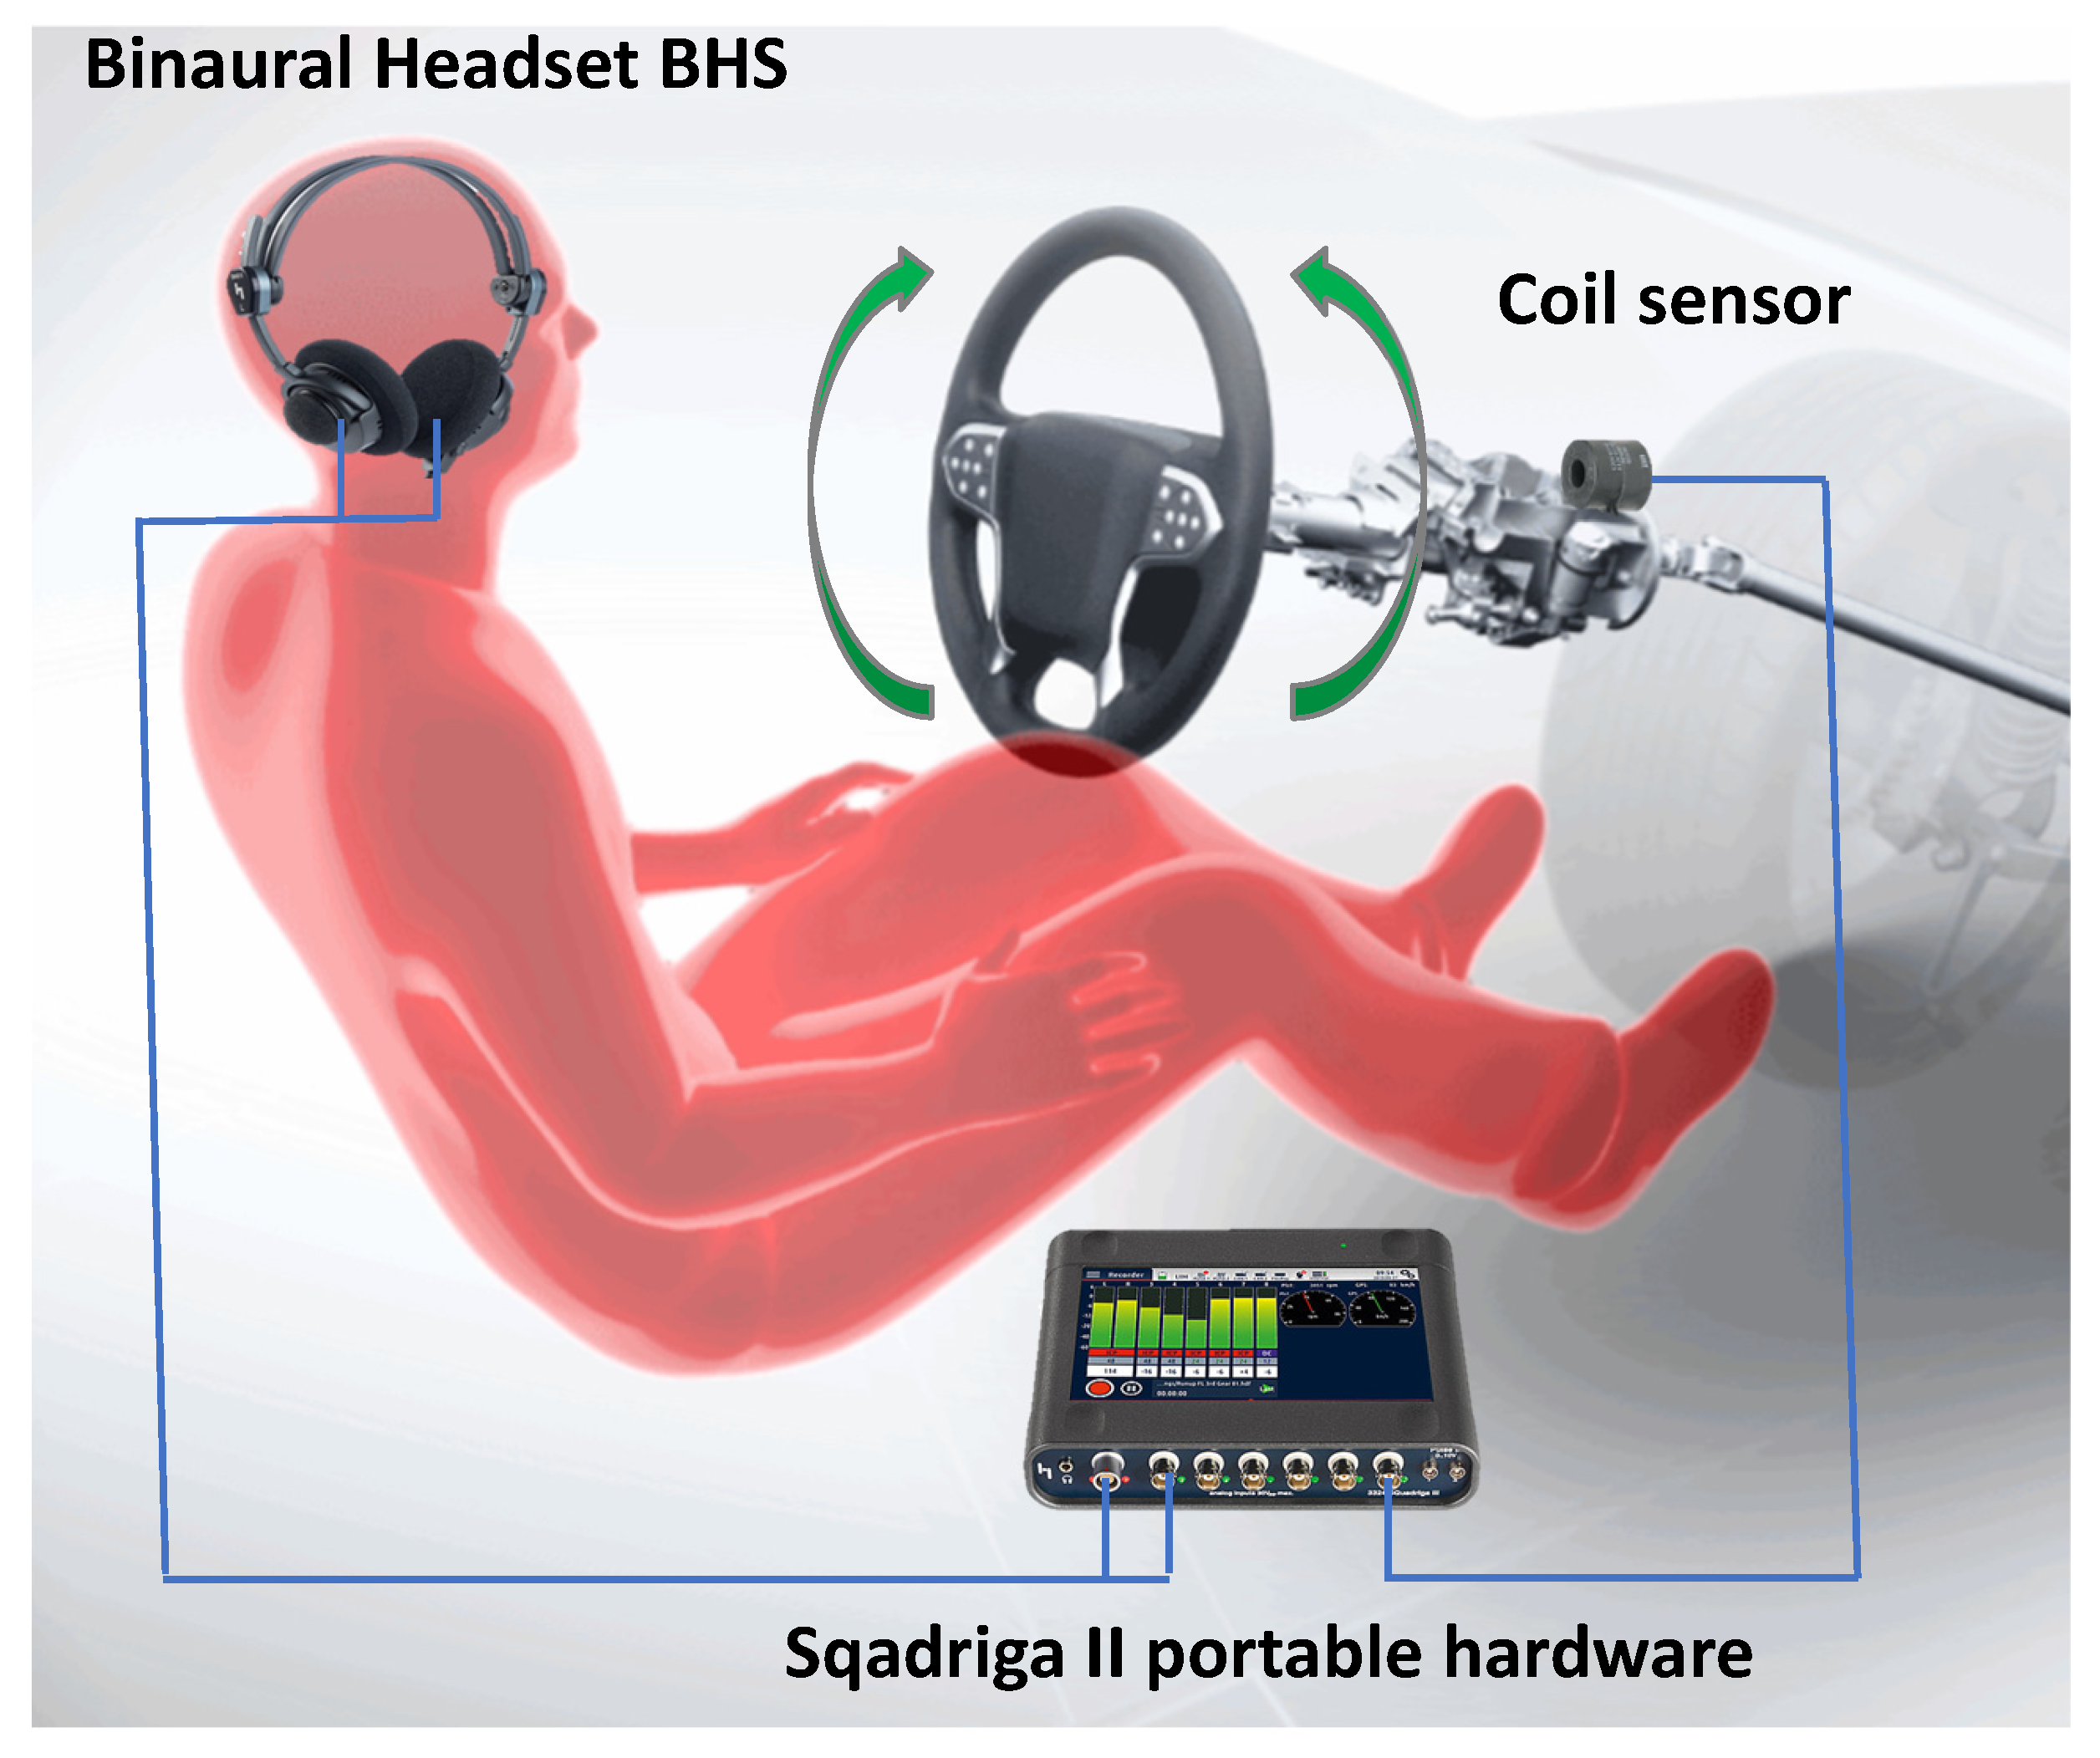
Field measurements were conducted at the vehicle level. The complete setup inside the passenger cabin is shown in
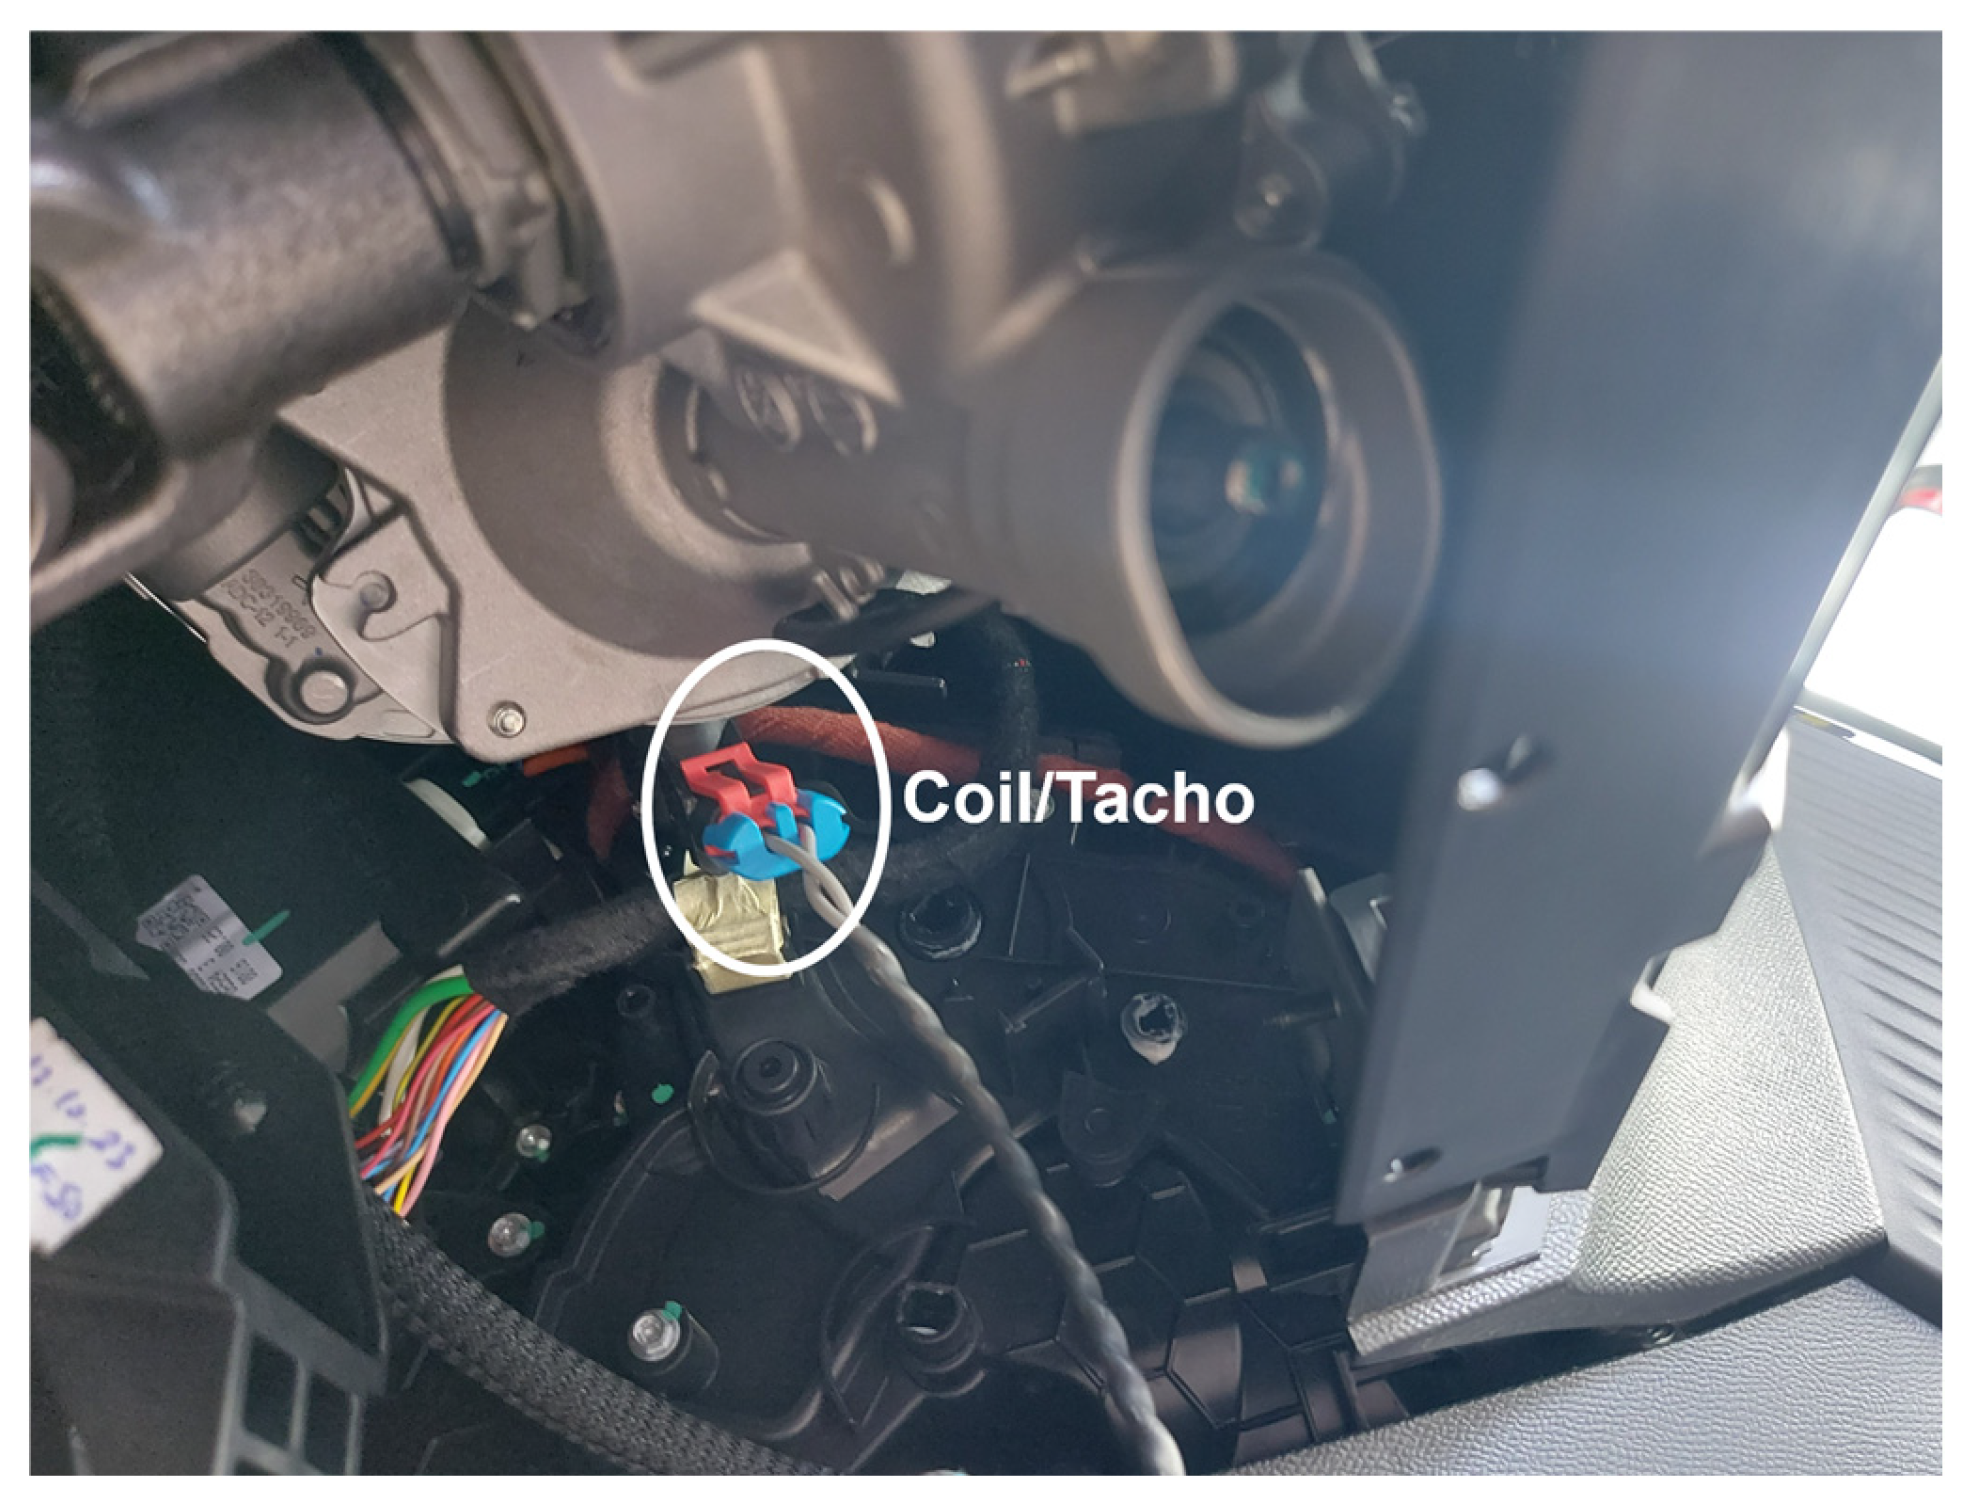
Figure 4. The data acquisition setup required the removal of the lower cover of the steering column to allow attachment of the coil sensor to the EPS motor housing
Figure 5. The sensor was mounted to the EPS electric motor using wax. This electromagnetic coil consists of enameled copper wire wound around a thermally resistant bobbin and encapsulated in insulating material to ensure reliable operation and protection against environmental factors. When alternating current is applied, the coil generates a magnetic field. The component is engineered for continuous use in automation systems; its design parameters align with industrial standards for electrical resistance, insulation class, and ambient operating temperature (certifications CE, CSA, NRTL-C, IP65, and class F insulation—maximum allowable temperature 155 °C). Acoustic data acquisition was performed using portable measurement hardware consisting of two components. The main one is the Squadriga II Data Recorder, which is a mobile, multi-channel front-end and stand-alone system for sound and vibration data acquisition. The second is the binaural headset BHS II, which is a headphone and microphone unit for aurally accurate binaural recordings. Adapting coil sensor wires to the BNC connector enables connection to one of the Squadriga II inputs.
To excite the structure over a wide range of frequencies, the rotational speed of the electric motor should be gradually increased to produce a sweep-like excitation. It is important to rotate the steering wheel with a progressively increasing angular velocity as a function of the steering angle position. The total steering angle from end-of-travel (EOT) to end-of-travel is approximately 1200°. Therefore, achieving the required speed range for the analysis necessitates careful execution of manual maneuvers.
2.2. Data Acquisition in a Semi-Anechoic Chamber for Acoustic Measurements
To comprehensively characterize the magnetic noise properties of the investigated EPS motor, measurements were conducted in a semi-anechoic chamber. The experimental setup consisted of a chamber constructed in accordance with the relevant ISO automotive standard [
24] and equipped with 19 microphones. The standard applied to the setup is ISO 3744:2010 [
24]. This arranges a hemispherical microphone array at specified positions distributed evenly on a hemisphere with a radius at least twice the largest source dimension. The hemisphere is placed above a reflecting plane containing the source. This ensures spatial averaging for accurate sound power measurement by uniformly sampling the radiation field around the source. The array is made of PCB 378B02 type, a 1/2-inch prepolarized free-field condenser microphone with a sensitivity of 50 mV/Pa and a wide frequency range of 3.75 Hz to 20 kHz (±2 dB), making it suitable for precision sound level measurements in environments free of reflective surfaces. Its high dynamic range (15.5 dB(A)–146 dB) and IEC 61094-4 [
25] compliance support applications in automotive, aerospace, and research that require accurate acoustic analysis.
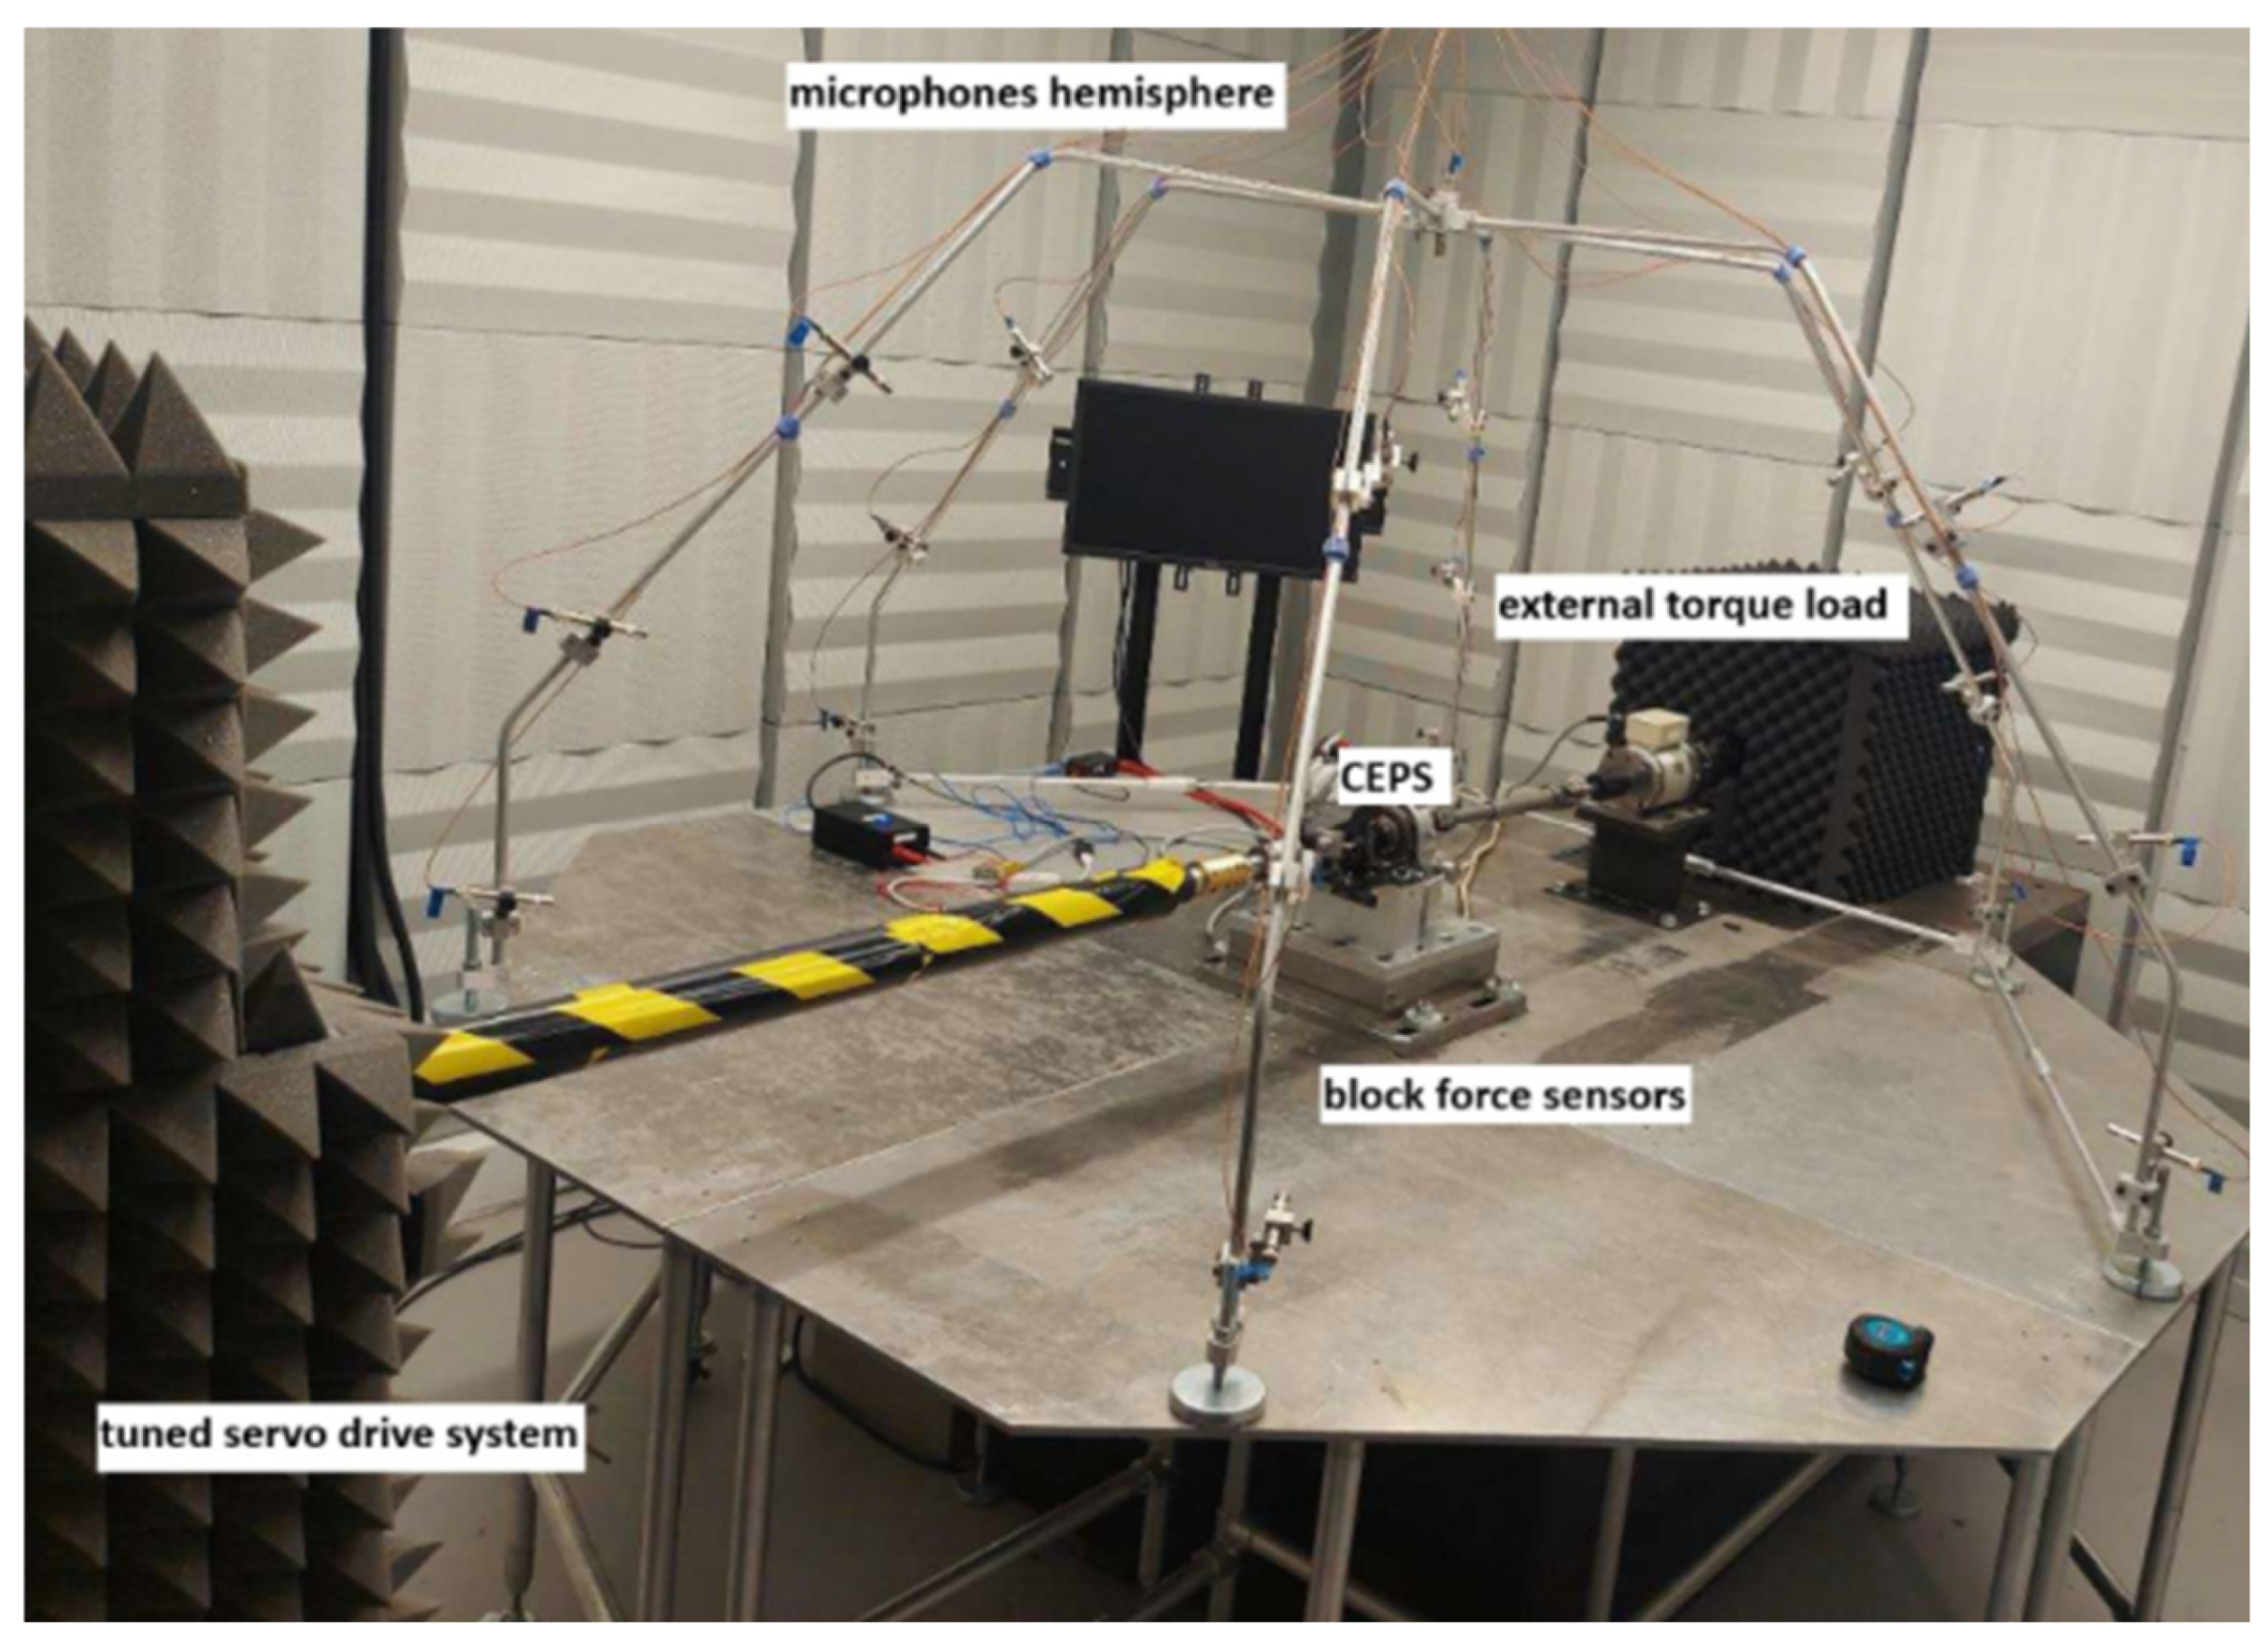
The test rig was designed to enable measurement of reaction forces using three force sensors mounted beneath the EPS assembly plate within the fixture. Automated steering wheel rotation maneuvers were executed using an external servo drive system connected to the steering wheel shaft. An external electromagnetic brake was applied to the EPS output shaft to control the torque load on the system. Both the servo drive system and the torque load units were enclosed within acoustic housings to prevent their influence on the measured acoustic data. The rotational speed control loop of the servo drive was precisely tuned to minimize interference from the drive system in the recorded sound pressure levels. The complete experimental arrangement is shown in
Figure 6. Notably, both the servo drive and brake systems were positioned outside the microphone hemisphere to minimize their impact on measured noise values.
Sound pressure measurements were performed at four steering shaft rotational speeds: 15, 30, 45, and 60 revolutions per minute (RPM). During each test, the rotational speed was maintained constant, and sound pressure levels were continuously recorded for 20 s under steady-state conditions. For each speed, the time-averaged octave-band sound pressure level (SPL) was computed. All measurements were carried out at constant torque load of 45 Nm.
2.3. Drive Unit Structural Dynamics Analysis
To correlate results obtained from vehicle and semi-anechoic chamber measurements, a natural frequency test of the CEPS drive unit was conducted. The objective of this experiment was to determine whether audible magnetic noise within the steering wheel rotational range corresponds to any specific stator mode.
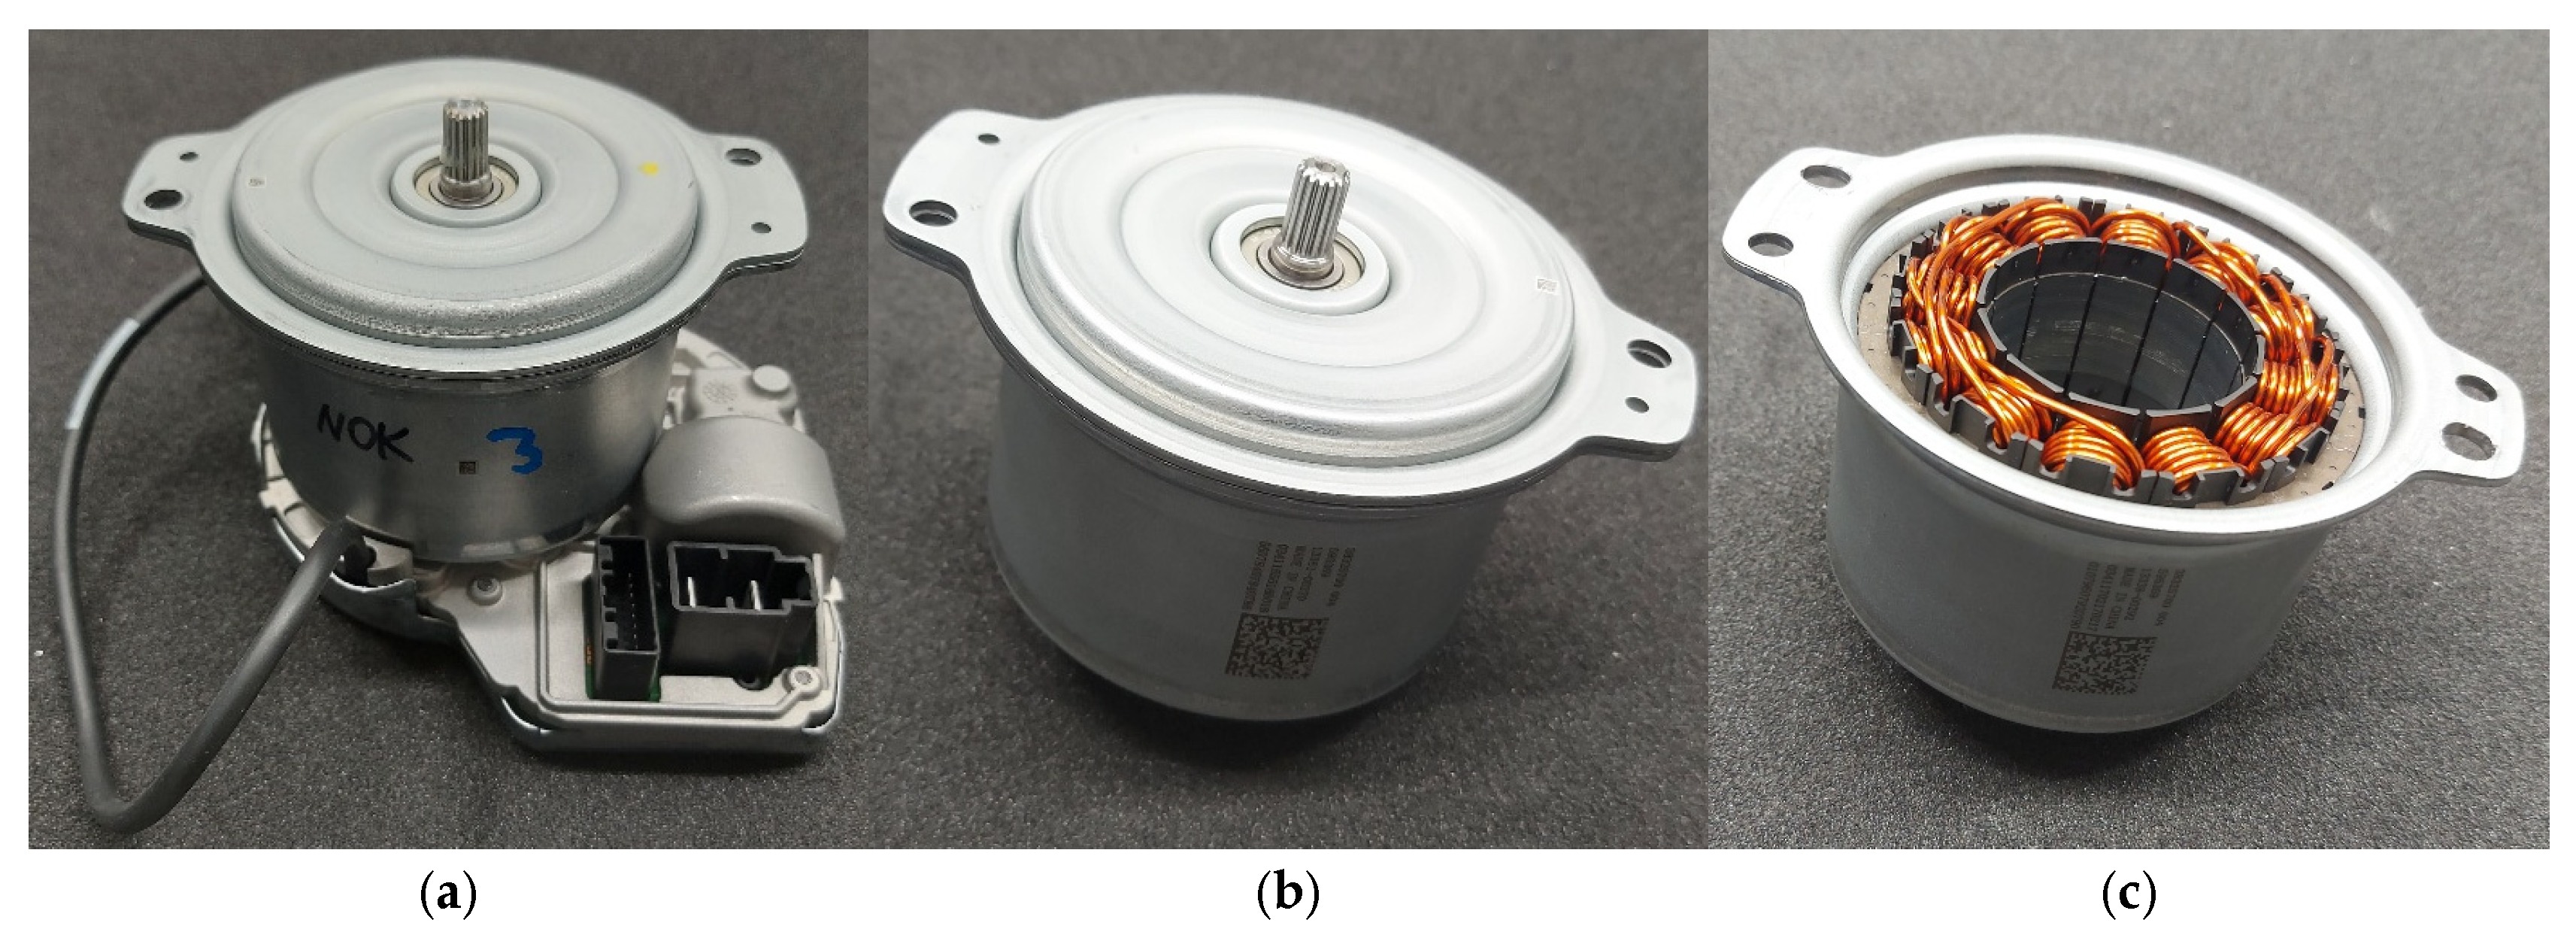
The test was performed at three levels of component assembly (illustrated in
Figure 7):
- (a)
Motor and electronics assembled, referred to as the power pack (PPK).
- (b)
Complete motor without electronics.
- (c)
Stator without electronics, rotor and housing cover removed.
3. Results
Due to the complexity of acoustic signals acquired during measurements in a vehicle or anechoic chamber, frequency-domain analysis is widely employed. This approach represents the signal as a sum of harmonics, with amplitudes describing its frequency composition. Such analysis provides a time-independent representation of a stationary random process, i.e., one whose statistical properties remain constant over time.
Frequency-domain analysis is widely used in industry for various purposes [
26]. Building on this, order tracking is employed as an advanced technique. It uses integer multiples of the rotational speed (orders) as the frequency base instead of absolute frequencies. This method requires analog instrumentation to monitor rotational speed, enabling direct correlation between acoustic and vibration signals and rotational motion.
3.1. Vehicle-Based Field Data Analysis
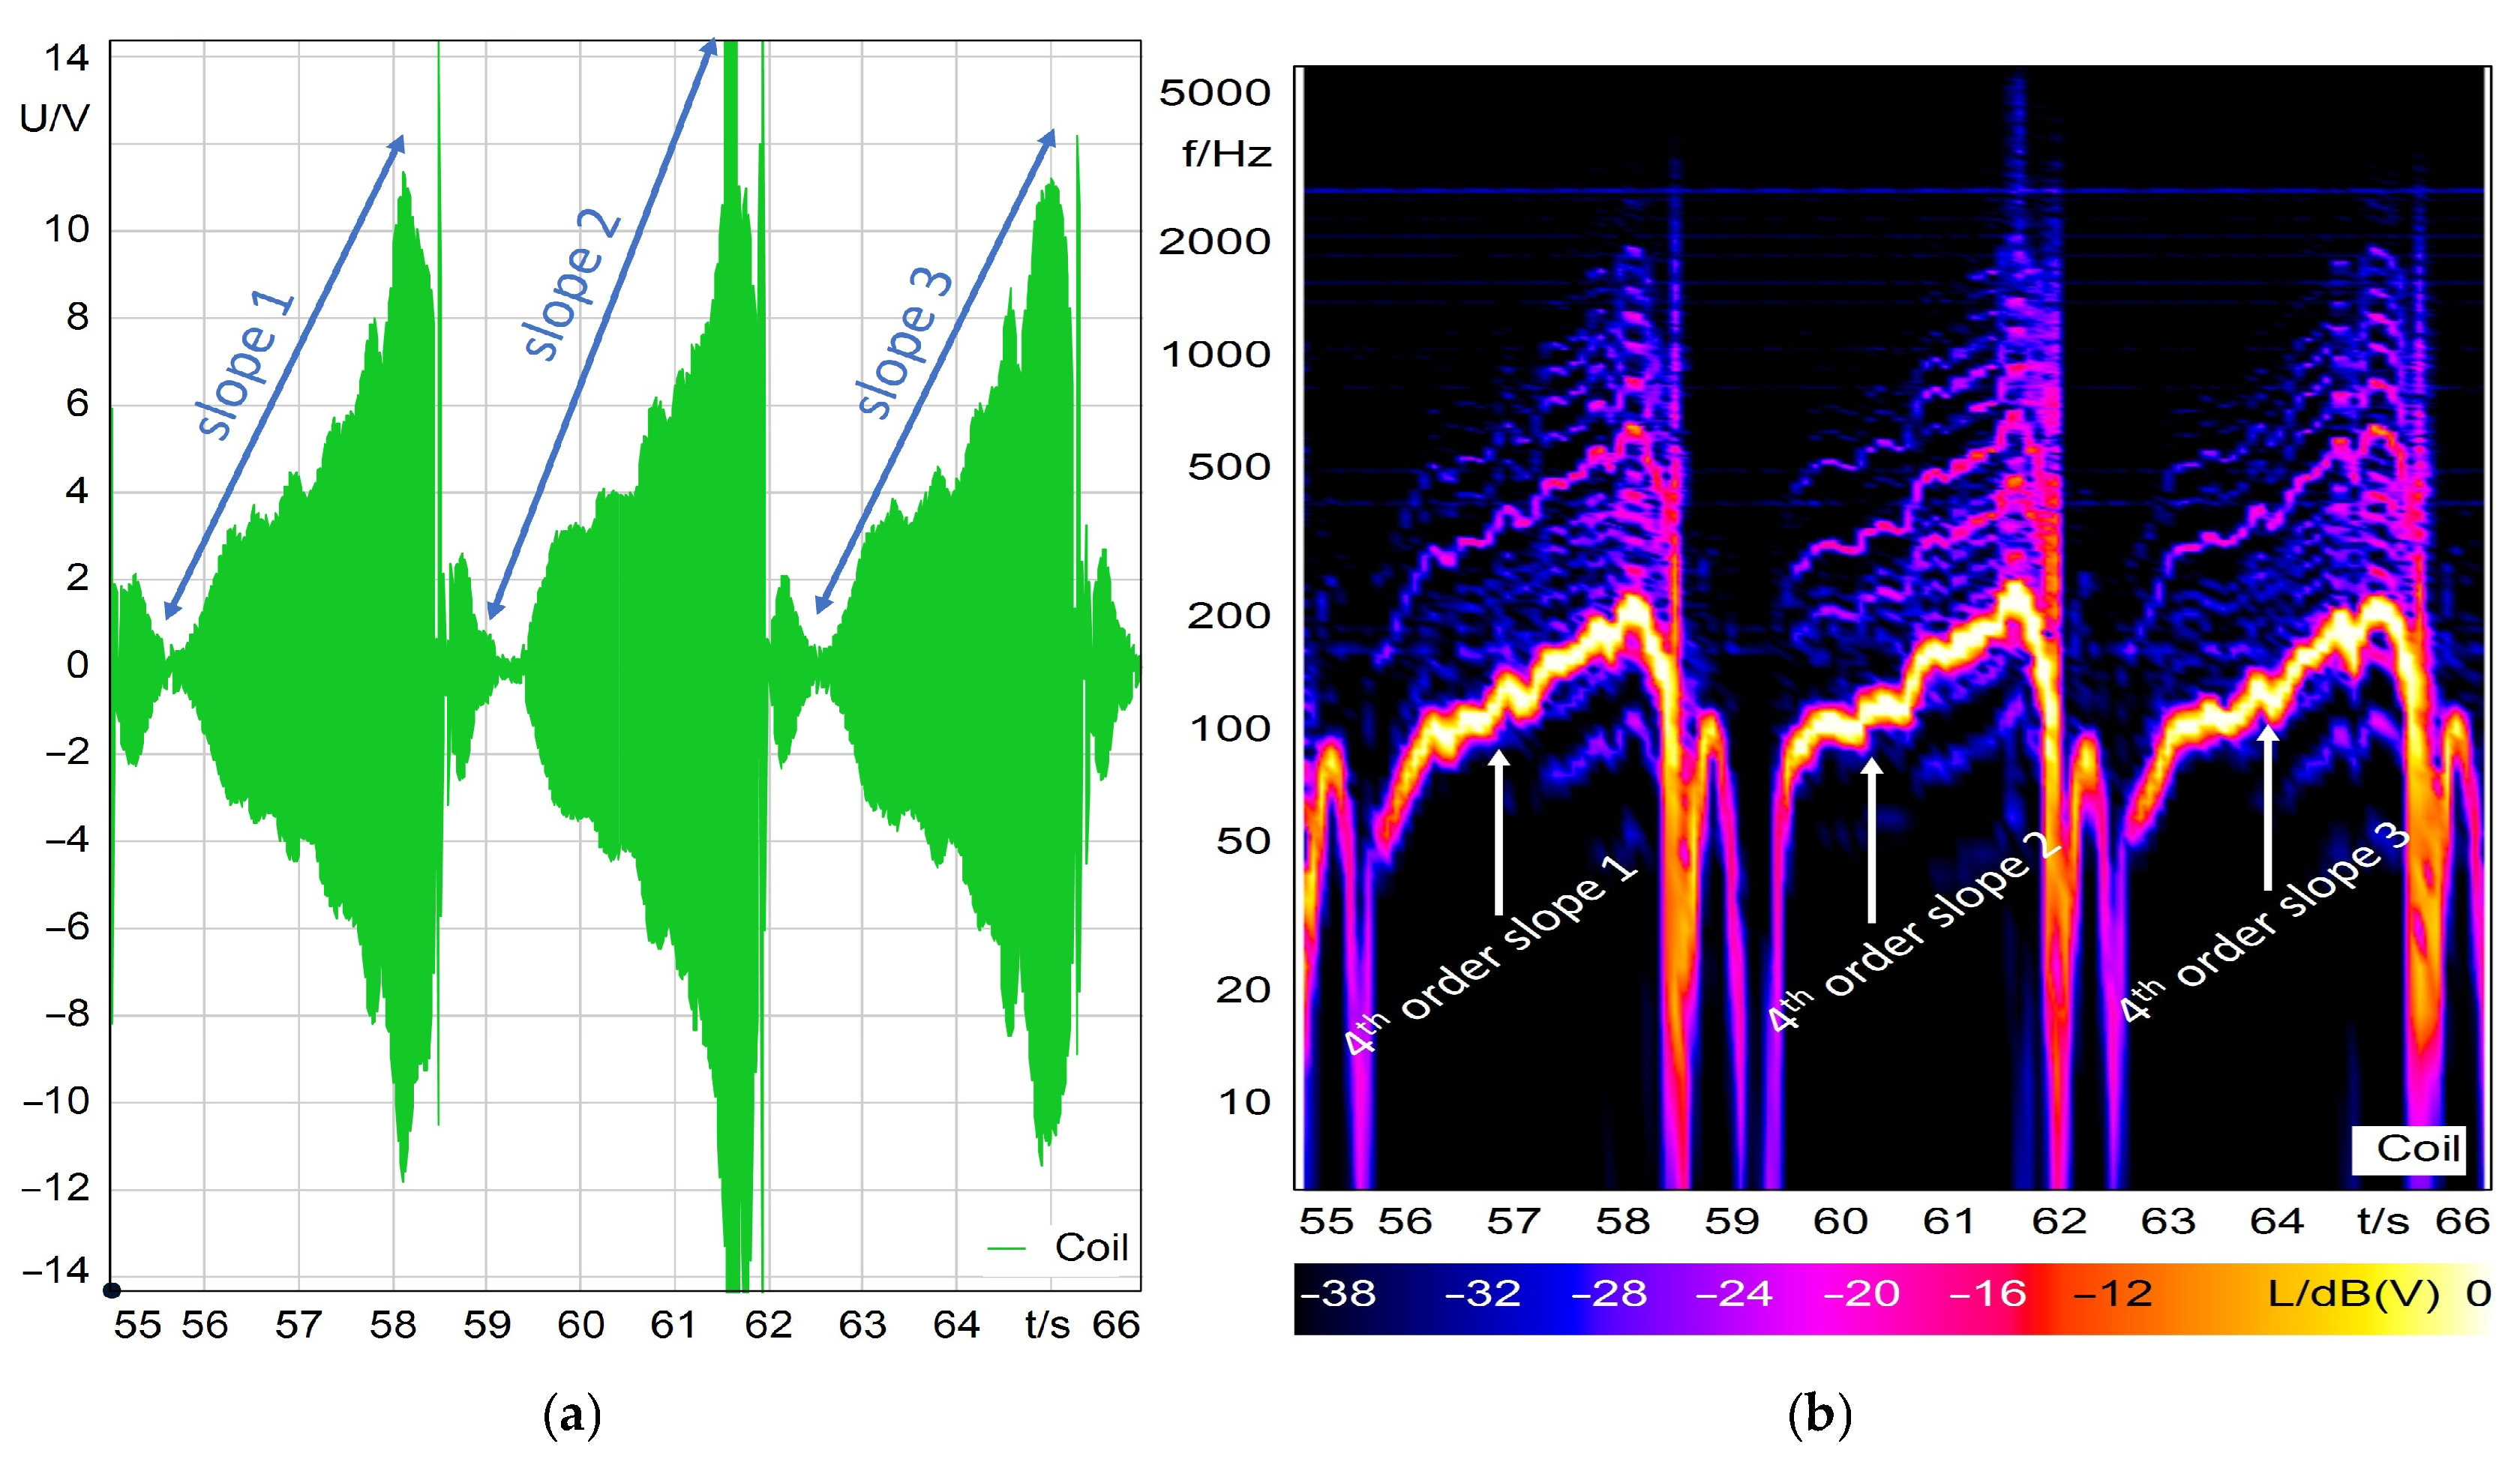
The time signal of the voltage acquired by the coil sensor mounted on the EPS electric motor during three consecutive EOT-to-EOT steering maneuvers is presented in
Figure 8. These rotational maneuvers of the steering wheel correspond to the angular velocity of the EPS electric motor,
ω. The magnetic flux, Φ, passing through the coil sensor induces a voltage given by Equation (4):
where
NC is the number of coil turns, Φ is the magnetic flux, and
ω is the angular velocity of the EPS motor. The flux Φ depends on the magnetic field distribution and the relative position of the sensor with respect to the rotor, as well as the geometry and properties of the magnetic circuit. The increasing voltage amplitude observed in
Figure 8a confirms that the steering maneuvers were performed correctly. Specifically, the rotational speed of the steering wheel increased with the steering angle, producing a sweep-like excitation.
The frequency analysis of the recorded coil sensor voltage signal is presented as a spectrogram in
Figure 8b. The highest values recorded during each steering maneuver are observed in the range of 50–250 Hz. The electric motor rotational frequency is determined by the EPS gear ratio and the steering wheel input. During the tests, the steering wheel rotational speed ranged from 0 to 120 RPM, corresponding to a frequency range of 0–2 Hz. It is important to highlight that this type of research can only be conducted when data acquisition is performed during variable rotational speed conditions, either accelerating or decelerating. However, operation during manual deceleration presents certain challenges. Nevertheless, this method enables verification of the system’s behavior within a single measurement. Although theoretically possible, performing multiple trials at different constant steering wheel speeds is impractical due to the difficulty in maintaining a stable speed throughout the entire EOT-to-EOT range. It should be emphasized that obtaining reliable data for analysis requires the operator to possess a certain level of expertise in performing manual maneuvers.
By combining the EPS gear ratio (31), the electric motor pole pair number (4), and the steering wheel operating frequency (0–2 Hz), the resulting frequency range extends from 0 to 248 Hz. It should be noted that the voltage output of the coil sensor decreases at lower rotational speeds, resulting in lower voltage levels at the onset of each steering maneuver when the rotational speed is still low. This is evident as reduced voltage amplitudes up to approximately 50 Hz.
As shown in the time signal in
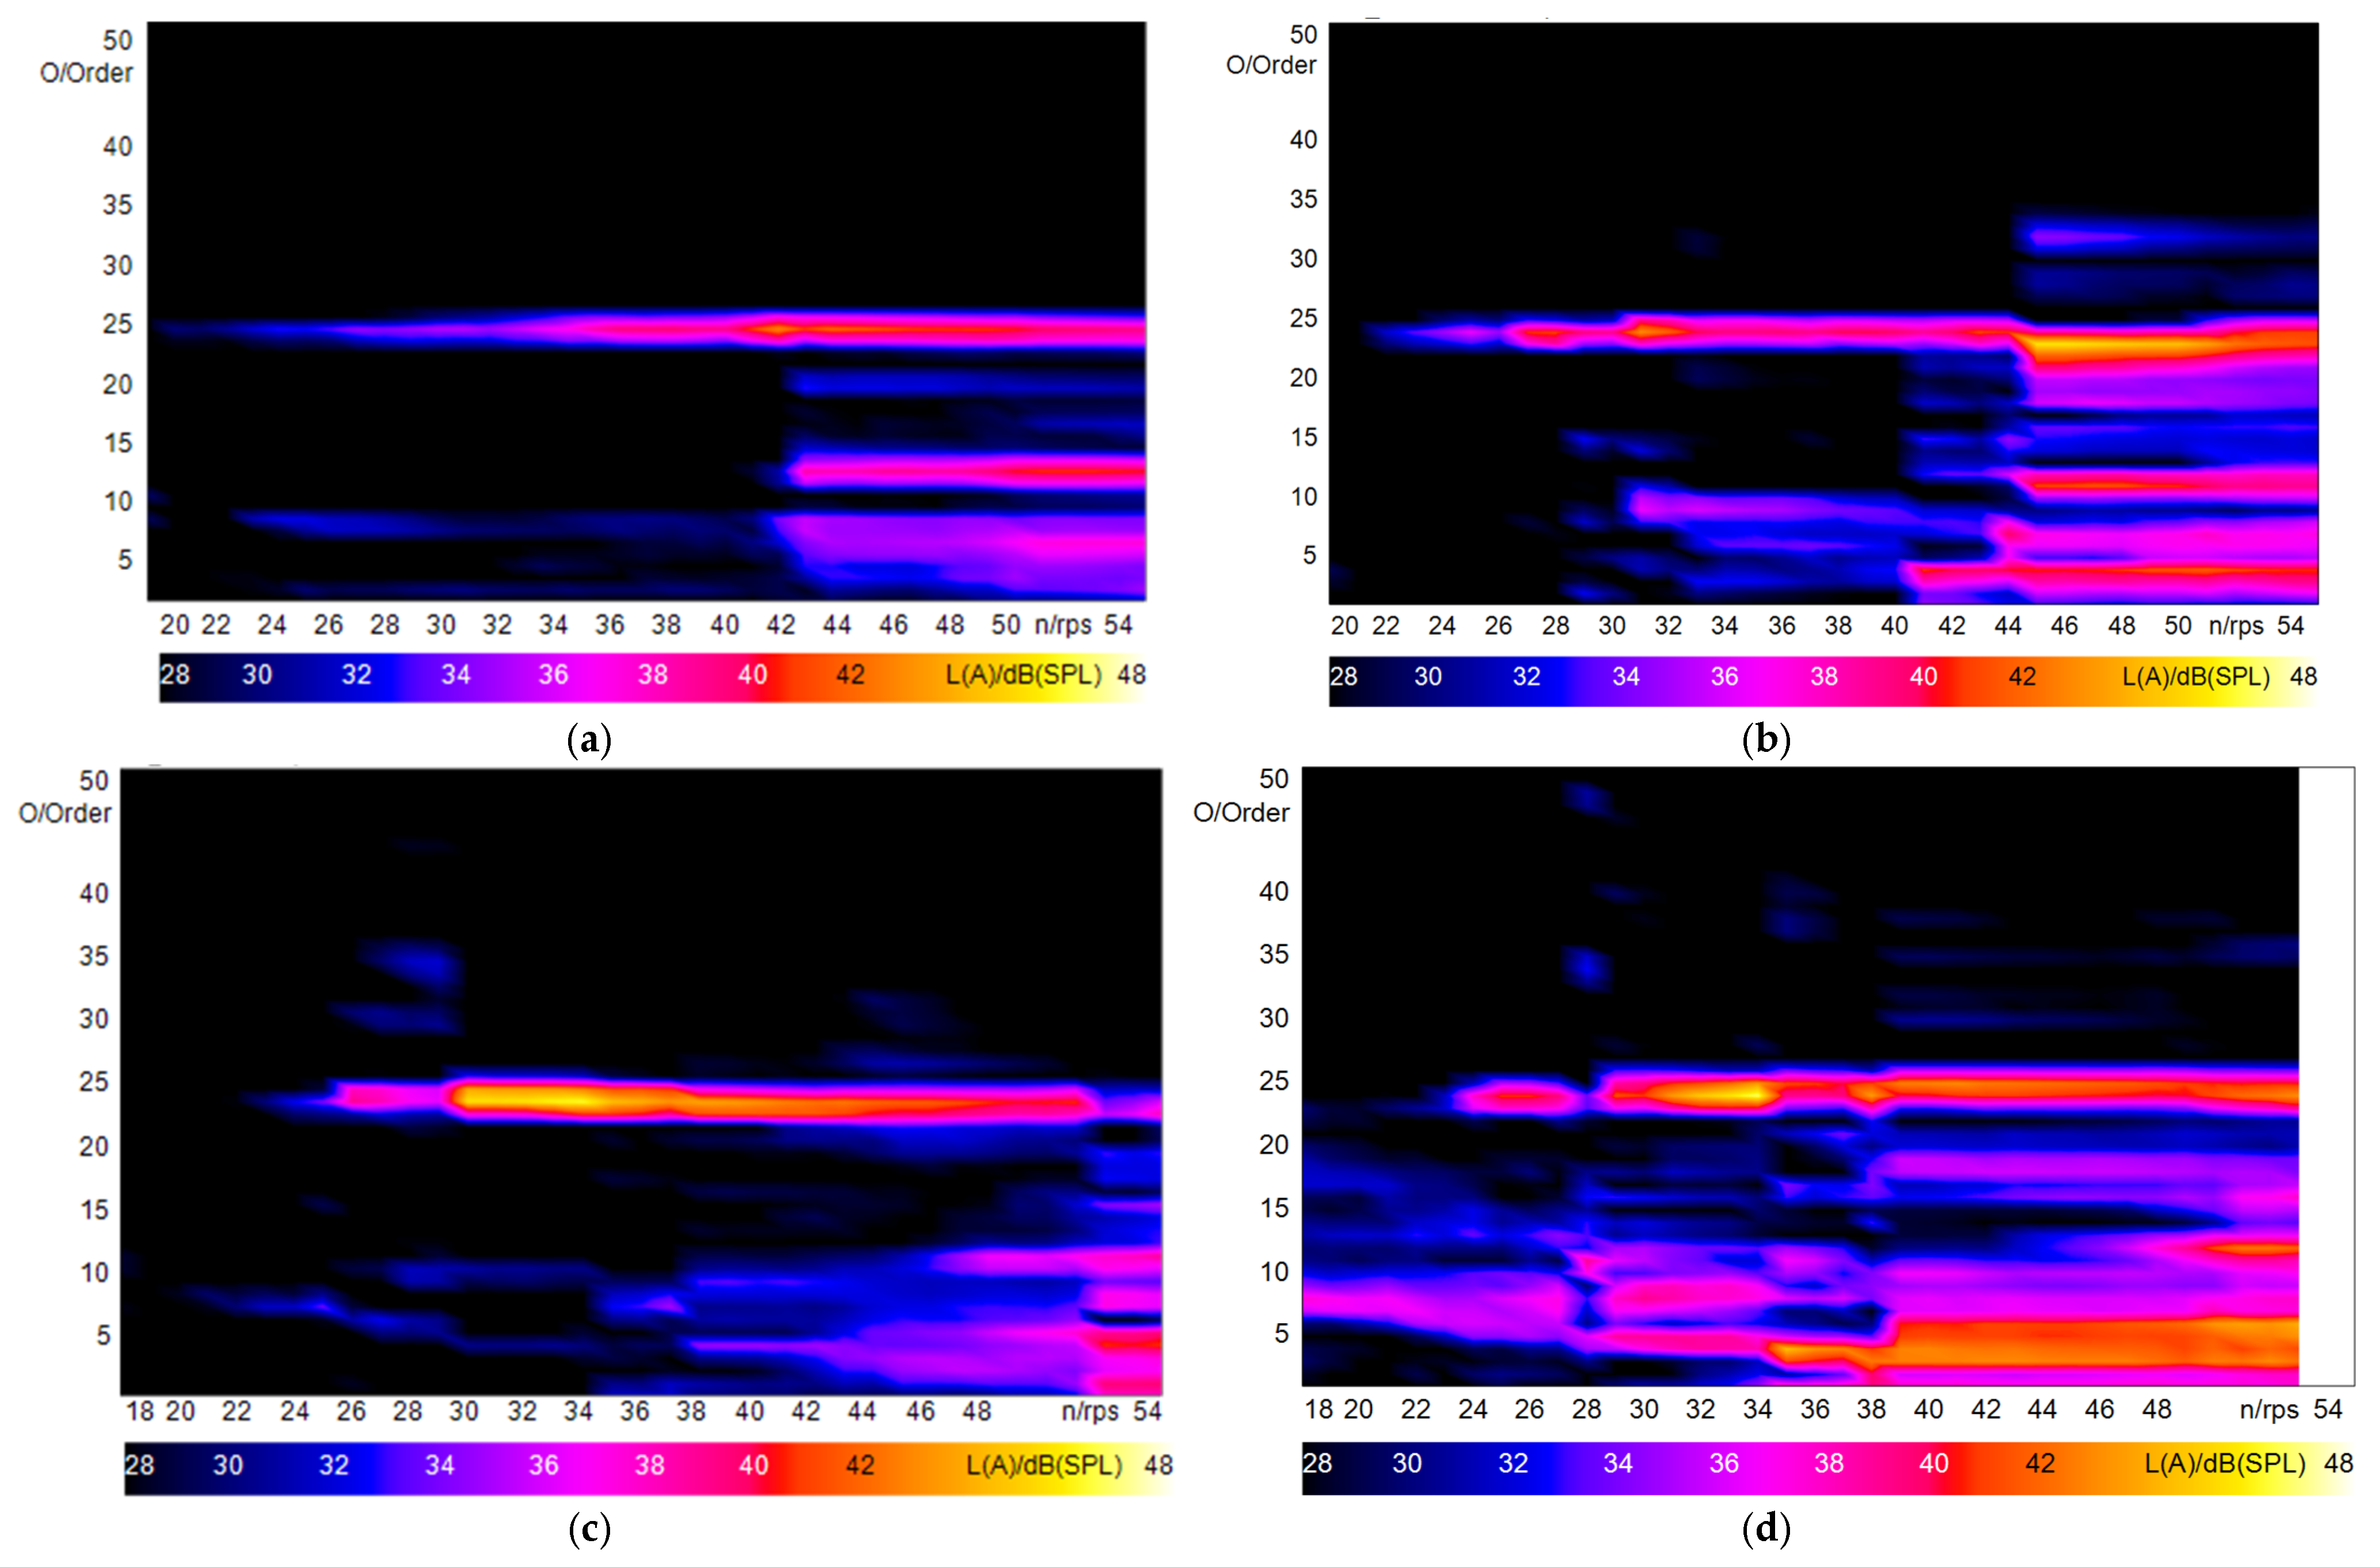
Figure 8a, the induced voltage from the coil sensor reflects the gradual increase in steering speed applied during the tests. Using the known gear ratio of the EPS system and the number of motor pole pairs, the motor’s rotational speed can be estimated. This enables order-tracking analysis by employing the coil sensor signal as a tachometer reference corresponding to the motor’s fourth harmonic (four times the shaft rotational frequency) during post-processing. An A-weighting filter was applied to the field-recorded acoustic signals to evaluate the influence of EPS motor noise on the driver’s perceived sound quality. Representative results from Vehicles #1, #2, #7, and #8 are shown in
Figure 9.
Figure 9 presents A-weighted Sound Pressure Level (SPL) order-tracked spectrograms. The SPL values, calculated from acoustic measurements obtained during vehicle field testing, are shown as order-tracked spectrograms with color-coded SPLs. These plots are essential for the investigation, as they identify specific frequency components that contribute to motor noise as a function of rotational speed. The horizontal axis represents the rotational speed (in revolutions per second) of the EPS motor shaft.
What immediately draws attention is the prominent 24th-order, which appears earliest among the observed orders, just above 0.6 RPS (20 RPS of worm gear) at the steering wheel. As the speed increases, the 4th, 8th, and 12th harmonics become audible. Focusing again on the 24th order, it exhibits a local maximum. This order originates directly from the construction of the electric motor. Specifically, the main magnetic order (24th) corresponds to the lowest common multiple (LCM) of the number of poles and stator slots of the machine, which are 8 and 12, respectively; hence, the LCM is 24. Several alternative methods for calculating the main magnetic order that causes electromagnetic noise have been proposed in the literature. For instance, Bianchi and Bolognani [
12], M. Arun Noyal Doss [
27] and Chun-Yu Hsiao [
14] describe slightly different approaches that lead to the same result. The main magnetic order determines the dominant variation in air-gap permeance, which in turn causes cogging torque: the torque ripple present even at no load, due to the rotor magnets wanting to align with stator slot geometry. Empirical studies of IPMSMs show that the harmonic of cogging torque has the same order as that magnetic order (LCM-based), confirming that this geometrical harmonic is a root cause of cogging torque and associated vibration and noise [
28].
3.2. Semi-Anechoic Chamber Results Analysis
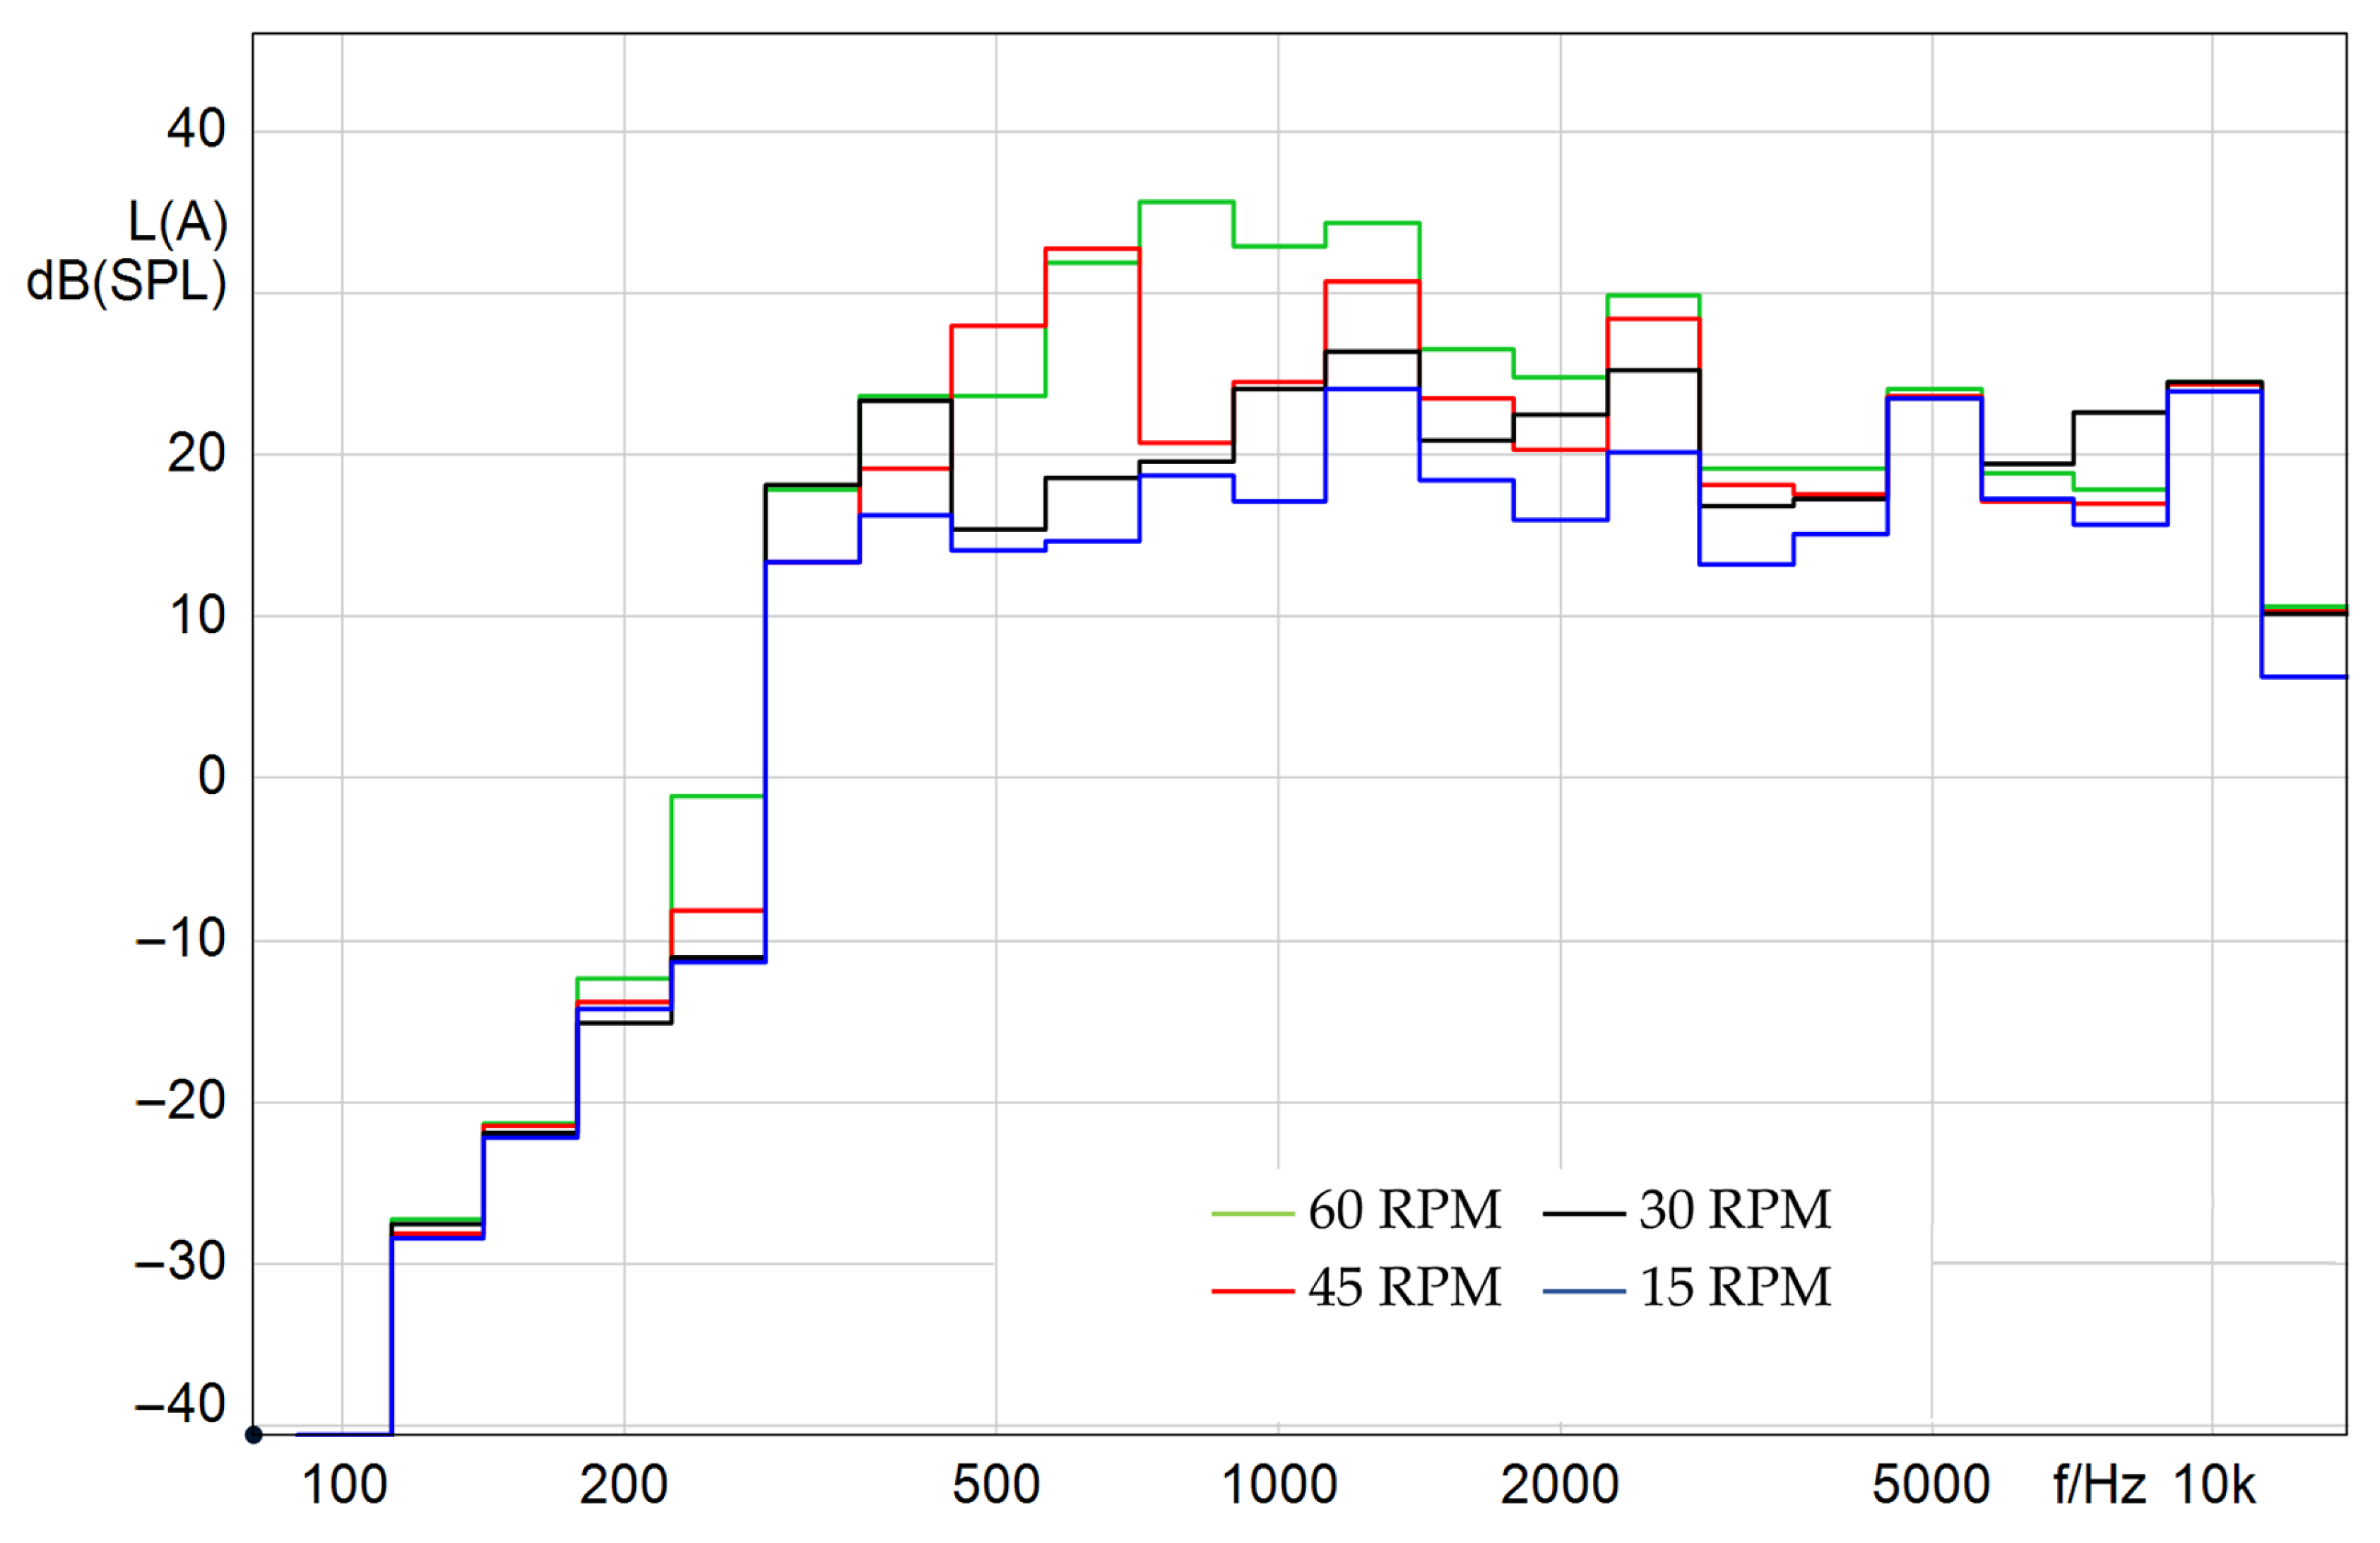
The noise generated by the EPS drive unit was investigated in a semi-anechoic chamber at four steering shaft rotational speeds: 15, 30, 45, and 60 RPM. During each test, the rotational speed was kept constant, and sound pressure levels were continuously recorded for 20 s under steady-state conditions at a constant torque load of 45 Nm. For these rotational speeds (15, 30, 45, and 60 rpm), the corresponding 24th-order frequencies were 186, 372, 558, and 744 Hz, respectively. These frequencies fall within the most acoustically relevant range, which strongly influences customers’ subjective perception of noise. All considered magnetic orders values at the tested rotational speeds are presented in
Table 2.
In parallel, the motor drive was tuned to minimize drive-originated noise. This tuning involved the adjustment of the PI current-controller gains, the implementation of torque-ripple compensation, and the selection of an appropriate PWM carrier frequency. These measures were intended to suppress electrically induced torque fluctuations and associated acoustic emissions. The influence of the drive tuning on the measured acoustic signals was considered negligible within the frequency range of interest and for the purposes of this study.
Figure 10 presents the 1/3-octave-band, time-averaged A-weighted SPL, obtained as the arithmetic mean of measurements conducted in both rotational directions (clockwise and counterclockwise) at each test speed. Each spectrum was computed from a 20 s acquisition. During the measurements, the servo drive speed exhibited a variation of approximately ±2 rpm, which is negligible for the analyzed frequency bands.
The 1/3-octave-band SPL spectrum presented in
Figure 10 shows elevated levels in the 500 Hz and 630 Hz bands for the 45 RPM test and in the 630 Hz and 800 Hz bands for the 60 RPM test. The motor’s main magnetic order—558 Hz at 45 RPM and 744 Hz at 60 RPM—lies between these adjacent 1/3-octave bands, which explains the increased energy observed across both. A secondary increase in SPL is also evident around the 1.25 kHz band; however, the exact second-harmonic frequencies of the main magnetic orders (1.12 kHz and 1.49 kHz, respectively) lie between the 1 kHz and 1.25 kHz bands, indicating that the 1.25 kHz band only partially captures the second-harmonic contribution. For the 15 RPM test, corresponding to a main magnetic order of approximately 186 Hz, no significant increase is observed in the 160–200 Hz range when compared with higher-speed tests. This is likely due to the applied A-weighting, which strongly attenuates low-frequency components, and possibly to the lower excitation amplitude at reduced rotational speeds. In the 30 RPM case, corresponding to a magnetic order of 372 Hz, an increase in SPL is observed around the 400 Hz band, exceeding the levels measured during the 45 RPM test. The correspondence between order frequencies and 1/3-octave band centers confirms that the observed peaks arise from the motor’s magnetic excitation and its harmonics.
3.3. Drive Unit Impact Testing
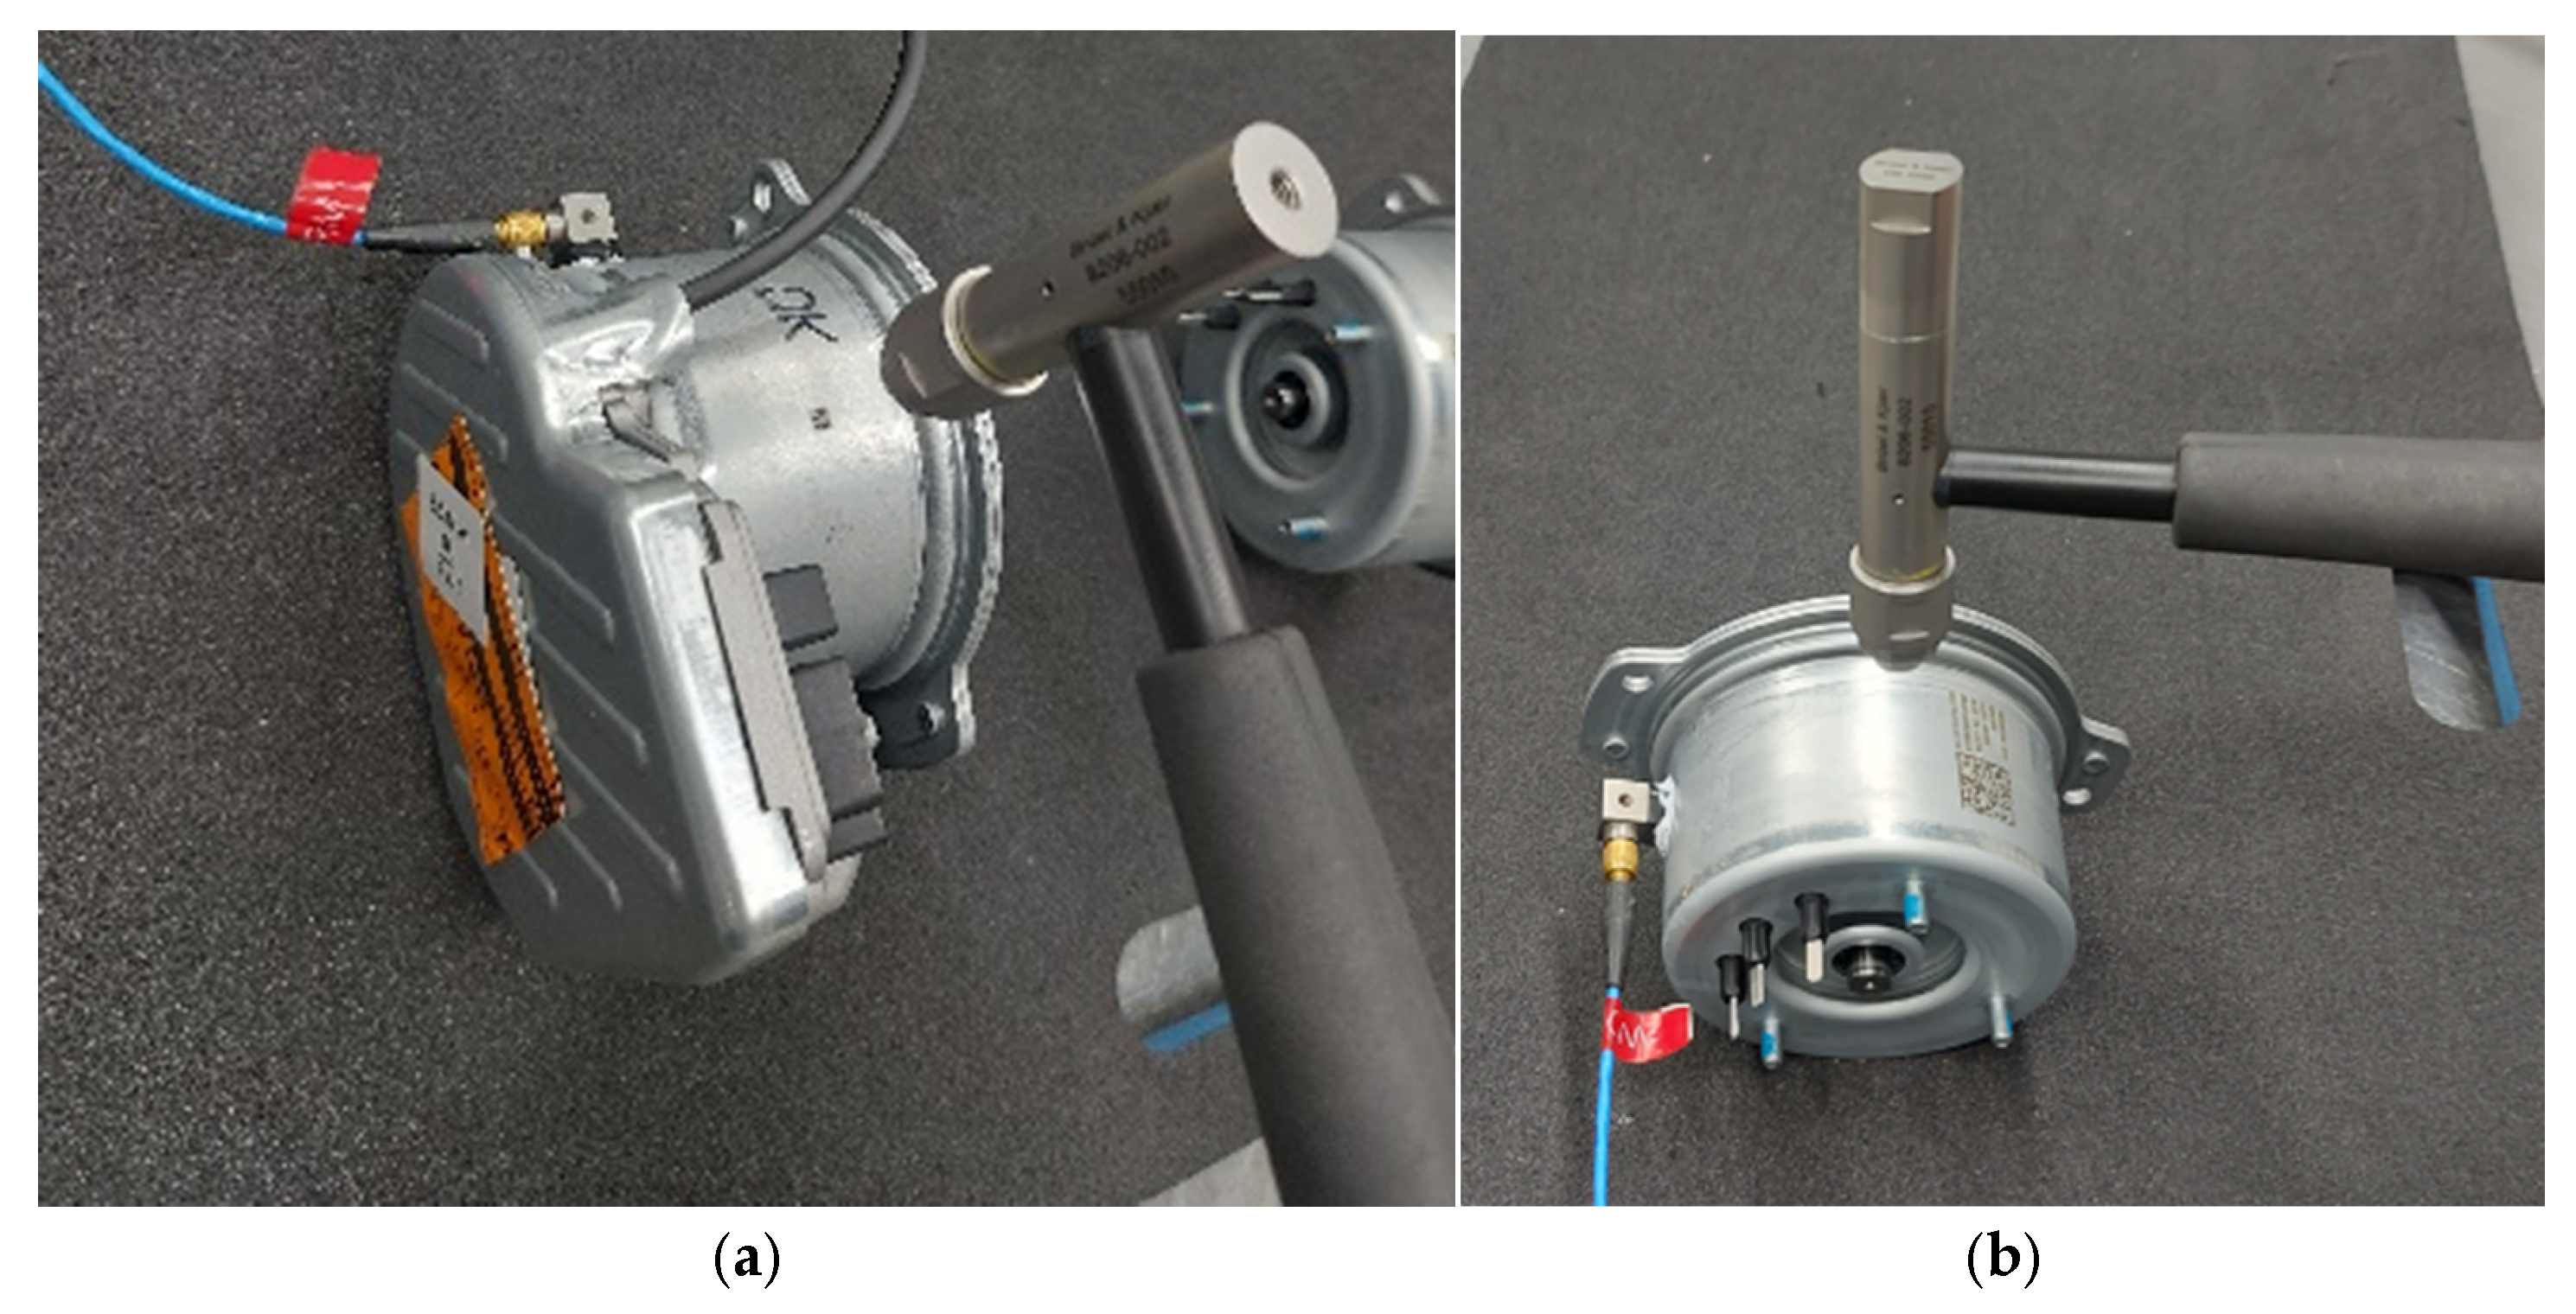
A preliminary impact test using a modal hammer (
Figure 11) was conducted to characterize the frequency response of the EPS motor drive assembly, the motor including electronics with the housing unit, and the stator motor (
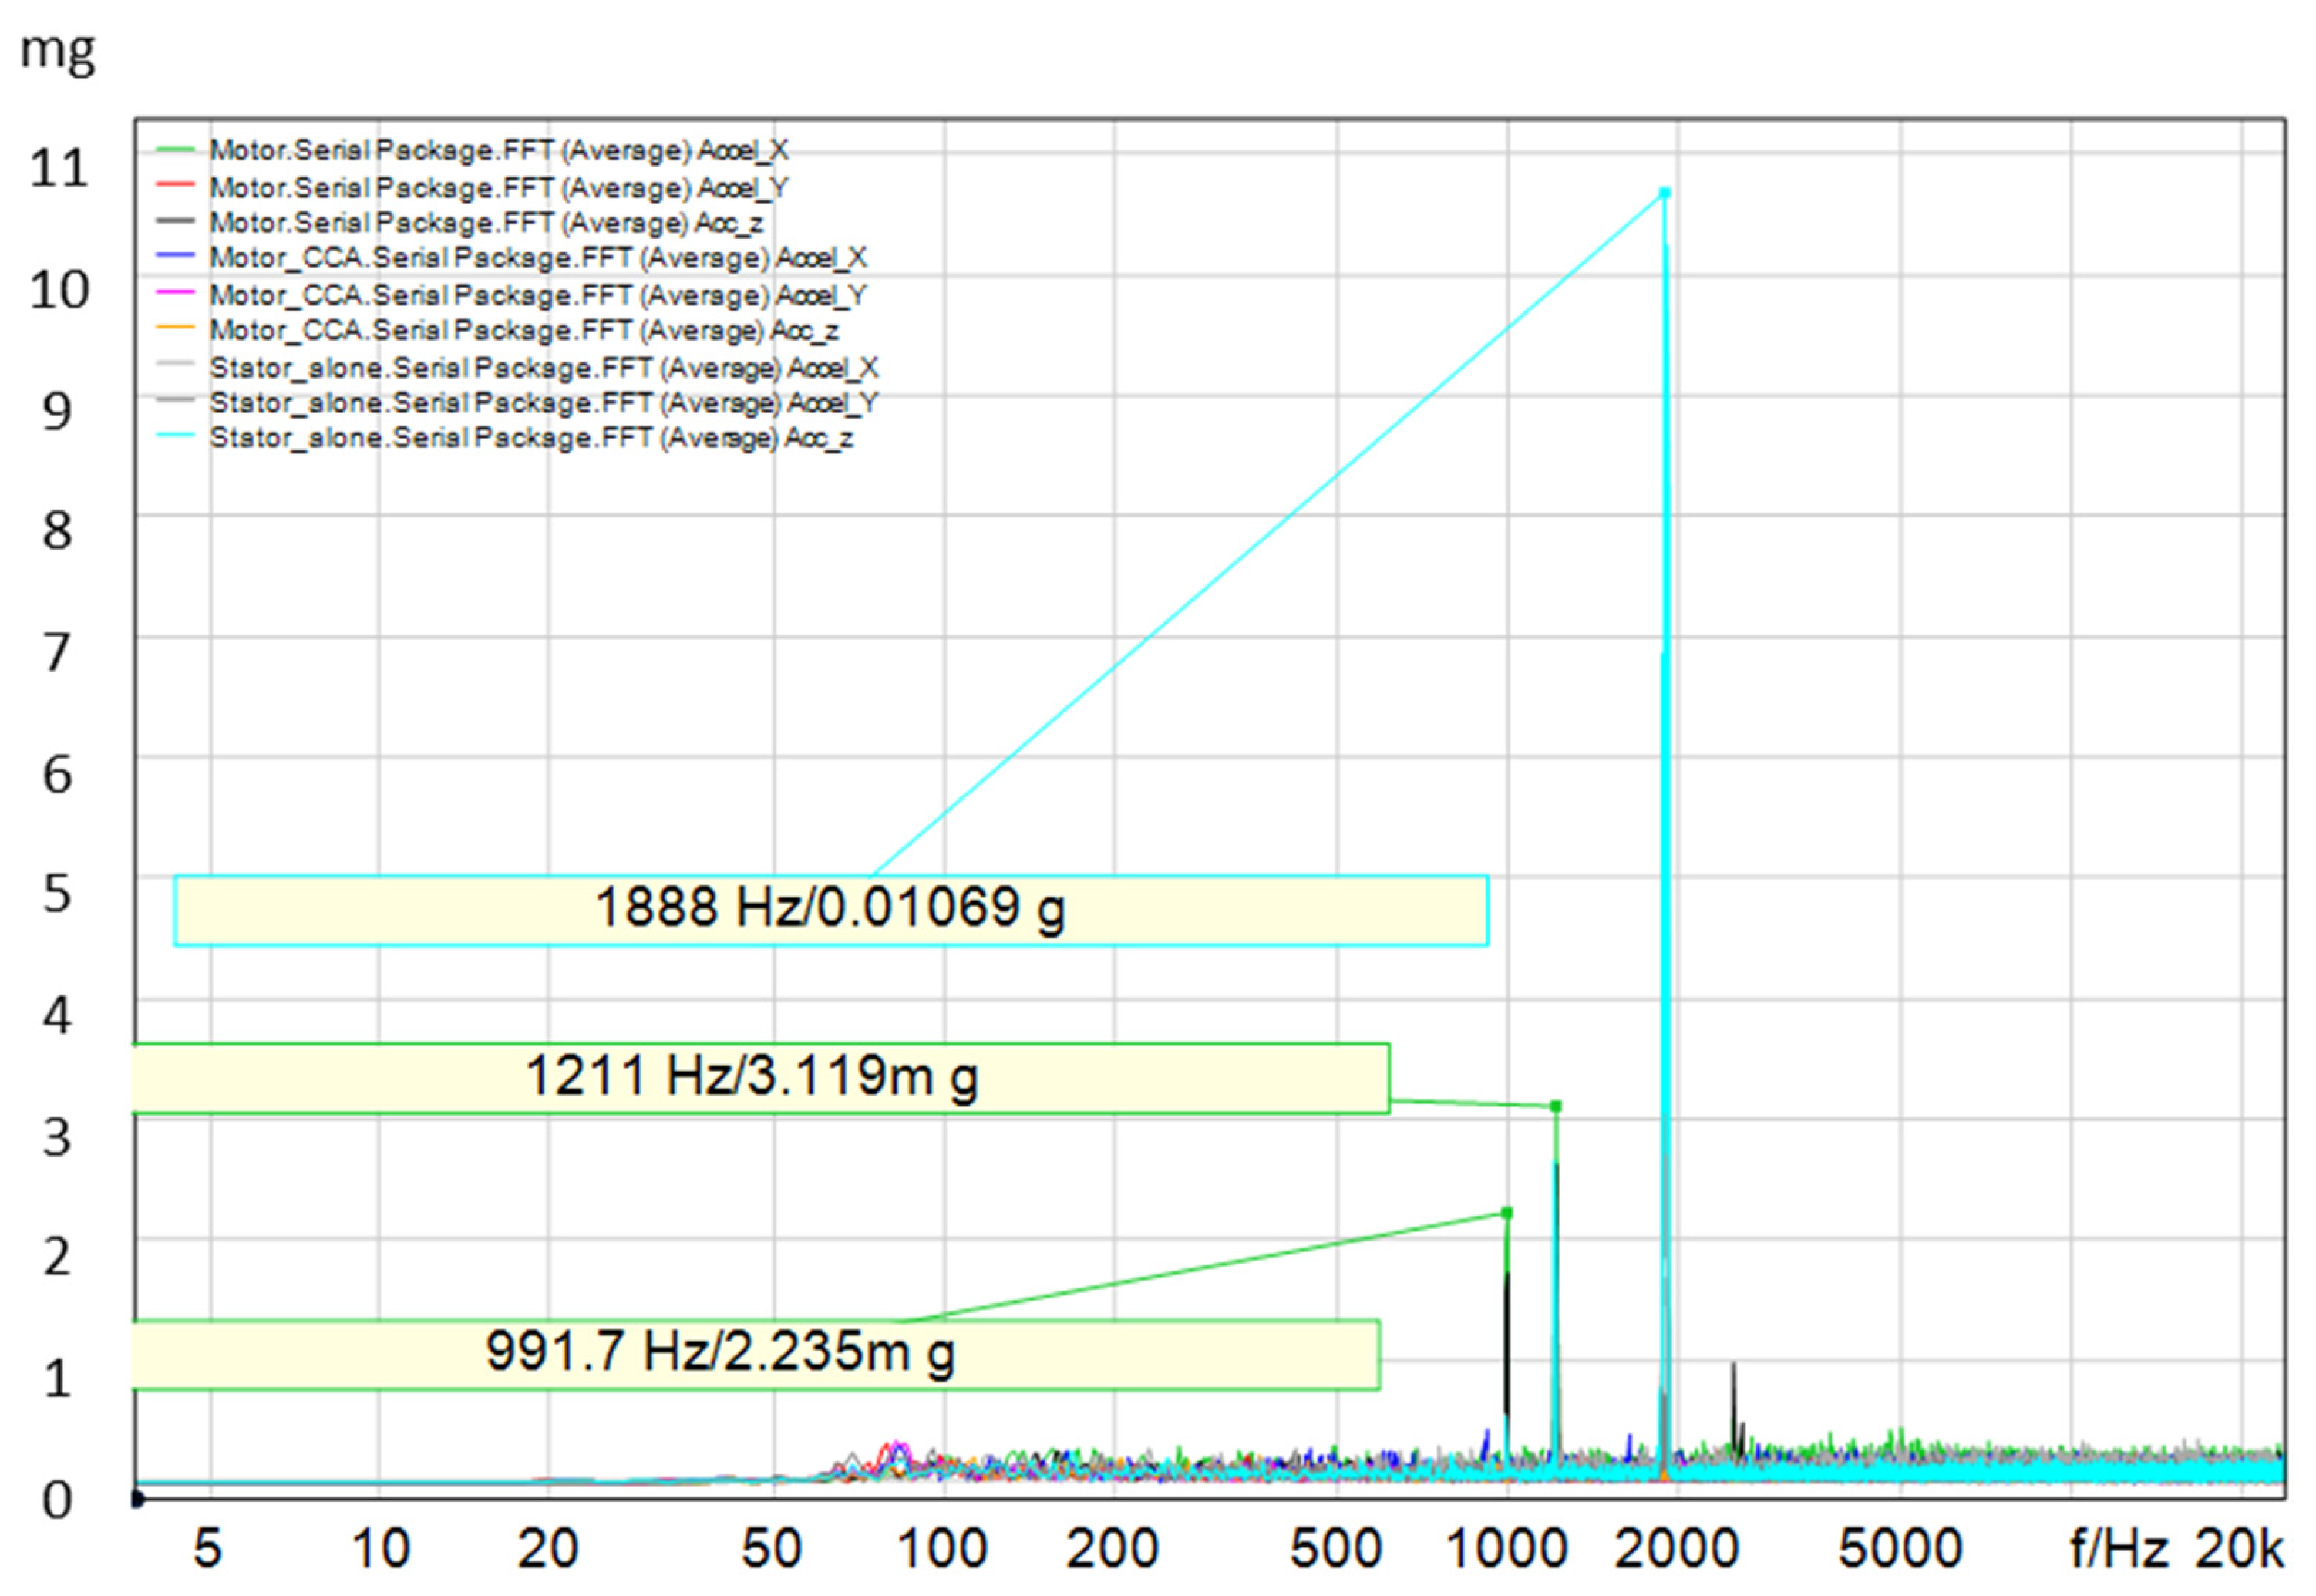
Figure 7). Acceleration spectra from the impact excitation presented in
Figure 12 were analyzed to identify resonant frequencies. While previous tests indicated the motor’s main magnetic orders at 186, 372, 558, and 744 Hz, corresponding to the motor RPM, the measured response exhibited pronounced peaks at 991, 1211, and 1888 Hz across all configurations, suggesting dominant structural resonances in these frequency ranges.
The impact tests reveal that the EPS motor drive assembly has dominant structural resonances at 991, 1211, and 1888 Hz—well above the motor’s electromagnetic excitation frequencies—suggesting that the previously observed noise originates in the electromagnetic domain rather than from these structural resonances. Considering these values and the operating range of the electric motor during steering wheel maneuvers under normal conditions, it can be concluded that the overlay of magnetic orders on stator modes does not lead to any deterioration in the subjective perception of the end user.
4. Discussion
The automotive industry’s shift toward electrification—accelerated by manufacturers focusing exclusively on electric vehicles (EVs)—has introduced new engineering challenges. Equipment suppliers face growing pressure to deliver high-quality, reliable products at equal or lower cost, necessitating shorter development cycles.
Noise, vibration, and harshness (NVH), particularly acoustic performance, have become increasingly critical in EVs. While extensive research has examined the analysis [
29] and simulation [
30,
31] of EV drive system components to reduce NVH, secondary components remain a significant source of noise and vibration, warranting further investigation. Among these, EPS systems are particularly important due to their direct chassis connection and potential to transmit vibrations to the cabin.
Although some studies have addressed EPS-related NVH challenges, unresolved issues remain. Active vibration control (AVC) systems have been proposed to reduce vibrations from rack-assist EPS, showing notable subframe vibration reductions [
32]. However, these studies did not measure interior acoustics, leaving the effect of cabin noise uncertain. AVC implementation also requires additional actuators and control algorithms, which increase cost and limit feasibility in mid- to low-range vehicles. For column-assist EPS, actuator installation is further constrained by cabin space and passenger comfort. Passive noise control remains widely used to mitigate NVH in EVs. These methods rely on material properties and structural design to reduce vibration and noise without additional power or control systems. Common techniques include damping materials, isolation mounts, tuned mass absorbers, structural reinforcements, and acoustic insulation. While generally cost-effective, passive solutions are often frequency-specific and may increase vehicle weight.
Evaluating passive and active NVH mitigation typically requires complex, full-vehicle testing or advanced instrumentation, which is time-consuming and costly. This highlights the need for simplified, reliable test methods to rapidly assess secondary components such as EPS systems under realistic operating conditions. Developing such methods enables efficient comparisons of designs, materials, and control strategies, accelerating development cycles and supporting wider adoption of NVH mitigation in mid- to low-range EVs.
The present study demonstrates that a magnetic-borne noise identification method using coil sensor measurements is effective for EPS systems and can be applied in vehicle-based investigations. The coil sensor signal captures the motor’s induced voltage, reflecting steering speed variations during testing. By utilizing the EPS gear ratio and motor pole count, the rotor speed was estimated from the coil sensor signal, which subsequently served as a tachometer reference for order-tracking analysis. Acoustic data were recorded concurrently using microphones (BHS embedded), and order-tracking analysis was performed to extract velocity-dependent harmonic components from the acquired acoustic signals, effectively isolating transmission and mechanical excitations as background noise. Data processing and order-tracking analysis were conducted using Artemis software version 16.5 released December 12 2024 (
https://www.head-acoustics.com/news-events/press-releases/press-details/show/new-artemis-suite-16-5-release/, Head Acoustics GmbH, Herzogenrath, Germany), which facilitated the identification of order-dependent phenomena that would otherwise be obscured by the variable operational speed characteristic of the EPS system.
Results from multiple vehicles show that the method identifies specific frequency components associated with the motor’s magnetic structure. Notably, the 24th-order harmonic, derived from the lowest common multiple of the rotor poles and stator slots, was prominent at low steering speeds, followed by the 4th, 8th, and 12th orders at higher speeds.
The proposed methodology integrates subjective customer perception and evaluation with objective measurements conducted in an anechoic chamber, established following initial vehicle testing to verify whether observed interior acoustic phenomena correlate with EPS system operation. However, anechoic chamber measurements alone cannot reliably predict EPS acoustic behavior in real vehicle environments, as noise levels depend critically on vehicle platform architecture, specific vehicle configuration, and operational conditions. Since each vehicle platform comprises multiple distinct vehicle types with varying structural features and environmental parameters, direct translation of laboratory results to field performance requires comprehensive testing across representative vehicle configurations. Based on the comprehensive analysis presented above, it can be concluded that, from the end-user perspective, the acquisition of the selected samples yielded consistent results regardless of tire type or vehicle drivetrain configuration. Semi-anechoic chamber measurements confirmed the results obtained using the proposed method during vehicle-based testing. The observed peaks in 1/3-octave-band spectra correspond closely to the main magnetic order and its harmonics, confirming that magnetic excitation is a primary source of NVH in EPS systems. These findings validate the proposed approach, demonstrating its potential for efficient, vehicle-level assessment of EPS-related noise without extensive instrumentation and providing a practical tool to support design improvements and NVH mitigation strategies.
Finally, it should be emphasized that although the proposed method provides a clear overview of the general situation, the objective data obtained from the analysis cannot be considered definitive. For this purpose, measurements in an anechoic chamber are required. This necessity arises from several factors discussed in detail by Fyfe and Munck [
33] as well as Saavedra and Rodrigues [
34]. The most evident one, as shown in
Figure 8a,b, is the non-instantaneous acceleration. Despite the correctness of the overall trend in slope, fluctuations and local extrema are still observed during the run-up process.
