Article

Impact of the Use of Predictive Cruise Control in Freight Transport on Energy Consumption

1
AVE—MOTO, s.r.o., Tehelná 1748/5, 915 01 Nové Mesto nad Váhom, Slovakia
2
Faculty of Operation and Economics of Transport and Communications, University of Zilina, Univerzitná 8215/1, 010 26 Žilina, Slovakia
3
ProfiDrive MAN Truck & Bus Slovakia, Rožňavská 24/A, 821 04 Bratislava, Slovakia
4
Faculty of Mechanical Engineering, Lublin University of Technology, Nadbystrzycka 36, 20-618 Lublin, Poland
*
Author to whom correspondence should be addressed.
Energies 2025, 18(23), 6171; https://doi.org/10.3390/en18236171
Submission received: 5 October 2025 / Revised: 14 November 2025 / Accepted: 19 November 2025 / Published: 25 November 2025
(This article belongs to the Special Issue Performance and Emissions of Vehicles and Internal Combustion Engines)

Abstract

Current research on the performance and emissions of vehicles and internal combustion engines should include analysis of efficiency-enhancing technologies and emission reduction strategies across a variety of vehicle systems. To improve both performance and emission control, it is necessary to examine advanced heavy-duty driveline technologies, considering their real-world impact on fuel economy and emission reduction under various driving conditions. This article will deal with predictive cruise control (PCC) and its influence on the operating characteristics of a truck, specifically a semi-trailer combination. The measurement was carried out using dynamic driving tests of a truck on a selected road. The use of electronic systems for automatically maintaining the vehicle’s motion states (especially speed) based on the specified conditions most often has several benefits for the driver not only from the point of view of vehicle operation but also from the point of view of transport companies (cost reduction). It is generally known that the use of these electronic systems reduces the vehicle’s fuel consumption and therefore also reduces the amount of exhaust gases. Comparing the individual directions of the road tests, the difference in relative maximum power utilization between the driver and the PCC system was 26.42% in the ST-MY direction and 23.81% in the MY-ST direction. The use of PCC also results in fuel savings of up to 17.11%. This study provides new insights into the quantification of the impact of PCC on fuel consumption in real operating conditions and highlights the potential for integrating PCC into driver assistance systems and logistics planning to reduce costs and emissions in freight transport. Further research could focus on applying this system in specific road conditions.

1. Introduction

The transport sector is one of the most important for the economic development of regions and countries [1], but it is also one of the most energy-intensive sectors in the economy. Energy consumption in road freight transport in the form of liquid fuels, mainly diesel, is a significant component of transport costs. Other factors include taxes and road tolls, as well as labor costs for drivers and logistics center employees [2]. Road freight transport transports a variety of materials and goods, including so-called ADR (the European Agreement concerning the International Carriage of Dangerous Goods by Road), (dangerous goods) [3,4,5], food and agricultural products [6,7,8] and in various forms, e.g., bulk materials [9], liquid and gaseous materials [10,11], general cargo and containers [12,13], etc. Safety issues in road freight transport are a very important issue [14]. Particularly dangerous are damage to tires in a semi-trailer [15] related to the strength of the semi-trailer or axle damage [16] as well as those responsible for the stability of the vehicle combination and the load [17,18,19]. Interesting research on the safety of various types of trucks was presented by Vlkovský and Veselik et al. [20], who also took into account road quality in their research [21,22]. Other studies have shown the impact of fuel consumption depending on the road profile [23]. Fuel consumption is directly linked to the emission of harmful exhaust components into the atmosphere. This problem is well-known and widely discussed in the literature. Research on emissions from transport vehicles depends on many factors and is the subject of numerous studies [24,25,26,27,28,29]. To reduce negative emissions, scientists around the world are working on technical solutions and new low-emission alternative fuels. In the field of fuels, studies are emerging on the evaluation of combustion and emission characteristics in dual-fuel engines powered by compressed natural gas (CNG) and diesel [30,31] and hydrotreated vegetable oil (HVO) [32,33,34]. Yang et al. [35] investigated injection strategies for an RCCI engine fueled with diesel fuel and natural gas (NG). The impact of combustion of ethanol and diesel fuel blends on the performance of a compression-ignition engine is presented in [36]. In [37], studies of the physicochemical properties of diethyl ether and sunflower oil mixtures are presented in the context of their impact on exhaust emissions. Interesting research on the operation and maintenance of truck and bus fleets powered by biomethane-based fuel is presented in [38]. This research focused specifically on ensuring the technical safety of vehicles and reducing greenhouse gas emissions resulting from the combustion of this type of fuel. Another emerging research direction is the use of hydrogen to power combustion engines in high-powered vehicles. Such research is presented in works such as [39,40,41].
In the case of European countries, there are diverse geographical and climatic conditions, there are diverse road topologies and their networks. In addition, there are other important factors, and very often goods are transported through many countries in one transport operation (e.g., from north to south or from east to west), so it is necessary to ensure reliable and sufficiently fast transport of these goods. For these reasons, it is so important to ensure the appropriate performance of the vehicle’s drive system [42,43,44,45,46,47]. To meet the challenges of reducing fuel consumption in road freight transport, modern driver and driving assistance systems, such as adaptive cruise control (ACC), are becoming increasingly helpful. The main tasks of the ACC system are to improve the longitudinal control of the vehicle, help drivers regulate speed and follow the vehicle, which effectively reduces driving load and increases the efficiency of vehicle movement [48,49,50,51,52], which has a positive impact on improving road safety [53,54] and driving comfort [55]. Although existing ACC systems can maintain a safe following distance under certain conditions, they still face challenges regarding safety and response efficiency in complex traffic environments [52]. The impact of driver assistance systems on fuel consumption was presented in [56,57,58]. Grencik et al. [59] examined the impact of energy consumption and travel time as factors in transport mode selection. Similar studies, but focusing on route selection for intelligent vehicles with different types of powertrains, were presented in [60]. In turn, studies [61,62] presented the impact of engine power changes due to damage to electronic components and sensors. Similar studies, but focusing on vehicle system diagnostics, were conducted by Melders et al. [63].
Predictive cruise control is a system that operates based on global positioning system (GPS) technology. The system can operate by utilizing the vehicle’s kinetic energy with respect to the height and direction of the PK. The system control also takes into account the inertia of the vehicle or vehicle combination on climbs or descents, curves or entrances to towns and cities. In addition to maintaining and regulating the vehicle’s speed, the PCC system can also react to the situation in front of the vehicle and can even partially predict it based on combinations of input data. This is data from a multifunctional camera and GPS technology. The system can predict all of this data approximately 1 to 3 km in advance. Subsequently, if the system evaluates that the vehicle’s speed is too dangerous, it will reduce it so that driving through the curve or town is safe [64].
One of its main advantages is so-called predictiveness (forecasting) at a certain distance ahead of the vehicle, reducing fuel consumption by utilizing the vehicle’s kinetic energy in relation to the elevation and directional guidance of the roadway in a heterogeneous environment. For the proper functioning of the predictive cruise control (PCC), timely and primarily correct input data are required. This is ensured by electronic systems for detecting obstacles around the vehicle, which most often include sensors, radars, and cameras mounted on the vehicle. Before performing any action of the PCC, a processing of a large amount of information is necessary. This is followed by understanding the current situation based on the input data, where the subsequent step involves deciding what action the control unit (CU) should perform. The final step is the execution of the corresponding action or maneuver [65].
Basic data processed by the CU of the PCC system include communication tilt, vehicle mass, vehicle rolling resistance, basic reference speed of the vehicle, distance between vehicles, resulting reference speed of the vehicle, and the power exerted by the ICE (internal combustion engine). The subsequent execution of a specific action is carried out using actuators located in the vehicle [65].
This article presents research on predictive cruise control and its impact on the operating characteristics of a truck, specifically a tractor-trailer combination. For this purpose, measurements were conducted using dynamic driving tests of the truck combination on a selected road section, taking into account its parameters and the main vehicle parameters. The paper is structured as follows: Section 1 presents the importance of predictive cruise control; Section 2 presents the research methodology; and the next section presents the experimental results and their discussion. The final section summarizes the conducted research, its main results, and directions for further research in this area.
Despite the increasing pressure to reduce emissions and costs, logistics companies face the challenge of optimizing fuel consumption while ensuring efficient and reliable transport of goods. While current PCC systems have demonstrated their potential for reducing fuel consumption, their effectiveness can be influenced by the variability of topographic conditions and traffic situations. This study aims to address these limitations through a detailed analysis of the impact of PCC on fuel consumption under different topographic conditions and the development of a strategy for its integration into driver assistance and logistics planning systems. This research seeks to provide insights that can inform both operational decisions within freight companies and the development of policies aimed at promoting more sustainable transportation practices.
Therefore, this study aims to address the aforementioned limitations and contribute to a better understanding of PCC’s potential in real-world freight transport. The specific objectives of this research are:
-
To assess the fuel-saving potential of Predictive Cruise Control (PCC) in real-world driving conditions on a mixed-terrain route;
-
To compare the operational characteristics (speed, engine power utilization, fuel consumption) of a heavy-duty vehicle equipped with PCC to those of a manually driven vehicle on the same route;
-
To quantify the impact of PCC on specific effective fuel consumption under the defined testing conditions.
By achieving these objectives, this study seeks to provide valuable insights for freight companies, policymakers, and researchers interested in improving the energy efficiency and sustainability of road freight transport.

2. Materials and Methods

For the measurement, dynamic driving tests were conducted in an outdoor environment. During the tests, a tractor with a tarpaulin semi-trailer was used because the advantages of predictive cruise control are much more significant for heavy trucks in road freight transport than for passenger cars. This is because, in heavy vehicles, even small changes in speed lead to greater variations in fuel consumption compared to passenger vehicles. The measurement was performed using a MAN TGX 18.470 4 × 2 LL SA tractor (produced by MAN Trucks Sp. z o. o., Niepołomice, Poland), with a tarpaulin semi-trailer (Figure 1).
The manual driving tests were conducted by a professional driver with extensive experience and training in operating vehicles of this type. The driver is also a certified instructor who trains other drivers on proper and efficient vehicle operation.
The vehicle is equipped with a diesel internal combustion engine with a power of 346 kW at 1800 rpm, a cylinder displacement of 12,419 cm3, and an automatic transmission with 14 gears. The overall weight of the vehicle combination is 21,300 kg, and the front surface area of the vehicle is 9.97 m2 [66].
The vehicle also includes the MAN telematics system—RIO box, which forms the technical part of the MAN Efficient Cruise system. The MAN Efficient Cruise system allows the driver to choose among four ECO levels (I to IV). At ECO level I, deviation from the set speed is minimal, making it suitable for high traffic intensity and bad weather conditions. Conversely, at ECO level IV, deviation from the set speed is maximal, making it suitable for low traffic intensity and optimal for highway driving [67].
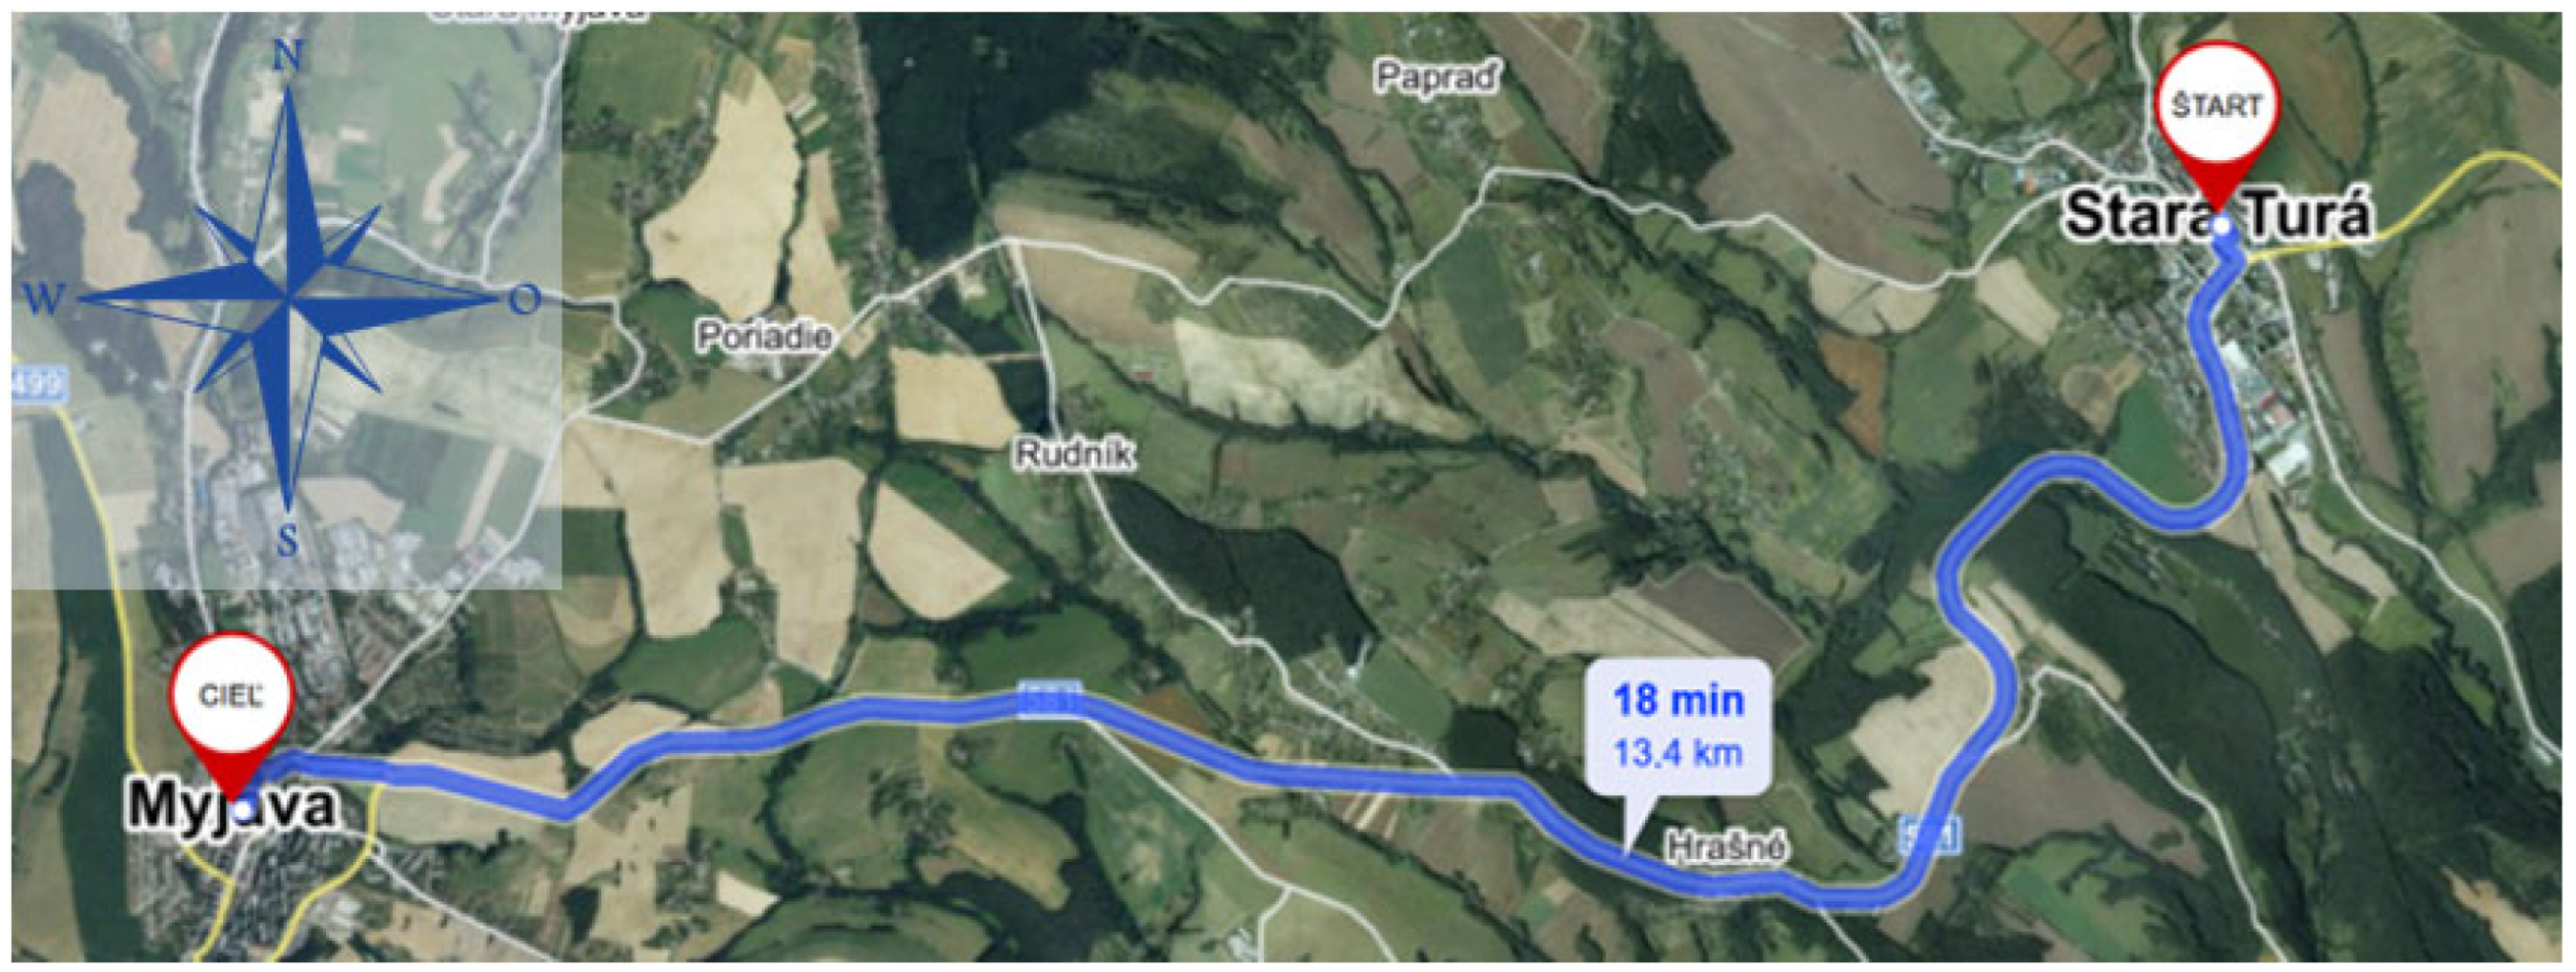
To compare the greatest advantages of predictive cruise control, such as vehicle inertia or kinetic energy, travel distance utilization, smooth speed changes, and topography in relation to the driver, the following route was designed. The route is characterized by frequent changes between ascending and descending terrain, directional curves, and frequent changes in the maximum allowed speed. The route is located between the towns of Stará Tura (ST) and Myjava (MY). These towns are connected by a second-class road, specifically II/581. The directional and elevation profile of the route is shown in Figure 2 and Figure 3.
The test route was deliberately chosen to include various types of terrain and driving situations that are typical for long-haul freight transport in [region/country]. The route includes a combination of ascents, descents, curves, and sections with different speed limits to simulate real-world operating conditions. The route selection considered the need to evaluate the impact of PCC on fuel consumption in various driving modes.
Although the test route represents a specific section of a Class II Road in [region/country], its characteristics (mixed profile, variable speed limits) are comparable to many other routes commonly used in freight transport. The aim of the study was not to achieve universal validity of the results for all routes, but rather to demonstrate the potential of PCC for fuel savings in real operating conditions.
Weather conditions (wind speed, wind direction, and temperature) were recorded at four key points along the route (marked as 1, 2, 3, and 4 in Figure 3) to account for their potential influence on fuel consumption. These points represent: 1—the starting point, 4—the endpoint, 2—the lowest elevation point, and 3—the highest elevation point of the route.
During the measurement, additional laboratory techniques were used, such as a meteorological station, an anemometer, a wind vane, a smartphone with an application for capturing the vehicle’s real-time position and speed, and the vehicle’s telematics system—MAN RIO box. The measurement was conducted during the nighttime hours to eliminate interference from traffic, which could affect the results of individual measurements. The measurement process can be divided into three main phases: the preparatory phase, the measurement phase, and the final phase.
In the preparatory phase, a check was performed on the communication and the weather conditions. Subsequently, the vehicle was loaded with a weight of 7000 kg, which represents the most frequently transported cargo by the measured vehicle. Then, a vehicle inspection was carried out along with securing the load, and participants were briefed about the measurement procedure. In the final step of this phase, the vehicle was brought to the initial measurement station, where the combustion engine was also conditioned.
For data that were recorded continuously throughout the entire measurement, a graphical evaluation is also provided. To evaluate the individual operational characteristics, measures of central tendency and measures of variability are used. The aim of using these characteristics is to provide factually correct information about the course of the individual operational characteristics through numerical indicators. The basic measures of central tendency and measures of variability include:
  • Arithmetic mean;
  • Range;
  • Mean deviation;
  • Variance;
  • Standard deviation.
These characteristics are used in the statistical evaluation of data for both directions separately, because the route is uphill in one direction and downhill in the opposite direction, which can affect the results due to different values for each direction.
The first operational characteristic is fuel consumption expressed in L/100 km. The arithmetic mean can be calculated using the following formula:
x ¯ = i = 1 m x i n
where
x ¯ Simple arithmetic mean [L/100 km];
i = 1 m x i Sum of individual values [-];
n Total frequency [-].
The range expresses the difference between the maximum and minimum values of the statistical set and was calculated based on the following formula:
V r = x m a x x m i n
where
V r Range [L/100 km];
x m a x Maximum value of the statistical set [L/100 km];
x m i n Minimum value of the statistical set [L/100 km].
The mean deviation expresses the average deviation of the value of a statistical character of each statistical unit from some characteristic of the measures of central tendency, most often from the arithmetic mean. The mean deviation was calculated using the formula:
d ¯ = i = 1 m x i x ¯ n
where
d ¯ Mean deviation [L/100 km];
i = 1 m x i x ¯ Sum of absolute values of deviations of the statistical character [L/100 km];
n Total frequency [-].
Variance expresses the arithmetic mean of the squares of the deviations of the values of the statistical character from the arithmetic mean. This means that the greater the variance, the more the data deviate from the mean. The variance is calculated using the following formula:
σ 2 = i = 1 m x i x ¯ 2 n
where
σ 2 Variance [L/100 km];
i = 1 m x i x ¯ 2 Sum of the squared deviations of the statistical character [L/100 km];
n Total frequency [-].
From a mathematical point of view, the standard deviation expresses the square root of the variance. In essence, it is the average difference between the values of statistical units and the arithmetic mean. The standard deviation was calculated using the following formula:
σ = i = 1 m x i x ¯ 2 n
where
σ Standard Deviation [L/100 km];
i = 1 m x i x ¯ 2 Sum of the squared deviations of the statistical character [L/100 km];
n Total frequency [-].
In order to compare the PCC system with the driver and identify the key factors influencing fuel consumption, correlation analysis was used. This statistical method allows quantifying the linear relationship between operational characteristics through the correlation coefficient [40]. The correlation coefficient can be calculated based on the following formula:
r x y = n · i = 1 n x i · y i i = 1 n x i · i = 1 n y i n · i = 1 n x i 2 i = 1 n x i 2 · n · i = 1 n y i 2 i = 1 n y i 2
where
r x y Correlation coefficient [-];
n Total frequency [-];
i = 1 n x i · y i Sum of the partial products of variables X and Y [-];
i = 1 n x i Sum of variable X [-];
i = 1 n y i Sum of variable Y [-].
The measurement phase followed, involving the installation of all measurement instruments and devices, and performing the actual measurement. Throughout the process, weather conditions such as wind speed and direction, ambient temperature, and air pressure were continuously recorded. The operational parameters of the vehicle monitored during the measurement included: fuel consumption in liters per 100 km, vehicle weight in kilograms, time in seconds, distance traveled in kilometers, vehicle altitude in meters above sea level, and vehicle speed in kilometers per hour.
In the first part of the measurement, the driver traveled along the designated route, with the task to simulate a typical driving style, utilizing the maximum permitted speeds on the measured road segment and dynamic vehicle properties as much as possible. This simulates the typical driving style in road freight transport on automotive lines—aimed at saving transport time. However, on some sections, due to the vehicle dimensions and the curves of the road, it was not possible to adhere to the maximum speed limit. In such cases, the vehicle’s speed was adjusted for safety and the specific situation.
The next step was to perform the measurement using the predictive cruise control system. In this case, the driver set the maximum permitted speed for each segment using the cruise control lever, except on sections where safety and vehicle dimensions prevented it. Also, throughout the measurement, the maximum ECO level, i.e., level IV, was set to assess the highest possible system efficiency of the PCC compared to the driver. The ECO levels are adjustable via the steering lever. In both cases, the measurement was performed three times to allow for statistical evaluation. After completing all measurements, a check of all recorded data was conducted.
The final phase of the measurement involved driving the vehicle in maneuvering mode, exporting all data, and subsequent data processing.

3. Results and Discussion

This section presents the results of the statistical analysis, comparing the operational characteristics of the driver and the PCC system. The data is presented in tabular form, followed by a percentage evaluation of the PCC system’s efficiency.

The Processing of Recorded Data

All values of the statistical evaluation of the driver’s operational characteristics are presented in the following table for both directions separately.
In the next step, the same statistical evaluation is performed for the PCC system, where all values of the measures of central tendency and measures of variability are presented in the following table for both directions separately.
When comparing the driver and the PCC system, it can be noted that all values of the measures of central tendency and measures of variability in the case of the PCC system are lower compared to the driver. This means that when using the PCC system, there is a better course of operational characteristics in all aspects. From this, it can be inferred that it is more efficient to use the PCC system for the purpose of efficient vehicle operation, and thus also lower fuel consumption. Therefore, a percentage evaluation will be performed in the following section to determine by how many percent the PCC system is more efficient than the driver.
In this section, the processing and calculation of individual operational and external characteristics of the vehicle were performed. These include, for example, fuel consumption [liters], specific effective fuel consumption [grams per kilowatt-hour], vehicle rolling resistance [N], acceleration and deceleration of the vehicle [m·s−2], number of speed changes [-], number of speed changes per second [-], number of climbed and descended speed kilometers [kmph], force on the wheels [N], power exerted by the engine [kW], the proportion of time the internal combustion engine (ICE) was working (in traction), and the relative utilization of the maximum engine power [%].
For the accurate calculation of derived operational characteristics, such as the force on the wheels [N] and the power exerted by the engine [kW], standard equations of vehicle dynamics were applied. These calculations incorporated specific vehicle parameters, including the aerodynamic drag coefficient (CdA) and the rolling resistance coefficient (Cr). The values for these coefficients were determined based on technical documentation for the MAN TGX 18.470 4 × 2 LL SA vehicle (produced by MAN Trucks Sp. z o. o., Niepołomice, Poland), supported by industry standards for heavy-duty trucks [41]. These derived metrics were crucial inputs for evaluating fuel consumption and engine utilization, which are central to the findings presented in this section and in the Conclusions.
To provide a more complete picture of the fuel consumption results, we have calculated the standard deviation and 95% confidence intervals for each direction and driving mode.
Driver:
  • In the ST-MY direction, the average fuel consumption was 37.35 L/100 km with a standard deviation of 0.32 L/100 km. The 95% confidence interval is (36.71 L/100 km, 37.99 L/100 km).
  • In the MY-ST direction, the average fuel consumption was 26.43 L/100 km with a standard deviation of 2.01 L/100 km. The 95% confidence interval is (24.41 L/100 km, 28.45 L/100 km).
PCC:
  • In the ST-MY direction, the average fuel consumption was 31.01 L/100 km with a standard deviation of 0.23 L/100 km. The 95% confidence interval is (30.78 L/100 km, 31.24 L/100 km).
  • In the MY-ST direction, the average fuel consumption was 24.41 L/100 km with a standard deviation of 0.035 L/100 km. The 95% confidence interval is (24.34 L/100 km, 24.48 L/100 km).
These results provide a more complete picture of the fuel consumption characteristics for each driving mode and direction. The relatively narrow confidence intervals for the PCC system suggest more consistent fuel consumption compared to the driver. To further assess the statistical significance of the observed differences in fuel consumption between the driver and the PCC system, we performed paired t-tests for each direction. The results indicate a highly statistically significant difference in fuel consumption in the ST-MY direction (p < 0.001), suggesting that the PCC system significantly reduces fuel consumption compared to the driver in this direction. However, the difference in fuel consumption in the MY-ST direction was not statistically significant (p ≈ 0.19).
Due to the large amount of measured data, only the values of operational characteristics of individual measurements directly related to the vehicle’s fuel consumption are provided below. For this purpose, a correlation analysis was performed between the individual operational characteristics and fuel consumption. Only those characteristics with a correlation coefficient higher than 0.4 are analyzed. This threshold was chosen to focus on the operational characteristics that have a reasonably strong relationship with fuel consumption and are therefore most relevant for improving fuel efficiency. This is to ensure that only characteristics which significantly influence fuel consumption—critical for the transport company, especially concerning variable costs and market competitiveness—are compared. The correlation coefficient ranges from <−1; +1>. Values higher or lower than ±0.7 indicate a strong direct or inverse dependence, while values within the interval <−0.4; −0.7> or <0.4; 0.7> indicate a moderate direct or inverse dependence. A strong dependence can be explained, for example, in physical phenomena where heating an object to a certain temperature causes it to expand by a specific amount, and this rule always applies during repeated heating.
However, in this particular issue, the human factor comes into play, whose behavior cannot be unequivocally defined as in the case of heating an object. Drivers often vary their driving style depending on feelings or their immediate physical and mental state (e.g., if they are tired, they reduce speed for safety reasons; in other cases, they may increase speed to reach the destination faster and rest afterwards). Therefore, the values within the interval for moderate dependence will be considered sufficient for mutual relationship.
The operational characteristics that have a correlation coefficient higher than ±0.4 with fuel consumption include:
  • Average vehicle speed [kmph]—0.44;
  • Number of climbed and descended speed kilometers [kmph]—0.61;
  • Relative utilization of maximum engine power [%]—0.91;
  • Average specific effective fuel consumption [grams per kilowatt-hour]—0.97.
In the following Table 1, the absolute and relative differences in operational characteristics for different directions, both combined and separately, are shown, particularly when they have a correlation coefficient with a higher or lower value than ±0.4.
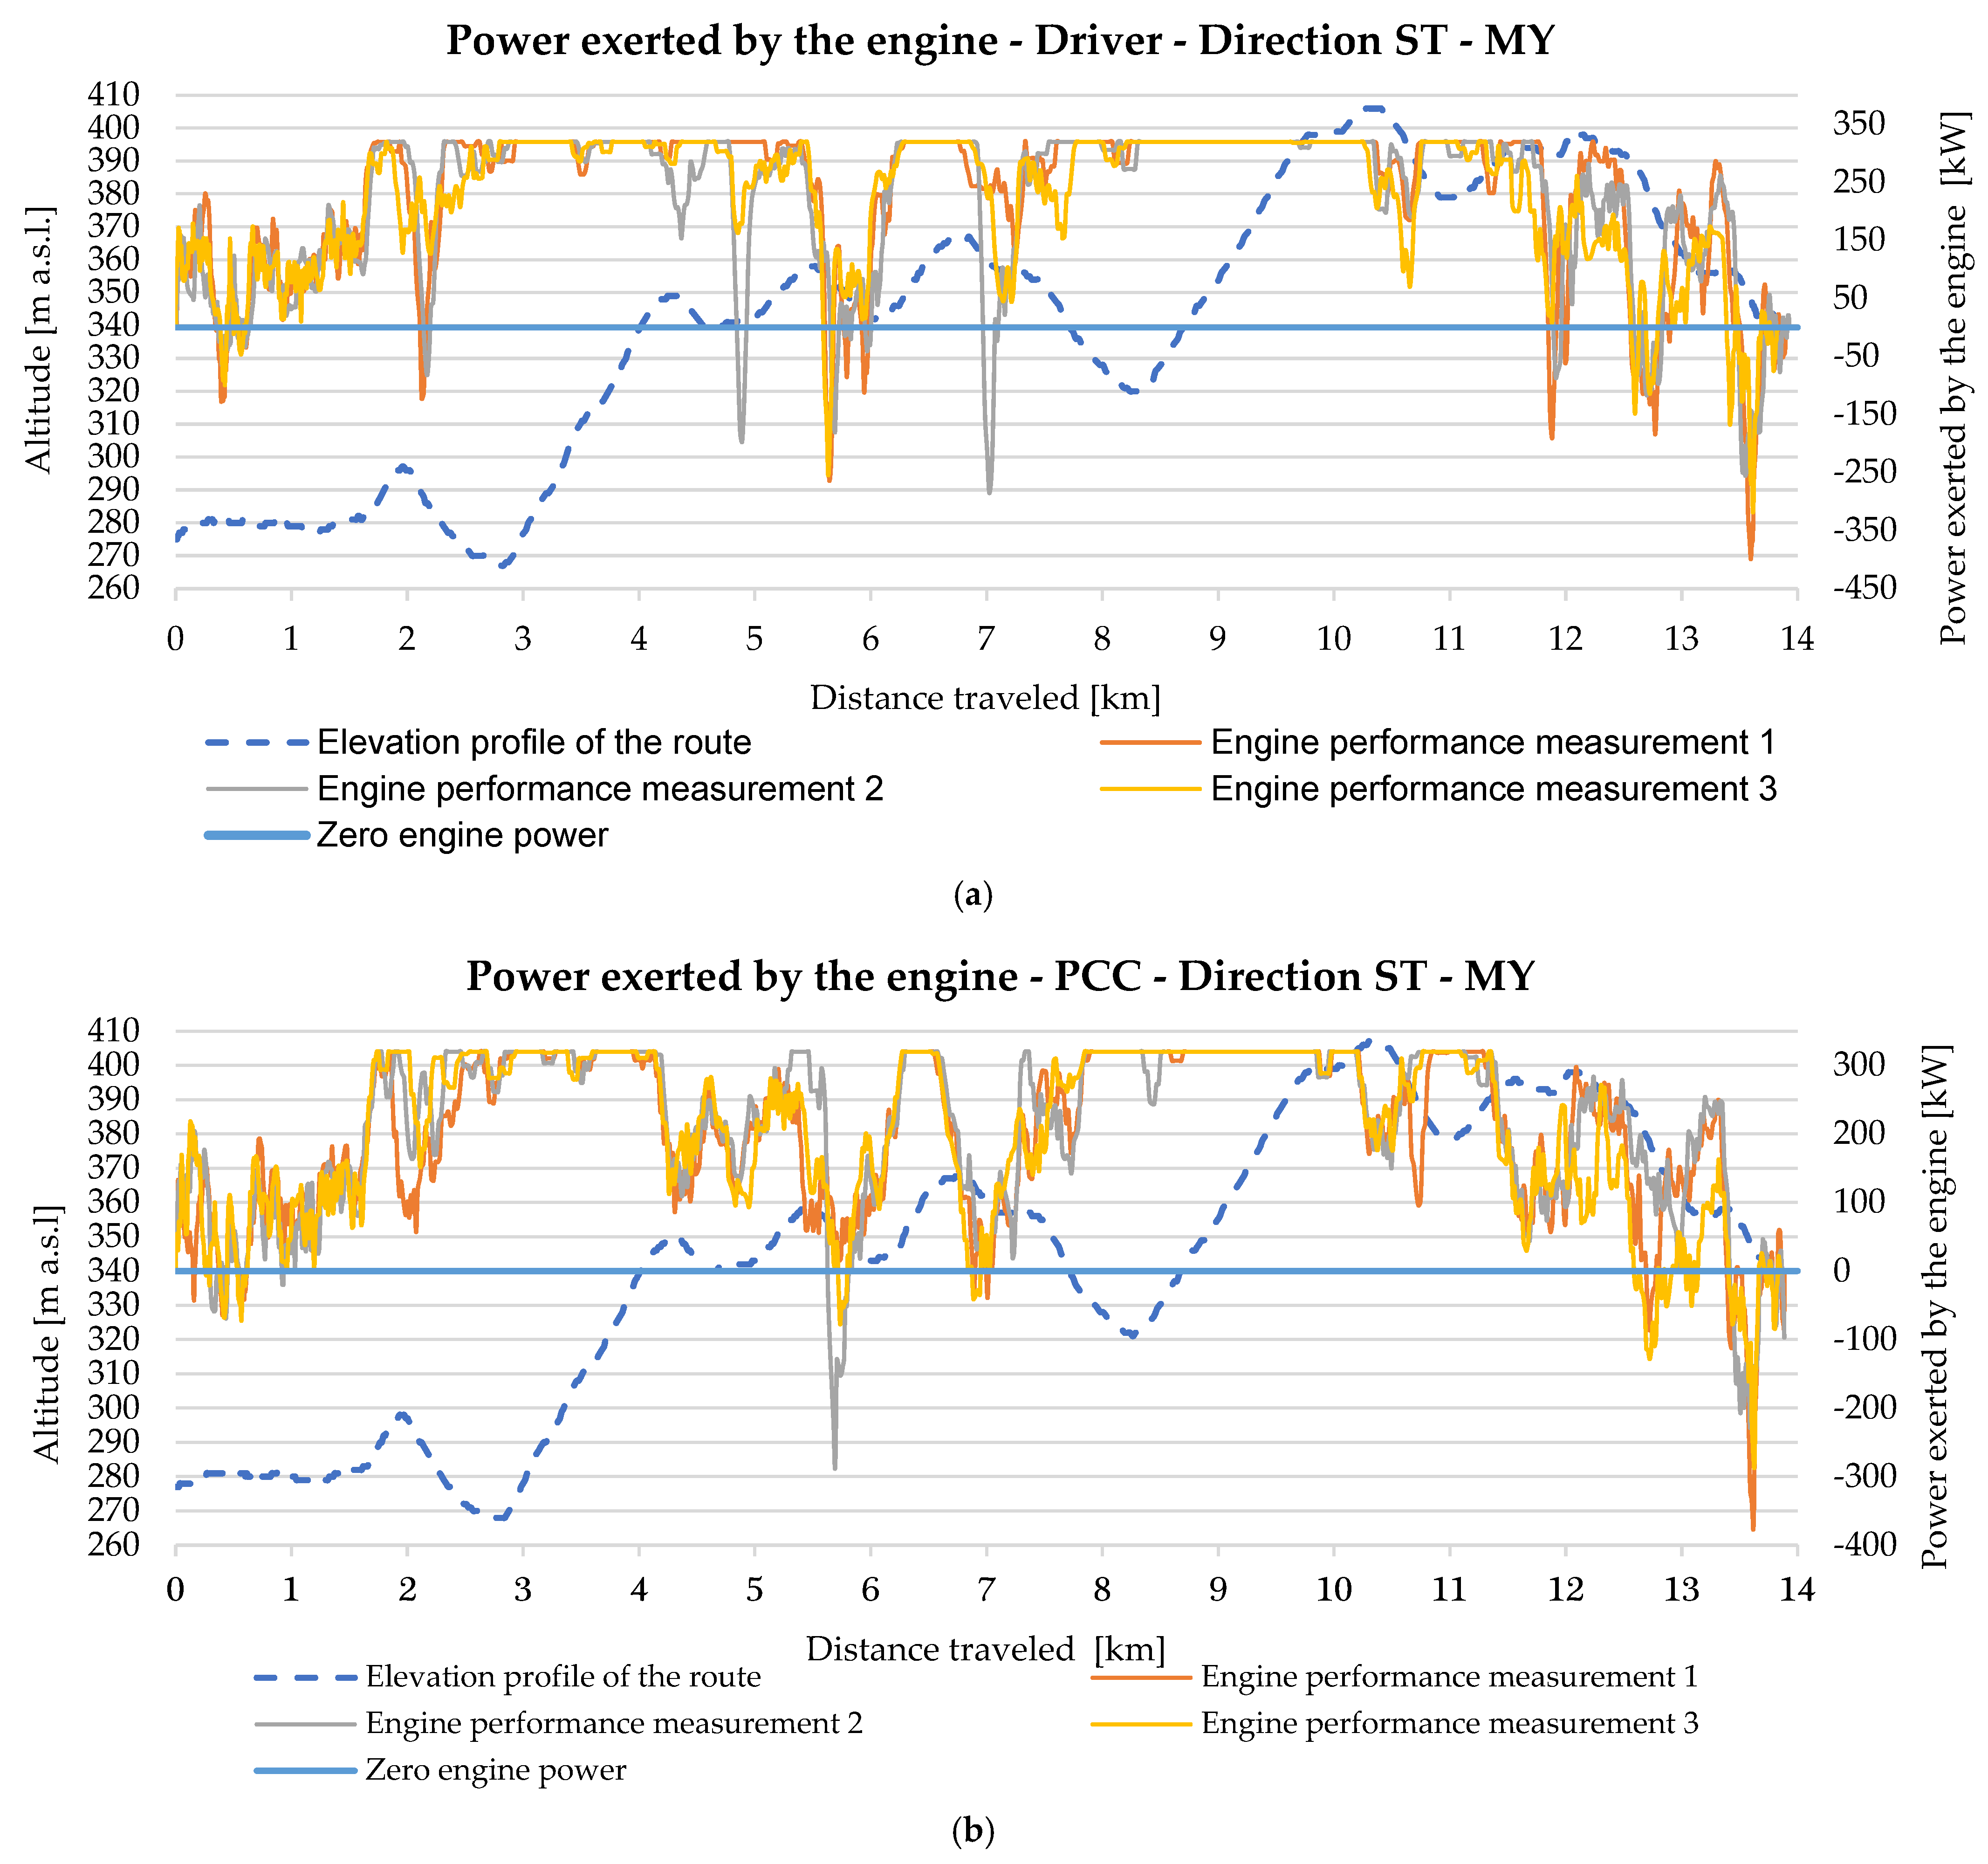
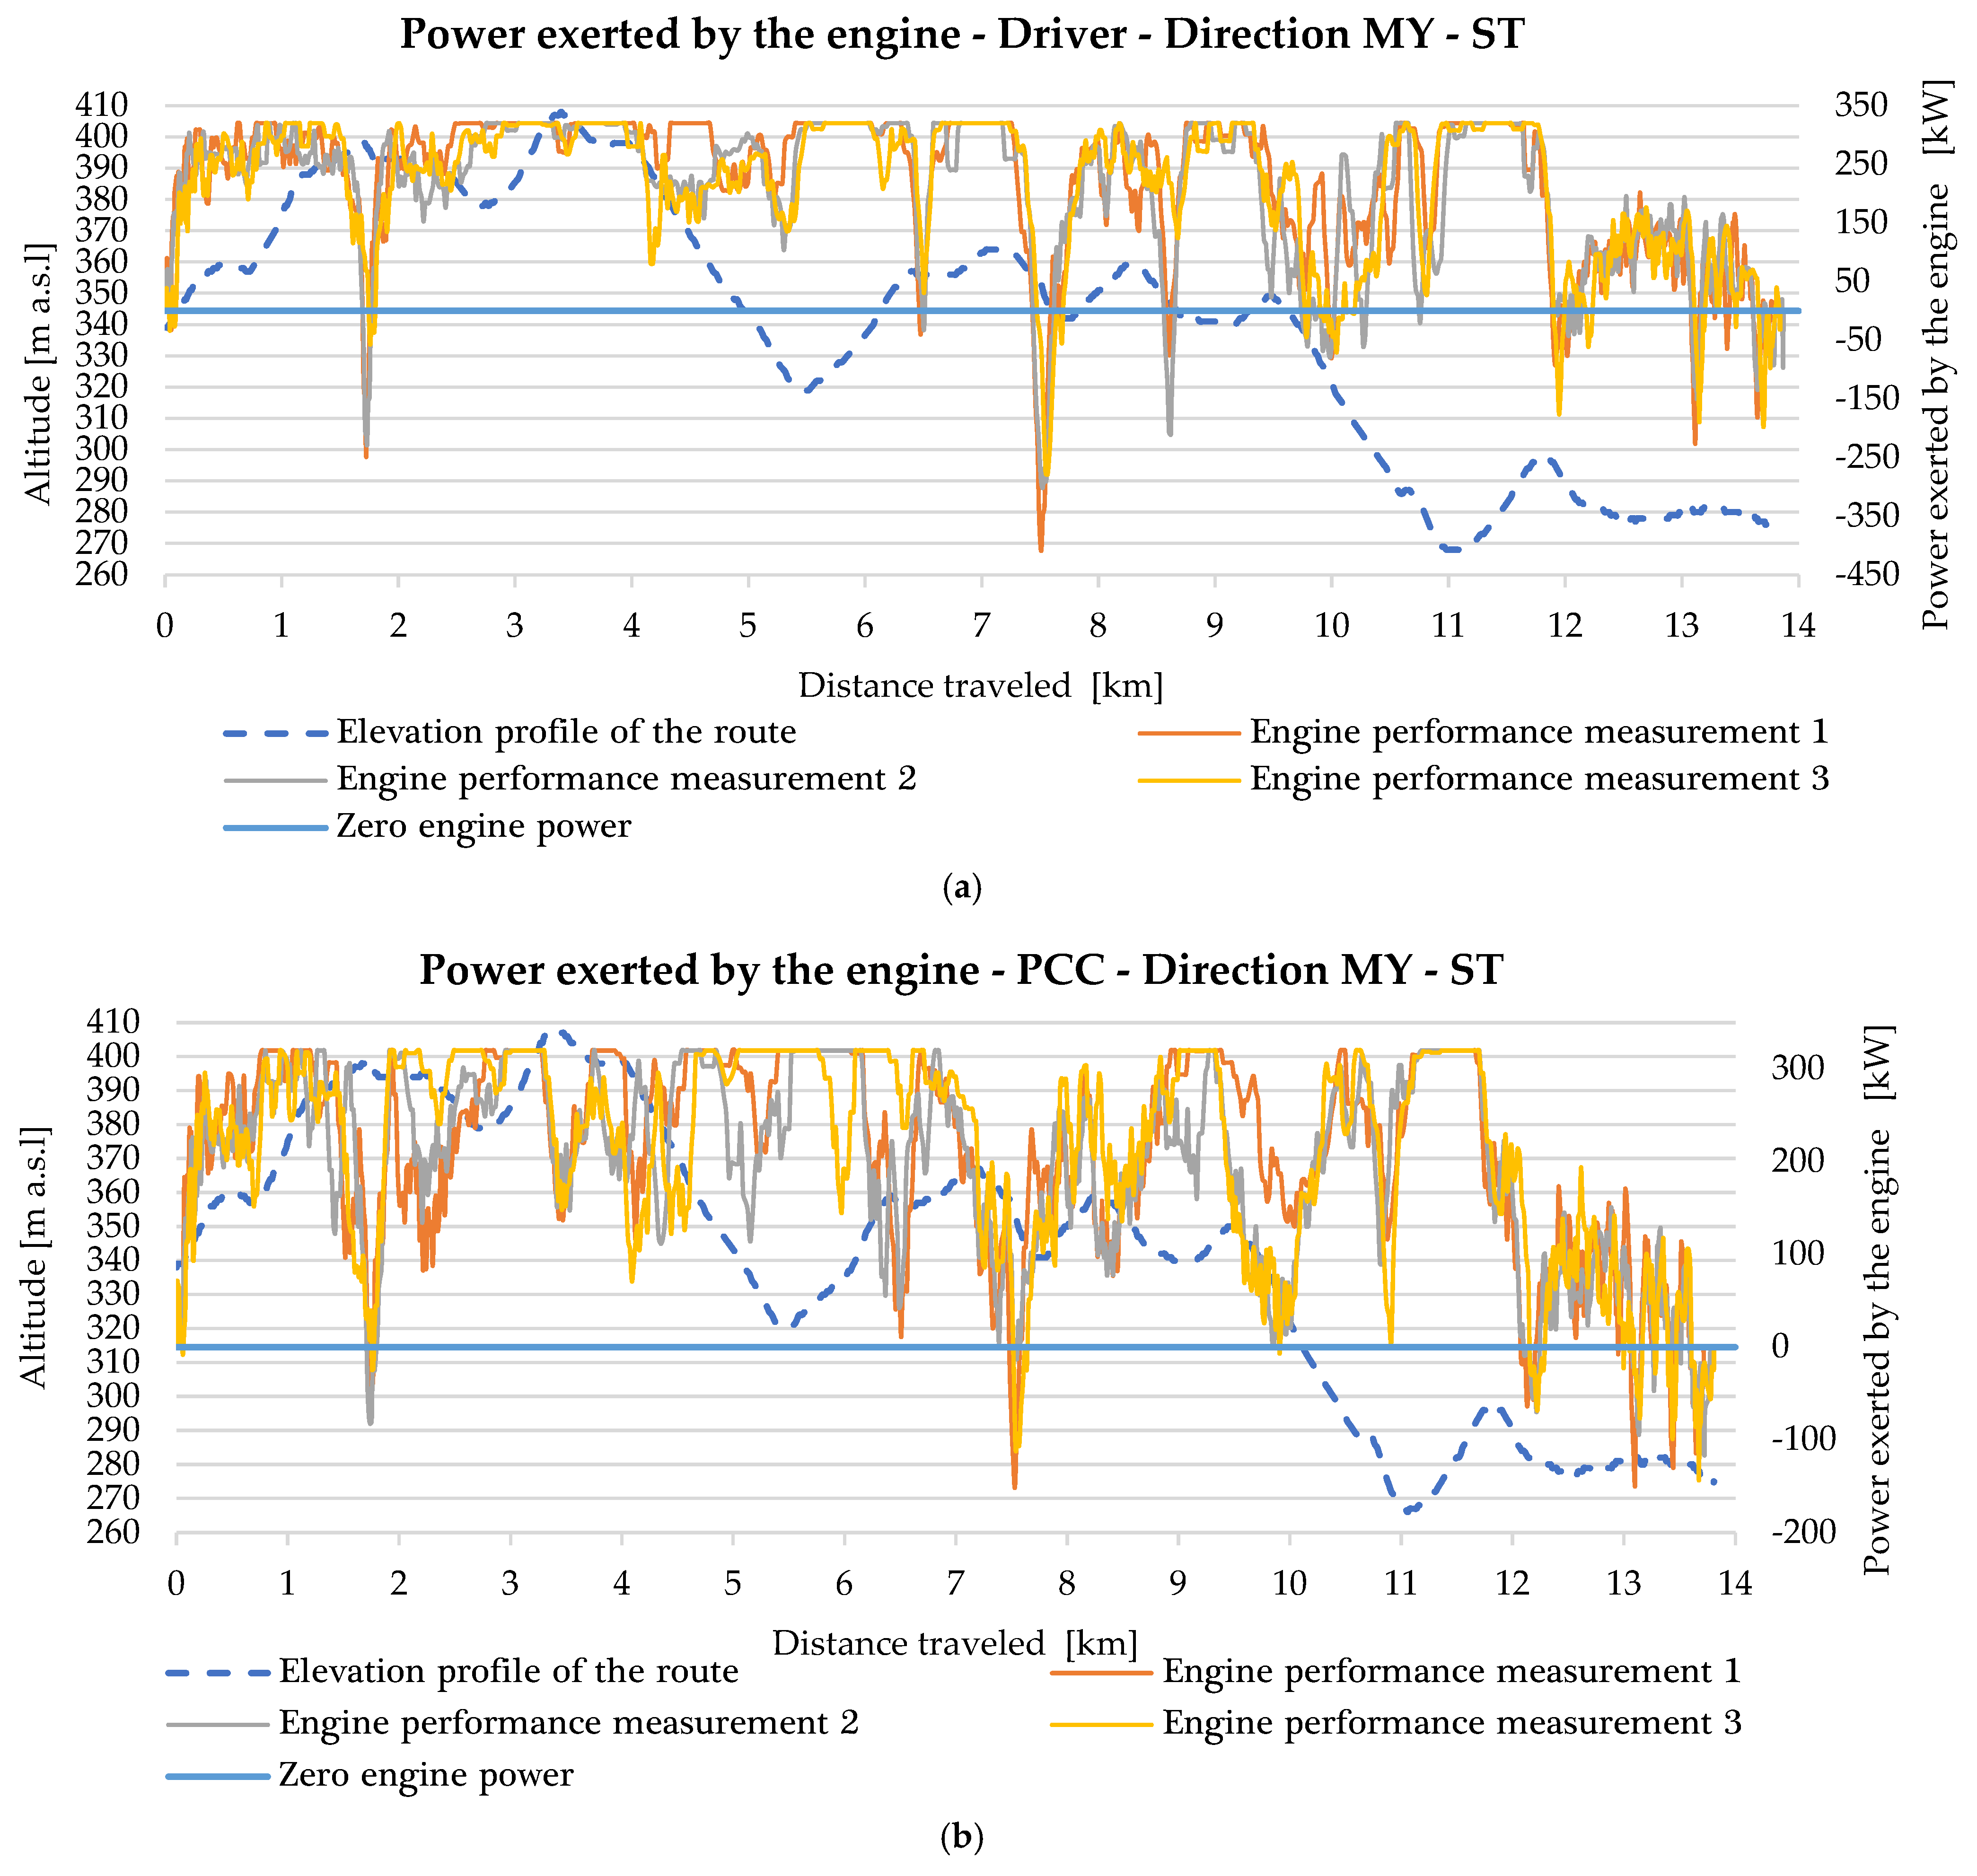
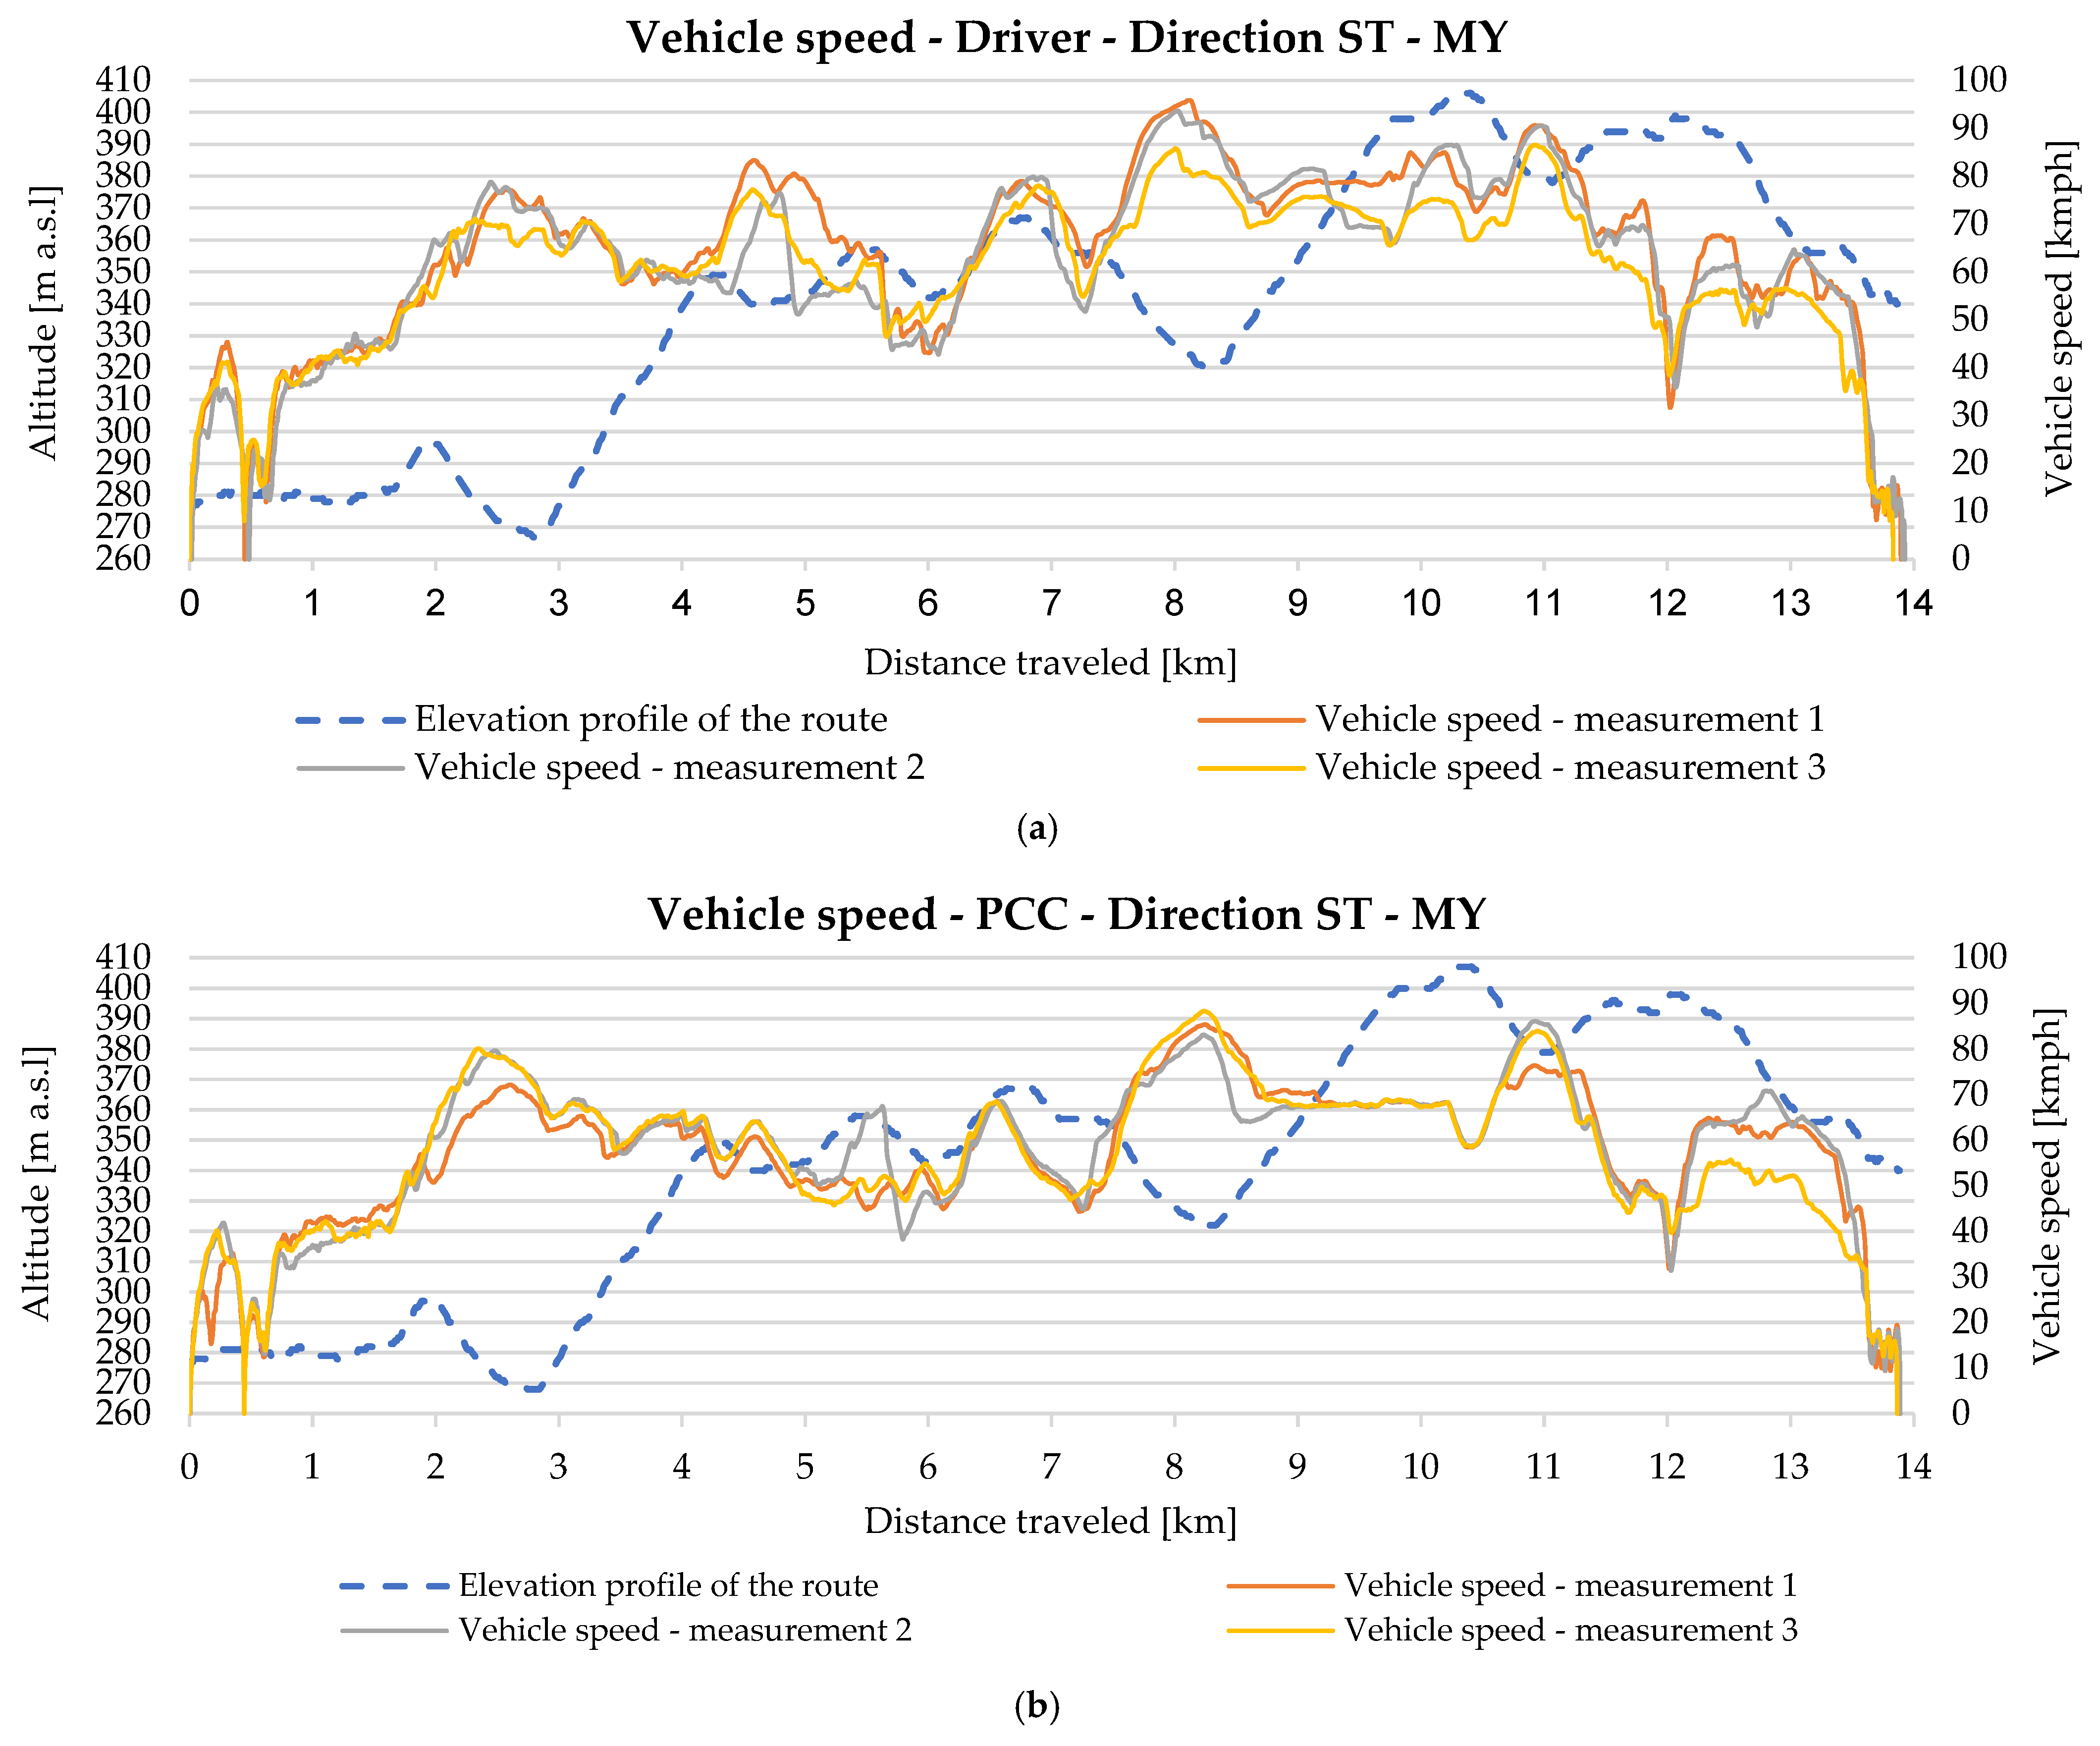
To better illustrate the course or comparison of how the driver behaves in relation to the predictive cruise control, the graphs of vehicle speed and the engine power exerted are provided below. The individual power curves are generated from moving averages of the engine power values. This is because the individual engine power curves would oscillate significantly. Additionally, the system or vehicle itself uses various algorithms (e.g., Levenberg–Marquardt algorithm) to smooth out the various characteristics, ensuring stable vehicle operation even if the input data of some parameters change abruptly [65].
By comparing the engine power curves in Figure 4 and Figure 5, it can be observed that the driver more frequently reached the maximum engine power of the system compared to the PCC system. The driver most often utilized the maximum engine power when overcoming inclines and immediately afterward. This is because the driver reacted later to changes in the road gradient, resulting in situations where the engine reached its maximum power even on level ground or just after descent had begun. Subsequently, the vehicle achieved higher speeds before the start of the descent, and during downhill driving when the driver used engine braking, the engine more frequently exhibited higher negative power values compared to the PCC system.
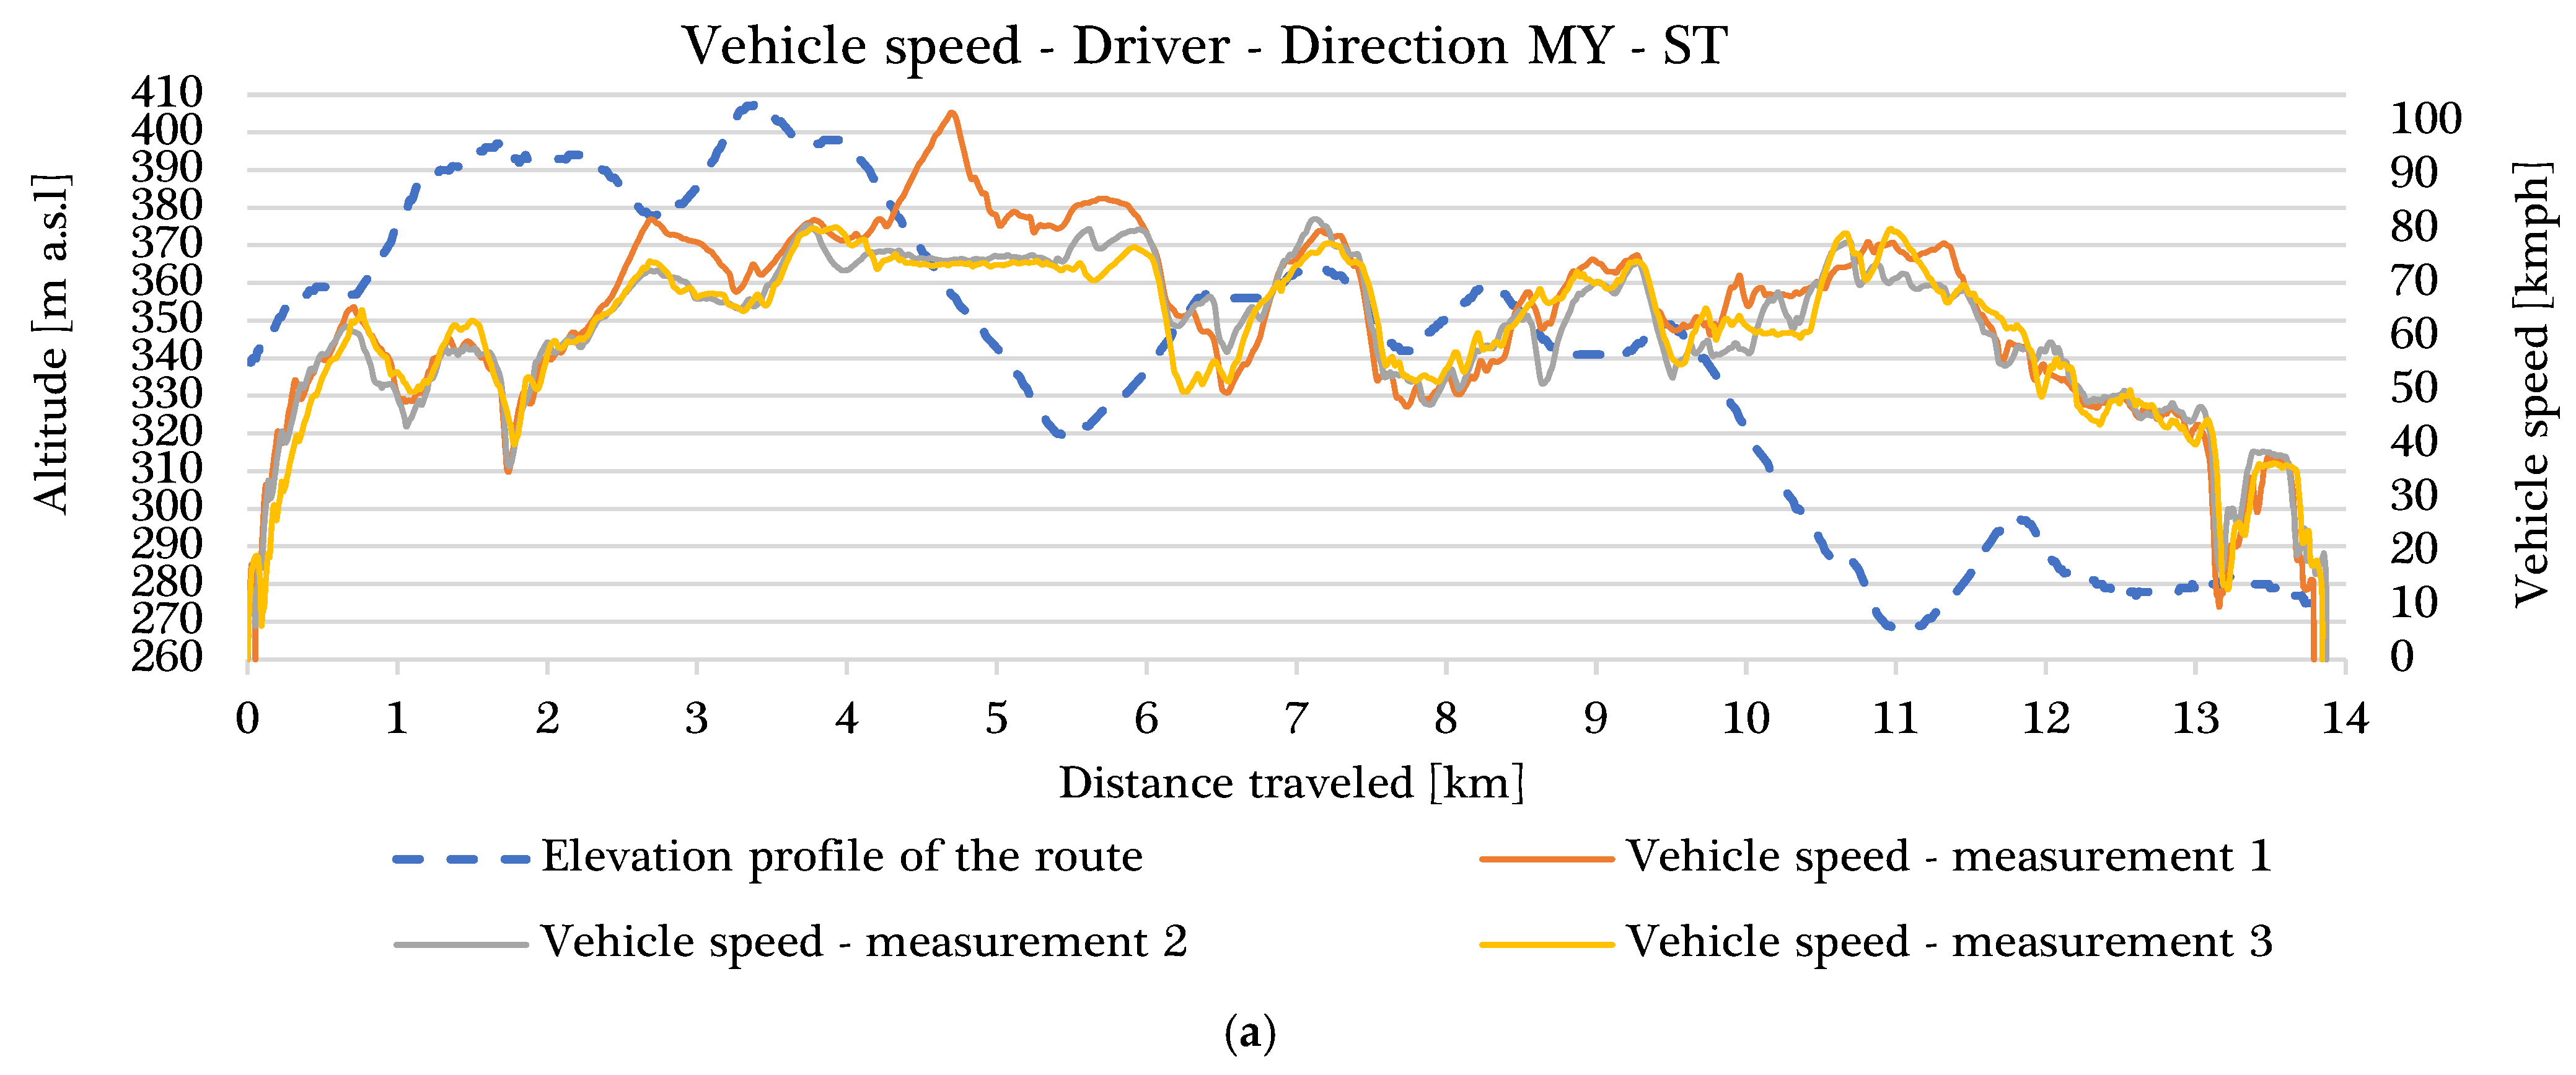
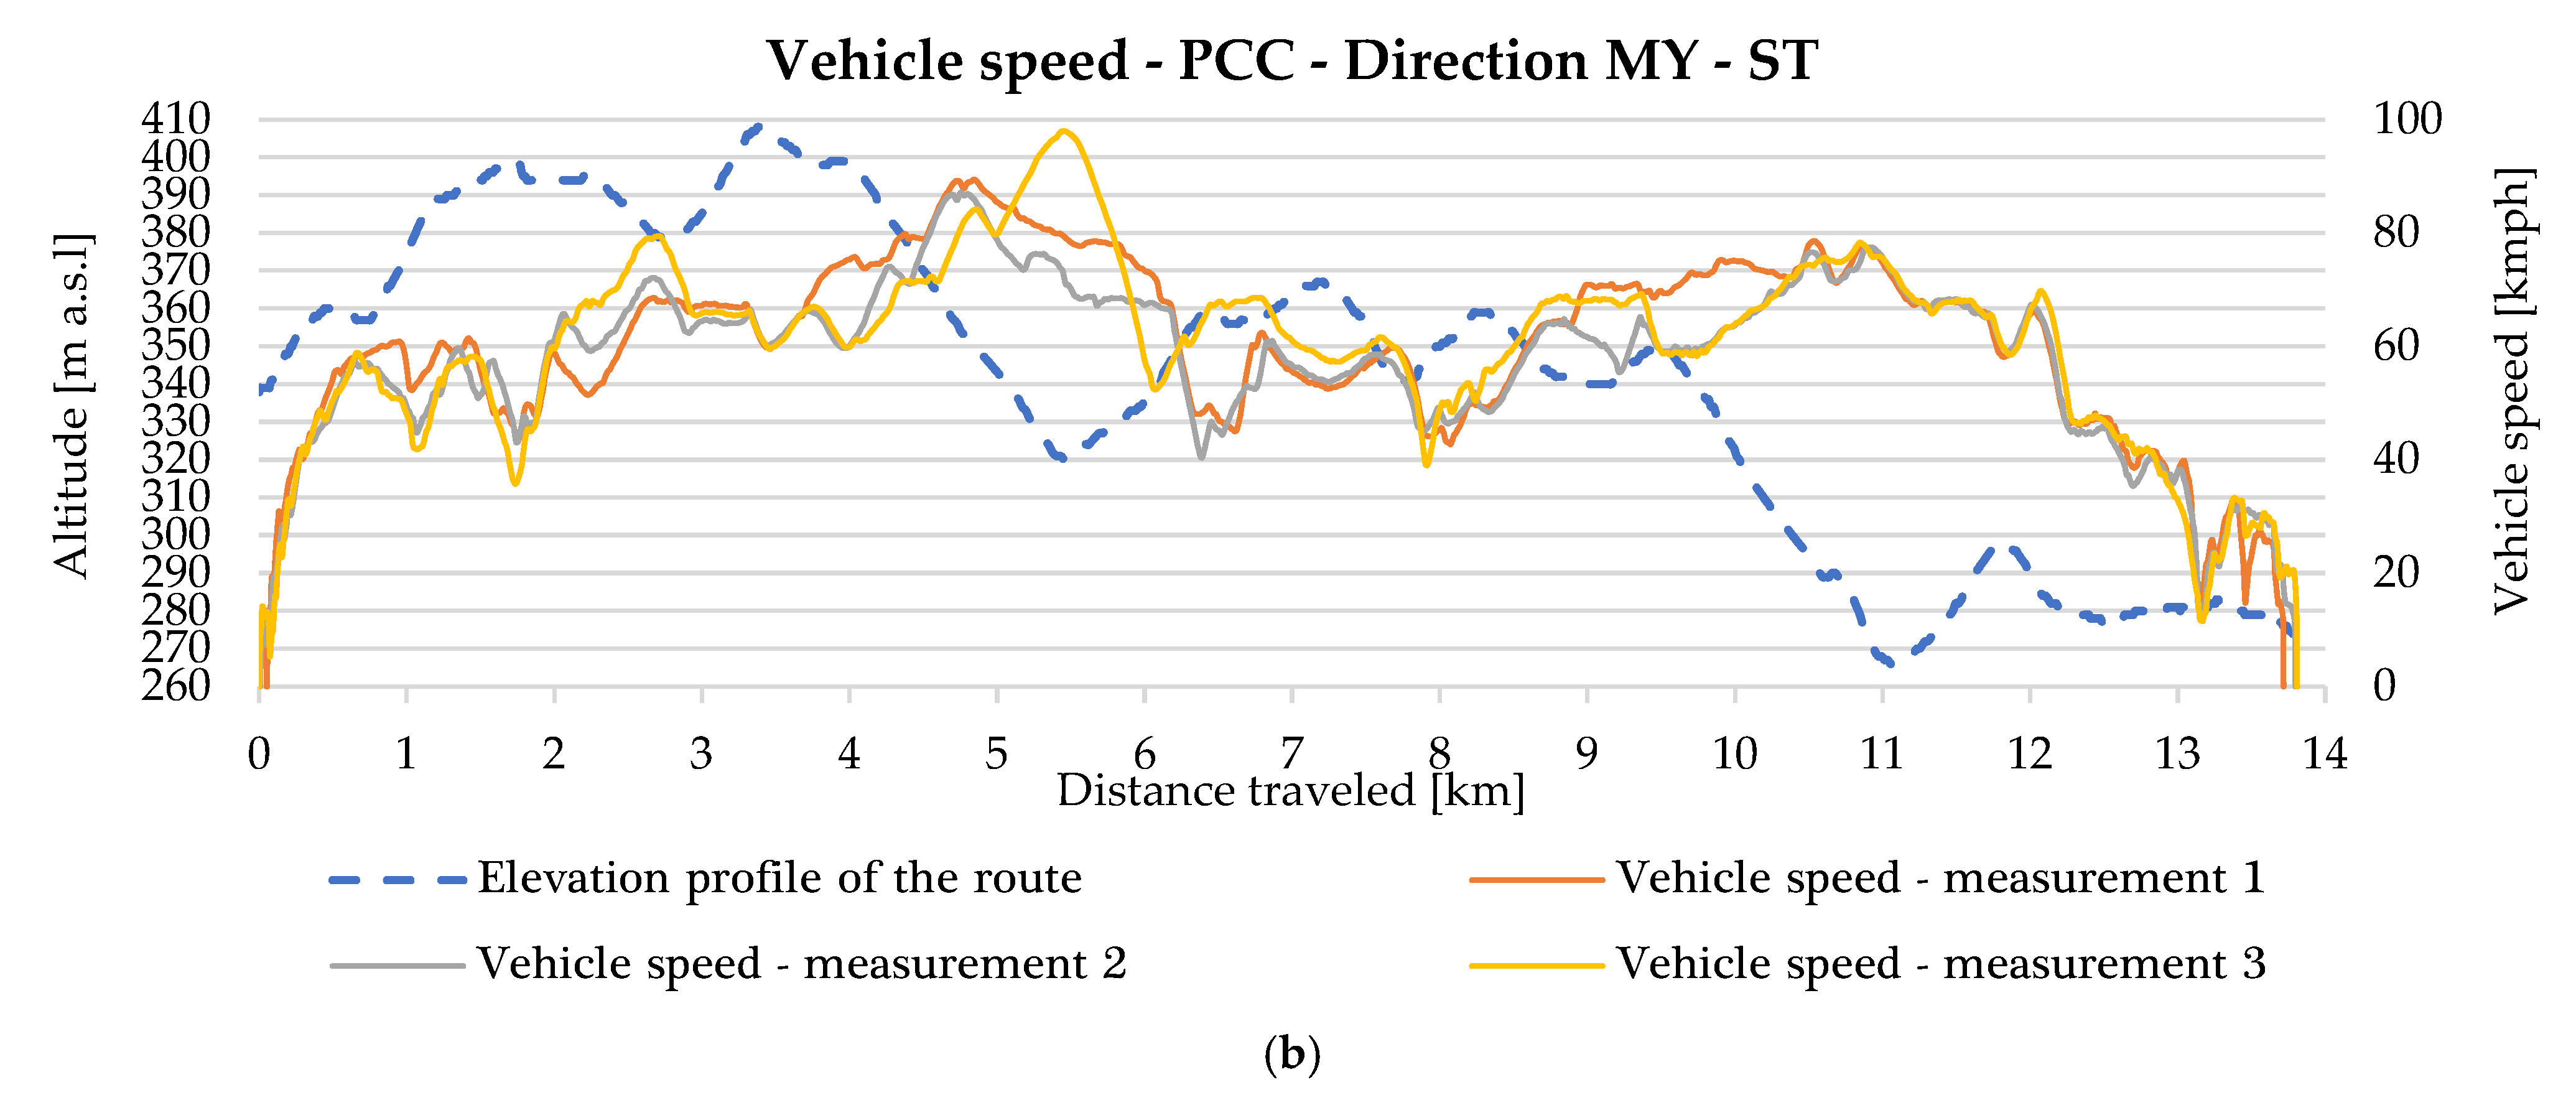
On Figure 6 and Figure 7, it can be seen that the vehicle speed profiles for the individual measurements with the PCC system have very similar shapes, with most of the curves overlapping. Conversely, the speed profiles executed by the driver only partly overlap and do not share the same pattern. Therefore, it can be concluded that when repeating the route, the PCC system will always behave consistently, with only minor differences compared to the driver. Additionally, the vehicle speed curves produced by the PCC system are more stable than those recorded during driver-operated driving.
The observed differences in engine power utilization and vehicle speed profiles between the driver and the PCC system directly translate into the reported fuel savings. The PCC’s ability to anticipate road topography allows for proactive management of the vehicle’s kinetic and potential energy. For instance, by “reading” upcoming descents, PCC can initiate coasting or optimized engine braking earlier, reducing the need for aggressive mechanical braking which dissipates kinetic energy as heat. Conversely, approaching ascents, PCC can strategically build momentum or avoid unnecessary acceleration just before the gradient changes, preventing the engine from frequently operating at high, less efficient power outputs, as frequently seen with manual driving. This optimized energy flow ensures that the engine operates more consistently within its most fuel-efficient load and speed ranges, contributing significantly to lower specific effective fuel consumption. While a human driver typically reacts to the current road conditions and prioritizes factors like journey time and safety, the PCC system is explicitly programmed for fuel economy based on predictive information. This fundamental difference in control strategy leads to smoother speed transitions, fewer instances of harsh acceleration or deceleration, and a more deliberate utilization of the vehicle’s inertia, ultimately minimizing energy losses. These control behaviors are analogous to an expert eco-driver who consistently plans ahead, but executed with greater precision and consistency by the automated system. The discussed fuel savings directly contribute to reduced operational costs for freight fleet operators and, as quantified in the Section 4, also lead to a meaningful reduction in CO2 emissions per 100 km.
To compare the driver and the PCC system, a ranking method was used for this purpose. Based on the correlation coefficient values, normalized importance weights were assigned to each operational characteristic. The higher the correlation coefficient, the greater the importance weight assigned to that characteristic. The individual importance weights are listed in Table 2.
In the next step, all average values of the operating characteristics for both directions together and separately were multiplied by the given normalized importance weight. The resulting values assigned to the driver and the PCC system are shown in Table 3.
Table 4 presents the normalized importance weights. Table 5 presents a comparison of the results obtained by the Driver and the PCC system.
After performing the comparison, it can be observed that the predictive cruise control has a lower final value than the driver in each direction and also in the round-trip direction, which means the PCC system is better than the driver in all cases by between 11.50% and 13.10%. Other researchers also note the benefits of using driver assistance systems [57,60,65,70,71,72] in terms of fuel consumption and emissions. For context, several advanced longitudinal control approaches have reported fuel savings comparable to those observed here. Conventional adaptive cruise control (ACC) typically yields modest reductions by stabilizing speed, while model-predictive control (MPC) and GPS-assisted predictive controllers frequently achieve larger improvements by optimizing speed/gear profiles ahead of topography [56,57,72]. Cooperative strategies such as platooning can further reduce consumption under coordinated traffic conditions but require fleet-level deployment and dedicated infrastructure. Differences in reported savings often stem from methodological factors (route profile, vehicle load, measurement method and simulation vs. field tests), so direct numerical comparison with our single-route field test is indicative but not definitive.
We estimate the environmental benefit of the measured fuel savings. Using an emission factor of 2.68 kg CO2 per liter of diesel, the average round-trip fuel saving of 4.68 L/100 km (14.68%) corresponds to ≈12.6 kg CO2 avoided per 100 km. On the ST→MY run, the saving of 6.4 L equates to ≈17.2 kg CO2 per trip. These estimates indicate that PCC can meaningfully reduce CO2 emissions under the tested conditions. We note, however, that direct measurement of tailpipe emissions (CO2, NOx, PM) was not performed here; therefore pollutant reductions other than CO2 are only inferred from fuel savings and should be validated in future studies using PEMS or laboratory-grade fuel flow/meters.

4. Conclusions

In the percentage evaluation, the absolute and relative differences in individual operating characteristics are shown. This study provides novel insights into predictive cruise control optimization and its potential to enhance energy efficiency and sustainability in freight transport, with practical implications for driver-assistance systems, logistics planning, and transportation policies. The most significant differences concern fuel consumption and the proportional use of the engine’s maximum power. When comparing directions separately, the difference between the driver and the PCC system in proportional use of maximum engine power was 26.42% on the ST→MY route and 23.81% on the MY→ST route. This also resulted in higher fuel consumption for the driver: specifically 17.11% (i.e., 6.4 L) on one route and 7.58% (i.e., 2 L) on the other. When both directions are considered together, the difference in proportional use of maximum power between the driver and the PCC system was 25.38%. Fuel consumption differed by 14.68% (i.e., 4.68 L). Thus, using the PCC system on the given route produced significant fuel savings compared with the driver.
Beyond the direct fuel savings, our findings underscore the broader potential for PCC to integrate seamlessly into modern fleet energy management systems. Freight companies can leverage these insights to refine driver training programs, optimize route planning based on real-time topography, and strategically deploy PCC-equipped vehicles on routes where the greatest energy-saving benefits are evident. This contributes directly to mitigating carbon intensity in long-haul logistics by systematically reducing diesel consumption. While this study focused on traditional internal combustion engine vehicles, the principles of predictive energy management demonstrated by PCC also hold significant promise for future integration with renewable energy-aware route planning and the optimization of energy use in electric heavy-duty vehicles, paving the way for more sustainable transport solutions.
These results are limited to the specific vehicle, load and route conditions used in this study. Generalization requires further experiments on representative routes (highway, mixed profile, urban), testing varied payloads, increasing the number of replicates for statistical validation, and direct emission measurements to verify environmental impacts. The main reason is considerable fuel savings, which reduce variable costs and improve the company’s competitive position. Reduced fuel consumption also lowers vehicle emissions, making operations much more environmentally friendly. Other benefits include more efficient vehicle operation: with the PCC system, the engine reached maximum power less frequently, which can contribute to a longer service life of the vehicle’s combustion engine.
While this study provides valuable insights into the performance of PCC on a specific route, it is important to acknowledge that the results may not be directly generalizable to all driving conditions. Future research should also consider incorporating regression correction or sensitivity analysis to account for the effects of weather conditions on fuel consumption and the specific contributions of preemptive braking, reduced speed fluctuations, and vehicle inertia energy recovery to the overall fuel savings achieved by PCC systems.
Further research is needed to validate the specific effective fuel consumption metric against actual engine-specific fuel consumption and to determine its sensitivity to different driving styles and vehicle configurations. This will help to refine the metric and improve its usefulness for assessing and optimizing vehicle energy efficiency.

Author Contributions

Conceptualization, J.V. and T.S.; methodology, J.V., T.S., A.R. and J.C.; validation, J.C., F.K. and A.R.; formal analysis, J.C. and F.K.; resources, J.C., J.V., F.K. and T.S.; data curation, J.V. and J.C.; writing—original draft preparation, J.V., T.S. and J.C.; writing—review and editing, F.K., J.C. and J.V.; visualization, J.V. and A.R.; supervision, J.V. and T.S.; funding acquisition, J.V. and T.S. All authors have read and agreed to the published version of the manuscript.

Funding

This research was funded by the “Projekt: 1/0411/25 Zdieľaná mobilita v SR a jej ekonomické dopady na zvýšenie konkurencie schopnosti MHD v mestskom prostredí. (Project: 1/0411/25 Shared mobility in Slovakia and its economic impacts on enhancing the competitiveness of public transportation in urban environments”).

Data Availability Statement

The original contributions presented in the study are included in this article; further inquiries can be directed to the corresponding author.

Conflicts of Interest

Author Tomas Skrucany was employed by the company AVE—MOTO, s.r.o. Author Andrej Rakyta was employed by the company ProfiDrive MAN Truck & Bus Slovakia. The remaining authors declare that the research was conducted in the absence of any commercial or financial relationships that could be construed as a potential conflict of interest.

Abbreviations

The following abbreviations are used in this manuscript:
ACCAdaptive Cruise Control
ADRthe European Agreement concerning the international carriage of Dangerous goods by Road
CNGCompressed Natural Gas
CUControl Unit
GPSGlobal Positioning System
HVOHydrotreated Vegetable Oil
ICEInternal Combustion Engine
m a.s.l.Meters above sea level
MY-STRoute from Myjava to Stará Tura
NGNatural Gas
PCCPredictive Cruise Control
RCCIReactivity Controlled Compression Ignition
ST-MYRoute from Stará Tura to Myjava

References

  1. Borucka, A.; Kozłowski, E. Border Road Freight Traffic in the Context of the Modern Geopolitical Situation. In TRANSBALTICA XV: Transportation Science and Technology; Prentkovskis, O., Yatskiv (Jackiva), I., Skačkauskas, P., Karpenko, M., Stosiak, M., Eds.; TRANSBALTICA 2024. Lecture Notes in Intelligent Transportation and Infrastructure; Springer: Cham, Switzerland, 2025. [Google Scholar] [CrossRef]
  2. Čižiūnienė, K.; Voronavičiūtė, G.; Marinkovic, D.; Matijošius, J. Sustainable Human Resource Management in Emergencies: The Case of the Lithuanian Logistics Sector. Sustainability 2025, 17, 2591. [Google Scholar] [CrossRef]
  3. Bartnik, G.; Krzysiak, Z.; Samociuk, W.; Łysiak, G.; Plizga, K.; Szmigielski, M.; Nieoczym, A.; Kaliniewicz, Z.; Brumerčik, F. Dokumentowanie spełniania wymagań w obszarze bezpieczeństwa technicznego na przykładzie dystrybucji paliw ciekłych. Przem. Chem. 2017, 96, 1039–1041. [Google Scholar] [CrossRef]
  4. Samociuk, W.; Krzysiak, Z.; Bukova, B.; Brumercikova, E.; Bąkowski, H.; Krzywonos, L. Analiza międzynarodowego transportu produktów chemicznych w państwach Grupy Wyszehradzkiej. Przem. Chem. 2018, 97, 829–833. [Google Scholar] [CrossRef]
  5. Stoma, M.; Maj, G.; Dudziak, A.; Ślaska-Grzywna, B.; Piekarski, W.; Andrejko, D. Obrót produktami chemicznymi zgodnie z systemem badania bezpieczeństwa i jakości SQAS. Przem. Chem. 2015, 94, 1883–1886. [Google Scholar] [CrossRef]
  6. Krzysiak, Z. Profitability of Sugar Beet Production in 2023/2024 Campaign on Example of Lublin Voivodeship. In Proceedings of the 23rd International Scientific Conference Engineering for Rural Development, Jelgava, Latvia, 22–24 May 2024. [Google Scholar]
  7. Panoutsou, C.; Alexopoulou, E. Costs and Profitability of Crops for Bioeconomy in the EU. Energies 2020, 13, 1222. [Google Scholar] [CrossRef]
  8. Samociuk, W.; Krzysiak, Z.; Przystupa, K.; Zarajczyk, J. Sugar Beet Profitability in Lubelskie Province, Poland. Appl. Sci. 2025, 15, 8685. [Google Scholar] [CrossRef]
  9. Čižiūnienė, K.; Matijošius, J.; Liebuvienė, J.; Sokolovskij, E. Comparison of the Relative Importance of Factors Affecting the Conveyance of Bulk and Liquid Cargo. Appl. Sci. 2024, 14, 1151. [Google Scholar] [CrossRef]
  10. Stojanovic, N.; Boskovic, B.; Petrovic, M.; Grujic, I.; Abdullah, O.I. The impact of accidents during the transport of dangerous good, on people, the environment, and infrastructure and measures for their reduction: A review. Environ. Sci. Pollut. Res. 2023, 30, 32288–32300. [Google Scholar] [CrossRef] [PubMed]
  11. Pang, L.; Yue, M.; Qi, G.; Liu, Y.; Qian, K. Preview-based MPC for active suspension control of tank vehicle with lateral liquid sloshing suppression. Proc. I. Mech. E. Part D J. Automob. Eng. 2025, 09544070251317649. [Google Scholar] [CrossRef]
  12. Marienka, P.; Frančák, M.; Jagelčák, J. Evaluation of bulk cargo dynamics in the ACTS intermodal container. Nase More 2021, 68, 14–27. [Google Scholar] [CrossRef]
  13. Vlkovský, M. A comparison of cargo securing on laden/unladen container trucks. Int. J. Logist. Syst. Manag. 2021, 40, 510–524. [Google Scholar] [CrossRef]
  14. Aleksandrowicz, P.J.; Wrona, R.; Droździel, P. Problems of modelling a pedestrian collision—Selected aspects. Adv. Sci. Technol. Res. J. 2025, 19, 44–55. [Google Scholar] [CrossRef]
  15. Drozd, K.; Tarkowski, S.; Caban, J.; Nieoczym, A.; Vrábel, J.; Krzysiak, Z. Analysis of Truck Tractor Tire Damage in the Context of the Study of Road Accident Causes. Appl. Sci. 2022, 12, 12333. [Google Scholar] [CrossRef]
  16. Decker, Ž.; Tretjakovas, J.; Drozd, K.; Rudzinskas, V.; Walczak, M.; Kilikevičius, A.; Matijosius, J.; Boretska, I. Material’s Strength Analysis of the Coupling Node of Axle of the Truck Trailer. Materials 2023, 16, 3399. [Google Scholar] [CrossRef]
  17. Jilek, P. Design of Kinematic Coupling of the Rear Wheels of a Road Trailer. Int. J Automot. Technol. 2025, 26, 1631–1637. [Google Scholar] [CrossRef]
  18. Zhang, G.; Wang, T.; Wang, H.; Wu, S.; Shao, Z. Stability Analysis of a Vehicle–Cargo Securing System for Autonomous Trucks Based on 6-SPS-Type Parallel Mechanisms. Machines 2023, 11, 745. [Google Scholar] [CrossRef]
  19. Bańka, M.; Droździel, P.; Nieoczym, A. Lashing methods—Mathematical basis of the process of selecting the number of lashings. In Proceedings of the 23rd International Conference, Transport Means 2019, Proceedings Part, Palanga, Lithuania, 2–4 October 2019; pp. 99–103. [Google Scholar]
  20. Vlkovský, M.; Veselík, P. Cargo Securing—Comparison of the Selected Trucks. Transp. Probl. 2020, 15 Pt 2, 265–274. [Google Scholar] [CrossRef]
  21. Vlkovský, M.; Veselík, P. Cargo securing—Comparison of different quality roads. Acta Univ. Agric. Silvic. Mendel. Brun. 2019, 67, 1015–1023. [Google Scholar] [CrossRef]
  22. Vlkovský, M. Impact of vehicle type and road quality on cargo securing. Commun. Sci. Lett. Univ. Zilina 2020, 22, 9–14. [Google Scholar] [CrossRef]
  23. Hanzl, J.; Pečman, J.; Bartuška, L.; Stopka, O.; Šarkan, B. Research on the Effect of Road Height Profile on Fuel Consumption during Vehicle Acceleration. Technologies 2022, 10, 128. [Google Scholar] [CrossRef]
  24. Hurtova, I.; Sejkorova, M.; Verner, J.; Sarkan, B. Comparison of electricity and fossil fuel consumption in trolleybuses and buses. Eng. Rural. Dev. 2018, 17, 2079–2084. [Google Scholar] [CrossRef]
  25. Kravchenko, O.; Barta, D.; Gerlici, J.; Kravchenko, K.; Rybicka, I.; Zigo, A. Environmental Problems Associated with Vehicle Braking and Their Solutions. In International Conference TRANSBALTICA: Transportation Science and Technology; Lecture Notes in Intelligent Transportation and Infrastructure; Springer: Cham, Switzerland, 2023; Part F1379; pp. 258–267. [Google Scholar]
  26. Lizbetin, J.; Stopka, O.; Kurenkov, P.V. Declarations regarding the energy consumption and emissions of the greenhouse gases in the road freight transport sector. Arch. Automot. Eng. 2019, 83, 59–72. [Google Scholar] [CrossRef]
  27. Stopka, O.; L’upták, V.; Stopková, M.; Šarkan, B.; Mašek, J. Methodology of Choosing the Most Eco-Friendly Waste Collection Truck. Promet Traffic Transp. 2025, 37, 874–887. [Google Scholar] [CrossRef]
  28. Warguła, Ł.; Lijewski, P.; Kukla, M. Influence of non-commercial fuel supply systems on small engine SI exhaust emissions in relation to European approval regulations. Environ. Sci. Pollut. Res. 2022, 29, 55928–55943. [Google Scholar] [CrossRef]
  29. Zając, G.; Szyszlak-Bargłowicz, J.; Słowik, T. Comparison and assessment of emission factors for toxic exhaust components during combustion of biomass fuels. Rocz. Ochr. Srodowiska 2019, 21, 378–394. [Google Scholar]
  30. Bialy, M.; Wendeker, M.; Magryta, P.; Czyz, Z.; Sochaczewski, R. CFD Model of the Mixture Formation Process of the CNG Direct Injection Engine. In Proceedings of the SAE 2014 International Powertrain, Fuels & Lubricants Meeting, Birmingham, UK, 20–23 October 2014. [Google Scholar] [CrossRef]
  31. Milojević, S.; Gročić, D.; Dragojlović, D. CNG propulsion system for reducing noise of existing city buses. J. Appl. Eng. Sci. 2016, 14, 377–382. [Google Scholar] [CrossRef]
  32. Dittrich, A.; Prochazka, R.; Popelka, J.; Phu, D.N. Effect of HVO CNG dual-fuel operation mode on emissions and performance of CI engine. Eng. Rural. Dev. 2023, 22, 58–63. [Google Scholar] [CrossRef]
  33. Phu, D.N.; Dittrich, A.; Prochazka, R.; Popelka, J. Evaluation of Combustion and Emission Characteristics of CI Engines Operating Dual-Fuel with BioCNG/Diesel and BioCNG/HVO. SSRG Int. J. Mech. Eng. 2024, 11, 17–26, IJME-V11I3P103. [Google Scholar] [CrossRef]
  34. Smigins, R.; Sondors, K.; Pirs, V.; Dukulis, I.; Birzietis, G. Studies of Engine Performance and Emissions at Full-Load Mode Using HVO, Diesel Fuel, and HVO5. Energies 2023, 16, 4785. [Google Scholar] [CrossRef]
  35. Yang, L.; Ji, S.; Niu, W.; Zare, A.; Hunicz, J.; Brown, R.J. Effect of split injection strategy of diesel fuel on multi-stage heat release and performance of a RCCI engine fueled with diesel and natural gas. Fuel 2024, 362, 130930. [Google Scholar] [CrossRef]
  36. Górski, K.; Tziourtzioumis, D.; Smigins, R.; Longwic, R. Effects of Ethanol–Diesel Blends on Cylinder Pressure, Ignition Delay, and NOx Emissions in a Diesel Engine. Energies 2025, 18, 2392. [Google Scholar] [CrossRef]
  37. Górski, K.; Smigins, R.; Matijošius, J.; Rimkus, A.; Longwic, R. Physicochemical Properties of Diethyl Ether—Sunflower Oil Blends and Their Impact on Diesel Engine Emissions. Energies 2022, 15, 4133. [Google Scholar] [CrossRef]
  38. Milojević, S.; Stopka, O.; Orynycz, O.; Tucki, K.; Šarkan, B.; Savić, S. Exploitation and Maintenance of Biomethane-Powered Truck and Bus Fleets to Assure Safety and Mitigation of Greenhouse Gas Emissions. Energies 2025, 18, 2218. [Google Scholar] [CrossRef]
  39. Amatnieks, K.; Šmigins, R.; Birkavs, A. Effect of Hydrogen Injection on Performance and Emissions of a Light-Duty Diesel Vehicle. In Proceedings of the Transport Means Proceedings of the International Conference, Kaunas, Lithuania, 2–4 October 2024; pp. 57–62. [Google Scholar]
  40. Malek, A.; Taccani, R.; Kasperek, D.; Hunicz, J. Optimization of energy management in a city bus powered by the hydrogen fuel cells. Commun. Sci. Lett. Univ. Zilina 2021, 23, E56–E67. [Google Scholar] [CrossRef]
  41. Ngasse Moudio, N.D.; Bian, X.-Q.; Chinamo, D.S. Liquid hydrogen carriers for clean energy systems: A critical review of chemical hydrogen storage strategies. Fuel 2026, 404, 136329. [Google Scholar] [CrossRef]
  42. Brumercik, F.; Lukac, M.; Krzysiak, Z.; Krzywonos, L. Model of integrated transportation system. Commun. Sci. Lett. Univ. Zilina 2017, 19, 23–26. [Google Scholar] [CrossRef]
  43. Dižo, J.; Blatnický, M.; Melnik, R.; Kravchenko, O. A mathematical model of operation of a semi-trailer tractor powertrain. Commun. Sci. Lett. Univ. Zilina 2022, 24, B267–B274. [Google Scholar] [CrossRef]
  44. Gnap, J.; Senko, S.; Kostrzewski, M.; Bridzikova, M.; Czodorova, R.; Riha, Z. Research on the relationship between transport infrastructure and performance in rail and road freight transport—A case study of Japan and selected European countries. Sustainability 2021, 13, 6654. [Google Scholar] [CrossRef]
  45. Korsakas, V.; Melaika, M.; Pukalskas, S.; Stravinskas, P. Hydrogen addition influence for the efficient and ecological parameters of heavy-duty natural gas Si engine. Procedia Eng. 2017, 187, 395–401. [Google Scholar] [CrossRef]
  46. Lovska, A.; Ishchuk, V.; Dižo, J.; Blatnický, M. Analysis of Running Properties of a Rail Multiple-Unit with a Diesel and a Hydrogen Powertrain. In International Conference TRANSBALTICA: Transportation Science and Technology; Lecture Notes in Intelligent Transportation and Infrastructure; Springer: Cham, Switzerland, 2025; Part F230; pp. 527–536. [Google Scholar]
  47. Rabinovich, E.; Gritsuk, I.V.; Zuiev, V.; Evgeny, E.Y.; Golovan, A.; Zybtsev, Y.; Volkov, V.; Gerlici, J.; Kravchenko, K.; Volska, O.; et al. Evaluation of the powertrain condition based on the car acceleration and coasting data. SAE Tech. Pap. 2018. [Google Scholar] [CrossRef]
  48. Huang, D.; Ou, J.; Yang, E.; Lin, J.; Zhang, Y. Research on a Multimode Adaptive Cruise Control Strategy with Emergency Lane-Changing Function. World Electr. Veh. J. 2023, 14, 189. [Google Scholar] [CrossRef]
  49. Kabasakal, B.; Üçüncü, M. The design and simulation of adaptive cruise control system. Int. J. Auto. Sci. Tech. 2022, 6, 242–256. [Google Scholar] [CrossRef]
  50. Li, Z.; Deng, Y.; Sun, S. Adaptive Cruise Predictive Control Based on Variable Compass Operator Pigeon-Inspired Optimization. Electronics 2022, 11, 1377. [Google Scholar] [CrossRef]
  51. Wu, C.; Xu, Z.; Liu, Y. Spacing Policies for Adaptive Cruise Control: A Survey. IEEE Access 2020, 8, 50149–50162. [Google Scholar] [CrossRef]
  52. Yu, T.; Tang, Y.; Chen, R.; Zhao, S. Optimization of Adaptive Cruise Control Strategies Based on the Responsibility-Sensitive Safety Model. Vehicles 2025, 7, 28. [Google Scholar] [CrossRef]
  53. Eustace, D. Emerging Transportation Safety and Operations: Practical Perspectives. Vehicles 2024, 6, 2251–2256. [Google Scholar] [CrossRef]
  54. Yang, Z.; Wang, Z.; Yan, M. An Optimization Design of Adaptive Cruise Control System Based on MPC and ADRC. Actuators 2021, 10, 110. [Google Scholar] [CrossRef]
  55. Mu, H.; Li, L.; Mei, M.; Zhao, Y. A Hierarchical Control Scheme for Adaptive Cruise Control System Based on Model Predictive Control. Actuators 2023, 12, 249. [Google Scholar] [CrossRef]
  56. Borneo, A.; Miretti, F.; Misul, D.A. Fuel Efficiency Optimization in Adaptive Cruise Control: A Comparative Study of Model Predictive Control-Based Approaches. Appl. Sci. 2024, 14, 9833. [Google Scholar] [CrossRef]
  57. Grabowski, Ł.; Sochaczewski, R.; Biały, M. Deep learning long short-term memory methods for instantaneous fuel consumption prediction: Experimental study and comparison of modeling strategies. Adv. Sci. Technol. Res. J. 2025, 19, 197–209. [Google Scholar] [CrossRef]
  58. Kalašová, A.; Čulík, K.; Skřivánek-Kubíková, S. The interaction between a driver and intelligent transport systems. Acta Polytech. CTU Proc. 2022, 39, 16–22. [Google Scholar] [CrossRef]
  59. Grencik, J.; Barta, D.; Brezani, M.; Molnar, D. Energy Consumption and Travel Time as Important Factors for Deciding on the Mode of Transport—Case Study from Slovakia. In International Conference TRANSBALTICA: Transportation Science and Technology; Lecture Notes in Intelligent Transportation and Infrastructure; Springer: Cham, Switzerland, 2023; Part F1379; pp. 518–527. [Google Scholar]
  60. Małek, A.; Marciniak, A.; Kroczyński, D. Defining Signatures for Intelligent Vehicles with Different Types of Powertrains. World Electr. Veh. J. 2025, 16, 135. [Google Scholar] [CrossRef]
  61. Šarkan, B.; Loman, M.; Senko, Š.; Richtář, M.; Gołębiowski, W. Change in engine power in the event of electronic components failures. Arch. Automot. Eng. 2022, 98, 40–55. [Google Scholar] [CrossRef]
  62. Loman, M.; Šarkan, B. Determination of the deviation of the on-board computer in the vehicle when determining the average fuel consumption. Arch. Automot. Eng. 2021, 91, 25–35. [Google Scholar] [CrossRef]
  63. Melders, L.; Smigins, R.; Birkavs, A. Recent Advances in Vehicle Driver Health Monitoring Systems. Sensors 2025, 25, 1812. [Google Scholar] [CrossRef]
  64. Sajdl, J. Predictive Adaptive Cruise Control. Available online: https://www.autolexicon.net/en/articles/prediktivni-adaptivni-tempomat/ (accessed on 5 June 2025).
  65. Gáspár, P.; Németh, B. Predictive Cruise Control for Road Vehicles Using Road and Traffic Information; Springer: Cham, Switzerland, 2019; p. 226. ISBN 978-3-030-04115-1. [Google Scholar]
  66. Vehicle Registration Certificate MAN TGX 18.470 4x2 LL SA. Available online: https://autoline.info/-/sale/truck-tractors/MAN/TGX-18-470-4X2-LL-SA-MEGA--25112217255940077000 (accessed on 4 October 2025).
  67. Predictive Driving—Smart Savings. Available online: https://www.man.eu/de/en/truck/assistance-systems/gps-assisted-cruise-control/man-efficientcruise.html (accessed on 21 July 2025).
  68. Internet Map Application Mapy.cz. Available online: https://sk.mapy.cz/zakladni?x=19.4402339&y=48.8084443&z=8 (accessed on 25 February 2025).
  69. Google Earth Pro Internet Mapping Application. Available online: https://earth.google.com/web/ (accessed on 25 February 2025).
  70. Borneo, A.; Zerbato, L.; Miretti, F.; Tota, A.; Galvagno, E.; Misul, D.A. Platooning Cooperative Adaptive Cruise Control for Dynamic Performance and Energy Saving: A Comparative Study of Linear Quadratic and Reinforcement Learning-Based Controllers. Appl. Sci. 2023, 13, 10459. [Google Scholar] [CrossRef]
  71. Piao, C.; Gao, J.; Yang, Q.; Shi, J. Adaptive cruise control method based on hierarchical control and multi-objective optimization. Trans. Inst. Meas. Control. 2023, 45, 1298–1312. [Google Scholar] [CrossRef]
  72. Weißmann, A.; Görges, D.; Lin, X. Energy-optimal adaptive cruise control combining model predictive control and dynamic programming. Control Eng. Pract. 2018, 72, 125–137. [Google Scholar] [CrossRef]
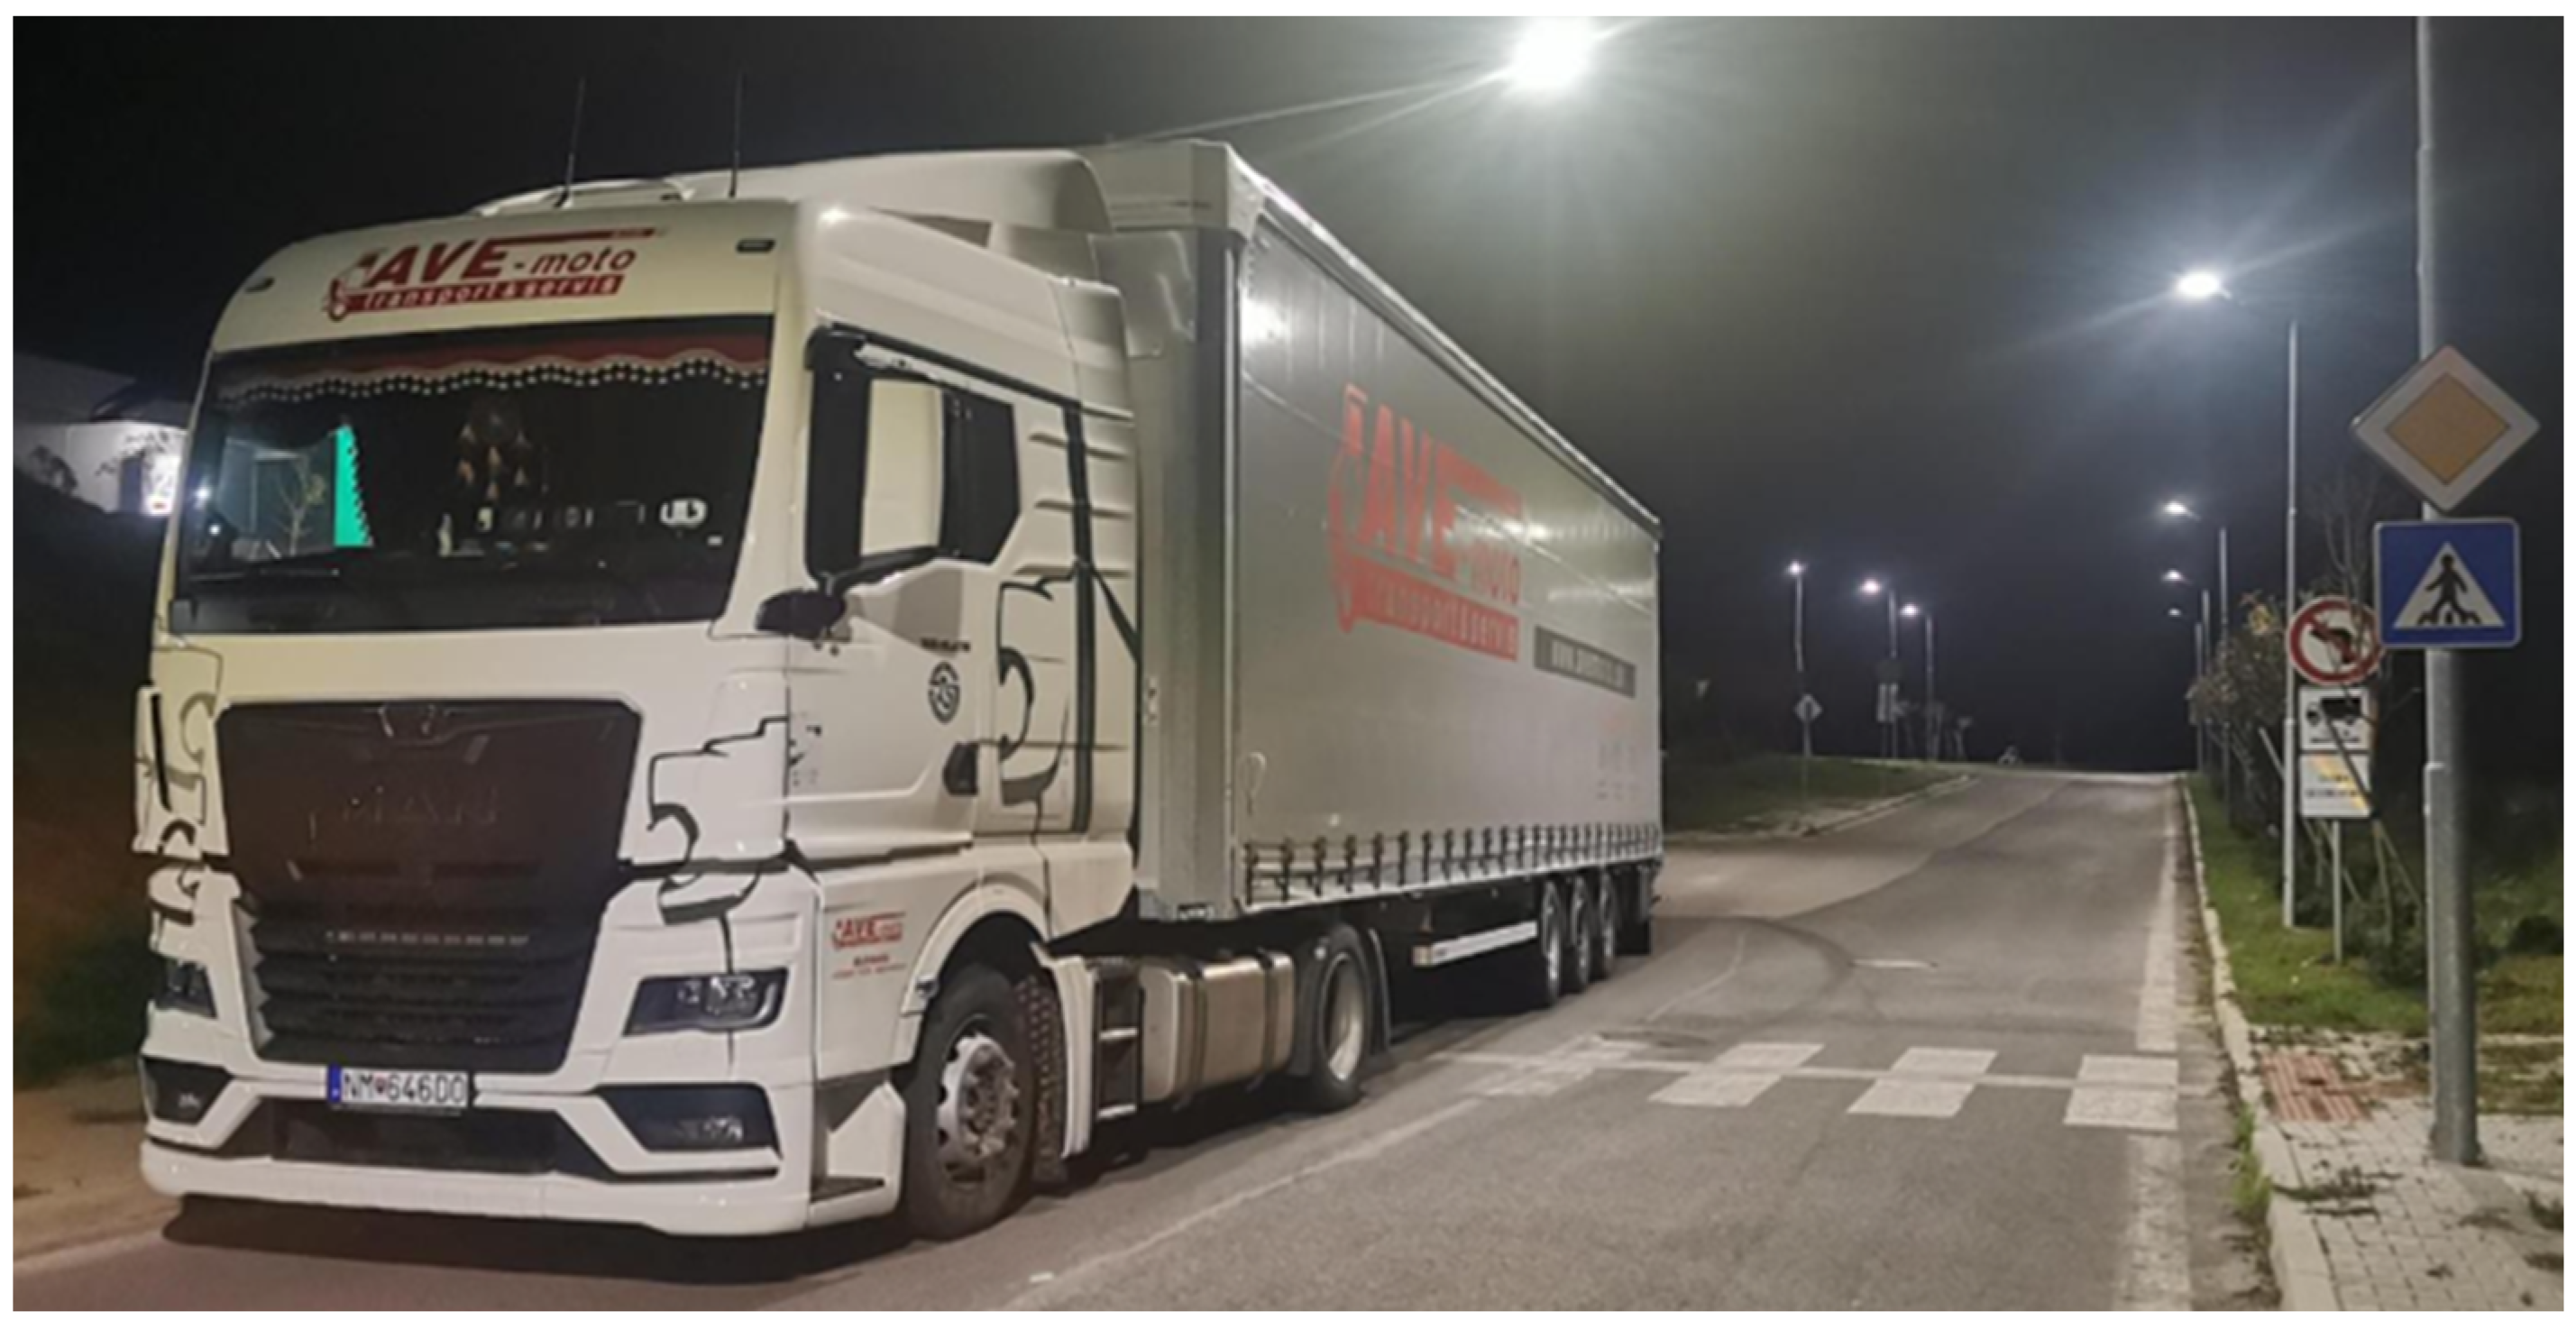
Figure 1. Semi-trailer combination used during measurement.
Energies 18 06171 g001
Figure 2. Direction of the measured route [68].
Energies 18 06171 g002
Figure 3. The elevation profile of the measured route [69].
Energies 18 06171 g003
Figure 4. Graphs of engine power exerted—direction ST-MY: (a) by Driver; (b) with PCC.
Energies 18 06171 g004
Figure 5. Graphs of engine power exerted—direction MY-ST: (a) by Driver; (b) with PCC.
Energies 18 06171 g005
Figure 6. Graphs of vehicle speed—direction ST-MY: (a) by Driver; (b) with PCC.
Energies 18 06171 g006
Figure 7. Graphs of vehicle speed—direction MY-ST: (a) by Driver; (b) with PCC.
Energies 18 06171 g007aEnergies 18 06171 g007b
Table 1. Measures of Central Tendency and Measures of Variability—Driver.
DirectionST-
MY
MY-
ST
ST-
MY
MY-
ST
ST-
MY
MY-
ST
ST-
MY
MY-
ST
ST-
MY
MY-
ST
x ¯ x ¯ V r V r d ¯ d ¯ σ 2 σ 2 σ σ
OC152.149.55.915.52.06.15.843.9±2.4±6.6
OC2384.3363.775.027.032.910.91217.6137.6±34.9±11.7
OC3−384.3−363.7−75.0−27.032.910.91217.6137.6±34.9±11.7
OC429.918.98.36.93.13.011.810.2±3.4±3.2
OC5106.375.416.412.25.831.045.425.9±6.7±2.6
OC637.426.40.63.60.21.50.12.7±0.3±1.6
Legend:
x ¯ Arithmetic meanOC1Average vehicle speed [km/h]
V r RangeOC2Average number of uphill speed kilometers [km/h]
d ¯ Mean deviationOC3Average number of downhill speed kilometers [km/h]
σ 2 VarianceOC4Relative utilization of maximum engine power [%]
σ Standard deviationOC5Average specific effective fuel consumption [g/kWh]
OC6Average fuel consumption [L/100 km]
Table 2. Measures of Central Tendency and Measures of Variability—PCC.
DirectionST-
MY
MY-
ST
ST-
MY
MY-
ST
ST-
MY
MY-
ST
ST-
MY
MY-
ST
ST-
MY
MY-
ST
x ¯ x ¯ V r V r d ¯ d ¯ σ 2 σ 2 σ σ
OC148.448.04.64.71.81.73.93.8±2.0±1.9
OC2345.3318.343.025.015.88.9317.6105.6±17.8±10.3
OC3−345.3−318.3−43.0−25.015.88.9317.6105.6±17.8±10.3
OC422.014.43.34.81.37.62.04.2±1.4±2.0
OC590.869.46.81.92.40.77.80.7±2.8±0.8
OC631.024.40.40.10.20.030.030.001±0.2±0.03
Legend:
x ¯ Arithmetic meanOC1Average vehicle speed [km/h]
V r RangeOC2Average number of uphill speed kilometers [km/h]
d ¯ Mean deviationOC3Average number of downhill speed kilometers [km/h]
σ 2 VarianceOC4Relative utilization of maximum engine power [%]
σ Standard deviationOC5Average specific effective fuel consumption [g/kWh]
OC6Average fuel consumption [L/100 km]
Table 3. Percentual evaluation of the results. Separately for each direction and collectively for both directions.
Operational CharacteristicDirectionAverage ValueDifference
DriverPCCAbsoluteRelative [%]
Vehicle speed [kmph]ST-MY52.148.43.77.10
MY-ST49.548.01.53.03
ST-MY-ST50.8348.172.665.23
Number of uphill speed kilometers [kmph]ST-MY384.3345.33910.15
MY-ST363.7318.345.412.48
ST-MY-ST3743324211.23
Number of downhill speed kilometers [kmph]ST-MY−384.3−345.3−3910.15
MY-ST−363.7−318.3−45.412.48
ST-MY-ST374−332−4211.23
Relative utilization of the maximum engine power [%]ST-MY29.922.07.926.42
MY-ST18.914.44.523.81
ST-MY-ST24.4318.236.225.38
Specific effective fuel consumption [g/kWh] *ST-MY106.390.815.514.58
MY-ST75.469.467.96
ST-MY-ST90.8380.0910.7411.82
Fuel consumption [L/100 km]ST-MY37.431.06.417.11
MY-ST26.424.427.58
ST-MY-ST31.8927.214.6814.68
* This is not exactly the “specific effective fuel consumption” known from the characteristics of the internal combustion engine, but rather an expression of the amount of energy consumed in terms of fuel burned during vehicle operation (the work performed by the engine during the measurement). Since the engine also exerted negative or zero work (braking with the engine, vehicle coasting, etc.), the value of this consumption is significantly lower than the specified specific effective fuel consumption for the given vehicle engines.
Table 4. Normalized importance weights.
RankingOperational CharacteristicNormalized Importance Weight [-]
P1Average vehicle speed [kmph]1/15
P2aNumber of uphill speed kilometers [kmph]1/15(2/15)
P2bNumber of downhill speed kilometers [kmph]1/15
P3Relative utilization of the maximum engine power [%]3/15
P4Average specific effective fuel consumption [g/kWh]4/15
P5Average fuel consumption [L/100 km]5/15
Σ 15 Σ 1
Table 5. Comparison results.
DirectionFinal Number of Assigned PointsDifference
Driver [-]PCC [-]AbsoluteRelative [%]
ST-MY101.4688.1713.2913.10
MY-ST84.5274.809.7211.50
ST-MY-ST92.9981.4811.5112.38
Disclaimer/Publisher’s Note: The statements, opinions and data contained in all publications are solely those of the individual author(s) and contributor(s) and not of MDPI and/or the editor(s). MDPI and/or the editor(s) disclaim responsibility for any injury to people or property resulting from any ideas, methods, instructions or products referred to in the content.