Article

Frequency–Temperature Characteristics of the Cellulose—Insulating Oil–Water Nanodroplet Nanocomposite Components for Diagnostic Evaluation of Power Transformer Insulation

1
Lublin University of Technology, 38d, Nadbystrzycka Street, 20-618 Lublin, Poland
2
Department of Electrical Devices and High Voltage Technology, Lublin University of Technology, 38a, Nadbystrzycka Street, 20-618 Lublin, Poland
3
Energo-Complex, Sp. z o.o., 9, Lotników Street, 41-949 Piekary Śląskie, Poland
4
Nynas AB Raffinaderivagen, 21, 149 82 Nynashamn Stoc, Sweden
*
Author to whom correspondence should be addressed.
Energies 2025, 18(23), 6176; https://doi.org/10.3390/en18236176
Submission received: 18 September 2025 / Revised: 30 October 2025 / Accepted: 19 November 2025 / Published: 25 November 2025
(This article belongs to the Special Issue Nanomaterials for Sustainable Energy and Environmental Applications)

Abstract

We determined the reference characteristics of the loss tangent and the real component of the complex permittivity of the cellulose-insulating oil–water nanodroplet nanocomposite with a moisture content of 5.17% by weight in pressboard. Such a high moisture content was selected because a value close to 5% by weight is critical, and reaching it may lead to catastrophic transformer failure as well as contamination of the natural environment with poorly biodegradable mineral oil and products of its incomplete combustion. Based on the measurement results, the values of the loss tangent and the real and imaginary components of the complex permittivity of the power transformer insulation system, consisting of moistened pressboard and insulating oil, were determined according to CIGRE. These values were obtained for both factory-new and moistened mineral oil. It was found that oil moisture content has a significant impact on the tanδ characteristics of strongly moistened liquid–solid insulation in the lowest frequency range. In the intermediate frequency range, this effect gradually decreases and then practically disappears. In the frequency range above 50 Hz, the tanδ values depend on the moisture content in cellulose and on the geometrical parameters of the insulation components in the CIGRE system, and do not depend on the oil moisture content. The influence of oil moisture on the estimation of cellulose moisture content becomes noticeable starting from a water content of 2% in pressboard. This should be taken into account in insulation condition analysis and in moisture level estimation in order to detect a critical state threatening catastrophic failure of a power transformer. It was also determined that the real component of the complex permittivity depends only weakly on oil moisture, and only in the low-temperature and low-frequency ranges. In contrast, the imaginary component of the complex permittivity depends on oil moisture practically in the same way as the loss tangent of the power transformer insulation system.

1. Introduction

For almost one hundred years, the vast majority of power transformers have been manufactured using so-called liquid–solid insulation. The solid component is usually produced from cellulose-based materials such as paper and pressboard, while the liquid component is typically mineral oil of petroleum origin [1,2].
The application of oils in transformers is related to three essential functions. First, oils act as coolants, removing heat from transformer elements where power losses occur during operation. Cooling efficiency is determined by several parameters, including kinematic viscosity [3,4,5], thermal conductivity, and heat capacity [3,5,6]. Second, oil fills the spaces between transformer elements such as windings and the core, where there are high differences in voltage. In this way, the oil forms one of the components of the insulation system. Third, oil impregnates the cellulose-based insulation, filling empty capillary spaces between the fibers [7]. Impregnation increases the breakdown voltage of cellulose [8] and slows down its aging processes [4,5,9].
The production process of transformers can be briefly summarized as follows. Copper windings are insulated with cellulose materials such as winding paper and pressboard. After manufacturing the transformer components, they are assembled in a tank, which is then sealed. At this stage, cellulose moisture can reach up to 8 wt% or more [10,11,12]. To eliminate the negative influence of high water content in cellulose, vacuum drying is applied. For this purpose, air is evacuated from the tank by a vacuum pump to a pressure at least 1000 times lower than atmospheric, while the insulation is heated. During drying, cellulose moisture decreases to about 0.8 wt% [13,14]. Next, while still under vacuum, the transformer tank is filled with vacuum-treated insulating oil at a temperature above 60 °C. This treatment reduces oil moisture to 3–7 ppm and removes dissolved gases [10,15,16]. At this stage, the impregnation process takes place.
During decades of transformer operation, moisture very slowly penetrates into the transformer and dissolves in the oil. Subsequently, oil supplies water molecules to cellulose. Cellulose absorbs water, as the solubility of water in oil-impregnated cellulose is about 1000 times higher than in oil [17]. Over 25 or more years of service, the moisture content of impregnated cellulose may rise to about 5 wt% or even slightly higher. A moisture content of 5 wt% is considered critical. Moisture levels approaching this value pose the risk of catastrophic transformer failure [18,19,20].
To detect moisture levels approaching the 5 wt% threshold, periodic measurements of cellulose moisture are performed. Non-destructive electrical methods are applied to determine the moisture content of pressboard, such as Return Voltage Measurement (RVM) [8,21,22], Polarization–Depolarization Current (PDC) [23,24,25], and Frequency Domain Spectroscopy (FDS) [26,27,28]. The RVM method determines relaxation time and its dependence on water content and temperature. In the PDC method, the temperature dependence of DC conductance on insulation moisture is measured. In the FDS method, frequency–temperature dependencies of insulation parameters are measured, such as dielectric loss tangent, permittivity, dielectric loss factor, and conductivity, over a frequency range from acoustic to ultra-low frequencies. Currently, FDS is the most widely used method for insulation assessment. This is because modern FDS meters, apart from measuring electrical parameters of insulation, also estimate cellulose moisture content using their proprietary software.
Models describing DC and AC conduction in highly resistive materials have been developed since the first half of the 20th century. Ionic conduction models, describing conduction by ion transport, have been presented in detail in [29]. These models show a linear dependence of conductivity on ion concentration, while the temperature dependence of conductivity is exponential. Since the 1950s, the theoretical foundations of percolation processes in two-phase composite materials have been developed. In such systems, a highly resistive matrix contains conductive inclusions called fillers of small but macroscopic dimensions. The pioneers of percolation theory are considered to be S. R. Broadbent and J. M. Hammersley [30]. Numerous experimental studies of percolation have been performed, e.g., for metallic particles in dielectric matrices [31,32]. Both models and experiments indicate that at low filler concentrations, conductive particles are isolated by the dielectric matrix. As concentration increases, conductive particles begin to touch and eventually form a percolation channel connecting the electrodes, leading to a sharp increase in conductivity. The filler concentration at which the percolation channel forms is called the percolation threshold.
The next step in the development of composite conduction models was the introduction of hopping conduction models based on the quantum-mechanical tunneling of electrons between potential wells of nanometric dimensions, separated by nanometric distances. In this framework, inclusions of the second phase with at least one dimension below 100 nm are treated as nanometric objects [33]. Tunneling occurs because the electron wave function in such nanostructures extends beyond their boundaries [34]. The square of the wave function at a given point corresponds to the probability of finding an electron there. Thus, an electron can exist outside the potential well with some probability. If the distance to another well is nanometric, the electron may “hop” to it. In quantum mechanics, such hops are called electron tunneling. Observation of tunneling in electrical conduction requires a low-conductivity matrix. This can be semiconductors at cryogenic temperatures, or dielectrics at temperatures ranging from liquid nitrogen up to and above room temperature. Potential wells can be represented by single atoms (dopants, point defects in semiconductors and ionic crystals), nanometric conductive or semiconductive particles, and many others [35].
In tunneling-based conduction, potential wells do not need to be in direct contact, since electrons can hop across nanometric dielectric gaps. Nevil F. Mott pioneered hopping conduction by electron tunneling; see, for example, his monograph [36]. For his achievements, Mott received the Nobel Prize in 1977. Numerous experiments have confirmed hopping conduction via electron tunneling. Models and experiments (see, e.g., [37,38]) both show that the dependence of composite conductivity containing nanoparticles on the concentration of potential wells is exponential, i.e., stronger than linear. With the rapid development of nanotechnology, many studies have been published on hopping conduction by electron tunneling in nanocomposites [39,40,41].
DC conductivity studies [42] have established that conduction in the three-component cellulose-insulating oil–moisture composite is determined by the presence of water and proceeds by electron tunneling between water molecules. Further AC and DC studies [43] indicate that in moist oil-impregnated pressboard, water can exist as nanodroplets containing about 200 water molecules each, with diameters of approximately 2.2 nm. When an electron tunnels from one nanodroplet to another, a dipole is formed, leading to additional polarization of the material [44,45]. After the dielectric relaxation time, the electron is attracted back to the positively charged well and returns to its original nanodroplet, causing the dipole to vanish. Relaxation time depends on the distance between nanodroplets, dielectric permittivity, and temperature [43]. This means that, with increasing moisture content in the cellulose component of insulation, the material effectively becomes a cellulose–oil–water nanodroplet nanocomposite (NCOwnd).
For the proper determination of moisture content in paper–oil insulation, a physical model must be used that accurately describes both conduction (defined by conductivity) and dielectric relaxation (defined by dielectric permittivity). Increasing pressboard moisture also increases oil moisture in transformer insulation. In [46], a method of oil moistening was developed identical to the process occurring in power transformers. It was shown that such moistening increases oil conductivity while nearly doubling the activation energy of conductivity. In this study, we applied the same procedure for moistening insulating oil. Conductivity is the fundamental component of the dielectric loss tangent, which is widely used for transformer insulation diagnostics. Therefore, comparative studies of the electrical properties of the NCOwnd and its individual components are necessary. This requires parameters linked to different electrical properties of the materials—namely, frequency dependencies of dielectric loss tangent and the components of complex permittivity. These parameters are significantly influenced by temperature. Consequently, to clarify the mechanisms of conduction and dielectric relaxation in cellulose–oil–moisture three-component composites, a comparative analysis of the electrical properties of the composite and its constituent substances, as well as their temperature dependencies, must be performed.
The objectives of this study were as follows:
To determine reference frequency–temperature characteristics of dielectric loss tangent and the real component of complex permittivity for pressboard moistened to 5.17 wt% and impregnated with insulating oil, for factory-new insulating oil with a moisture content below 7 ppm, and for insulating oil moistened identically to the process occurring in power transformers;
To calculate the frequency–temperature dependencies of transformer insulation (dielectric loss tangent and real and imaginary components of complex permittivity) based on the obtained reference characteristics of pressboard and oil;
To analyze the influence of insulating oil moisture content on the dielectric loss tangent and the real and imaginary components of complex permittivity of liquid–solid transformer insulation.

2. AC Insulation Parameters of Power Transformers: Theoretical Fundamentals

2.1. Theoretical Analysis of the AC Properties of Power Transformer Insulation Systems

Both barriers and spacers in power transformers are made of cellulose in the form of pressboard impregnated with insulating oil. Oil channels filled with insulating oil are located between the barriers and the spacers. As shown in Figure 1, such a system represents a complex cylindrical capacitor.
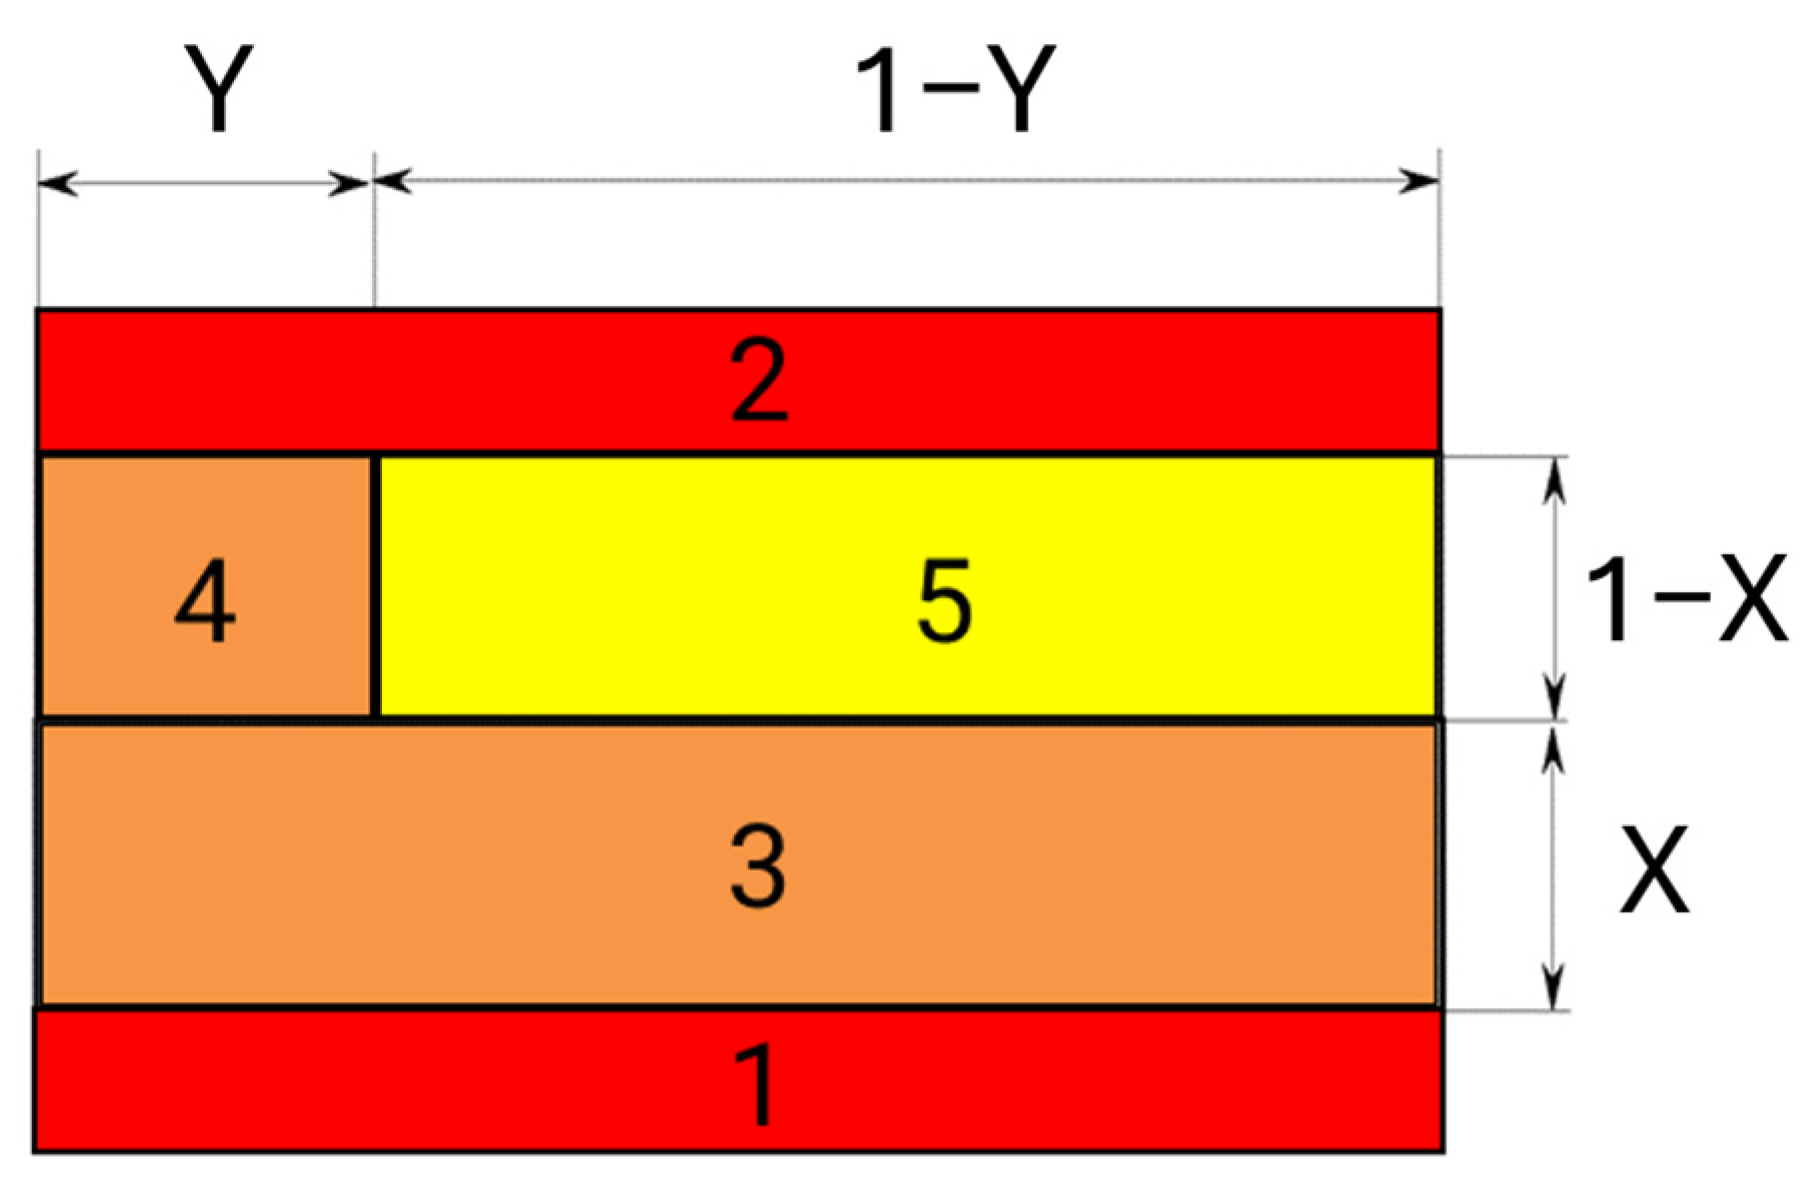
In its publications [48,49], CIGRE recommends using a simplified transformer insulation model, reducing it to a series–parallel arrangement of parallel-plate capacitors, as shown in Figure 2.
In the CIGRE model, all barriers are combined into a single one of thickness X, and all spacers are replaced by a single one of width Y. The same applies to the oil ducts, which are represented by a single duct of thickness (1 − X) and width (1 − Y). In the CIGRE-recommended model, it is assumed that the winding height h is much greater than the distance between the HV and LV windings. In this model, the parameter X is defined as the ratio of the total thickness of all barriers to the distance between the windings, while Y is the ratio of the total width of all spacers to the total outer circumference of the oil duct. From Figure 2, it follows that the barrier thickness is (RHVRLV) × X. Considering the value of X, the radius of the outer circumference of the oil duct is given as
R o i l = R H V ( 1 X ) + X R L V ,
To simplify further calculations, we introduce the ratio of the cylindrical surface area with a radius equal to the distance from the center to the outer boundary of the oil duct to the distance between the high- and low-voltage windings. This value is included in the formulas for the capacitances of individual elements, represented in Figure 3 as capacitors in the CIGRE XY model:
Σ = S d = 2 π R o i l h R H V R L V = 2 π [ R H V ( 1 X ) + X R L V ] h R H V R L V ,
where S—“electrode” surface area, RHV—radius of the HV winding, h—winding height, RLV—radius of the LV winding, Roil—radius of the outer edge of the oil duct.
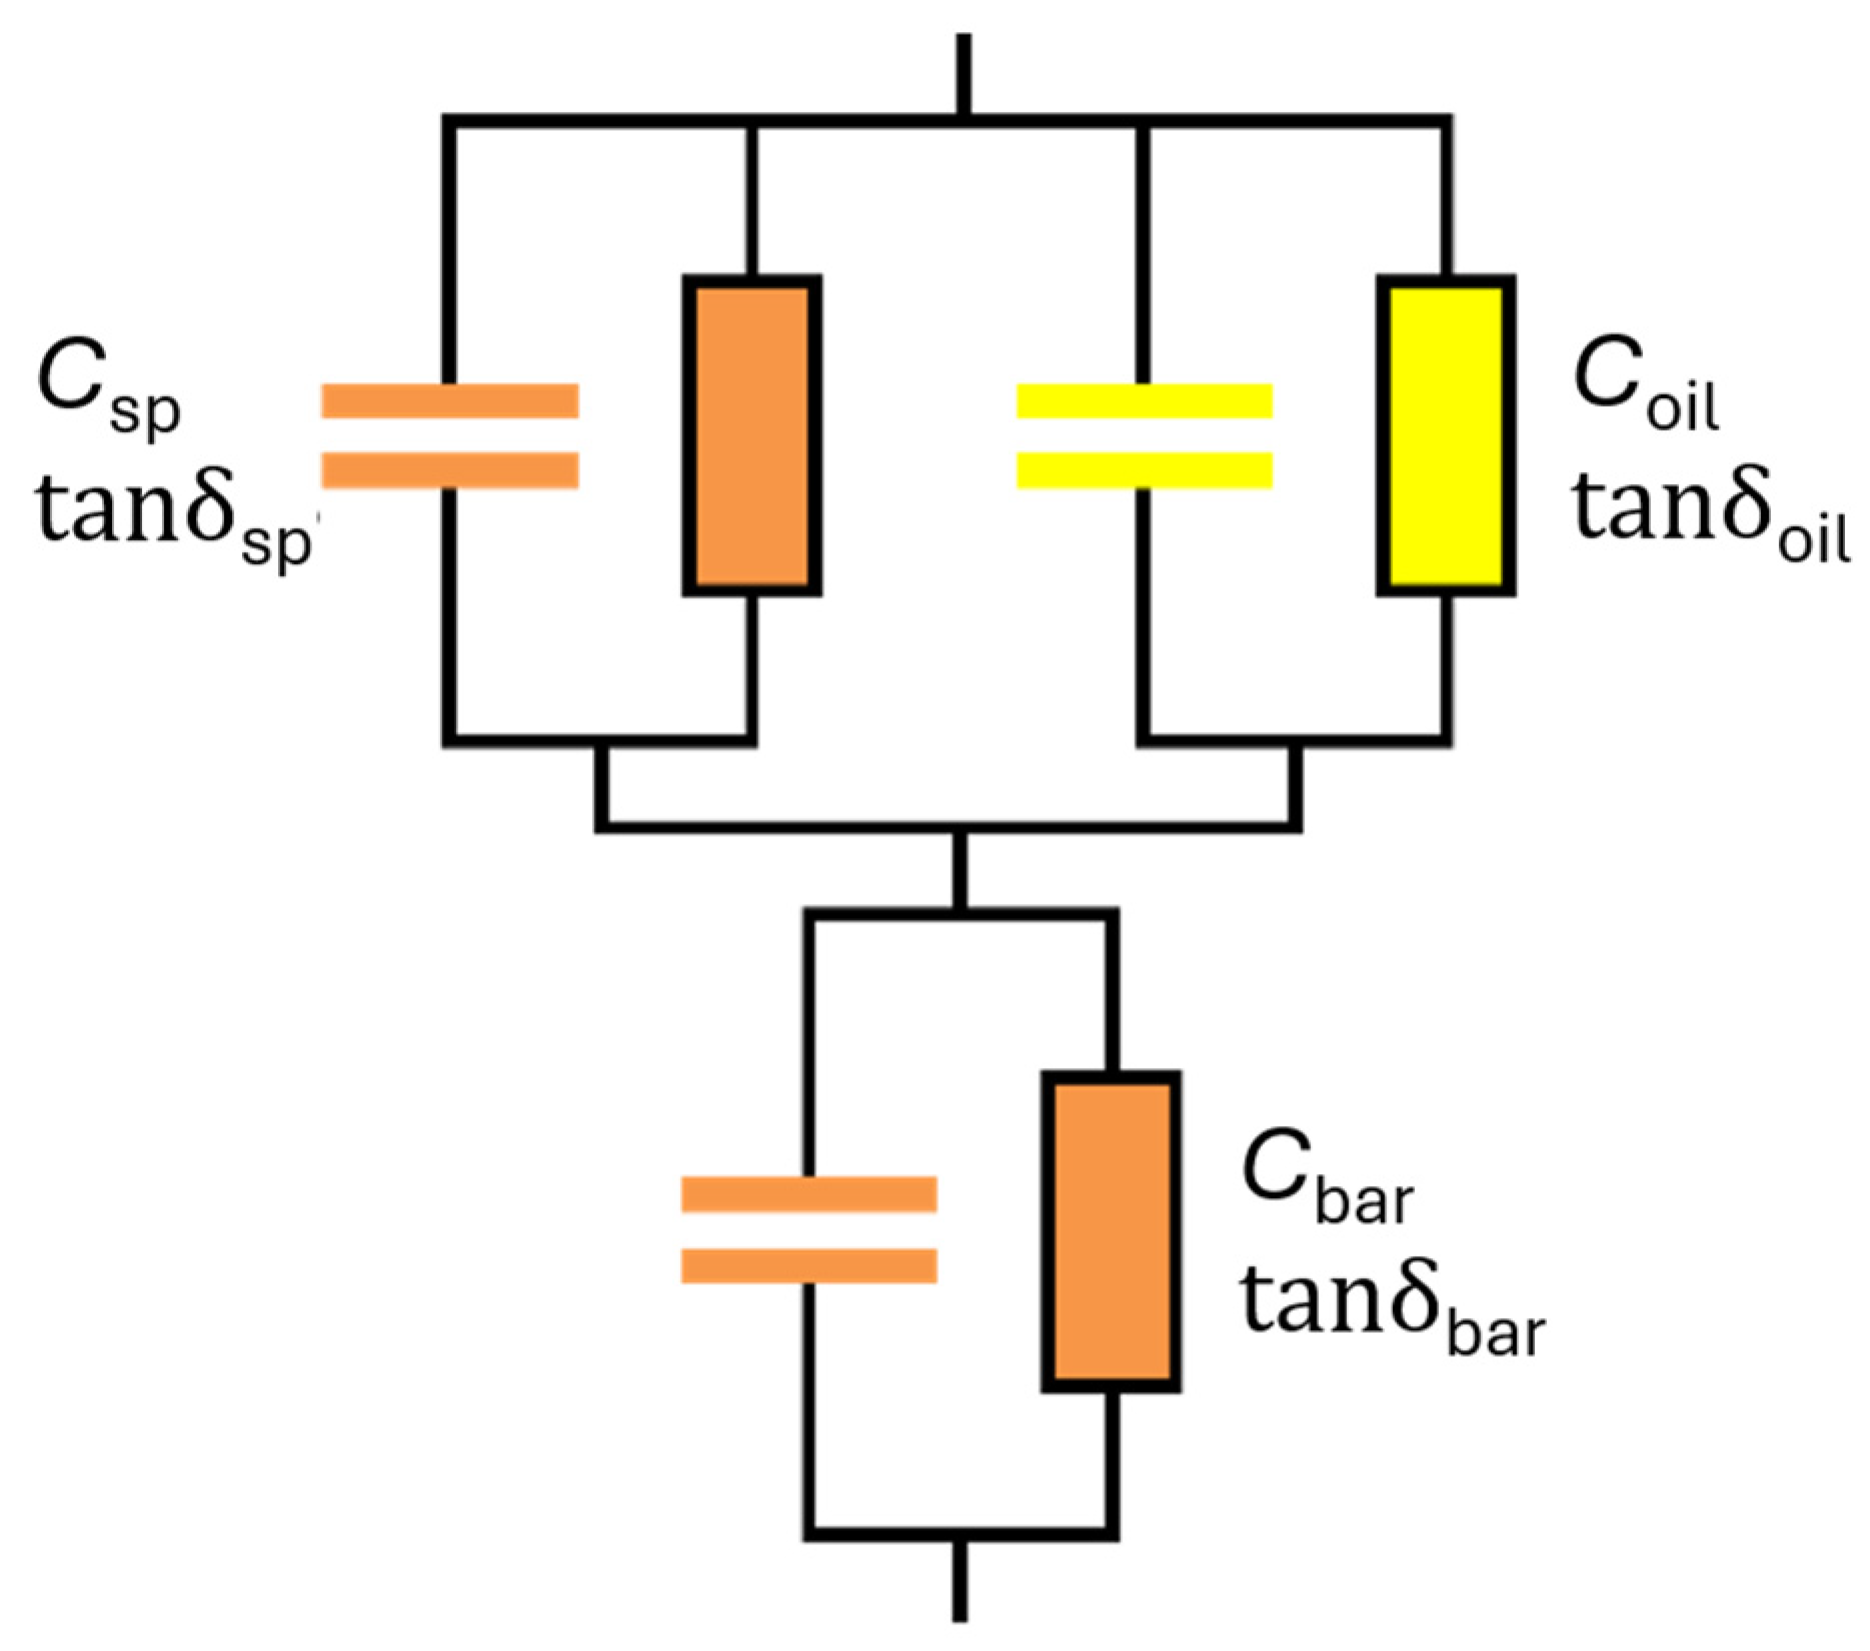
The values of X and Y are calculated based on the design data of a specific transformer. In most power transformers, X ranges from about 0.15 to about 0.5, while Y ranges from 0.15 to 0.25. Replacing the complex cylindrical capacitor (Figure 1) with the CIGRE insulation model has significantly simplified the electrical representation of the insulation, as shown in Figure 2, reducing it to a series–parallel RC network (Figure 3).
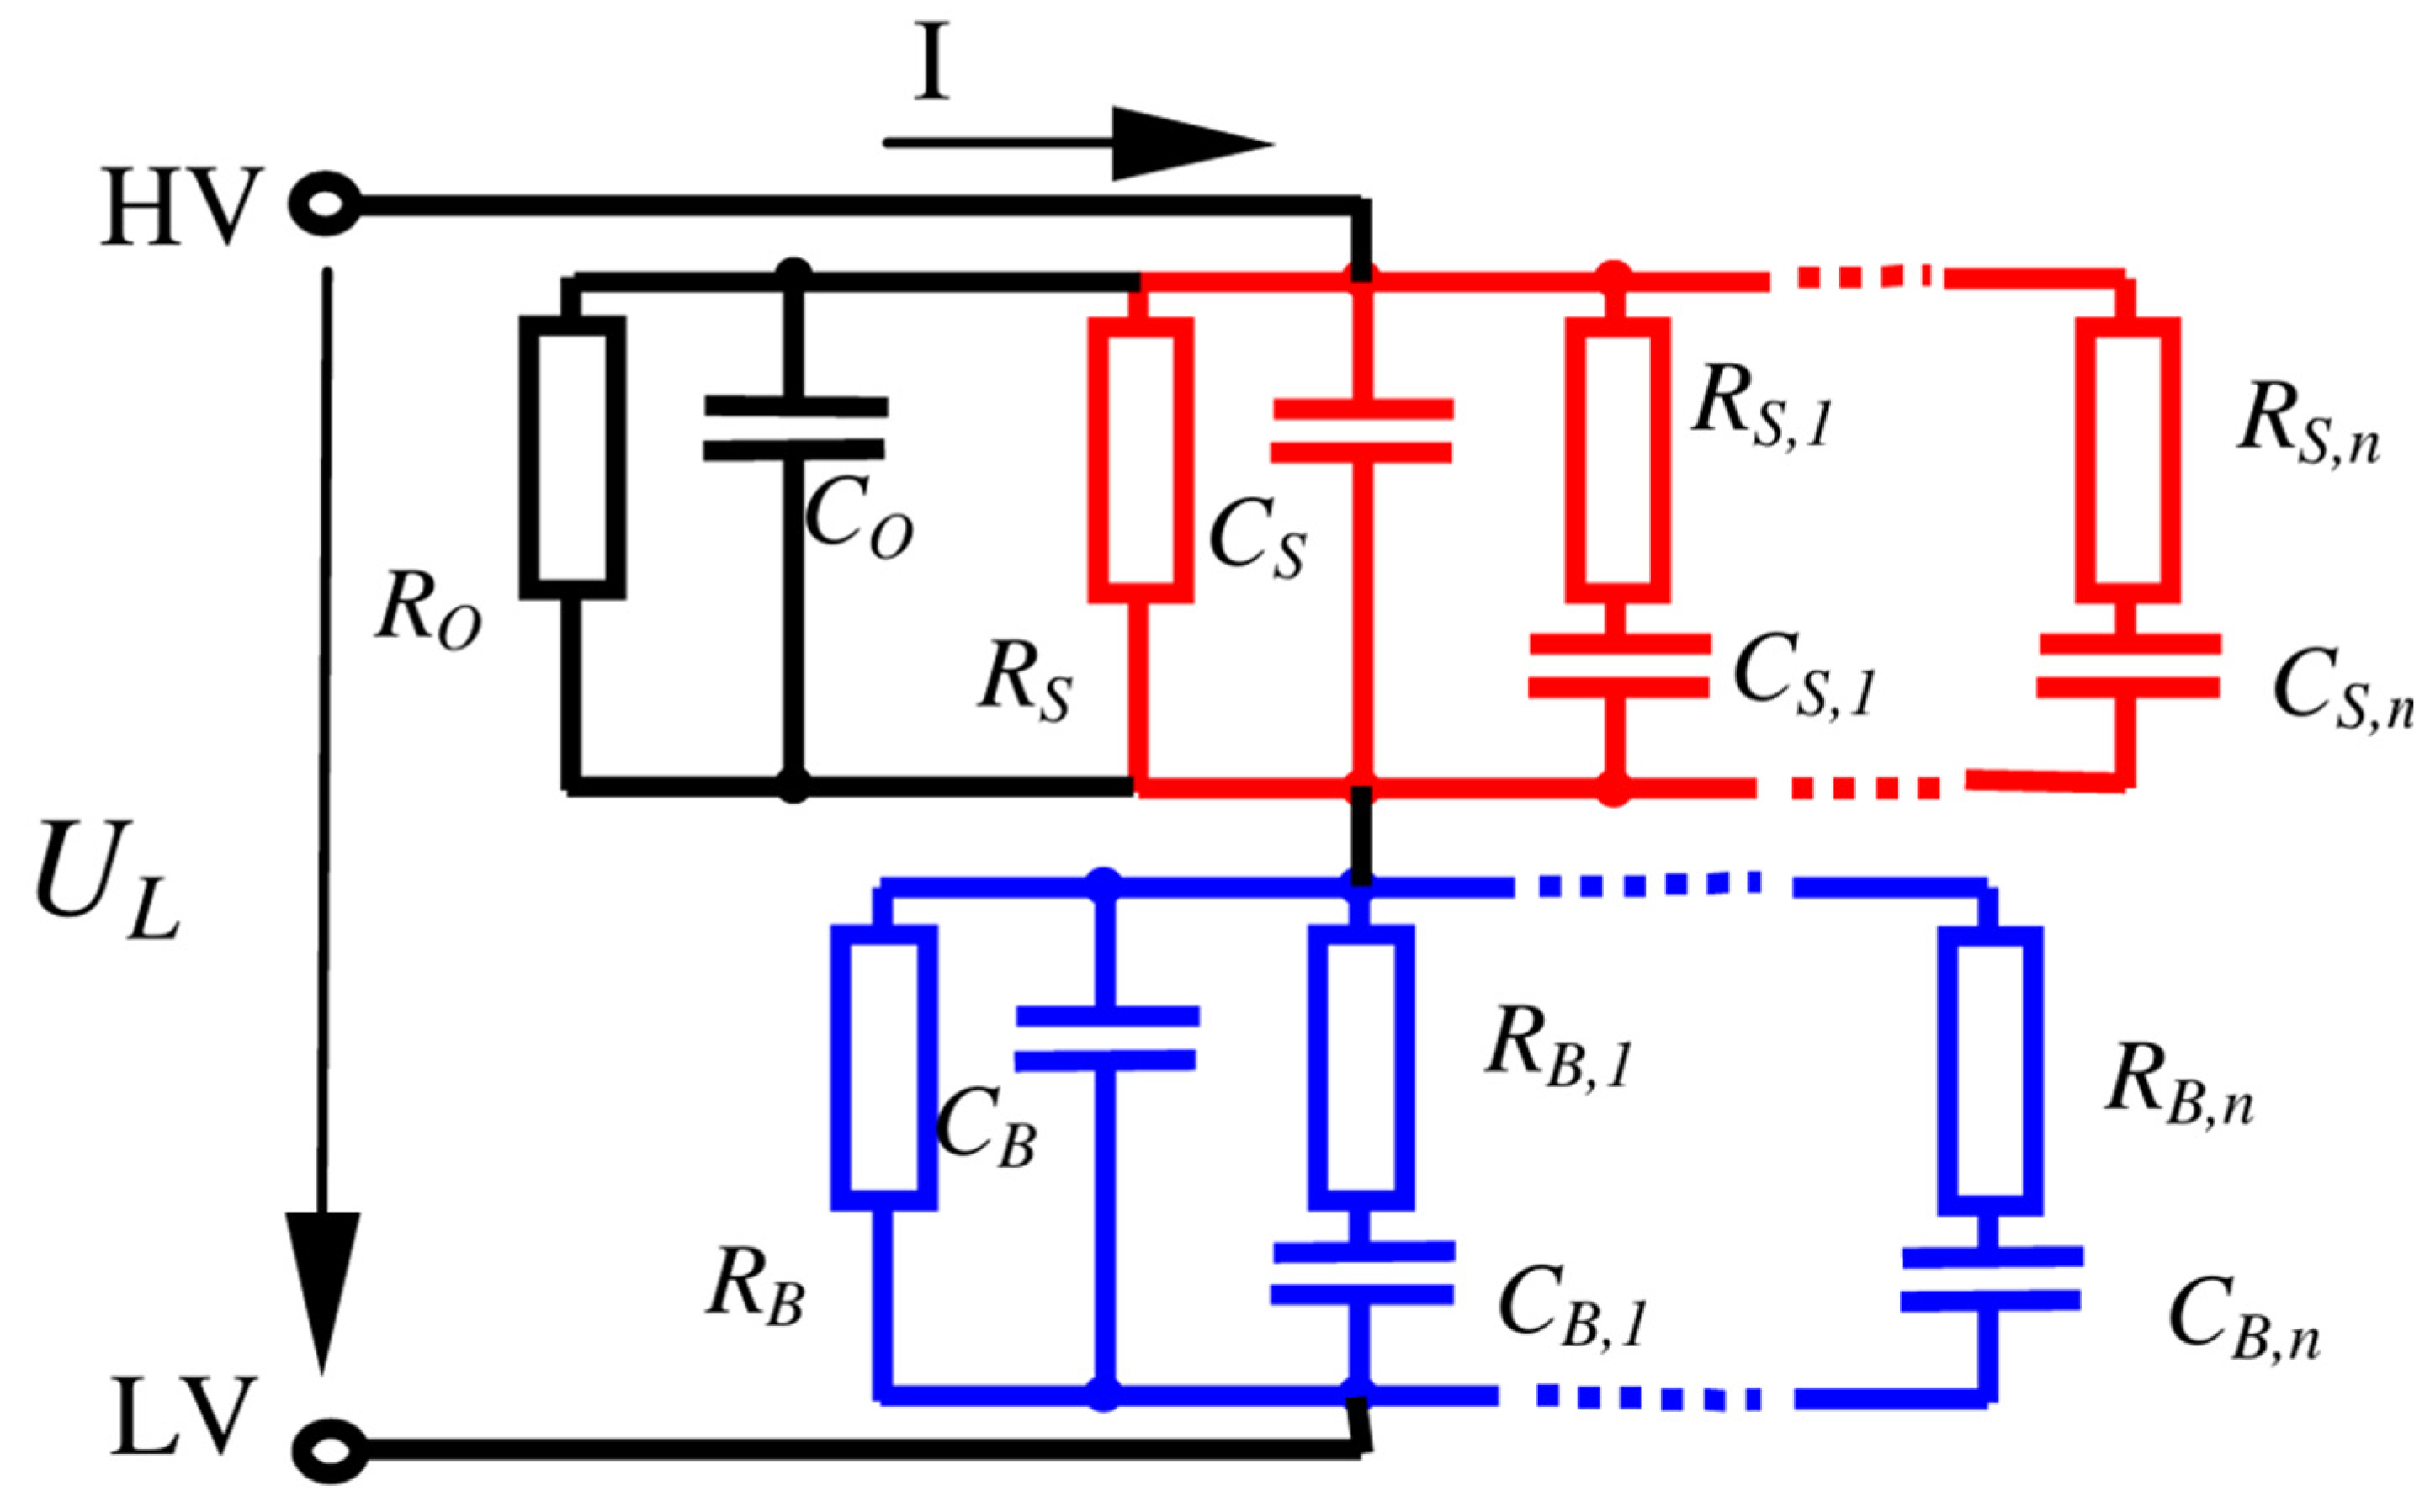
For more than half a century, in numerous publications, see, for example [50,51,52,53], the equivalent circuit of each element of the CIGRE XY model shown in Figure 3—the spacers, barriers, and oil duct—has been represented by several parallel branches consisting of RC elements connected in parallel and in series (Figure 4).
The authors of these and other publications use the arrangement of individual branches of the equivalent circuit shown in Figure 4 to represent several relaxation processes occurring simultaneously in each component of transformer insulation. It should be emphasized that the equivalent circuit shown in Figure 4 can only serve as an illustration of the complexity of relaxation processes occurring in transformer insulation. In contrast, measurements of the electrical parameters of actual materials and insulation systems with an impedance meter do not allow for the direct identification of the relaxation mechanisms present in the tested materials. This is because the meter provides values of the loss tangent, capacitance, resistance, or other AC parameters, each of which represents the resultant value of all conduction and dielectric relaxation mechanisms occurring in the tested material or insulation system at the measurement frequency. These mechanisms can only be distinguished based on an in-depth analysis of the obtained dependencies on frequency and temperature, as well as by modifying the content of individual components of the composite materials forming transformer insulation.
Only in the parallel equivalent circuit can the conductivity σ(ω) and the real component of the dielectric permittivity ε’(ω) of isotropic materials be correctly determined. Below, the calculation of the system parameters according to CIGRE is presented for measurements performed in the parallel equivalent circuit for the system shown in Figure 3. The calculations were carried out using Equations (3)–(5), provided in many textbooks on electrical engineering (see, for example [55]).
In the case of two capacitors connected in parallel, the loss tangent is determined using the following equation:
tan δ = C 1 tan δ 1 + C 2 tan δ 2 C 1 + C 2 ,
Here and in Equations (18)–(20), C1, C2 are capacitances of the capacitors, tanδ1, tanδ2—loss tangents of these capacitors determined in the parallel equivalent circuit.
In the case of two capacitors connected in series, as in the CIGRE model, Figure 3:
tan δ = C 1 tan δ 2 + C 2 tan δ 1 C 1 + C 2 ,
Capacitance of two capacitors connected in parallel:
C = C 1 + C 2 ,
Capacitance of two capacitors connected in series:
C = C 1 C 2 C 1 + C 2 ,
Taking into account the equivalent circuit shown in Figure 3, the procedure for determining the AC parameters of the XY system can be presented as follows. In the parallel circuit, it is necessary to measure the frequency–temperature dependencies (the so-called reference characteristics) of the capacitance of oil-impregnated moist pressboard Ccel, insulating oil Coil and the corresponding values of the loss tangent tanδcel and tanδoil.
Based on the measurements and the geometric dimensions of the measuring capacitor:
C P = ε ε 0 S d ,
the dielectric permittivity values of cellulose and oil ε’cel, ε’oil as well as their dependencies on frequency and temperature, are calculated.
Taking into account the geometric dimensions of the power transformer insulation system, according to Equation (2), the capacitance of the oil duct in the parallel circuit (Figure 3) is given by
C o i l = ε o i l ε 0 S o i l d o i l = ε o i l ε 0 1 Y 1 X Σ ,
The capacitance of the spacers with width Y and thickness (1 − X):
C s p a c = ε c e l ε 0 Y 1 X Σ ,
The capacitance of the spacers and the oil duct connected in parallel is
C o i l + s p a c = ε 0 ( ε o i l 1 Y + ε c e l Y ) 1 X Σ ,
Using Equations (3) and (8)–(10), we calculate the loss tangent for the spacers and the oil duct connected in parallel:
tan δ o i l + s p a c = ε o i l 1 Y tan δ o i l + ε c e l Y tan δ c e l ( ε o i l 1 Y + ε c e l Y ) ,
We calculate the capacitance of the barriers:
C b a r = ε c e l ε 0 S b a r d b a r = ε c e l ε 0 X Σ ,
The loss tangent of the barriers is equal to the loss tangent of cellulose:
tan δ b a r = tan δ c e l ,
Using Equation (6), we calculate the capacitance of the system of barriers connected in series with the spacers and the oil duct, which describes the capacitance in the CIGRE model:
C C I G R E = ε 0 ( ε o i l 1 Y + ε c e l Y ) ε c e l ( ε o i l 1 Y + ε c e l Y ) X + ε c e l ( 1 X ) Σ ,
Using Equation (4), we calculate the loss tangent for the system according to CIGRE:
tan δ C I G R E = ( ε o i l 1 Y + ε c e l Y ) 2 X tan δ c e l + ( 1 X ) ε c e l ( ε o i l 1 Y tan δ o i l + ε c e l Y tan δ c e l ) ( ε o i l 1 Y + ε c e l Y ) [ ( ε o i l 1 Y + ε c e l Y ) X + ( 1 X ) ε c e l ]
To verify the correctness of Equation (15) for tanδCIGRE, we will substitute several characteristic values of X and Y into Equation (15).
(a)
X = 1, Y = 0; X = 0, Y = 1; and X = 1, Y = 1—the entire CIGRE system consists of pressboard. For all three combinations, Equation (15) reduces to the form
tan δ C I G R E = tan δ c e l
(b)
X = 0, Y = 0. In this case, the insulation consists solely of oil. Equation (15) reduces to
tan δ C I G R E = tan δ o i l
(c)
X = 0.5, Y = 0. This corresponds to two capacitors connected in series, each with half the thickness and with an electrode area equal to that of the CIGRE capacitor. One of them has pressboard as the dielectric, while the other has oil. Equation (15) then takes the following form:
tan δ C I G R E = ε o i l tan δ c e l + ε c e l tan δ o i l ε o i l + ε c e l
This is consistent with Equation (4) for the series connection of two capacitors.
(d)
X = 0, Y = 0.5. This corresponds to two capacitors connected in parallel, each with the same thickness and with electrode areas equal to half of the electrode area of the CIGRE capacitor. Equation (15) reduces to
tan δ C I G R E = tan δ o i l ε o i l + tan δ c e l ε c e l ε o i l + ε c e l
This equation is consistent with Equation (3) for the loss tangent of capacitors connected in parallel.
The calculations performed for cases (a)–(d) showed that the equation for the loss tangent of the CIGRE XY system correctly describes all of them. This means that it can be applied for any values of X and Y, as well as for the material parameters tanδcel, tanδoil, εoil, and εcel.
Based on Equation (14) for CCIGRE, we calculate the equivalent permittivity of the CIGRE insulation system by replacing the XY system (Figure 3) with a homogeneous dielectric of permittivity ε’CIGRE, so that the capacitance of the system remains unchanged:
C C I G R E = ε 0 ( ε o i l 1 Y + ε c e l Y ) ε ˙ c e l ( ε o i l 1 Y + ε c e l Y ) X + ε c e l ( 1 X ) Σ = ε C I G R E ε 0 Σ ,
From Equation (16), we obtain the value of the equivalent permittivity of the CIGRE system:
ε C I G R E = ( ε o i l 1 Y + ε c e l Y ) ε c e l ( ε o i l 1 Y + ε c e l Y ) X + ε c e l ( 1 X ) ,
To verify Equation (17), we substitute several selected values of the parameters X and Y into it.
(e)
X = 1, Y = 0; X = 0, Y = 1; and X = 1, Y = 1, corresponding to insulation consisting only of impregnated pressboard. We obtain
ε C I G R E = ε c e l
(f)
X = 0, Y = 0, which corresponds to insulation consisting solely of oil. We obtain
ε C I G R E = ε o i l
(g)
Y = 0.5, X = 0 corresponds to two capacitors connected in parallel, each with half the electrode area and the same thickness. We obtain
ε C I G R E = ε o i l + ε c e l 2
This equation is consistent with the equation for the parallel connection of capacitors.
(h)
Y = 0, X = 0.5—series connection of capacitors with half the thickness and identical electrode areas. We obtain
ε C I G R E = 2 ε c e l ε o i l ε c e l + ε o i l
This equation is consistent with the equation for the series connection of capacitors.
The calculations performed for cases (e)–(h) show that the equation for the equivalent permittivity of the CIGRE XY system correctly describes all of them. This means that it can be applied for any values of X and Y, as well as for the material parameters εoil and εcel.
The next parameter used in the analysis of transformer insulation is the dielectric loss factor ε’’CIGRE. This parameter is determined from the equation
tan δ C I G R E = ε C I G R E ε C I G R E ,
By substituting into Equation (18) the values from Equations (15) and (17) and rearranging, we obtain
ε C I G R E = ε c e l [ ( ε o i l 1 Y + ε c e l Y ) 2 X tan δ c e l + ( 1 X ) ε c e l ( ε o i l 1 Y tan δ o i l + ε c e l Y tan δ c e l ) ] [ ( ε o i l 1 Y + ε c e l Y ) X + ( 1 X ) ε c e l ] [ ( ε o i l 1 Y + ε c e l Y ) X + ε c e l ( 1 X ) ]
The equations for the loss tangent tanδCIGRE (15), ε’CIGRE (17), and ε’’CIGRE (19) make it possible, based on laboratory-obtained reference dependencies of the parameters tanδcel, tanδoil, ε’oil, and ε’cel to calculate the frequency–temperature dependencies of the XY system parameters according to CIGRE: tanδCIGRE, ε’CIGRE, and oraz ε’’CIGRE.

2.2. Factors Influencing the AC Parameters of Power Transformer Insulation

In power transformers, the insulation system is formed by pressboard and oil (Figure 1 and Figure 2). The moisture content in the oil is not constant and depends both on the moisture content in the pressboard and on the temperature [14]. As the temperature increases, moisture migrates from the pressboard into the oil. When the temperature decreases, the moisture content in the oil is reduced, as moisture migrates from the oil back into the pressboard.
As shown in the characteristics from [14], for a critical moisture content of 5%, the thermodynamic equilibrium moisture content in the oil at a temperature of 20 °C is about 18 ppm. An increase in temperature to 60 °C causes the oil moisture content to rise to about 137 ppm.
It should be noted that changes in oil moisture content have practically no effect on the moisture content of cellulose. In power transformers, the mass of oil is about ten times greater than that of cellulose. According to Oommen’s characteristics [14], temperature changes in the insulation from 20 °C to 60 °C cause moisture migration from pressboard into the oil. For pressboard with 5% moisture content, the migration results in only about a 0.11% decrease, or about 0.022 times, in moisture content. This leads to negligible changes in the AC parameters of cellulose. In contrast, the oil moisture content increases by about 7.4 times, which may cause noticeable changes in the values of tanδoil, ε’oil, and ε’’oil. Such oil moistening occurs naturally as the water content in pressboard increases during the long-term operation of transformers. This means that when calculating the loss tangent, permittivity, and dielectric loss factor of transformer insulation in the XY system according to CIGRE, the changes in tanδoil, ε’oil, and ε’’oil caused by moisture migration from cellulose into the oil must be taken into account. Until recently, it was assumed (see, for example, [56]), that the so-called reference characteristics of pressboard were sufficient to estimate the moisture content in the cellulose component of the insulation. These characteristics are determined in laboratory tests as frequency–temperature dependencies of tanδcel, ε’cel, and ε’’cel for different moisture levels. Considering the changes in oil moisture content, especially for higher moisture levels in pressboard, it follows that in order to correctly determine the moisture content of the cellulose component, reference characteristics must be obtained in the laboratory not only for pressboard but also for oil with different moisture contents. Only the determination of reference characteristics for both pressboard and insulating oil makes it possible to reasonably accurately estimate the cellulose moisture content based on AC measurements performed on an actual transformer.

3. Materials and Methods

Calculating the loss tangent of cellulose–oil insulation in power transformers with Equation (17), requires the AC values tanδcel, tanδoil, ε’cel and ε’oil, which must first be obtained in laboratory tests, as well as the geometric dimensions of the XY insulation system. The values of tanδcel, ε’cel, and ε’’cel of pressboard impregnated with insulating oil are functions of frequency, temperature, and moisture content. In many publications (for example [57,58,59,60]), such dependencies were determined for pressboard impregnated with mineral oil at moisture contents of 1%, 2%, 3%, and 4%. The characteristics determined in [57,58] are considered reference characteristics. It should be noted that these parameters were obtained with relatively low accuracy, since the measurements were carried out at only three frequency points per decade. Only three measurement temperatures were used: 20 °C, 50 °C, and 80 °C. This does not allow for the determination of accurate frequency–temperature dependencies of the measured parameters. Furthermore, these studies did not take into account the most important moisture content—the so-called critical moisture content of 5% [18,19,20]. Approaching, reaching, or even exceeding this value during long-term operation may lead to a catastrophic transformer failure. One possible cause of such a failure is the so-called bubble effect [61,62]. Moistening of the pressboard was carried out in accordance with a standard procedure that has been used for many years, described, for example, in [58,61,63,64,65]. The preparation of pressboard samples consisted of vacuum drying (p < 1 hPa) at a temperature of 80 °C for 3 days. The pressboard was then moistened in atmospheric air to the desired value. Impregnation with mineral oil was performed in a hermetically sealed vessel at 45 °C for 14 days. The application of this standard pressboard moistening procedure ensures repeatability and enables the comparison of results obtained in different laboratories. The target water content in the pressboard was set to 5%. When determined by the Karl Fischer method [66] after moistening, it differed slightly from the assumed value and amounted to 5.17%. This value is close to the critical moisture content.
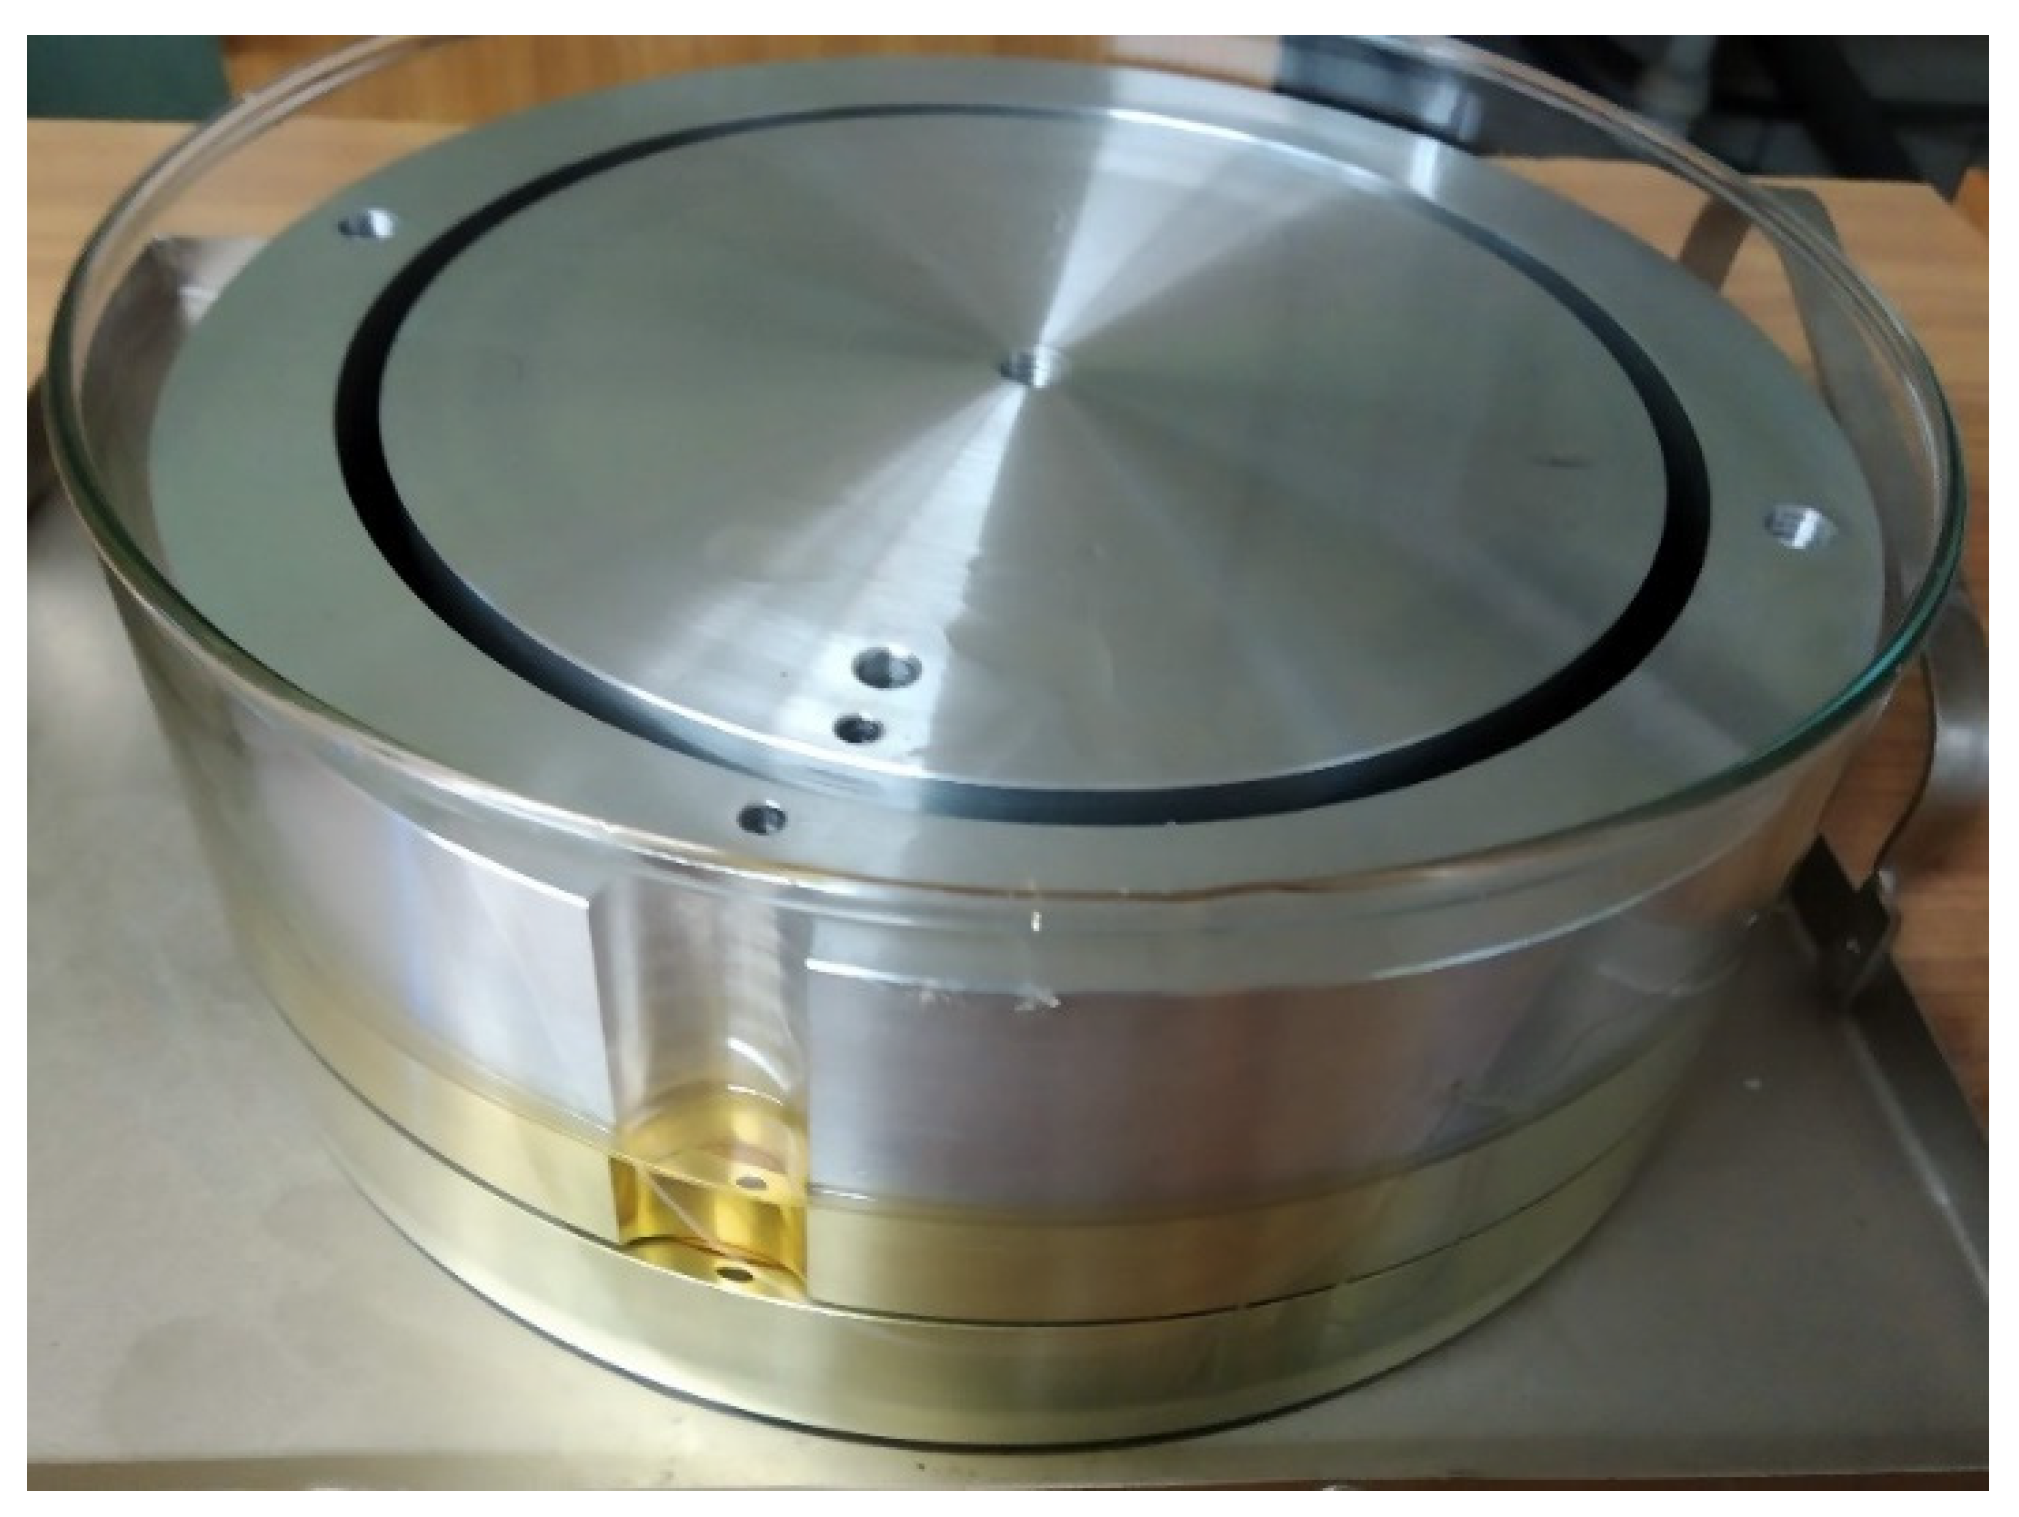
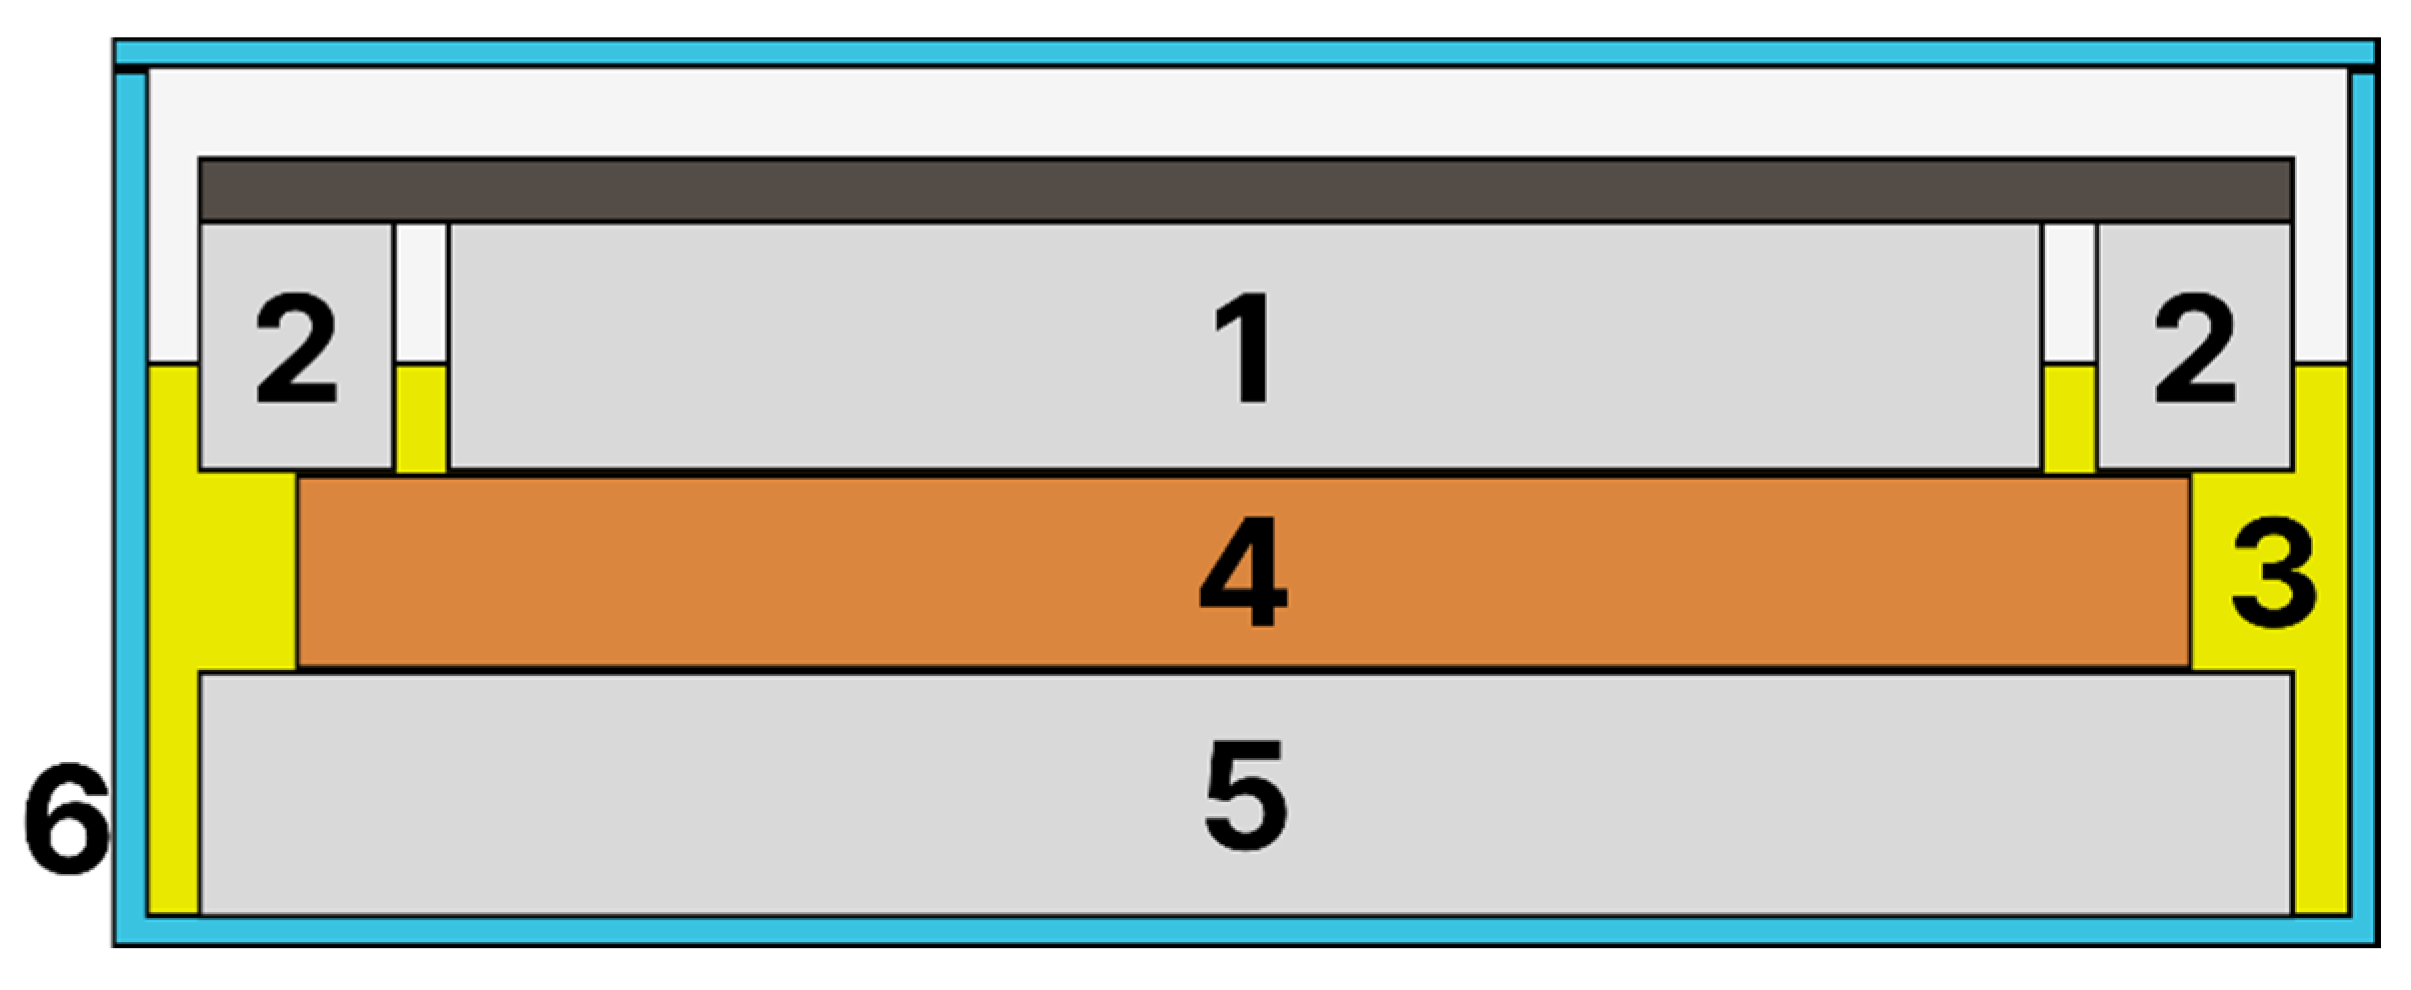
The frequency measurements were carried out using a PDC-FDS Dirana meter [67] with the resolution increased to 6 points per frequency decade in the range from 10−4 Hz to 10−3 Hz and to 10 points per decade in the range from 10−3 Hz to 5 kHz. The measurements were performed in the temperature range from 20 °C to 60 °C with a step of 8 °C. The climate chamber used for temperature stabilization provided long-term temperature maintenance accuracy not exceeding ±0.01 °C. A three-electrode measuring capacitor was used for the measurements (Figure 5).
A cross-section of the measuring capacitor with the pressboard sample is shown in Figure 6.
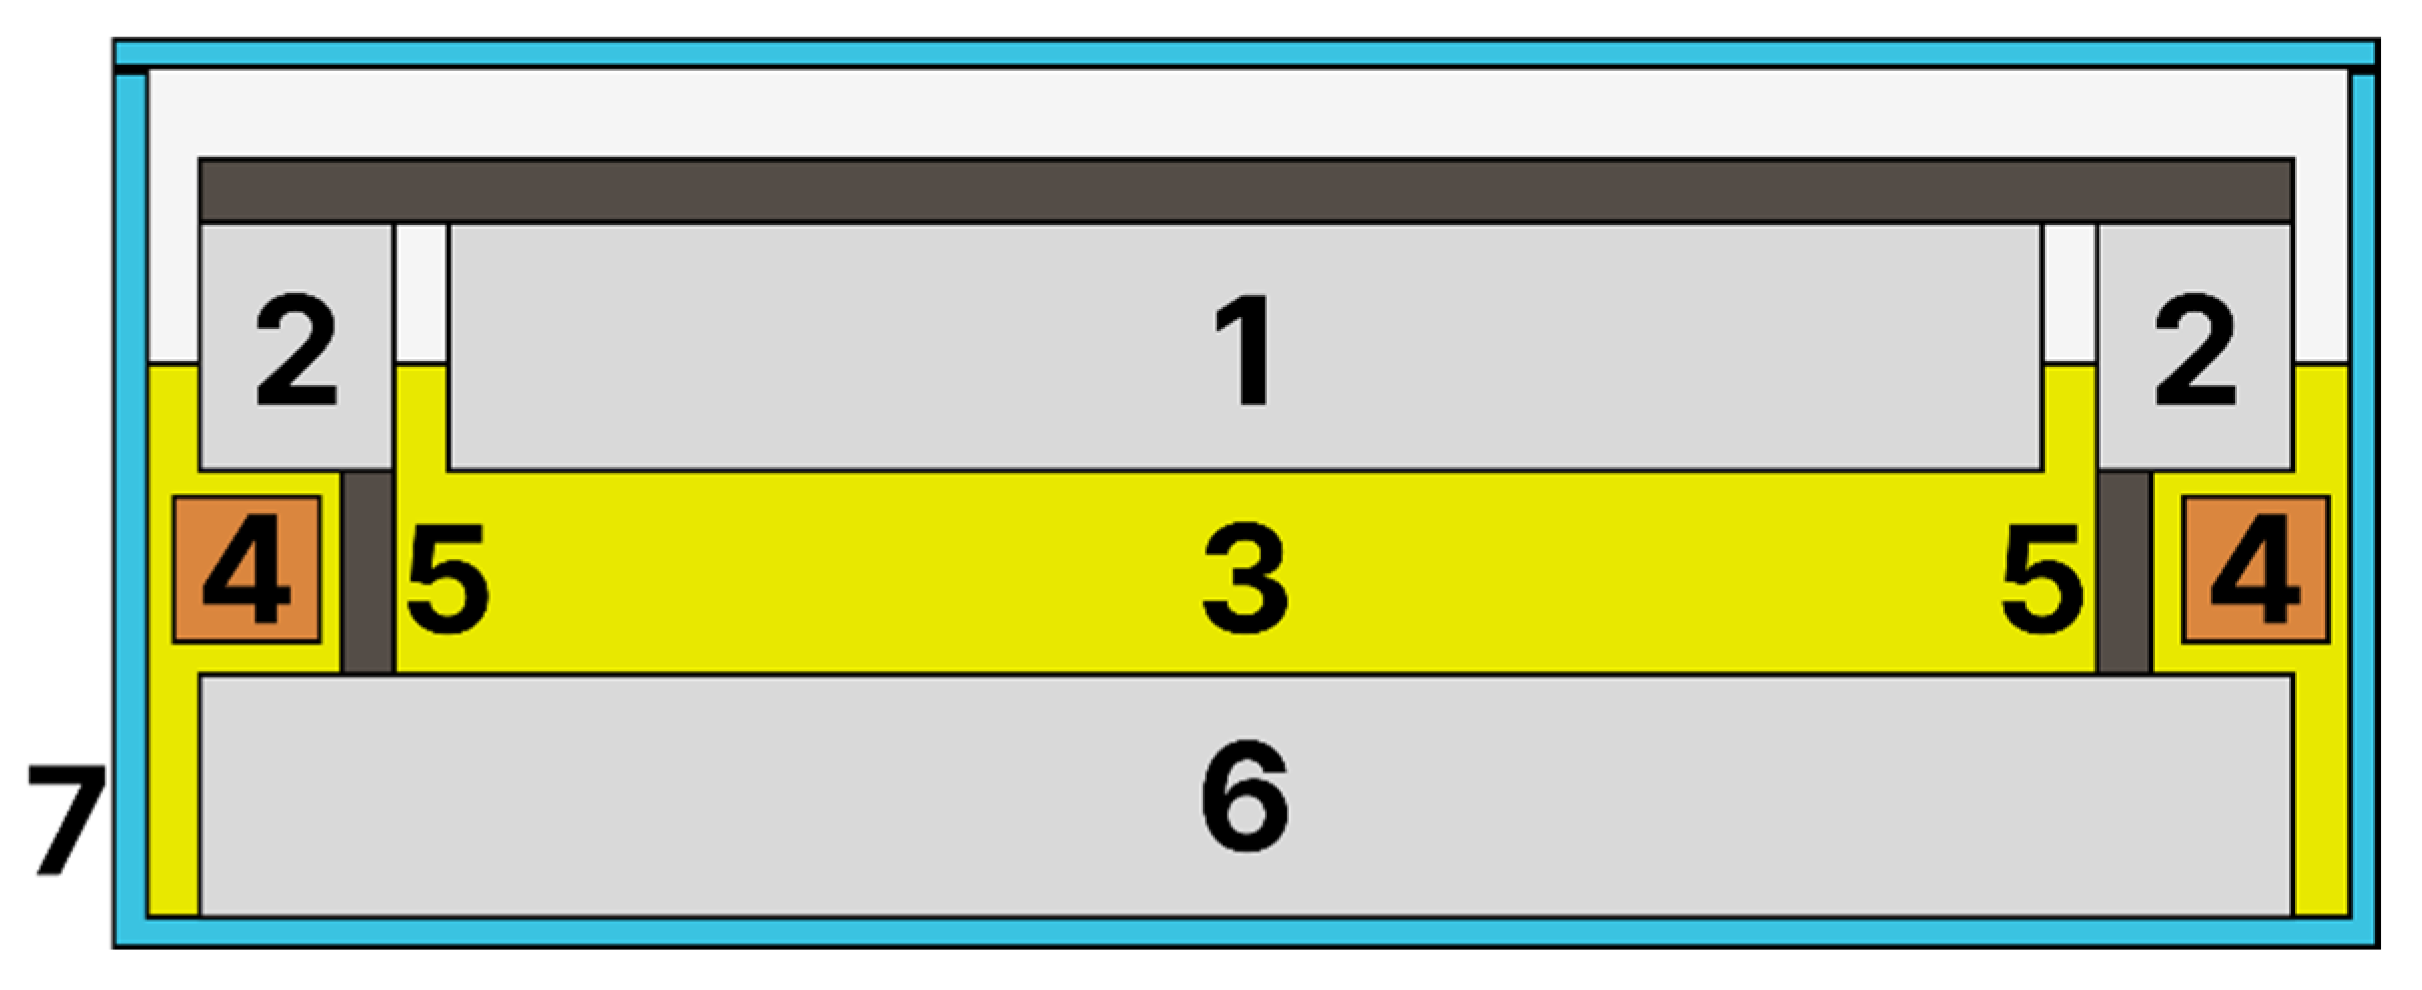
A modified three-electrode measuring capacitor system was used to measure the AC parameters of mineral oil. The cross-section of the capacitor is shown in Figure 7. In the capacitor, instead of a pressboard plate, six, small glass plate spacers were placed. The spacers were located outside the measuring electrode area so as not to interfere with the measurements. In this way, the AC parameters of mineral oil with a moisture content not exceeding 7 ppm were measured. To determine the effect of moisture exchange between pressboard and oil, a second series of measurements was carried out by placing plates of moist oil-impregnated pressboard with a water content of 5.17% into the oil next to the capacitor. This method of oil moistening is identical to the moistening process in power transformers containing a cellulose insulation component with increased moisture. The arrangement of the pressboard plates is shown in Figure 7. The volume of the moist pressboard plates was, as in transformers, ten times smaller than the volume of the oil.
The vessel containing the measuring capacitor, oil, and moist pressboard was hermetically sealed and placed in a climate chamber at 20 °C for 100 h. During this time, moisture diffused from the moist oil-impregnated pressboard into the oil. After thermodynamic equilibrium was reached between the moisture contents of the pressboard and the oil, electrical parameters were measured at 20 °C. Next, after stabilizing the subsequent measurement temperature, the system was kept at that temperature for 15 h to reach the next equilibrium state at a higher level. These steps were repeated until measurements were completed at 60 °C.

4. Frequency–Temperature Measurements of the Basic Parameters of Transformer Insulation Components

As follows from Equations (15), (17) and (19), the correct determination of the basic parameters of the transformer insulation system requires the AC parameter values of the individual insulation components. For the cellulose component, these are tanδcel and ε’cel. For the second component—mineral oil—they are tanδoil and ε’oil.
Figure 8 shows the experimental frequency–temperature dependencies of tanδcel (a) and ε’cel (b) for pressboard with a moisture content of 5.17% impregnated with mineral insulating oil.
From Figure 8a, it can be seen that the tanδcel dependencies have a rather complex shape. Let us first analyze them based on the dependence for the highest measurement temperature, 60 °C. Starting from the lowest frequency, an increase in tanδcel is observed. At a frequency of about 1.5 × 10⁻³ Hz, the value of tanδcel reaches a maximum. Then, up to a frequency of about 2.5 Hz, a decrease in tanδcel is observed, where a minimum occurs. After passing through the minimum, tanδcel increases again up to a frequency of about 70 Hz, where another maximum is observed. Beyond this point, a monotonic decrease in tanδcel is observed. Within the investigated frequency range, the changes in tanδcel vary from about 25 at the low-frequency maximum to about 10−1 at the highest measurement frequency. With decreasing measurement temperature, the dependencies shift towards lower frequencies. At the same time, a slight reduction in the value of tanδcel at the low-frequency maximum is observed. The values at the minimum and at the maximum occurring in the mid-frequency range do not change. In publication [68], tanδcel dependencies for pressboard with 5% moisture content are presented in the frequency range from 10−1 Hz to 105 Hz. It should be noted that, our obtained dependencies are close to those presented in that publication within the same frequency range. What distinguishes our results is that we applied a much wider frequency range.
Figure 8b shows the frequency–temperature dependencies of the permittivity ε’cel of the pressboard-insulating oil–water composite with a moisture content of 5.17%. The analysis of these dependencies begins with the highest temperature, 60 °C. As seen in the figure, the ε’cel dependence consists of two stages of decrease. In the low-frequency stage, the value of ε’cel decreases from about 3000 to about 25 at a frequency of approximately 10−1 Hz. This is followed by a region of nearly constant ε’cel. Starting from a frequency of about 1 Hz, a second stage of decrease in ε’cel is observed, reaching a nearly constant value of about 5.2. A decrease in temperature shifts the ε’cel(f) dependence towards lower frequencies. At the same time, the high-frequency region of constant value becomes extended. Similar dependencies were observed in [58] for pressboard moistened to 5.06%. In that publication, a low frequency resolution of 3 points per decade was used. In our measurements, a much higher resolution was applied, allowing for accurate representation of the frequency dependencies.
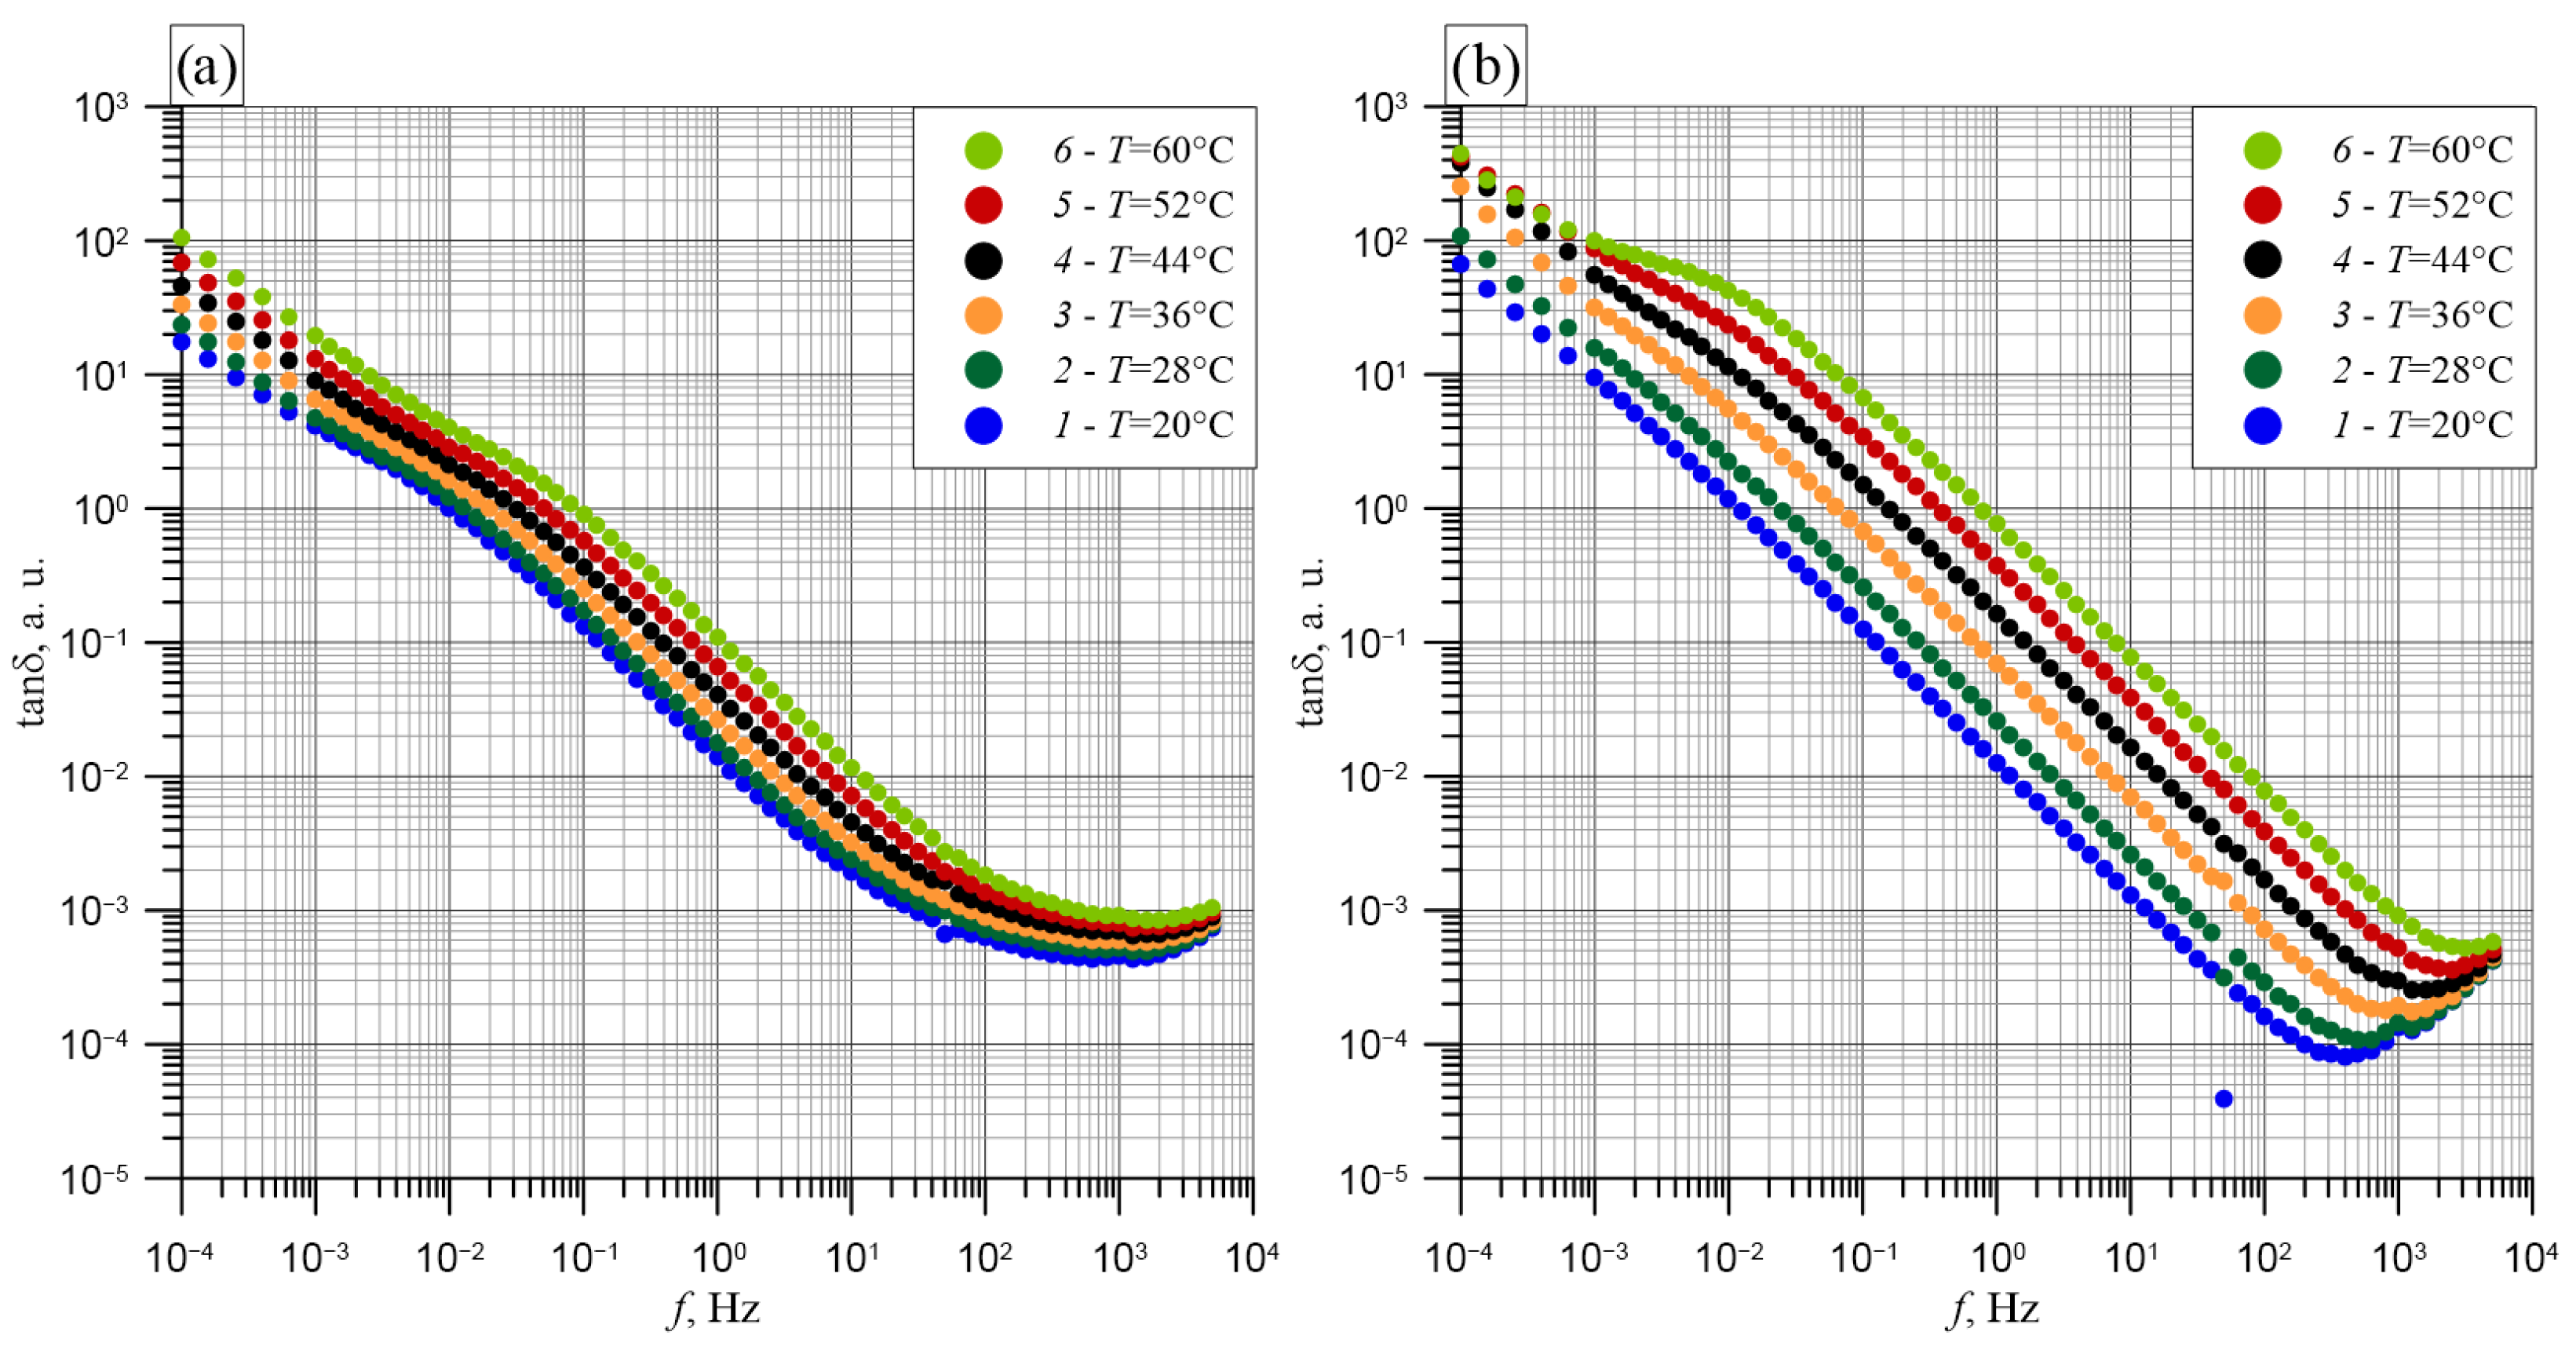
Figure 9 shows the frequency–temperature dependencies of the loss tangent for factory-new insulating oil (≤7 ppm) and for oil moistened by pressboard with a moisture content of 5.17%.
The dependencies for factory-new oil can be divided into three ranges. In the first frequency range, up to about 0.1 Hz, a decrease in tanδoil is observed. A further increase in frequency in the second range leads to an accelerated decrease in tanδoil. In the third frequency range, above 100 Hz, a broad minimum occurs.
Moistening of the oil by pressboard with a moisture content of 5.17% caused significant changes in the dependencies. First, a much stronger influence of temperature on the vertical shift in the curves is observed. This is probably due to the additional supply of water molecules from the pressboard as the temperature increases. Second, the first segment of the decrease practically disappeared, with only traces visible at the measurement temperatures of 52 °C and 60 °C. Third, the shape of the high-frequency minimum changed, with its width reduced several times. Lowering the measurement temperature decreases the minimum by almost an order of magnitude and shifts the dependencies towards lower frequencies. The range of tanδoil values also changed. For factory-new oil, the values range from 100 Hz to 10−3 Hz (at 60 °C), while for moistened oil they range from about 450 Hz to 5·10−4 Hz at 60 °C.
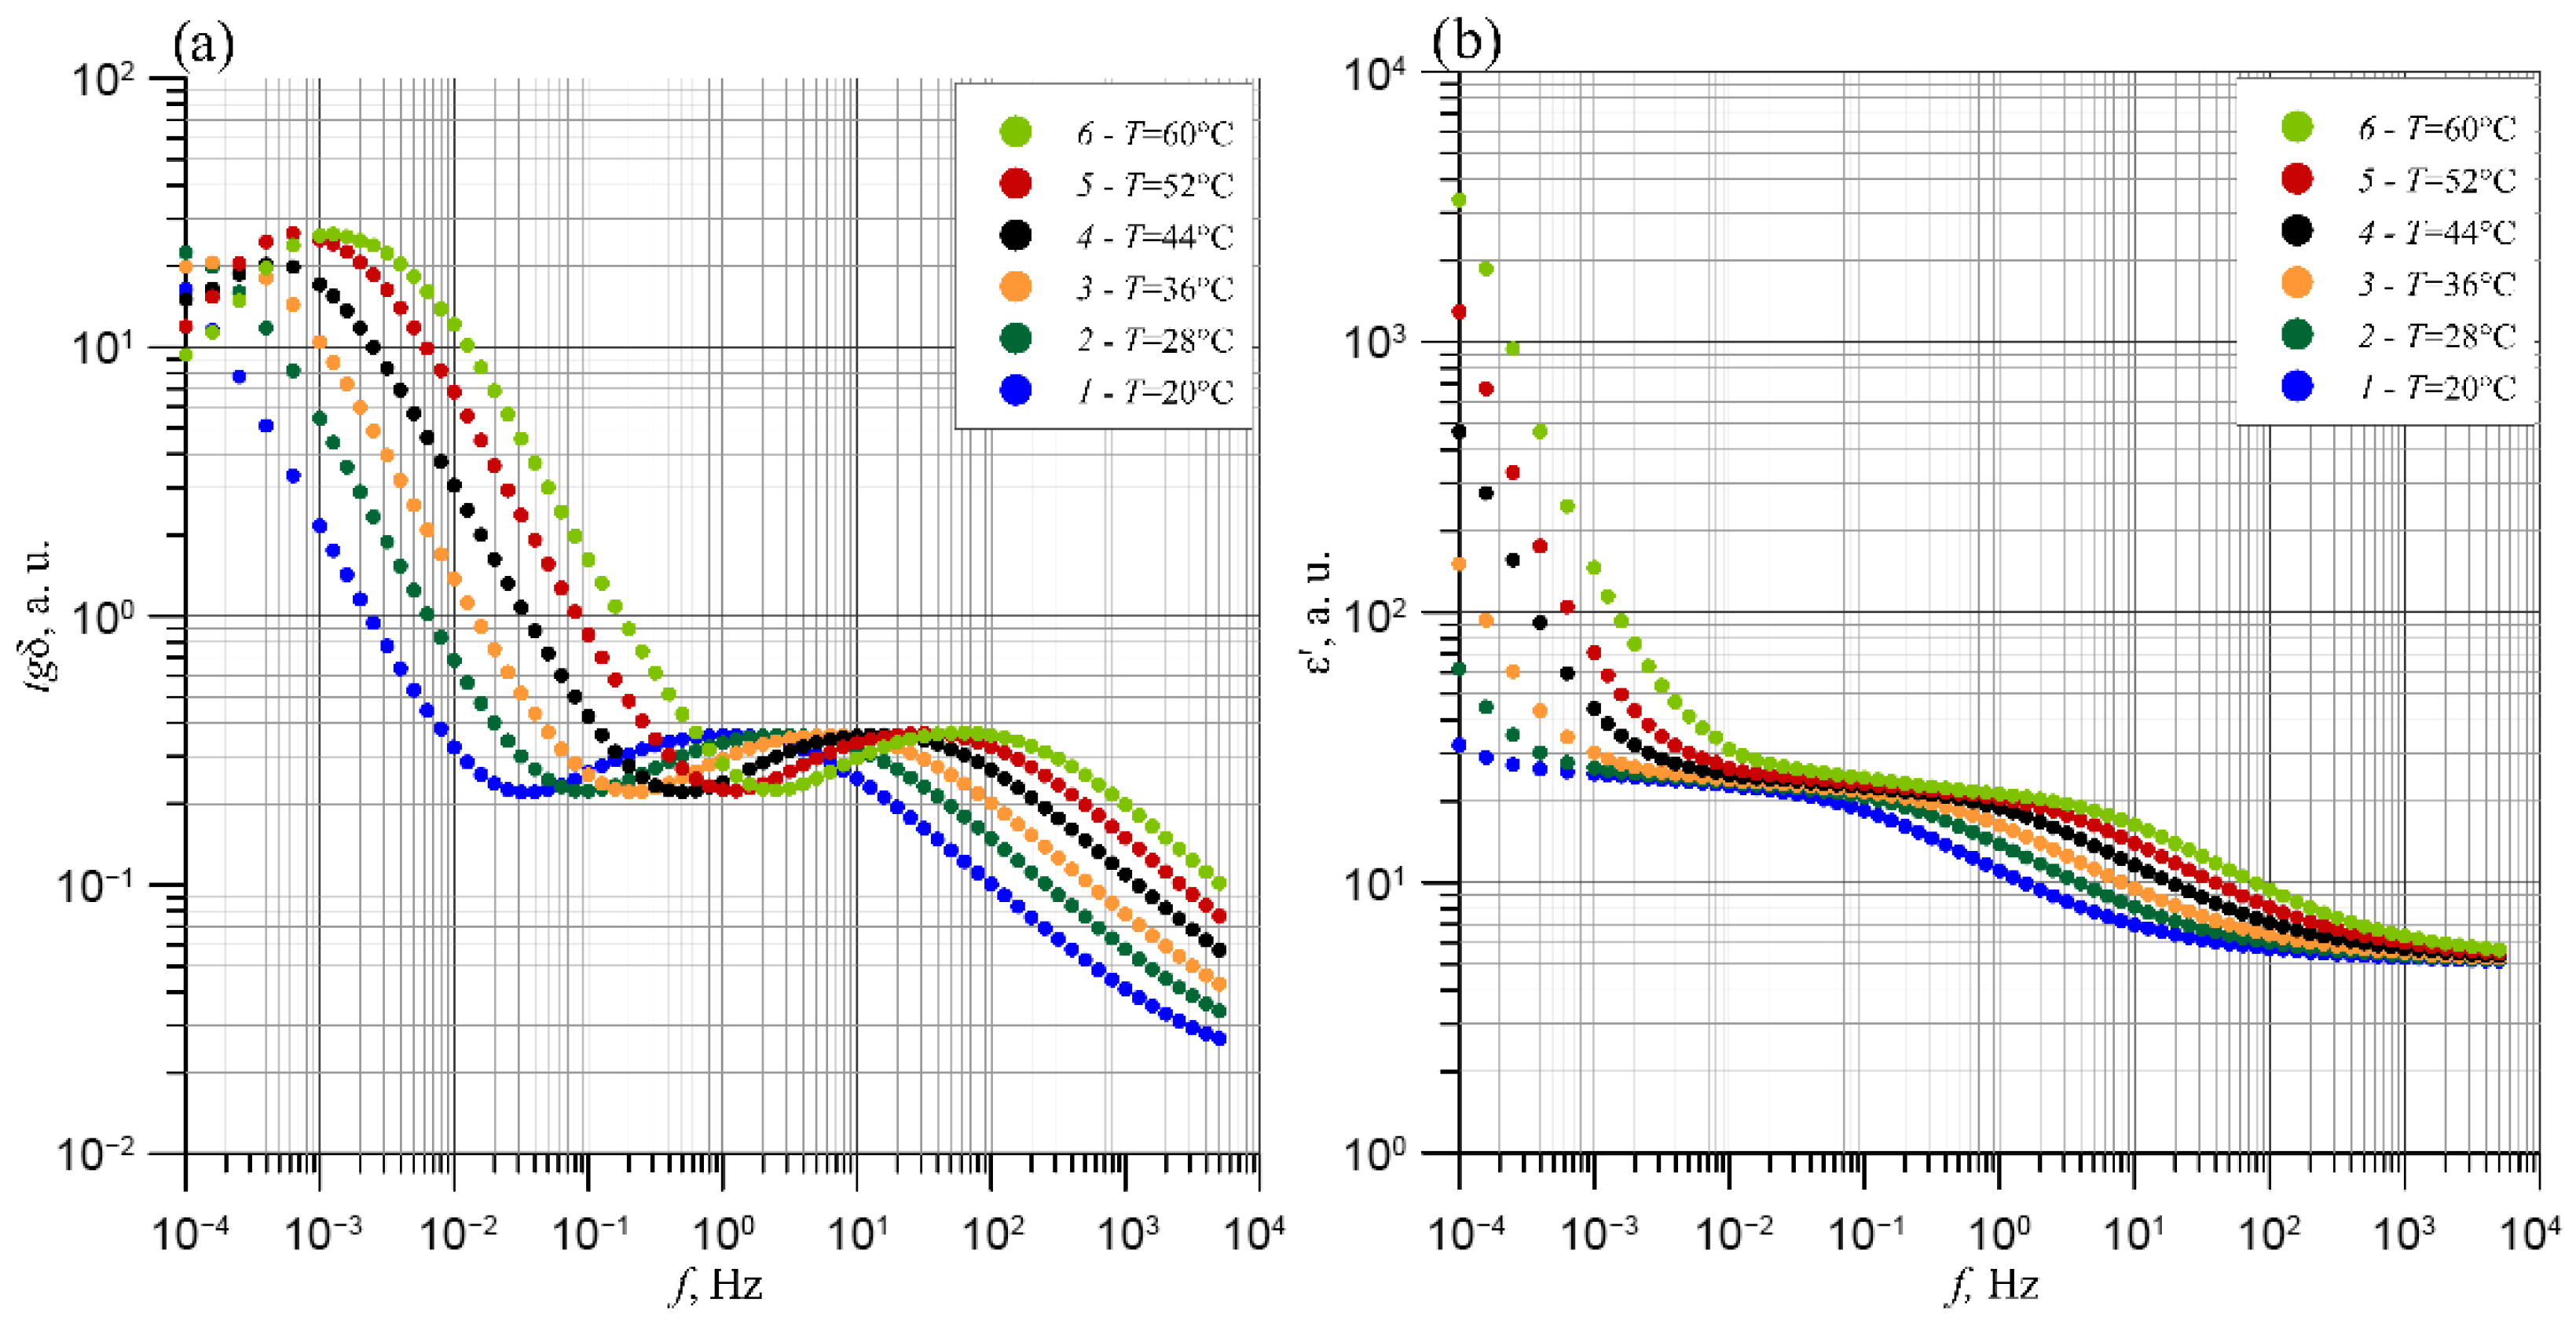
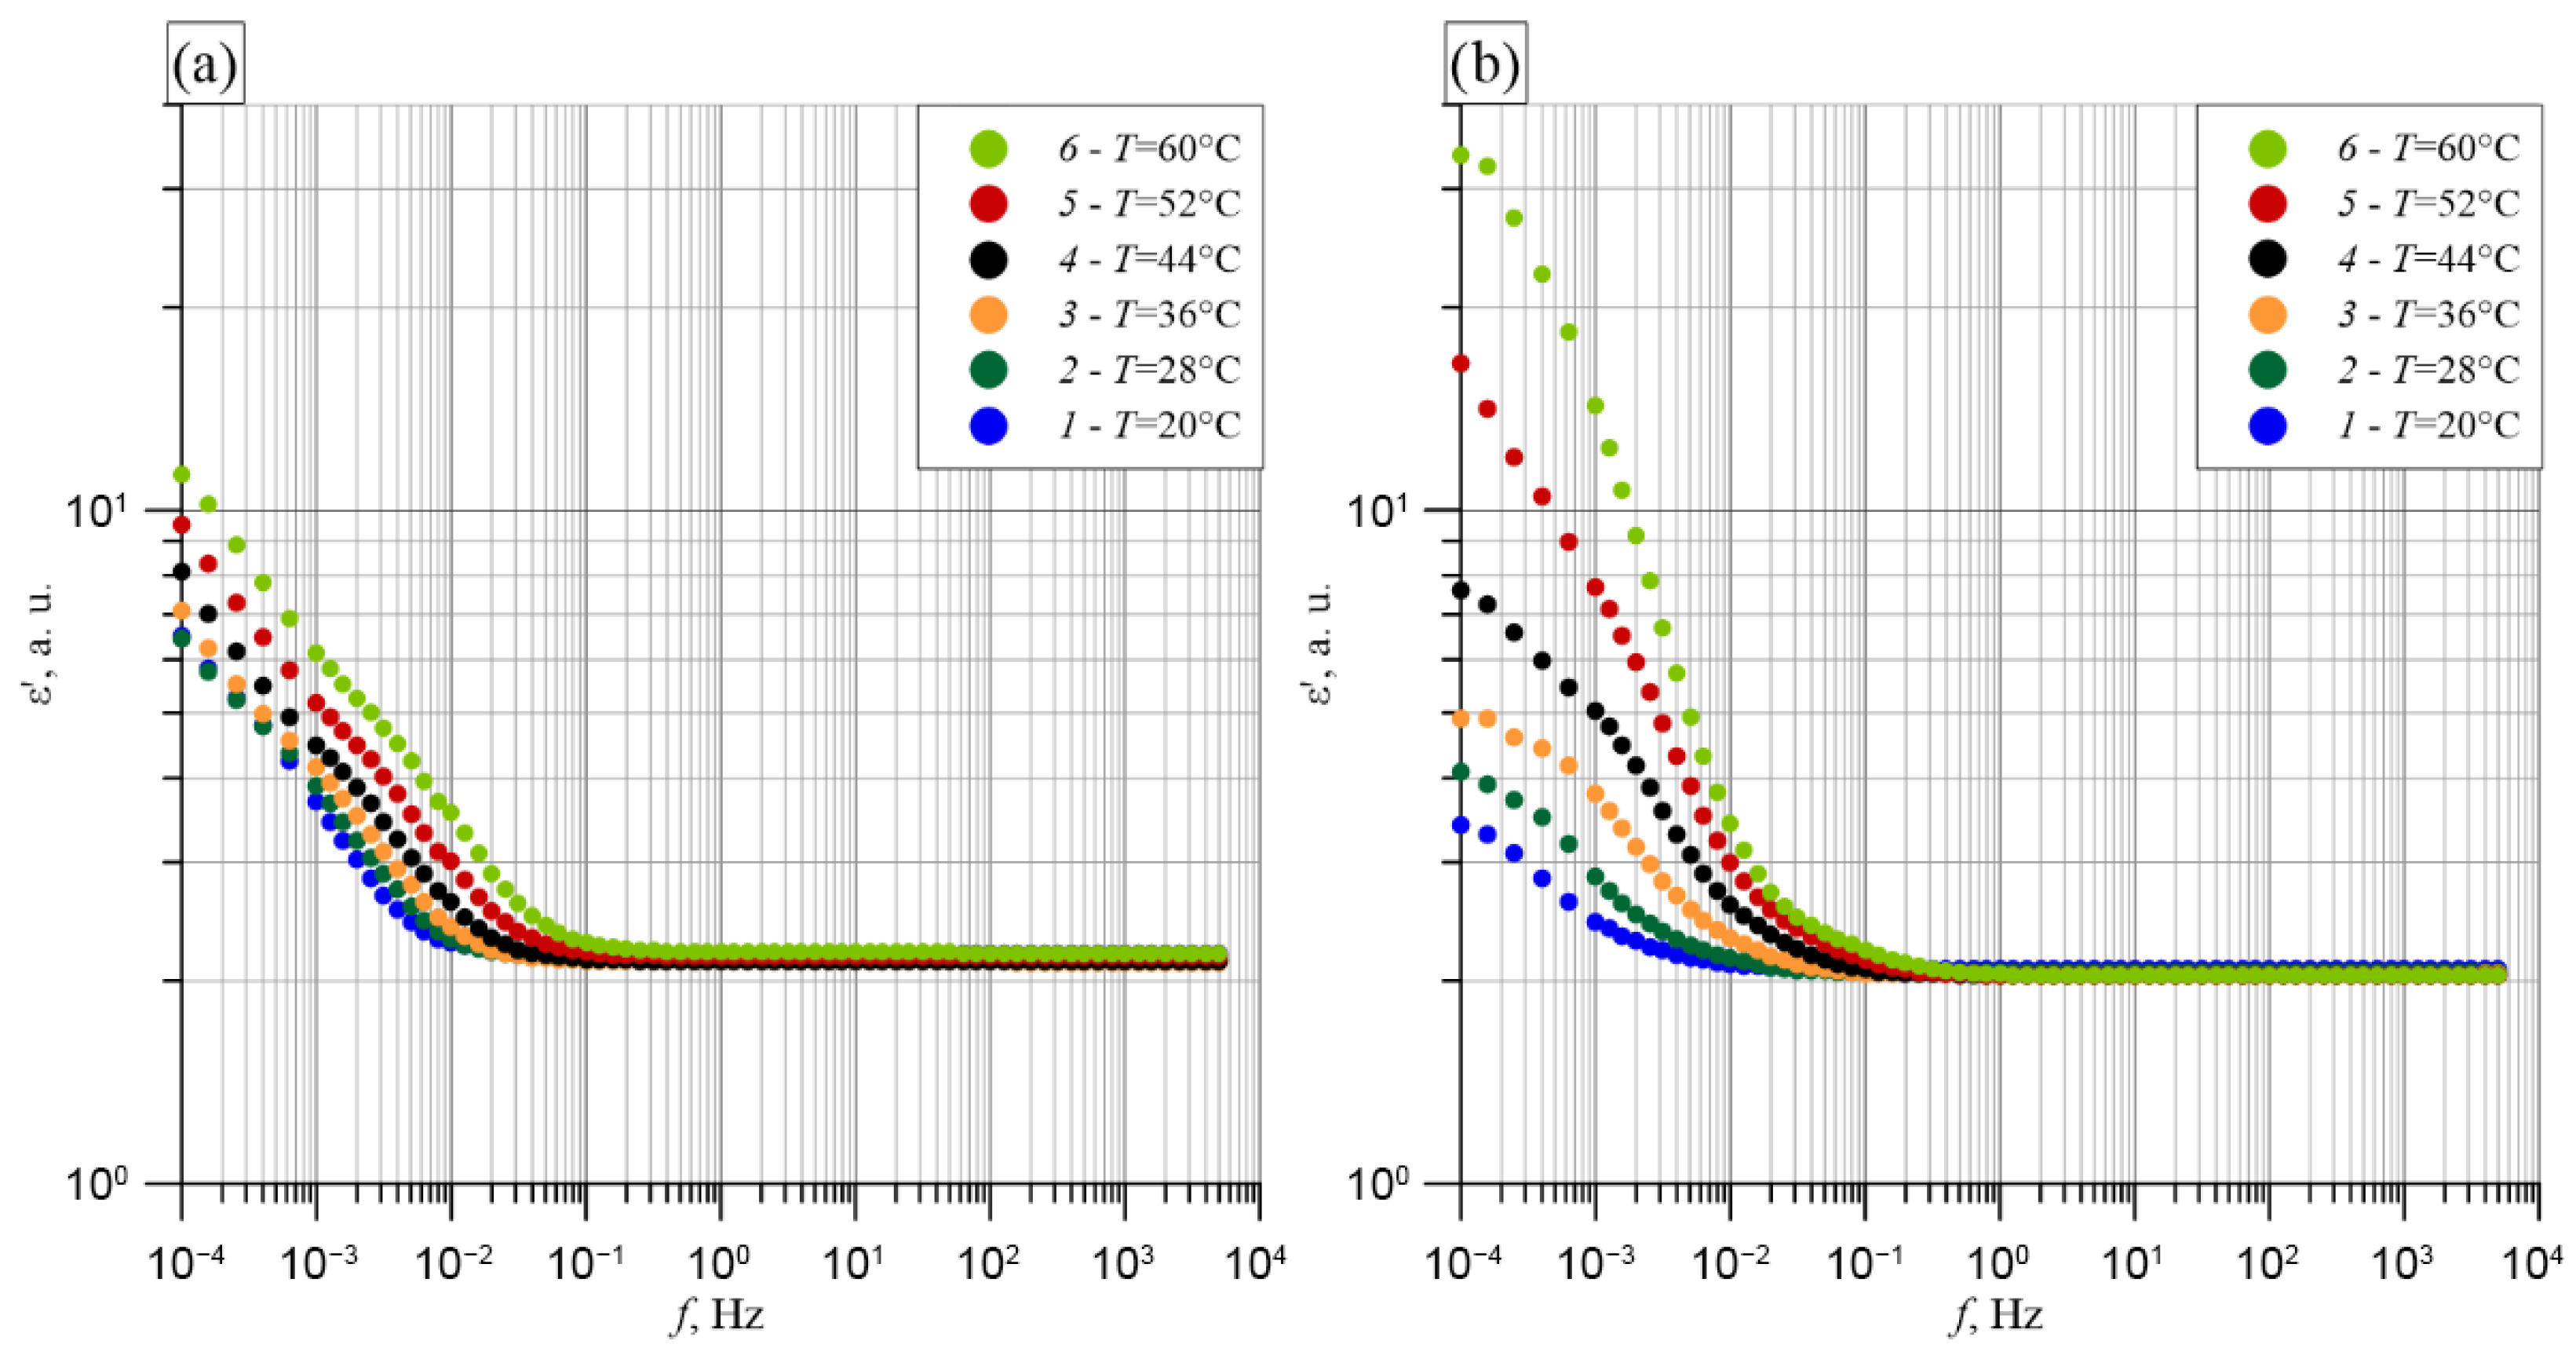
Figure 10 shows the frequency–temperature dependencies of ε’oil for factory-new insulating oil and for moistened oil.
We will begin the analysis of the results with the highest measurement temperature. As seen in Figure 10a, the value of ε’oil for factory-new oil at a frequency of 10−4 Hz is about 10. With increasing frequency, ε’oil decreases, and at frequencies above 0.1 Hz, it reaches about 2.2, which is characteristic of mineral oil. Lowering the temperature to 20 °C reduces ε’oil at 10−4 Hz to about 6.5, while the transition frequency to the steady-state value shifts down to about 0.02 Hz. Moistening of the oil by pressboard with a moisture content of 5.17% increases ε’oil at 10−4 Hz to about 33, i.e., by a factor of about 3. The transition to the steady-state value changes very little. However, the influence of temperature becomes stronger in the low-frequency region, where the permittivity values for T ≤ 36 °C are even lower than those of factory-new oil.

5. Calculation of the AC Parameters of the XY System of Highly Damp Insulation of Power Transformers

For the calculation of the loss tangent, permittivity, and loss factor of the XY system, Formulas (15), (17) and (19) were applied, along with the experimental values of tanδcel and ε’cel for moistened pressboard, and the values of tanδoil and ε’oil for factory-new and moistened oils. The frequency–temperature dependencies of these parameters are presented in Section 6. The values of parameters X and Y, entering Formula (15), may vary depending on transformer construction within the ranges 0.15 ≤ X ≤ 0.50 and 0.15 ≤ Y≤ 0.25. Therefore, calculations were performed for four combinations of these values: (a) X = 0.15 Y = 0.15, (b) X = 0.25 Y = 0.18, (c) X = 0.35 Y = 0.21, and (d) X = 0.50 Y = 0.25, thus covering the entire range of possible variations.

5.1. Loss Tangent

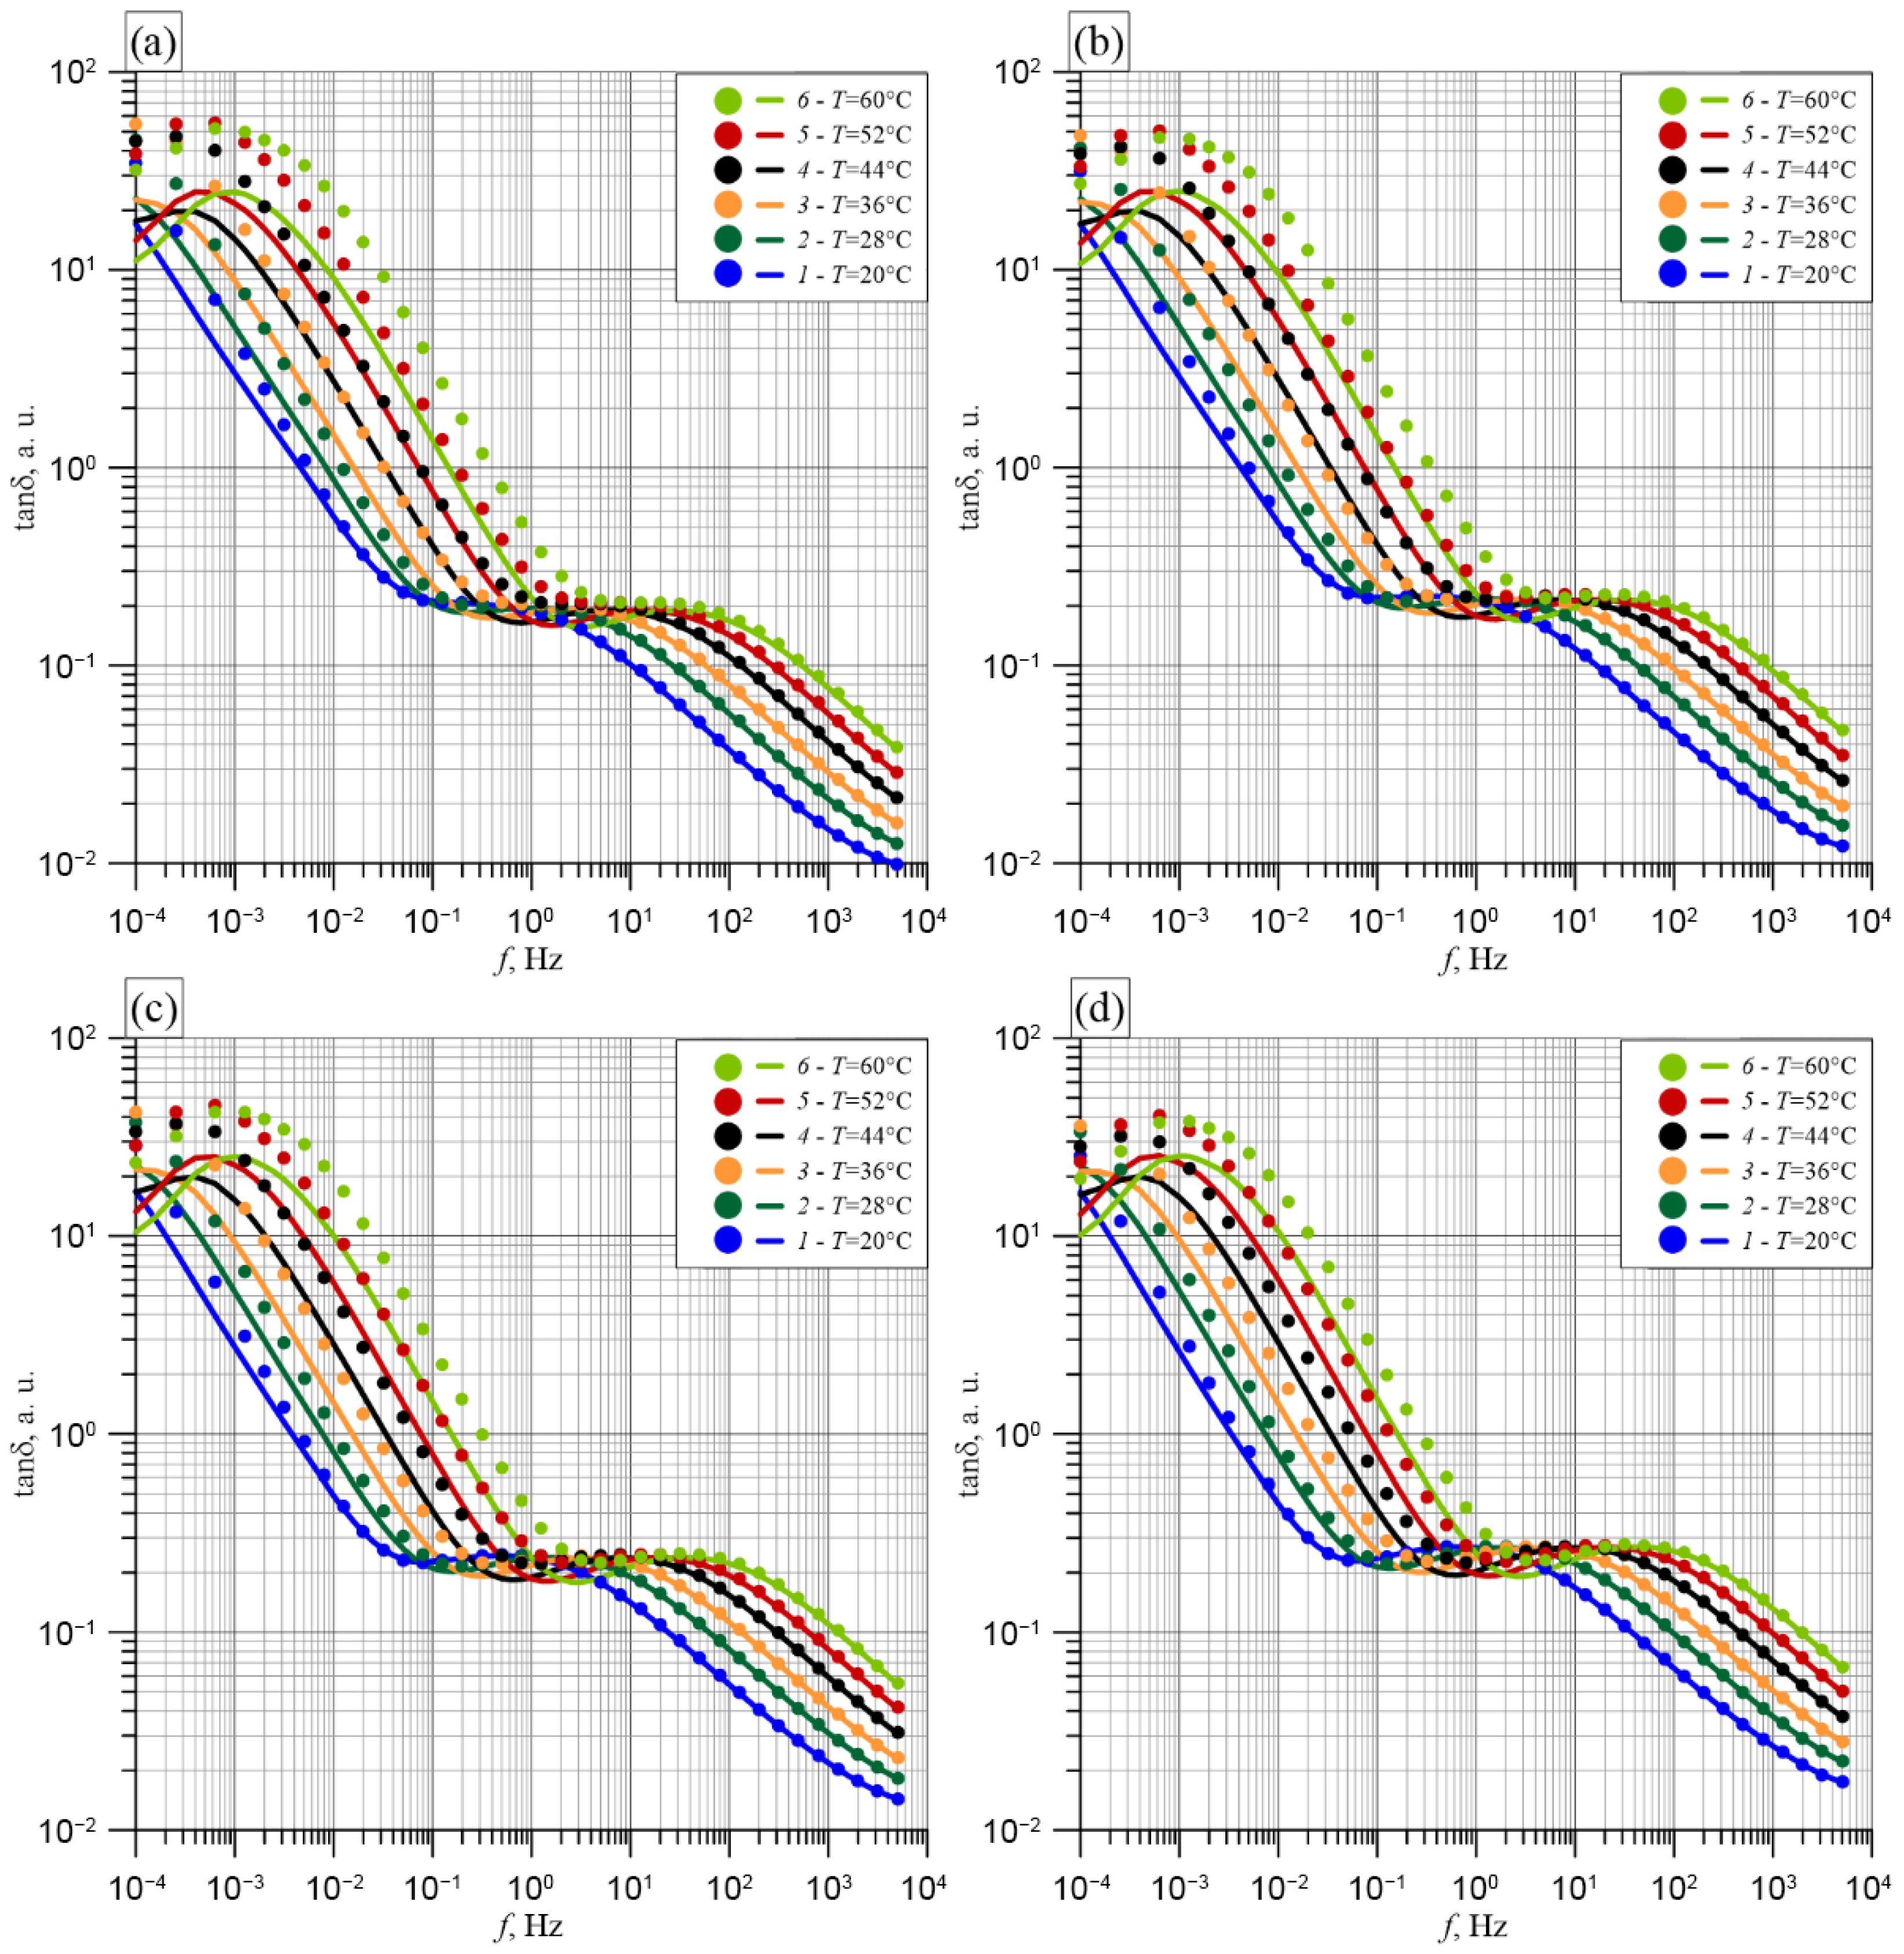
Figure 11a–d present the results of the frequency–temperature dependencies of the loss tangent for four sets of X and Y values.
In each of the figures, solid lines represent the dependencies calculated for factory-new oil parameters, while colored markers indicate moistened oil. For the lowest X and Y values (Figure 11a), it can be seen that significant differences occur between the calculated curves based on measurement results for factory-new and moistened oil in the low-frequency range. First, the local maximum in the region of the lowest frequencies and the highest measurement temperatures is more pronounced for factory-new and slightly moistened oil. Second, for moistened oil (Figure 11a), a shift toward higher tanδCIGRE values is observed compared to factory-new oil. This shift at the maximum corresponds to a temperature increase of approximately 16 °C. As the temperature decreases, these shifts slightly diminish, but even at 20 °C, they remain at a level corresponding to about 6–7 °C. Third, in the frequency range above 10−4 Hz, shifts due to oil moistening toward higher frequencies are observed. As frequency increases, tanδCIGRE values decrease. The differences observed in this study between curves for factory-new and moistened oil result from the increased water content in the moistened oil, originating from the diffusion of water molecules from the pressboard. For frequencies from approximately 5 Hz to about 100 Hz (at 60 °C), an almost constant segment of tanδ values, and even a slight local maximum, is observed, especially for higher X and Y parameter values. This is followed by a further decrease in tanδ values. Differences between curves obtained for systems with factory-new and moistened oil decrease with increasing frequency up to approximately 10 Hz. At higher frequencies, differences between the curves for factory-new and moistened oil practically vanish. A decrease in temperature (Figure 11a) shifts the tanδ curves toward lower frequencies while practically maintaining their shape.
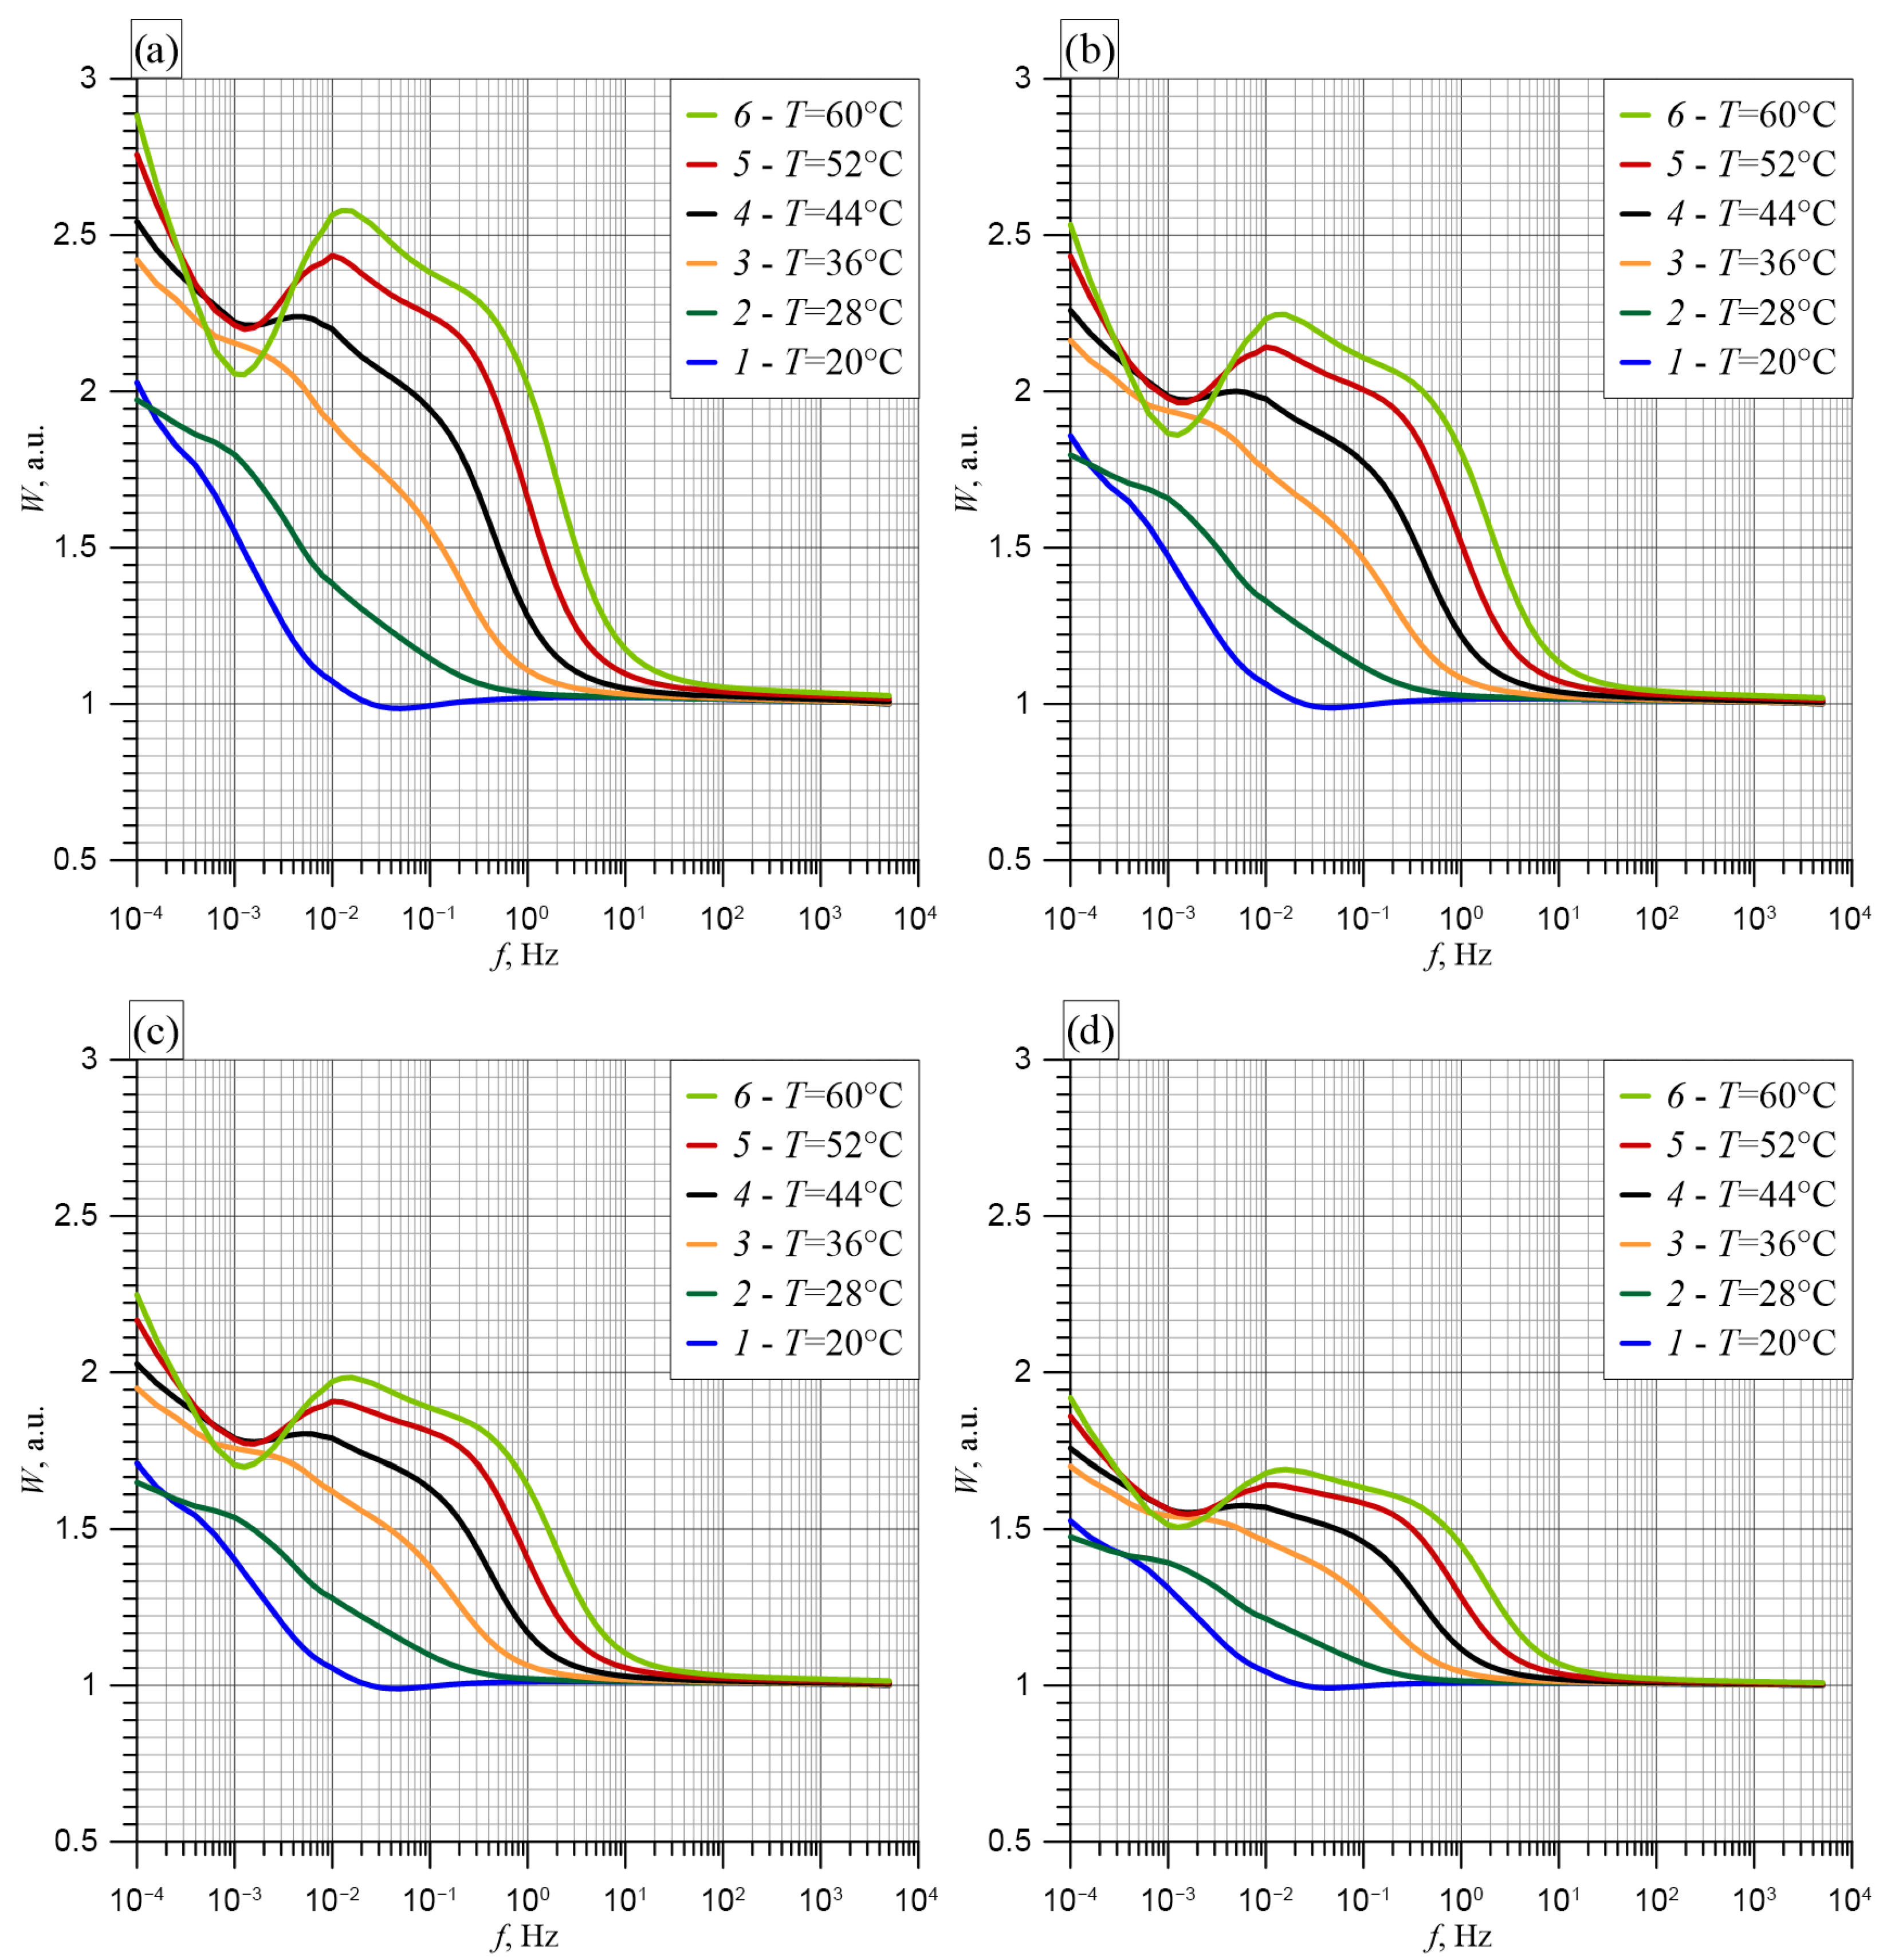
The most important conclusion from the calculations of tanδ, which account for changes in oil moisture content due to water diffusion from pressboard moistened to 5.17%, is that oil moistening has a significant impact on the tanδ dependencies in the low-frequency range. As frequency increases, this influence decreases. To perform a detailed analysis of the effect of oil moisture on the frequency–temperature dependencies of tanδCIGRE, Figure 12 presents the ratios of tanδCIGRE values for moistened and factory-new oil, calculated according to the formula
W = tan δ ( w ) C I G R E tan δ ( 7 p p m ) C I G R E ,
where tanδ(w)CIGRE—value for moistened oil, and tanδ(7 ppm)CIGRE—value for factory-new oil.
The analysis begins at a temperature of 60 °C. From Figure 12, it can be seen that for the lowest X and Y values, tanδCIGRE in the frequency range up to 1 Hz is more than twice as high for moistened oil as for factory-new oil (Figure 12a). As the values of X and Y increase, this ratio decreases. However, even for the highest X and Y values, the ratio is 1.5 at a frequency of 1 Hz (Figure 12d). In the lower frequency range, this ratio is even higher. Such significant differences between tanδCIGRE values caused by changes in oil moisture must undoubtedly be taken into account when analyzing the moisture condition of the cellulose component in power transformers.
At temperatures below 60 °C, the W ratio curves shift toward lower frequencies. Upon reaching a certain frequency, the value of which depends on temperature, the W ratio approaches unity. For a temperature of 20 °C, this frequency is approximately 5·× 10−1 Hz, while for 60 °C it is about 50 Hz.
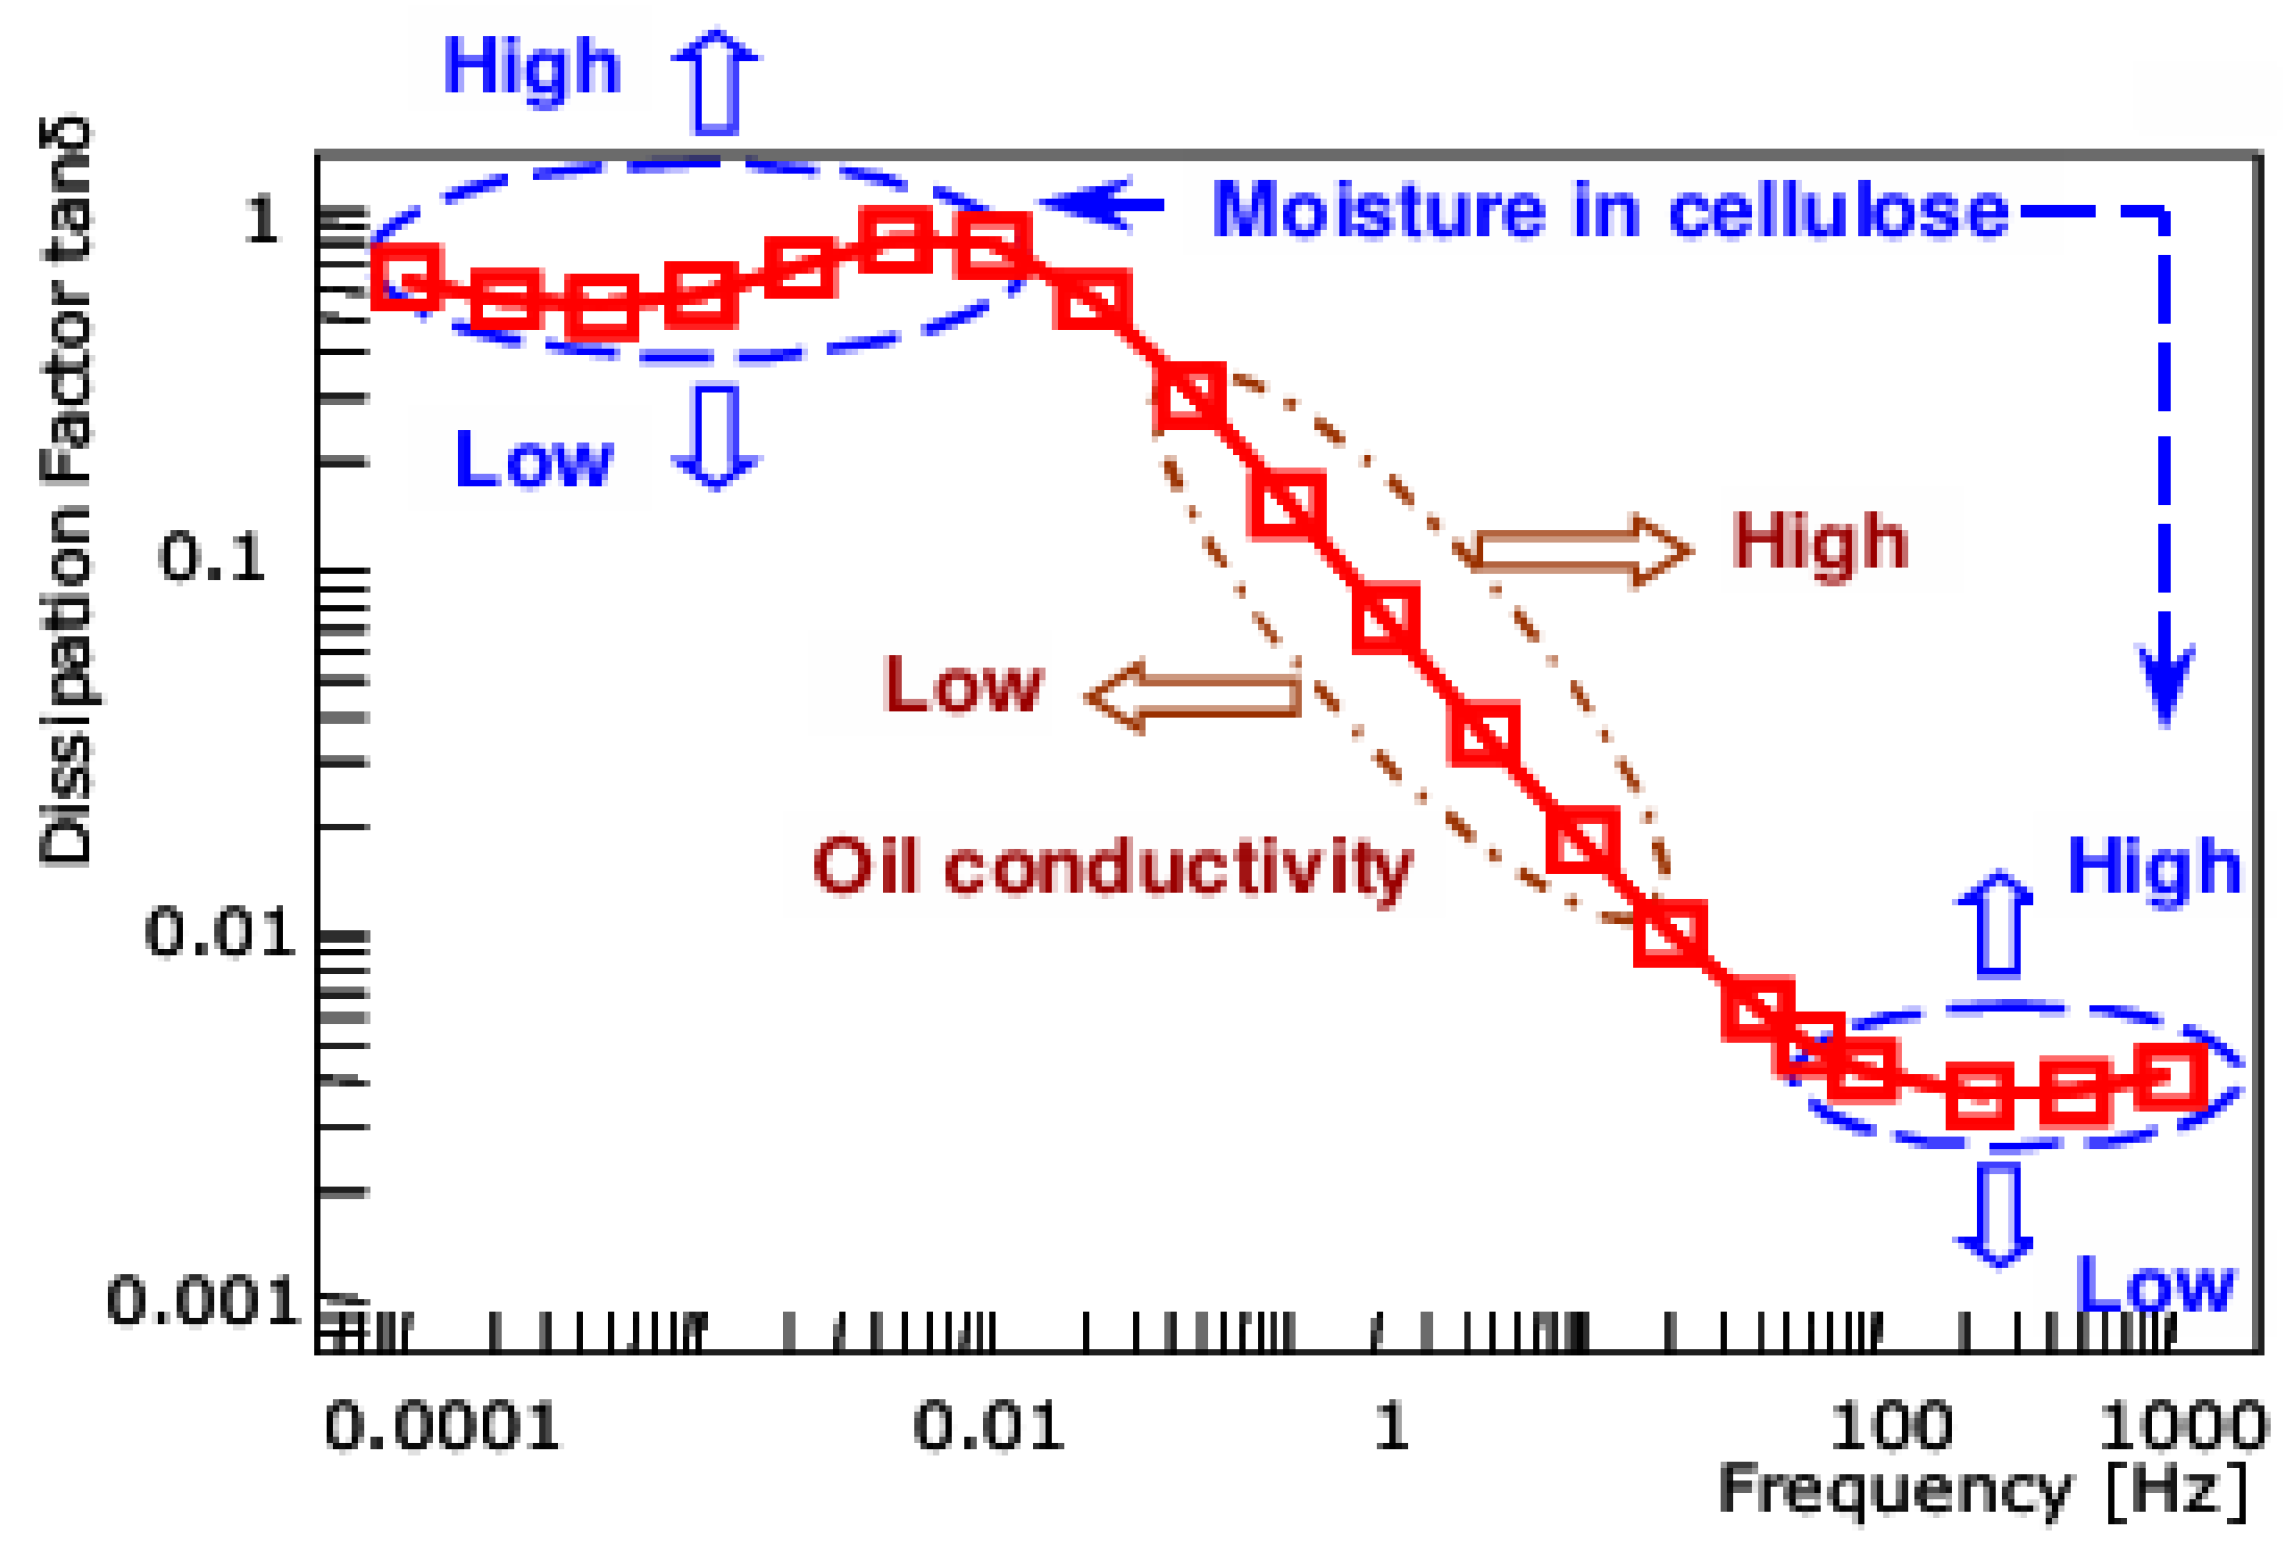
The effect of cellulose moisture on the loss tangent values of transformer insulation has been analyzed in a series of publications. Figure 13 shows the tanδ dependency for moistened transformer insulation from [54].
This figure has been repeatedly reproduced in later publications by various authors; see, for example, [67,68,69,70,71,72]. These publications indicate that two frequency ranges should be used for moisture analysis based on the loss tangent. The first range extends from 10−4 Hz to 10−2 Hz, and the second from 50 Hz to 5000 Hz (Figure 13). According to these publications, the frequency dependencies of tanδ are influenced by pressboard moisture in these ranges. The intermediate range between these two is considered the region in which the loss tangent of the system is affected by the conductivity of the oil. In Figure 13, arrows in these regions indicate that, as the water content in the pressboard increases, tanδ should increase.
From our data (Figure 12), it is evident that the influence of oil moisture on the tanδ of the transformer insulation system is the greatest in the lowest frequency range. In the intermediate frequency range, the effect of oil moisture on the tanδ dependencies decreases. For transformer operating temperatures (≥60 °C), the influence of oil moisture on the frequency–temperature dependencies of the tanδ of the insulation system practically vanishes above 50 Hz. This implies that using the lowest frequency range results in significant errors when estimating the moisture content in pressboard. In contrast, using the frequency range f ≥ 50 Hz eliminates the effect of uncontrolled changes in oil moisture on the results obtained from tanδ measurements of power transformer insulation systems.
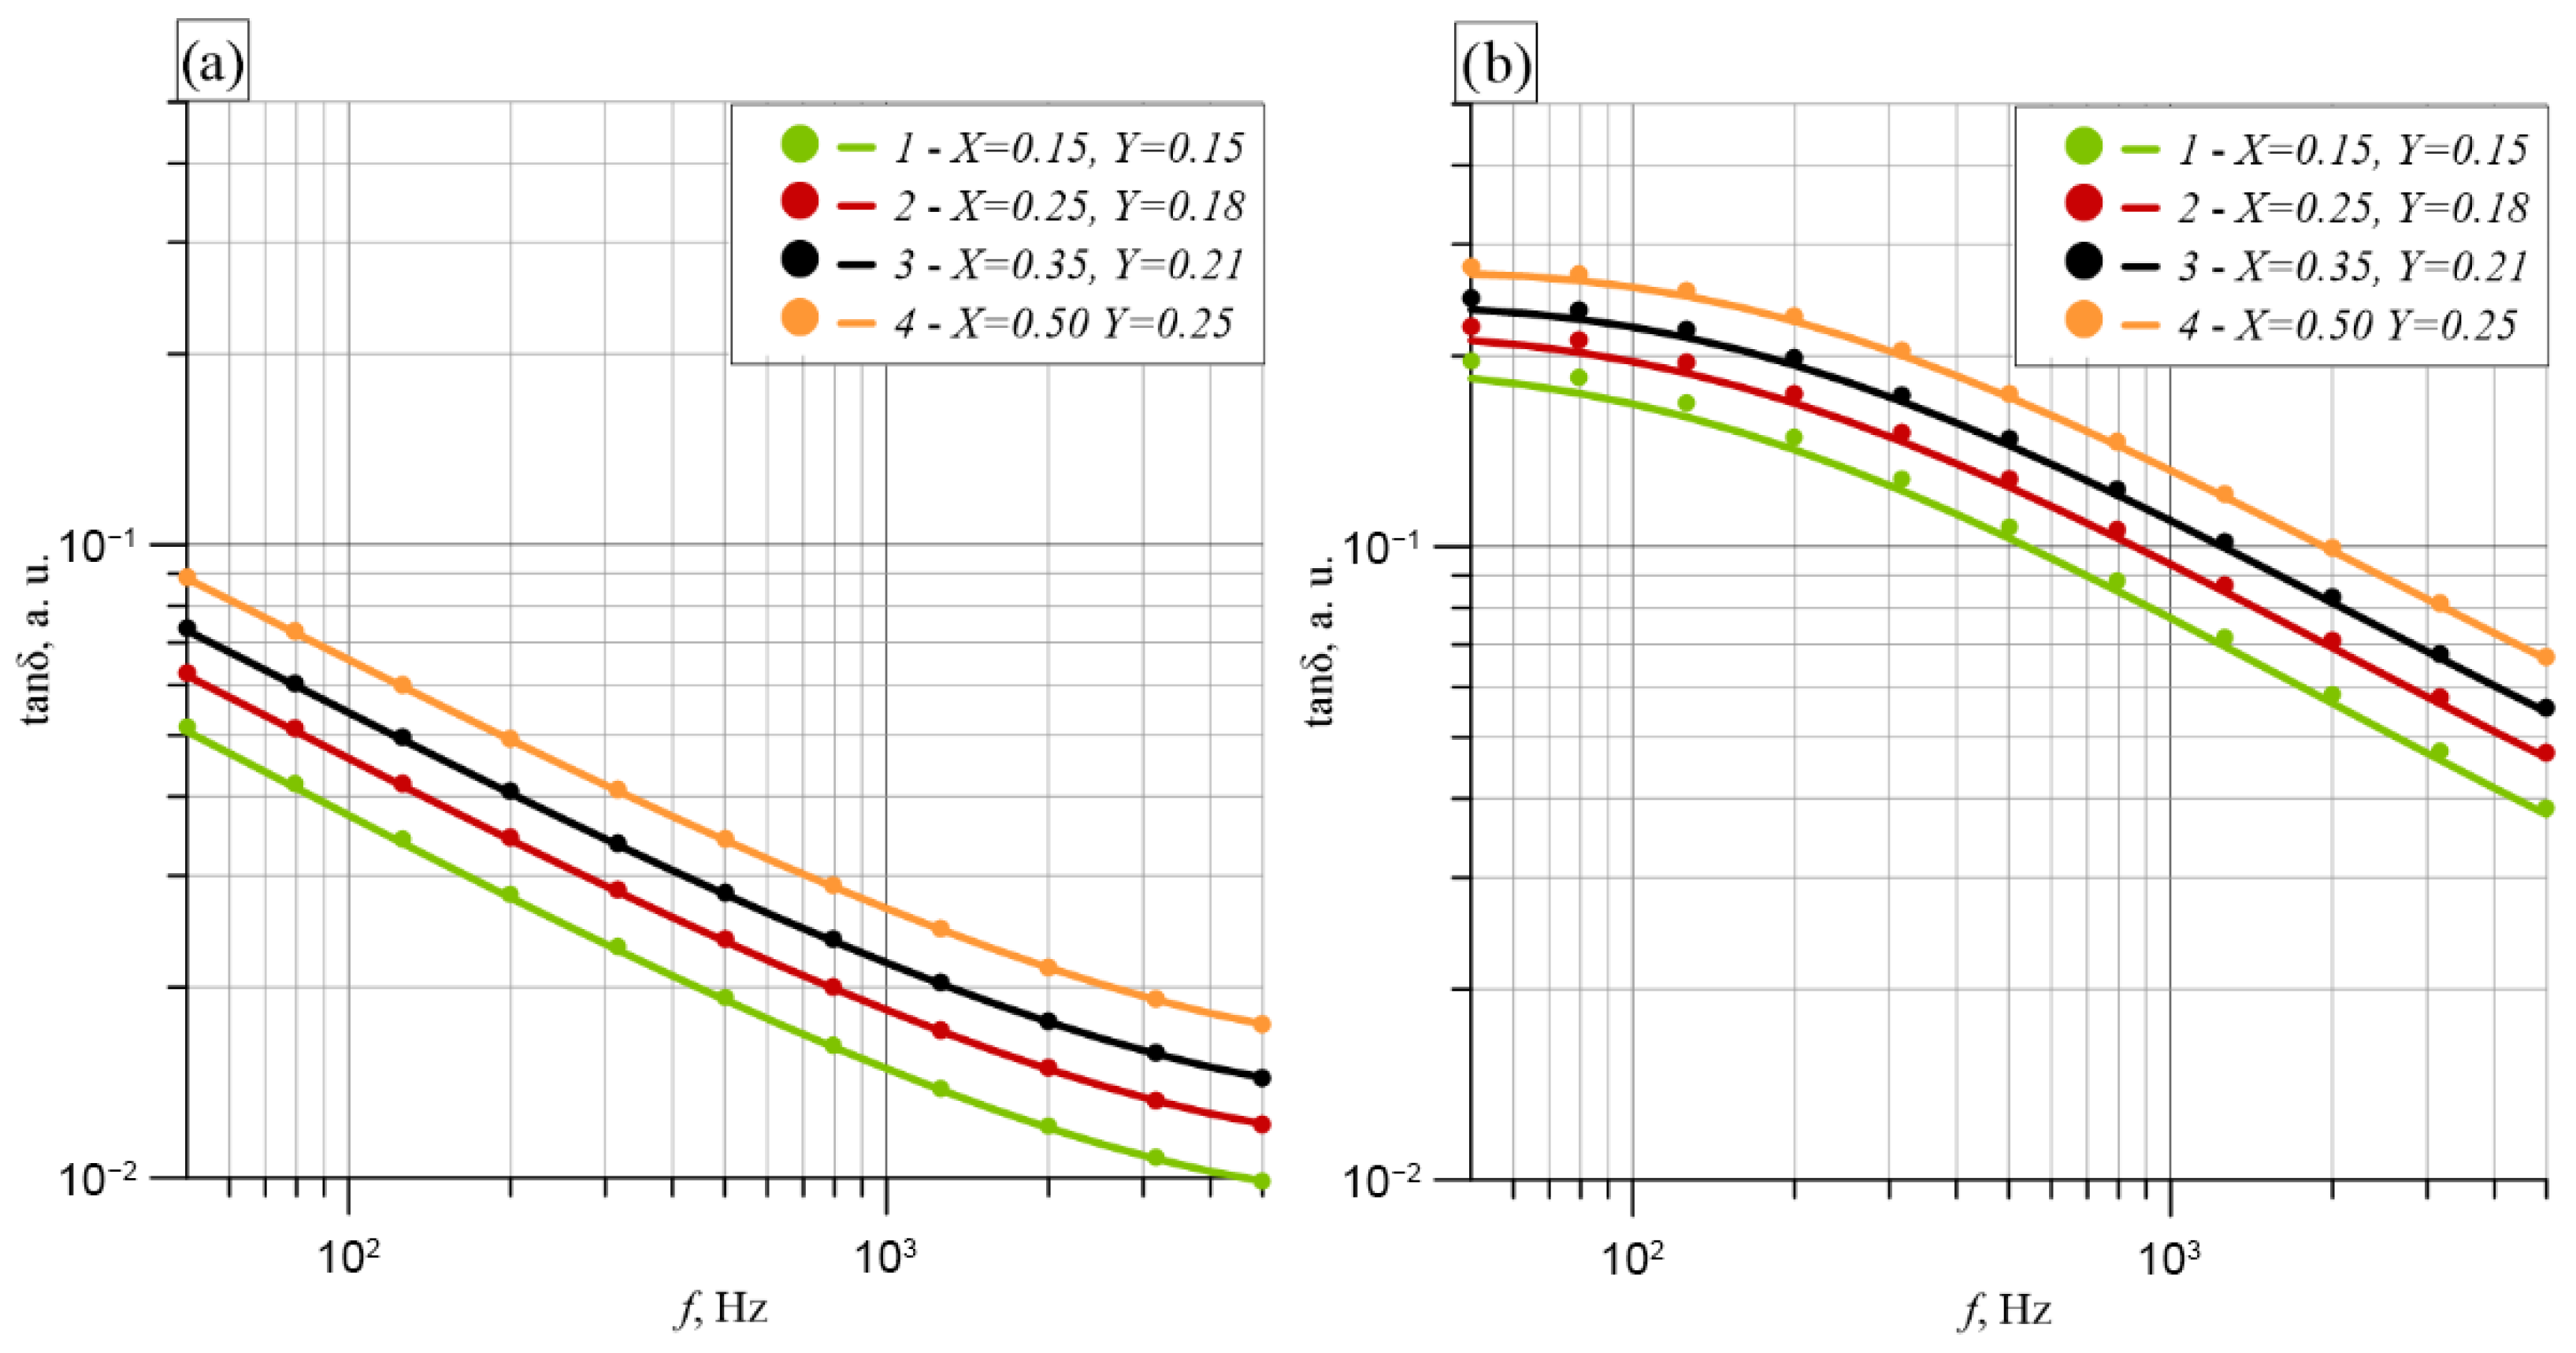
Another conclusion can be drawn from the analysis above. Namely, in the high-frequency range (f ≥ 50 Hz), which is useful for estimating cellulose moisture, the tanδ values are significantly influenced by the X and Y parameters of the CIGRE system. Figure 14a shows the tanδ dependencies at a temperature of 20 °C, and Figure 14b at 60 °C for four sets of X and Y values above 50 Hz, where the influence of oil moisture on the tanδ dependencies is practically negligible.
From Figure 14, it can be seen that changes in the X and Y coefficients from the lowest values (X = 0.15, Y = 0.15) to the highest values (X = 0.50, Y = 0.25) result in a significant decrease in tanδ of approximately 1.7 times. This decrease does not depend on either the insulation temperature or the oil moisture. The observed effect of changing the XY parameters is related to the reduction in the oil’s volumetric fraction in the insulation system from 0.7225 to 0.375. This reduces the influence of oil parameters on the tanδ value. This indicates that, for precise estimation of the moisture content in the cellulose component, the actual values of the XY parameters of the CIGRE system must be accurately determined.

5.2. Real Part of Complex Permittivity

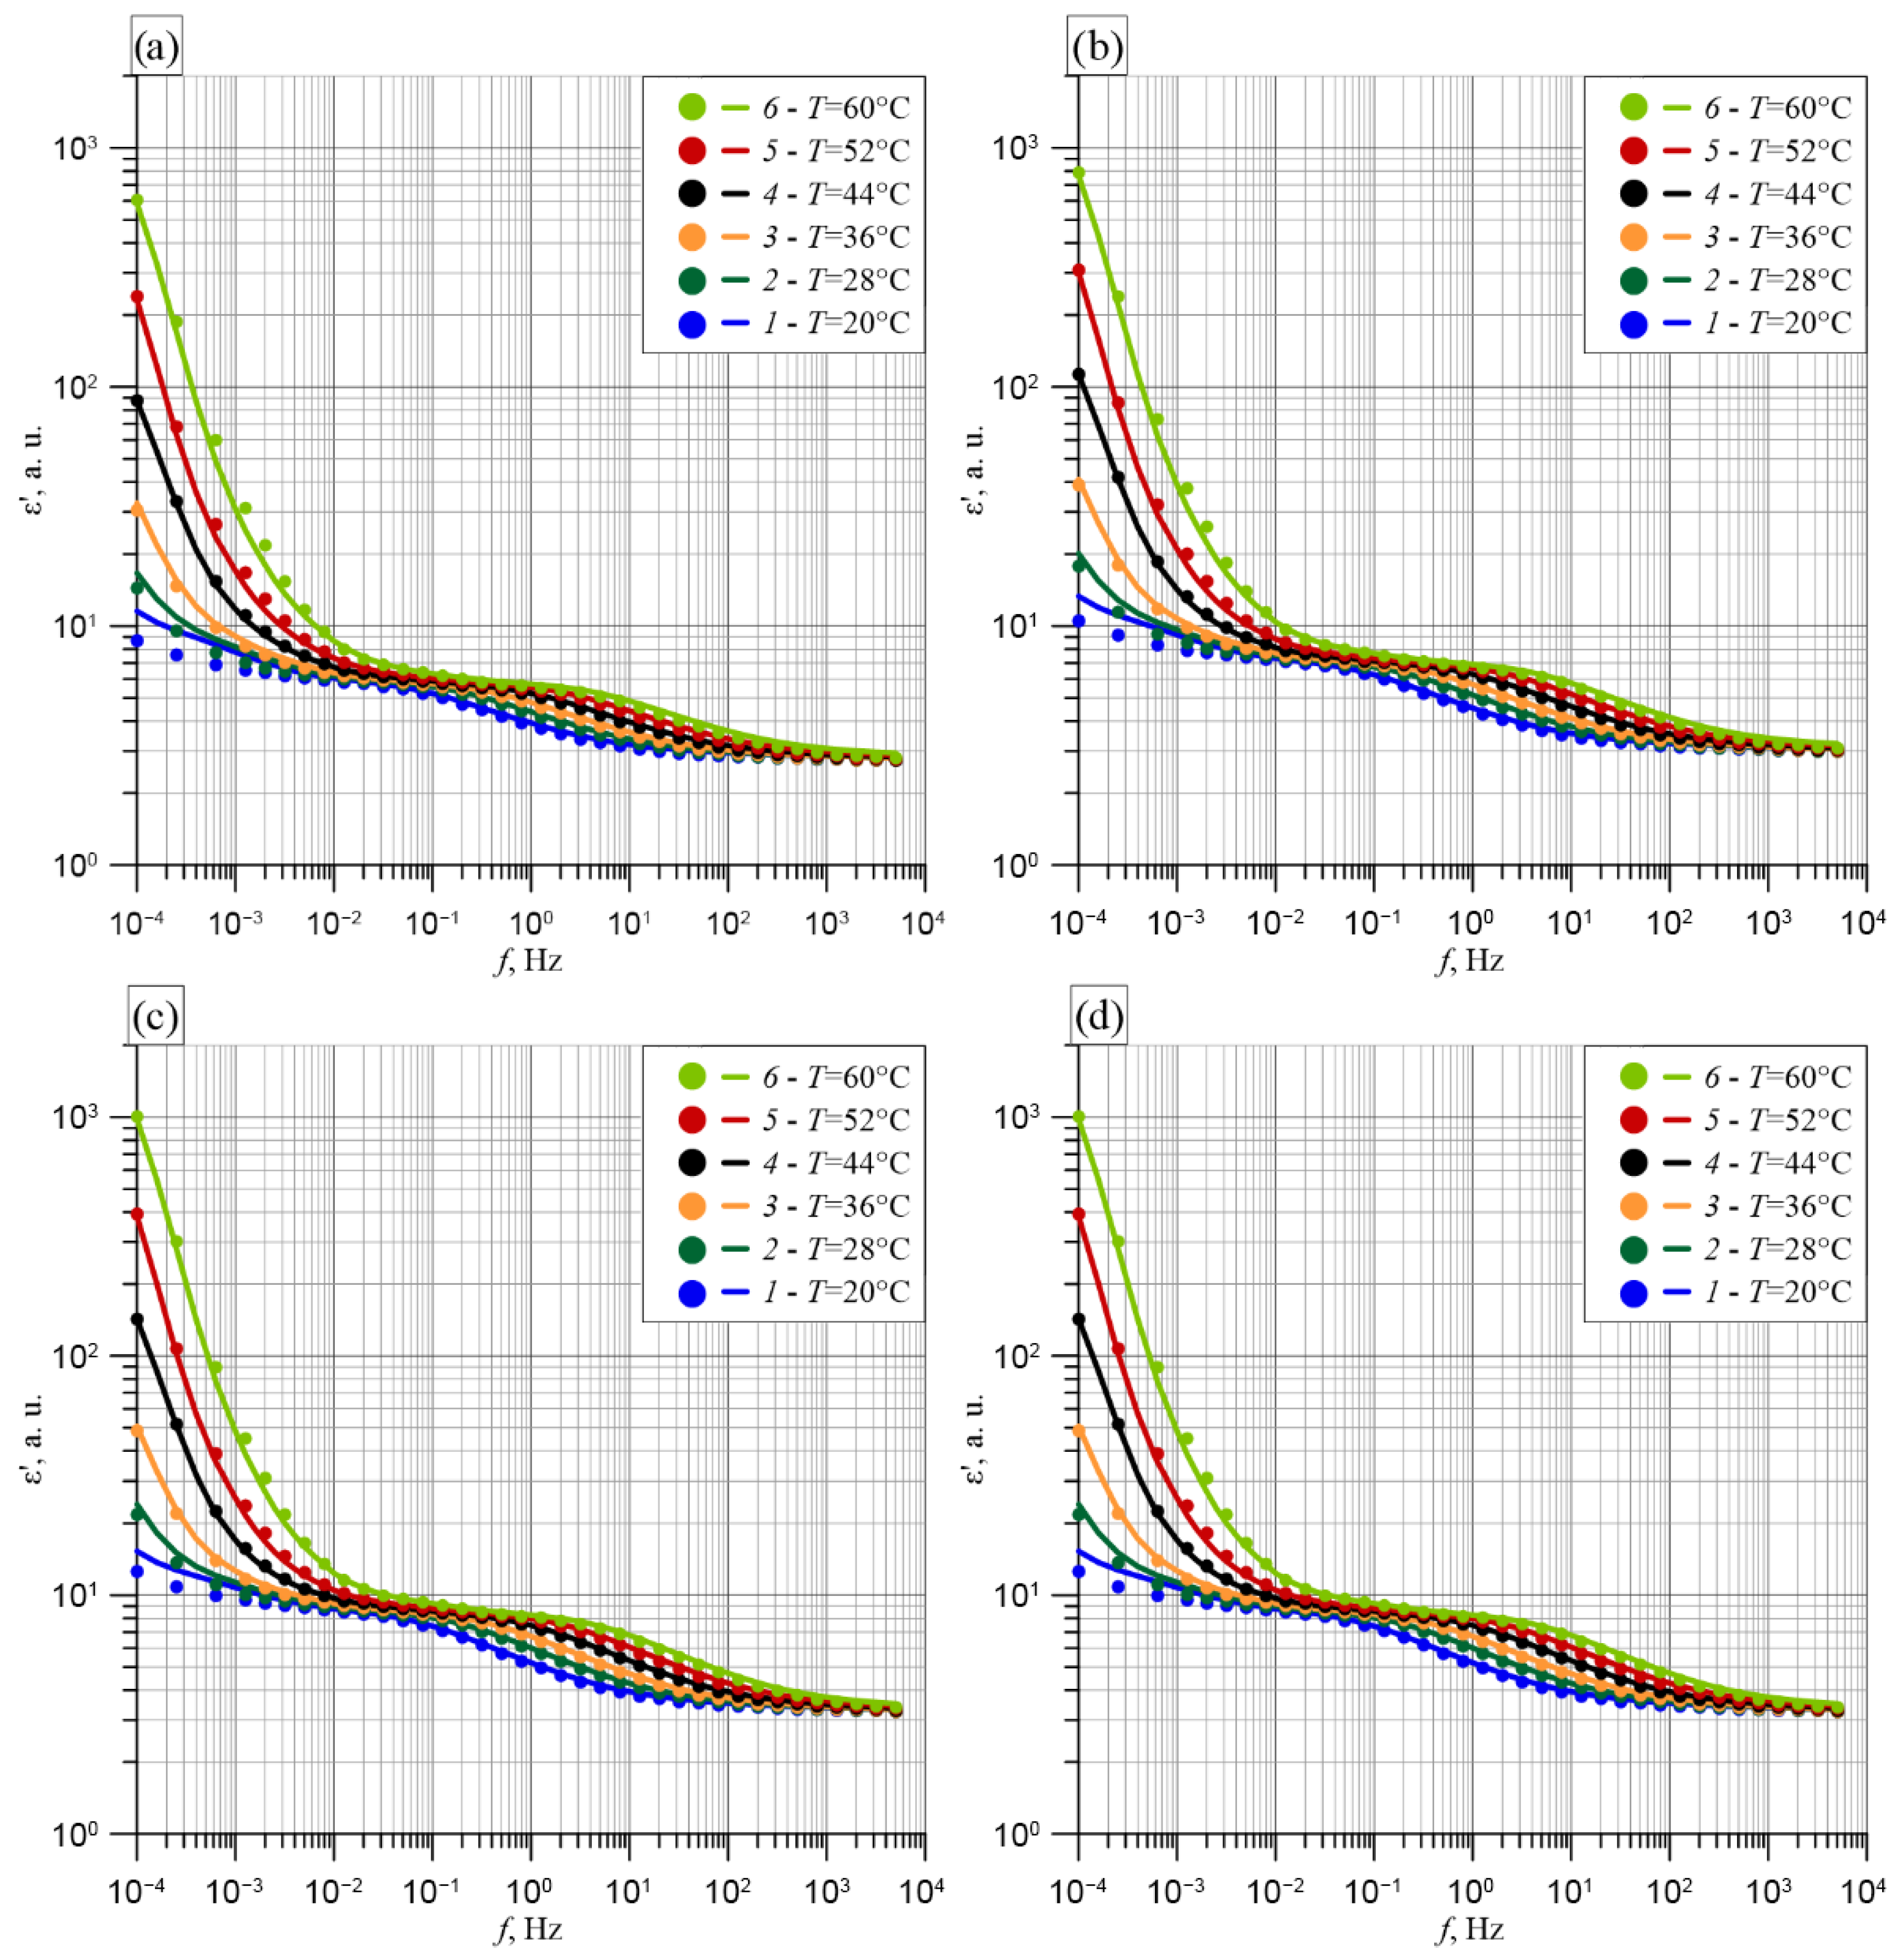
Figure 15 shows the dependencies of the real part of the complex permittivity of the XY system according to CIGRE, calculated using formula (17), for pressboard with a moisture content of 5.17%.
The calculations used the experimental permittivity dependencies of moistened pressboard (Figure 8b), as well as factory-new and moistened mineral oil (Figure 10a,b). From Figure 15, it can be seen that for nearly all measurement temperatures, the ε’CIGRE dependencies exhibit two stages of permittivity decrease—at low and high frequencies. These stages are very similar to those observed for moistened pressboard (Figure 8b). Differences between the dependencies calculated for factory-new and moistened oil are visible in the low-frequency range for the lowest measurement temperatures of 20 °C and 28 °C. For higher temperatures, these differences practically vanish across the entire frequency range. In the intermediate frequency range, where nearly constant ε’CIGRE values occur, an increase in ε’CIGRE is observed as the XY parameters increase (Figure 15a–d). This is related to the fact that changing the XY system parameters from X = 0.15, Y = 0.15 to X = 0.50, Y = 0.25 increases the static component of the insulation and reduces the oil content in the system. Consequently, the influence of pressboard permittivity increases, which in this frequency range has significantly higher values than the oil permittivity (Figure 8b and Figure 10a,b). In the high-frequency range, the system permittivity does not depend on temperature or the XY parameters. This indicates that permittivity can be useful for estimating the moisture content in pressboard within the operating temperature range of transformers. In this case, the XY parameters of the insulation system according to CIGRE must be accurately determined.

5.3. Loss Factor

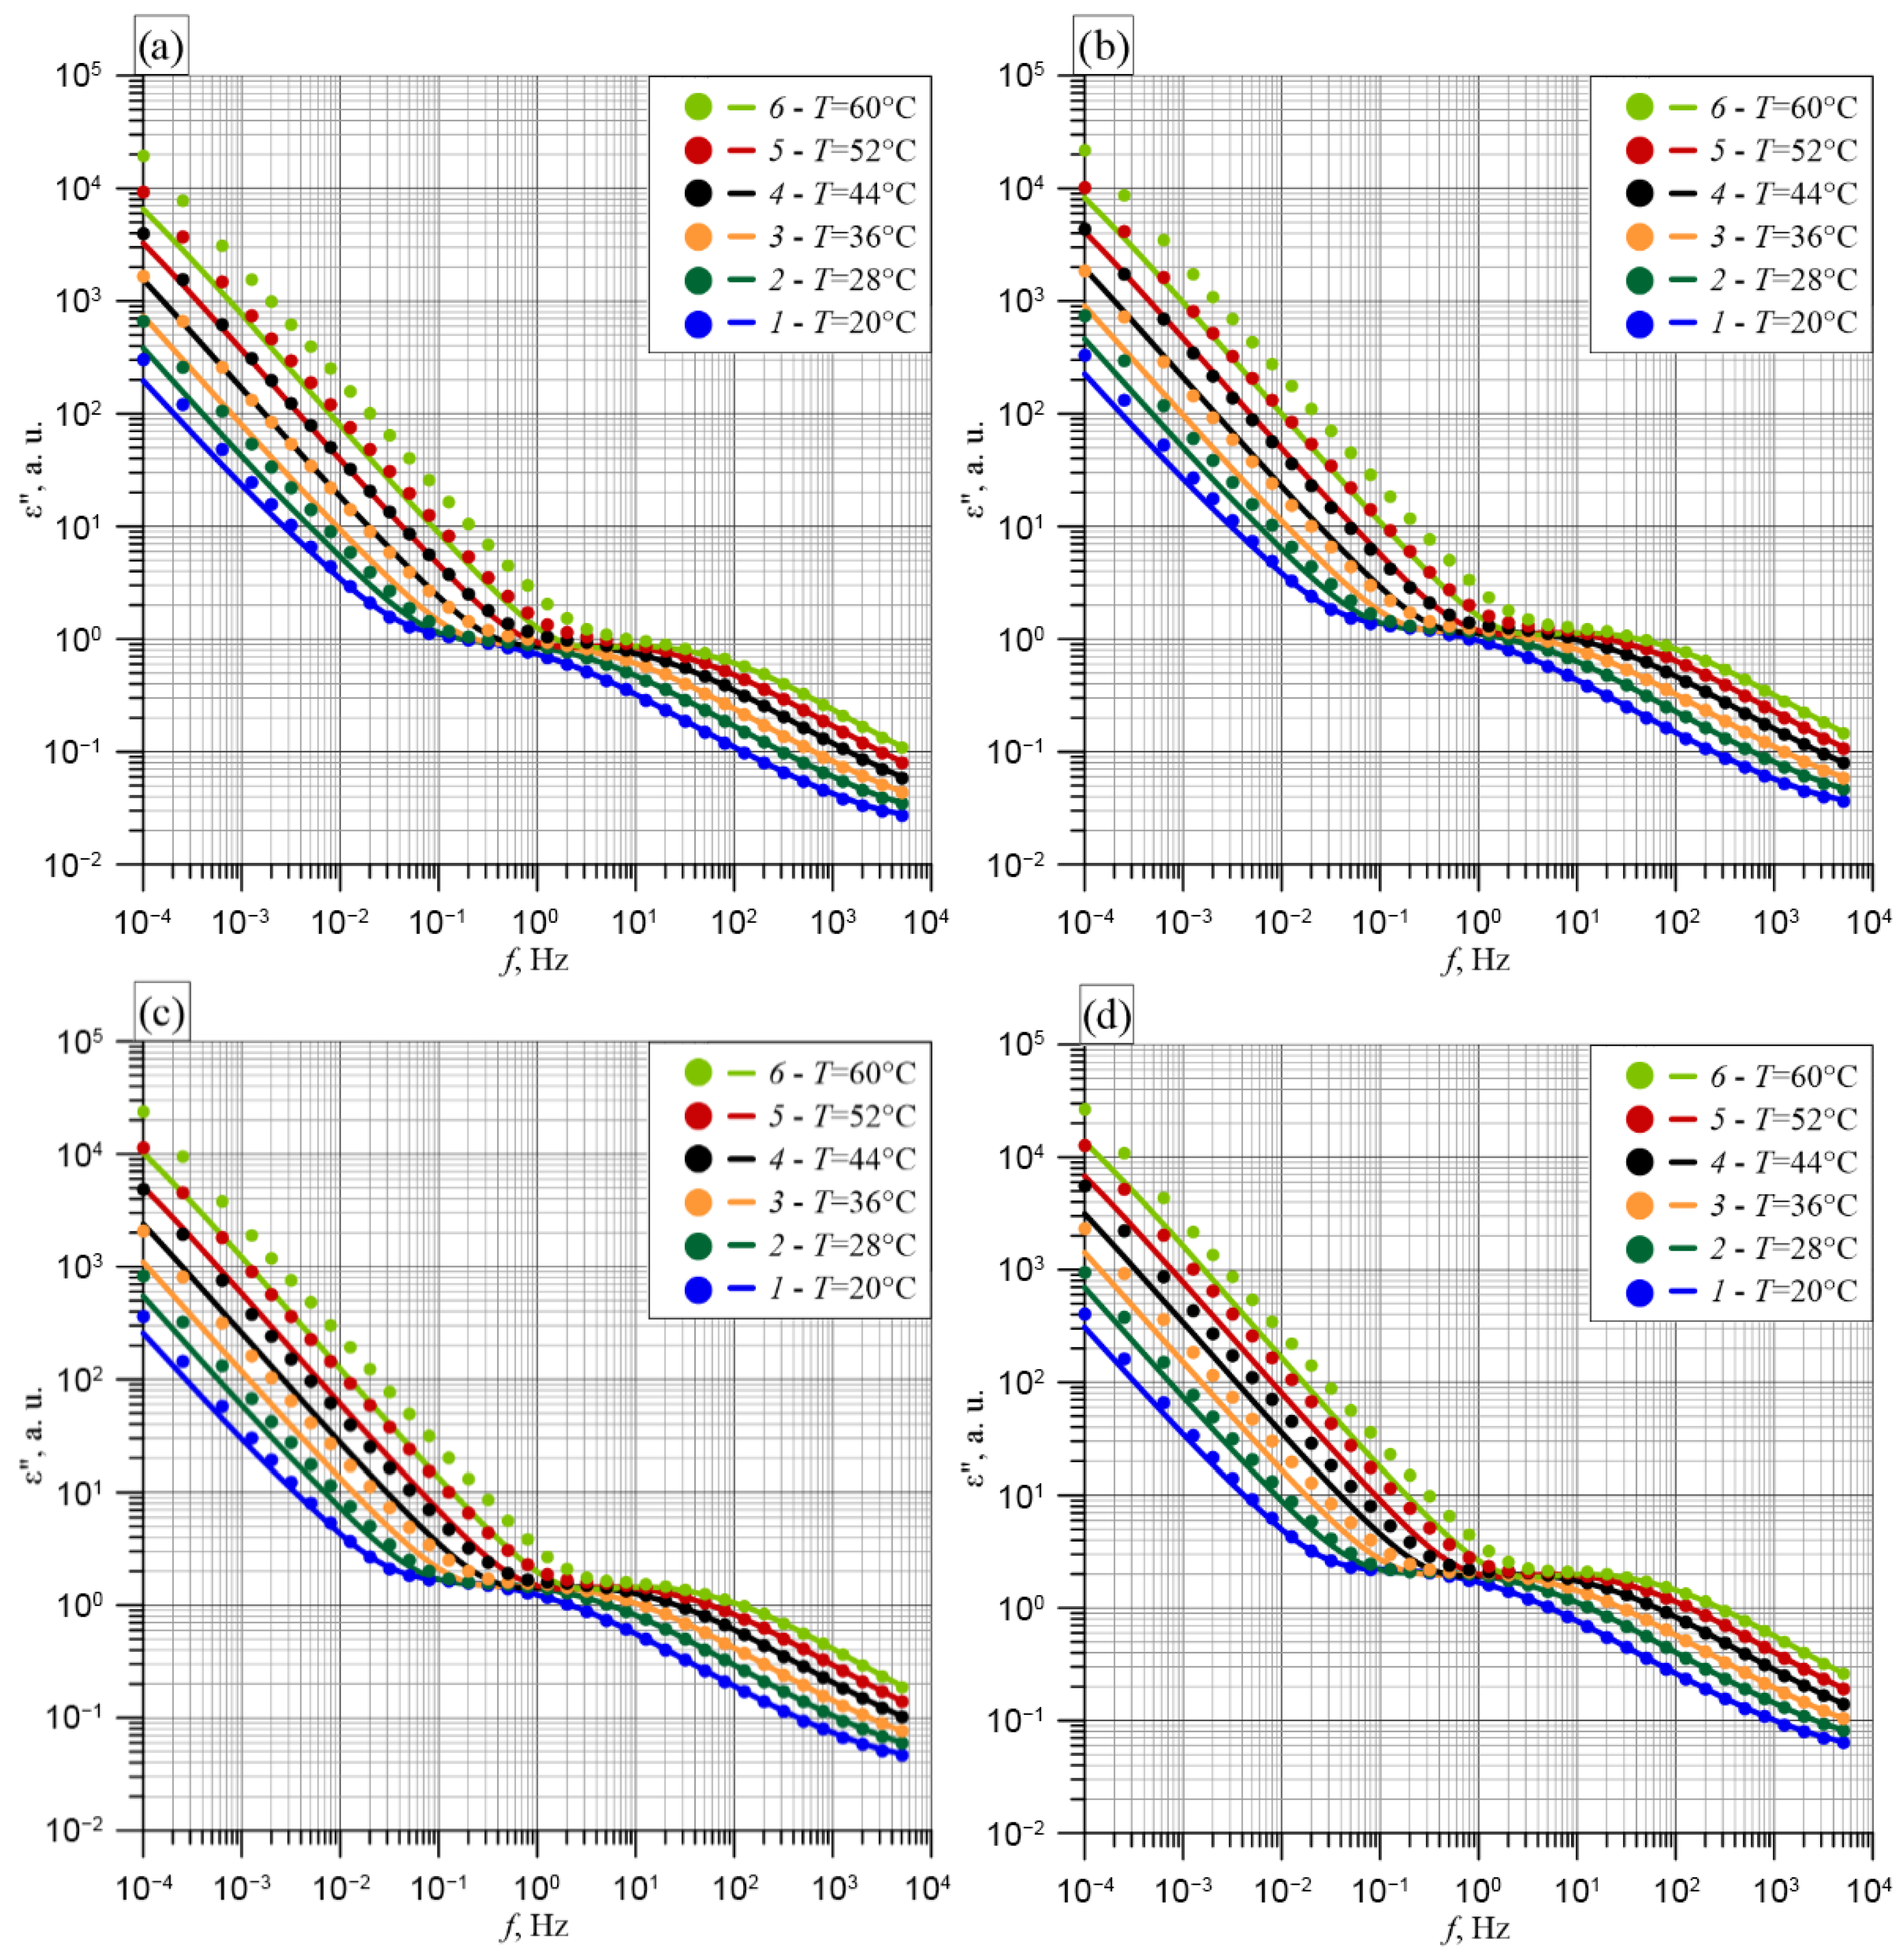
Figure 16 shows the dependencies of the imaginary part of the complex permittivity ε’’CIGRE (loss factor) of the XY system according to CIGRE, calculated using formula (19), for pressboard with a moisture content of 5.17%.
The frequency dependencies of the loss factor can be divided into three stages. In the low-frequency range, a stage of rapid decrease in the loss factor occurs. In the intermediate frequency range, the loss factor remains nearly constant. In the high-frequency range, a further stage of loss factor decrease takes place, which is slower than in the low-frequency range. From Figure 16, it can be seen that, similar to tanδ, differences exist between calculations for factory-new and moistened mineral oil in the low-frequency range. These differences increase with rising temperature. However, increasing the static component by raising the X and Y values reduces these differences. These differences practically vanish in the second and third stages. This indicates that the use of the loss factor for insulation condition analysis of transformers is possible based on values measured in the second stage (constant value) and the third stage (slower decrease with increasing frequency).

6. Conclusions

In this study, analytical formulas were derived for the dielectric loss tangent (hereafter—tanδ), and for the real (hereafter—permittivity) and imaginary (hereafter—loss factor) components of the complex permittivity of the solid–liquid insulation system of power transformers, represented by the CIGRE model.
Frequency dependencies of tanδ and permittivity of moist impregnated pressboard were determined. The influence of temperature on these dependencies was also investigated by carrying out measurements in the range 20–60 °C, with a step of 8 °C.
Frequency–temperature dependencies of factory-new insulating oil, with a moisture content below 7 ppm, were also determined. e oil moisture rises significantly above the factory-new state. To simulate this process, Oil moisturization was carried out in a manner identical to that occurring in operating transformers. For this purpose, pressboard plates with a water content of 5.17 wt.% were placed in a vessel together with insulating oil, in a pressboard-to-oil volume ratio of 1:10. The system was held at 20 °C for 100 h, after which measurements were taken.
It was established that oil moisturization from pressboard with 5.17 wt.% water led to significant changes in the tanδ dependencies. First, a much stronger temperature effect was observed, shifting the curves along both horizontal and vertical axes. This was caused by additional water molecules diffusing from the pressboard into the oil with increasing temperature. The width of the high-frequency minimum was considerably reduced. In the permittivity dependencies, only small changes were observed in the low-frequency region.
Tanδ, permittivity, and dielectric loss dependencies of the CIGRE transformer insulation model were calculated based on the experimentally obtained dependencies of tanδ and permittivity for moist pressboard impregnated with mineral oil, as well as for factory-new and moisturized insulating oil. Calculations were performed for parameter values of X = 0.15, Y = 0.15; X = 0.25, Y = 0.18; X = 0.35, Y = 0.21; X = 0.50, Y = 0.25, covering the full range of possible variations.
It was found that the largest differences between tanδ dependencies obtained for factory-new and moisturized oils occur in the lowest frequency region. The local maximum at low frequencies and highest measurement temperatures is more pronounced in the case of factory-new oil. For moisturized oil, tanδ curves are shifted to higher values and higher frequencies compared with new oil. These differences result from the increased conductivity of moisturized oil, caused by the diffusion of water molecules from the pressboard. As frequency increases, tanδ values decrease. In the range of ~5–100 Hz (at 60 °C), a nearly constant tanδ segment was observed. Further frequency increase caused another decrease in tanδ. Differences between tanδ curves for new and moisturized oil diminish with frequency, practically vanishing above a certain frequency depending on temperature: ~10−1 Hz at 20 °C, and ~50 Hz at 60 °C. Lowering temperature shifted the tanδ dependencies toward lower frequencies, without significantly altering their shape.
Frequency–temperature dependencies of permittivity in the CIGRE insulation model were also determined. It was found that, for practically all measurement temperatures, two stages of permittivity decrease are visible—at low and high frequencies. These stages are similar to those observed for moist pressboard. Increasing the values of parameters X and Y in the CIGRE model led to higher permittivity values in the low- and mid-frequency ranges.
Three stages were observed in the frequency dependencies of dielectric loss in the CIGRE model. In the low-frequency region, a rapid decrease in dielectric loss is observed. In the mid-frequency region, dielectric loss remains nearly constant. In the high-frequency region, another decrease occurs, though slower than at low frequencies. Differences between dielectric loss dependencies of systems with new and moisturized oil are visible in the low-frequency region, increasing with temperature. However, increasing the solid component content (higher X and Y values) reduces these differences, which practically vanish in the second and third stages. These regions can therefore be applied for analyzing the condition of the solid insulation component in transformers.

Author Contributions

Conceptualization, P.Z. and K.K.; methodology, P.Z., K.K., P.R., P.O., M.S., P.M. and R.P.; software, K.K., P.R. and P.O.; validation, P.Z., M.S. and R.P.; formal analysis, P.Z., K.K., P.R., P.O., M.S., P.M. and R.P.; investigation, K.K., P.R., P.O. and P.M.; resources, K.K.; data curation, K.K., P.R., P.O., M.S. and R.P.; writing—original draft preparation, P.Z. and K.K.; writing—review and editing, K.K. and R.P.; visualization, K.K.; supervision, P.Z. and K.K.; project administration, K.K.; funding acquisition, K.K., P.R. and P.O. All authors have read and agreed to the published version of the manuscript.

Funding

The research was supported from the state budget within the program of the Ministry of Education and Science entitled ‘Science for Society II’ project no. NdS-II/SP/0173/2024/01 total project value PLN 1,462,590.80 as well as partly from a subsidy from the Ministry of Science and Higher Education for the Lublin University of Technology as funds allocated for activities in the scientific disciplines of Automation, Electronics, Electrical Engineering and Space Technologies (grants: FD-20/EE-2/702, FD-20/EE-2/705 and FD-20/EE-2/707).

Data Availability Statement

The original contributions presented in the study are included in the article, further inquiries can be directed to the corresponding author.

Conflicts of Interest

Authors PM and MS were employed by the company Energo-Complex, Sp. z o.o. Athor RP was employed by the company Nynas AB Raffinaderivagen. The remaining authors declare that the research was conducted in the absence of any commercial or financial relationships that could be construed as a potential conflict of interest.

References

  1. Krause, C. Power transformer insulation—History, technology and design. IEEE Trans. Dielectr. Electr. Insul. 2012, 19, 1941–1947. [Google Scholar] [CrossRef]
  2. Prevost, T.A.; Oommen, T.V. Cellulose insulation in oil-filled power transformers: Part I—History and development. IEEE Electr. Insul. Mag. 2006, 22, 28–35. [Google Scholar] [CrossRef]
  3. Amoiralis, E.I.; Tsili, M.A.; Kladas, A.G. Transformer design and optimization: A literature survey. IEEE Trans. Power Deliv. 2009, 24, 1999–2024. [Google Scholar] [CrossRef]
  4. Fofana, I.; Wasserberg, V.; Borsi, H.; Gockenbach, E. Retrofilling conditions of high-voltage transformers. IEEE Electr. Insul. Mag. 2001, 17, 17–30. [Google Scholar] [CrossRef]
  5. Kurzweil, P.; Schell, C.; Haller, R.; Trnka, P.; Hornak, J. Environmental Impact and Aging Properties of Natural and Synthetic Transformer Oils under Electrical Stress Conditions. Adv. Sustain. Syst. 2021, 5, 2100079. [Google Scholar] [CrossRef]
  6. Bertrand, Y.; Hoang, L.C. Vegetal oils as substitute for mineral oils. In Proceedings of the 7th International Conference on Properties and Applications of Dielectric Materials, Nagoya, Japan, 1–5 June 2003; Volume 2, pp. 491–494. [Google Scholar] [CrossRef]
  7. Chinga-Carrasco, G.; Miettinen, A.; Luengo Hendriks, C.L.; Gamstedt, E.K.; Kataja, M. Structural Characterisation of Kraft Pulp Fibres and Their Nanofibrillated Materials for Biodegradable Composite Applications. In Nanocomposites and Polymers with Analytical Methods; Scitus Academics: Wilmington, DE, USA, 2011. [Google Scholar]
  8. Martínez, M.; Pleite, J. Improvement of RVM test interpretation using a Debye equivalent circuit. Energies 2020, 13, 323. [Google Scholar] [CrossRef]
  9. Lukenda, N. Not all mineral oils are equal—Exploring the history and technology behind mineral insulating oils. Transform. Mag. 2019, 6, 112–117. [Google Scholar]
  10. Graczkowski, A.; Gielniak, J. Influence of impregnating liquids on dielectric response of impregnated cellulose insulation. In Proceedings of the IEEE International Conference on Solid Dielectrics-ICSD, Potsdam, Germany, 4–9 July 2010; pp. 513–516. [Google Scholar]
  11. Wei, Y.; Han, W.; Li, G.; Liang, X.; Gu, Z.; Hu, K. Aging Characteristics of Transformer Oil-Impregnated Insulation Paper Based on Trap Parameters. Polymers 2021, 13, 1364. [Google Scholar] [CrossRef]
  12. Qi, B.; Dai, Q.; Li, C.; Zeng, Z.; Fu, M.; Zhuo, R. The Mechanism and Diagnosis of Insulation Deterioration Caused by Moisture Ingress into Oil-Impregnated Paper Bushing. Energies 2018, 11, 1496. [Google Scholar] [CrossRef]
  13. Lundgaard, L.E.; Hansen, W.; Linhjell, D.; Painter, T.J. Aging of Oil-Impregnated Paper in Power Transformers. IEEE Trans. Power Deliv. 2004, 19, 230–239. [Google Scholar] [CrossRef]
  14. Oommen, T.V.; Prevost, T.A. Cellulose insulation in oil-filled power transformers: Part II—Maintaining insulation integrity and life. IEEE Electr. Insul. Mag. 2006, 22, 5–14. [Google Scholar] [CrossRef]
  15. Fabre, J.; Pichon, A. Deteriorating Processes and Products of Paper in Oil Application to Transformers. In Proceedings of the International Conference on Large High Voltage Electric Systems, Paris, France, 3–6 November 1960; p. 137. [Google Scholar]
  16. Liu, J.; Zhang, H.; Geng, C.; Fan, X.; Zhang, Y. Aging Assessment Model of Transformer Insulation Based on Furfural Indicator under Different Oil/Pressboard Ratios and Oil Change. IEEE Trans. Dielectr. Electr. Insul. 2021, 28, 1061–1069. [Google Scholar] [CrossRef]
  17. Oommen, T.V. Moisture Equilibrium in Paper Oil Systems. In Proceedings of the 16th Electrical/Electronics Insulation Conference, Chicago, IL, USA, 3–6 October 1983; pp. 162–166. [Google Scholar]
  18. Rahman, M.F.; Nirgude, P. Partial discharge behaviour due to irregular-shaped copper particles in transformer oil with a different moisture content of pressboard barrier under uniform field. IET Gener. Transm. Distrib. 2019, 13, 5550–5560. [Google Scholar] [CrossRef]
  19. Hill, J.; Wang, Z.; Liu, Q.; Krause, C.; Wilson, G. Analysing the power transformer temperature limitation for avoidance of bubble formation. High Volt. 2019, 4, 210–216. [Google Scholar] [CrossRef]
  20. Garcia, B.; Villarroel, R.; Garcia, D. A Multiphysical model to study moisture dynamics in transformers. IEEE Trans. Power Deliv. 2019, 34, 1365–1373. [Google Scholar] [CrossRef]
  21. Islam, M.M.; Lee, G.; Hettiwatte, S.N. A review of condition monitoring techniques and diagnostic tests for lifetime estimation of power transformers. Electr. Eng. 2018, 100, 581–605. [Google Scholar] [CrossRef]
  22. Fofana, I.; Hadjadj, Y. Electrical-Based Diagnostic Techniques for Assessing Insulation Condition in Aged Transformers. Energies 2016, 9, 679. [Google Scholar] [CrossRef]
  23. Sarkar, S.; Sharma, T.; Baral, A.; Chatterjee, B.; Dey, D.; Chakravorti, S. An expert system approach for transformer insulation diagnosis combining conventional diagnostic tests and PDC, RVM data. IEEE Trans. Dielectr. Electr. Insul. 2014, 21, 882–891. [Google Scholar] [CrossRef]
  24. Zheng, H.; Liu, J.; Zhang, Y.; Ma, Y.; Shen, Y.; Zhen, X.; Chen, Z. Effectiveness Analysis and Temperature Effect Mechanism on Chemical and Electrical-Based Transformer Insulation Diagnostic Parameters Obtained from PDC Data. Energies 2018, 11, 146. [Google Scholar] [CrossRef]
  25. Mishra, D.; Haque, N.; Baral, A.; Chakravorti, S. Assessment of interfacial charge accumulation in oil-paper interface in transformer insulation from polarization-depolarization current measurements. IEEE Trans. Dielectr. Electr. Insul. 2017, 24, 1665–1673. [Google Scholar] [CrossRef]
  26. Zhang, Y.; Liu, J.; Zheng, H.; Wang, K. Feasibility of a universal approach for temperature correction in frequency domain spectroscopy of transformer insulation. IEEE Trans. Dielectr. Electr. Insul. 2018, 25, 1766–1773. [Google Scholar] [CrossRef]
  27. Liu, J.; Fan, X.; Zhang, Y.; Zhang, C.; Wang, Z. Aging evaluation and moisture prediction of oil-immersed cellulose insulation in field transformer using frequency domain spectroscopy and aging kinetics model. Cellulose 2020, 27, 7175–7189. [Google Scholar] [CrossRef]
  28. Yang, L.; Chen, J.; Gao, J.; Zheng, H.; Li, Y. Accelerating frequency domain dielectric spectroscopy measurements on insulation of transformers through system identification. IET Sci. Meas. Technol. 2018, 12, 247–254. [Google Scholar] [CrossRef]
  29. Mott, N.F.; Gurney, R.W. Electronic Processes in Ionic Crystals; Clarendon Press: Oxford, UK, 1950. [Google Scholar]
  30. Broadbent, S.R.; Hammersley, J.M. Percolation processes: I. Crystals and mazes. Math. Proc. Cambridge Philos. Soc. 1957, 53, 629–641. [Google Scholar] [CrossRef]
  31. Mamunya, Y.P.; Davydenko, V.V.; Pissis, P.; Lebedev, E.V. Electrical and thermal conductivity of polymers filled with metal powders. Eur. Polym. J. 2002, 38, 1887–1897. [Google Scholar] [CrossRef]
  32. Koltunowicz, T.N.; Zukowski, P.; Bondariev, V.; Fedotova, J.A.; Fedotov, A.K. The effect of annealing on induction like properties of (FeCoZr)x(CaF2)(100−x) nanocomposite films produced by ion-beam sputtering in the vacuum environment. Vacuum 2015, 120, 44–50. [Google Scholar] [CrossRef]
  33. ISO—ISO/TS 80004-2:2015—Nanotechnologies—Vocabulary—Part 2: Nano-Objects. Available online: https://www.iso.org/standard/54440.html (accessed on 3 December 2021).
  34. Landau, L.D.; Lifshitz, E.M. Quantum Mechanics, 3rd ed.; Revised and Enlarged; Princeton University Press: Princeton, NJ, USA, 1977; ISBN 978-0-08-020940-1. [Google Scholar]
  35. Imry, Y. Introduction to Mesoscopic Physics; Oxford University Press: Oxford, UK, 2002; ISBN 9780198507383. [Google Scholar]
  36. Mott, N.F. Metal-Insulator Transitions; Taylor and Francis: London, UK, 1974. [Google Scholar]
  37. Pollak, M.; Geballe, T.H. Low-Frequency Conductivity Due to Hopping Processes in Silicon. Phys. Rev. 1961, 122, 1753. [Google Scholar] [CrossRef]
  38. Ravich, Y.I.; Nemov, S.A. Hopping conduction via strongly localized impurity states of indium in PbTe and its solid solutions. Semiconductors 2002, 36, 1–20. [Google Scholar] [CrossRef]
  39. Gerashchenko, O.V.; Ukleev, V.A.; Dyad’kina, E.A.; Sitnikov, A.V.; Kalinin, Y.E. Hopping conductivity with the “1/2” law in the multilayer nanocomposite [(Co40Fe40B20)34(SiO2)66/C]47. Phys. Solid State 2017, 59, 164–167. [Google Scholar] [CrossRef]
  40. Kavokin, A.; Kutrovskaya, S.; Kucherik, A.; Osipov, A.; Vartanyan, T.; Arakelyan, S. The crossover between tunnel and hopping conductivity in granulated films of noble metals. Superlattices Microstruct. 2017, 111, 335–339. [Google Scholar] [CrossRef]
  41. Pogrebnjak, A.; Ivashchenko, V.; Maksakova, O.; Buranich, V.; Konarski, P.; Bondariev, V.; Zukowski, P.; Skrynskyy, P.; Sinelnichenko, A.; Shelest, I.; et al. Comparative measurements and analysis of the mechanical and electrical properties of Ti-Zr-C nanocomposite: Role of stoichiometry. Measurement 2021, 176, 109223. [Google Scholar] [CrossRef]
  42. Zukowski, P.; Kołtunowicz, T.N.; Kierczyński, K.; Subocz, J.; Szrot, M.; Gutten, M. Assessment of water content in an impregnated pressboard based on DC conductivity measurements theoretical assumptions. IEEE Trans. Dielectr. Electr. Insul. 2014, 21, 1268–1275. [Google Scholar] [CrossRef]
  43. Żukowski, P.; Kierczyński, K.; Kołtunowicz, T.N.; Rogalski, P.; Subocz, J. Application of elements of quantum mechanics in analysing AC conductivity and determining the dimensions of water nanodrops in the composite of cellulose and mineral oil. Cellulose 2019, 26, 2969–2985. [Google Scholar] [CrossRef]
  44. Zukowski, P.W.; Rodzik, A.; Shostak, Y.A. Dielectric constant and ac conductivity of semi-insulating Cd1-xMnxTe semiconductors. Semiconductors 1997, 31, 610–614. [Google Scholar] [CrossRef]
  45. Zukowski, P.; Rogalski, P.; Kierczynski, K.; Koltunowicz, T.N. Precise Measurements of the Temperature Influence on the Complex Permittivity of Power Transformers Moistened Paper-Oil Insulation. Energies 2021, 14, 5802. [Google Scholar] [CrossRef]
  46. Kierczynski, K.; Rogalski, P.; Bondariev, V.; Okal, P.; Korenciak, D. Research on the Influence of Moisture Exchange between Oil and Cellulose on the Electrical Parameters of the Insulating Oil in Power Transformers. Energies 2022, 15, 7681. [Google Scholar] [CrossRef]
  47. Subocz, J. Przewodnictwo i Relaksacja Dielektryczna Warstowywch Układów Izolacyjnych; Uczelniane, W., Ed.; Zachodniopomorski Uniwersytet Technologiczny (Szczecin) Wydaw; Uczelniane Zachodniopomorskiego Uniwersytetu Technologicznego w Szczecinie: Szczecin, Poland, 2012; ISBN 8376631136/9788376631134. [Google Scholar]
  48. CIGRE. Dielectric Response Methods for Diagnostics of Power Equipment; TF D1.01.09; CIGRE: Paris, France, 2002; p. 33. [Google Scholar]
  49. CIGRE. Dielectric Response Diagnoses for Transformer Windings; TF D1.01; CIGRE: Paris, France, 2010. [Google Scholar]
  50. Alekseev, B.A. A new method for detecting moisture in the insulation of transformer windings. Elektrichestvo 1959, 2, 58–63. [Google Scholar]
  51. Occhini, E.; Maschio, G. Electrical Characteristics of Oil-Impregnated Paper as Insulation for HV DC Cables. IEEE Trans. Power Appar. Syst. 1967, PAS-86, 312–326. [Google Scholar] [CrossRef]
  52. Silva, H.A.P.; Bassi, W.; Diogo, A.C.T. Non-invasive ageing assessment by means of polarization and depolarization currents analysis and its correlation with moisture content for power transformer life management. In Proceedings of the 2004 IEEE/PES Transmision and Distribution Conference and Exposition, Sao Paulo, Brazil, 8–11 November 2004; pp. 611–616. [Google Scholar] [CrossRef]
  53. Fan, X.; Liu, J.; Zhang, Y.; Yang, S.; Zhang, C.; Zhang, Y. A modified XY model of transformer oil–paper insulation system including non-uniform aging and conductance effect. IET Gener. Transm. Distrib. 2021, 15, 2008–2017. [Google Scholar] [CrossRef]
  54. Leibfried, T.; Kachler, A.J. Insulation diagnostic on power transformers using the polarisation and depolarisation current (PDC) analysis. In Proceedings of the Conference Record of the the 2002 IEEE International Symposium on Electrical Insulation, Boston, MA, USA, 7–10 April 2002; pp. 170–173. [Google Scholar] [CrossRef]
  55. Waygood, A. An Introduction to Electrical Science, 2nd ed.; Taylor & Francis Group: New York, NY, USA, 2019. [Google Scholar]
  56. Koch, M.; Tenbohlen, S.; Krüger, M.; Kraetge, A. A Comparative Test and Consequent Improvements on Dielectric Response Methods. In Proceedings of the 15th International Symposium on High Voltage Engineering, Ljubljana, Slovenia, 27–31 August 2007. [Google Scholar]
  57. Blennow, J.; Ekanayake, C.; Walczak, K.; García, B.; Gubanski, S.M. Field experiences with measurements of dielectric response in frequency domain for power transformer diagnostics. IEEE Trans. Power Deliv. 2006, 21, 681–688. [Google Scholar] [CrossRef]
  58. Ekanayake, C.; Gubanski, S.M.; Graczkowski, A.; Walczak, K. Frequency Response of Oil Impregnated Pressboard and Paper Samples for Estimating Moisture in Transformer Insulation. IEEE Trans. Power Deliv. 2006, 21, 1309–1317. [Google Scholar] [CrossRef]
  59. Zhang, D.; Yun, H.; Zhan, J.; Sun, X.; He, W.; Niu, C.; Mu, H.; Zhang, G.J. Insulation condition diagnosis of oil-immersed paper insulation based on non-linear frequency-domain dielectric response. IEEE Trans. Dielectr. Electr. Insul. 2018, 25, 1980–1988. [Google Scholar] [CrossRef]
  60. Liao, R.; Liu, J.; Yang, L.; Gao, J.; Zhang, Y.; Lv, Y.D.; Zheng, H. Understanding and analysis on frequency dielectric parameter for quantitative diagnosis of moisture content in paper-oil insulation system. IET Electr. Power Appl. 2015, 9, 213–222. [Google Scholar] [CrossRef]
  61. Moranda, H.; Moscicka-Grzesiak, H. A Particularly Dangerous Case of the Bubble Effect in Transformers That Appeared in a Large Mass of Pressboard Heated by Mineral Oil. Energies 2025, 18, 380. [Google Scholar] [CrossRef]
  62. Oommen, T.V.; Lindgren, S.R. Bubble evolution from transformer overload. In Proceedings of the 2001 IEEE/PES Transmission and Distribution Conference and Exposition. Developing New Perspectives, Atlanta, GA, USA, 2 November 2001; Volume 1, pp. 137–142. [Google Scholar] [CrossRef]
  63. Zhao, H.; Mu, H.; Zhang, D.; DIng, N.; Wu, Y.; Zhang, G.; Tian, J.; Liang, Z. Analysis of FDS Characteristics of Oil-impregnated Paper Insulation under High Electric Field Strength Based on the Motion of Charge Carriers. IEEE Trans. Dielectr. Electr. Insul. 2021, 28, 1153–1161. [Google Scholar] [CrossRef]
  64. Liu, J.; Fan, X.; Zhang, Y.; Lai, B.; Jiao, J. Analysis of low-frequency polarisation behaviour for oil-paper insulation using logarithmic-derivative spectroscopy. High Volt. 2021, 6, 460–469. [Google Scholar] [CrossRef]
  65. Fofana, I.; Hemmatjou, H.; Meghnefi, F.; Farzaneh, M.; Setayeshmehr, A.; Borsi, H.; Gockenbach, E. On the frequency domain dielectric response of oil-paper insulation at low temperatures. IEEE Trans. Dielectr. Electr. Insul. 2010, 17, 799–807. [Google Scholar] [CrossRef]
  66. IEC 60814:2.0; Insulating Liquids—Oil-Impregnated Paper and Pressboard—Determination of Water by Automatic Coulometric Karl Fischer Titration. American National Standards Institute (ANSI): Washington, DC, USA, 2007.
  67. OMICRON electronics Asia Limited. DIRANA—The Fastest Way of Moisture Determination of Power- and Instrument Transformers and Condition Assessment of Rotating Machines; L2894; OMICRON electronics Asia Limited: Huangpu, China, 2018. [Google Scholar]
  68. Gubanski, S.M.; Blennow, J.; Karlsson, L.; Feser, K.; Tenbohlen, S.; Neumann, C.; Moscicka-Grzesiak, H.; Filipowski, A.; Tatarski, L. Reliable diagnostics of HV transformer insulation for safety assurance of power transmission system REDIATOOL—A european research project. In Proceedings of the 41st International Conference on Large High Voltage Electric Systems, Paris, France, 27 August–1 September 2006; CIGRE: Paris, France, 2006; p. D1-207. [Google Scholar]
  69. Jaya, M.; Leibfried, T.; Koch, M. Information within the dielectric response of power transformers for wide frequency ranges. In Proceedings of the 2010 IEEE International Symposium on Electrical Insulation, San Diego, CA, USA, 6–9 June 2010. [Google Scholar] [CrossRef]
  70. Koch, M.; Prevost, T. Analysis of dielectric response measurements for condition assessment of oil-paper transformer insulation. IEEE Trans. Dielectr. Electr. Insul. 2012, 19, 1908–1915. [Google Scholar] [CrossRef]
  71. Bigdeli, M.; Aghajanloo, J.; Azizian, D. Estimation of Moisture in Transformer Insulation Using Dielectric Frequency Response Analysis by Heuristic Algorithms. Model. Simul. Electr. Electron. Eng. 2021, 1, 27–35. [Google Scholar] [CrossRef]
  72. Brncal, P.; Gutten, M. Diagnostics of Insulating Condition of Traction Transformer by Frequency Method. Transp. Res. Procedia 2021, 55, 977–982. [Google Scholar] [CrossRef]
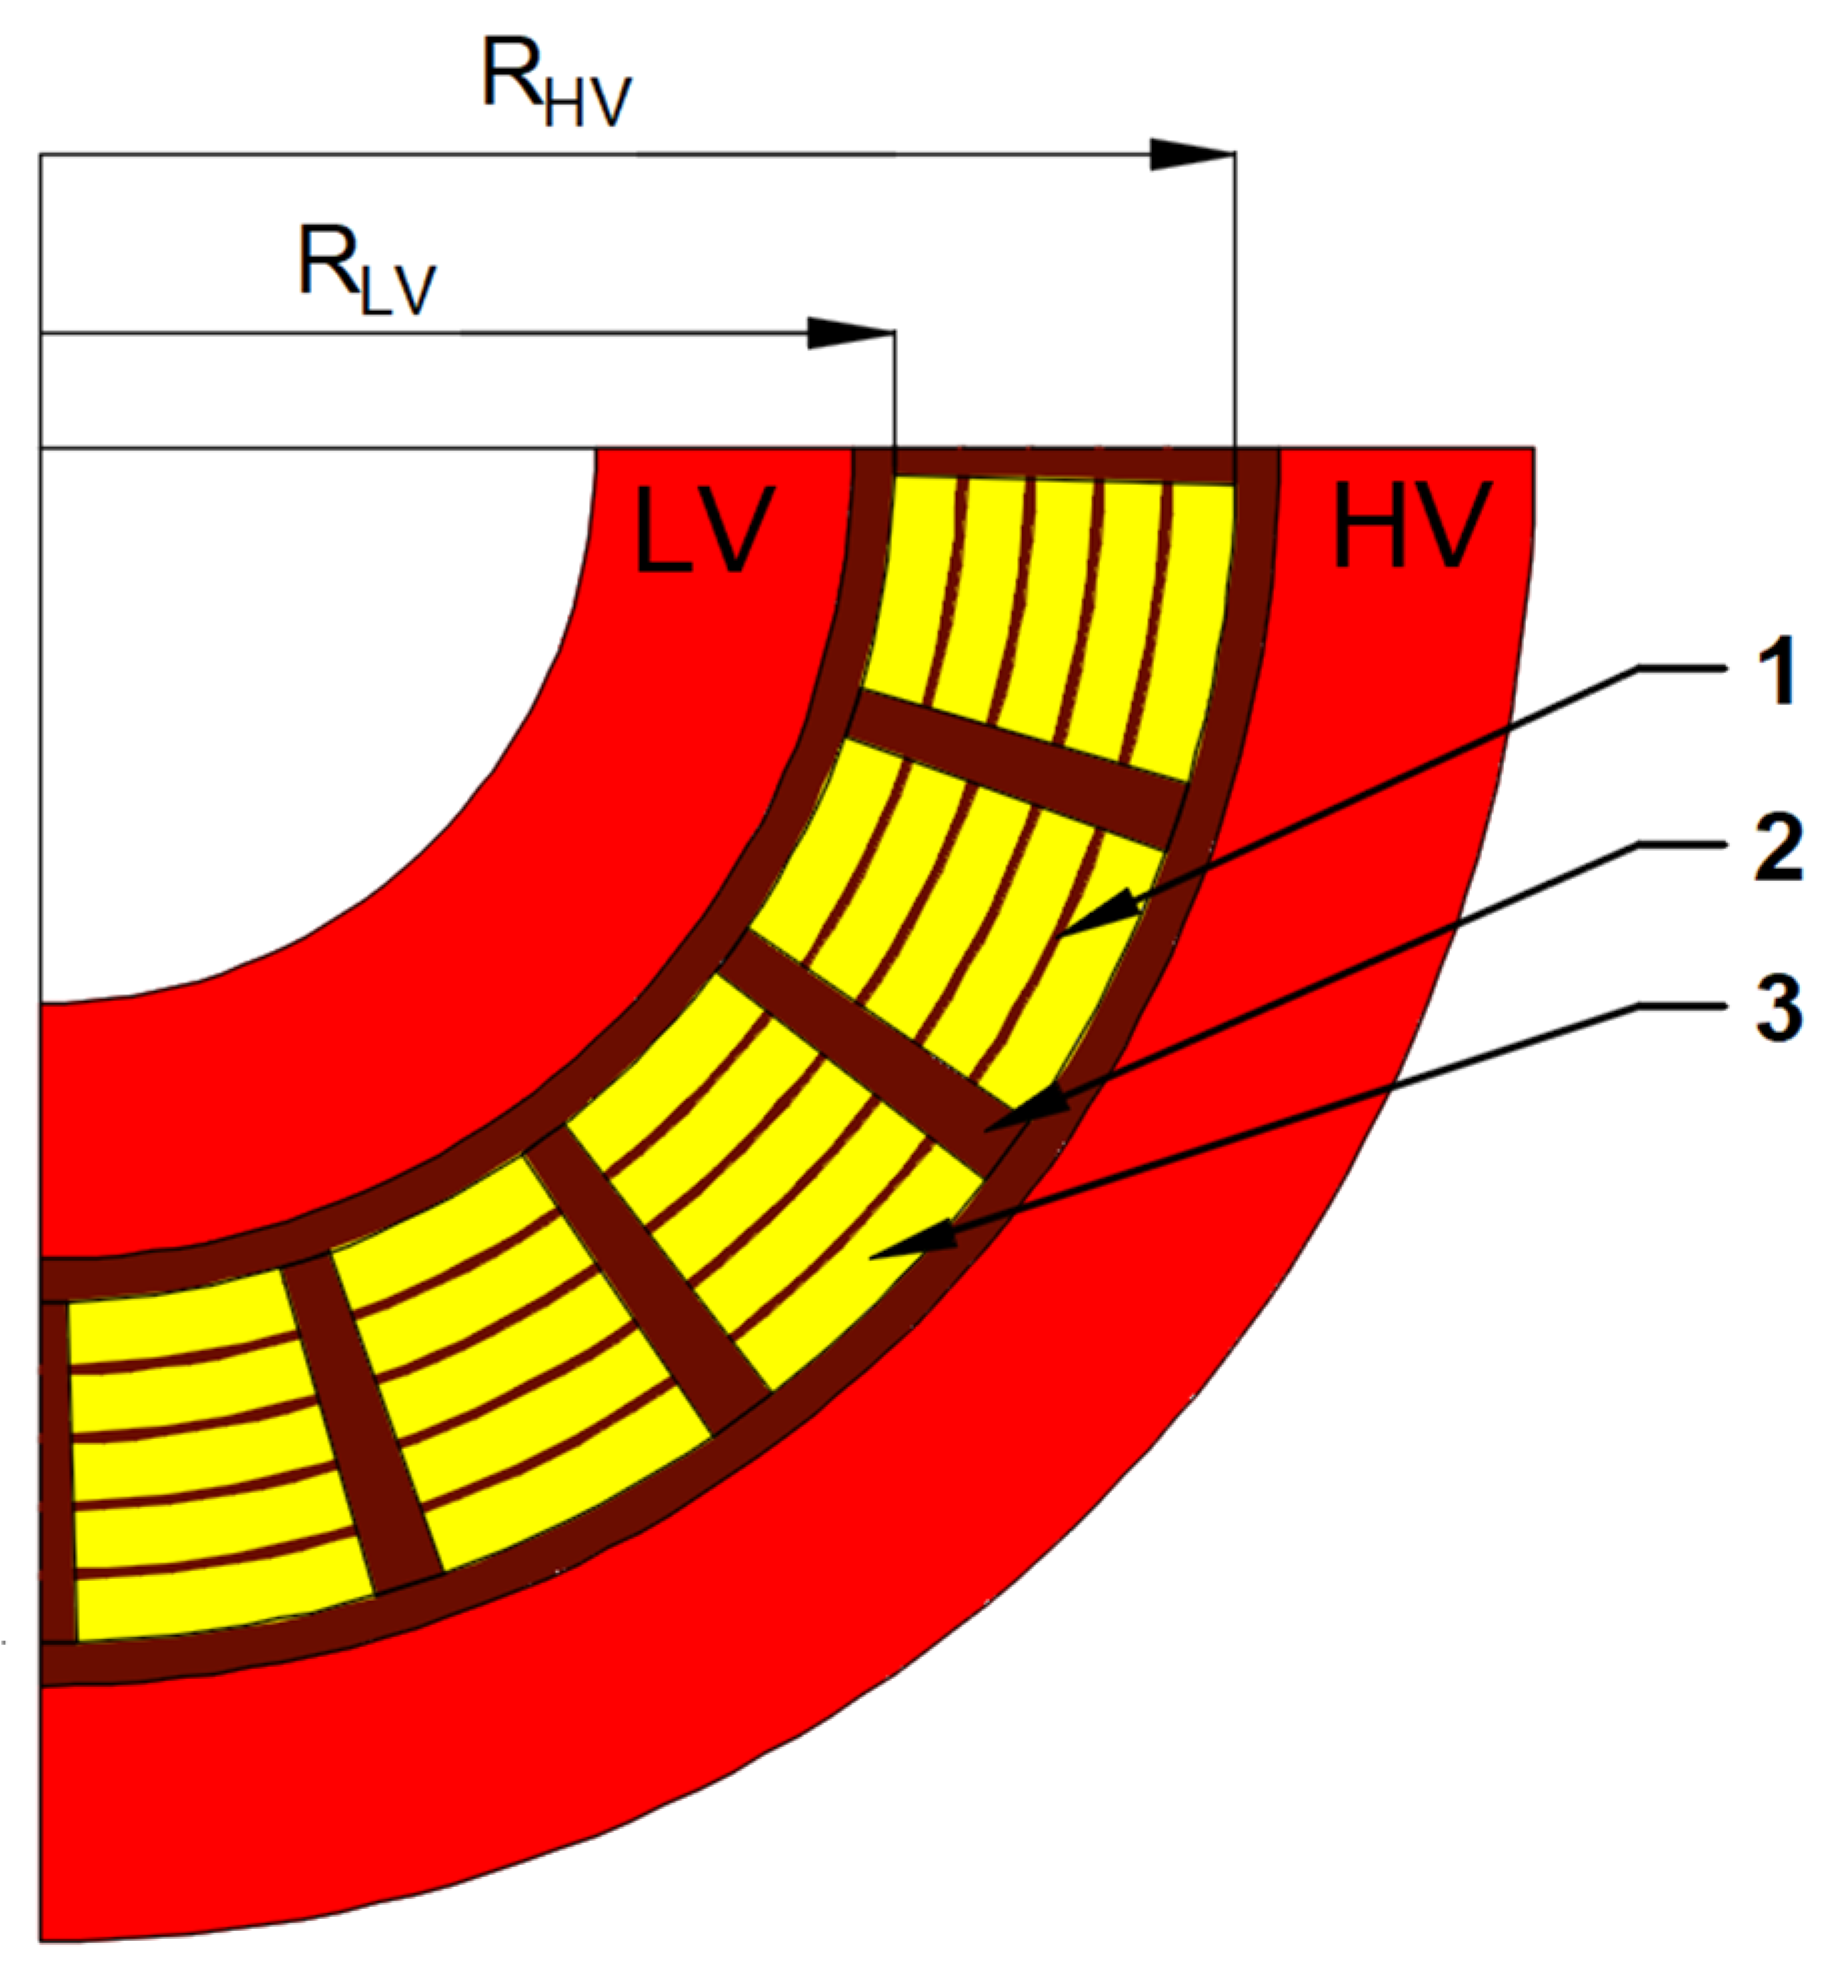
Figure 1. Example schematic of the winding arrangement and main insulation of a power transformer. LV winding (hereafter LV)—low-voltage winding; HV winding (hereafter HV)—high-voltage winding. 1—barriers; 2—spacers made of pressboard; 3—oil channels [47].
Energies 18 06176 g001
Figure 2. Simplified electrical model of transformer insulation according to CIGRE [48,49]. The heights of all components are identical and equal to h. 1—HV winding; 2—LV winding; 3—pressboard barriers; 4—pressboard spacers; 5—oil duct.
Energies 18 06176 g002
Figure 3. Equivalent electrical circuit of transformer insulation. tanδoil, Coil—loss tangent and capacitance of the oil duct; tanδsp, Csp—loss tangent and capacitance of the spacers; tanδbar, Cbar—oss tangent and capacitance of the barriers.
Energies 18 06176 g003
Figure 4. Equivalent circuit of the liquid–solid insulation system of a power transformer [54].
Energies 18 06176 g004
Figure 5. Three-electrode measuring capacitor with a sample of oil-impregnated moist pressboard, placed in a glass vessel and filled with oil.
Energies 18 06176 g005
Figure 6. Schematic cross-section of the measuring system for investigating the electrical properties of pressboard. 1—measuring electrode; 2—guard electrode; 3—transformer oil; 4—moist pressboard; 5—voltage electrode; 6—hermetically sealed glass vessel.
Energies 18 06176 g006
Figure 7. Schematic cross-section of the measuring system for investigating the electrical properties of transformer oil. 1—measuring electrode; 2—guard electrode; 3—transformer oil; 4—moist pressboard serving as a source of moisture for the oil in the second measurement series; 5—spacers—glass plates (6 pieces); 6—voltage electrode; 7—hermetically sealed glass vessel.
Energies 18 06176 g007
Figure 8. Frequency dependencies of: (a) dielectric loss tangent, (b) ε’oil of insulating oil moisturized from pressboard with a moisture content of 5.17%, for measurement temperatures ranging from 20 °C to 60 °C.
Energies 18 06176 g008
Figure 9. Frequency dependencies of the loss tangent of insulating oil: (a) factory-new, (b) moistened by pressboard with a moisture content of 5.17%, for measurement temperatures from 20 °C to 60 °C.
Energies 18 06176 g009
Figure 10. Frequency dependencies of ε’oil of insulating oil: (a) factory-new, and (b) moistened by pressboard with a moisture content of 5.17%, for measurement temperatures from 20 °C to 60 °C.
Energies 18 06176 g010
Figure 11. Frequency–temperature dependencies of the loss tangent tanδCIGRE of the XY system of a power transformer: (a) X = 0.15, Y = 0.15, (b) X = 0.25, Y = 0.18, (c) X = 0.35, Y = 0.21, (d) X = 0.50, Y = 0.25. Moisture content in pressboard impregnated with mineral oil: 5.17%. Solid lines—factory-new oil; markers—moistened oil. Every second measurement point is shown in the figure.
Energies 18 06176 g011
Figure 12. Frequency–temperature dependencies of the ratios of tanδCIGRE for moistened and factory-new oil in the XY system of a power transformer: (a) X = 0.15, Y = 0.15, (b) X = 0.25, Y = 0.18, (c) X = 0.35, Y = 0.21, (d) X = 0.50, Y = 0.25. Moisture content in pressboard impregnated with mineral oil is 5.17%.
Energies 18 06176 g012
Figure 13. Frequency dependence of tanδ and the frequency ranges in which its value is influenced by pressboard moisture and oil moisture [54].
Energies 18 06176 g013
Figure 14. Frequency dependencies of tanδ at a temperature of 20 °C—(a) and 60 °C—(b) for four sets of X and Y values: 1—X = 0.15, Y = 0.15; 2—X = 0.25, Y = 0.18; 3—X = 0.35, Y = 0.21; 4—X = 0.50, Y = 0.25 in the high-frequency range. Solid lines—factory-new oil; markers—moistened oil. Every second measurement point is shown in the figure.
Energies 18 06176 g014
Figure 15. Frequency–temperature dependencies of ε’CIGRE for the XY system of a power transformer: (a) X = 0.15, Y = 0.15, (b) X = 0.25, Y = 0.18, (c) X = 0.35, Y = 0.21, (d) X = 0.50, Y = 0.25. Moisture content in pressboard impregnated with mineral oil: 5.17%. Solid lines—factory-new oil; markers—moistened oil. Every second measurement point is shown in the figure.
Energies 18 06176 g015
Figure 16. Frequency–temperature dependencies of the loss factor ε’’CIGRE for the XY system of a power transformer: (a) X = 0.15, Y = 0.15, (b) X = 0.25, Y = 0.18, (c) X = 0.35, Y = 0.21, (d) X = 0.50, Y = 0.25. Moisture content in pressboard impregnated with mineral oil: 5.17%. Solid lines—factory-new oil; markers—moistened oil. Every second measurement point is shown in the figure.
Energies 18 06176 g016
Disclaimer/Publisher’s Note: The statements, opinions and data contained in all publications are solely those of the individual author(s) and contributor(s) and not of MDPI and/or the editor(s). MDPI and/or the editor(s) disclaim responsibility for any injury to people or property resulting from any ideas, methods, instructions or products referred to in the content.